Embed Size (px)
Citation preview

Portland State University Portland State University
PDXScholar PDXScholar
Dissertations and Theses Dissertations and Theses
1992
Student attitudes and feelings about standardized Student attitudes and feelings about standardized
tests and parent observations of behavior during tests and parent observations of behavior during
testing : a survey of third grade students and their testing : a survey of third grade students and their
parents parents
Candace Ann Iseminger Portland State University
Follow this and additional works at: https://pdxscholar.library.pdx.edu/open_access_etds
Part of the Curriculum and Instruction Commons
Let us know how access to this document benefits you.
Recommended Citation Recommended Citation Iseminger, Candace Ann, "Student attitudes and feelings about standardized tests and parent observations of behavior during testing : a survey of third grade students and their parents" (1992). Dissertations and Theses. Paper 4325. https://doi.org/10.15760/etd.6209
This Thesis is brought to you for free and open access. It has been accepted for inclusion in Dissertations and Theses by an authorized administrator of PDXScholar. Please contact us if we can make this document more accessible: [email protected].
AN ABSTRACT OF THE THESIS OF Candace Ann Iseminger for the
Master of Science in Education: curriculum and Instruction
presented July 23, 1992.
Title: Student Attitudes and Feelings About Standardized
Tests and Parent Observations of Behavior During
Testing: A Survey of Third Grade Students and Their
Parents.
APPROVED BY THE MEMBERS OF THE THESIS COMMITTEE:
Kenneth D. Peterson
This study was a descriptive study of student attitudes
toward standardized tests and parent observations of behaviors

2
during the testing process. A total of 87 third gradestudents
and their parents were surveyed.
predominately white and middle class.
The students were
The school settings
consisted of parochial elementary schools.
The students were surveyed on how they felt about taking
a standardized test and what they experienced during the
testing process. The student survey consisted of 10 closed
and 6 open ended questions. Parents were surveyed on their
child's behavior during testing and what their child expressed
at home about the test. The parent survey consisted of 7 open
ended questions. The study sought descriptions of how
students felt about taking a standardized test and explored
whether the feelings are displayed at home.
From this study it can be concluded that students vary in
their feelings about taking standardized tests. It can also
be concluded that students' displayed home behavior was
consistent with expressed feelings. A further conclusion is
that the students' home behavior did not change during the
testing process. It can also be concluded that many students
and parents were not aware of the grading process of the test
and the future use of the scores received.
Implications can be drawn for teachers that include
adjusting the test schedule to fit the students'
comfort/stress level, and explaining the purpose of the test
and the testing process to both students and parents. It is
also important for teachers to consider the common practice of

3
reporting test scores and the appropriate use of the test
scores. Implications for parents include looking at ways of
reducing stress through examining diet, exercise, and sleep
patterns of their children, and the parent's availability for
discussing the test. Implications can also be addressed to
test publishers, which include revision of procedures and the
time limitations placed on students, as well as reevaluating
if the testing process is needed at all.
An area not examined in this study is how students'
feelings about taking a standardized test change over a period
of years. Future research could address how students' feel
about a taking a standardized test with a span of several
years between surveys.
STUDENT ATTITUDES AND FEELINGS ABOUT STANDARDIZED TESTS
AND PARENT OBSERVATIONS OF BEHAVIOR DURING TESTING:
A SURVEY OF THIRD GRADE STUDENTS AND THEIR PARENTS
by
CANDACE ANN ISEMINGER
A thesis submitted in partial fulfillment of the requirements for the degree of
MASTER OF SCIENCE in
EDUCATION: CURRICULUM AND INSTRUCTION
Portland state University 1992
PORTl.Mm STATE L'rJrJERSITY LIBRARY

TO THE OFFICE OF GRADUATE STUDIES:
The members of the Committee approve the thesis of
Candace Ann Iseminger presented July 23, 1992.
APPROVED:
Kenneth D. Peterson
Cathleen L. Smith
~arr; ation
esearch

TABLE OF CONTENTS
PAGE
LIST OF TABLES . .......................................... v
INTRODUCTION. .1
Purpose. .1
Rationale. .2
METHODOLOGY ••.. .7
Introduction . ....................................... 7
Sample .. .7
Context. • 8
Procedures .......................................... 9
Limitations . ....................................... . 10
Analysis . ........................................... 12
RESULTS AND DISCUSSION .............................•..... 13
Introduction . ....................................... 13
Student Responses on Survey .•...•................... 13
Student Responses Student Responses
to Closed Questions to Open-ended Questions
Parent Responses on Survey. .............•....• 2 7
Comparison of Student and Parent surveys ...••...•... 38
Comparison of Individual student/Parent Responses Comparison of Student/Parent Responses Overall
STUDY CONCLUSIONS AND INTERPRETATIONS •.................•• 45

iv
STUDY IMPLICATIONS AND DISCUSSION ........................ 48
Introduction .••..•........ .48
For Teacher Professionals ..........................• 48
For Parents . ........................................ 5 2
For Test Publishers . ................................ 5 3
S~Y . ..••••••••.••.•••••....••.••.••••..••...•..••..•• 55
REFERENCES CITED . ....................................•... 57
APPENDIX . ...................................•..•.....•... 59
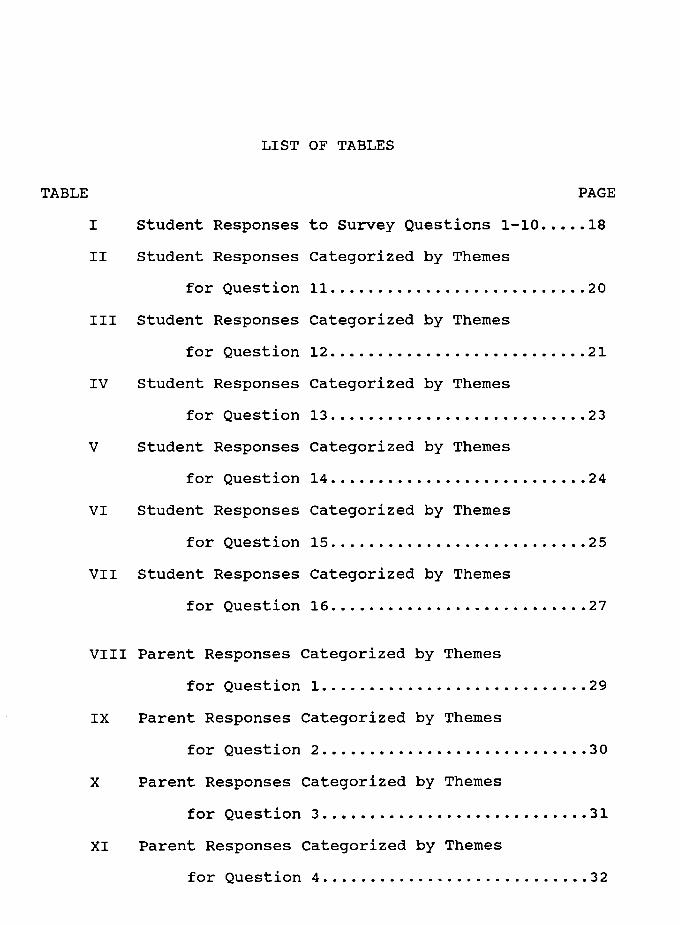
LIST OF TABLES
TABLE PAGE
I Student Responses to Survey Questions 1-10 .•••. 18
II Student Responses Categorized by Themes
for Question 11 ........................... 20
III Student Responses Categorized by Themes
for Question 12 . .......................... 21
IV Student Responses Categorized by Themes
for Question 13 .........•................. 23
V Student Responses Categorized by Themes
for Question 14 ............•..•..•........ 24
VI Student Responses Categorized by Themes
for Question 15 ........................... 25
VII Student Responses Categorized by Themes
for Question 16 ........................... 27
VIII Parent Responses Categorized by Themes
for Question 1 ............................ 29
IX Parent Responses Categorized by Themes
for Question 2 ..........................•• 30
X Parent Responses Categorized by Themes
for Question 3 ..••.•...•............••...• 31
XI Parent Responses Categorized by Themes
for Question 4 ............................ 32
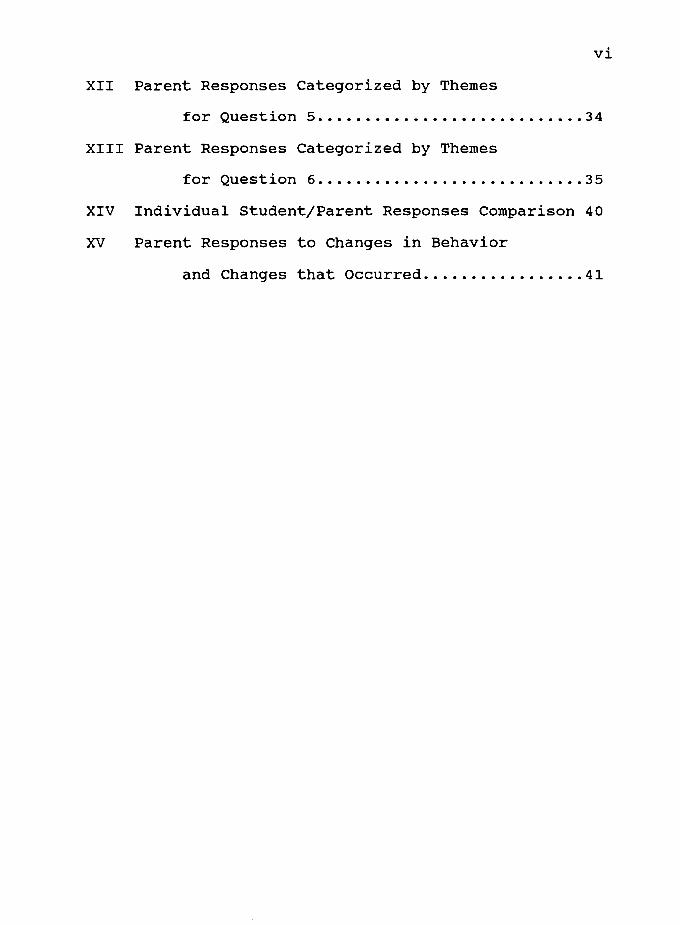
vi
XII Parent Responses Categorized by Themes
for Question 5 •••••••••••••...•.•••....••• 34
XIII Parent Responses Categorized by Themes
for Question 6 .......•.....•.............. 35
XIV Individual Student/Parent Responses Comparison 40
xv Parent Responses to Changes in Behavior
and Changes that Occurred •......•••...••.. 41
INTRODUCTION
The practice of assessing learning through standardized
tests has a long and questionable tradition. This study
responds to the significant question, "What effect does the
testing process have on students." The description of this
study, "Student Attitudes Toward Standardized Tests and Parent
Observations of Behavior During Testing: A Survey of Third
Grade Students and Their Parents," begins with the rationale
for conducting the investigation. Following the introduction
is the methodology which describes the actual study and
procedures followed. The results are presented with attention
to three categories of findings: the student survey responses,
the parent survey responses, and a comparison of the student
and parent responses. This comparison is to determine if the
testing process affects home behavior. Subsequent to the
results are study conclusions. The conclusions entail
implications for teaching professionals, parents and test
publishers. A summary concludes the report.
PURPOSE
The purpose of this thesis was to conduct a descriptive
study of student attitudes toward standardized tests and of
parent observations of student behaviors during testing. The
study used a survey of student attitudes and self perceptions

related to taking a standardized test.
2
The study also
included a survey of parents for descriptions of their
observations of student responses and reactions to taking a
standardized test. From the data obtained, a comparison of
student and parent responses was conducted.
RATIONALE
The intent of this study was to explore and examine
students' feelings about taking a standardized test and to
investigate how those feelings are displayed at home to
determine if the testing process affects home behavior. There
is a paucity of research literature describing how elementary
students feel about standardized tests. There is even less
literature documenting how their feelings influence home
behavior. Much has been written on parents' and teachers'
concerns about standardized tests and test usage in schools.
Anastasi and Geisinger (1980) administered guided inventories
to teachers and parents. Parent responses about how the test
taking experiences affected their own child ranged from "quite
harmful," through "no effect," to "quite helpful." Parents
were also questioned on what the school or teacher could have
done to inform them better about their child's test
performance. Three thematic categories appeared. Most
parents recommended increased feedback from the schools to the
parents about the test and test scores. Some asked for
explanations about the purpose of the test and its
3
implications for the child, and some suggested that parents be
given the test results without having to request them.
In the literature, parents have described the effect of
the test-taking experience on their children. However, the
students themselves have not been questioned. Hardy (1982)
and Alley, Barnwell, Dickey, Kelley, Leifest, & Hartman (1982)
have written on usage of standardized test scores in the
school setting and parent's concern and interest in those test
scores. Hardy addressed the parents' right to know how
standardized tests are used in schools. He encouraged the
parents to be concerned about the accuracy of test scores and
the placement of students strictly by test scores without the
consideration of other available data. Hardy also stated that
parents feel tests are important in assessing the quality of
education their child is receiving. Finally, Hardy stressed
that tests are important to parents because the tests help
parents assess their children's abilities and levels of
achievement. The work of Alley et al., is a reflection
of six parents and their concerns about testing. These
parents reflected that they needed information about what
types of tests are given to their children, understanding of
what the tests measure, and ideas about how tests can be used
constructively. Although Alley did not describe the purpose
for administering these tests, the parents expressed a concern
that their children were judged on their test scores, not
their overall ability and performance. They also addressed
4
the need to be careful with the tests and recommended that
they be used appropriately. Parent and teacher concerns are
addressed in 1 i terature, yet student concerns are seldom
addressed, and have not been examined in the context of parent
responses.
Within the research literature on student attitudes
toward standardized tests are significant studies with
implications for this thesis. Karmos and Karmos (1980)
conducted a study using a series of attitudinal questions
attached to the achievement test for students in grades six
through nine. Their intent was to measure students' attitudes
toward the achievement test and how those attitudes affected
performance on the test. Their findings revealed that while
students felt achievement tests were important, student
attitudes had very little relationship to test performance.
Another study, the largest survey of students and their
attitudes toward standardized tests, was conducted by Beck and
Stetz (1980). In their survey, students in grades K-12 and
their teachers were asked their opinions about taking the test
with the use of a rating. The responses were then compared to
the National Council on Measurement in Education (NCME)
predictions of what those opinions would be. Results
indicated that 72% of the students had one of two degrees of
positive attitudes toward standardized tests. Study
conclusions indicated student feelings about taking a test,
5
but did not examine whether behavior at home reflected
documented student feelings.
Fleege (1990) studied the stress level of Kindergarten
students during the process of taking a standardized test and
how it affected exhibited behavior. The objective was to
discover if there were observable changes in children's
behavior during the testing process as compared with their
behavior before and after testing. The study showed that more
stress-related behaviors were evident during the testing
period than before or after. Interviews with the children
after the test was over indicated that the children felt
uncomfortable and pressured to perform during the
administration of the test. The study also showed that, in
schools where the test received more emphasis from the
principal, the students exhibited more stress-related
behavior. Fleege observed school behavior and how testing
affected that behavior. Home behavior as reported by parents
was studied but not examined in relationship to how students
expressed feelings toward the test. This study proposed to
extend the information gained by Fleege by conducting such an
investigation.
This study was designed to investigate the relationship
between student descriptions of their feelings toward
standardized tests and parent descriptions of home behaviors
during testing. This study explored whether students'
descriptions of feelings are reflected in home behavior. This

6
research provided information to teachers on student feelings
toward standardized tests. This information will be useful to
the decision-making process involved in test selection, test
usage, and in the assessment practice in general. Based on
this information, teachers will be able to adjust the
administration of tests to best suit students' needs, that is,
by adjusting how many tests are administered each day.
Teachers will also receive information on behaviors displayed
at home. This information will allow teachers to discern what
kind of guidance to provide parents and students.
METHODOLOGY
INTRODUCTION
The students did not appear to have any aversion to
completing the survey. The teachers were also very
cooperative and helpful in allowing the researcher into their
classrooms. They were a valuable asset in guaranteeing the
return of the parent surveys. This methodological description
will include information about the sample, procedures, and
analysis.
SAMPLE
The population for this study consisted of students from
8 third grade classrooms located in 7 schools. The researcher
previously taught in this school district. The sample was
predominately white and middle class. Approximately 87
students and their parents were surveyed. The geographic area
of the survey was approximately a one hundred mile radius in
Eastern Washington and a small portion of Northeastern Oregon.
The school settings were limited to parochial elementary
schools.

8
CONTEXT
This was the first year that the majority of the students
in this school district have taken a standardized test. The
test administered was the Iowa Test of Basic Skills. The test
included 14 different timed sections. The time limit for each
section varied from 25 to 45 minutes with a break of a few
minutes following each section. At the beginning of each
section the students completed one or two warm-up questions.
The school district allowed 4 school days for the test to be
administered. The tests were usually administered for 2 to 3
hours a day. The teachers had the option of how the testing
was distributed throughout the day, but did not have the
option of abstaining from the testing.
The purpose of administering the test was to track
student growth. The results were used to determine student
progress, and to plan the academic structure for each student.
The teachers used the scores to diagnose and prescribe for
individual students.
The parents were given the scores to see their child's
strengths and weaknesses, as well as areas of growth. This
information was given at a parent/teacher conference after the
testing had been administered, scored, and returned to the
school.
Each teacher decided what was told to the students in
his/her classroom about the purpose and use of the test.
Generally the teachers told the students that the test would
9
measure areas in which he/she has strengths or weaknesses.
The students could also be told that the scores appear in the
cumulative folders for a permanent record to show the
student's growth over a period of years.
PROCEDURES
The survey was administered to the students by the
investigator with the classroom teacher present. The students
completed the survey in the presence of the investigator. The
parent survey was sent home the same day students filled out
their surveys. A consent form explaining the survey was sent
prior to the survey (see appendix). The help of the teachers
was enlisted to guarantee return of the parent surveys.
The student survey consisted of 16 questions, created by
the researcher, designed to reveal the student's feelings.
The survey is located in the appendix. The majority of the
questions were answered on a 3-point rating scale of agreement
using a range of happy to sad smiley faces. A happy face
indicated agreement, a straight smile indicated a neutral
response, and a sad face designated disagreement. Each of the
3 faces were also accompanied by a written word describing the
choice. The use of a fixed response with a rating scale
allowed for easy scoring (Lyons, 1970). Previous studies of
lower elementary school classrooms have demonstrated that
students of this age are able to respond to a rating scale
(Peterson, Driscoll, & Stevens, 1990; Driscoll, Peterson,

Crow, & Larsen, 1985).
10
The remaining questions were open-
ended, short answer responses. These questions allowed the
students to reflect and describe their individual feelings.
The parent survey (see appendix) consisted of 7 open
ended, short-answer questions, created by the researcher. The
questions were designed to correspond with the student
questions. The parents described their child's home behavior
and attitudes during testing such as, no change was noticed,
or my child was more tired than usual.
The use of open-ended questions allowed students and
parents to state precisely how they felt (Lyons, 1970) about
the testing process. The questions also provided an
opportunity for respondents to include sentiments or
information not anticipated by the researcher.
Student and parent surveys were assigned numbers for
reference use. The number on the student survey matched the
number on his/her parent survey. This procedure facilitated
comparison of the student's view of his/her reactions to a
standardized test with his/her parent's observations while
maintaining anonymity.
LIMITATIONS
There are several limitations to consider when
interpreting the results of data obtained from the surveys.
For the majority of the students, this was their first time to
take a standardized test. The school system, which was a
11
private, parochial system, does not administer standardized
tests until the third grade. Some students were in the
process of taking a standardized test for the second time
during the school year as part of a pilot program for a new
standardized test.
It must also be considered that several months had passed
between the actual test taking and the time of the survey.
The students were shown one of the testing booklets to remind
them about the test.
Using one grade level was also a limitation. This
restricted the researcher from getting a cross-section of
students.
It is important to keep in mind that self-reported data
can be restricting.
students disposition.
Data could have be affected by the
As was mentioned earlier, the students were predominantly
white and middle class. Having the same socioeconomic
background could result in similar scores.
The geographic area also was a limitation to the study.
The area consisted of approximately a one hundred mile radius,
located in rural, Eastern Washington and Northeastern Oregon.
A final consideration is that the teachers of the
students were educated primarily in colleges with similar
teaching philosophies. The teachers thus exhibit similar
teaching philosophies and styles in the classrooms.
12
ANALYSIS
The analysis of data proceeded in a two-step sequence.
The first procedure was an analysis of student surveys.
Responses to the scale questions were computed by percentages
according to the rating on each question. A descriptive
summary accompanied the analysis. The open-ended questions
were summarized in thematic categories. The thematic
categories were identified through the process of re-readings
and the use of colored highlight markers to categorize the
predominate themes. A tally of the responses was made and the
percentage was then calculated from that tally. This process
of evaluation and categorization is consistent with the
analysis recommended for qualitative research as described by
Bogdan and Bilken ( 1982) . The second procedure was an
analysis of parent surveys. The data from parent surveys were
also summarized in thematic categories. Following the
analysis of parent surveys, comparisons of the categories
obtained from parent and student surveys were conducted. This
indicated how parent and student surveys compared or
contrasted; that is, whether there was agreement or a
difference between how students feel about taking tests and
how they behaved at home during test taking.

RESULTS AND DISCUSSION
INTRODUCTION
The students' responses toward the standardized test are
presented first. This interpretation includes two parts.
First are presented descriptive narratives of student
responses to the questions on the rating scale (see Table I) .
Second, thematic categorization of student responses to the
open-ended questions are presented. The analysis of the
parents' surveys succeeds the student response analysis. The
parent analysis is done by thematic categorization. Lastly,
student and parent surveys are compared and contrasted using
the thematic categories for references. This comparison is
done in two sections: first, comparison of individual
student/parent responses, and second, an overall comparison of
student/parent responses.
STUDENT RESPONSES ON SURVEY
Student Responses to Closed Questions
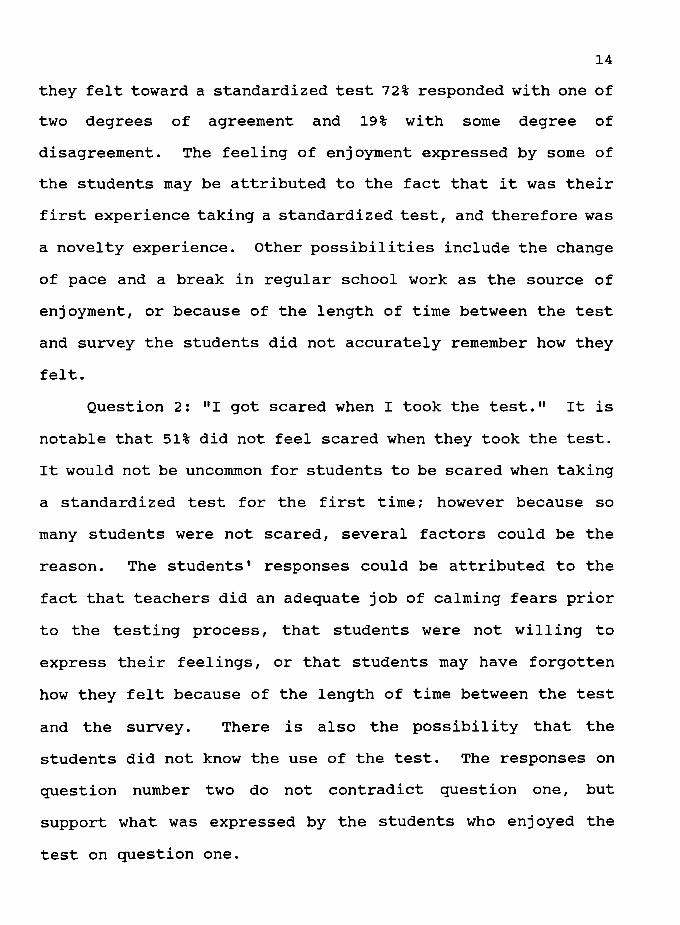
Question 1: "I enjoyed taking the test." The percentage
of students that enjoyed the test was slightly more than the
percentage that did not enjoy the test. It is notable that
more students enjoyed the test than those who did not. When
students in grades K-4 were asked by Beck and Stetz (1980) how
14
they felt toward a standardized test 72% responded with one of
two degrees of agreement and 19% with some degree of
disagreement. The feeling of enjoyment expressed by some of
the students may be attributed to the fact that it was their
first experience taking a standardized test, and therefore was
a novelty experience. Other possibilities include the change
of pace and a break in regular school work as the source of
enjoyment, or because of the length of time between the test
and survey the students did not accurately remember how they
felt.
Question 2: "I got scared when I took the test." It is
notable that 51% did not feel scared when they took the test.
It would not be uncommon for students to be scared when taking
a standardized test for the first time; however because so
many students were not scared, several factors could be the
reason. The students' responses could be attributed to the
fact that teachers did an adequate job of calming fears prior
to the testing process, that students were not willing to
express their feelings, or that students may have forgotten
how they felt because of the length of time between the test
and the survey. There is also the possibility that the
students did not know the use of the test. The responses on
question number two do not contradict question one, but
support what was expressed by the students who enjoyed the
test on question one.

15
Question 3: "I could think clearly when I took the test."
The majority of the students agreed that they were able to
think clearly when they took the test. The students'
responses on this question continue to support question two in
that students were not scared during the testing process. Why
the students could think clearly could be attributed to the
conditions under which the test was administered. Teachers
may have attempted to keep distractions to a minimum, such as
lighting, ventilation, and visitors. Not being scared could
also have contributed to being able to think clearly.
Question 4: "I tried to stay home so I wouldn't have to
take the test." The students responded that they could think
clearly and were not scared. This is further indication of
their comfort level with the testing process as expressed in
the previous questions. A strong majority of 79% responded
that they did not try to stay home. This can be ascribed to
several factors such as their family upbringing, the positive
way the test was presented, or the type of school environment
of which the students were a part.
Question 5: "I understood how to take the test." A
continued strong majority felt they understood how to take the
test. This supports the findings in the previous questions
that the students were comfortable with the testing
experience. This may be attributed to the fact that the
teacher explained the testing process and had the students
complete sample questions prior to the actual testing. This

16
test knowledge could alleviate some test anxiety as most of
the students responded in question two that they did not feel
scared and in question three that they could think clearly.
Question 6: "At the end of each test I felt good about
myself." This result was very encouraging to the researcher.
The student ratings indicated good self-concepts. The
responses indicated that the test did not lower the self
esteem of 68% of the students. The student responses did
indicate that 11% of the students did not feel good about
themselves at the end of the test. The lowered self-concept
could be attributed to the fact that these students may not
have been happy with their performance on the test, or they
may have felt too pressured by the timed factor of the test.
There is also the possibility that the time lapse between test
administration and this study contributed to the responses to
this question. The students may have forgotten how they felt.
Question 7: "The test results will help me to do better
in school." The students' responses indicated that overall
they felt that the test would help them do better in school.
These responses could be attributed to a situation in which
students are accustomed to regular teacher tests which help
them see areas in need of improvement and show ways to
improve. Students may have felt that the standardized test
would do the same.
Question 8: "I talked to my parents about how I felt
about the test." Student responses indicated that a majority

17
of students did not talk to their parents about the test. The
students' responses indicated that they viewed the testing
experience as positive. The students may have felt that the
testing experience was not a concern and therefore did not
feel a need to talk to their parents.
Question 9: "My parents talked to me about the test." A
slightly larger number of parents (44%) did not talk to their
children about the test at home, but the percentages of 44%
who did not and 39% who did are not significantly different.
This may be attributed to the idea that many parents today are
too busy to talk to their children, but it was encouraging to
the researcher that some parents {39%) did take the time to
talk to their children. Approximately the same number of
students talked to their parents as parents talked to
students.
Question 10: "Taking the test didn't upset me in any
way." The student responses continue to support the ratings
given on questions 1 and 2. The student reactions indicated
that they were comfortable enough with the testing process
that it did not upset them. These responses also support the
student answers to questions 3 and 6. The student responses
indicated that taking the test did not affect their thinking
ability or how they felt about themselves.
18
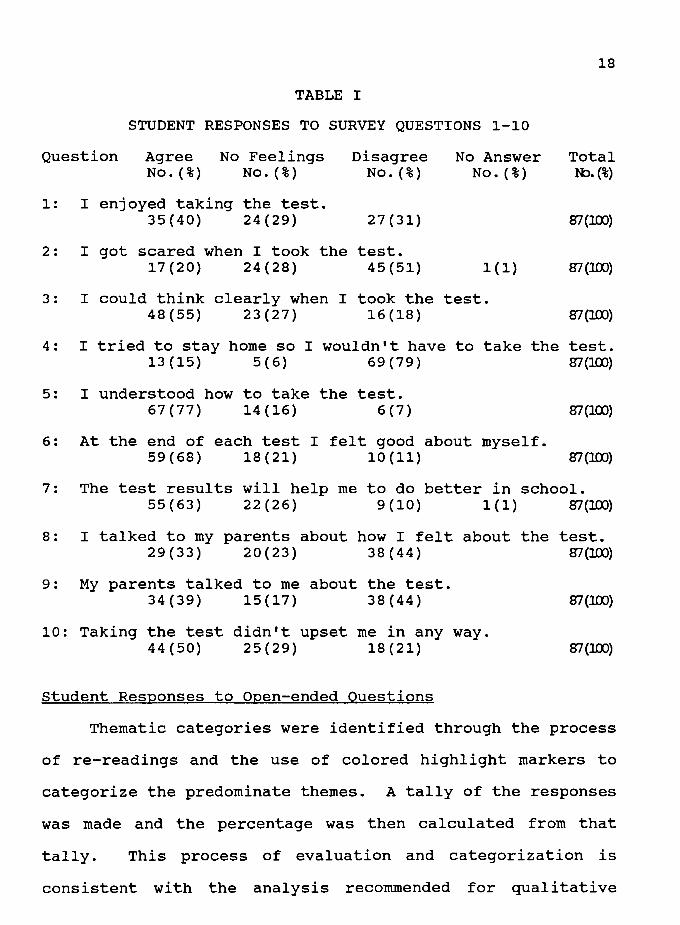
TABLE I
STUDENT RESPONSES TO SURVEY QUESTIONS 1-10
Question Agree No Feelings Disagree No Answer Total No. ( %) No. ( % ) No. ( % ) No. ( % ) N:J. (%)
1: I enjoyed taking the test. 35(40) 24(29) 27(31) ff/(100)
2: I got scared when I took the test. 17(20) 24(28) 45 ( 51) 1(1) ff/(100)
3: I could think clearly when I took the test. 48 (55) 23(27) 16(18) ff/(100)
4: I tried to stay home so I wouldn't have to take the test. 13(15) 5 ( 6) 69(79) ff/(100)
5: I understood how to take the test. 6 7 ( 7 7 ) 14 ( 16 ) 6 ( 7 ) ff/ (100)
6: At the end of each test I felt good about myself. 59 (68) 18 (21) 10 (11) ff/(100)
7: The test results will help me to do better in school. 5 5 ( 6 3 ) 2 2 ( 2 6 ) 9 ( 1 0 ) 1 ( 1 ) ff/ (100)
8: I talked to my parents about how I felt about the test. 29(33) 20(23) 38(44) ff/(100)
9: My parents talked to me about the test. 34(39) 15(17) 38(44) ff/(100)
10: Taking the test didn't upset me in any way. 44(50) 25(29) 18(21) ff/(100)
Student Responses to Open-ended Questions
Thematic categories were identified through the process
of re-readings and the use of colored highlight markers to
categorize the predominate themes. A tally of the responses
was made and the percentage was then calculated from that
tally. This process of evaluation and categorization is
consistent with the analysis recommended for qualitative
19
research as described by Bogdan and Bilken ( 1982) . The
calculations for this section are based on the 87 student
surveys, that is, 100% equals 87 surveys.
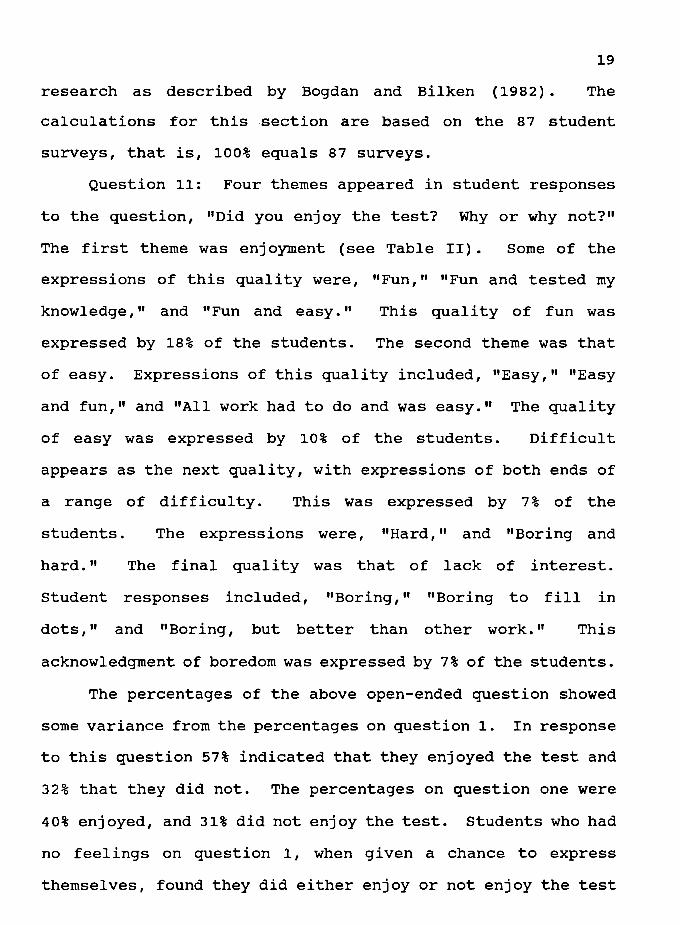
Question 11: Four themes appeared in student responses
to the question, "Did you enjoy the test? Why or why not?"
The first theme was enjoyment (see Table II). Some of the
expressions of this quality were, "Fun," "Fun and tested my
knowledge," and "Fun and easy." This quality of fun was
expressed by 18% of the students. The second theme was that
of easy. Expressions of this quality included, "Easy," "Easy
and fun," and "All work had to do and was easy." The quality
of easy was expressed by 10% of the students. Difficult
appears as the next quality, with expressions of both ends of
a range of difficulty. This was expressed by 7 % of the
students. The expressions were, "Hard," and "Boring and
hard." The final quality was that of lack of interest.
Student responses included, "Boring," "Boring to fill in
dots," and "Boring, but better than other work." This
acknowledgment of boredom was expressed by 7% of the students.
The percentages of the above open-ended question showed
some variance from the percentages on question 1. In response
to this question 57% indicated that they enjoyed the test and
32% that they did not. The percentages on question one were
40% enjoyed, and 31% did not enjoy the test. Students who had
no feelings on question 1, when given a chance to express
themselves, found they did either enjoy or not enjoy the test
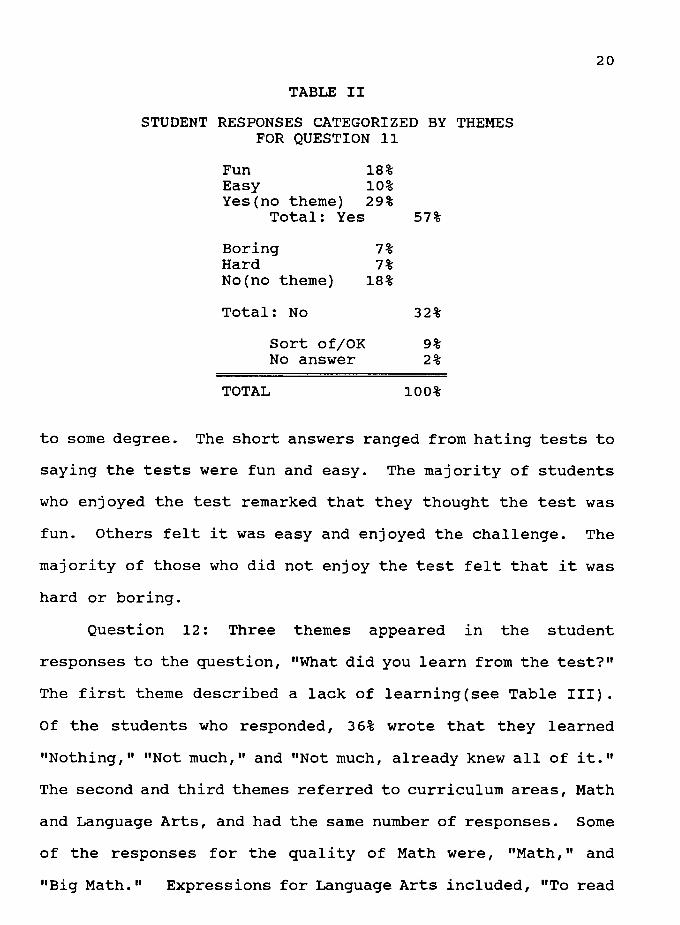
TABLE II
STUDENT RESPONSES CATEGORIZED BY THEMES FOR QUESTION 11
Fun Easy Yes(no theme)
Total: Yes
Boring Hard No(no theme)
Total: No
Sort of/OK No answer
TOTAL
18% 10% 29%
7% 7%
18%
57%
32%
9% 2%
100%
20
to some degree. The short answers ranged from hating tests to
saying the tests were fun and easy. The majority of students
who enjoyed the test remarked that they thought the test was
fun. Others felt it was easy and enjoyed the challenge. The
majority of those who did not enjoy the test felt that it was
hard or boring.
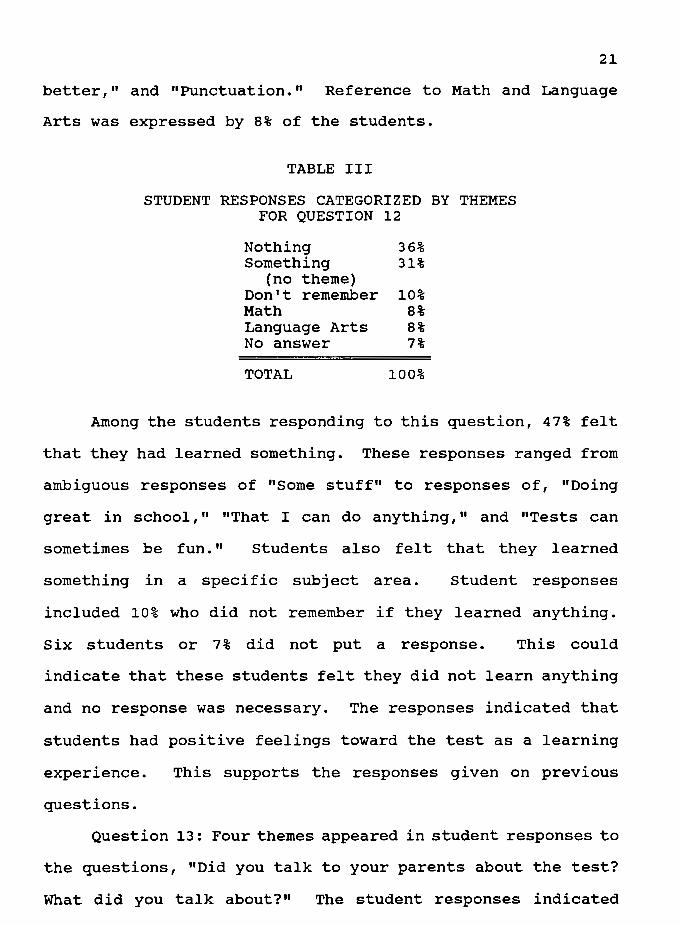
Question 12: Three themes appeared in the student
responses to the question, "What did you learn from the test?"
The first theme described a lack of learning(see Table III).
Of the students who responded, 36% wrote that they learned
"Nothing," "Not much," and "Not much, already knew all of it."
The second and third themes referred to curriculum areas, Math
and Language Arts, and had the same number of responses. Some
of the responses for the quality of Math were, "Math," and
"Big Math." Expressions for Language Arts included, "To read
21
better," and "Punctuation." Reference to Math and Language
Arts was expressed by 8% of the students.
TABLE III
STUDENT RESPONSES CATEGORIZED BY THEMES FOR QUESTION 12
Nothing Something
(no theme) Don't remember Math Language Arts No answer
TOTAL
36% 31%
10% 8% 8% 7%
100%
Among the students responding to this question, 47% felt
that they had learned something. These responses ranged from
ambiguous responses of "Some stuff" to responses of, "Doing
great in school," "That I can do anything," and "Tests can
sometimes be fun. " students also felt that they learned
something in a specific subject area. Student responses
included 10% who did not remember if they learned anything.
six students or 7 % did not put a response. This could
indicate that these students felt they did not learn anything
and no response was necessary. The responses indicated that
students had positive feelings toward the test as a learning
experience. This supports the responses given on previous
questions.
Question 13: Four themes appeared in student responses to
the questions, "Did you talk to your parents about the test?
What did you talk about?" The student responses indicated

22
that 52% did not talk to their parents and 39% did (see Table
IV). The first theme of the students who did talk to their
parents dealt with grades or scores from the test. Some of
the expressions of this quality were, "I wondered if I would
have to do it over if I did bad," "How good I did," and "How
good I did and what I needed to work on." This quality of
being graded was expressed by 10% of the students. The second
theme was that of describing the tests as fun/easy. The
expressions included, "How easy it was," and "Had fun taking
the test." The quality of fun/easy was expressed by 7% of the
students. The third and fourth qualities had the same number
of student responses. These were the qualities of length of
test and discussions of how they felt. The quality of length
included an expression of, "How long would the test last."
The quality of how they felt included expressions of "That I
was nervous, " and "How I felt. " These qualities of length and
how they felt were expressed by 5% of the students.
The student responses indicated that 39% of the students
talked to their parents. This figure varies slightly from the
figures on question 8. On question 8, 33% said they talked to
their parents. This variation may indicate that when students
are given the opportunity to express themselves in an open
ended question, they may remember more or will express
themselves more thoroughly. The responses for this question
range greatly from talking about feelings during the test to
asking parents how long the test would last. Many of the
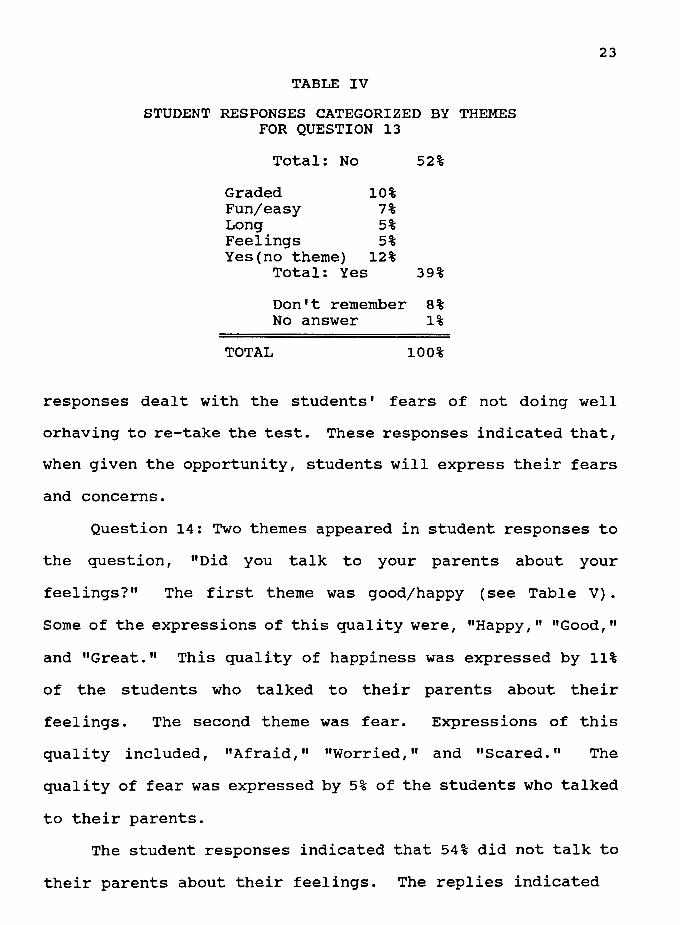
TABLE IV
STUDENT RESPONSES CATEGORIZED BY THEMES FOR QUESTION 13
Total: No 52%
Graded 10% Fun/easy 7% Long 5% Feelings 5% Yes(no theme) 12%
Total: Yes 39%
Don't remember 8% No answer 1%
TOTAL 100%
23
responses dealt with the students' fears of not doing well
orhaving to re-take the test. These responses indicated that,
when given the opportunity, students will express their fears
and concerns.
Question 14: Two themes appeared in student responses to
the question, "Did you talk to your parents about your
feelings?" The first theme was good/happy (see Table V) .
Some of the expressions of this quality were, "Happy," "Good,"
and "Great." This quality of happiness was expressed by 11%
of the students who talked to their parents about their
feelings. The second theme was fear. Expressions of this
quality included, "Afraid," "Worried," and "Scared." The
quality of fear was expressed by 5% of the students who talked
to their parents.
The student responses indicated that 54% did not talk to
their parents about their feelings. The replies indicated
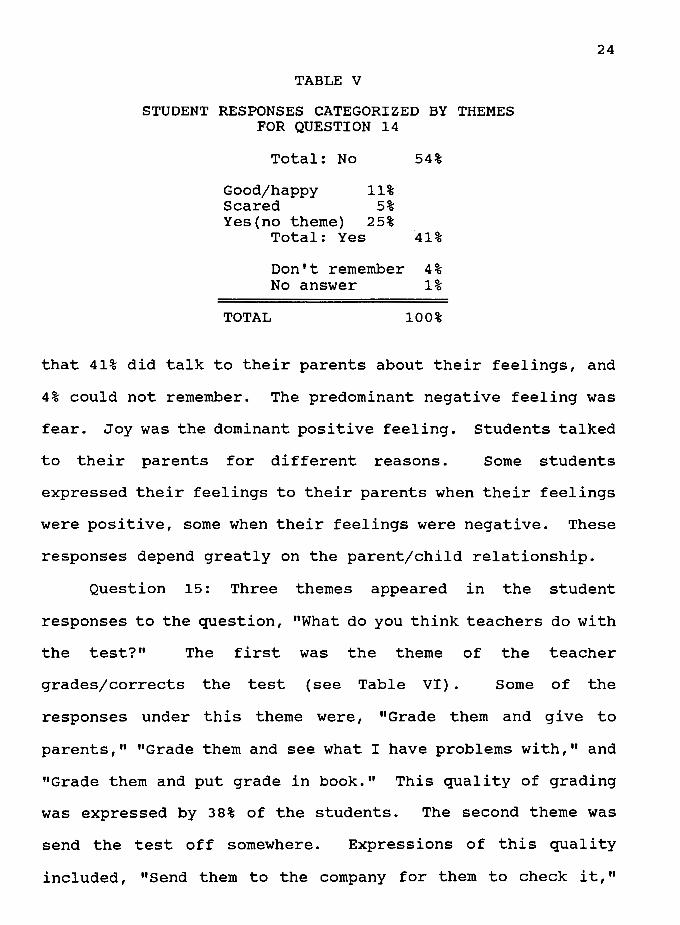
TABLE V
STUDENT RESPONSES CATEGORIZED BY THEMES FOR QUESTION 14
Total: No 54%
Good/happy Scared Yes(no theme)
Total: Yes
11% 5%
25% 41%
Don't remember 4% No answer 1%
TOTAL 100%
24
that 41% did talk to their parents about their feelings, and
4% could not remember. The predominant negative feeling was
fear. Joy was the dominant positive feeling. Students talked
to their parents for different reasons. Some students
expressed their feelings to their parents when their feelings
were positive, some when their feelings were negative. These
responses depend greatly on the parent/child relationship.
Question 15: Three themes appeared in the student
responses to the question, "What do you think teachers do with
the test?" The first was the theme of the teacher
grades/corrects the test (see Table VI). Some of the
responses under this theme were, "Grade them and give to
parents," "Grade them and see what I have problems with," and
"Grade them and put grade in book." This quality of grading
was expressed by 38% of the students. The second theme was
send the test off somewhere. Expressions of this quality
included, "Send them to the company for them to check it,"

25
"Give them to the people that made them," and "Send them to
people, run them through a machine and see if the dots are in
the right place." The quality of sending the test off was
expressed by 9% of the students. The third theme was computer
grading. Some of the expressions of this quality were, "Put
it in a machine that corrects it," and "Send them to a special
computer." This quality of computer grading was expressed by
9% of the students.
TABLE VI
STUDENT RESPONSES CATEGORIZED BY THEMES FOR QUESTION 15
Teacher grades Don't know No theme Sends off Computer grades No answer
TOTAL
38% 21% 16%
9% 9% 7%
100%
Most students were not aware that the test was not graded
by the teacher. The majority of the students viewed the test
like a regular teacher-made test. This may be attributed to
the students' lack of contact with standardized tests. They
viewed the test like any other test. Students assumed a grade
would be given and they could see how they did. No other uses
of their scores were realized. The student responses also
indicated that 21% did not know what the teacher did with the
test.

26
Question 16: Three themes appeared in the student
responses to the question, "Please expla"in in a short
paragraph how you felt about taking the test." The first
theme was happy/good (see Table VII). Some of the expressions
of this quality were, "Good and confident," "Very fine, it was
OK," and "Happy because I was going to learn more." This
quality of happiness/goodness was expressed by 25% of the
students. The second theme was being scared or nervous. Some
of the expressions of this quality included, "Scared, thought
would get a bad grade," "Scared at first because wanted to get
it right, when first saw test I wished never had seen it," and
"Scared at first, but then got used to it." This quality of
being scared/nervous was expressed by 12% of the students.
The third theme was fun. Expressions of this quality
included, "Fun and easy, " "Liked very much was easy, " and
"Fun, learned a lot, hope I get to do it again." The quality
of fun was expressed by 10% of the students.
The students' responses indicated that 43% of the
students had positive feelings toward the test. student
responses indicated that 31% reported negative feelings. The
positive feelings revolved around feeling good and having fun.
The negative feelings centered on being nervous. students
continued to have mixed feelings about the test. These
figures show that some students did not enjoy the test. This
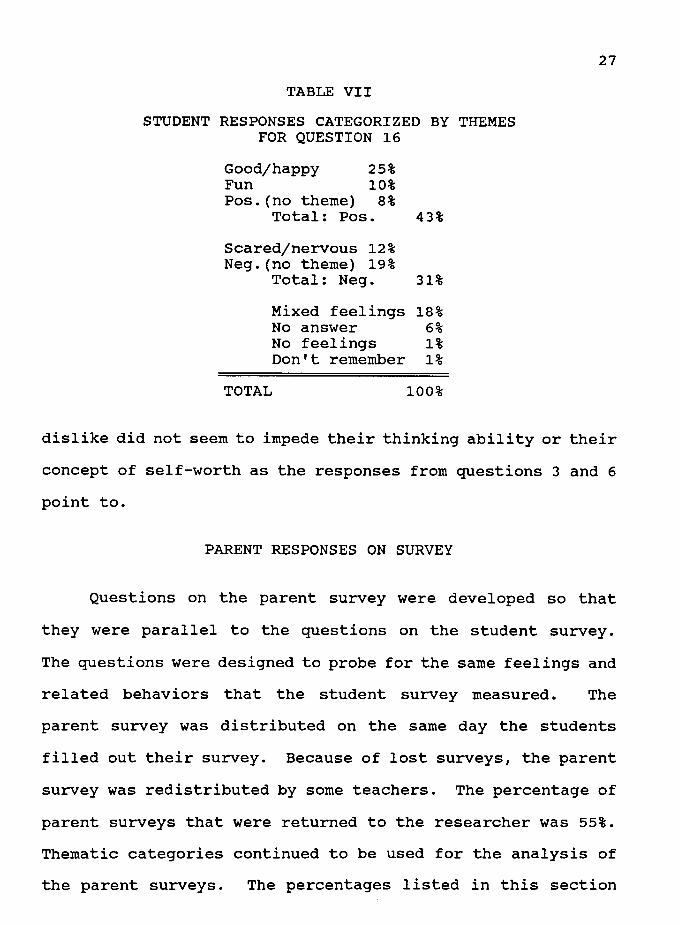
TABLE VII
STUDENT RESPONSES CATEGORIZED BY THEMES FOR QUESTION 16
Good/happy 25% Fun 10% Pos.(no theme) 8%
Total: Pos. 43%
Scared/nervous 12% Neg.(no theme) 19%
Total: Neg. 31%
Mixed feelings 18% No answer 6% No feelings 1% Don't remember 1%
TOTAL 100%
27
dislike did not seem to impede their thinking ability or their
concept of self-worth as the responses from questions 3 and 6
point to.
PARENT RESPONSES ON SURVEY
Questions on the parent survey were developed so that
they were parallel to the questions on the student survey.
The questions were designed to probe for the same feelings and
related behaviors that the student survey measured. The
parent survey was distributed on the same day the students
filled out their survey. Because of lost surveys, the parent
survey was redistributed by some teachers. The percentage of
parent surveys that were returned to the researcher was 55%.
Thematic categories continued to be used for the analysis of
the parent surveys. The percentages listed in this section

28
will be based on the 48 returned parent surveys, that is, 100%
equals the 48 returned surveys.
Question 1: Three themes appeared in the parent responses
to the question, "Did your child express any positive or
negative feelings about taking the Iowa Test of Basic Skills?"
The first was the theme of nervousness (see Table VIII). Some
expressions of this quality were, "Anxiety, didn't want to do
poorly," "Apprehension about getting good grades," and
"Nervousness." This quality of nervousness was expressed by
10% of the parents. The second theme was bored/fatigue.
Expressions of this quality included, "Tired of filling out
tests all day," "Boring, took too much time," and "Boring,
took too long." The quality of boredom/fatigue was expressed
by 8% of the parents. The third theme was
tedious/frustration. Some expressions of this quality were,
"Discouraged, frustrated," "Long, frustrated, not allowed to
use the restroom," and "Frustration." This quality of
tediousness/frustration was expressed by 8% of the parents.
The majority of parents responded that their children
expressed some type of feelings about the standardized test to
them. Of the feelings expressed the most (42%) were negative.
The most prevalent feeling was that of being nervous and
anxious. Children expressed that the tests took too long and
were tiring. The student responses seemed to indicate that
most children expressed their negative feelings at home as
opposed to positive feelings. This may be attributed to the

TABLE VIII
PARENT RESPONSES CATEGORIZED BY THEMES FOR QUESTION 1
Total: No 38% Don't remember 8%
Nervous Bored Frustrated Neg. (no theme)
Total: Neg.
10% 8% 8%
16% 42%
Pos.(no theme) 6% Total: Pos. 6%
Mixed feelings 4% No feelings 2%
Total: Yes 54%
TOTAL 100%
fact that they were comfortable expressing their negative
29
feelings at home, or that parents primarily remembered the
negative expressions over the positive expressions.
Question 2: Only one theme appeared in the parent's
responses to the question, "Did your child's behavior change
in any way during the testing process?" This theme was
fatigue (see Table IX) . Some expressions of this quality
were, "Tired and cranky," and "Needed more sleep at night."
This quality of fatigue was expressed by 19% of the parents.
The majority of parent responses (61%) indicated that
their child's behavior did not change in any way during the
testing process. The parents who stated that their child's
behavior changed felt that their child was more tired than
usual. This matches with the parent responses that the tests

TABLE IX
PARENT RESPONSES CATEGORIZED BY THEMES FOR QUESTION 2
No 61%
Tired 19% Yes(no theme) 10%
Total: Yes 29%
Don't remember 6% No answer 4%
TOTAL 100%
were long and tiring as conveyed in question one.
30
Question 3: Three themes appeared in the parent responses
to the questions, "Did you or your child bring up the subject
of the test and talk about it? If yes, who brought the
subject up? What did you talk about?" The first theme was
how the student was doing (see Table X) . Some of the
expressions of this quality were, "Checked on how was doing
each day, " and "Asked how child was holding up, assured
wouldn't last forever," and asked "How are you doing." This
quality of inquiry of how the student was doing was expressed
by 35% of the parents. The second and third themes were
expressed by the same number of parents. These themes were
expressed by the student to the parent and reflected the
student's feelings. The themes were boring/tedious and the
difficulty of filling in the circles on the answer sheet.
Expressions of these two qualities included, "Hard to fill in
the dots," "Boring and interferes with recess," and "Tedious

31
and boring." These two qualities were expressed by 6% of the
parents.
TABLE X
PARENT RESPONSES CATEGORIZED BY THEMES FOR QUESTION 3
How doing 35% Bored 6% Marking dots 6% Yes(no theme) 37%
Total: Yes 84%
Total: No 8% Don't remember 8%
TOTAL 100%
The parent responses indicated that 84% of them talked to
their child about the test. The majority of parents talked to
their child to get a feel for how the tests were going and how
the student felt they were doing. The majority of the parents
(55%) responded that their child brought up the subject of the
test. This is contradictory to the student responses on
question 8 of the student survey where 33% reported that they
talked to their parents. This may be attributed to the fact
that the parents remembered better than the students, or that
parents feel pressured to say that they indeed do talk to
their children.
Question 4: Three themes were evident in the parent
responses to the questions, "Did your child talk to you about
their feelings toward the test? If yes, what feelings did
they talk about?" The first theme was fatigue (see Table XI) .

32
Examples of responses that included this theme were, "Became
more tired as the week progressed," "Stressed and wearied by
the testing," and "Anxiousness and tiredness." This quality
of fatigue was expressed by 13% of the parents who responded
that their child talked about his/her feelings with them. The
second theme was the length of the test. Some of the
expressions of this quality were, "Test was long," "Took too
long, want to do other things," and "Took too much time."
Length of test was expressed by 8% of the parents who
responded that their child talked with them. The third theme
was boredom. Expression of this quality included, "Boring and
interfered with recess, 11 and "Bored, worried, didn't do well. 11
This quality of boredom was expressed by 6% of the parents.
TABLE XI
PARENT RESPONSES CATEGORIZED BY THEMES FOR QUESTION 4
Tired Long Boredom Yes(no theme)
13% 8% 6%
27% Total: Yes 54%
Total: No 34% Don't remember 6% No answer 6%
TOTAL 100%
This question was very similar to question number one on
the parent survey. A majority of parents said that their
child talked about their feelings toward the test. The main
feeling that was discussed continued to be related to fatigue
and how hard the test was.
33
The parents also continued to
relate that the students felt the test-taking process was too
long. The fatigue and boredom of the students could be
attributed to the length of the test. The boredom could also
be attributed to the repetitiveness of the testing process.
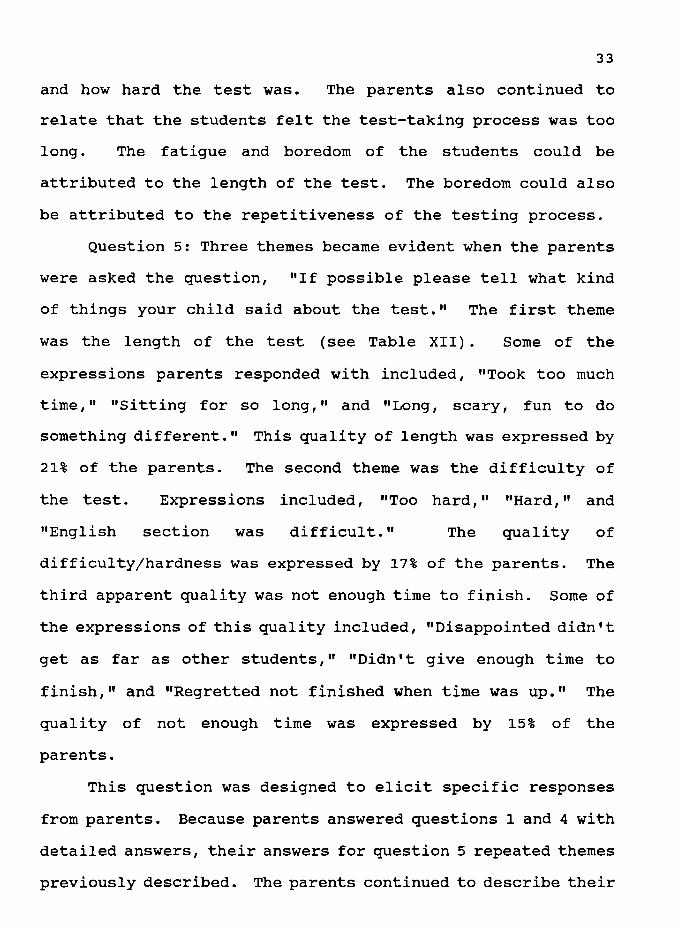
Question 5: Three themes became evident when the parents
were asked the question, "If possible please tell what kind
of things your child said about the test." The first theme
was the length of the test (see Table XII). Some of the
expressions parents responded with included, "Took too much
time," "Sitting for so long," and "Long, scary, fun to do
something different." This quality of length was expressed by
21% of the parents. The second theme was the difficulty of
the test. Expressions included, "Too hard," "Hard," and
"English section was difficult." The quality of
difficulty/hardness was expressed by 17% of the parents. The
third apparent quality was not enough time to finish. Some of
the expressions of this quality included, "Disappointed didn't
get as far as other students," "Didn't give enough time to
finish," and "Regretted not finished when time was up." The
quality of not enough time was expressed by 15% of the
parents.
This question was designed to elicit specific responses
from parents. Because parents answered questions 1 and 4 with
detailed answers, their answers for question 5 repeated themes
previously described. The parents continued to describe their
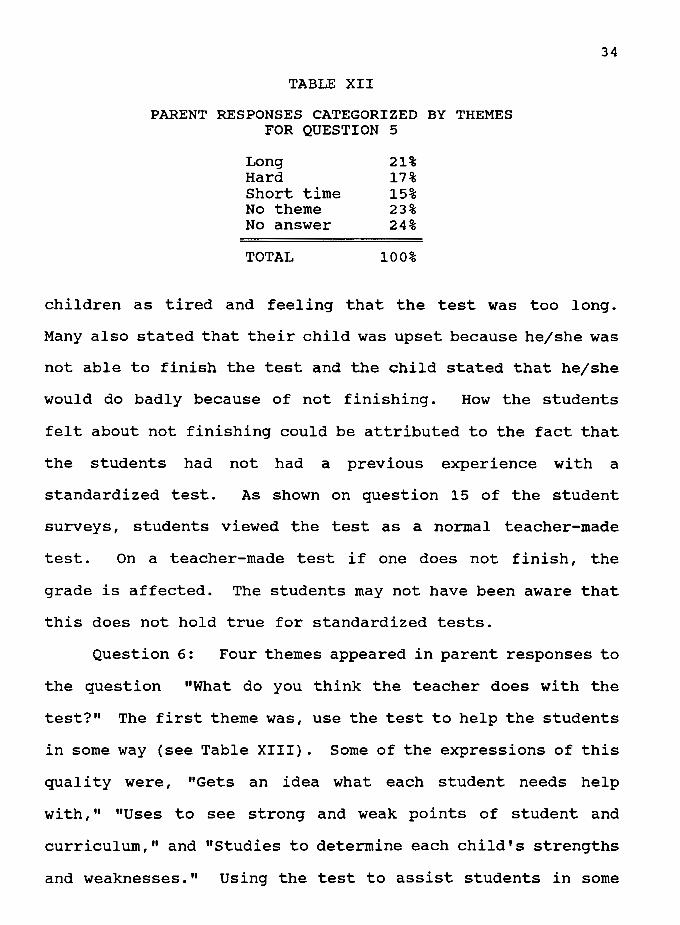
TABLE XII
PARENT RESPONSES CATEGORIZED BY THEMES FOR QUESTION 5
Long 21% Hard 17% Short time 15% No theme 23% No answer 24%
TOTAL 100%
34
children as tired and feeling that the test was too long.
Many also stated that their child was upset because he/she was
not able to finish the test and the child stated that he/she
would do badly because of not finishing. How the students
felt about not finishing could be attributed to the fact that
the students had not had a previous experience with a
standardized test. As shown on question 15 of the student
surveys, students viewed the test as a normal teacher-made
test. On a teacher-made test if one does not finish, the
grade is affected. The students may not have been aware that
this does not hold true for standardized tests.
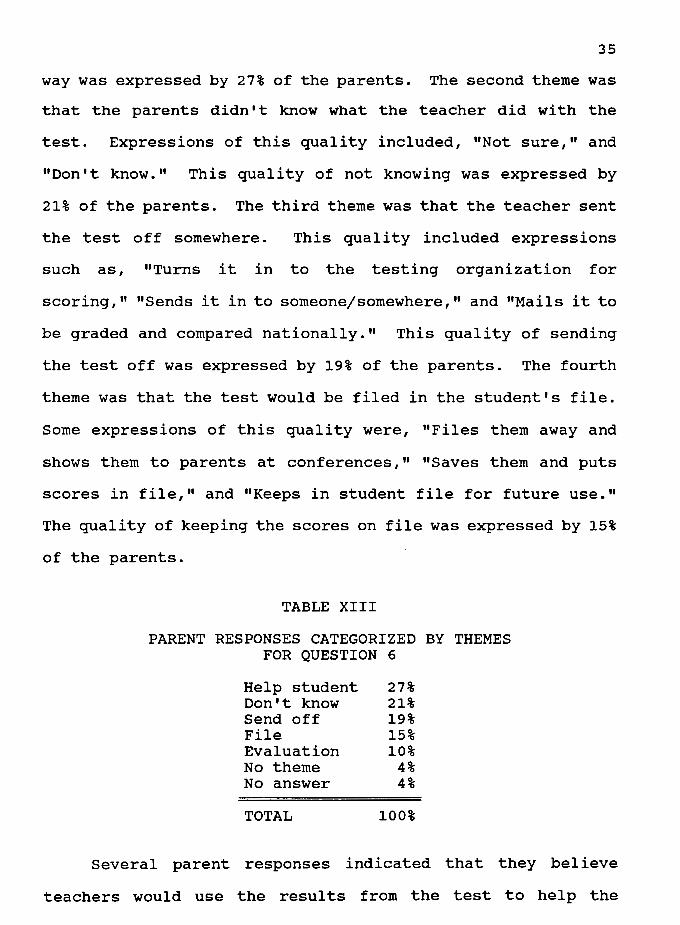
Question 6: Four themes appeared in parent responses to
the question "What do you think the teacher does with the
test?" The first theme was, use the test to help the students
in some way (see Table XIII) . Some of the expressions of this
quality were, "Gets an idea what each student needs help
with," "Uses to see strong and weak points of student and
curriculum," and "Studies to determine each child's strengths
and weaknesses." Using the test to assist students in some
35
way was expressed by 2 7 % of the parents. The second theme was
that the parents didn't know what the teacher did with the
test. Expressions of this quality included, "Not sure," and
"Don't know." This quality of not knowing was expressed by
21% of the parents. The third theme was that the teacher sent
the test off somewhere. This quality included expressions
such as, "Turns it in to the testing organization for
scoring," "Sends it in to someone/somewhere," and "Mails it to
be graded and compared nationally." This quality of sending
the test off was expressed by 19% of the parents. The fourth
theme was that the test would be filed in the student's file.
Some expressions of this quality were, "Files them away and
shows them to parents at conferences," "Saves them and puts
scores in file," and "Keeps in student file for future use."
The quality of keeping the scores on file was expressed by 15%
of the parents.
TABLE XIII
PARENT RESPONSES CATEGORIZED BY THEMES FOR QUESTION 6
Help student Don't know Send off File Evaluation No theme No answer
TOTAL
27% 21% 19% 15% 10%
4% 4%
100%
Several parent responses indicated that they believe
teachers would use the results from the test to help the

students in weak areas.
36
Other parents stated the test was
sent off somewhere. Many parents expressed that the scores
would be filed and referred to at parent/teacher conferences.
A number did not know what was done with the tests. Many
parents expressed that the tests were used in some sort of
evaluation process. What varied was what the parents thought
was being evaluated, that is, students, teacher, class, or
school.
Question 7: Several parents responded to the question,
"Please describe any other reactions your child had toward
taking the test that you haven't already discussed. Please
also note anything else you feel is important about your
child's reactions to taking the test." Parent responses were
not categorized for this question. The responses display
diversity and potential for recommendations so they are
included as written.
Fifteen parents wrote additional responses. Several are
included to provide specificity to the descriptive data of
this study. Those parents who felt that the tests were in
some way a negative experience for their child recommended
that less focus before and during the testing process might
reduce the stress on students. Others stated that, after the
results were known, their child's self-esteem was hindered
because of the scores they received. The drop in student
self-esteem as expressed by the parents may be attributed to
the secrecy at the time of the scores, the emphasis placed by
37
the teacher on the scores, or the response of the parents to
the scores.
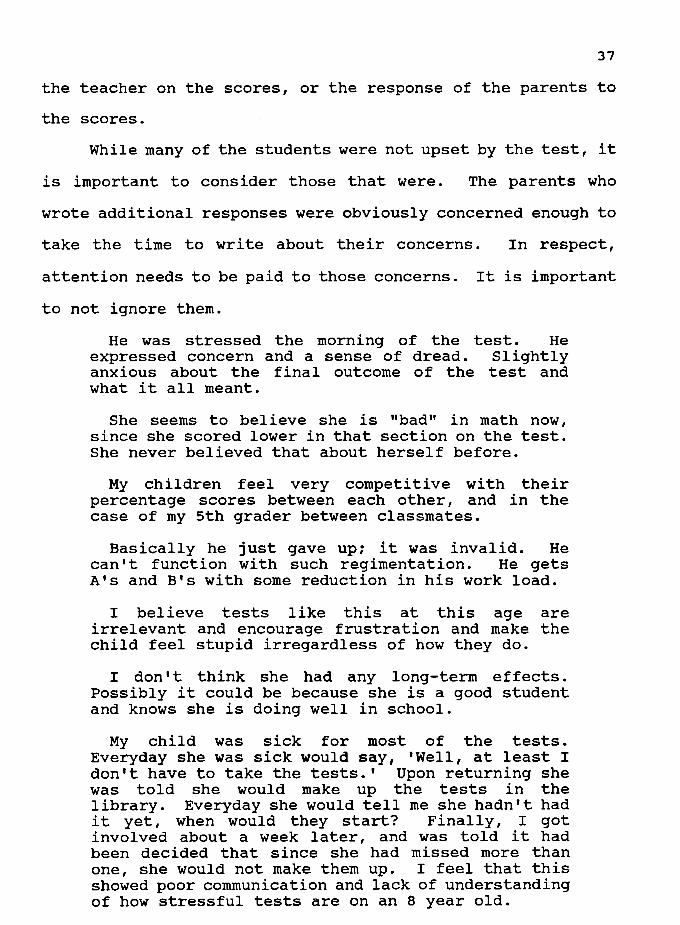
While many of the students were not upset by the test, it
is important to consider those that were. The parents who
wrote additional responses were obviously concerned enough to
take the time to write about their concerns. In respect,
attention needs to be paid to those concerns. It is important
to not ignore them.
He was stressed the morning of the test. He expressed concern and a sense of dread. Slightly anxious about the final outcome of the test and what it all meant.
She seems to believe she is "bad" in math now, since she scored lower in that section on the test. She never believed that about herself before.
My children feel very competitive with their percentage scores between each other, and in the case of my 5th grader between classmates.
Basically he just gave up; it was invalid. He can't function with such regimentation. He gets A's and B's with some reduction in his work load.
I believe tests like this at this age are irrelevant and encourage frustration and make the child feel stupid irregardless of how they do.
I don't think she had any long-term effects. Possibly it could be because she is a good student and knows she is doing well in school.
My child was sick for most of the tests. Everyday she was sick would say, 'Well, at least I don't have to take the tests.• Upon returning she was told she would make up the tests in the library. Everyday she would tell me she hadn't had it yet, when would they start? Finally, I got involved about a week later, and was told it had been decided that since she had missed more than one, she would not make them up. I feel that this showed poor communication and lack of understanding of how stressful tests are on an 8 year old.
38
Terrible reaction when the test was over. Taking wasn't so hard, but the results were so unfair for a child that is a good student to suddenly see that they are extremely low in areas that normally they excel in. These tests are unfair; they are comparing every one against everyone, not evaluating a child for what they can do. Just for what some graph says they should do. They don't do much for the morale of a child. Each teacher has to explain before they show you test results, that these tests are not accurate and your child is much better than these show. What good is that? These go on their permanent record. They are used to show a child's learning abilities and knowledge of work, but these are not accurate.
Another factor to consider that a parent mentioned is the
effect peer pressure exerts on students regarding attitudes
toward tests. Some students may have been influenced in their
attitudes and feelings prior to the test by peers or siblings.
COMPARISON OF STUDENT AND PARENT SURVEYS
This comparison contains two sections. First a
comparison of individual student and parent responses is
presented. Several of the questions were designed to probe
for a relationship between students• feelings and observed
behavior at home. This section looks at the answers given on
related questions to see how they compare or contrast.
Because not all student surveys could be matched with the
actual parent survey for that student due to lost and replaced
parent surveys, survey pairs were available for 51% of the
sample. From this 51%, a random sampling was selected for
analysis. The random sampling consisted of 29 pairs of
student/parent surveys. This is 33% of the total surveys
39
administered and 66% of the total matched pairs of
student/parent surveys. All figures for this section will be
based on the 29 pairs examined, that is, 100% equals the 29
pairs.
Following the individual comparison is an overall
comparison of student and parent responses. Although the
intent of this study was to probe the relationship between
individual student responses and reported home behavior, the
overall sample was also studied for the same relationship.
Comparison of Individual Student/Parent Responses
Of the student/parent responses examined, 79% of the
pairs showed agreement between student and parent responses,
18% showed a lack of agreement between student and parent
responses, and 3% did not provide enough information for a
comparison (see Table XIV) . Two themes appeared in the pairs
that showed agreement. The first theme was that of enjoying
the test. student expressions included, "It made me feel
smart, " "It was fun, " and "It was fun and easy. " Parent
expressions were, "When I asked him how his testing was going
he would say it was easy, " "No change in behavior, thought the
test was easy and interesting," and "No change, taking the
test didn't seem to bother him." The quality of enjoying the
test in some aspect was expressed by 41% of the pairs. The
second theme was that of dislike for the test. The student
expressions for this quality included, "I didn't enjoy the
test because I was worried that I would do bad," "I didn't
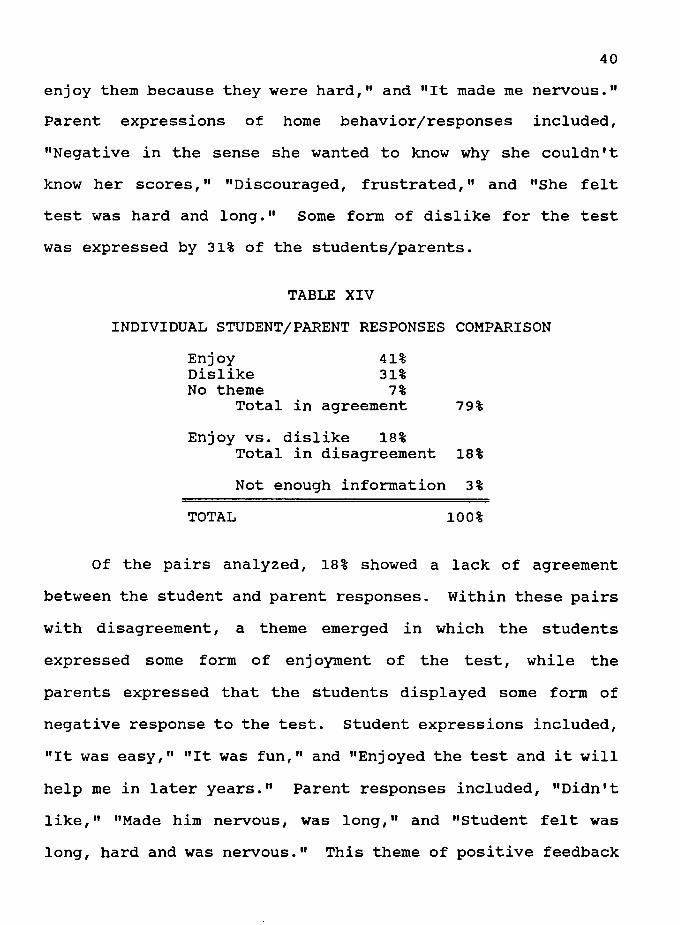
40
enjoy them because they were hard," and "It made me nervous."
Parent expressions of home behavior/responses included,
"Negative in the sense she wanted to know why she couldn't
know her scores," "Discouraged, frustrated," and "She felt
test was hard and long." Some form of dislike for the test
was expressed by 31% of the students/parents.
TABLE XIV
INDIVIDUAL STUDENT/PARENT RESPONSES COMPARISON
Enjoy Dislike No theme
Total
41% 31%
7% in agreement
Enjoy vs. dislike 18%
79%
Total in disagreement 18%
Not enough information 3%
TOTAL 100%
Of the pairs analyzed, 18% showed a lack of agreement
between the student and parent responses. Within these pairs
with disagreement, a theme emerged in which the students
expressed some form of enjoyment of the test, while the
parents expressed that the students displayed some form of
negative response to the test. Student expressions included,
"It was easy," "It was fun," and "Enjoyed the test and it will
help me in later years." Parent responses included, "Didn't
like," "Made him nervous, was long," and "Student felt was
long, hard and was nervous." This theme of positive feedback
41
from students and negative feedback from parents is consistent
among all the surveys with disagreement.
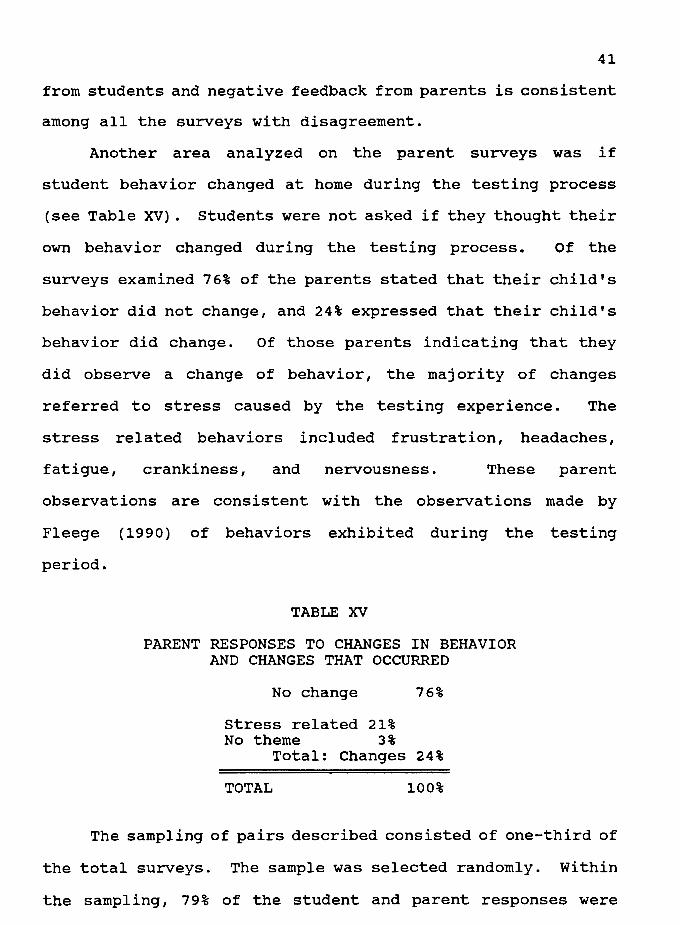
Another area analyzed on the parent surveys was if
student behavior changed at home during the testing process
(see Table XV). students were not asked if they thought their
own behavior changed during the testing process. Of the
surveys examined 76% of the parents stated that their child's
behavior did not change, and 24% expressed that their child's
behavior did change. Of those parents indicating that they
did observe a change of behavior, the majority of changes
referred to stress caused by the testing experience. The
stress related behaviors included frustration, headaches,
fatigue, crankiness, and nervousness. These parent
observations are consistent with the observations made by
Fleege (1990) of behaviors exhibited during the testing
period.
TABLE XV
PARENT RESPONSES TO CHANGES IN BEHAVIOR AND CHANGES THAT OCCURRED
No change 76%
Stress related 21% No theme 3%
Total: Changes 24%
TOTAL 100%
The sampling of pairs described consisted of one-third of
the total surveys. The sample was selected randomly. Within
the sampling, 79% of the student and parent responses were

consistent.
42
The students' stated feelings and their
behavior/expressions at home were consistent as indicated by
the responses to the survey. Of the feelings stated, a
majority of students expressed positive feelings toward the
testing experience. The predominant positive feeling was
happiness/enjoyment. The negative feelings indicated that the
test was long and boring. The majority of parents (76%) did
not see a change in student behavior. Of those parents that
indicated a change of behavior, most of the changes referred
to stress caused by the testing experience.
Comparison of student/Parent Responses Overall
The questions that were designed to establish a
relationship between student and parent surveys focused on how
the students felt toward the test. In this section the total
number of parent surveys returned are compared to the total
number of student surveys. When the students were asked about
their feelings related to the test, there was a relatively
even mixture of positive and negative answers. Positive
feelings made up 43% of the students' responses and negative
feelings, 31% of the students' responses (see student question
16). The positive feelings described feeling happy and good,
and indicated that the test was fun. Negative feelings
described feeling nervous, frustrated, and bored. Questions
11, 14, and 16 on the student survey probed the student
feelings.
43
Parent responses indicated that students expressed
primarily negative feelings at home. Of the parents that
responded, 42% indicated that their child expressed negative
feelings at home. Of the feelings expressed, 6% were positive
(see parent question 1). The negative feelings expressed
included, "Nervousness," "Boredom," "Tiredness," and
"Frustration." The negative feelings that students expressed
to their parents are consistent with the negative feelings
students stated on the surveys. These responses included,
"Boring," "Scared", and "Nervous." The negative feelings
students expressed toward the test on the survey were
consistent with their negative feelings expressed at home as
stated by their parents.
It is interesting to note that more parents stated that
there was communication between parent and child about the
test than student responses to the same question indicated.
Thirty-three percent of the students indicated on the rating
scale that they talked to their parents about the test, while
55% (see parent question 3) of the parents expressed that the
students brought up the subject of the test in conversations
at home. When students were asked in an open-ended question
how many talked to their parents, 39% indicated that they
talked to their parents (see student question 13).
Both parents and students were asked what teachers did
with the test. Parents are more aware than students that the
teachers send the test to be graded by an outside
44
organization. students view the test like teacher-made tests,
assuming that it will be graded and recorded like other tests
they have taken. Parents felt that teachers would use the
tests to help students with their weak areas. Students did
not indicate knowledge of any future use of the test scores.
There were a number of parents (21%) and students (21%) that
did not know what the teachers did with the tests (see parent
question 6 and student question 15).
Overall, students had mixed feelings toward the
standardized test, a few more students enjoyed the test than
did not. On the parent survey, negative feelings of the
students toward the test tended to be expressed by parents.
This could be attributed to the fact that not all parents
returned the survey. Another consideration could be that
those parents who saw a negative reaction by their child were
more concerned about returning the survey. Also to be taken
into consideration is that students at the time of the test
may have expressed negative feelings at home, but over time
did not remember the negative feelings about the test, or
students tend to express negative feelings at home more
readily than positive feelings.
STUDY CONCLUSIONS AND INTERPRETATIONS
From this study it can be concluded that students vary in
their feelings about taking standardized tests. The study
focused primarily on student attitudes and feelings about
taking a standardized test.
that students differ in
standardized test. While
The student responses indicated
their feelings about taking a
some students enjoyed the test,
others did not. Of the students surveyed, 57% indicated that
they enjoyed the test, as opposed to those students (32%) who
did not enjoy the test (see student question 11).
It can also be concluded that the displayed home behavior
of students was consistent with expressed feelings. If the
student did not enjoy the test, he/she tended to express that
dislike at home. It was notable that students who did not
enjoy the test tended to display those feelings at home more
than those who did enjoy the test. The students who enjoyed
the test appeared to be at a comfort level that did not lend
itself to expression through "out of the ordinary" behaviors
at home. Parents described observations of more negative
feelings in their children than positive feelings.
A further conclusion is that the students' home behavior
did not change during the testing process. The study showed
that a majority of parents did not notice any significant
change in behavior of the students at home. Most parents who

46
noticed a change in their child's behavior stated that their
child tended to be more tired than usual or demonstrated a
behavior brought on by stress.
Another facet of this study dealt with the administration
and grading aspect of the testing process. It can be
concluded that many students (21%) were not aware of the
grading process of the test. Many did not know how the test
was graded or the potential use of the scores. This lack of
awareness was also true for the parents. A number of parents
(21%) did not know what was done with the test after the
students completed it. Many of the parents (27%) felt the
test would be used to help the students in their areas of
weakness.
Other observations can also be made from the study. The
parents saw more changes in behavior than the students did in
themselves. The students were mixed in their feelings about
the test and the learning process it provided. Some felt they
learned something, others did not. One of the most
encouraging results is that the students' self esteem did not
seem to be greatly affected by taking the test. Students
indicated that they were not scared, could think clearly, and
felt good about themselves at the end of each test. While
many did not enjoy the test, the testing process did not lower
the self-concept of most children, as indicated by their
responses to the survey.
47
While this is not a representative cross-section of
schools, it begins to show how students feel toward
standardized tests and how those feelings are displayed and
observed by parents. It would be appropriate to follow up
this study with a large sample of public school students.
STUDY IMPLICATIONS AND DISCUSSION
INTRODUCTION
Implications for teacher professionals, parents and test
publishers can be drawn from this study. The following
sections describe ways that teachers, parents, and test
publishers may be able to make the testing process and
education as a whole more meaningful for the students. Some
of the implications may already be implemented in some
classrooms and families; in that case, the implications can
serve as a reference guide.
FOR TEACHER PROFESSIONALS
Teachers have long been aware that students do not like
tests. What many educators may not realize is that some
students may enjoy or feel positively about the tests or
certain aspects of the testing process. In this study many
students thought the test was fun and liked the challenge and
change of pace. Although students stated that they enjoyed
the test, they also described the process as long and tiring.
Often, teachers are more concerned with completing the tests
and with the level of student scores, than adjusting current
practices to students' needs and reactions.
administrators need to consider revision of
Teachers and
the testing

49
process. One possible change is the adjusting of a test
schedule so that fewer tests are given each day. Rather than
allowing one week for testing, two or three could be utilized.
In relation to schedules, students mentioned that recesses
were missed during the testing. Students value recesses and
look forward to them. By missing recesses, the students'
schedule was disrupted and more confusing. It might be
beneficial for teachers to look at planning the tests around
recess, or other regular routines, and adjust to the students'
need of continuity and security.
There is a general learning principle that if students
understand the objectives of what they are expected to do they
will perform better on those tasks (Fisher, Filby, Marliave,
Cahen, Dishaw, Moore, & Berliner, 1978). If students know why
they are taking the tests they will be more apt to look
positively at the experience as a learning one. The students
need more understanding about the test and what it will show.
Some students were frustrated with the test and testing
process. This frustration could be alleviated by explaining
the complete testing process to the students. This
explanation could include explaining the complete process at
the beginning of the testing and reminding students of the
process as testing takes place. During the explanation about
the test it is a good idea to explain how the grading process
works. Students indicated that they worried about not
finishing sections of the test. By explaining the grading

50
process, some of the fear and stress of not finishing could be
alleviated. It is important to thoroughly explain everything
to the students.
The whole schooling experience needs to be looked at when
administering a standardized test. This study has emphasized
the enjoyment aspect of the testing process. This aspect can
have an effect on the total schooling aspect of the student.
A positive or negative experience during a standardized test
could influence a student's attitude about learning and school
in general.
Parents should also be made aware of the testing process.
Often it is assumed that parents understand the testing
process. This study demonstrated that 11% of the parents did
not know the grading process of the test. If the complete
process was never explained to parents, they may not be aware
of it. Parents need to understand the need for the test and
how it can affect their child's school experience. The
parents need to know what the test results will be used for
and why.
Another area that needs to be considered is communicating
the appropriate purpose of the testing to the parents. There
is much media attention placed on the scores, which is often
in the form of ranking schools to determine which school is
best or worst. It is important for teachers to communicate to
the parents the appropriate use of test scores, some being to
determine if the curriculum is meeting the students' needs and

51
to aid teachers in adjusting their teaching practices. This
communication of the appropriate purpose to parents should be
of prime concern if teachers are to reveal the true purpose of
testing.
This study also raises questions about the common
procedures for reporting test scores to parents and students.
The scores can become a source of pressure on the parents or
students to perform. The reporting of scores can also limit
what parents see as the purpose of the test. The reporting of
scores can narrow the focus of the parents' understanding of
what testing is all about. The reporting of the test scores
can also become a stress to the students. A student who felt
he/ she was a good student can suddenly be made to feel
inferior. This was illustrated in the parents' written
comments on question 7 of the parent survey.
standardized tests will continue to be an area of
controversy. Unless there is a great shift in the way society
and education thinks, teachers will be administering
standardized tests for years to come. Since teachers will not
be able to do away with the testing process, what needs to be
addressed is that process. We must listen to what students
and parents are saying and adjust administration procedures to
fit students' needs. By meeting students' needs we will begin
to truly educate during the testing process.

52
FOR PARENTS
Parents are naturally concerned about their children and,
during the testing process, it is a natural reaction for that
concern to increase. Parents may not be aware of how
stressful the test can be. Most parents know if their
children are enjoying the test or not, by the student's
feedback at home, but may not be aware of how much the test is
affecting their children. During the testing process it might
be beneficial for parents to pay extra attention to their
child's nutrition. Nutritional food and regular, balanced
meals will benefit the students and help reduce the stress
level.
Parents may also want to monitor their child's exercise
level during testing. Exercise is another way to reduce
stress. Family walks in the afternoon or evening will allow
families a time to talk about the day as well as reduce their
stress level.
The most important recommendation would be for parents to
talk to their children about the test. Children can become
more comfortable with the testing process just by having an
opportunity to express themselves in a supportive environment.
We must allow children to express whatever feelings they may
be experiencing. At times, the feelings may come out in anger
or frustration. Just getting things out in the open can help
alleviate some of the anxiety or stress children may be

53
feeling. Above all, we must show children that they are loved
and cared for no matter what they are feeling.
FOR TEST PUBLISHERS
Students have expressed that they have difficulty filling
in the little squares or circles. Teachers stress to students
that they need to be careful not to go outside the circle or
their answer may be computed wrongly. This concentration on
filling in the circle "just right" takes away from the
students' concentration on the test questions. It might do
well for test makers to develop an easier marking system.
Students stated that not being able to finish the test
was upsetting to them. Perhaps test makers need to re
evaluate the number of questions that students are expected to
attempt to answer within the time limit, or make provision for
flexibility in time limits. It is understood that the timing
aspect is important for the standardization process, but
perhaps some adjustments could be made.
In addition to considering format, style and the amount
of testing, real revision needs to examine the type of
knowledge the testing is looking at. The question whether or
not the test is developmentally appropriate needs to be asked.
Is the whole child taken into consideration during the
development of the test? With the beginning of more
appropriate procedures for evaluation, such as portfolios and
teacher observation, the testing process itself needs to be
54
re-evaluated. Part of this re-evaluation needs to consider if
the test are truly needed, or if they have become a habit or
crutch for administrators.
This study showed that the testing process is stressful
for some students. In today's high-paced society with the
other stresses on students, the testing community may need to
alleviate stress rather than contribute to it.
SUMMARY
This study was a descriptive study of student attitudes
toward standardized tests and parent observations of behaviors
during the testing process. A total of 87 third grade
students and their parents were surveyed. The students were
predominately white and middle class. The school settings
consisted of parochial elementary schools.
The students were surveyed on how they felt about taking
a standardized test and what they experienced during the
testing process. The student survey consisted of 10 closed
and 6 open-ended questions. Parents were surveyed on their
child's behavior during testing and what their child expressed
at home about the test. The parent survey consisted of 7
open-ended questions. The study sought descriptions of how
students felt about taking a standardized test and explored
whether the feelings are displayed at home.
From this study it can be concluded that students vary in
their feelings about taking standardized tests. It can also
be concluded that students' displayed home behavior was
consistent with expressed feelings. A further conclusion is
that the students• home behavior did not change during the
testing process. It can also be concluded that many students
and parents were not aware of the grading process of the test
and the future use of the scores received.

56
Implications can be drawn for teachers that include
adjusting the test schedule to fit the students'
comfort/stress level, and explaining the purpose of the test
and the testing process to both students and parents. It is
also important for teachers to consider the common practice of
reporting test scores and the appropriate use of the test
scores. Implications for parents include looking at ways of
reducing stress through examining diet, exercise, and sleep
patterns of their children, and the parent's availability for
discussing the test. Implications can also be addressed to
test publishers, which include revision of procedures and the
time limitations placed on students, as well as reevaluating
if the testing process is needed at all.
An area not examined in this study is how students'
feelings about taking a standardized test change over a period
of years. Future research could address how students feel
about a taking a standardized test with a span of several
years between surveys.

REFERENCES CITED
Alley, J., Barnwell, J.M., Dickey, K., Kelley, D., Leifest, G., & Hartman, J. (1982). Reflections of six parents. In A.B. Anderson & L.V. Coburn (Eds.), Academic testing and the consumer: New directions for testing and measurement (Vol 16, pp. 93-109). San Francisco: Jossey-Bass.
Anastasi, A. & Geisinger, K.F. (1980). Use of tests with schoolchildren: Final project report. New York: Harcourt Brace Jovanovich.
Beck, M.D. & Stetz, F.P. (1980, April). Standardized testing as viewed by test specialists and users. Paper presented to the annual meeting of the National Council on Measurement in Education, Boston, MA.
Bogdan, R. & Bilken, s.w. (1982). Qualitative research for education: An introduction to theory and methods. Boston: Allyn & Bacon.
Driscoll, A., Peterson, K., Crow, N., & Larsen, B. {1985). student reports for primary teacher evaluation. Educational Research Quarterly, ~, 43-50.
Fisher,c., Filby, N., Marliave, R., Cahen, L., Dishaw, M., Moore, J., & Berliner, D. (1978). Teaching behaviors. academic learning time, and student achievement: Final report of Phase III-B. Beginning Teacher Evaluation Study. San Francisco: Far West Laboratory for Educational Research and Development.
Fleege, P. (1990). Stress begins in kindergarten: A look at behavior during standardized testing. Unpublished doctoral dissertation, University of North Texas, Denton.
Hardy, R.A. (1982). Parents' concern about standardized tests. In A.B. Anderson & L.B. Coburn (Eds.), Academic testing and the consumer: New directions for testing and measurement (Vol 16, pp. 89-92). San Francisco: Jossey Bass.

58
Karinos, J.S. & Karinos, A.H. (1980, April). Attitudes toward standardized achievement tests and relationships to achievement test perforinance. Paper presented at the Annual Meeting of the American Educational Research Association, Boston, MA.
Lyons, T. (1970). Instrumentation. In C.F. Paulson Jr. (Ed.), A strategy for evaluation design (Section IV). Teaching Research: A Division of the Oregon State System of Higher Education.
Peterson, K., Driscoll, A., & Stevens, D. (1990). Primary grade student reports for teacher evaluation. Journal of Personnel Evaluation in Education, ~' 165-173.
Roth, R.A. (1981). How to conduct surveys, follow-up studies, and basic data collection in evaluation studies. Lanham, MD: University Press of America.
SXUllilS a.NV dI'IS NOISSIYraad
XIGNaddV
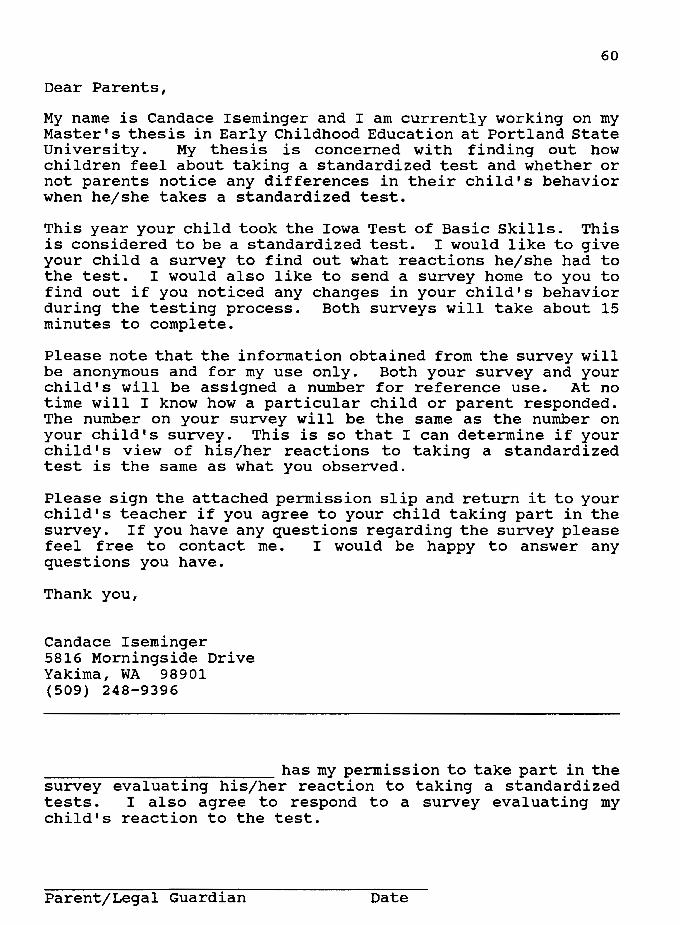
60
Dear Parents,
My name is Candace Iseminger and I am currently working on my Master's thesis in Early Childhood Education at Portland State University. My thesis is concerned with finding out how children feel about taking a standardized test and whether or not parents notice any differences in their child's behavior when he/she takes a standardized test.
This year your child took the Iowa Test of Basic Skills. This is considered to be a standardized test. I would like to give your child a survey to find out what reactions he/she had to the test. I would also like to send a survey home to you to find out if you noticed any changes in your child's behavior during the testing process. Both surveys will take about 15 minutes to complete.
Please note that the information obtained from the survey will be anonymous and for my use only. Both your survey and your child's will be assigned a number for reference use. At no time will I know how a particular child or parent responded. The number on your survey will be the same as the number on your child's survey. This is so that I can determine if your child's view of his/her reactions to taking a standardized test is the same as what you observed.
Please sign the attached permission slip and return it to your child's teacher if you agree to your child taking part in the survey. If you have any questions regarding the survey please feel free to contact me. I would be happy to answer any questions you have.
Thank you,
Candace Iseminger 5816 Morningside Drive Yakima, WA 98901 (509) 248-9396
~~~~~~~~~~~~~has my permission to take part in the survey evaluating his/her reaction to taking a standardized tests. I also agree to respond to a survey evaluating my child's reaction to the test.
Parent/Legal Guardian Date
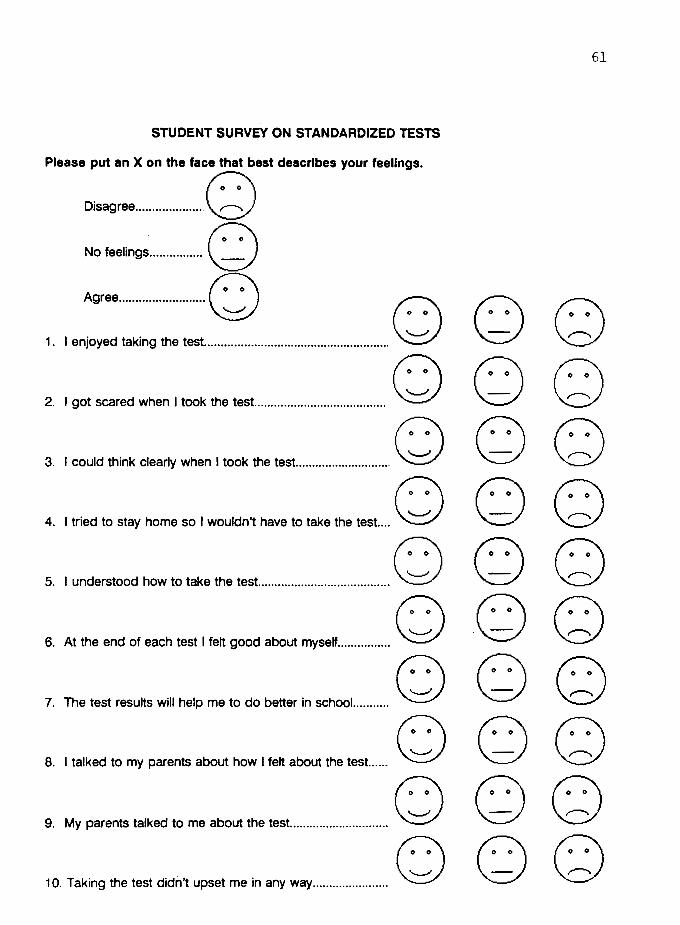
61
STUDENT SURVEY ON STANDARDIZED TESTS
Please put an X on the facAest describes your feelings.
Disagree .................... \c) (.:\
No feelings ................ \.d
QQ 0 Agree.......................... 0 0 0
~ 1. I enjoyed taking the test ....................................................... .
2. I got scared when I took the test... .................................... . OQQ (.:\
3. I could think clearly when I took the test ............................. \::::::.,)
(.:\ 4. I tried to stay home so I wouldn't have to take the test.... \::::::.,)
(.:\ 5. I understood how to take the test... ..................................... \::::::.,)
(.:\ 6. At the end of each test I felt good about myself ................ \::::::.,)
(.:\ 7. The test results will help me to do better in school. .......... \::::::.,)
QQ QQ QQ QQ QQ
(.:\ (.:\ (.:\ 8. I talked to my parents about how I felt about the test...... \::::::.,) \.d- \c)
0 9. My parents talked to me about the test.............................. '--' QQ
(.:\ (.:\ (.:\ 10. Taking the test didn't upset me in any way ....................... \::::::.,) \.d- \c)

Please wr1te a short answer for the follow1ng quest1ons.
11. Did you enjoy the test? Why or why not?
12. What did you learn from the test?
13. Did you talk to your parents about the test? What did you talk about?
14. Did you talk to your parents about your feelings? What feelings did you talk about?
15. What do you think teachers do with the test?
16. Please expla1n tn a short paragragh how you felt about taking the test.
62

PARENTS SURVEY ON ST AND ARD I ZED TESTS
Please answer the following questions to the best of your knowledge.
1. Did your child express any poslt1ve or negative feelings about taking the Iowa Test of Bas1c Skills? If yes, explain those feelings.
2. D1d your ch11d's behavior change 1n any way during the testing process? If yes, explain those changes.
3. Did you or your child bring up the subject of the test and talk about It? If yes, who brought the subject up? What d1d your talk about? Why?
4. Did your ch11d talk to you about their feelings toward the test? If yes, what feel lngs did they talk about?
5. If possible please tell what kind of things your child said about the test.
6. What do you think the teacher does with the test?
7. Please describe any other reactions your child had toward taking the test that you haven't already discussed. Please also note anything else you feel 1s Important about your child's reactions to taking the test.
63