Embed Size (px)
Citation preview
Student: C1C Tim BrownAdvisor: Maj. Lydon
Fast Burning Hybrid Fuels
Preview Motivation Fuel Burning Theory Objectives Predictions Cavitating Venturi Experimental Test Set-Up Results Conclusions
Motivation
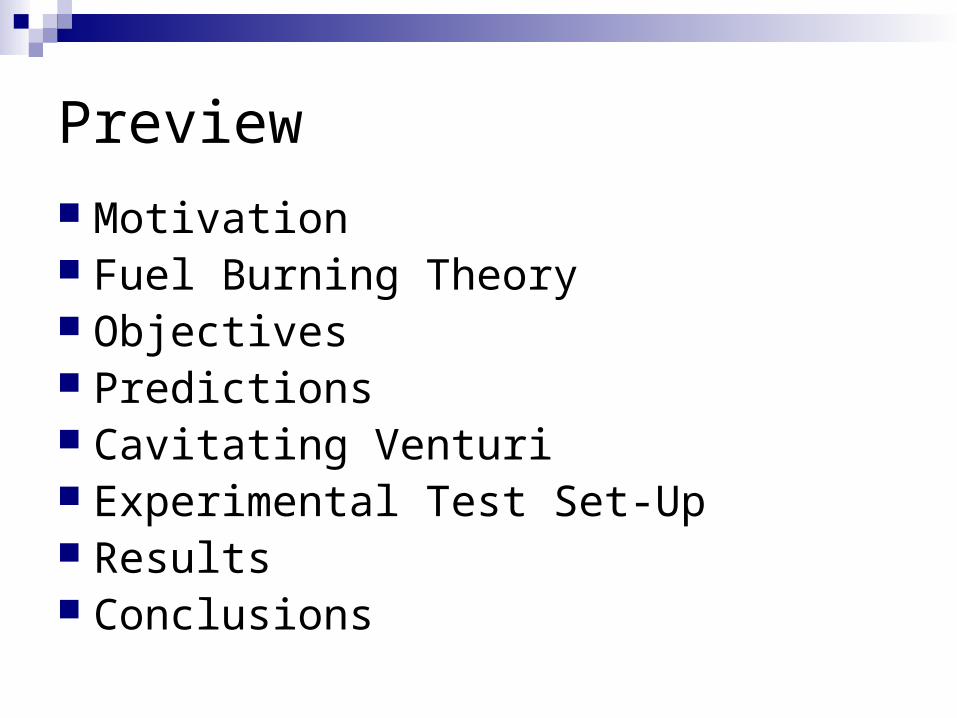
There is growing emphasis on safety, environmental cleanliness, low cost, and safety .
Hybrids suffer from low regression rates
Advantages over solids
Advantages over liquids
Throttling Simpler
Safety Cheaper
Restart/Shut-down
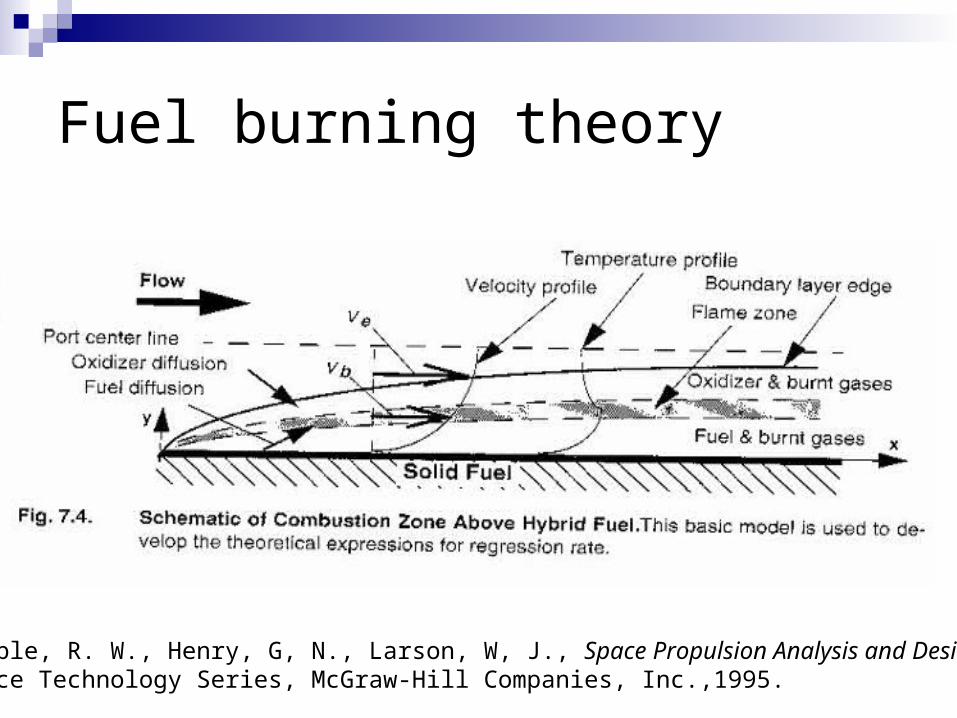
Fuel burning theory
Humble, R. W., Henry, G, N., Larson, W, J., Space Propulsion Analysis and Design, Space Technology Series, McGraw-Hill Companies, Inc.,1995.
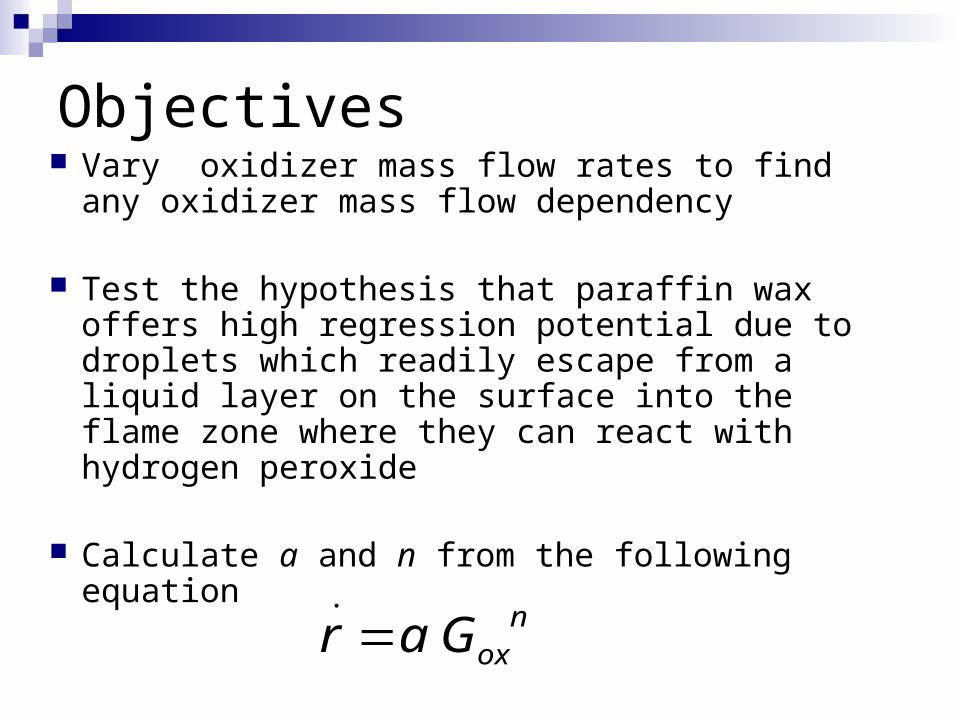
Objectives Vary oxidizer mass flow rates to find any
oxidizer mass flow dependency
Test the hypothesis that paraffin wax offers high regression potential due to droplets which readily escape from a liquid layer on the surface into the flame zone where they can react with hydrogen peroxide
Calculate a and n from the following equationn
oxGar .
Predictions
0
50
100
150
200
250
300
0 5 10 15O/F Ratio
Sp
ec
ific
Imp
uls
e (
s)
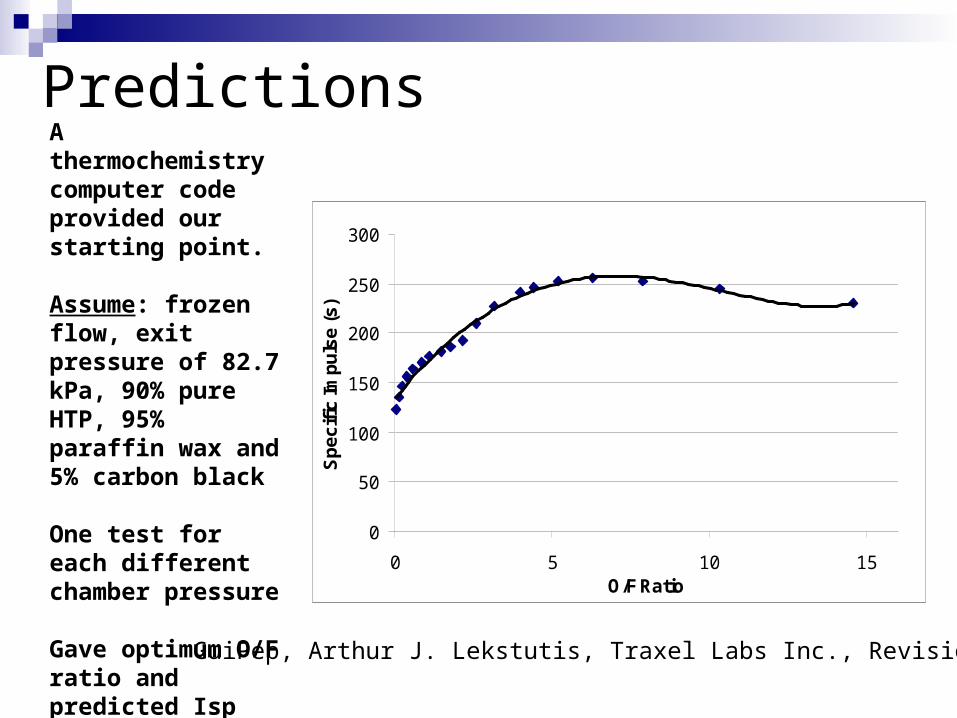
A thermochemistry computer code provided our starting point.
Assume: frozen flow, exit pressure of 82.7 kPa, 90% pure HTP, 95% paraffin wax and 5% carbon black
One test for each different chamber pressure
Gave optimum O/F ratio and predicted Isp GuiPep, Arthur J. Lekstutis, Traxel Labs Inc., Revision 0.04
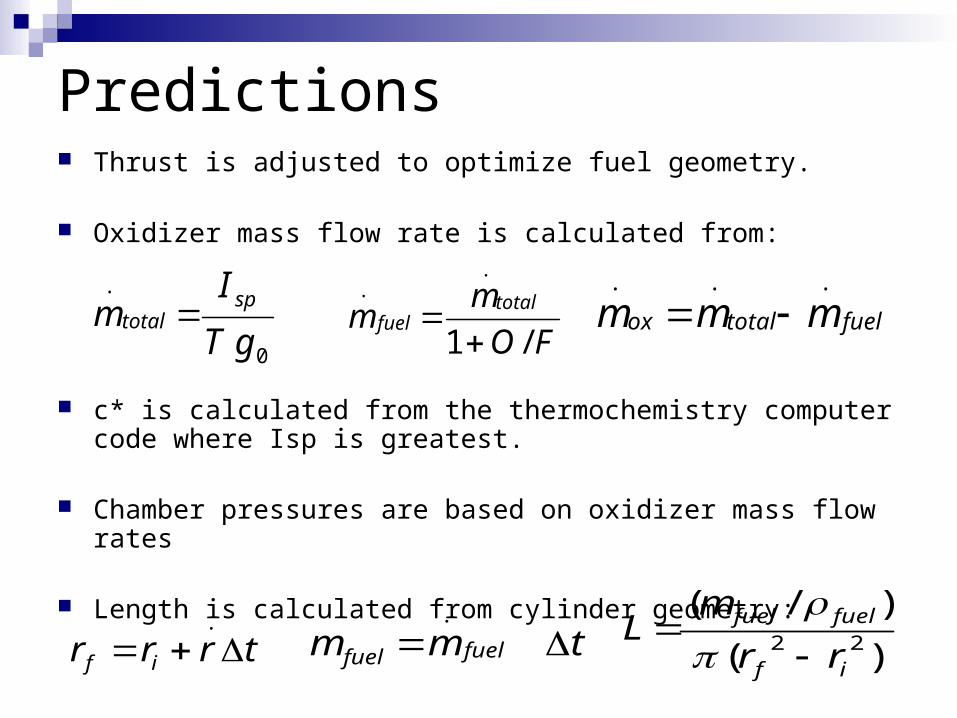
Predictions Thrust is adjusted to optimize fuel geometry.
Oxidizer mass flow rate is calculated from:
c* is calculated from the thermochemistry computer code where Isp is greatest.
Chamber pressures are based on oxidizer mass flow rates
Length is calculated from cylinder geometry:
0
.
gT
Im sp
total fueltotalox mmm...
)(
)/(22
if
fuelfuel
rr
mL
FO
mm
totalfuel
/1
..
trrr if .
tmm fuelfuel .
Predictions
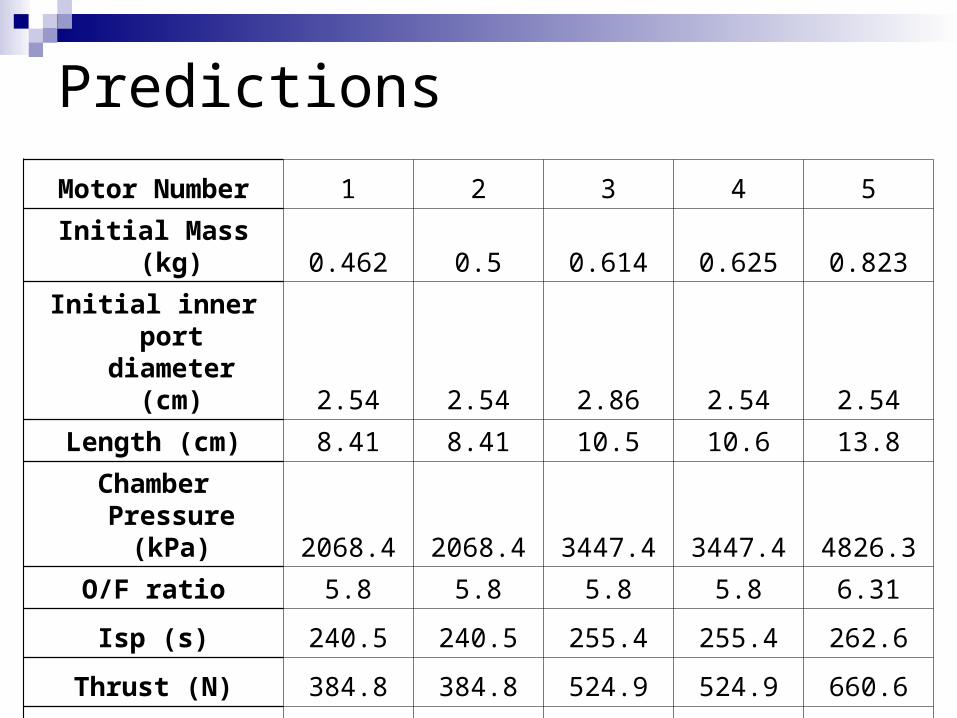
Motor Number 1 2 3 4 5
Initial Mass (kg) 0.462 0.5 0.614 0.625 0.823
Initial inner port diameter (cm) 2.54 2.54 2.86 2.54 2.54
Length (cm) 8.41 8.41 10.5 10.6 13.8
Chamber Pressure (kPa) 2068.4 2068.4 3447.4 3447.4 4826.3
O/F ratio 5.8 5.8 5.8 5.8 6.31
Isp (s) 240.5 240.5 255.4 255.4 262.6
Thrust (N) 384.8 384.8 524.9 524.9 660.6
mdot ox (kg/s) 0.14 0.14 0.18 0.18 0.22
c* (m/sec) 1622 1622 1622 1622 1622
Cavitating Venturi
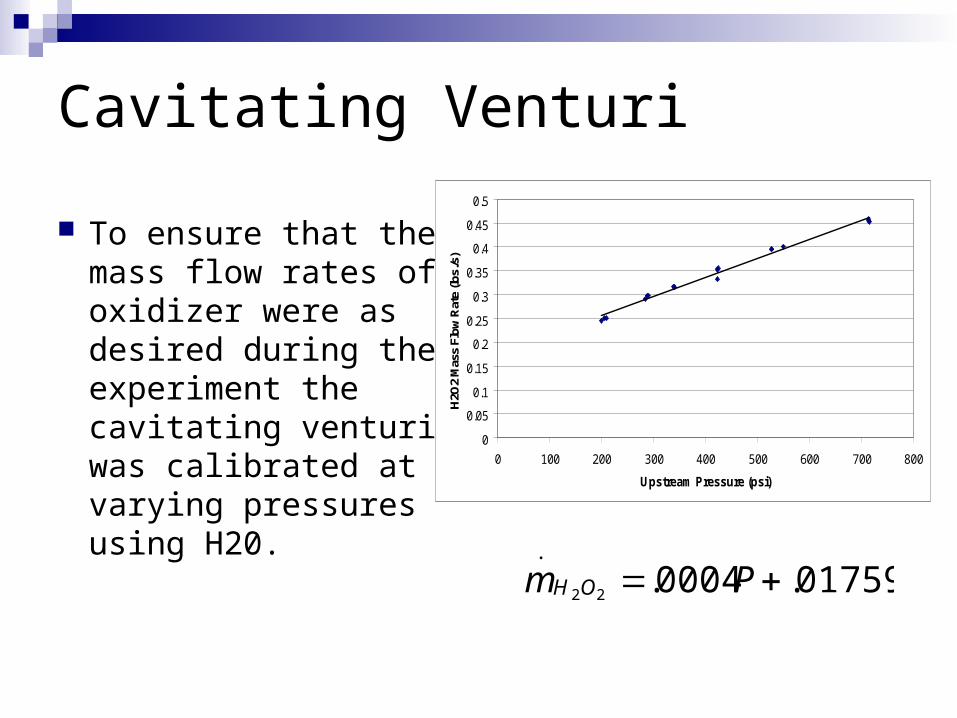
To ensure that the mass flow rates of oxidizer were as desired during the experiment the cavitating venturi was calibrated at varying pressures using H20. 01759.0004.22
.
Pm OH
0
0.05
0.1
0.15
0.2
0.25
0.3
0.35
0.4
0.45
0.5
0 100 200 300 400 500 600 700 800
Upstream Pressure (psi)
H2O
2 M
ass
Flow
Rat
e (lb
s./s
)
Experimental Test Set-up
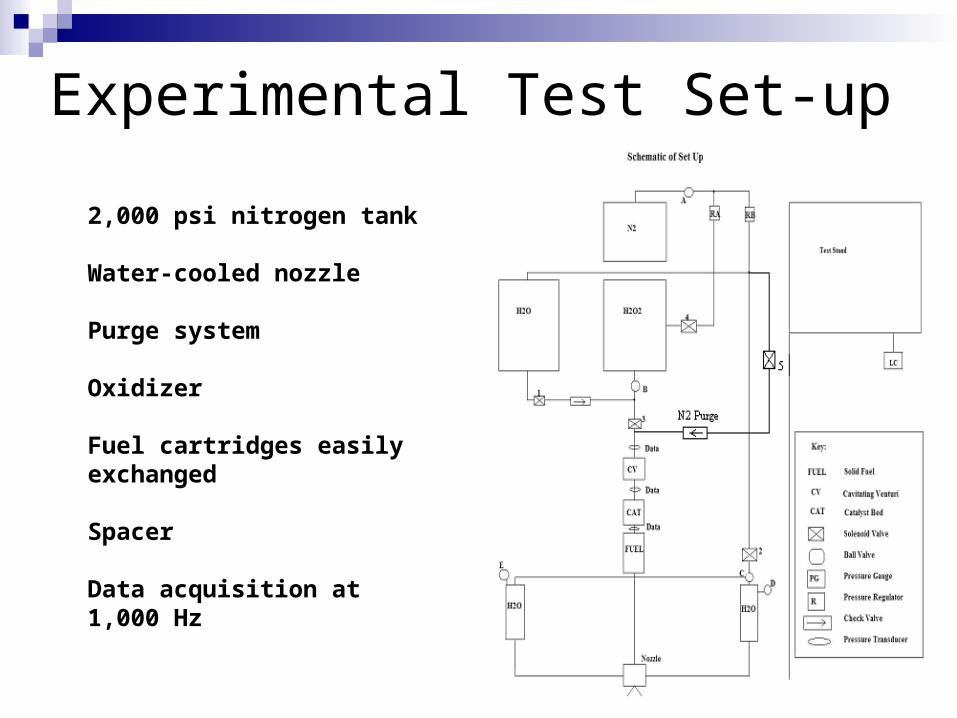
2,000 psi nitrogen tank
Water-cooled nozzle
Purge system Oxidizer
Fuel cartridges easily exchanged
Spacer
Data acquisition at 1,000 Hz
Experimental Test Set-Up
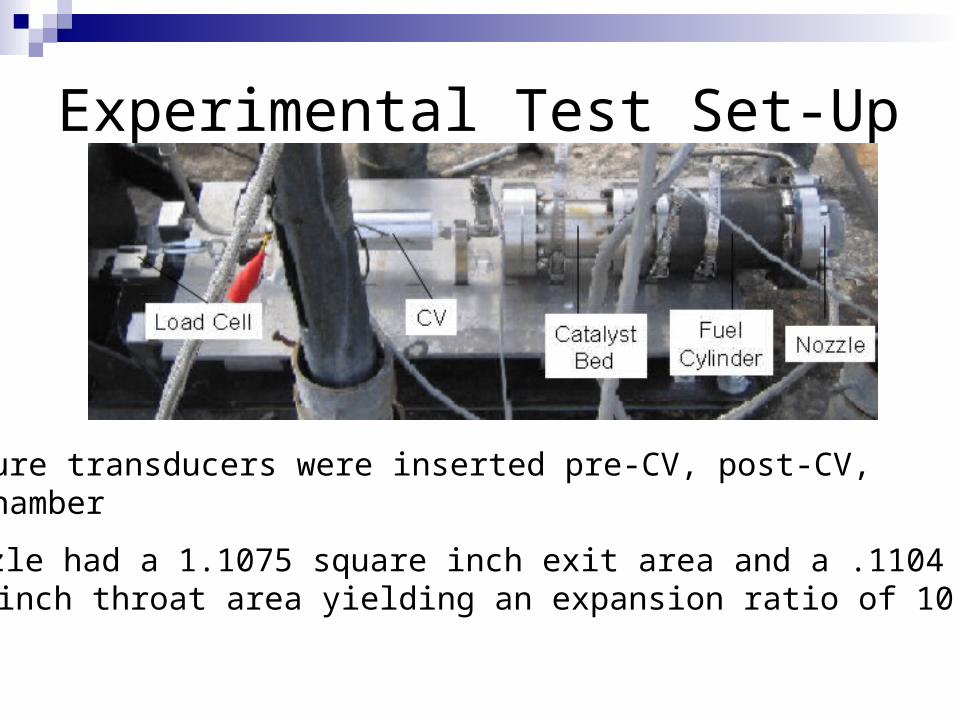
Pressure transducers were inserted pre-CV, post-CV, and chamber
The nozzle had a 1.1075 square inch exit area and a .1104 square inch throat area yielding an expansion ratio of 10.03.
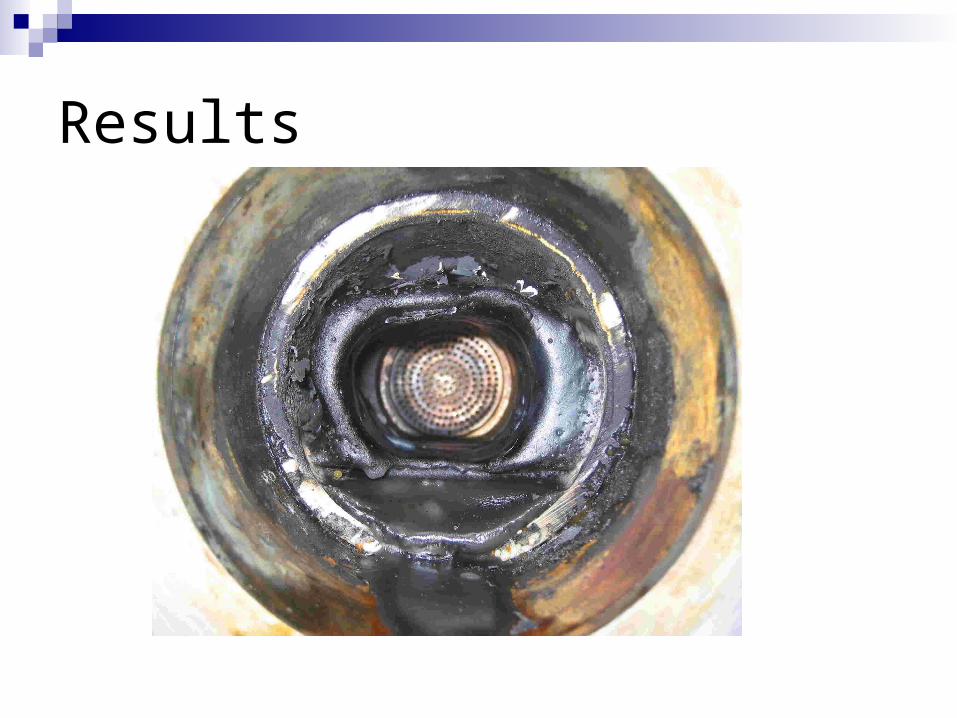
Results
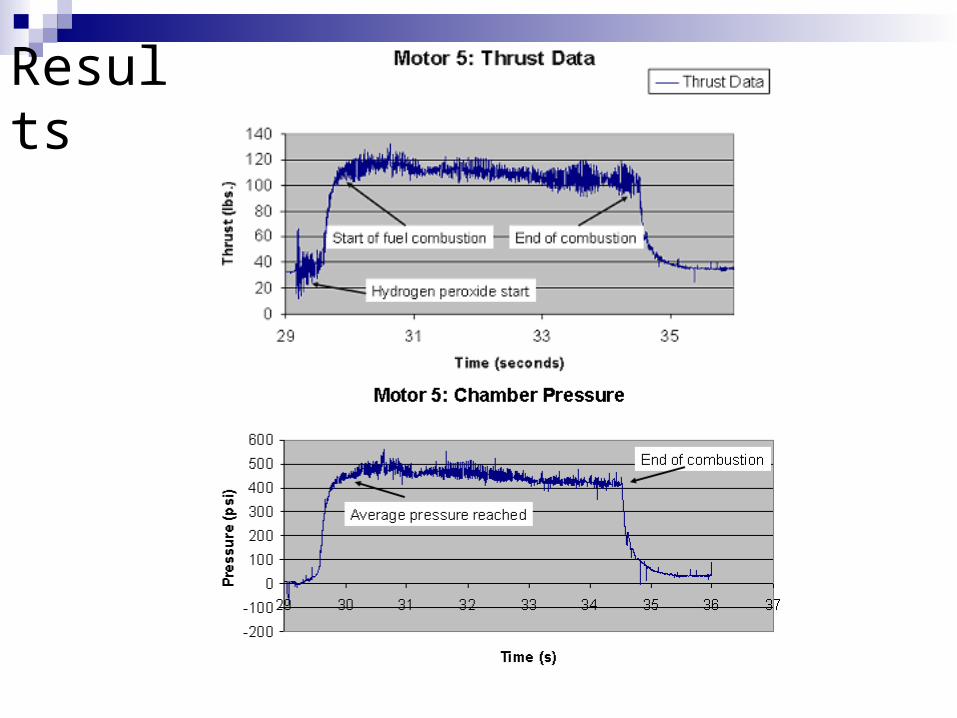
Results
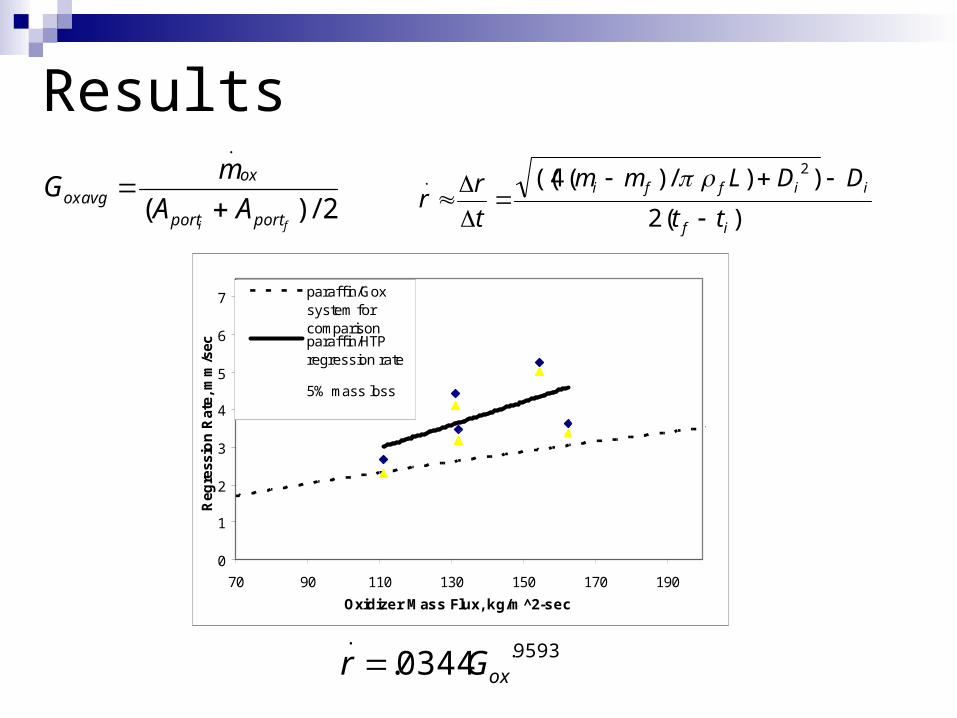
Results
2/)(
.
fi portport
ox
avgox AA
mG
)(2
))/)(4(( 2.
if
iiffi
tt
DDLmm
t
rr
0
1
2
3
4
5
6
7
70 90 110 130 150 170 190
Oxidizer Mass Flux, kg/m^2-sec
Reg
ress
ion
Rat
e, m
m/s
ec
paraff in/Goxsystem forcomparisonparaff in/HTPregression rate
5% mass loss
9593..
0344. oxGr
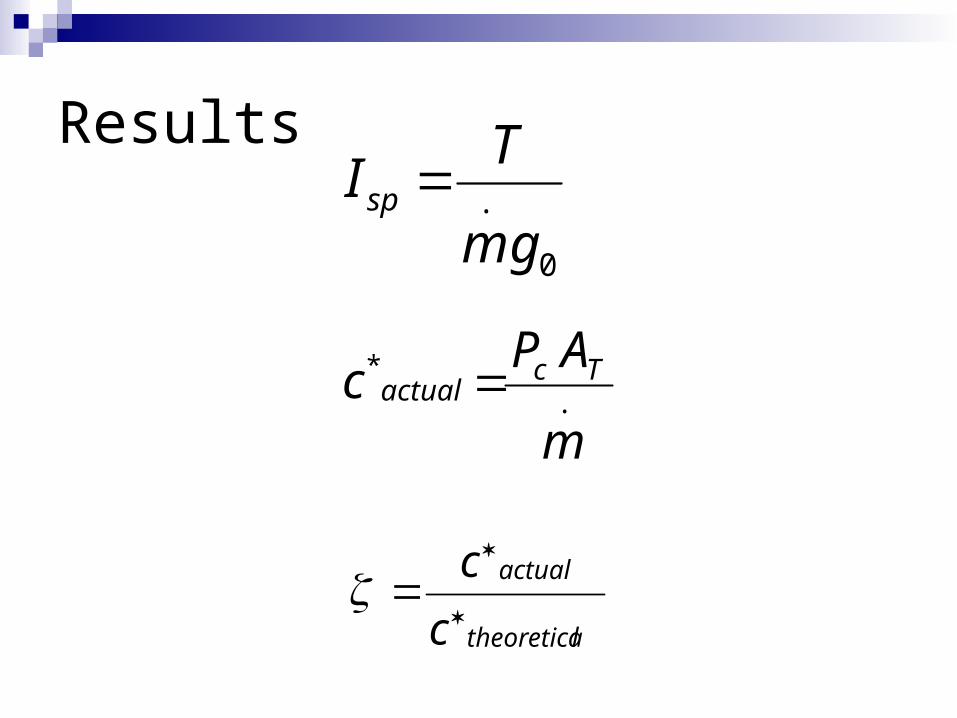
Results
.*
m
APc Tc
actual
0
.
gm
TI sp
ltheoretica
actual
c
c
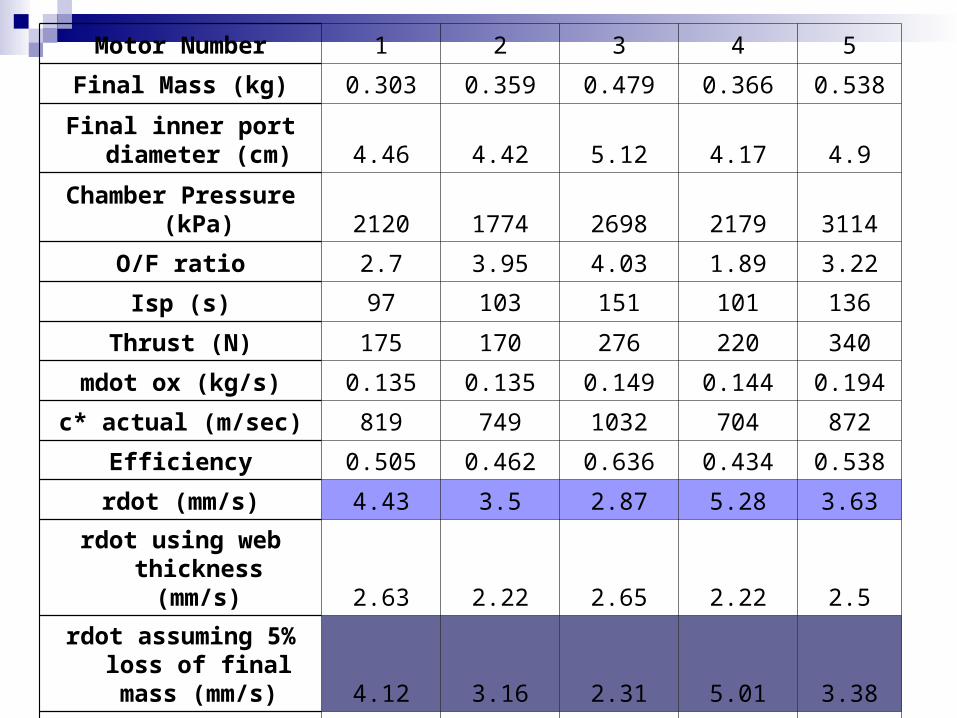
Motor Number 1 2 3 4 5
Final Mass (kg) 0.303 0.359 0.479 0.366 0.538
Final inner port diameter (cm) 4.46 4.42 5.12 4.17 4.9
Chamber Pressure (kPa) 2120 1774 2698 2179 3114
O/F ratio 2.7 3.95 4.03 1.89 3.22
Isp (s) 97 103 151 101 136
Thrust (N) 175 170 276 220 340
mdot ox (kg/s) 0.135 0.135 0.149 0.144 0.194
c* actual (m/sec) 819 749 1032 704 872
Efficiency 0.505 0.462 0.636 0.434 0.538
rdot (mm/s) 4.43 3.5 2.87 5.28 3.63
rdot using web thickness (mm/s) 2.63 2.22 2.65 2.22 2.5
rdot assuming 5% loss of final mass
(mm/s) 4.12 3.16 2.31 5.01 3.38
Gox (kg/m-s^2) 131.19 131.89 111.62 154.31 162.4
Conclusion Similar tests conducted by Stanford
University using gaseous oxygen as the oxidizer achieved regression rates around 2.6 mm/sec for values of 130 kg/m^2-sec. Our regression rate is closer to 3.23 mm/sec for the value of 130 kg/m^2-sec. The hypothesis that paraffin is capable of a high regression rate, especially with hydrogen peroxide, was validated.
Conclusion The main shortcomings were lower than
expected , , and c*.
Difficulty of recovering specimen’s weight after firing as well as calculating web-thickness. Therefore included a 5% loss regression result which is still above expected
spI

Questions?