Embed Size (px)
Citation preview
I D E A SA C T I O N
R E S U LT S
Student Debt and the Federal Budget
H O W S T U D E N T L O A N S I M P A C T T H E U . S . F I S C A L O U T L O O K
November 2021

2
A C K N O W L E D G M E N T SBPC would like to thank the Peter G. Peterson Foundation for its generous support of this project. The authors are grateful to Phillip Oliff of the Pew Charitable Trusts for his feedback, former BPC staff member Kenneth Megan for his advice, and current staff members Jason Fichtner and G. William Hoagland for their strategic input. Kathryn McGinnis, Jillian Harrison, and Douglas Luo, interns at BPC, also made valuable contributions to this paper.
D I S C L A I M E RThe findings and conclusions expressed herein do not necessarily reflect the views or opinions of BPC’s founders, its funders, or its board of directors.
A U T H O R S Sean RuddyProject Associate
Shai AkabasDirector of Economic Policy
Kevin MillerAssociate Director of Higher Education
3
4
5
16
2 6
29
3 5
36
Table of Contents
I NTRO DUC TIO N
TH E FE D E R AL B U DG ETARY I M PAC T S O F AM E R ICA’ S STU D E NT D E BT E X PLO S IO N
K E Y D R IVE R S O F G ROWI N G STU D E NT LOAN D E BT
T H E T R U E C O S T S O F F E D E R A L S T U D E N T D E B T A R E D E B AT E D
POTE NTIAL PO LICY O P TIO N S TO AD D R E S S STU D E NT D E BT G ROW TH
CO N C LU S IO N
E N D N OTE S

4
Introduction
Federal student loan debt in the United States has ballooned since the Great Recession, growing from $642 billion in 2007 to $1.566 trillion in 2020, a 144% increase.i,1 This expansion has outpaced growth in the number of borrowers, which increased by 52% (from 28 million to 43 million) over the same period.2
These figures indicate that students are borrowing more to finance their education. Between 2007 and 2020, the average amount of outstanding federal student loan debt per borrower increased from $22,680 to $36,510 in real terms.3 Students have borrowed more, in part, to compensate for the rising cost of college attendance: Real published tuition and fees at public four-year institutions increased by 42% between the 2006-07 and 2020-21 academic years.4
Many borrowers are also struggling to repay their loans: Prior to the suspension of interest and loan payments in response to the COVID-19 pandemic, nearly one in every five borrowers was in default.5
The precipitous rise of student debt, along with the strained ability of many borrowers to repay, has launched a policy debate over how to provide relief and rein in student borrowing. One component of this issue, however, is often overlooked: What impact does the swelling federal student loan portfolio have on the federal budget?
Current estimates of the fiscal impact are modest, as the portfolio is projected to produce savings for the government under official budgetary scoring. But these projections have consistently underestimated the portfolio’s true costs—often by tens of billions of dollars—and alternative methods show that the portfolio could produce significant costs in the years to come. Additionally, falling repayment rates and the expansion of generous repayment and forgiveness plans suggest that costs to taxpayers may continue to rise. The uncertainty about the portfolio’s true costs hinders policymakers from crafting informed and effective decisions to address the rapid growth of student debt, even though reforms are needed.
This paper presents an in-depth examination of federal student loan debt and the complex challenges that helped spur the ongoing crisis. We conclude with a discussion of several current policy proposals aimed at curbing the unsustainable growth of student debt and improving borrower outcomes.
i These figures are reported in constant 2020 dollars.
5
The Federal Budgetary Impacts of America’s Student Debt Explosion
S U M M A R Y
• Outstanding federal student debt has ballooned in recent years, increasing by 144% since 2007.
• Although much of this debt accumulated in the aftermath of the Great Recession, lackluster repayment outcomes are contributing to further growth, with two-fifths of borrowers making no progress on repayment three years after graduating.
• As debt levels rise and repayment falters, taxpayers shoulder much of the risk, and the federal government stands to lose billions of dollars.
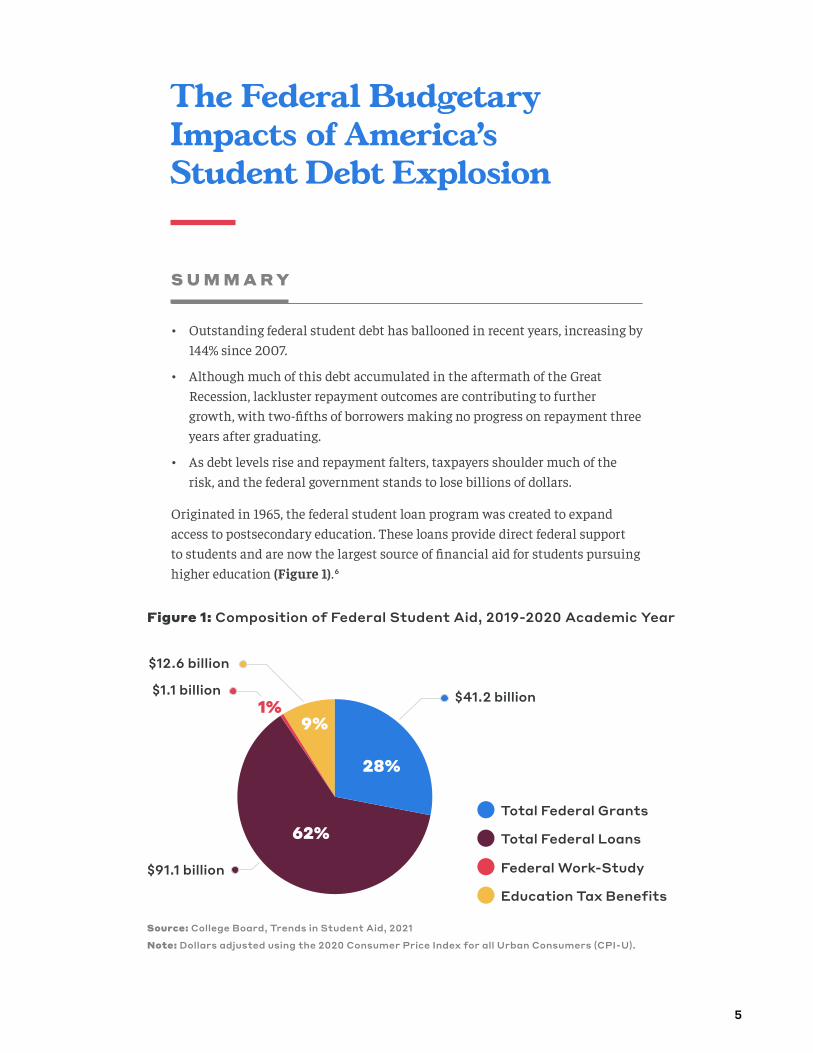
Originated in 1965, the federal student loan program was created to expand access to postsecondary education. These loans provide direct federal support to students and are now the largest source of financial aid for students pursuing higher education (Figure 1).6
Figure 1: Composition of Federal Student Aid, 2019-2020 Academic Year
Source: College Board, Trends in Student Aid, 2021
Note: Dollars adjusted using the 2020 Consumer Price Index for all Urban Consumers (CPI-U).
28%
$41.2 billion
Total Federal Grants
62%
9%
$12.6 billion
$1.1 billion1%
$91.1 billion
Total Federal Loans
Federal Work-Study
Education Tax Benefits

6
The large amount of debt that students are taking on to finance their postsecondary education raises questions about how this borrowing will impact the federal government’s long-term finances. Taxpayers ultimately foot the bill if a borrower defaults on their loans or has them forgiven. Therefore, as the amount of student debt held by the government continues to rise, taxpayer exposure also rises. That exposure is already substantial: The federal student loan portfolio was equivalent to 7.3% of annual U.S. gross domestic product (GDP) at the end of 2020.7 While much of this student debt will be repaid by borrowers under current law, the potential budgetary impact is concerning given the U.S. government’s existing debt burden: federal debt held by the public is already roughly 100% of GDP and is growing unabated.
Federal Student Debt: Putting the Numbers in ContextThis paper cites a variety of figures related to federal student loan debt, including cumulative measures of debt built up over many years and single-year measures of debt. To help put these figures into context, terms commonly used throughout this brief are explained in depth here.
Outstanding Federal Student Loan Debt – The $1.566 trillion in outstanding federal student loan debt, also referred to as the federal student loan portfolio, consists of the total unpaid balances on existing federal student loans and includes both initial loan amounts and accrued interest. Under current law, most of this outstanding balance will be repaid in full, though some will be forgiven or remain uncollected.
Annual Borrowing – Annual borrowing represents the total new student loan amounts disbursed by the federal government for a given academic year; during the 2019-20 academic year, for example, the Department of Education disbursed $91 billion in student loans (in constant 2020 dollars).8 All new federal student loan borrowing occurs through the Federal Direct Student Loan program using funds from the U.S. Treasury.
Cost Estimates of the Federal Student Loan Portfolio – These cost estimates are usually summed over 10 years and represent the government’s expected budgetary gains or losses from the loans issued during that decade. These cost estimates are projections and are subject to change. Cost estimates compare the sums disbursed by the government to expected repayments from borrowers—the latter figure accounts for outstanding balances that will go unpaid, either due to defaults and the borrower’s inability to repay their loan in full or due to loan forgiveness under government relief and repayment programs. The portfolio’s cost estimates differ depending on the accounting methodology used: they range from producing $17 billion in savings to costing $226 billion for the federal government over the next 10 years.ii,9 Cost estimates for the student loan portfolio and potential policy changes throughout the paper use the official budgetary method (FCRA accounting), which produces lower
ii Reported cost estimates exclude re-estimates, modifications, and administrative costs associated with the student loan portfolio.

7
S T U D E N T L O A N D E B T H A S I N C R E A S E D R A P I D LY S I N C E T H E G R E AT R E C E S S I O N
Prior to 2010, the federal government provided most student loans through the Federal Family Education Loan (FFEL) program. Under FFEL, lenders issued loans using private capital, with the federal government agreeing to cover most of private lenders’ losses in the case of default.
During the Great Recession, however, high unemployment caused a spike in college enrollment as people sought to improve their job prospects.11 As a result, applications for federal student aid shot up, increasing by 10% between 2008 and 2009.12 At the same time, credit markets tightened and private lenders feared they would struggle to raise sufficient capital to extend student loans to borrowers. Consequently, the number of FFEL lenders quickly dropped by 65%.13
Striving to improve access to credit, Congress shifted responsibility for issuing federal student loans from private lenders to the federal government through an expansion of the Federal Direct Loan program. As a result, since July 2010, all federal student loans have been directly issued from the government using funds from the U.S. Treasury.iii This ensures that the supply of credit used to originate student loans is not at risk of drying up during recessions in the way that private funds were under the FFEL program.
iii The private sector still originates a relatively small amount of student loans with no financial involvement from the federal government. The ongoing role of the private sector in federal student loans, however, is largely limited to holding some of the legacy FFEL portfolio and the task of loan servicing.
costs, but estimates using the alternative method (fair-value accounting) are reported in accompanying footnotes. (For more information on the difference between these two methodologies, see page 27 of this report.)
Annual Net Cost Re-estimates of the Federal Student Loan Portfolio – These re-estimates of the outstanding portfolio—calculated by the White House’s Office of Management and Budget (OMB)—account for changes to the economic and technical assumptions about future cash flows, such as fluctuations in interest and default rates. Each year, re-estimates are calculated both upward (resulting from changes to assumptions that raise costs) and downward (resulting from changes to assumptions that lower costs), with the net re-estimate being the sum of the two. In fiscal year 2021, the net re-estimate to the federal student loan portfolio was an upward revision of $53 billion, an additional cost to the Department of Education distinct from the previously estimated cost of operating the student loan program.10
8
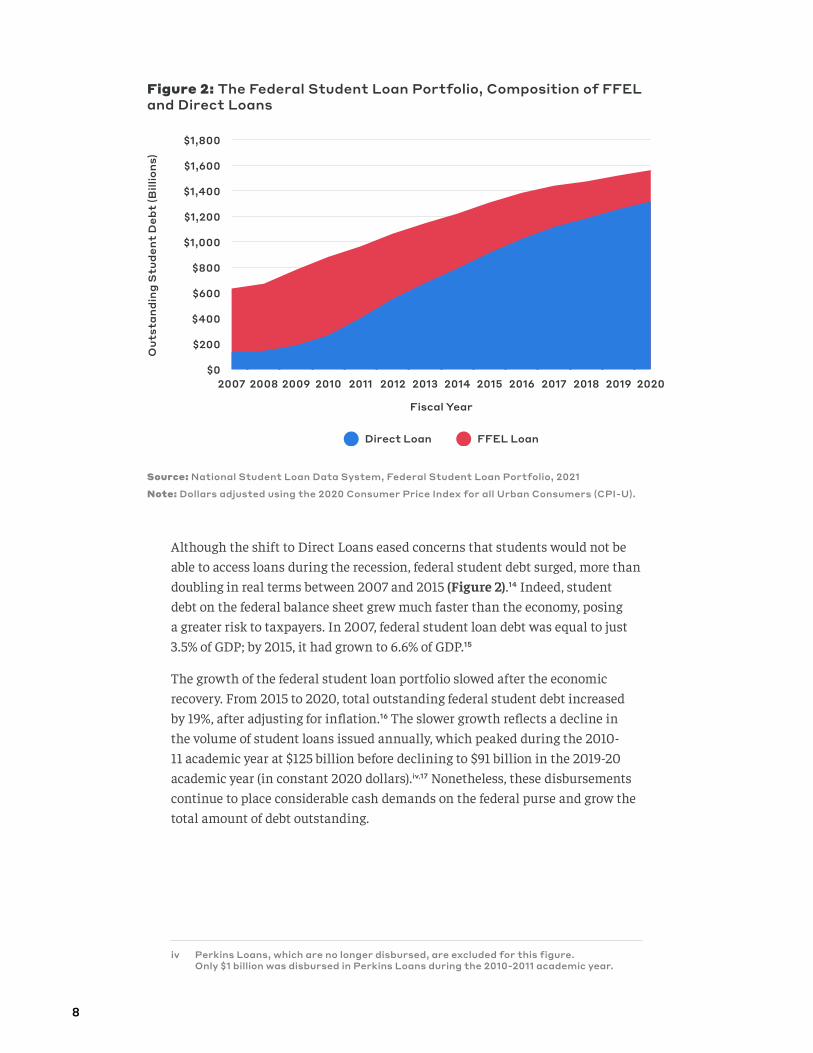
Although the shift to Direct Loans eased concerns that students would not be able to access loans during the recession, federal student debt surged, more than doubling in real terms between 2007 and 2015 (Figure 2).14 Indeed, student debt on the federal balance sheet grew much faster than the economy, posing a greater risk to taxpayers. In 2007, federal student loan debt was equal to just 3.5% of GDP; by 2015, it had grown to 6.6% of GDP.15
The growth of the federal student loan portfolio slowed after the economic recovery. From 2015 to 2020, total outstanding federal student debt increased by 19%, after adjusting for inflation.16 The slower growth reflects a decline in the volume of student loans issued annually, which peaked during the 2010-11 academic year at $125 billion before declining to $91 billion in the 2019-20 academic year (in constant 2020 dollars).iv,17 Nonetheless, these disbursements continue to place considerable cash demands on the federal purse and grow the total amount of debt outstanding.
iv Perkins Loans, which are no longer disbursed, are excluded for this figure. Only $1 billion was disbursed in Perkins Loans during the 2010-2011 academic year.
Figure 2: The Federal Student Loan Portfolio, Composition of FFEL and Direct Loans
Source: National Student Loan Data System, Federal Student Loan Portfolio, 2021
Note: Dollars adjusted using the 2020 Consumer Price Index for all Urban Consumers (CPI-U).
Direct Loan FFEL Loan
Out
stan
ding
Stu
dent
Deb
t (B
illio
ns)
$0
$200
$400
$600
$800
$1,000
$1,200
$1,400
$1,600
$1,800
Fiscal Year
2007 2008 2009 2010 2011 2012 2013 2014 2015 2016 2017 2018 2019 2020

9
Type of Loan Interest Rate Eligibility Criteria
Total Annual Issuance
Dependent Studentsv
Independent Students
Direct Subsidized
3.73%
Undergraduate students with financial need
First year: $3,500
First year: $3,500
Interest is suspended during
enrollment and for a six-month “grace period” after a student
leaves school
Second year: $4,500
Second year: $4,500
Third year and beyond:
$5,500
Third year and beyond:
$5,500
Direct Unsubsidized
Undergraduate: 3.73%
Undergraduate, graduate, and professional
students
First year: $5,500
First year: $9,500
Second year: $6,500
Second year: $10,500
Graduate and Professional:
5.28%
Third year and beyond:
$7,500
Third year and beyond:
$12,500
Graduate yearly limit: $20,500
Total Aggregate Loan Limit (Direct Unsubsidized and Subsidized): $31,000
Undergraduate: $57,000
Graduate: $138,500
Limit includes loans
received for undergraduate
study
Grad PLUS
6.28%
Graduate/professional
students without an adverse credit
history Can borrow up to the cost of attendance minus other
financial aid
Parent PLUS
Parents of dependent
undergraduates without an
adverse credit history
v Direct Subsidized Loans received by a student count toward their annual issuance limits for Direct Unsubsidized Loans, as well, meaning a first-year student receiving $3,500 in Direct Subsidized Loans could only receive $2,000 in Direct Unsubsidized Loans during that award year.
Figure 3: Types of Student Loans Directly Issued by the Federal Government
Source: U.S. Department of Education, Federal Student Aid

10
FFEL v. Direct Lending: Ramifications of the SwitchBy offering new loans solely through direct lending beginning in 2010, the federal government effectively ended the Federal Family Education Loan (FFEL) program and the private sector’s role in originating federal student loans. Advocates for the switch cited greater access, lower costs, and a better student experience. Ten years later, what has been the impact of the switch?
Access – Despite concerns, there is no evidence that borrowers lacked access to FFEL Loans during the 2008 financial crisis. The Department of Education was temporarily authorized to purchase existing FFEL Loans and offer lines of credit to private lenders so that they could continue to issue new loans during the crisis.18 This temporary authorization could have been expanded and continued during future crises to avoid disruptions in access.
Costs – The Congressional Budget Office (CBO) estimated that the switch to direct student lending would yield $61 billion in savings from 2010-19.vi,19
Savings were expected because payments to FFEL lenders exceeded the federal government’s cost of directly administering loans.20 Yet while CBO assumed new Direct Loans would produce 9 cents in savings for every dollar lent, in reality, these loans ended up costing the government 8 cents per dollar on average over the decade.21,22 Although the actual cost of continued FFEL lending is impossible to know, CBO’s ultimately incorrect assumptions call into question whether the switch truly produced savings.vii
Borrower Experience – Under the FFEL program, students who filled out the Free Application for Federal Student Aid (FAFSA) and were deemed eligible for aid then had to contact a private lender to originate the student loan. The conversion to direct lending eliminated this step, reducing the application burden for many borrowers and potentially increasing student loan uptake by roughly 5%.23 Although some argue that loan counseling for Direct Loans, provided by colleges and the Department of Education, is less effective than the counseling provided by private lenders under FFEL, there is limited evidence to support this claim.24
Administrative Flexibility – As direct lender, the government has greater flexibility to provide relief to borrowers than it did under FFEL. Accordingly, the most generous repayment plans and borrower protections are limited to Direct Loan borrowers.25 In fact, the majority of borrowers with FFEL Loans were excluded from the federal government’s pause on student loan repayment during the COVID-19 pandemic.viii,26
vi CBO estimated that the switch to direct lending would require an additional $5 billion in discretionary administrative costs, which are excluded from this cost estimate.
vii The “savings” from the switch to Direct Loans were used to offset the cost of other policies, including the Patient Protection and Affordable Care Act and an expansion of Pell Grants, making it particularly noteworthy that those savings failed to materialize.
viii Borrowers whose FFEL Loans were purchased by the Department of Education during the financial crisis (“federally held FFEL Loans”) were included in the repayment pause.
11
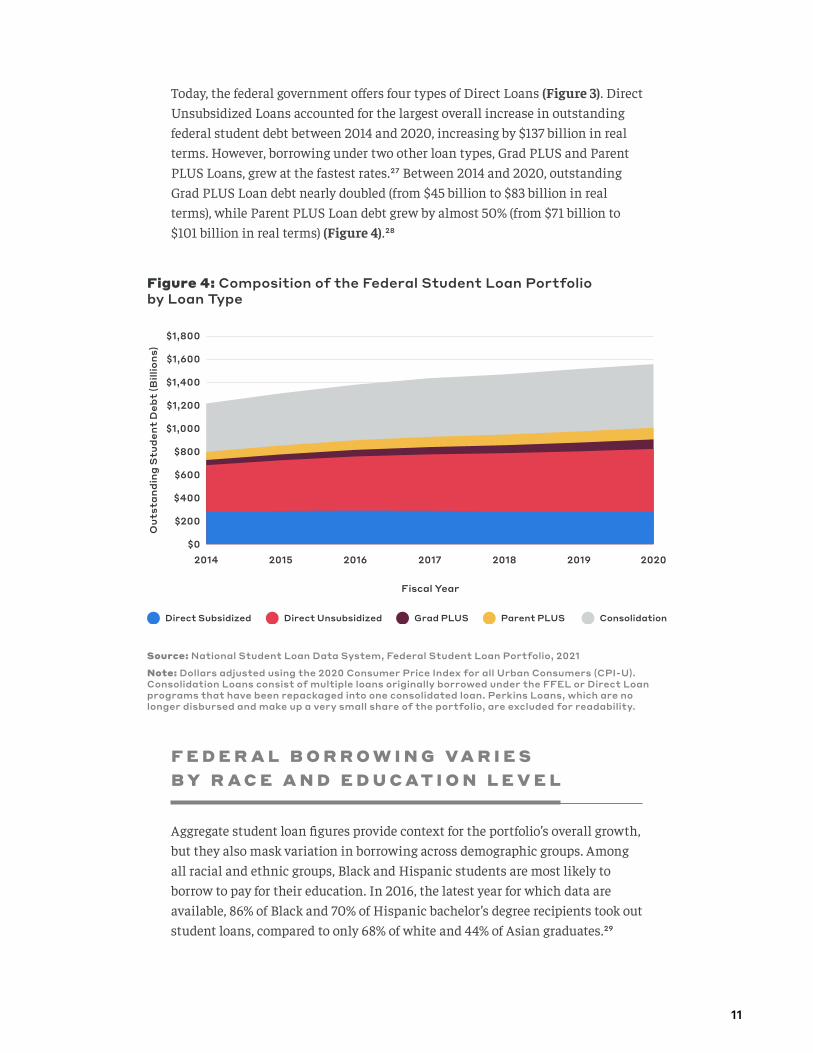
Today, the federal government offers four types of Direct Loans (Figure 3). Direct Unsubsidized Loans accounted for the largest overall increase in outstanding federal student debt between 2014 and 2020, increasing by $137 billion in real terms. However, borrowing under two other loan types, Grad PLUS and Parent PLUS Loans, grew at the fastest rates.27 Between 2014 and 2020, outstanding Grad PLUS Loan debt nearly doubled (from $45 billion to $83 billion in real terms), while Parent PLUS Loan debt grew by almost 50% (from $71 billion to $101 billion in real terms) (Figure 4).28
Figure 4: Composition of the Federal Student Loan Portfolio by Loan Type
Source: National Student Loan Data System, Federal Student Loan Portfolio, 2021
Note: Dollars adjusted using the 2020 Consumer Price Index for all Urban Consumers (CPI-U). Consolidation Loans consist of multiple loans originally borrowed under the FFEL or Direct Loan programs that have been repackaged into one consolidated loan. Perkins Loans, which are no longer disbursed and make up a very small share of the portfolio, are excluded for readability.
Out
stan
ding
Stu
dent
Deb
t (B
illio
ns)
Direct Subsidized Direct Unsubsidized Grad PLUS Parent PLUS Consolidation
Fiscal Year
2014 2015 2016 2017 2018 2019 2020$0
$200
$400
$600
$1,000
$800
$1,200
$1,400
$1,600
$1,800
F E D E R A L B O R R O W I N G V A R I E S B Y R A C E A N D E D U C A T I O N L E V E L
Aggregate student loan figures provide context for the portfolio’s overall growth, but they also mask variation in borrowing across demographic groups. Among all racial and ethnic groups, Black and Hispanic students are most likely to borrow to pay for their education. In 2016, the latest year for which data are available, 86% of Black and 70% of Hispanic bachelor’s degree recipients took out student loans, compared to only 68% of white and 44% of Asian graduates.29

12
Black students not only borrow at a higher rate, but they also rely more heavily on loans to finance their education. For the graduating class of 2016, the average Black bachelor’s degree recipient with student loans borrowed $39,500 compared to $29,900 for white borrowers, $28,220 for Hispanic borrowers, and $26,500 for Asian borrowers.ix,30
Borrowing also differs by degree level. While graduate students are only slightly more likely than undergraduates to take out loans, those who do borrow take on significantly more debt.31,32 In 2016, the average borrower who received a bachelor’s degree borrowed $28,900, compared to $63,700 for a master’s degree and $181,400 for a professional doctorate.x,33
Graduate students take on larger loans because they are ineligible for most federal grant-based aid, such as Pell Grants and Federal Supplemental Educational Opportunity Grants, and because graduate programs tend to cost more. Graduate students can also borrow up to the cost of attendance using Grad PLUS Loans, while undergraduate borrowers face annual and cumulative loan limits.
L A C K L U S T E R R E P AY M E N T R A T E S A M P L I F Y B U D G E T A R Y I S S U E S
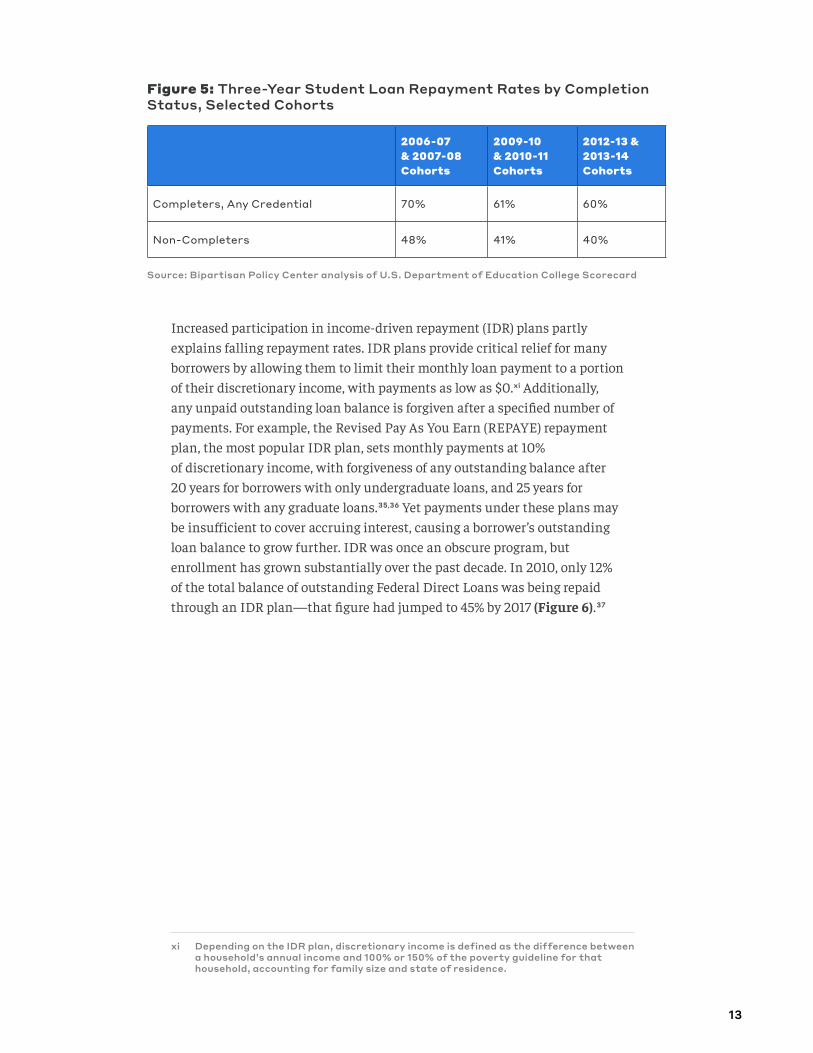
Borrowers only begin repaying their federal student loans six months after leaving an institution, whether by graduating or dropping out. Repayment rates measure the percentage of borrowers who reduce their principal loan balance by at least one dollar over a given period of time. Repayment rates are low and have declined in recent years. The share of graduates that made a principal reduction to their student loans within three years of completing any college credential was 10 percentage points lower for students who completed their education in the 2012-13 and 2013-14 academic years compared to the 2006-07 and 2007-08 academic years (60% vs. 70%). Moreover, repayment rates for non-completers are even lower—about 20 percentage points below their peers who completed a credential (Figure 5).34 Student loan borrowers who drop out lose the wage premium associated with a college credential, likely harming their personal earnings and ability to repay their student loans.
ix All average borrowing amounts exclude Parent PLUS Loans.
x Amounts for graduate degrees are cumulative and include amounts borrowed for undergraduate studies.
13
Figure 5: Three-Year Student Loan Repayment Rates by Completion Status, Selected Cohorts
2006-07 & 2007-08 Cohorts
2009-10 & 2010-11 Cohorts
2012-13 & 2013-14 Cohorts
Completers, Any Credential 70% 61% 60%
Non-Completers 48% 41% 40%
Source: Bipartisan Policy Center analysis of U.S. Department of Education College Scorecard
Increased participation in income-driven repayment (IDR) plans partly explains falling repayment rates. IDR plans provide critical relief for many borrowers by allowing them to limit their monthly loan payment to a portion of their discretionary income, with payments as low as $0.xi Additionally, any unpaid outstanding loan balance is forgiven after a specified number of payments. For example, the Revised Pay As You Earn (REPAYE) repayment plan, the most popular IDR plan, sets monthly payments at 10% of discretionary income, with forgiveness of any outstanding balance after 20 years for borrowers with only undergraduate loans, and 25 years for borrowers with any graduate loans.35,36 Yet payments under these plans may be insufficient to cover accruing interest, causing a borrower’s outstanding loan balance to grow further. IDR was once an obscure program, but enrollment has grown substantially over the past decade. In 2010, only 12% of the total balance of outstanding Federal Direct Loans was being repaid through an IDR plan—that figure had jumped to 45% by 2017 (Figure 6).37
xi Depending on the IDR plan, discretionary income is defined as the difference between a household’s annual income and 100% or 150% of the poverty guideline for that household, accounting for family size and state of residence.

14
Figure 6: Percentage of Direct Loan Portfolio in an Income-Driven Repayment Plan
Source: National Student Loan Data System, Federal Student Loan Portfolio, 2021
Note: The share of outstanding loans and borrowers enrolled in IDR plans reflects those in the Income-Based Repayment (IBR), income-contingent repayment (ICR), Pay As You Earn (PAYE), and Revised Pay As You Earn (REPAYE) plans. The “other” category includes the standard 10-year repayment plan, graduated repayment plans, alternative repayment plans customized to a borrower’s circumstances, and those who are not currently enrolled in a repayment plan.
IDR provides borrowers with affordable payments and prevents defaults among borrowers who are struggling to repay their loans. Borrowers who avoid default can limit adverse effects on their credit and retain their ability to borrow in the future, while the government skirts financial losses associated with defaulted loans—the full value of which it often cannot recover.38
Borrowers who enroll in an IDR plan, however, are still less likely to fully repay their loans than are borrowers in a standard repayment plan. CBO estimates that the government loses about 17 cents for every dollar disbursed in loans that is repaid through an IDR plan. In contrast, the government gains an estimated 13 cents for every dollar disbursed in student loans that are repaid through a standard, fixed-payment plan.xii,39 This difference is partially explained by self-selection into IDR plans: Borrowers who choose to enroll in an IDR plan often do so because they would struggle to afford the monthly payments under a standard repayment plan. Self-selection into IDR means that borrowers who remain on the standard plan generally (on average) have a stronger ability to repay, leading the plan to have lower average governmental costs.
xii These estimates use the methodology directed by the Federal Credit Reform Act of 1990. Under the fair-value accounting method, loans repaid through a fixed-payment plan cost 9 cents per dollar disbursed and those repaid through IDR plans cost 43 cents per dollar disbursed. This important issue is discussed further in later sections.
IDR Other
Outstanding Direct Loan BalancesEnrolled in IDR Plan
Direct Loan Borrowers Enrolledin an IDR Plan
0% 20% 40% 60% 80% 100% 0% 20% 40% 60% 80% 100%
2020
2019
2018
2017
2016
2015
2014
2013
15
H I G H R A T E S O F D E F A U LT A N D D E L I N Q U E N C Y A R E C A U S E F O R C O N C E R N
Defaults and delinquencies are also important for understanding the fiscal impact of the federal student loan portfolio. A loan is considered delinquent on the first day a payment becomes past due; borrowers who are more than 270 days delinquent are considered to be in default. When a borrower defaults, their entire student loan balance becomes due and collection procedures begin.xiii Defaulting on student loans makes borrowers ineligible for future student loans and damages their credit scores.
Before the COVID-19 pandemic, about 11% of the total outstanding federal student loan portfolio was in default and another 6% was more than 30 days delinquent.40 Delinquency rates have declined in recent years as more students enrolled in IDR plans, but defaults were on the rise prior to the beginning of the COVID-19 pandemic, suggesting poorer borrower outcomes overall.41,42 If current trends continue, nearly 40% of federal student loan borrowers who entered college for the first time in 2003 will default on their loans by 2023.43 Although interest and loan repayments were temporarily suspended in response to the pandemic, the lingering economic fallout will likely affect many borrowers’ ability to repay, suggesting delinquency and default rates could rise once again when repayments resume.
L O A N O U T C O M E S D I F F E R A C R O S S D E M O G R A P H I C G R O U P S
Poor student loan repayment outcomes are particularly acute for certain historically disadvantaged demographic groups. These differences have budgetary implications, but perhaps more importantly, they reflect the disproportionate burden that some borrowers confront in repaying their loans.
Facing relatively high debt burdens and poorer labor market outcomes, Black and Hispanic borrowers enroll in IDR plans at higher rates to access relief: 34% of Black and 26% of Hispanic borrowers who earned a bachelor’s degree in 2016 enrolled in an IDR plan within one year of graduating compared to only 21% of
xiii After defaulting, a borrower is generally contacted by a private collection agency (PCA) contracted by the Office of Federal Student Aid. The borrower may be offered the opportunity to rehabilitate their loan or enter into a voluntary repayment agreement. If the borrower accepts neither offer, or fails to honor the agreement, the PCA may seek to collect on the defaulted loan amount through administrative wage garnishment, referring the borrower to the Treasury Offset Program (to garnish tax refunds or other government payments), or recommending litigation. For more information, see the Congressional Research Service report, “Federal Student Loans Made Through the William D. Ford Federal Direct Loan Program: Terms and Conditions for Borrowers,” available at: https://crsreports.congress.gov/product/pdf/R/R45931.
16
white borrowers.44 Partly due to their higher enrollment in IDR plans, Black and Hispanic borrowers also have lower repayment rates. One year after completing their bachelor’s degree, 79% of Black borrowers owed more than they borrowed in student loans compared to 62% of Hispanic borrowers and 55% of white borrowers.45
Delinquency and default rates tell a similar story: 58% of Black and 42% of Hispanic borrowers who completed their bachelor’s degree in 2016 had at least one late loan payment within a year of graduating compared to 38% and 34% of white and Asian borrowers, respectively.46 Twelve years after entering college in 2003, 38% of Black and 21% of Hispanic borrowers had defaulted on their student loans compared to only 12% of white and 6% of Asian borrowers.47 Put another way, Black borrowers were more than three times as likely to default on their student loans as white borrowers.
Key Drivers of Growing Student Loan Debt
S U M M A R Y
• Declining state support for higher education; the rising cost of tuition, fees, room, and board; and the declining relative value of Pell Grants have all contributed to rising out-of-pocket costs and an increased reliance on federal loans.
• Increased access to federal student loans has diminished consumers’ sensitivity to price hikes, allowing institutions to increase tuition prices without facing declines in enrollment.
• Uncapped borrowing and generous repayment options afford certain students unrestrained access to federal credit, creating incentives for greater borrowing and a windfall for wealthy borrowers.
• Weak accountability metrics allow poor-quality institutions to continue receiving federal student aid despite their students’ inability to repay their loans, leaving taxpayers to foot the bill.
The surge in student loan debt and the consequent federal budget exposure have several causes. Rising college costs have outpaced access to grant aid, straining families’ ability to pay for higher education and increasing their reliance on student loans to plug financing gaps. At the same time, federal policies aimed at
17
easing repayment burdens are poorly designed, rewarding additional borrowing and providing a windfall to high-income borrowers with large loan balances. Finally, lackluster and gameable accountability metrics also allow low-quality colleges to be financed by taxpayer dollars without providing students with a strong return on investment.
S T U D E N T S ’ O U T- O F - P O C K E T C O S T S A R E R I S I N G
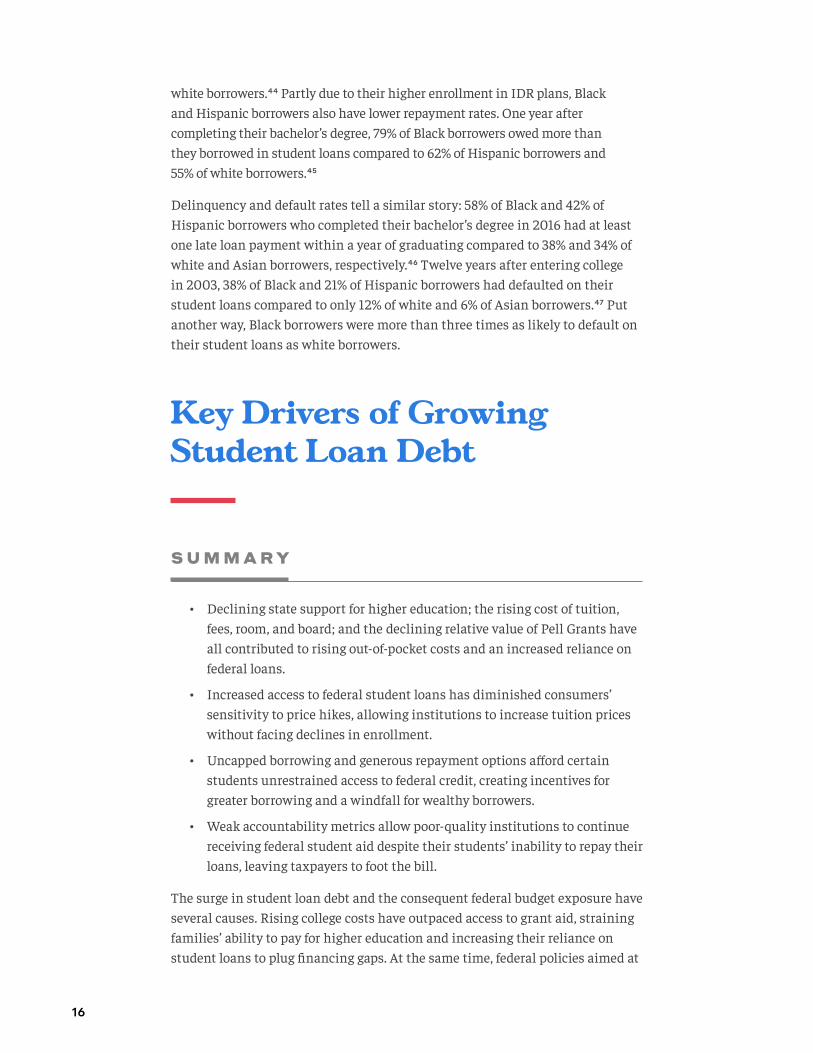
The cost of college attendance has risen substantially over the past four decades, leading many students to finance their education with additional student loans. After accounting for inflation, the cost of tuition, fees, room, and board minus grant aid (net TFRB) increased on average by $2,205 at public and $1,916 at private nonprofit four-year colleges between the 2006-07 and 2020-21 academic years, representing a real increase of 18% and 7%, respectively.xiv,48 Although increases in grant aid were sufficient to cover rising tuition costs—inflation-adjusted net tuition and fees actually decreased by $471 and $876, respectively, at public and nonprofit four-year colleges—the rising cost of nontuition expenses outpaced grant aid. For example, room and board costs increased by $2,677 at public and $2,792 at private nonprofit institutions over the same period, leading to higher net prices.49 While the figures above summarize recent increases in the out-of-pocket cost to attend college, sticker prices at these schools have been rising steadily since the 1980s (Figure 7).
xiv For-profit institutions rarely report room and board expenses. Net prices for the 2020-21 academic year are projected by assuming per-student grant aid amounts are the same as in 2019-20, measured in constant dollars.
Source: College Board, Trends in College Pricing, 2021
Note: Dollars adjusted using the 2020 Consumer Price Index for all Urban Consumers (CPI-U).
Figure 7: Average Published Tuition, Fees, Room, and Board by Sector
71-72
74-75
77-78
80-81
83-84
86-87
89-90
92-93
95-96
98-99
01-02
04-05
07-08
10-11
13-14
16-17
19-2
0$0
$10,000
$20,000
$30,000
$40,000
$50,000
$60,000
Academic Year
Private Nonprofit Four-Year Public Four-Year

18
Declining state support for higher education, the erosion in value of Pell Grants, and a potential feedback loop between access to federal student loan financing and higher college prices have all contributed to the long-term cost trend. Each of these factors is explored in greater depth below.
Declining State SupportState governments have historically been the primary funders of higher education, providing direct support to public colleges and universities through appropriations and offering grant aid to students at both public and private institutions. Over the past few decades, however, state support for higher education has gradually declined as a result of tax cuts, competing priorities, and the impact of recessions on state finances. During fiscal year 2000, states provided an average of $8,817 in funding per full-time equivalent (FTE) student (in constant 2020 dollars). This figure fell to just $7,805 in 2020.xv,50 State support as a fraction of personal income fell even more precipitously: by this metric, state support for higher education has decreased by more than a third since 1980 (Figure 8).51
xv These figures omit state appropriations that go directly to research, agriculture, public health care services, and medical schools. They also exclude any federal stimulus.
Figure 8: State Fiscal Support for Higher Education as a Percentage of Personal Income
Source: State Higher Education Executive Officers Association, State Higher Education Finance: FY 2020, 2021; Bureau of Economic Analysis, 2021
1980 1985 1990 1995 2000 2005 2010 2015 20200.0%
0.2%
0.4%
0.6%
0.8%
Fiscal Year

19
With state support declining, many public colleges and universities have sought additional tuition revenue to fill the gap—effectively passing state budget cuts on to students through tuition hikes.52 Published tuition and fees at public four-year schools more than doubled between the 2000-01 and 2020-21 academic years, rising from an average of $5,276 to $10,572, adjusted for inflation.53 As attendance costs balloon, students are increasingly reliant on debt to finance their degrees.
Recessions compound these funding challenges for institutions. During a recession, declining tax revenues and balanced budget requirements limit states’ ability to fund higher education. At the same time, colleges and universities often see enrollment surge in response to a weak labor market. This can translate to additional tuition revenues, but it also spreads state resources even thinner. Although states often boost funding for higher education after the economy recovers, per-FTE shortfalls from prior budget cuts tend to persist, fueling a long-term decline in state support.
The Great Recession illustrates this trend. States faced a 17% average reduction in yearly tax revenue at the height of the crisis and scrambled to balance their budgets.54 The result was a real 15% reduction in state appropriations for higher education between 2008 and 2012.55 Over the same period, enrollment increased by 12%, leading average per-FTE resources to fall even further: from $8,190 in 2008 to $6,166 in 2012 (in constant 2020 dollars).56 Institutions raised prices to compensate, and as a result, average tuition and fees at public four-year colleges increased 23% between the 2008-09 and 2012-13 academic years, adjusted for inflation.57 State support for higher education rebounded following the Great Recession, but per-FTE funding still has not fully recovered to 2008 levels.58
The Eroding Value of Pell GrantsRising prices have also eroded the value of Pell Grants and other non-loan-based federal student aid, further increasing students’ reliance on debt to finance higher education. Unlike a loan, Pell Grants—available to undergraduate students with financial need—do not need to be repaid. Pell Grant funds can also be used to cover all education expenses, not just tuition and fees. In 1975, the maximum Pell Grant award was sufficient to cover nearly 80% of the average attendance costs at a public four-year college.59 Today, the maximum annual Pell Grant award, which is $6,495, covers only 29% of average costs.60
The declining value of Pell partially explains some of the demographic differences in student borrowing. Students of color are disproportionately harmed by the erosion of Pell Grants: Black and Hispanic students are more likely to receive a Pell Grant than white students.61 As the relative value of Pell Grants has declined, low-income students have relied more heavily on federal student loans.
20
A Cycle of Higher Prices and Increased BorrowingThe federal student loan program has undoubtedly expanded access to higher education, but the increased availability of credit has contributed to a vicious cycle of rising tuition and higher debt loads. Specifically, as federal lending limits have risen to accommodate higher college attendance costs, students have taken on additional debt and become less sensitive to tuition increases. In turn, colleges and universities can charge higher tuition prices without serious declines in enrollment, enabling the cycle to continue.
Research from the Federal Reserve Bank of New York suggests that, after accounting for other factors, published tuition rates at colleges and universities rose by 60 cents for every dollar increase in the annual lending limit for Federal Direct Subsidized Loans.62 Additionally, as much as 55% of the total increase in net tuition prices between 1987 and 2010 may be explained by increased access to federal student aid.63 Other research has found that public institutions specifically raise in-state tuition based on the availability of federal student aid, and that for-profit institutions eligible for federal aid charge 78% more than comparable non-eligible institutions.64,65
It is important to note that many factors affect how universities set tuition—including state funding, macroeconomic conditions, and labor costs. Without consistent data at the level of individual institutions, isolating specific cost drivers is challenging.66,67 Nonetheless, though there are questions about the extent that greater access to student loan financing impacts college pricing, mounting evidence suggests that it does play a role.
U N R E S T R A I N E D P L U S L O A N B O R R O W I N G P R O D U C E S O N E R O U S D E B T
The two types of PLUS Loans—Grad PLUS and Parent PLUS—allow graduate students and the parents of dependent students to access additional federal student loans to help cover the cost of college attendance, further expanding access to higher education for many students. Yet minimal underwriting standards and the lack of annual lending limits for these PLUS Loans has allowed eligible borrowers to access an almost unrestrained flow of federal student loans regardless of their ability to repay.
Lax Underwriting Standards for Parent PLUS LoansParent PLUS Loans have contributed significantly to the rapid rise of student loan debt over the past decade. From 2014 to 2020, the balance of outstanding Parent PLUS Loans grew by 42% (adjusted for inflation), driven by rising prices and the ease with which borrowers can access uncapped credit under the program.68 Currently, borrowers qualify for Parent PLUS Loans so long as they

21
have no adverse credit history, meaning individuals with no credit history or limited ability to repay can qualify for tens of thousands of dollars in federally issued debt. One-fifth of Parent PLUS borrowers and 40% of all Black Parent PLUS borrowers have annual household income below $30,000.69 Even more startling, the average Parent PLUS borrower in the bottom income quartile borrowed nearly as much to help finance a year of college ($10,051) as their average reported annual income ($14,140).70 Additionally, Parent PLUS borrowers are ineligible for some benefits afforded to other federal student loan borrowers, such as IDR and lower interest rates. Like other student loan borrowers, they are usually unable to discharge their loans in bankruptcy and face severe repercussions upon default, after which the government can garnish their wages or Social Security benefits.
Uncapped Lending to Graduate StudentsThe Grad PLUS Loan program is particularly costly to the federal government and may be pushing up tuition prices. Grad PLUS and Parent PLUS Loans have no annual lending limit, allowing graduate students to borrow up to the cost of attendance. Unlike Parent PLUS Loans, Grad PLUS Loans have no basic underwriting requirement, enabling graduate students to borrow large amounts regardless of their ability to repay. These features, together with the longer duration of many graduate programs, explain why debt levels per borrower are higher in the Grad PLUS program than in any other federal student loan program.71 Graduate student lending has increased substantially since Grad PLUS Loans became available in 2006 (Figure 9). During the 2019-20 academic year, the average Grad PLUS borrower took out $26,748 in loans, compared to $17,915 under the Parent PLUS Loan program and $9,113 under the Direct Loan program (in constant 2020 dollars).72
Figure 9: Average Annual Borrowing Among Graduate Students
Source: College Board, Trends in Student Aid, 2021
Note: Y-axis does not begin at $0. Average federal loans are measured in 2020 dollars per-FTE (full-time equivalent) student. These averages are among all graduate students, including those who do not borrow.
2000 2002 2004 2006 2008 2010 2014 2016 2018 2020$10,000
$12,000
$14,000
$16,000
$18,000
$20,000
$22,000
Ave
rage
Fed
eral
Loa
n
Academic Year
Federal PLUS Loans become available for graduate students in 2006

22
In theory, greater borrowing by graduate students should be unobjectionable, as graduate students tend to earn more following graduation. But some expensive graduate programs can fail to produce an increase in earnings, and certain elements of the loan repayment system, such as forgiveness and the standard repayment cap (both discussed below), are unintentionally helping borrowers with high earnings avoid full repayment.
R E P AY M E N T A N D F O R G I V E N E S S P R O G R A M S H A V E B E C O M E M O R E G E N E R O U S
The federal government offers generous loan repayment programs, providing financial relief to struggling borrowers. When combined with uncapped borrowing under the Grad PLUS program, however, several features of IDR plans and the Public Service Loan Forgiveness (PSLF) program disproportionately benefit higher-income borrowers and make the student loan system more regressive.
Forgiveness Under IDRIDR plans eventually forgive a borrower’s outstanding debt, but the costs to the federal government of that forgiveness are substantial, especially for debt accrued at graduate programs. An estimated $40 billion of undergraduate student debt disbursed between 2020 and 2029 and placed into an IDR plan will be forgiven, representing 21% of the total amount of loans disbursed and enrolled in IDR during this period. While startling, these estimates are even worse for graduate students: $167 billion—or more than half (56%)—of graduate student debt disbursed between 2020 and 2029 and placed into an IDR plan will be forgiven.73 As enrollment in IDR plans increases and larger amounts are forgiven, the cost to U.S. taxpayers will grow.
Forgiveness under IDR also disproportionately subsidizes borrowers with the largest outstanding balances. These borrowers are typically graduate students pursuing expensive degrees who are likely to earn high incomes after graduating and who will be able to repay their loans in full. For example, students who earned a professional degree in 2016 had more than six times as much debt as those who earned a bachelor’s degree, yet the former can expect to make $1.7 million more in median earnings over their lifetime.74,75 Moreover, on average, graduate borrowers with loan amounts in the highest quintile can expect to have $118,000 of their student loan debt—or about 53% of the amount received—forgiven through IDR. By comparison, average graduate borrowers in the lowest quintile of debt will have just $700 of their loan debt forgiven—2% of the amount received.76 For all these reasons, it is troubling that graduate borrowers account for more than 80% of the $207 billion in student loans that were issued between 2020 and 2029 and are projected to be forgiven through IDR plans.77
23
Standard Repayment CapAnother feature of some IDR plans, the standard repayment cap, similarly disproportionately benefits high-income borrowers and promotes costly and needless levels of loan forgiveness. Specifically, the cap limits a borrower’s monthly payment under some IDR plans to what their payment would be under a 10-year standard repayment plan. This provision is particularly beneficial for borrowers whose income is low when they enter repayment but whose income then increases, as it caps their monthly payments below what they can afford to repay. For example, a borrower who owes $26,946 in student loans and has an income of $100,000 should be paying about $670 dollars a month under an IDR plan. With the standard repayment cap however, this borrower would instead owe less than $280 in monthly payments, the amount they would owe under the 10-year standard repayment plan.78 In short, the policy enables high-income borrowers to prolong their student loan repayment under IDR plans and receive a higher subsidy from eventual loan forgiveness.
Public Service Loan ForgivenessThe PSLF program is meant to incentivize careers in public service. Such jobs often require a postsecondary degree but offer comparatively lower salaries than the private sector. Under the PSLF program, a borrower who works in government or at a qualifying nonprofit can have their outstanding debt balance forgiven after 10 years of loan payments.xvi Despite noble aims, the program’s current design limits its effectiveness and disproportionately benefits higher-income borrowers.xvii
Unfortunately, PSLF fails to help borrowers when they need it most: at the beginning of their careers when incomes tend to be lowest.79,80 Instead, the program provides relief after 10 years of repayment, which also means that borrowers who start with lower balances are less likely to receive any benefit. Yet low-balance borrowers often need the most assistance; in fact, data show that borrowers with less than $5,000 in student debt are the most likely to default within the first four years of repayment.81 Instead of helping these vulnerable borrowers, the 10-year payment requirement means that the PSLF program mostly benefits borrowers with high loan balances and the ability to make timely payments—who also tend to be higher-income.
xvi Student loan payments made under IDR plans count toward the 10 years of payments required to receive PSLF, as do most payments under the standard repayment plan, but payments under other plans generally do not qualify for PSLF. The Department of Education has created a limited waiver to allow most previously ineligible payments to retroactively qualify for PSLF through October 1, 2022. Loans forgiven through PSLF are not counted as taxable income by the IRS.
xvii It is worth noting that the program to date has entailed administrative barriers that have severely hampered takeup. Only 2% of PSLF applications filed and processed between November 2020 and April 2021 were approved. For more information, see: https://studentaid.gov/data-center/student/loan-forgiveness/pslf-data.

24
Additionally, because borrowers are required to make payments for only 10 years before their remaining balance is forgiven, they have less incentive to limit how much they borrow. Research suggests that PSLF borrowers face no marginal cost for taking on additional debt after reaching a certain threshold—a threshold that is lower than the cost of many professional degrees.82 The increased borrowing encouraged by the structure of PSLF could ultimately lead to larger costs for the government. Indeed, CBO estimates that the program will cost taxpayers $28 billion over the next decade.xviii,83
I N S T I T U T I O N A L A C C O U N T A B I L I T Y I S L A C K I N G
Concerns about the federal student loan program are further heightened by the poor return on investment (ROI) provided by many postsecondary institutions. Too many students who pursue higher education are left with massive amounts of debt but little improvement in their job prospects. Meanwhile, federal resources are allocated to low-quality institutions, even as taxpayers remain on the hook for losses from poor-performing loans.
Under current policy, low-quality institutions can theoretically be stripped of the ability to issue federal student loans, but the two main accountability metrics used by the federal government to determine eligibility or monitor disbursement—cohort default rates and financial responsibility scores—are poorly designed and weakly enforced. As a result, they provide few incentives for institutions to curb student borrowing or improve student outcomes.
Cohort Default RatesCohort default rates (CDR) measure the percentage of borrowers who default within a given number of years after entering repayment. If an institution’s CDR exceeds 40% for a single cohort of borrowers or 30% for three consecutive cohorts, the institution can lose eligibility for federal aid.
Although the CDR metric is meant to calibrate whether a school’s value proposition is so poor that it sends a large share of its students into default, borrowers have an array of options to avoid this outcome—including forbearance, deferment, and IDR enrollment.xix As a result, a large share of
xviii The $28 billion 10-year cost of PSLF reflects a FCRA estimate. PSLF’s 10-year costs are estimated to be $22 billion under the fair-value accounting method. The fair-value costs are lower because loan payments forgone under forgiveness are discounted at a higher rate and therefore have a lower present value under this methodology.
xix Deferment and forbearance allow federal student loan borrowers who are struggling with repayment, continuing their education, or who meet other criteria to temporarily suspend or decrease their monthly payments without entering delinquency or default. Although payments are suspended or decreased, interest typically continues to accrue during periods of deferment or forbearance. For more information, see: https://studentaid.gov/manage-loans/lower-payments/get-temporary-relief.

25
an institution’s borrowers may be failing to make progress on paying down their loans, yet the school can pass the test with flying colors because of CDR’s narrow view. CDR therefore provides an incomplete picture of borrower outcomes and produces minimal institutional accountability. In 2020, just 12 out of several thousand postsecondary institutions were sanctioned because of high default rates.xx,84
Financial Responsibility ScoresThe U.S. Department of Education uses financial responsibility scores to evaluate the financial strength of private and for-profit institutions that receive federal student aid. These scores are meant to reflect a school’s financial health and act as an early warning sign of financial mismanagement or possible school closure. Scores range from -1.0 to 3.0; schools that score below 1.5 are considered financially irresponsible and become subject to additional oversight. For example, they must provide financial assurance to the federal government that they will cover a specified portion of the costs associated with student loan discharges should the school close. Schools with failing scores also become subject to heightened cash monitoring, meaning the disbursement of federal student aid is controlled to limit the government’s exposure in the event of closure.
While financial responsibility scores could act as a strong accountability tool, their efficacy is considerably weakened because they rely on data that are at least two years old. This lag in reporting means warning signs often come too late: A Government Accountability Office (GAO) report found that financial responsibility scores failed to predict half of college closures between 2010 and 2016.85 Without robust and timely monitoring of institutional finances, taxpayers remain exposed to the costly consequences of college closures.
xx Only eight schools were sanctioned because of high default rates in 2021. This decline, however, is partially attributable to the pause on federal student loan payments, which affected the last six months of the three-year period.

26
The True Costs of Federal Student Debt Are Debated
S U M M A R Y
• Frequent and growing upward cost re-estimates of the federal student loan program indicate that its true cost will be greater than anticipated.
• Conflicting accounting methods yield substantially different cost estimates of the federal student loan portfolio.
The federal student loan portfolio clearly has federal budgetary implications, but its true cost is difficult to discern. The government has historically reported a net profit from student lending. Yet frequent upward revisions to cost estimates and conflicting accounting methodologies suggest that the program’s long-term budget impacts are negative and could be much larger than anticipated.
C O N S I S T E N T U P W A R D C O S T R E - E S T I M A T E S S U G G E S T A G R O W I N G P R O B L E M
Each year, the president’s budget proposal for the Department of Education includes re-estimates of the outstanding federal student loan portfolio’s costs. These re-estimates are meant to correct inaccuracies in earlier estimates due to fluctuations in interest rates, prepayment, default rates, IDR enrollment and borrowers’ income, and other repayment factors.xxi Re-estimates in the late 2000s and early 2010s were small and roughly balanced between unanticipated costs and savings. Recent re-estimates, however, have trended consistently in an upward (higher cost) direction, indicating persistent overly optimistic assumptions about the federal student loan program. In the past two years alone, those re-estimates have grown the cost of the outstanding Direct Loan portfolio by $116 billion (Figure 10).86,87
xxi For more information on what factors affect Direct Loan re-estimates, see the GAO report, “Department of Education: Key Aspects of the Federal Direct Loan Program’s Cost Estimates,” GAO-01-197, available at: https://www.gao.gov/products/gao-01-197.

27
Figure 10: Annual Net Re-estimates of the Federal Direct Loan Program’s Budgetary Costs
Source: Department of Education’s Presidential Budget Request, FYs 2008-2022
These startling changes largely reflect incorrect assumptions about the popularity and subsidy rate of IDR plans. Between 2013 and 2016, both the percentage of borrowers and the amount of total outstanding loan debt enrolled in IDR plans doubled.88 In addition to higher enrollment, GAO found that the estimated subsidy cost of IDR plans had increased rapidly. In 2012, the government estimated it lost 11 cents for every dollar of student loan debt disbursed and repaid through an IDR plan; in 2017, just five years later, the figure was more than 26 cents per dollar.89 Greater IDR enrollment and higher subsidy costs likely reflect borrowers seeking relief as they struggle to repay their loans. As a result, the net cost re-estimate for existing Federal Direct Loans turned positive, meaning costs were higher than expected, and they stayed that way nearly every year after 2014. As borrowers struggle to repay their debt and turn to IDR plans for relief, upward re-estimates to the cost of the federal student loan portfolio will likely continue to grow.
D I S P A R A T E A C C O U N T I N G M E T H O D S L E A D T O U N C L E A R C O S T S
CBO currently reports on two different and contrasting accounting methodologies when assessing the budgetary impacts of the federal student loan program. One methodology, which CBO is required to use for its baseline and estimates of legislation, is specified under the Federal Credit Reform Act of 1990 (FCRA), and the other is called “fair-value accounting.”
2008 2009 2010 2011 2012 2013 2014 2015 2016 2017 2018 2019 2020 2021$(20)
$(10)
$-
$10
$20
$30
$40
$50
$60
$70
$80
$0.6 $0.1
$(2.6)
$5.6
Net
Re-
esti
mat
e C
osts
(Bill
ions
)
$6.8
$21.8
$7.7
$(11.5)
$28.4 $26.3
$63.2
$52.8
$(5.7) $(8.2)
Fiscal Year

28
FCRA records the lifetime cost of a loan in the year it was made, with the cost of disbursement offset by the present value of projected repayments on the loan. The applied discount rate is tied to the interest rate on U.S. Treasury bonds, which have been at historic lows over the past few decades. Under fair-value accounting, costs are recorded in the same fashion, but discount rates are tied to the market-value interest rate. This market-value interest rate is essentially the interest rate that a borrower would receive for a comparable loan in private markets.
How Did the Federal Credit Reform Act of 1990 Enable the Switch to Direct Lending?Before FCRA, congressional budgetary rules required that the cost and revenue of credit programs be accounted for on a cash basis. Under cash accounting, expenses are only recorded when money flows into or out of the government. This meant that any federal funds disbursed through a direct government loan were fully recorded as a cost during the origination year, with expected repayments on the loan not showing up until years later (much of it outside the 10-year scoring window). Cash accounting therefore heavily favored guaranteed loan programs, such as FFEL, which used private capital—instead of a large outflow of government funds—to originate loans.90
After the passage of FCRA in 1990, budgetary rules were changed to record federal credit programs on an accrual-accounting basis. Under accrual accounting, the lifelong costs of a federal loan or loan guarantee—including expected future revenue from repayment of the loan—are recorded during the origination year. The switch to accrual accounting not only improved the accuracy of government accounting, it also substantially lowered the budgetary cost of direct lending, leading to the creation of the current Direct Student Loan program in 1994 and the complete transition to direct lending for newly originated loans in 2010.91
Although the resulting difference in discount rates seems small (usually just a few percentage points), it has surprisingly large implications for the projected cost of the student loan program. Excluding cost re-estimates, CBO projects that the federal government’s Direct Student Loan portfolio will yield net savings of $16 billion between 2021 and 2031 under the FCRA methodology.xxii Under the fair-value method, however, the portfolio is projected to have a net cost of $226 billion over the same period.92
xxii It is worth noting that the federal government’s cost of administering the Direct Loan program over the same time period is projected to be $13 billion in mandatory funding plus some portion of the Department of Education’s $23 billion in discretionary administrative funds.
29
The question of which method more accurately estimates the true cost of the federal student loan program is vigorously debated. Advocates of fair-value accounting argue that using Treasury bond rates—which are essentially void of repayment risks—to discount future cash flows underestimates the cost of the program. In their view, a market-value interest rate better reflects the risks associated with the federal student loan portfolio because borrowers may fail to fully repay their loan on schedule, either because they become delinquent, default, or receive forgiveness.93 By contrast, advocates of the FCRA method argue that tying the discount rate to private interest rates overestimates costs, as the government faces lower borrowing costs and can be less averse to loss than private lenders.94 Additionally, those in favor of the FCRA methodology, including GAO, point out that federal student loans are incredibly hard to discharge in bankruptcy, and the federal government has the unique ability to garnish tax refunds and Social Security benefits to collect defaulted balances. This reduces the risk of loss to the federal government.95 Regardless of this debate, however, the large differences between these two accounting approaches create further uncertainty and confusion surrounding the true costs of the loan portfolio, reducing policymakers’ ability to make confident and informed decisions that address the growth in student debt.
Potential Policy Options to Address Student Debt Growth
The federal student loan portfolio and its potential risks to the federal budget will likely continue to grow without substantial policy changes. This section discusses several options for reducing reliance on the federal student loan system and for mitigating taxpayers’ exposure through steps to improve institutional accountability, rein in student lending, better target repayment support, and promote alternatives for financing higher education.
Promote Accountability Through Institutional Risk Sharing
Current federal accountability measures for higher education are weak, allowing schools that do not provide their students with a strong return on investment to retain access to the federal loan program. These institutions lack “skin in the game” and face little incentive to improve their students’ loan outcomes.

30
To promote accountability, institutions that accept federal student loans could be charged a small premium based on the risk their students’ loan debt poses to the federal budget.96 Premiums would be calculated as a percentage of an institution’s outstanding loan balance that has not seen a principal reduction within three years of repayment. This “non-repayment balance” would be calculated as a three-year rolling average to avoid abrupt swings. Protections would be embedded for schools that enroll high numbers of disadvantaged students, since these institutions may justifiably have weaker outcomes because the communities they serve face outsized repayment challenges. Specifically, in this risk-sharing system, the premium for each institution would be adjusted to account for its low-income enrollment and the proportion of resources it allocates to promoting student success, including instruction, career services and counseling, and other wraparound supports.
Implementing a risk premium tied to student outcomes would hold institutions at least partially accountable for poor loan outcomes. It would also create clear incentives to improve performance, including by aligning curricula with job market demands, limiting tuition increases, and directing school resources to activities and services that help vulnerable students.
Broaden the Metrics Used to Evaluate Student Loan Outcomes
Institutional accountability could also be improved by replacing the cohort default rate with a more robust and informative set of metrics that better capture student outcomes. This could include the current CDR, which simply measures the percent of borrowers who default, along with metrics for repayment rates (measuring students’ ability to reduce their principal balance within a given period after entering repayment), degree completion rates, and earnings outcomes among graduates.97 Schools that fail to demonstrate strong outcomes through these metrics would lose access to federal student aid, including loans. Although this change would incentivize institutions to provide students with a strong return on investment, it could penalize schools that serve a higher proportion of students from groups with worse repayment outcomes, such as low-income students and first-generation college students. Thus, any reforms to strengthen accountability metrics should be developed with equity considerations at the forefront.
Expand Pell Grants to Improve Student Outcomes
The rising out-of-pocket costs of college attendance are eroding the relative value of Pell Grants, along with their usefulness as a tool to expand access to higher education. Diminished levels of assistance relative to cost harm the program’s ability to achieve its objectives and translate to worse outcomes among low-income students. Thirty-one percent of students who leave school before graduating cite financial reasons as their main cause for leaving.98

31
The maximum Pell award could be expanded to ensure that its support keeps up with the rising cost of postsecondary education. This would carry upfront costs for taxpayers, but it could be a worthwhile investment, making college more affordable, particularly for vulnerable and historically underrepresented students. Boosting grant aid could also enhance college completion, as research has found that an additional $3,500 in annual grant aid is associated with a 5 percentage point increase in on-time bachelor’s degree attainment among low-income students.99 Completion gains would in turn improve loan repayment outcomes among lower-income students, who disproportionately struggle to repay their loans, partially offsetting the cost of Pell expansion.
Pell eligibility could be adjusted to exclude high-income students to help pay for this expansion.100 Although 73% of Pell Grant recipients have an annual income of $30,000 or less, some higher-income students are eligible because they attend a high-cost institution or because they come from large families.101 Capping access at the fourth income quartile—which consists of students from households with an annual income of roughly $110,000 or more—would prevent these higher-income students, who have myriad other financing options, from accessing Pell Grants while ensuring that low- and moderate-income students receive the assistance they need.xxiii
Eliminate In-School Interest Subsidies on Federal Student Loans
Although commonly used by middle- and low-income students, subsidized Direct Loans are costly and act as a back-end support that provides minimal assistance to students while they pursue their degree. In contrast, need-based grant aid (such as Pell Grants) provides direct support to students during their education and is more effective at promoting retention and attainment compared to loan subsidies.102 ,103,104 To better target aid dollars, in-school interest subsidies on federal student loans could be eliminated, a change estimated to save taxpayers around $19 billion over 10 years.xxiv,105,106
Eliminating these subsidies would result in additional interest accrual for some borrowers, leading to higher debt burdens after graduation, but there is no evidence suggesting it would reduce access or degree completion. In fact, enrollment and degree completion among graduate students saw little change after they lost eligibility for in-school interest subsidies in 2012.107,108
Nevertheless, an elimination of subsidized loans would make more sense if paired with an equivalent increase in grant aid or other supports targeting low- and middle-income students—such as the Pell expansion described above.
xxiii For more information on the fourth income quartile, see: http://www.pellinstitute.org/downloads/publications-Indicators_of_Higher_Education_Equity_in_the_US_2016_Historical_Trend_Report.pdf.
xxiv Under the fair-value method, eliminating subsidized loans would yield $15 billion in savings over 10 years.
32
Eliminate the Standard Repayment Cap to Avoid Unnecessary Taxpayer Costs
IDR plans are meant to provide relief for struggling borrowers through lower monthly payments, but the standard repayment cap disproportionately benefits borrowers with the highest loan balances. These are also the borrowers who tend to have the highest incomes.
To eliminate these poorly targeted subsidies, policymakers could repeal the standard repayment cap. Doing so would make IDR plans less regressive by ensuring that all borrowers pay an equal proportion of their discretionary income.109 This reform would also help prevent high-income borrowers from receiving unnecessary forgiveness, reducing costs to taxpayers. CBO recently estimated that eliminating the standard repayment cap would save U.S. taxpayers $10 billion over 10 years.xxv,110
Facilitate Automatic Enrollment in a Simplified and More Progressive IDR Plan
Under the current repayment system, borrowers must navigate a confusing maze of bureaucracy to access relief through an IDR plan. They not only have to decide between four plans, all with different monthly payment formulas and eligibility requirements, but borrowers must also reapply annually by submitting their tax information. To avoid this obligation and confusion, borrowers could be automatically enrolled into a single streamlined IDR plan. Automatic enrollment could be facilitated through data sharing between the IRS and Department of Education, removing the need for borrowers to submit tax information.
Although automatic enrollment would likely increase the budgetary costs of the student loan portfolio—as the subsidy rate under IDR plans is higher than under traditional repayment—it would do so by less than alternatives like broad-based loan forgiveness. Importantly, automatic enrollment in IDR would dramatically reduce defaults and increase the progressivity of the student loan system. Among borrowers who entered repayment between fiscal years 2010 and 2014, less than 1% of those enrolled in two of the most-used IDR plans (Income-Based Repayment and Pay As You Earn) defaulted compared to 14% of borrowers enrolled in the standard repayment plan.111 Additionally, research found that if all borrowers were enrolled in IDR, households (including nonborrowers) in the bottom 10% of earners would receive almost six times as much benefit from eventual IDR forgiveness compared to those in the top 10% of earners.112 The IDR system could be made even more progressive and less expensive to the government if repayment formulas were adjusted to require high-income borrowers to repay their loans more quickly, which in combination with eliminating the standard repayment cap would reduce their likelihood of receiving forgiveness on loans they can afford to repay.
xxv Under the fair-value method, eliminating the standard repayment cap would similarly yield approximately $10 billion in savings over 10 years.

33
Better Target Support for Public Service Borrowers
While well-intentioned, PSLF is poorly designed and regressive in its relief. It also incentivizes excessive borrowing that is ultimately paid for with taxpayer dollars. Rather than offering blanket forgiveness after 10 years, PSLF could be turned into a flat monthly benefit of $300 for up to five years.113 This would ensure that all borrowers receive the same subsidy for public service regardless of their income and debt levels. A defined benefit would also provide support to borrowers at the beginning of their careers, when they need it most.
Currently, the vast majority (98%) of applications for PSLF forgiveness are rejected.114 This high rejection rate occurs because of a lack of clarity regarding which nonprofit jobs and types of loans qualify for the program.115 Data sharing between the Department of Education and the IRS could alleviate this confusion by identifying borrowers who work at an eligible organization. The Department of Education recently announced significant changes to streamline the PSLF process, such as automatically counting student loan payments made by military service members and other federal employees as qualifying payments, but further steps could be taken to help a broader population of borrowers.116
Explore Annual Loan Limits for Grad PLUS Loans
With borrowing allowed up to the cost of attendance, graduate students are a primary driver of student loan growth in recent years. Implementing an annual loan limit for the Grad PLUS program, akin to other programs, would likely yield budgetary savings and curb graduate students’ reliance on debt.
A cap on graduate borrowing would also address concerns about a feedback loop between easy access to credit and rising graduate school prices. Even though many advanced degrees are inherently expensive to provide because they require intensive in-person and hands-on training (e.g., clinical rotations for medical school), capping Grad PLUS borrowing could promote price discipline among programs. On the other hand, a cap could adversely impact access and equity, particularly for low-income students and students of color, who disproportionately rely on Grad PLUS Loans to finance their graduate education.
To better understand these trade-offs, further research is needed. Any analysis should specifically examine the effect of different cap levels on low-income borrowers and other student sub-groups; it should also explore the idea of setting different loan limits for different types of graduate programs depending on a program’s cost and expected ROI.117
34
Apply Underwriting Standards to Parent PLUS Loans
To address the precipitous rise of Parent PLUS Loans and the concern that roughly one-fifth of Parent PLUS borrowers will be unable to repay these loans, policymakers could implement underwriting standards similar to those applied by private-sector lenders.118 Stronger eligibility requirements would prevent many families from suffering the grave consequences of a loan default and limit the federal government’s exposure to poor loan outcomes.
This change would unquestionably improve the quality of Parent PLUS Loans, but it could also limit access to credit for low-income families. To address this concern, dependent students whose families are unable to qualify for Parent PLUS Loans could be allowed to qualify for the higher loan limits available to independent students in the Direct Loan program.
Explore Alternative Financing Systems
Students have used debt financing to access higher education since the creation of the federal student loan program more than 50 years ago, but loans may not be the best way to finance a college degree. Most students lack certainty about their earnings after graduation, making it challenging to determine how much to borrow. Additionally, for any miscalculations, students may face the steep consequence of defaulting. Likewise, taxpayers are not well-served by the current system, as they are left with the bill if students cannot repay. Alternative financing mechanisms could improve access to higher education while better protecting taxpayers from risk.
Income share agreements (ISAs), for example, allow investors to finance a student’s education in return for a share of the student’s future income stream for a certain number of years after leaving school. Repayment terms, including the percentage of income shared and the duration of the agreement, can differ by degree field and the amount of financing received. For example, a student who pursues a degree with a lower average starting salary or who receives a larger amount of financing support could expect to pay a larger share of future income for a longer time under an ISA.
Compared to traditional debt financing, ISAs present different benefits and drawbacks for students and investors. For students, ISAs eliminate the risk of default and reduce uncertainty about their future ability to repay. Students who are unable to secure high-income employment after graduation will make minimal payments without interest accruing. By contrast, students with higher earnings after graduation will likely pay more under an ISA than they would with traditional student loans. ISAs also offer these students a safety net: If their income falls, they would see a commensurate reduction in their monthly ISA payment.119
Investors assume greater risk for losses under ISAs, but they can also realize higher returns if students have high earnings post-graduation. By contrast, the return on a traditional student loan is the same regardless of the borrower’s

35
later income—as long as the loan is repaid. While investors stand to lose under both an ISA and a traditional loan if a student later has low earnings or defaults, an issuer of a traditional student loan has greater recourse to recoup their initial investment.120
Several other potential issues exist with ISAs. Students who expect higher earnings may opt for traditional student loans instead of an ISA or may take greater risks since they are not responsible for the full gains (or losses) of their actions, inhibiting profitability and making ISAs unsustainable for private-sector investors. There are also concerns that investors could impose more onerous terms on students whom they view as having poor labor market prospects—or even reject such students outright, thereby limiting some groups’ access to credit. Finally, the current lack of a legal framework for ISAs creates the potential for consumer fraud or abuse while also increasing uncertainty for well-intentioned investors.121
A regulated pilot program could be helpful in exploring the potential advantages and disadvantages of the ISA concept. Several ISA programs currently being offered by higher education institutions, such as Purdue University’s “Back a Boiler” program, could offer a baseline model.122 Specific goals of a pilot could include examining students’ experiences and satisfaction with ISAs, and understanding any disparities in use or uptake across student subgroups. A pilot should also be designed to explore the potential for adverse borrower behavior that might prevent ISA programs from generating sufficient investor returns to be sustainable.
Conclusion
America’s higher education financing system faces an array of challenges. With more than $1.5 trillion of student debt on the federal balance sheet, rising loan balances and low repayment rates could impose significant strains on the federal budget. The long-term costs of the system remain unclear due to a combination of uncertainty and ambiguities associated with budget forecasting methods.
It is already clear, however, that the student loan system is proving costlier than anticipated. If current trends continue, U.S. taxpayers could be forced to foot the bill for hundreds of billions of dollars in unanticipated costs while poor-performing colleges remain largely off the hook for their students’ lackluster loan outcomes. The policy options discussed in this paper are by no means a panacea for the mounting problems created by skyrocketing higher education prices and poor student outcomes, but they could improve the efficiency and effectiveness of a system that is in urgent need of reform.

36
Endnotes
1 BPC staff calculation of U.S. Department of Education, “Federal Student Loan Portfolio,” Federal Student Loan Portfolio Summary, 2021. Available at: https://studentaid.gov/data-center/student/portfolio.
2 Ibid.
3 Ibid.
4 BPC staff calculation of College Board, “Trends in College Pricing 2021,” Trends in College Pricing and Student Aid, Table CP-2, 2021. Available at: https://research.collegeboard.org/trends/college-pricing.
5 BPC staff calculation of U.S. Department of Education, “Portfolio by Delinquency Status,” Federal Student Loan Portfolio Summary, 2020. Available at: https://studentaid.gov/data-center/student/portfolio.
6 Congressional Research Service, “Federal Student Loans Made Through the William D. Ford Federal Direct Loan Program: Terms and Conditions for Borrowers,” September 24, 2019. Available at: https://sgp.fas.org/crs/misc/R45931.pdf.
7 BPC staff calculation of the Federal Reserve Economic Data, “Gross Domestic Product (GDP),” updated Sep. 30, 2021. Available at: https://fred.stlouisfed.org/series/GDP.
8 BPC staff calculation of College Board, “Trends in Student Aid 2021,” Trends in College Pricing and Student Aid, Table 6, 2021. Available at: https://research.collegeboard.org/trends/student-aid.
9 Congressional Budget Office, “Federal Student Loan Programs—CBO’s July 2021 Baseline,” Table 1 and 6, 2021. Available at: https://www.cbo.gov/system/files/2021-07/51310-2021-07-studentloan.pdf.
10 U.S. Department of Education, “Fiscal Year 2022 Budget Summary,” May 28, 2021. Available at: https://www2.ed.gov/about/overview/budget/budget22/summary/22summary.pdf.
11 J. Barshay, “How the last recession affected higher education. Will history repeat?,” The Hechinger Report, 2020. Available at: https://hechingerreport.org/how-the-2008-great-recession-affected-higher-education-will-history-repeat/.
12 R. Bhaskar and Y. Gopalan, Federal Reserve Bank of St. Louis, The Rising Cost of College: Student Loans Harder to Find in Tight Credit Marker, 2009. Available at: https://www.stlouisfed.org/publications/bridges/spring-2009/the-rising-cost-of-college-student-loans-harder-to-find-in-tight-credit-market.
13 Ibid.
14 BPC staff calculation of U.S. Department of Education, “Federal Student Loan Portfolio,” Federal Student Loan Portfolio Summary, 2021. Available at: https://studentaid.gov/data-center/student/portfolio.

37
15 BPC staff calculation of the Federal Reserve Economic Data, “Gross Domestic Product (GDP),” updated Sept. 30, 2021. Available at: https://fred.stlouisfed.org/series/GDP.
16 BPC staff calculation of U.S. Department of Education, “Federal Student Loan Portfolio,” Federal Student Loan Portfolio Summary, 2021. Available at: https://studentaid.gov/data-center/student/portfolio.
17 BPC staff calculation of College Board, “Trends in Student Aid 2021,” Trends in College Pricing and Student Aid, Table 6, 2021. Available at: https://research.collegeboard.org/trends/student-aid.
18 Congressional Research Service, “The Ensuring Continued Access to Student Loans Act of 2008,” April 15,2008-January 28, 2009. Available at: https://www.everycrsreport.com/reports/RL34452.html.
19 Congressional Budget Office, “Manager’s Amendment to Reconciliation Proposal,” March 20, 2010. Available at: https://www.cbo.gov/sites/default/files/111th-congress-2009-2010/costestimate/amendreconprop.pdf.
20 D. Lucas and D. Moore, Guaranteed Versus Direct Lending: The Case of Student Loans, CBO Working Paper Series, 2007. Available at: https://www.cbo.gov/sites/default/files/110th-congress-2007-2008/workingpaper/2007_09_studentloans_0.pdf.
21 Congressional Budget Office, “Costs and Policy Options for Federal Student Loan Programs,” March 20, 2010. Available at: https://www.cbo.gov/sites/default/files/111th-congress-2009-2010/reports/03-25-studentloans.pdf.
22 BPC staff calculation of Office of Management and Budget, “Credit Supplement: Budget of the U.S. Government Fiscal Year 2022,” 2022. Available at: https://www.whitehouse.gov/wp-content/uploads/2021/05/cr_supp_fy22.pdf.
23 C. Gibbs, Changing the Cost of Federal Student Loan Take-up: Evidence from the FFEL To Direct Loan Program Transition, University of Wisconsin-Madison, 2015. Available at: https://www.semanticscholar.org/paper/Changing-the-Cost-of-Federal-Student-Loan-Take-up-%3A-Gibbs/0d989ecd11f1d680cd9c1b30e51e409a79ec5fd6#paper-header.
24 U.S. Government Publishing Office, “Government-Run Student Loans: Ensuring the Direct Loan Program Is Accountable to Students and Taxpayers,” Hearing before the Subcommittee on Higher Education and Workforce Training, October 25, 2011. Available at: https://www.govinfo.gov/content/pkg/CHRG-112hhrg70771/html/CHRG-112hhrg70771.htm.
25 A. Minsky, “Is Your Student Loan A FFEL Loan? That May Matter for Student Loan Forgiveness,” Forbes, February 15, 2021. Available at: https://www.forbes.com/sites/adamminsky/2021/02/15/is-your-student-loan-a-ffel-loan-that-may-matter-for-student-loan-forgiveness/?sh=3ed10db173c4.
26 U.S. Department of Education, “COVID-19 Loan Payment Pause and 0% Interest,” Announcements and Events, 2021. Available at: https://studentaid.gov/announcements-events/covid-19/payment-pause-zero-interest.
27 BPC staff calculation of U.S. Department of Education, “Federal Student Aid Portfolio by Loan Type,” Federal Student Loan Portfolio Summary, 2021. Available at: https://studentaid.gov/data-center/student/portfolio.

38
28 Ibid.
29 National Center for Education Statistics, “Fast Facts,” 2020. Available at: https://nces.ed.gov/fastfacts/display.asp?id=900.
30 Ibid.
31 National Center for Education Statistics, “National Postsecondary Student Aid Study: 2016 Undergraduates,” 2016. Available at: https://nces.ed.gov/datalab/index.aspx.
32 National Center for Education Statistics, “National Postsecondary Student Aid Study: 2016 Graduates,” 2016. Available at: https://nces.ed.gov/datalab/index.aspx.
33 Congressional Research Service, “A Snapshot of Federal Student Loan Debt,” February 4, 2019. Available at: https://crsreports.congress.gov/product/pdf/IF/IF10158.
34 U.S. Department of Education, “College Scorecard,” 2021. Available at: https://collegescorecard.ed.gov/data/.
35 U.S. Department of Education, “Portfolio by Repayment Plan,” Federal Student Loan Portfolio Summary, 2021. Available at: https://studentaid.gov/data-center/student/portfolio.
36 U.S. Department of Education, “Income-Driven Repayment Plans,” Manage Loans, 2021. Available at: https://studentaid.gov/manage-loans/repayment/plans/income-driven.
37 Congressional Budget Office, “Income-Driven Repayment Plans for Student Loans: Budgetary Costs and Policy Options,” 2020. Available at: https://www.cbo.gov/system/files/2020-02/55968-CBO-IDRP.pdf.
38 U.S. Department of Education, “Student Loans Overview: Fiscal Year 2022 Budget Proposal,” https://www2.ed.gov/about/overview/budget/budget22/justifications/r-sloverview.pdf.
39 Congressional Budget Office, “Income-Driven Repayment Plans for Student Loans: Budgetary Costs and Policy Options,” 2021. Available at: https://www.cbo.gov/system/files/2020-02/55968-CBO-IDRP.pdf.
40 U.S. Department of Education, “Federal Student Loan Portfolio Summary,” Federal Student Loan Portfolio Summary, 2021. Available at: https://studentaid.gov/data-center/student/portfolio.
41 U.S. Department of Education, “Portfolio by Delinquency Status,” Federal Student Loan Portfolio Summary, 2021. Available at: https://studentaid.gov/data-center/student/portfolio.
42 U.S. Department of Education, “Portfolio by Loan Status,” Federal Student Loan Portfolio Summary, 2021. Available at: https://studentaid.gov/data-center/student/portfolio.
43 J. Scott-Clayton, “The looming student loan default crisis is worse than we thought,” January 11, 2018. Available at: https://www.brookings.edu/research/the-looming-student-loan-default-crisis-is-worse-than-we-thought/.
44 National Center for Education Statistics, “Baccalaureate and Beyond 2016/2017,” 2017. Available at: https://nces.ed.gov/datalab/index.aspx.

39
45 Ibid.
46 Ibid.
47 The Institute for College Access and Success, Students at Greatest Risk of Loan Default, April 2018. Available at: https://ticas.org/wp-content/uploads/legacy-files/pub_files/students_at_the_greatest_risk_of_default.pdf.
48 BPC staff calculation of College Board, “Trends in College Pricing 2021,” Trends in College Pricing and Student Aid, Figures CP-9 and CP-10, 2021. Available at: https://research.collegeboard.org/trends/college-pricing.
49 Ibid.
50 BPC staff calculation of State Higher Education Finance Executive Officers Association, State Higher Education Finance: FY 2020, 2021. Available at: https://shef.sheeo.org.
51 Ibid.
52 M. Aborn and S. Akabas, “A Moderate Alternative to Free College,” Bipartisan Policy Center, 2021. Available at: https://bipartisanpolicy.org/explainer/a-moderate-alternative-to-free-college/.
53 College Board, “Trends in College Pricing 2021,” Trends in College Pricing and Student Aid, Table CP-2, 2021. Available at: https://research.collegeboard.org/trends/college-pricing.
54 T. Gordon, “State and Local Budgets and the Great Recession,” December 31, 2012. Available at: https://www.brookings.edu/articles/state-and-local-budgets-and-the-great-recession/.
55 BPC staff calculation of State Higher Education Finance Executive Officers Association, State Higher Education Finance: FY 2020, 2021. Available at: https://shef.sheeo.org.
56 Ibid.
57 BPC staff calculation of College Board, “Trends in College Pricing 2021,” Trends in College Pricing and Student Aid, Table CP-2, 2021. Available at: https://research.collegeboard.org/trends/college-pricing.
58 BPC staff calculation of State Higher Education Finance Executive Officers Association, State Higher Education Finance: FY 2020, 2021. Available at: https://shef.sheeo.org.
59 S. Protopsaltis and S. Parrott, “Pell Grants — a Key Tool for Expanding College Access and Economic Opportunity — Need Strengthening, Not Cuts,” July 27, 2017. Available at: https://www.cbpp.org/research/federal-budget/pell-grants-a-key-tool-for-expanding-college-access-and-economic.
60 BPC staff calculation of College Board, “Trends in College Pricing 2021,” Trends in College Pricing and Student Aid, Table CP-2, 2021. Available at: https://research.collegeboard.org/trends/college-pricing.
61 National Center for Education Statistics, “National Postsecondary Student Aid Study: 2016 Undergraduates,” 2016. Available at: https://nces.ed.gov/datalab/index.aspx.

40
62 D. Lucca, T. Nadauld, and K. Shen, Credit Supply and the Rise in College Tuition: Evidence from the Expansion in Federal Student Aid Programs, Federal Reserve Bank of New York, 2017. Available at: https://www.newyorkfed.org/medialibrary/media/research/staff_reports/sr733.pdf.
63 G. Gordon and A. Hedlund, Accounting for Tuition Increases across U.S. Colleges, University of Missouri, 2020. Available at: https://papers.ssrn.com/sol3/papers.cfm?abstract_id=3720860.
64 M. Rizzo, R. Ehrenberg, “Resident and Nonresident Tuition and Enrollment at Flagship State Universities,” National Bureau of Economic Research Conference Report, 2004. Available at: http://www.nber.org/chapters/c10103.pdf.
65 S. Riegg Cellini and C. Goldin, Does Federal Student Aid Raise Tuition? New Evidence on For-Profit Colleges, National Bureau of Economic Research, 2012. Available at: http://www.nber.org/papers/w17827.pdf.
66 Government Accountability Office, “Impact of Loan Limit Increases on College Prices Is Difficult to Discern,” 2014. Available at: https://www.gao.gov/assets/gao-14-7.pdf.
67 American Council on Education, Does Federal Financial Aid Drive Up College Prices?” 2013. Available at: https://www.acenet.edu/Documents/Heller-Monograph.pdf.
68 BPC staff calculation of U.S. Department of Education, “Federal Student Loan Portfolio by Loan Type,” Federal Student Loan Portfolio Summary, 2021. Available at: https://studentaid.gov/data-center/student/portfolio.
69 National Center for Education Statistics, “National Postsecondary Student Aid Study: 2016 Undergraduates,” 2016. Available at: https://nces.ed.gov/datalab/index.aspx.
70 Ibid.
71 U.S. Department of Education, “Federal Student Loan Portfolio Summary,” Federal Student Loan Portfolio Summary, 2021. Available at: https://studentaid.gov/data-center/student/portfolio.
72 BPC staff calculation of College Board, “Trends in Student Aid 2021,” Trends in College Pricing and Student Aid, Table 6, 2021. Available at: https://research.collegeboard.org/trends/student-aid.
73 Congressional Budget Office, “Income-Driven Repayment Plans for Student Loans: Budgetary Costs and Policy Options,” 2020. Available at: https://www.cbo.gov/system/files/2020-02/55968-CBO-IDRP.pdf.
74 Congressional Research Service, “A Snapshot of Federal Student Loan Debt,” February 4, 2019. Available at: https://crsreports.congress.gov/product/pdf/IF/IF10158.
75 A. Carnevale, S. Rose, and B. Cheah, The College Payoff: Education, Occupations, Lifetime Earnings, The Georgetown University Center on Education and the Workforce, 2011. Available at: https://1gyhoq479ufd3yna29x7ubjn-wpengine.netdna-ssl.com/wp-content/uploads/collegepayoff-completed.pdf.
76 Congressional Budget Office, “Income-Driven Repayment Plans for Student Loans: Budgetary Costs Policy Options,” February 2020. Available at: https://www.cbo.gov/publication/56277.

41
77 Ibid.
78 BPC staff calculation of U.S. Department of Education, “Loan Simulator,” Federal Student Aid, 2021. Available at https://studentaid.gov/loan-simulator/.
79 National Association of Colleges and Employers, First Destinations for the College Class of 2018, 2019. Available at: https://www.naceweb.org/job-market/graduate-outcomes/first-destination/class-of-2018/.
80 R. Kelchen, “The relationship between student debt and earnings,” The Brookings Institutions, September 23, 2016. Available at: https://www.brookings.edu/blog/brown-center-chalkboard/2016/09/23/the-relationship-between-student-debt-and-earnings/.
81 K. Blagg, “Underwater on Student Debt: Understanding Consumer Credit and Student Loan Default,” Urban Institute, August 2018. Available at: https://www.urban.org/sites/default/files/publication/98884/underwater_on_student_debt_0.pdf.
82 J. Delisle and A. Holt, “Zero Marginal Cost: Measuring Subsidies for Graduate Education in the Public Service Loan Forgiveness Program,” New America Foundation, 2014. Available at: https://na-production.s3.amazonaws.com/documents/zero-marginal-cost.pdf.
83 Congressional Budget Office, “Reduce or Eliminate Public Service Loan Forgiveness,” December, 2020. Available at: https://www.cbo.gov/budget-options/56822 .
84 BPC staff calculations of U.S. Department of Education, “Official Cohort Default Rates for Schools,” May 14, 2021. Available at: https://www2.ed.gov/offices/OSFAP/defaultmanagement/cdr.html.
85 Government Accountability Office, “Higher Education: Education Should Address Oversight and Communication Gaps in Its Monitoring of the Financial Condition of Schools,” September 2017. Available at: https://www.gao.gov/products/gao-17-555.
86 U.S. Department of Education, “Fiscal Year 2021 President’s Request,” February 10, 2020. Available at: https://www2.ed.gov/about/overview/budget/budget21/21pbapt.pdf.
87 U.S. Department of Education, “Fiscal Year 2022 President’s Request,” May 28, 2021. Available at: https://www2.ed.gov/about/overview/budget/budget22/summary/22summary.pdf.
88 Government Accountability Office, “Education Needs to Improve Its Income-Driven Repayment Plan Budget Estimates,” November 2016. Available at: https://www.gao.gov/assets/gao-17-22.pdf.
89 Ibid.
90 Congressional Research Service, “Federal Credit Reform: Implementation of the Changed Budgetary Treatment of Direct Loans and Loan Guarantees,” June, 2003. Available at: https://www.everycrsreport.com/files/20030623_RL30346_81027106a75e9912d7fcc3a8732b4444a06ee4bf.pdf.
91 C. Gibbs, Changing the Cost of Federal Student Loan Take-up: Evidence from the FFEL To Direct Loan Program Transition, University of Wisconsin-Madison, 2015. Available at: https://www.semanticscholar.org/paper/Changing-the-Cost-of-Federal-Student-Loan-Take-up-%3A-Gibbs/0d989ecd11f1d680cd9c1b30e51e409a79ec5fd6#paper-header.

42
92 Congressional Budget Office, “Federal Student Loan Programs,” CBO’s Baseline Projections as of July 2021. Available at: https://www.cbo.gov/system/files/2021-07/51310-2021-07-studentloan.pdf.
93 J. Delisle and J. Richwine, “The Case for Fair-Value Accounting,” Fall 2014. Available at: https://www.nationalaffairs.com/publications/detail/the-case-for-fair-value-accounting.
94 R. Kogan, P. Van de Water, and J. Horney, “House Bill Would Artificially Inflate Cost of Federal Credit Programs,” June 18, 2013. Available at: https://www.cbpp.org/research/house-bill-would-artificially-inflate-cost-of-federal-credit-programs.
95 Government Accountability Office, “Current Method to Estimate Credit Subsidy Costs Is More Appropriate for Budget Estimates Than a Fair Value Approach,” January 2016. Available at: https://www.gao.gov/assets/gao-16-41.pdf.
96 Bipartisan Policy Center, “A New Course for Higher Education,” 2020. page 89. Available at: https://bipartisanpolicy.org/report/new-higher-ed/.
97 Ibid., 88.
98 T. Ross, G. Kena, et al., National Center for Education Statistics, Higher Education: Gaps in Access and Persistence Study, August 2012, xiii. Available at: https://nces.ed.gov/pubs2012/2012046.pdf.
99 S. Goldrick-Rab, R. Kelchen, et al., “Reducing Income Inequality in Educational Attainment: Experimental Evidence on the Impact of Financial Aid on College Completion,” American Journal of Sociology 121(6): 1762-1817, 2016. Available at: https://hope4college.com/wp-content/uploads/2018/09/Goldrick-Rab-etal-Reducing-Income-Inequality-in-Educational-Attainment.pdf.
100 Bipartisan Policy Center, “A New Course for Higher Education,” 2020. page 68. Available at: https://bipartisanpolicy.org/report/new-higher-ed/.
101 J. Delisle, The Brookings Institution, “The Pell Grant proxy: A ubiquitous but flawed measure of low-income student enrollment, October 12, 2017.” Available at: https://www.brookings.edu/research/the-pell-grant-proxy-a-ubiquitous-but-flawed-measure-of-low-income-student-enrollment/.
102 J. Denning, “Born under a Lucky Star: Financial Aid, College Completion, Labor Supply, and Credit Constraints,” Journal of Human Resources 54(3): 760-784, 2019. Available at: https://research.upjohn.org/cgi/viewcontent.cgi?article=1285&context=up_workingpapers.
103 S. Goldrick-Rab, R. Kelchen, et al., “Reducing Income Inequality in Educational Attainment: Experimental Evidence on the Impact of Financial Aid on College Completion,” American Journal of Sociology 121(6): 1762-1817, 2016. Available at: https://hope4college.com/wp-content/uploads/2018/09/Goldrick-Rab-etal-Reducing-Income-Inequality-in-Educational-Attainment.pdf.
104 J. Scott-Clayton, “The Role of Financial Aid in Promoting College Access and Success: Research Evidence and Proposals for Reform,” Journal of Student Financial Aid 45(3): 3, 2015. Available at: https://ir.library.louisville.edu/cgi/viewcontent.

43
cgi?article=1586&context=jsfa.
105 Bipartisan Policy Center, “A New Course for Higher Education,” 2020. page 75. Available at: https://bipartisanpolicy.org/report/new-higher-ed/.
106 Congressional Budget Office, “Options for Reducing the Deficit: 2021 to 2030 – Reduce or Eliminate Subsidized Loans for Undergraduate Students,” December 9, 2020. Available at: https://www.cbo.gov/budget-options/56821.
107 National Center for Education Statistics, “Digest of Education Statistics 2020,” Table 303.80, January 2021. Available at: https://nces.ed.gov/programs/digest/d20/tables/dt20_303.80.asp.
108 National Center for Education Statistics, “Digest of Education Statistics 2020,” Table 318.10, July 2020. Available at: https://nces.ed.gov/programs/digest/d20/tables/dt20_318.10.asp.
109 Bipartisan Policy Center, “A New Course for Higher Education,” 2020. page 73. Available at: https://bipartisanpolicy.org/report/new-higher-ed/.
110 Congressional Budget Office, “Federal Education Programs—CBO’s Estimate of the President’s Fiscal Year 2020 Budget,” May 9, 2019. Available at: https://www.cbo.gov/system/files/2019-05/55207-education.pdf.
111 Government Accountability Office, “Education Needs to Improve Its Income-Driven Repayment Plan Budget Estimates,” November 2016. Available at: https://www.gao.gov/assets/gao-17-22.pdf.
112 S. Catherine and C. Yannelis, “The Distributional Effects of Student Loan Forgiveness,” National Bureau of Economic Research, 2021. Available at: https://www.nber.org/system/files/working_papers/w28175/w28175.pdf.
113 Bipartisan Policy Center, “A New Course for Higher Education,” 2020. page 74. Available at: https://bipartisanpolicy.org/report/new-higher-ed/.
114 BPC staff calculation of U.S. Department of Education, “Public Service Loan Forgiveness Data,” April 2021 PSLF Report, 2021. Available at: https://studentaid.gov/data-center/student/loan-forgiveness/pslf-data.
115 D. Douglas-Gabriel, “For Student Borrowers, Confusion Anew in the Public-Service Loan-Forgiveness Program,” Washington Post, February 20, 2020. Available at: https://www.washingtonpost.com/education/2020/02/20/student-borrowers-confusion-anew-public-service-loan-forgiveness-program/.
116 Department of Education, “Fact Sheet: Public Service Loan Forgiveness (PSLF) Program Overhaul,” October 6, 2021. Available at: https://www.ed.gov/news/press-releases/fact-sheet-public-service-loan-forgiveness-pslf-program-overhaul.
117 Bipartisan Policy Center, “A New Course for Higher Education,” 2020. page 77. Available at: https://bipartisanpolicy.org/report/new-higher-ed/.
118 Ibid., 76.
44
119 S. Bair and P. Cooper, “The Future of Income-Share Agreements: Policy and Politics,” March 12, 2019. Available at: https://www.manhattan-institute.org/future-income-share-agreements-to-finance-higher-education.
120 Ibid.
121 Letter from Sen. Warren to Sec. DeVos, June 4, 2019. Available at: https://www.warren.senate.gov/imo/media/doc/Letter%20to%20DeVos%20re%20ISAs.pdf.
122 Purdue University, “Worried About How to Pay for your Purdue Education?” 2021. Available at: https://www.purdue.edu/backaboiler/.

1225 Eye St NW, Suite 1000 Washington, DC 20005
bipartisanpolicy.org
202 - 204 - 2400
The Bipartisan Policy Center (BPC) is a Washington, D.C.-based think tank that actively fosters bipartisanship by combining the best ideas from both parties to promote health, security, and opportunity for all Americans. Our policy solutions are the product of informed deliberations by former elected and appointed officials, business and labor leaders, and academics and advocates who represent both ends of the political spectrum.
BPC prioritizes one thing above all else: getting things done.
@BPC_Bipartisan
facebook.com/BipartisanPolicyCenter
instagram.com/BPC_Bipartisan
Policy Areas
Campus Free Expression
Economy
Education
Energy
Governance
Health
Immigration
Infrastructure
I D E A S . AC T I O N . R E S U LT S .
1225 Eye Street NW, Suite 1000 Washington, D.C. 20005