Embed Size (px)
Citation preview

Student Equity: Representation by Ethnicity
Fall 2007 to Fall 2012
PaRC PresentationApril 15, 2013
T. Margesson, M. Navi & E. KuoFHDA IR&P

Overview
• Breakdown of regional, local population by ethnicity
• Compared with the ethnicities represented in Foothill’s student population
• Examine trend lines over 6 years

Part I: Foothill Students and Local Population

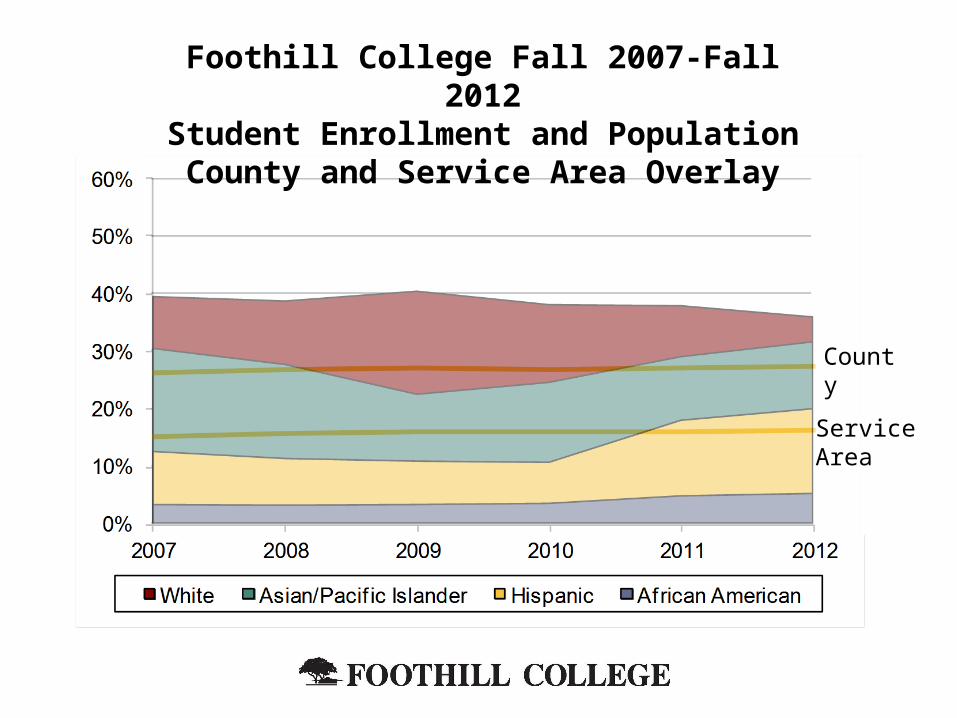
0%
10%
20%
30%
40%
50%
60%
2007 2008 2009 2010 2011 2012
White Asian/Pacif ic Islander Hispanic African American
Foothill College Fall 2007-Fall 2012Enrollment by Ethnicity

Service Area
County
Foothill College Fall 2007-Fall 2012Student Enrollment and Population
County and Service Area Overlay

Service Area
County
Foothill College Fall 2007-Fall 2012Student Enrollment and Population
County and Service Area Overlay
Service Area
County
Foothill College Fall 2007-Fall 2012Student Enrollment and Population
County and Service Area Overlay

Service AreaCounty
Foothill College Fall 2007-Fall 2012Student Enrollment and Population
County and Service Area Overlay
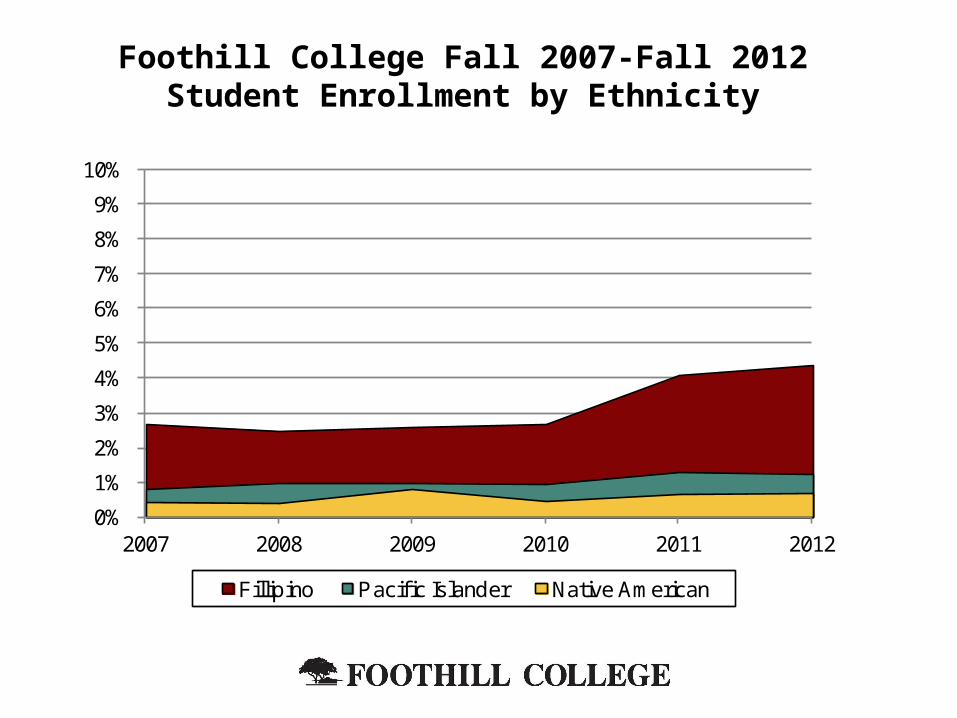
0%
1%
2%
3%
4%
5%
6%
7%
8%
9%
10%
2007 2008 2009 2010 2011 2012
Fillipino Pacif ic Islander Native American
Foothill College Fall 2007-Fall 2012Student Enrollment by Ethnicity

Foothill College Fall 2007-Fall 2012Student Enrollment and Population
County and Service Area Overlay
County Filipinos
County PIsCounty Native Americans

Part II: Foothill Students and Employees

IR&D District Website Fall 2007 to 2012
Total Enrollment
African American Enr.
Asian/Pac Isl Enr.
Filipino Enr.
Latino/a Enr.
White Enr.
2007 2008 2009 2010 2011 2012 % Change0
2,000
4,000
6,000
8,000
10,000
12,000
14,000
16,000
18,000
20,000
Foothill College Fall 2007-Fall 2012Enrollment Headcount by Ethnicity
Admin
Faculty
Latino/a Faculty
Staff
2007 2008 2009 2010 2011 2012 % Change0
20
40
60
80
100
120
140
160
180
200
220
Foothill College Fall 2007-Fall 2012Employee Headcount by Classification

2007 2008 2009 2010 2011 2012 % Change0
20406080
100120140160180200220240260280300320340360380400
Foothill College Fall 2007- Fall 2012Employee Headcount by Ethnicity
EmploymentAfrican American EmployeesAsian/Pac Is EmployeesFilipino EmployeesLatino/a EmployeesWhite Employees

2007 2008 2009 2010 2011 20120%
10%
20%
30%
40%
50%
60%
70%
Foothill College Fall 2007-Fall 2012Enrollment and Employment Percentage by Ethnicity
African American Enr.African American EmployeeAsian/Pac Isl Enr.Asian/Pac Isl EmployeeFilipino Enr.Filipino EmployeeLatino/a Enr.Latino/a EmployeeWhite Enr.White Employee

2007 2008 2009 2010 2011 20120
20
40
60
80
100
120
140
160
180
200
220
Foothill College Fall Full Time Faculty by EthnicityFall 2007-Fall 2012
TotalAfrican AmericanAsian/Pacific IslanderFilipinoLatino/aWhite

2007 2008 2009 2010 2011 20120
10
20
30
40
50
60
70
80
90
100
110
120
130
140
150
160
170
Foothill College Fall Classified Staff by EthnicityFall 2007-Fall 2012
TotalAfrican AmericanAsian/Pacific IslanderFilipinoLatino/aWhite

2007 2008 2009 2010 2011 20120
5
10
15
20
25
30
Foothill College Fall Administrators by EthnicityFall 2007 to Fall 2012
TotalAfrican AmericanAsian/Pacific IslanderFilipinoLatino/aWhite

Summary
• Data shows us trend lines and historical patterns
• Must consider how this information informs goals related to student equity
• Ethnicity is just one piece of equity– Exploration on other characteristics are needed

Implications
• What’s the goal?• What interventions can be attempted?• Unpackage issues related to equity
– Representation: Who is here?– Outcomes: What happens to those who are here?