Embed Size (px)
Citation preview
Student Evaluations 1
RUNNING HEAD: Student Evaluations
Student Evaluations of College Instructors:
An Overview
Patricia A. Gordon
Valdosta State University
As partial requirements for PSY 702: Conditions of Learning
Dr. William G. Huitt, Instructor
Student Evaluations 2
Abstract
The paper provides an overview of student evaluations of college instructors. Reasons for and
appropriate uses of student ratings are examined. Sources of validity as well as bias are reviewed.
Student self-insight into implicit and public theories is related to the ability to make valid,
thoughtful evaluations. Evaluations are described as multidimensional, stable, and a function of
the instructor. Improvements to satisfy faculty, students, and to meet the needs of the information
age conclude the paper.
Student Evaluations 3
Student Evaluations of College Instructors:
An Overview
For nearly a decade, teaching in higher education has risen in status and is viewed by many to
be of greater importance than the more traditional focus on research (Boyer & Rice, 1990;
McKeachie, 1990; Paulsen & Feldman, 1995). In designing a supportive teaching environment,
specific characteristics have been identified that facilitate teaching and drive the process of
instructional improvement. These characteristics include: unambiguous commitment to and
support of teaching and its improvement from administrators; shared values between faculty and
administrators about the importance of teaching; involvement of faculty in planning and
implementing programs to improve teaching, thereby creating a sense of faculty ownership; the
presence of effective department chairs; frequent interaction and collaboration among faculty; a
faculty development program; a broad, expanded view of scholarship; and rigorous evaluation of
teaching (Paulsen & Feldman).
It is this last characteristic, a rigorous evaluation of teaching, that is the focus of this paper.
Student Involvement in Evaluation
Students need not be silent partners in the improvement of teaching in higher education. In
actively seeking students' responses to instruction, colleges and universities are sending the
important message that they honor and support the teaching-learning process. According to the
North Carolina State University Handbook for Advising and Teaching (1994), student evaluation
of teacher effectiveness serves two purposes. Most importantly, student evaluations provide
instructors with important feedback from the consumer's point-of-view. Students can and do
Student Evaluations 4
make important contributions to the teaching-learning process, and teachers must be receptive to
their ideas.
Additionally, student evaluations are of value to administrators and department chairs in
assessing perceived effectiveness of instruction (NC State University, 1994). This information is
often used for both formative and summative purposes (Marsh, 1984) and occasionally to reward
exemplary teaching (NC State University).
In summary, since the 1970's, there has been a consensus on the purpose of student
evaluations at colleges and universities. Rifkin (1995) confirmed that the primary purpose is
formative; that is, facilitating faculty growth, development, and self-improvement. Secondly,
student evaluations are used for summative purposes and often play a vital part in tenure,
promotion, reappointment, and salary decisions.
Regardless of purpose of student evaluations, formative or summative, their use implies
belief in the following principles (Huitt, 1995; Stockham & Amann, 1994):
1. Learning is an active process and student involvement is an integral part of that process.
2. Student characteristics and behaviors impact perception of and interaction with the
teacher.
3. Teachers view their teaching with regard to the paradigms of their students in order to
facilitate change and build for growth.
4. Teachers recognize that students can make important contributions to the teaching-
learning process.
5. The teaching-learning process is dynamic and should change over time and with context.
Student Evaluations 5
Students are in a unique position to assess a variety of aspects concerning effective
instruction. Scriven (1995) identified several sources of validity for student ratings of instruction.
They include:
1. students' ratings of their own increased knowledge and comprehension;
2. perceived changes in motivation toward
(a) the subject taught,
(b) a career associated with the subject,
(c) further learning in that subject area;
3. observed teacher behavior relevant to competent teaching, such as punctuality;
4. identification of teaching style indicators, such as enthusiasm;
5. test evaluation;
6. student consumerism; that is, information not relevant to competent teaching, but
important to other students, such as textbook cost, attendance policy, or homework.
Finally, although not systematically examined, student ratings should incorporate research on
teaching (Marsh, 1984). Huitt (1995) proposed that educational research should help answer the
question: "Why do some students learn more than others?" When one considers the review of
models of the teaching-learning process as described by McIlwrath and Huitt (1995), it becomes
apparent that student evaluations can be an important measure of teacher behaviors and teaching
methods when they are related to a product or output measure of student learning and growth. It
might be suggested that student evaluations are additionally relevant to presage or teacher
characteristic variables (e.g., subject knowledge, teaching skills, teacher efficacy) for the next
Student Evaluations 6
group of learners. Such a powerful triad serves to facilitate research in the teaching-learning
environment in an attempt to answer major educational research questions.
Negative Implications
Although hundreds of papers have been written regarding the effectiveness of student
evaluations on faculty performance, such papers cannot be easily summarized. Researcher
opinions run the gamut from valid, reliable, and useful to invalid, unreliable, and useless
(Aleamoni, 1981). However, there is one criteria that most researchers agree on: student
evaluations should be non-normative (Rifkin, 1995). A criterion-referenced system that appraises
faculty members according to a set of standards that encourages professional development is
preferable to a system that rank-orders faculty on a particular set of items.
Both Scriven (1995) and Simpson (1995) suggested that student evaluations often contain the
wrong global questions that tend to rank or compare teachers or serve to recommend a specific
course or instructor to other students. An inappropriate question might be: "Is this one of the best
courses you have ever taken?" An appropriate global question might involve an evaluation of
overall teaching performance (Hativa, 1996).
Cashin and Downey (1992) and Abrami (1989) have deemed global questions appropriate for
summative evaluations. Just as a single final summative grade is used to indicate the amount of
student learning related to unquestionably multidimensional objectives, so too can effective
teaching be summarized via global questions. Cashin and Downey acknowledged that formative
questions allow for differences among teachers, courses, and environments, and serve as
diagnostic tools for improving the teaching-learning process. Yet they, along with Abrami,
Student Evaluations 7
favored the use of several global questions for summative purposes to indicate the lack of or
existence of problems or difficulties.
Eley and Stecher (1997) favored behavioral observations over Likert agree/disagree type
questions since they found that Likert type questions elicited global, impressionistic responses.
Behavioral observations seemed to produce more objective responses in distinguishing favorable
teaching qualities. In contrast, Cook (1989) found no difference between behaviorally anchored
rating scales (BARS) formatted questions and Likert-type questionnaires. Students preferred
Likert-type scales over BARS questionnaires, simply because it was less work. A related point,
according to Scriven (1995), is to keep evaluations short because students tend to lose interest if
the evaluation process becomes too wordy or lengthy.
In an effort to reduce instructor hostility toward student evaluations and to improve overall
validity, Davis (1995) suggested faculty-developed evaluation instruments suited to individual
departmental curriculum and purpose. Most universities currently use standardized forms that do
not recognize individual course contours and content (Divoky, 1995). North Carolina State
University (1994) has mandated that each department develop or adopt student evaluation
instruments appropriate to the types of courses offered in each department.
Finally, the validity of student evaluations is dependent on the context of how and when they
are administered. Two basic principles governing distribution, collection, and handling of
evaluation instruments are anonymity and confidentiality (NC State University, 1994).
Preferably, an instructor would not be present while students are completing questionnaires in an
attempt to control pleas for sympathy or indulgence by the teacher (Scriven, 1995).
Questionnaires should be distributed and collected by a non-teaching school employee or
Student Evaluations 8
designated student representative, who delivers the completed questionnaires to the appropriate
official, where they remain until grades are administered (NC State University, 1994).
While individual situations and personalities may be able to lend some credence to the
description of student evaluations as unreliable, invalid, and useless, the literature does not
support these claims. For over thirty years, exhaustive research has been compiled on student
evaluations, and as will be discussed later, when they are appropriately developed and
administered, they remain useful tools in impacting the teaching-learning process on the higher
education front.
Students' Ability to Judge
As previously mentioned, students have a front row seat to observe teacher behaviors and
classroom processes, and are the best judge of what they have learned (Scriven, 1995). The use of
standardized evaluations implies, though, that students have the ability to make fair, overall
judgments about teaching effectiveness based on legitimate factors that actually relate to
effective teaching and learning. Harrison, Ryan, and Moore (1996) have suggested that college
students, in general, possess self-insight into how they make judgments concerning their
instructors since they have an implicit awareness of the relative importance of the factors they are
considering.
Self-insight is a form of metacognition that reflects peoples' awareness of the value and
processes involved in their understanding (Harrison, Ryan, & Moore, 1996). Are students aware
of the processes they use to integrate information in order to make decisions concerning teacher
effectiveness? "Yes," said Harrison, Ryan, and Moore. While students seemed to possess implicit
theories associated with the occurrence or nonoccurrence of specific behaviors of instructors,
Student Evaluations 9
students also possessed self-insight into how they make overall evaluations while incorporating
those implicit theories.
Such implicit theories fall into the realm of student characteristics in Huitt's (1995) teaching-
learning process model. Students tended to organize and evaluate their experiences with one
instructor with respect to previous experiences and observed behaviors (Whitely & Doyle, 1976).
These implicit mental theories are then brought into each particular learning situation. For
example, if a male student had a negative experience with a female instructor, he might bring an
implicit theory regarding gender and teacher effectiveness to other learning situations.
Additionally, for an auditory learner, teacher characteristics such as clarity of speech, and speed
of material presented might be implicitly ranked as more important to that student than to another
more visual leaner. Students' opinions concerning the relative importance of specific teacher
behaviors and characteristics including such items as enthusiasm, organization, rapport, and
fairness, then, appeared to be brought with them to the learning situation (Harrison, Ryan, &
Moore, 1996).
The construct of public theories involves a specific group of people, who because of common
experiences, share implicit theories (Whitely & Doyle, 1976). These theories need not be
communicated publicly, orally or written. Public theory indicates only common experiences
(Wright & Rip, 1981). Regardless of the guiding theories, implicit or public, Harrison, Ryan, and
Moore (1996) supported the idea that students possess the self-insight necessary to understand
their personal or group weighting system and thereby make valid evaluations of teacher
effectiveness.
Student Evaluations 10
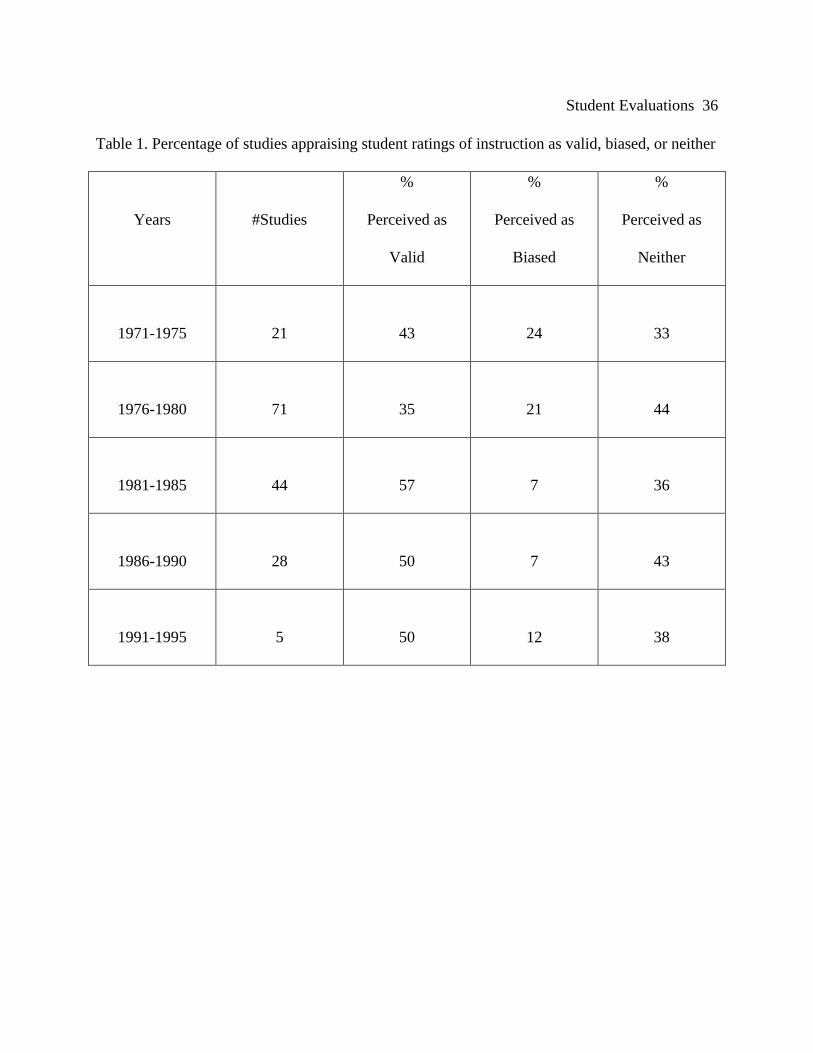
Greenwald (1997) substantiated Harrison, Ryan, and Moore's (1996) contention that students
do make valid evaluations of teachers. During the past 25 years, much research has been focused
on said validity. Greenwald discovered that while validity studies peaked around 1980,
historically the studies supporting student evaluations as valid remained constant. From 1991 to
1995, validity research was at an all time low, inferring that the 20 years of previous research had
resolved most major issues concerning this topic (see Table 1).
[Place Table 1 about here]
Student Evaluations Are . . .
Multidimensional
According to Marsh (1984, 1993), there are several reasons why evaluations of teaching
should be considered as multifaceted. First, if effective teaching is multifaceted (e.g.,
Cruckshank, 1985; Gage and Berliner, 1992; Huitt, 1995), then instruments for student
evaluations should reflect this multi-dimensionality. Second, there is no single criterion of
effective teaching (e.g., McKeachie, 1990). Therefore, a construct approach to validate student
ratings is necessary whereby the student evaluation ratings are shown to be related to additional
indicators of effective teaching. Finally, different factors of student evaluations will correlate
more highly with different indicators of effective teaching (e.g., McKeachie, 1973). Therefore,
student ratings should not be summarized by one response to a single item or an unweighted
average response to many items.
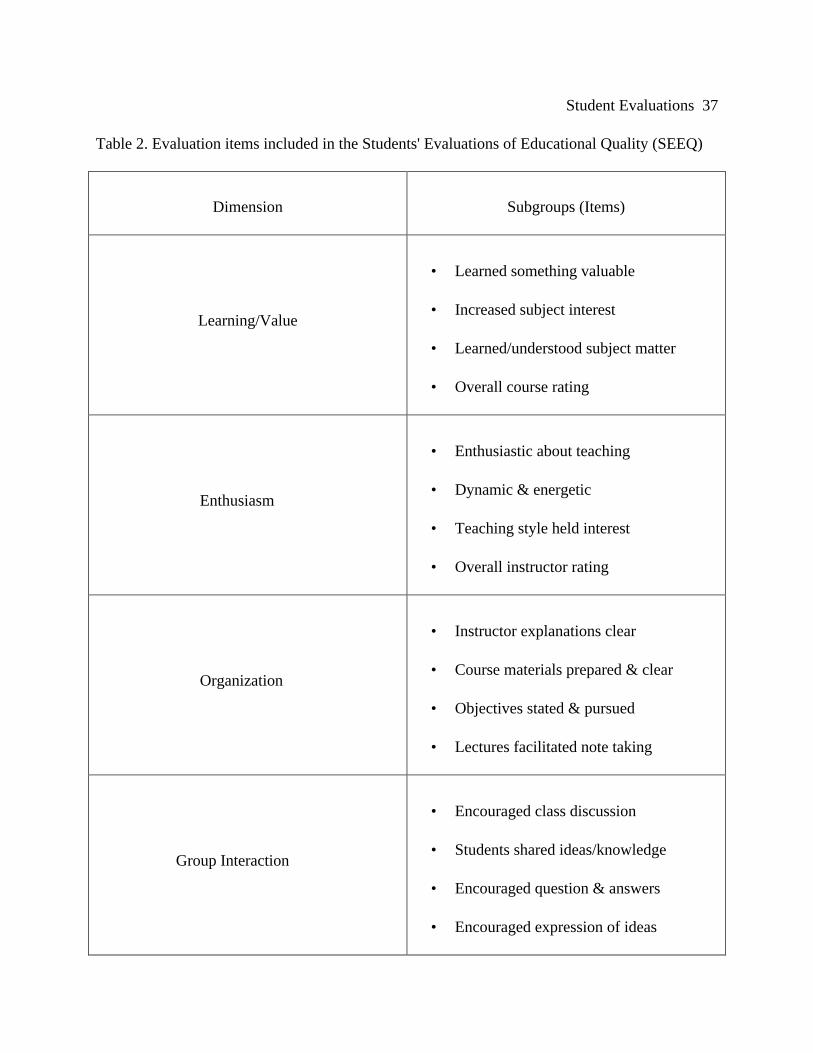
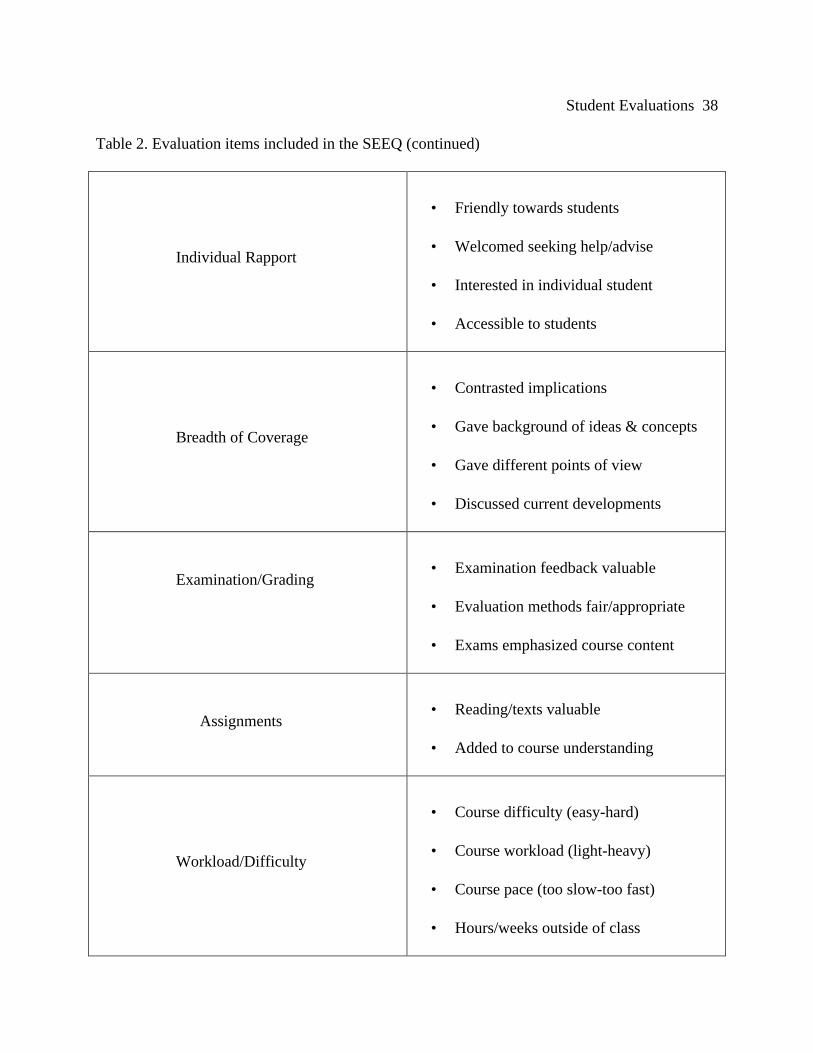
Throughout the 1980's and 1990's, Marsh (1983, 1984, 1993) studied the multi-
dimensionality of student evaluations of teaching effectiveness by the administration of one
million questionnaires representing 50,000 courses. Marsh's questionnaire, the Students'
Student Evaluations 11
Evaluations of Educational Quality (SEEQ), contains thirty-three evaluation items, divided into
nine subgroups (see Table 2).
[Place Table 2 About Here]
Over the years, Marsh (1983, 1984, 1993) consistently found that the single most important
factor effecting student evaluations was amount learned and the least important factor was course
difficulty. This finding was more recently supported by Ryan and Harrison (1995),
Cohen (1981) proposed that if a student knew their final grade in a course, and that grade was
high, then the student's perception of amount learned would be high and he or she would directly
attribute that grade to effective teaching, and the student rating would be correspondingly high.
However, higher grades in a course may actually reflect grading leniency, rather than amount
learned. Without comparison to some outcome measure, there is no way to tell.
In the statistical evaluation of the SEEQ, Marsh (1983) considered a host of what he called
background characteristics. These background characteristics included prior subject interest,
workload difficulty, expected grade, reason for taking course, class level, overall graded point
average, year in school, course enrollment, percent majors (that is, is the student majoring in the
same division or school in which the course is offered), and teacher rank (teaching assistant,
instructor, assistant professor, associate professor, professor). Through statistical analysis of
these background characteristics, Marsh concluded that four characteristics had the greatest
correlation to the SEEQ's: 1) prior subject interest, 2) general interest, 3) expected grade, and 4)
workload difficulty. The importance of prior subject knowledge should be of little surprise; Gage
and Berliner (1992) proposed that the schemata we bring to an instructional situation are as
important as the instruction itself.
Student Evaluations 12
In a simple analysis of background characteristics and SEEQ factors, Marsh (1983)
considered the correlation substantial if the r-squared was greater than .05 (with a resulting r >
.23). In a statistical analysis of 768 coefficients, 16 met the criteria and 14 of the 16 correlations
involved prior knowledge. The largest single correlation (r = .56) was between prior subject
interest and ratings of Learning/Value on the SEEQ (Marsh, 1983). The other three background
characteristics were expected grade (positively correlated with Learning/Value and Group
Interaction), course enrollment or class size (negatively correlated with Group Interaction and
Individual Rapport) and average year in school, freshman or sophomore (negatively correlated
with Group Interaction.) No other background variables were substantially correlated with any
other SEEQ factors.
After determining the bivariate relationships previously mentioned, Marsh (1983) entered the
background characteristics into a stepwise multiple regression to predict each of the SEEQ
factors. Marsh (1983) used the number of times a background factor appeared in a regression
equation as an indicator of importance. The most important variables, as determined by 48
regressions, were expected grades (42), workload/difficulty (30), prior subject interest (28), and
general interest/reason (18). Student ratings tended to be more favorable when expected grades
were higher, prior subject interest was higher, levels of workload/difficulty were higher, and the
percentage of students taking the course for general interest was higher. None of the other
background characteristics appeared more than 12 times in the 48 regressions equations.
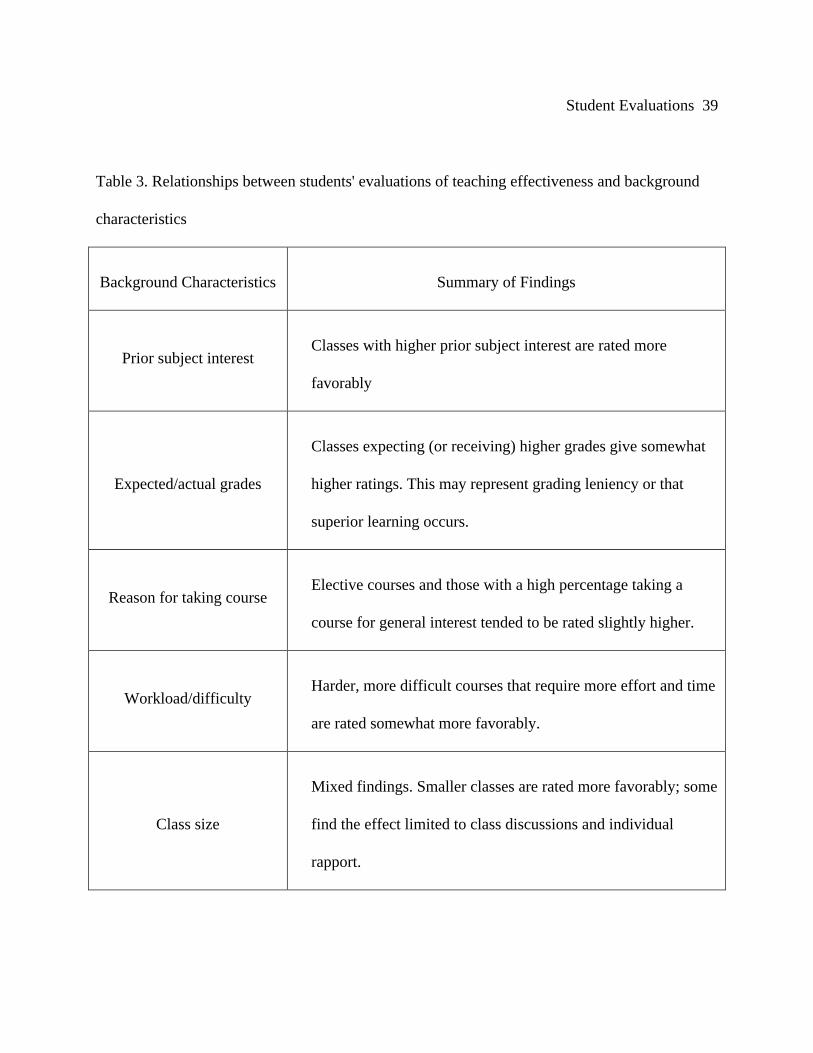
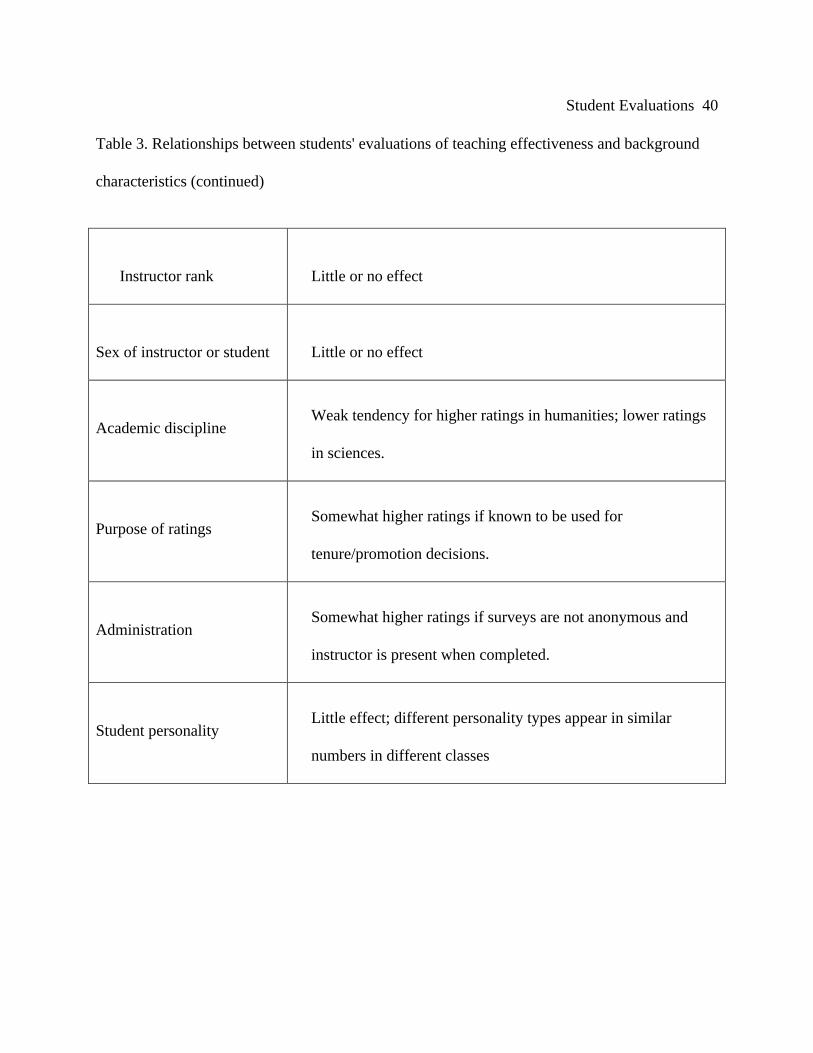
Additional relationships between students' evaluations of teaching effectiveness and
background characteristics were discussed by Marsh (1983, 1984. 1992) and are summarized in
Table 3.
Student Evaluations 13
[Place Table 3 About Here]
Cranton and Smith (1990) suggested that a different factor sturcture emerges when different
levels of analysis are considered. When looking at individual's opinions, two factors emerged:
Interest/Atmosphere, which includes such items as inspiring interest and developing an
atmosphere conducive to learning, and organization, which includes such items as clarifying
material and making clear distinctions among topics. These two factors accounted for 78.8% and
9.8% of the variance, respectively.
When one considers class means as the unit of analysis (which focuses on differences among
instructors), another factor structure emerged. The organizational factor included several
additional items such as clear purpose of class and use of class time, and accounted for 83.8% of
the variance. A second factor, labeled value, accounted for 8% of the variance and included such
items as how much learned and overall value.
Stable
Marsh and Bailey (1993) analyzed the rating profiles of 123 instructors during a 13-year
period. Ratings for each instructor included at least two undergraduate and two graduate courses,
and the departments included in the research spanned all disciplines. Since the shape of a teacher
profile graphically describes teacher characteristics and behaviors, and the level describes ratings
from high to low, Marsh and Bailey questioned whether teachers' profile shape would remain
constant over time and across courses. Results from their analysis indicated high consistency/
stability of the profile shape of the same instructor over time, regardless of course taught.
Hativa (1996) supported Marsh and Bailey's (1993) research concerning stability of profile
shape, but found during the second year of her study that there was a significant change in profile
Student Evaluations 14
level. If teachers are expected to modify behaviors and teaching strategies based on student
evaluations, one would then expect Hativa's results: ratings levels increase as a result of student
evaluations.
A Function of the Teacher, Not the Course
Marsh (1981) examined the importance of the effect of the instructor on student evaluations
compared with the effect of a particular class being taught. Marsh compared two different
courses taught by the same instructor and the same course taught by two different instructors.
The 1,364 courses were grouped in sets of four: same instructor-same course; same instructor-
different course; different instructor-same course; different instructor-different course. The mean
correlation coefficients are shown in Table 4.
[Insert Table 4 About Here]
Marsh (1981) argued that the large differences in correlation coefficients between same
instructor-same course (.7) and same instructor-different course (.52), especially when compared
to the much lower correlation between different instructor-same course (.14), demonstrates that
the effect of the teacher on student ratings was much larger than the effect of the course being
taught. Therefore, student evaluations reflected the effects of the instructor, not the course.
Marsh and Hocevar (1984) examined the consistency of student evaluations for university
instructors who taught the same course at least four times in four years. Over 31,000 students
evaluated 314 instructors and the pattern of ratings for one instructor were similar throughout the
four years.
In the analysis of Marsh's (1983, 1984, 1993) SEEQ's, the majority of the items we have
discussed are either teacher characteristics or behaviors (as compared to contextual or outcome
Student Evaluations 15
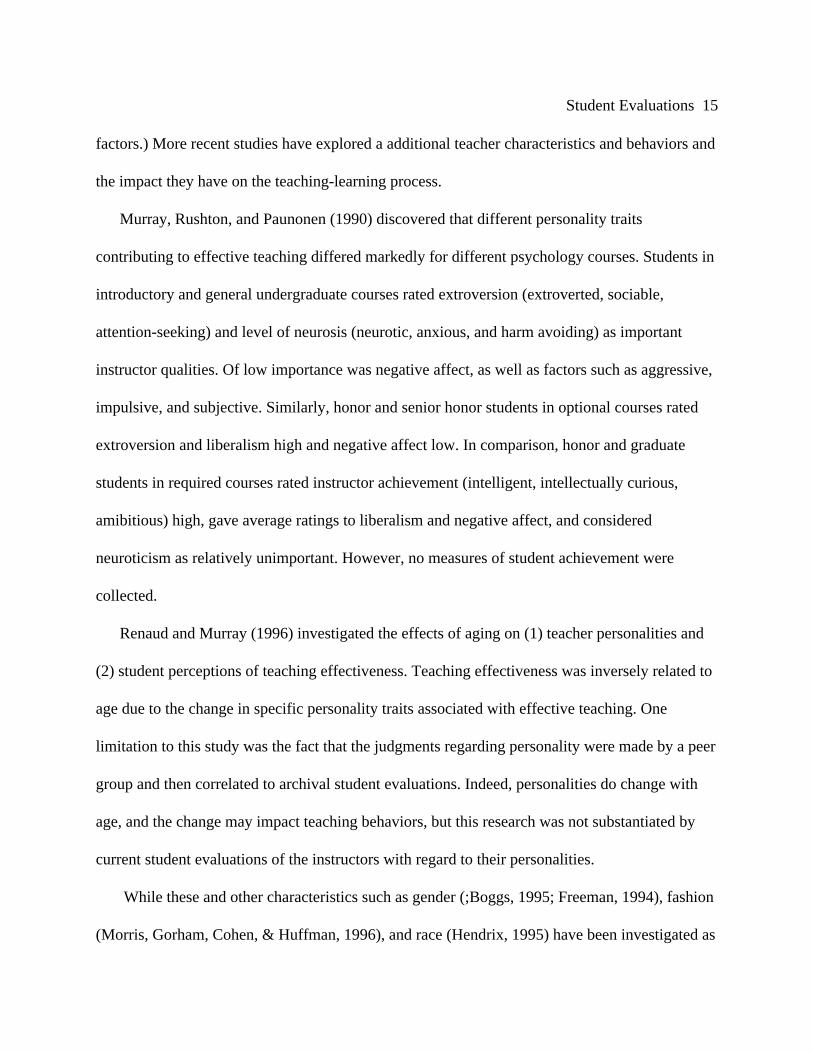
factors.) More recent studies have explored a additional teacher characteristics and behaviors and
the impact they have on the teaching-learning process.
Murray, Rushton, and Paunonen (1990) discovered that different personality traits
contributing to effective teaching differed markedly for different psychology courses. Students in
introductory and general undergraduate courses rated extroversion (extroverted, sociable,
attention-seeking) and level of neurosis (neurotic, anxious, and harm avoiding) as important
instructor qualities. Of low importance was negative affect, as well as factors such as aggressive,
impulsive, and subjective. Similarly, honor and senior honor students in optional courses rated
extroversion and liberalism high and negative affect low. In comparison, honor and graduate
students in required courses rated instructor achievement (intelligent, intellectually curious,
amibitious) high, gave average ratings to liberalism and negative affect, and considered
neuroticism as relatively unimportant. However, no measures of student achievement were
collected.
Renaud and Murray (1996) investigated the effects of aging on (1) teacher personalities and
(2) student perceptions of teaching effectiveness. Teaching effectiveness was inversely related to
age due to the change in specific personality traits associated with effective teaching. One
limitation to this study was the fact that the judgments regarding personality were made by a peer
group and then correlated to archival student evaluations. Indeed, personalities do change with
age, and the change may impact teaching behaviors, but this research was not substantiated by
current student evaluations of the instructors with regard to their personalities.
While these and other characteristics such as gender (;Boggs, 1995; Freeman, 1994), fashion
(Morris, Gorham, Cohen, & Huffman, 1996), and race (Hendrix, 1995) have been investigated as
Student Evaluations 16
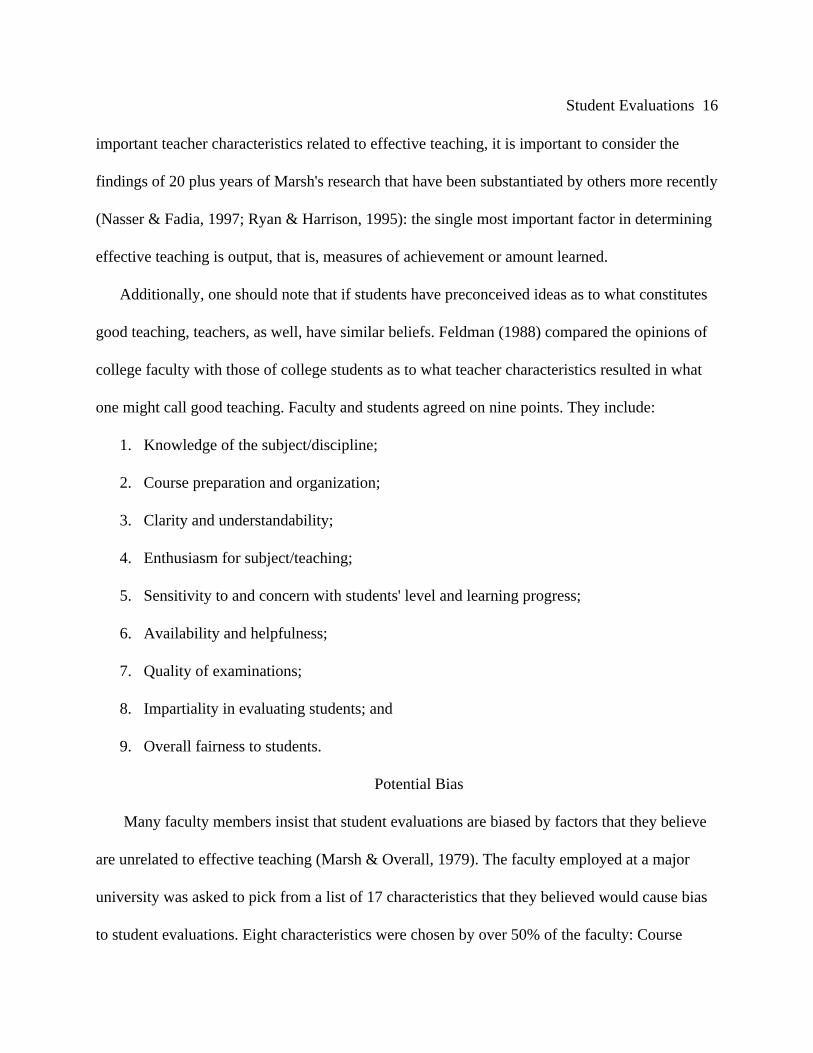
important teacher characteristics related to effective teaching, it is important to consider the
findings of 20 plus years of Marsh's research that have been substantiated by others more recently
(Nasser & Fadia, 1997; Ryan & Harrison, 1995): the single most important factor in determining
effective teaching is output, that is, measures of achievement or amount learned.
Additionally, one should note that if students have preconceived ideas as to what constitutes
good teaching, teachers, as well, have similar beliefs. Feldman (1988) compared the opinions of
college faculty with those of college students as to what teacher characteristics resulted in what
one might call good teaching. Faculty and students agreed on nine points. They include:
1. Knowledge of the subject/discipline;
2. Course preparation and organization;
3. Clarity and understandability;
4. Enthusiasm for subject/teaching;
5. Sensitivity to and concern with students' level and learning progress;
6. Availability and helpfulness;
7. Quality of examinations;
8. Impartiality in evaluating students; and
9. Overall fairness to students.
Potential Bias
Many faculty members insist that student evaluations are biased by factors that they believe
are unrelated to effective teaching (Marsh & Overall, 1979). The faculty employed at a major
university was asked to pick from a list of 17 characteristics that they believed would cause bias
to student evaluations. Eight characteristics were chosen by over 50% of the faculty: Course
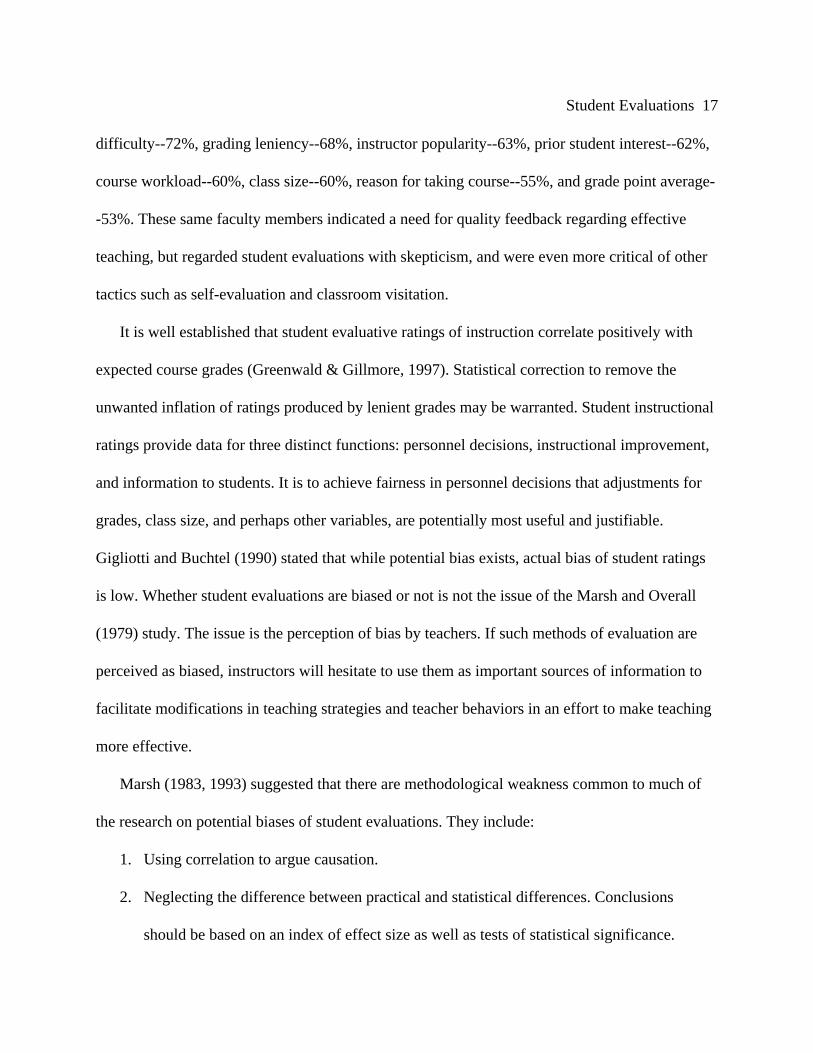
Student Evaluations 17
difficulty--72%, grading leniency--68%, instructor popularity--63%, prior student interest--62%,
course workload--60%, class size--60%, reason for taking course--55%, and grade point average-
-53%. These same faculty members indicated a need for quality feedback regarding effective
teaching, but regarded student evaluations with skepticism, and were even more critical of other
tactics such as self-evaluation and classroom visitation.
It is well established that student evaluative ratings of instruction correlate positively with
expected course grades (Greenwald & Gillmore, 1997). Statistical correction to remove the
unwanted inflation of ratings produced by lenient grades may be warranted. Student instructional
ratings provide data for three distinct functions: personnel decisions, instructional improvement,
and information to students. It is to achieve fairness in personnel decisions that adjustments for
grades, class size, and perhaps other variables, are potentially most useful and justifiable.
Gigliotti and Buchtel (1990) stated that while potential bias exists, actual bias of student ratings
is low. Whether student evaluations are biased or not is not the issue of the Marsh and Overall
(1979) study. The issue is the perception of bias by teachers. If such methods of evaluation are
perceived as biased, instructors will hesitate to use them as important sources of information to
facilitate modifications in teaching strategies and teacher behaviors in an effort to make teaching
more effective.
Marsh (1983, 1993) suggested that there are methodological weakness common to much of
the research on potential biases of student evaluations. They include:
1. Using correlation to argue causation.
2. Neglecting the difference between practical and statistical differences. Conclusions
should be based on an index of effect size as well as tests of statistical significance.
Student Evaluations 18
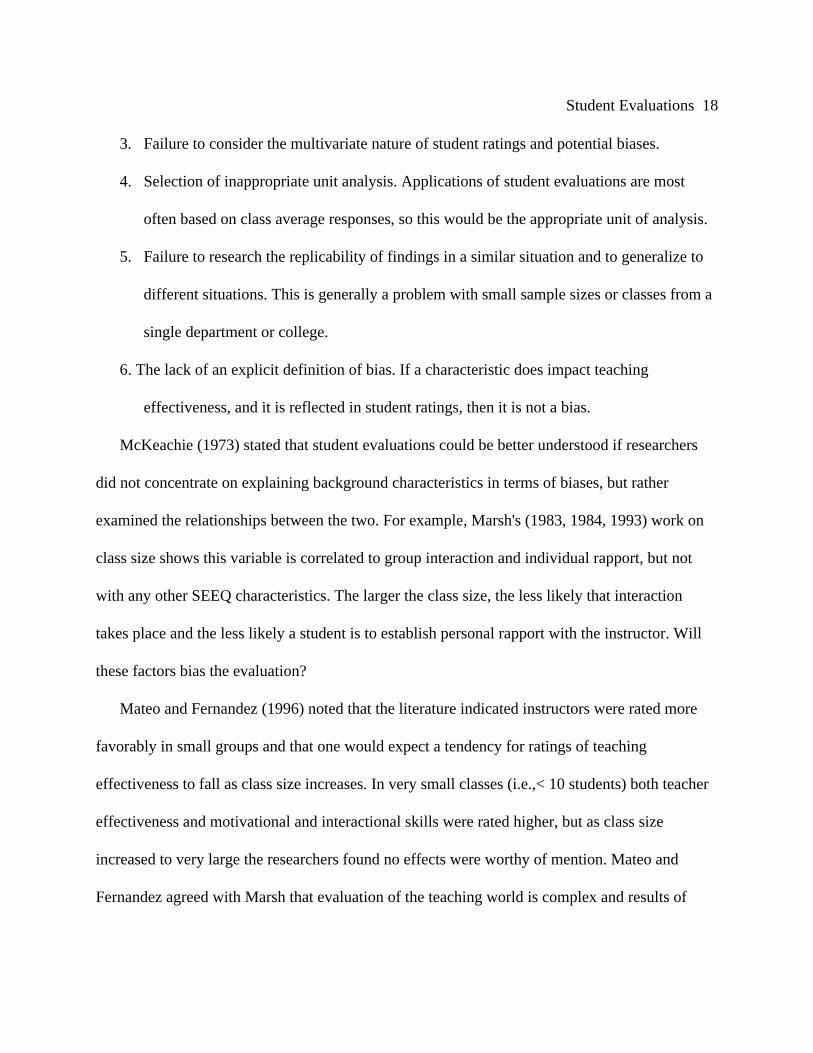
3. Failure to consider the multivariate nature of student ratings and potential biases.
4. Selection of inappropriate unit analysis. Applications of student evaluations are most
often based on class average responses, so this would be the appropriate unit of analysis.
5. Failure to research the replicability of findings in a similar situation and to generalize to
different situations. This is generally a problem with small sample sizes or classes from a
single department or college.
6. The lack of an explicit definition of bias. If a characteristic does impact teaching
effectiveness, and it is reflected in student ratings, then it is not a bias.
McKeachie (1973) stated that student evaluations could be better understood if researchers
did not concentrate on explaining background characteristics in terms of biases, but rather
examined the relationships between the two. For example, Marsh's (1983, 1984, 1993) work on
class size shows this variable is correlated to group interaction and individual rapport, but not
with any other SEEQ characteristics. The larger the class size, the less likely that interaction
takes place and the less likely a student is to establish personal rapport with the instructor. Will
these factors bias the evaluation?
Mateo and Fernandez (1996) noted that the literature indicated instructors were rated more
favorably in small groups and that one would expect a tendency for ratings of teaching
effectiveness to fall as class size increases. In very small classes (i.e.,< 10 students) both teacher
effectiveness and motivational and interactional skills were rated higher, but as class size
increased to very large the researchers found no effects were worthy of mention. Mateo and
Fernandez agreed with Marsh that evaluation of the teaching world is complex and results of
Student Evaluations 19
evaluations studies are difficult to define with simple models, but rather require consideration of
the complex relationships among all factors involved.
Dr. Fox
Naftulin, Ware, and Donnelly (1973) hired a professional actor to lecture enthusiastically and
expressively to a group of graduate students. The lecture was exciting, but lacking in content.
Despite the lack of content, the actor received favorable ratings. The actor's expressiveness
correlated to high ratings of instructor enthusiasm, which was the factor most logically related to
the manipulation. Expressiveness also resulted in a higher overall general rating and a small
effect on achievement. While some researchers merely labeled the study problematic (e.g., Frey,
1979), others conducted a review and re-analysis of the Dr. Fox study (e.g., Abrami, Leventhal,
& Perry, 1982; Marsh & Ware, 1982; Ware & Williams, 1979). For example, Abrami et al. found
that content manipulations had a greater effect on achievement and a smaller effect on student
ratings.
Improving the Evaluation Process
As stated previously, despite the general use of student evaluations in university systems
during the past thirty years, many teachers remain hostile (Davis, 1995) and often do not use the
feedback they receive (L'Hommedieu, Menges & Brinko, 1997). Davis directed faculty members
to explain the importance of the evaluation process to students, in an effort to elicit a fair and
thoughtful response by students. Cook (1989) advocated training student raters in an effort to
reduce the halo effect on Likert scale evaluation instruments and to help produce quality ratings.
According to Cook, students trained on the importance of ratings and given information and
opportunity to provide quality ratings, do so with regularity.
Student Evaluations 20
Cook (1989) hypothesized that ratings following rater training showed less leniency and halo
error without rater training. Five weeks before the end of a regular semester course, student raters
listened to a 15-minute presentation on leniency and halo effect and were given a copy of the
rating instrument to review. In addition, the presentation stressed the importance and benefit of
student evaluations. The students retained the evaluation instrument until the end of the course
and then completed their evaluations. A control group of raters received no training and no
evaluation instruments prior to the day of evaluation. Leniency was lower on all six evaluation
scales for students who received training than for students who did not. In addition, there was
less halo error in the trained ratings. Cook stated that (1) the training session was effective in
reducing leniency and halo error; and (2) rater training could be used to reduce psychometric
error in student evaluations of teacher performance.
Ideally, educators agree, there should be multiple sources of feedback to facilitate effective
teaching. Rifkin (1995) suggested a combination of self-evaluation, peer review, evidence of
student achievement, administrator and alumni evaluations, and finally, student evaluations. A
holistic approach to teacher evaluations, that is multiple sources and types of data, should yield a
more objective and complete picture of the teaching-learning environment and the teacher in
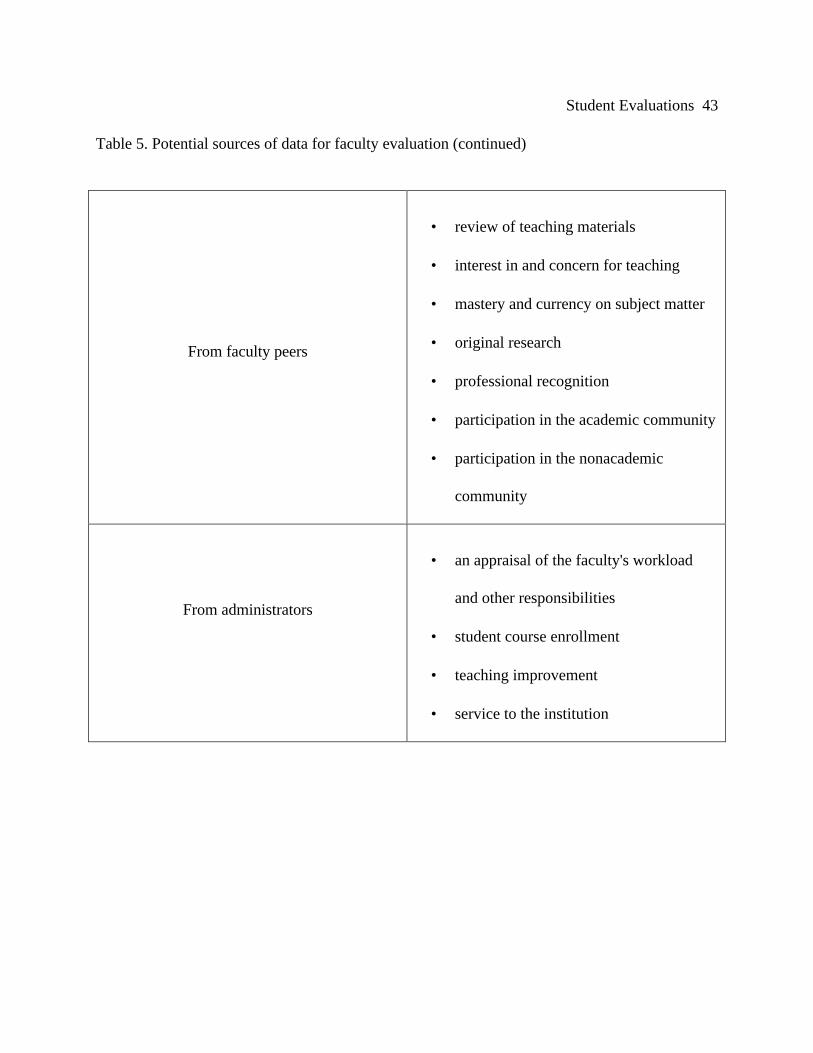
question. Seldon and Angelo (1994) suggested the collection of specific data from four different
evaluative sources: students, faculty, faculty peers, and administrators (see Table 5).
[Place Table 5 about here]
Student evaluations are included in another assessment alternative: the teaching portfolio.
Many colleges and universities see portfolios as a more credible means of assessment (Defina,
1996; Rifkin, 1995). A teacher portfolio would include a narrative section that identifies the
Student Evaluations 21
teacher's goals and philosophy of education. In collaboration with peers and department chairs,
teachers describe, in writing, responsibilities, performance standards, course syllabi, instructional
techniques, professional development and self-improvement activities. In addition, evidence of
teaching effectiveness and student achievement should be included. Portfolios, updated annually,
are reflective of change, growth, and general improvements taking place from year to year.
Another issue is when to collect evaluation data. Evaluations most often occur at the end of a
course. Students do not see the benefits of their evaluations, and often instructors must wait to
implement any recommended changes (Davis, 1995; Stockham & Amann, 1994; Timpson,
1997). Davis suggested periodic evaluations administered during the fourth, eighth. and twelfth
weeks of a course. Evaluation instruments might focus on such topics as understanding course
objectives and their relevance, perception of the organization and presentation of material,
attitudes toward grading and testing, and teacher perceptions. This strategy gives not only
periodic feedback, but an opportunity for students to witness the effect of their evaluations on the
teaching-learning process.
A relatively new method of formative student evaluation, labeled facilitated student feedback,
provides for student assessment of instructors at midcourse via a collaborative effort between
student and teacher (Stockham & Amann, 1994). This feedback process is divided into four
steps: 1) facilitator selection and preparation; 2) class brainstorming/feedback session; 3)
facilitators report; and 4) teacher's response. During facilitated student feedback, student
brainstorming helps to generate ideas that are then written before providing verbal responses to
the facilitator.
Student Evaluations 22
In addition to providing midcourse evaluations, facilitated student feedback increases teacher
rapport with students, allows students to see that others have similar problems, and presents the
teacher as a partner in the teaching/learning process, rather than as an adversary (Stockham &
Amann, 1994).
Abbott, Wulff, Nyquist, Ropp, and Hess (1990) employed Small Group Instructional
Diagnosis (SGID) to determine student opinion regarding the effectiveness of student evaluations
on the teaching-learning process. SGID also employs the facilitator approach. A facilitator met
first with small groups of students at the midterm of a college course to identify relevant
instructional issues. These student concerns were reported by the facilitator to the instructor and
at the following class meeting, the instructor responded to the students' concerns and comments.
Since many colleges are committed to collecting students opinions of teaching and learning
with standardized evaluation forms at the end of a course, Abbott et. al. (1990) compared student
satisfaction of a midterm, facilitated interview evaluation with the widely accepted traditional
evaluation method. Students preferred midterm evaluations, in any form, over end-of-term
evaluations. Students were most satisfied with midterm student interviews followed by an
extended teacher response and least satisfied with standardized questionnaires administered at
the end of the term.
As the shift into the information age progresses, it is logical to expect a variety of computer-
based student evaluation instruments to appear on the scene. Divoky (1995) has developed a
program that employs microcomputers to collect and evaluate the data for student evaluations.
Divoky described this data collection method as efficient and practical. Thinking back to
Scriven's (1995) warning about long, boring evaluations, the concept of computer-based
Student Evaluations 23
evaluations fits the parameters of quick, easy, and familiar. This technology also allows for the
generation of individualized evaluation instruments (Davis, 1995).
Divoky's (1995) interactive teaching evaluation is comprised of two phases. In phase I, each
student develops and uses an individualized evaluation instrument. One hundred fifty evaluation
statements, derived from 20 years of research in the field of student evaluations, were grouped
according to teaching and classroom dimensions. Thirteen categories were defined.
The evaluation process begins with students reviewing the thirteen categories and selecting
those that they wanted to use in the evaluation of a specific class and instructor. Students were
also asked to provide a performance and an importance measure for each item. These measures
are based on a ten point Likert-type scale. The selected items were stored and tabulated. This
completed Phase I of the process.
During Phase II, students reviewed the newly formatted database. Item listed were presented
and students were asked to vote on which items should be retained. Voting continued until a
majority was reached. Performance and importance factors were also selected and then approved
by a majority.
Students responded in a positive manner to this evaluation tool. They liked seeing what other
students deemed important concerning effective teaching and often asked if they could submit
their own items to be included in the data base. Although the voting process was time
consuming, it helped to produce a unique instrument for a unique setting, thereby increasing the
value of the diagnostic material it provided (Cook, 1989).
Regardless of student training, or the timing or format of the student evaluations, the question
of what type of evaluation questions, formative or summative, still remains. d'Apollonia and
Student Evaluations 24
Abrami (1997) stated that student ratings of instruction measure general instructional skill, which
is in fact a composite of subskills "of what the rater believes is all the relevant information
necessary for making accurate ratings" (Nathan & Tippins, 1990, p. 291). In contrast to Marsh
(1993), these researchers believe that global ratings or a simple score representing General
Instructional Skill should be used for summative evaluations. Moreover, specific ratings of
instructors' effectiveness add little to the explained variance beyond that provided by global
ratings (Cashin & Downey, 1992; Hativa & Raviv, 1993).
Cashin and Downey (1992) proposed the utilization of two global items for summative
purposes: one to evaluate the instructor and the second evaluating the course. They found that
such items accounted for more than 50% of the variance of weighted-composite criterion. They
suggest that students respond to two global questions for summative purposes (using a 5-point
Likert scale of 1 = definitely false and 5 = definitely true):
1. Overall, I rate this INSTRUCTOR an excellent teacher;
2. Overall, I rate this an excellent COURSE.
Abrami (1989) compared Marsh's multidimensional factor scores with his idea of overall or
total ratings. Abrami viewed both ratings as multidimensional, but stated that they should relate
to effectiveness criteria differently. Global ratings correlate more highly with student learning
than do factor scores, with the exception of teaching skill, which is a fairly global rating factor
itself. Bias appeared to be no more severe in global ratings than with factor scores, although the
rationale for the bias is more difficult to discern.
In summary, both instructors and students found formative evaluations more suited to an
ongoing interactive feedback mechanism that facilitated modifications to teaching and course
Student Evaluations 25
content. Both Abrami (1989) and Marsh (1993) agree that global items are not valuable for
formative evaluations. Additionally, they agree that weighted factor scores are superior to
unweighted factor scores or individual item ratings.
While a host of concerns address the improvement of student evaluations of teachers, the
primary concern remains how to use specific evaluative techniques. If formative evaluation is the
goal, then multidimensional analysis containing weighted factor scores would be the method of
evaluation. On the other hand, global questions would prove suitable and even preferable for
summative evaluations. Finally, as noted by several researchers (e.g., L'Hommedieu, Menges &
Brinko, 1990; Murray, Rushton, and Paunonen, 1990), one must always determine the reliability,
validity, and utility of the evaluative instrument at the local institution at which it is used.
L'Hommedieu et al. (1990) see little use to widening the scope of evaluation instruments. Rather,
replication in this area is important for the purpose of establishing the usefulness of student
ratings for instructional improvement. However, this is directly opposite the approach utilized at
North Carolina State University (1994). At that institution individual department faculties both
determined the design of the instrument as well as its use, either formative or summative.
Conclusions
As discussed in this paper, student opinion continues to be a major factor in the evaluation of
teacher effectiveness at institutions of higher education. Regardless of the weight of such
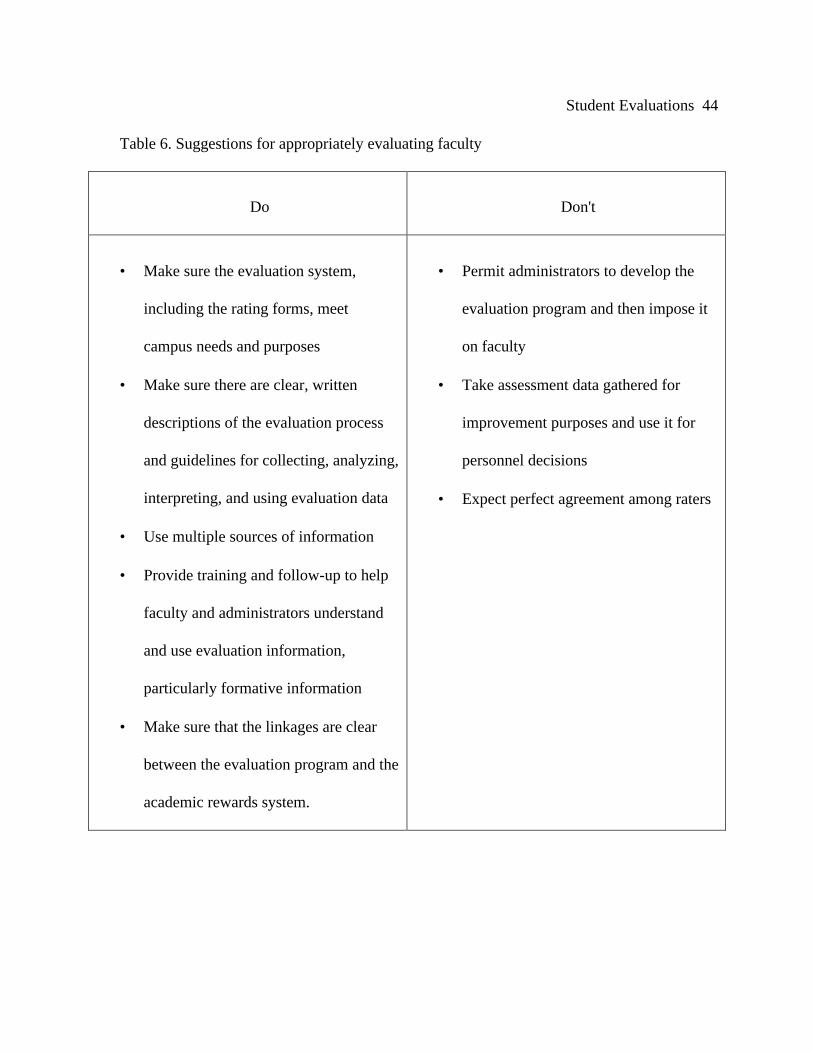
evaluations, or the form they take, we would be wise to consider the warnings and suggestions
offered by Seldin and Angelo (1997) concerning the development and administration of student
evaluations. They warn that the entire evaluation system, including any rating forms, should be
designed to meet a specific set of specific purposes and needs and should have a clear connection
Student Evaluations 26
to the academic rewards system. Faculty should be involved in the development of the entire
process as they are likely to be skeptical and are more likely to utilize data if they assist in the
development process (see Table 6).
[Place Table 6 about here]
Student ratings add a valuable component to the range of feedback for the evaluation of
effective teaching. Based on the work with the SEEQ, Marsh and Roche (1997) summarized
student evaluations as:
1) multidimensional;
2) reliable and stable
3) primarily a function of the instructor who teaches the course rather than the course;
4) relatively valid against a variety of indicators of effective teaching;
5) relatively unaffected by a variety of variables hypothesized as potential biases (e.g.,
grading leniency, class size, workload, prior subject interest); and
6) useful in improving teaching effectiveness when coupled with appropriate consultation.
In a review of the literature, McKeachie (1997) determined Marsh's work on
multidimensionality is correct when the goal is formative evaluation for instructional
improvement. However, he agrees with d'Apollonia and Abrami (1997) that a single global rating
is more appropriate for summative evaluations made by personnel committees. Regardless of the
type of evaluation questions used, Marsh and Roche (1997) and Murray et al. (1990) found
support for the need to consult on specific teaching behaviors if improvement is to be made.
Corrections and improvement can be facilitated by providing evaluations early in the learning
process to aid instructors in making corrections.
Student Evaluations 27
Finally, according to McKeachie (1997), the burden of appropriate administration and use of
evaluative tools falls on the shoulders of the personnel committee. The personnel committee
should never be concerned with comparing teachers, but rather should use student evaluations to
measure teaching effectiveness.
Two issues that can be addressed by the institution itself are grading inflation and class size.
McKeachie (1997) suggested that grading inflation bias may be a function of the type of
institution and should be a concern of the personnel committee. Additionally, if effective
teaching is more likely to take place in smaller classes, then the personnel committee can again
address this issue, if indeed effective teaching is their ultimate goal.
To reiterate what was presented earlier, the generation of evaluative scores may not be a real
problem facing personnel committees. Rather, it is the use of these ratings by said committees
that is, in fact, the larger problem that must be addressed. When and how student evaluations are
used in the decision process by personnel committees is the major concern; not what necessarily
composes the evaluation.
Student evaluation of teachers is just one component of an important process. Most higher
education faculty believe that the teaching-learning process is an active, ever-changing
interaction between the student, teacher, and environment (input and process within context) that
should be focused on a particular outcome. It is therefore reasonable to expect students to make
important contributions to this system and it is imperative that teachers be receptive to student
feedback. However, there is no one correct method of teaching (Joyce & Weil, 1996). In fact,
teaching and learning are contextual by nature, with different methods showing superiority for
different outcomes and different students. This diversity of student characteristics, faculty
Student Evaluations 28
objectives and preferred teaching methods, and institutional contexts must be considered when
developing the evaluation process.
Student Evaluations 29
References
Abbott, R. D., Wulff, D. H., Nyquist, J. D., Ropp, V. A., & Hess, C. W. (1990). Satisfaction
with processes of collecting student opinions about instruction: The student perspective. Journal
of Educational Psychology, 82(2), 201-206.
Abrami, P. C. (1989). How should we use student ratings to evaluate teaching? Research in
Higher Education. 80(2), 221-227.
Abrami, P. C., d'Apollonia, S., & Cohen, P. (1990). Validity of student ratings of instruction:
What we know and what we do not. Journal of Educational Psychology, 82(2), 219-231.
Abrami, P. C., Leventhal, L., & Perry, R. P. (1982). Educational seduction. Review of
Educational Research, 52, 446-464.
Aleamoni, L. M. (1981). Student ratings of instruction. In J. Millman (Ed.). Handbook of
teacher evaluation (pp. 110-145). Beverly Hills, CA: Sage.
Boggs, C. (1995). Gender bias in teaching evaluations: Insights offered by communication
research. (ERIC Document Reproduction Service No. ED387848)
Boyer, E.,& Rice, E. (1990). The new American scholar. Princeton, NJ: Carnegie Foundation
for the Advancement of Teaching.
Cashin, W. E.,& Downey, R. G. (1992). Using global student ratings items for summative
evaluations. Journal of educational Psychology, 84(4), 563-572.
Cohen, P. A. (1981). Student ratings of instruction and student achievement: A meta-analysis
of multisection validity studies. Research in Higher Education, 51, 281-309.
Cook, S. (1989). Improving the quality of student ratings of instruction: A look at two
strategies. Research in Higher Education, 30 (1), 31-45.
Student Evaluations 30
Cranton, P., Smith, R. A. (1990). Reconsidering the unit of analysis: A model of student
ratings of instruction. Journal of Educational Psychology, 82(2), 207-212.
d'Apollonia, S., & Abrami, P. C. (1997). Navigating student ratings of instruction. American
Psychologist, 52(11), 1198-1208.
Davis, M. (1995, March). Staging a pre-emptive strike: Turning student evaluations of faculty
from threat to asset. Paper presented at the annual meeting of the Conference on College
Composition and Communication. Washington, DC.
Defina, A. (1996). An effective alternative to faculty evaluation: The use of the teaching
portfolio. (ERIC Document Reproduction Service No. ED394561)
Divoky, J. (1995). Eliciting teaching evaluation information interactively. Journal of
Education for Business, 70, (6), 317-32.
Eley, M.,& Stecher, E. (1997). A comparison of two response scale formats used in teaching
evaluation questionnaires. Assessment and Evaluation in Higher Education, 22, (1), 65-70.
Feldman, K. A. (1988). Effective college teaching from the students' and faculty's view:
Matched or mismatched priorities? Research in Higher Education, 28(4), 291-344.
Feldman, K. A. (1989). Instructional effectiveness of college teachers as judged by teachers
themselves, current and former students, colleagues, administrators, and external (neutral)
observers. Research in Higher Education, 30(2), 137-169.
Freeman, H. (1994). Student evaluations of college instructors: Effects of type of course,
gender and gender role, and student gender. Journal of Educational Psychology, 86, (4), 627-630.
Frey, P. W. (1979). The Dr. Fox effect and its implications. Instructional Evaluation, 3, 1-5.
Student Evaluations 31
Gage, N. L.,& Berliner, D. C. (1992). Educational psychology, (5th ed.). Boston, MA:
Houghton, Mifflin Company.
Gigliotti, R. J., & Buchtel, F. S. (1990). Attributional bias and course evaluations. Journal of
Educational Psychology, 82(2), 341-351.
Greenwald, A. G. (1997). Validity concerns and usefulness of student ratings of instruction.
American Psychologist, 52(11), 1182-1186.
Greenwald, A. G., & Gilmore, G. (1997). Grading leniency is a removable contaminant of
student ratings. American Psychologist, 52(11), 1209-1217.
Harrison, P. D., Ryan, J. M., & Moore, P. (1996), College students' self-insight and common
implicit theories of rating of teaching effectiveness. Journal of Educational Psychology, 88, (4),
775-782.
Hativa, N. (1996). University instructors' ratings profiles: Stability over time, and disciplinary
differences. Research in Higher Education, 37, (3), 341-365.
Hativa, N., & Raviv, A. (1993). Using a single score for summative evaluation by students.
Research in Higher Education, 34, 625-646.
Hendrix, K. G. (1995, November). Student perceptions of the influence of race on professor
credibility. Paper presented at the annual meeting of Speech Communication Association. San
Antonio, Texas.
Huitt, W. (1995). A systems model of the teaching/learning process. Educational Psychology
Interactive. Valdosta, GA: College of Education, Valdosta State University. Available online:
[http://www.valdosta.edu/~whuitt/psy702/sysmdlhb.html]
Joyce, B., & Weil, M. (1996). Models of teaching (5th ed.). Boston: Allyn & Bacon.
Student Evaluations 32
L'Hommedieu, R., Menges, R., & Brinko, K. Methodological explanations for the modest
effects of feedback from student ratings. Journal of Educational Psychology, 82(2), 232-240.
Marsh, H. W. (1981). The use of path analysis to estimate teacher and course effects on
student ratings of instrument effectiveness. Applied Psychological Measurement, 6. 47-60.
Marsh, H. W. (1983). Multidimensional ratings of teaching effectiveness by students from
different academic settings and their relation to student/course/instructor characteristics. Journal
of Educational Psychology, 75, (1), 150-166.
Marsh, H. W. (1984). Students' evaluations of university teaching: Dimensionality, reliability,
validity, potential biases, and utility. Journal of Educational Psychology, 76, (5), 707-754.
Marsh. H. W. (1993). Multidimensional students' evaluations of teaching effectiveness.
Journal of Higher Education, 64, (1), 1-18.
Marsh, H. W., & Bailey, M. (1993). Multidimensionality of students' evaluation of teaching
effectiveness: A profile analysis. Journal of Higher Education, 64, (1), 1-15.
Marsh, H. W., & Hocevar, D. (1984), The factorial invariance of students' evaluations of
college teachers. American Educational Research Journal, 21, 341-366.
Marsh, H. W., & Overall, J. U. (1979). Long-term stability of students' evaluations. Research
in Higher Education, 10, 139-147.
Marsh, H. W., & Roche, L. A. (1997). Making students' evaluations of teaching effectiveness
effective: The critical issues of validity, bias, and utility. American Psychologist, 52(11), 1187-
1197.
Student Evaluations 33
Marsh, H. W., & Ware, J. E. (1982). Effects of expressiveness, content coverage, and
incentive on multidimensional student rating scales. Journal of Educational Psychology, 74, 126-
134.
Mateo, M. A., & Fernandez, J. (1996). Incidence of class size on the evaluation of university
teaching quality. Educational and Psychological Measurement, 56, (5), 771-778.
McIlrath, D., & Huitt, W. (1995, December). The teaching-learning process: A discussion of
models. Educational Psychology Interactive. Valdosta, GA: Valdosta State University. Available
online: [http://www.valdosta.edu/~whuitt/psy702/files/modeltch.html]
McKeachie, W. J. (1973). Correlates of students' ratings. In A. L. Sockloff (Ed.).
Proceedings: The first invitational conference on faculty effectiveness evaluated by students (pp.
213-218). Temple University.
McKeachie, W. J. (1990). Research on college teaching: The historical background. Journal
of Educational Psychology, 82(2), 189-200.
McKeachie, W. J. (1997). Student ratings: The validity of use. American Psychologist,
52(11), 1218-1225.
Morris, T. L., Gorham, J., Stanley, H. C., & Huffman, D. (1996). Fashion in the classroom:
Effects of attire on student perceptions of instructors in college classes. Communication
Education, 45, (2), 135-147.
Murray, H. G., Rushton, J. P., & Paunonen, S. V. (1990). Teacher personality traits and
student instructional ratings in six types of university courses. Journal of Educational
Psychology, 82(2), 250-261.
Student Evaluations 34
Naftulin, D. H., Ware, J. E., & Donnelly, F. A. (1973). The Doctor Fox lecture: A paradigm
of educational seduction. Journal of Medical Education, 48, 630-635.
Nasser, F., & Glassman, D. (1997). Student evaluation of university teaching: Structure and
relationship with student characteristics. (ERIC Document Reproduction Service No. ED407390)
North Carolina State University handbook for advising and teaching. (1994). Available
online: [http://www2.ncsu.edu/ncsu/provost/info/hat/current/ch10/0105.html]
Paulsen, M. B., & Feldman, K. A. (1995). Taking teaching seriously: Meeting the challenge
of instructional improvement. (ERIC Document Reproduction Service No. ED396615)
Renaud, R. D., & Murray, H. G. (1996). Aging, personality, and teaching effectiveness in
academic psychologists. Research in Higher Education, 37, (3), 323-339.
Rifkin, T. (1995). The status and scope of faculty evaluation. (ERIC Reproduction Service
No. ED385315)
Ryan, J. M., & Harrison, P. D. (1995). The relationship between individual characteristics
and overall assessment of teaching effectiveness across different instructional contexts. Research
in Higher Education, 36, (5), 577-594.
Scriven, M. (1995). Student ratings offer useful input to teacher evaluations. (ERIC
Reproduction Service No. ED39824)
Seldin, P., & Angelo, T. A. (1997). Assessing and evaluating faculty: When will we ever
learn? (To use what we know). Proceedings of the AAHE 1997 Conference on Assessment and
Quality Assessing Impact: Evidence and Action.
Simpson, R. D. (1995). Uses and misuses of student evaluations of teaching effectiveness.
Innovative Higher Education, 20, (1), 3-5.
Student Evaluations 35
Stockham, S. L., & Amann, J. F. (1994). Facilitated student feedback to improve teaching
and learning. Journal of Veterinary Medicine, 21, (2), 51-55.
Timpson, W. W. (1997). Rethinking student evaluations and the improvement of teaching:
Instruments for change at the University of Queensland. Journal of Higher Education, 22, (1), 55-
65.
Ware, J. E., & Williams, R. G. (1979). Seeing through the Dr. Fox effect: A response to Frey.
Instructional Evaluation, 3, 6-10.
Whitely, S. E., & Doyle, K. O. (1976). Implicit theories in student ratings. American
Educational Research Journal, 13, 241-253.
Wright, P., & Rip, P. D. (1981). Retrospective reports on the causes of decisions. Journal of
Personality and Social Psychology, 40.
Student Evaluations 36
Table 1. Percentage of studies appraising student ratings of instruction as valid, biased, or neither
Years #Studies
%
Perceived as
Valid
%
Perceived as
Biased
%
Perceived as
Neither
1971-1975 21 43 24 33
1976-1980 71 35 21 44
1981-1985 44 57 7 36
1986-1990 28 50 7 43
1991-1995 5 50 12 38
Student Evaluations 37
Table 2. Evaluation items included in the Students' Evaluations of Educational Quality (SEEQ)
Dimension Subgroups (Items)
Learning/Value
• Learned something valuable
• Increased subject interest
• Learned/understood subject matter
• Overall course rating
Enthusiasm
• Enthusiastic about teaching
• Dynamic & energetic
• Teaching style held interest
• Overall instructor rating
Organization
• Instructor explanations clear
• Course materials prepared & clear
• Objectives stated & pursued
• Lectures facilitated note taking
Group Interaction
• Encouraged class discussion
• Students shared ideas/knowledge
• Encouraged question & answers
• Encouraged expression of ideas
Student Evaluations 38
Table 2. Evaluation items included in the SEEQ (continued)
Individual Rapport
• Friendly towards students
• Welcomed seeking help/advise
• Interested in individual student
• Accessible to students
Breadth of Coverage
• Contrasted implications
• Gave background of ideas & concepts
• Gave different points of view
• Discussed current developments
Examination/Grading• Examination feedback valuable
• Evaluation methods fair/appropriate
• Exams emphasized course content
Assignments• Reading/texts valuable
• Added to course understanding
Workload/Difficulty
• Course difficulty (easy-hard)
• Course workload (light-heavy)
• Course pace (too slow-too fast)
• Hours/weeks outside of class
Student Evaluations 39
Table 3. Relationships between students' evaluations of teaching effectiveness and background
characteristics
Background Characteristics Summary of Findings
Prior subject interestClasses with higher prior subject interest are rated more
favorably
Expected/actual grades
Classes expecting (or receiving) higher grades give somewhat
higher ratings. This may represent grading leniency or that
superior learning occurs.
Reason for taking courseElective courses and those with a high percentage taking a
course for general interest tended to be rated slightly higher.
Workload/difficultyHarder, more difficult courses that require more effort and time
are rated somewhat more favorably.
Class size
Mixed findings. Smaller classes are rated more favorably; some
find the effect limited to class discussions and individual
rapport.
Student Evaluations 40
Table 3. Relationships between students' evaluations of teaching effectiveness and background
characteristics (continued)
Instructor rank Little or no effect
Sex of instructor or student Little or no effect
Academic disciplineWeak tendency for higher ratings in humanities; lower ratings
in sciences.
Purpose of ratingsSomewhat higher ratings if known to be used for
tenure/promotion decisions.
AdministrationSomewhat higher ratings if surveys are not anonymous and
instructor is present when completed.
Student personalityLittle effect; different personality types appear in similar
numbers in different classes
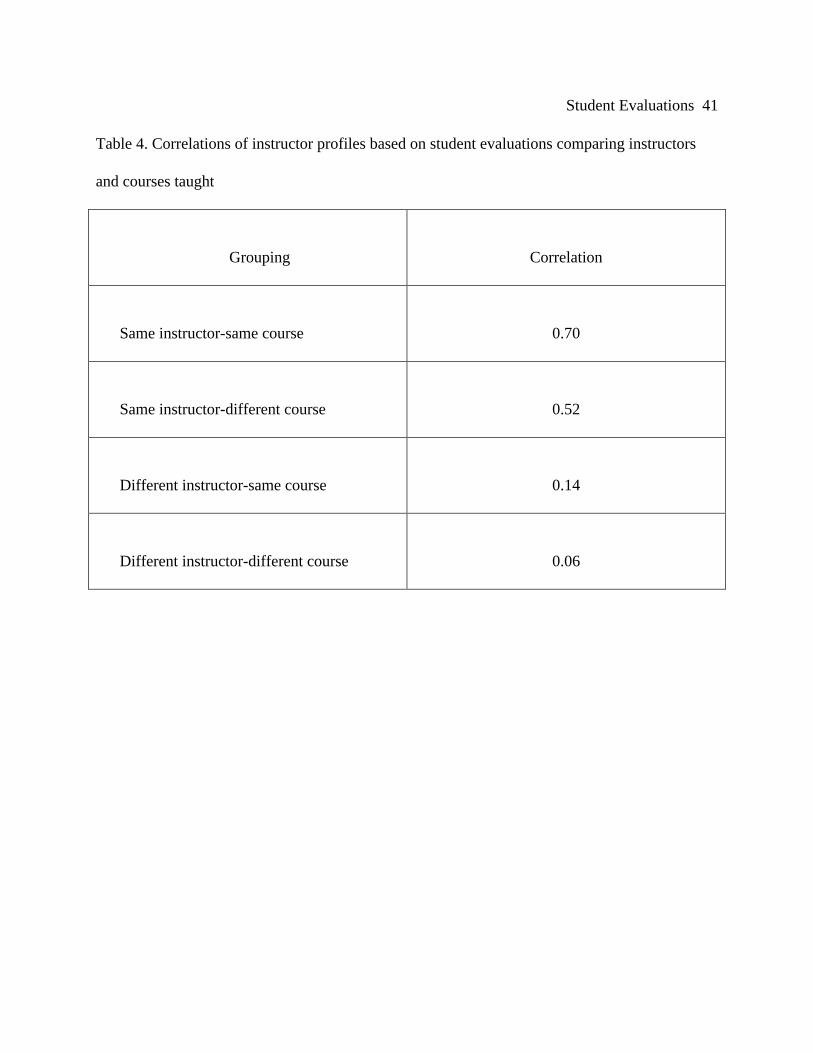
Student Evaluations 41
Table 4. Correlations of instructor profiles based on student evaluations comparing instructors
and courses taught
Grouping Correlation
Same instructor-same course 0.70
Same instructor-different course 0.52
Different instructor-same course 0.14
Different instructor-different course 0.06
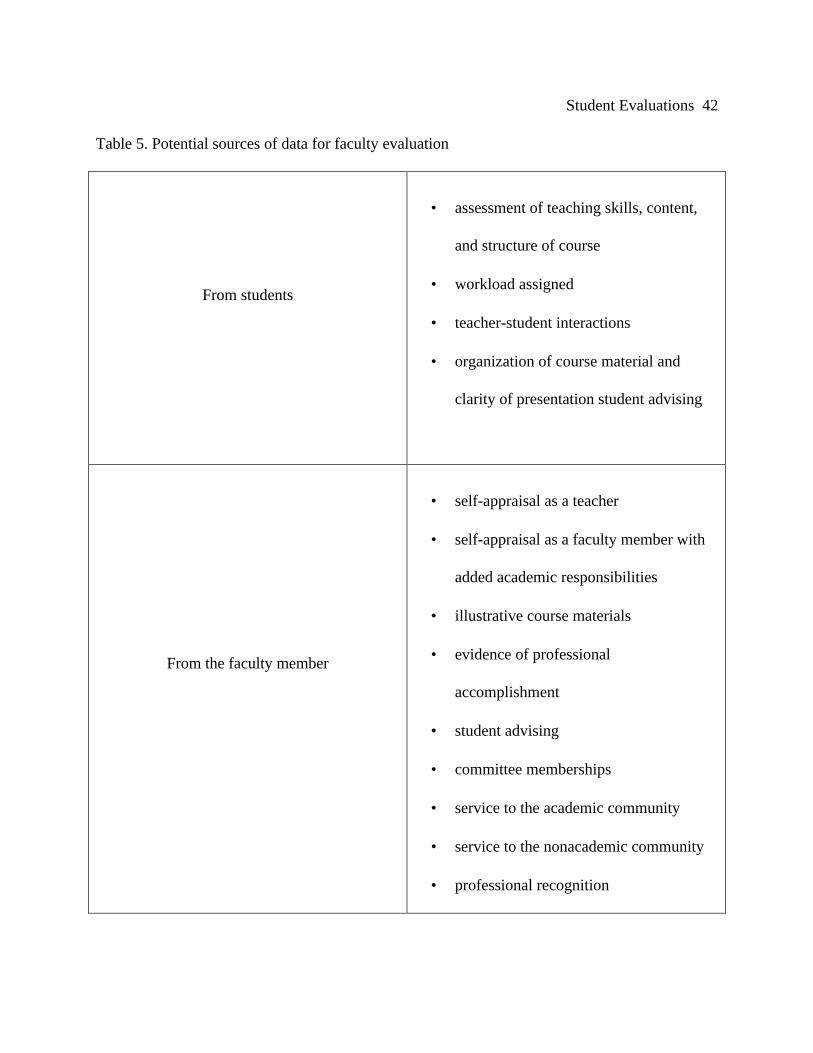
Student Evaluations 42
Table 5. Potential sources of data for faculty evaluation
From students
• assessment of teaching skills, content,
and structure of course
• workload assigned
• teacher-student interactions
• organization of course material and
clarity of presentation student advising
From the faculty member
• self-appraisal as a teacher
• self-appraisal as a faculty member with
added academic responsibilities
• illustrative course materials
• evidence of professional
accomplishment
• student advising
• committee memberships
• service to the academic community
• service to the nonacademic community
• professional recognition
Student Evaluations 43
Table 5. Potential sources of data for faculty evaluation (continued)
From faculty peers
• review of teaching materials
• interest in and concern for teaching
• mastery and currency on subject matter
• original research
• professional recognition
• participation in the academic community
• participation in the nonacademic
community
From administrators
• an appraisal of the faculty's workload
and other responsibilities
• student course enrollment
• teaching improvement
• service to the institution
Student Evaluations 44
Table 6. Suggestions for appropriately evaluating faculty
Do Don't
• Make sure the evaluation system,
including the rating forms, meet
campus needs and purposes
• Make sure there are clear, written
descriptions of the evaluation process
and guidelines for collecting, analyzing,
interpreting, and using evaluation data
• Use multiple sources of information
• Provide training and follow-up to help
faculty and administrators understand
and use evaluation information,
particularly formative information
• Make sure that the linkages are clear
between the evaluation program and the
academic rewards system.
• Permit administrators to develop the
evaluation program and then impose it
on faculty
• Take assessment data gathered for
improvement purposes and use it for
personnel decisions
• Expect perfect agreement among raters