Embed Size (px)
Citation preview
Student Focus Group Data: PersistenceStudent Focus Group Data: Persistence
Student Focus Group Student Focus Group DataData
Persistence: First Semester Persistence: First Semester to to
Second SemesterSecond Semester
Student Focus Group Data: PersistenceStudent Focus Group Data: Persistence
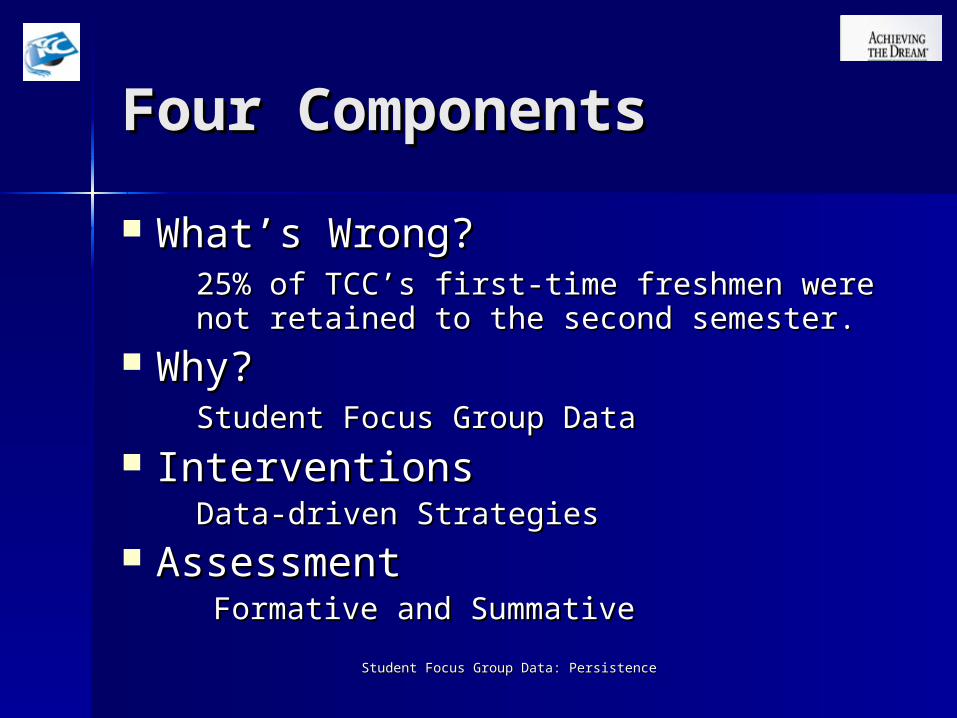
Four ComponentsFour Components
What’s Wrong?What’s Wrong?25% of TCC’s first-time freshmen were not 25% of TCC’s first-time freshmen were not retained to the second semester. retained to the second semester.
Why?Why?Student Focus Group DataStudent Focus Group Data
InterventionsInterventionsData-driven StrategiesData-driven Strategies
AssessmentAssessmentFormative and SummativeFormative and Summative
Student Focus Group Data: PersistenceStudent Focus Group Data: Persistence
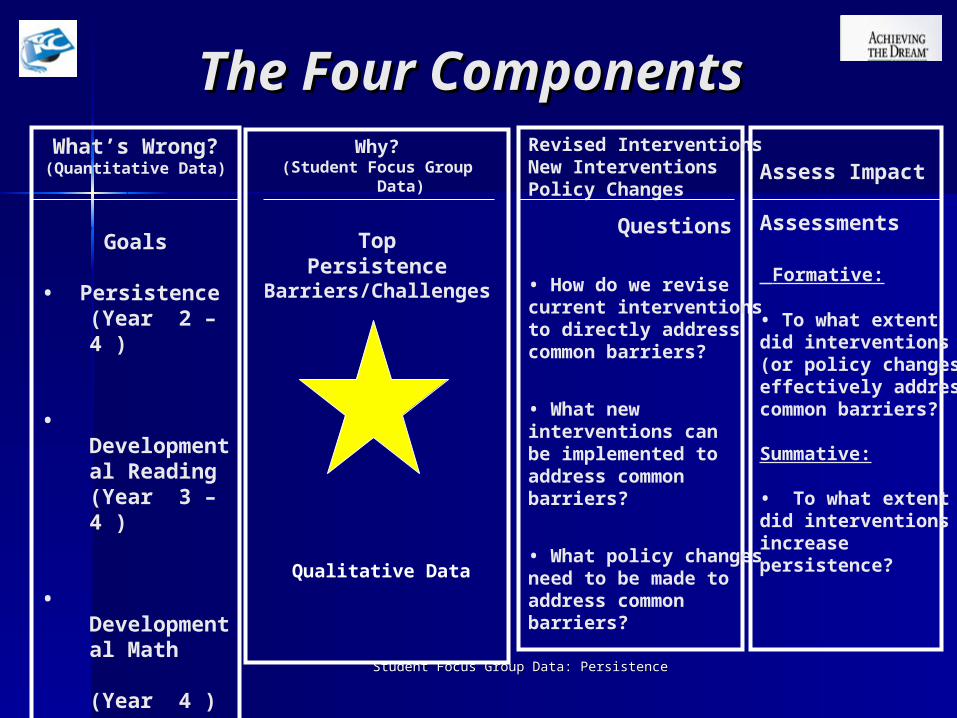
The Four ComponentsThe Four ComponentsWhat’s Wrong?(Quantitative Data)
Goals
• Persistence (Year 2 – 4 )
• Developmental Reading (Year 3 – 4 )
• Developmental Math (Year 4 )
Why?(Student Focus Group
Data)
TopPersistence
Barriers/Challenges
Revised InterventionsNew InterventionsPolicy Changes
Questions
• How do we revise current interventions to directly addresscommon barriers?
• What newinterventions canbe implemented toaddress commonbarriers?
• What policy changes need to be made to address common barriers?
Assess Impact
Assessments
Formative:
• To what extent did interventions(or policy changes)effectively addresscommon barriers?
Summative:
• To what extent did interventionsincrease persistence?Qualitative Data
Student Focus Group Data: PersistenceStudent Focus Group Data: Persistence
Student Focus Groups Demographics: Gender
72%
28%
59%
41%
Females Males
Focus Group AtD Cohort
Student Focus Group Data: PersistenceStudent Focus Group Data: Persistence
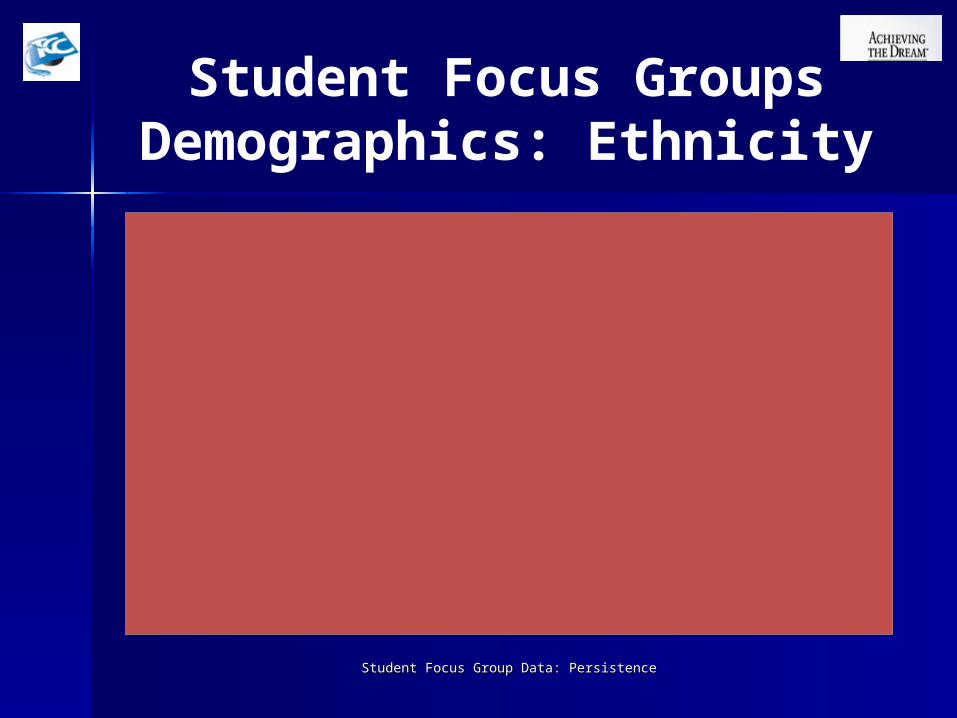
Student Focus Groups Demographics: Ethnicity
16%
1%
60%
2%
14%5%
10%2%
71%
4%11%
2%
AfricanAmerican
Asian Caucasian Hispanic NativeAmerican
Other
Focus Group AtD Cohort
Student Focus Group Data: PersistenceStudent Focus Group Data: Persistence
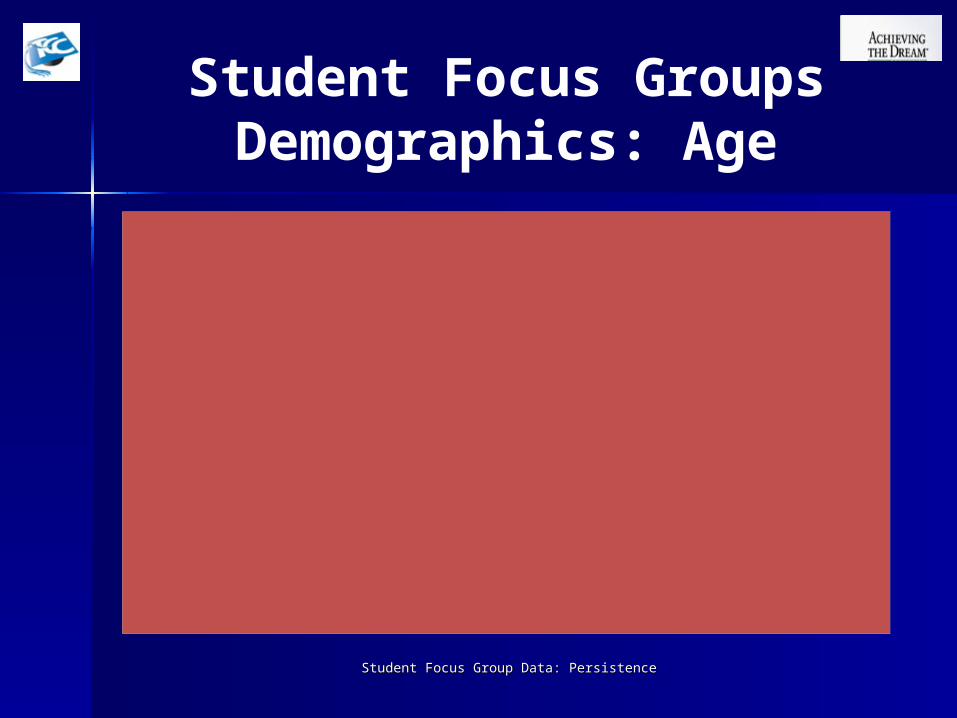
Student Focus Groups Demographics: Age
72%
8%2%
9% 9%
72%
12%7% 6% 3%
Under 21 21-24 25-29 30-39 40 and Older
Focus Group AtD Cohort
Student Focus Group Data: PersistenceStudent Focus Group Data: Persistence
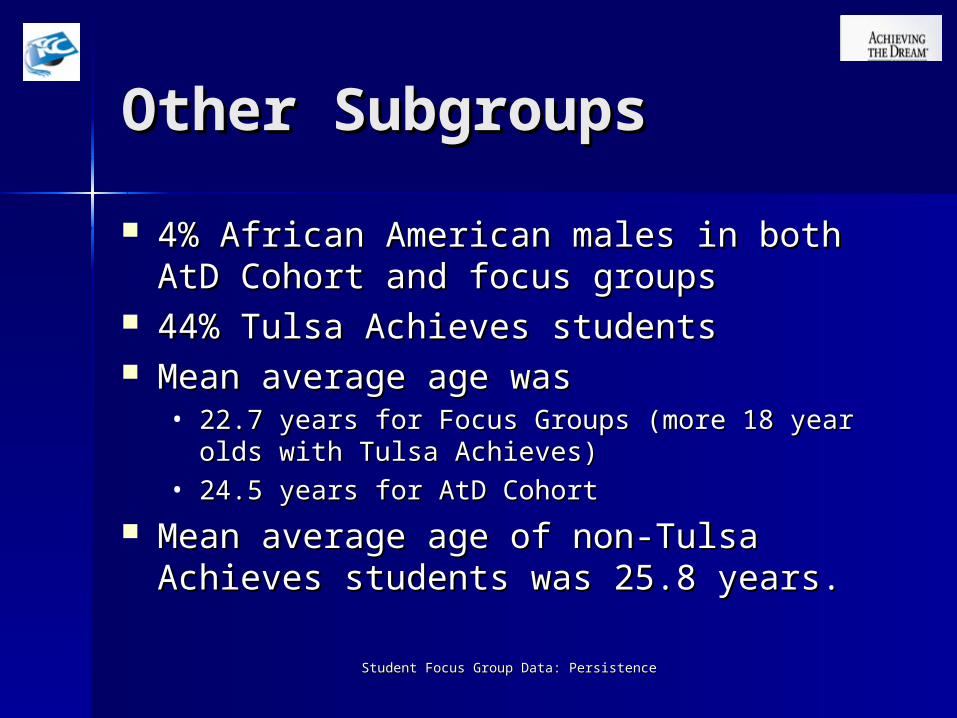
Other SubgroupsOther Subgroups
4% African American males in both AtD 4% African American males in both AtD Cohort and focus groupsCohort and focus groups
44% Tulsa Achieves students44% Tulsa Achieves students Mean average age was Mean average age was
• 22.7 years for Focus Groups (more 18 year olds 22.7 years for Focus Groups (more 18 year olds with Tulsa Achieves)with Tulsa Achieves)
• 24.5 years for AtD Cohort24.5 years for AtD Cohort
Mean average age of non-Tulsa Achieves Mean average age of non-Tulsa Achieves students was 25.8 years.students was 25.8 years.
Student Focus Group Data: PersistenceStudent Focus Group Data: Persistence
Definition of TermsDefinition of Terms
Student Focus GroupStudent Focus Group Barrier/ChallengeBarrier/Challenge FrequencyFrequency ClusterCluster
Student Focus Group Data: PersistenceStudent Focus Group Data: Persistence
Student Focus GroupsStudent Focus Groups
Three focus groups per campusThree focus groups per campus 12 total groups 12 total groups 101 total students101 total students Students volunteered and were Students volunteered and were
accepted if they had completed accepted if they had completed their first semester in Fall 2007 their first semester in Fall 2007 and had re-enrolled in Spring and had re-enrolled in Spring 2008. 2008.
Student Focus Group Data: PersistenceStudent Focus Group Data: Persistence
Barrier/ChallengeBarrier/Challenge
Barrier/ChallengeBarrier/Challenge
““All students experience barriers or All students experience barriers or challenges as they make their way challenges as they make their way toward graduation.”toward graduation.”
Common barriers include those Common barriers include those experienced at TCC and those experienced at TCC and those connected to life circumstances. connected to life circumstances.
Student Focus Group Data: PersistenceStudent Focus Group Data: Persistence
FrequencyFrequency
Barriers/Challenges - Frequency Barriers/Challenges - Frequency
• By Raw TotalBy Raw Total• By GroupBy Group• By CampusBy Campus
Student Focus Group Data: PersistenceStudent Focus Group Data: Persistence
ClusterCluster
Barriers seemed related to each Barriers seemed related to each other.other.
Data Team classified barriers into Data Team classified barriers into larger clusters or categories to larger clusters or categories to provide the best overall picture of provide the best overall picture of the data.the data.
Student Focus Group Data: PersistenceStudent Focus Group Data: Persistence
General FindingsGeneral Findings
No single barrier was mentioned in No single barrier was mentioned in every focus group on all four campuses.every focus group on all four campuses.
Many barriers occurred frequently and Many barriers occurred frequently and were identified on all four campuses.were identified on all four campuses.
Barriers specific to individual campuses Barriers specific to individual campuses did not occur frequently overall; College-did not occur frequently overall; College-wide barriers were identified far more wide barriers were identified far more frequently overall.frequently overall.
Student Focus Group Data: PersistenceStudent Focus Group Data: Persistence
Most Frequent Most Frequent Barriers/ChallengesBarriers/Challenges
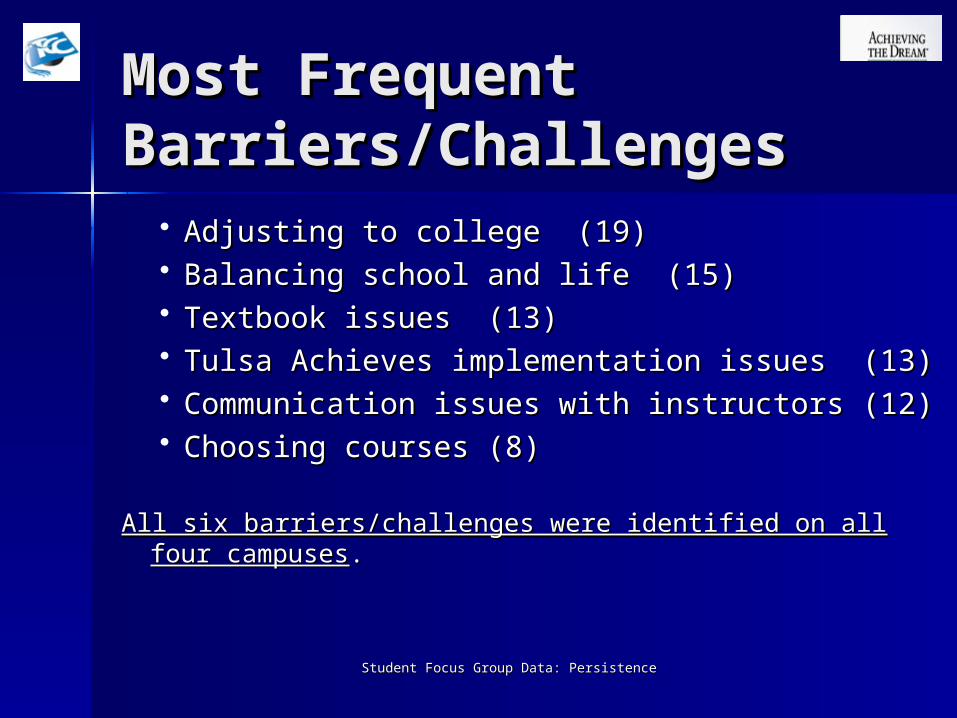
Adjusting to college (19)Adjusting to college (19) Balancing school and life (15)Balancing school and life (15) Textbook issues (13)Textbook issues (13) Tulsa Achieves implementation issues (13)Tulsa Achieves implementation issues (13) Communication issues with instructors (12)Communication issues with instructors (12) Choosing courses (8)Choosing courses (8)
All six barriers/challenges were identified on all four All six barriers/challenges were identified on all four campusescampuses..
Student Focus Group Data: PersistenceStudent Focus Group Data: Persistence
Specific FindingsSpecific Findings
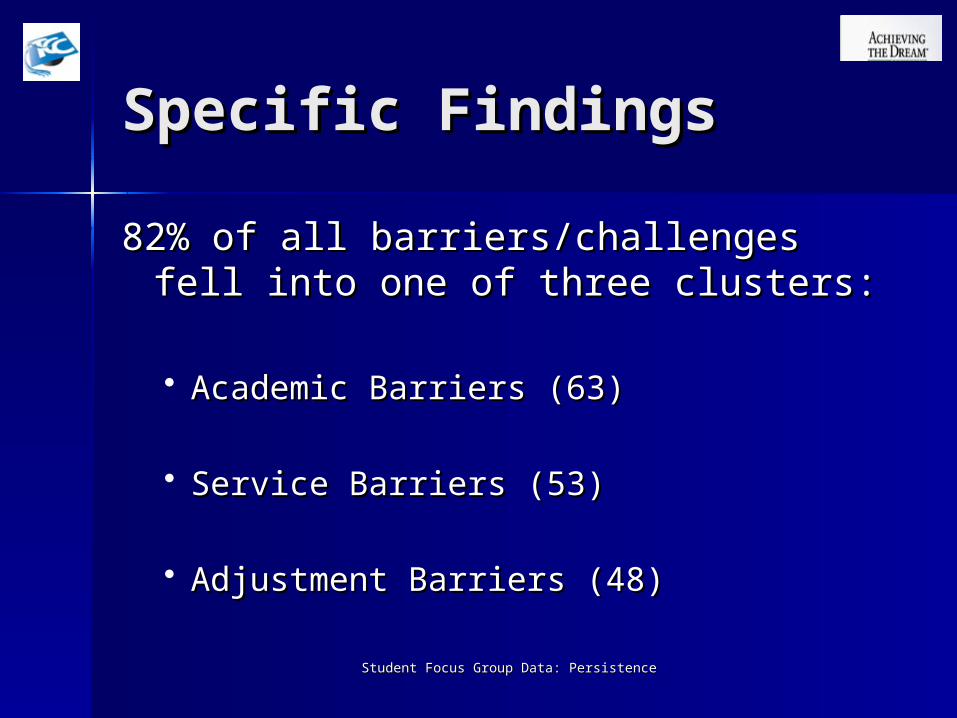
82% of all barriers/challenges fell 82% of all barriers/challenges fell into one of three clusters:into one of three clusters:
Academic Barriers (63)Academic Barriers (63)
Service Barriers (53)Service Barriers (53)
Adjustment Barriers (48)Adjustment Barriers (48)
Student Focus Group Data: PersistenceStudent Focus Group Data: Persistence
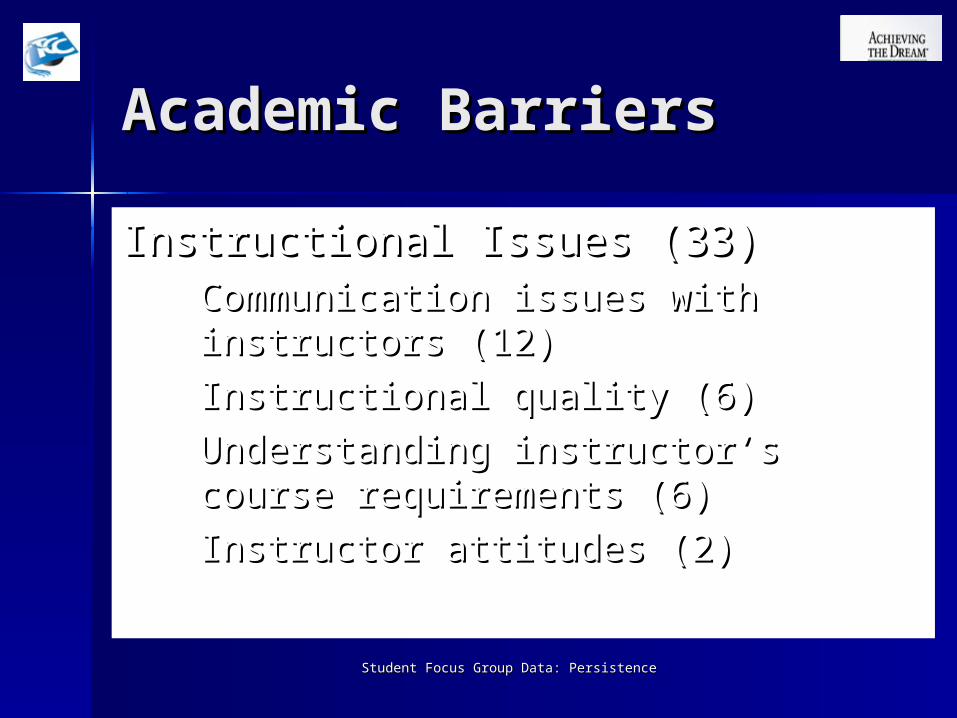
Academic Barriers (63)Academic Barriers (63)
63 Academic Barriers were grouped 63 Academic Barriers were grouped into two types:into two types:
• Instructional Issues (33)Instructional Issues (33)
• Student Issues (30)Student Issues (30)
Student Focus Group Data: PersistenceStudent Focus Group Data: Persistence
Academic BarriersAcademic Barriers
Instructional Issues (33)Instructional Issues (33)• Communication issues with instructors Communication issues with instructors
(12)(12)• Instructional quality (6)Instructional quality (6)• Understanding instructor’s course Understanding instructor’s course
requirements (6)requirements (6)• Instructor attitudes (2)Instructor attitudes (2)
Student Focus Group Data: PersistenceStudent Focus Group Data: Persistence
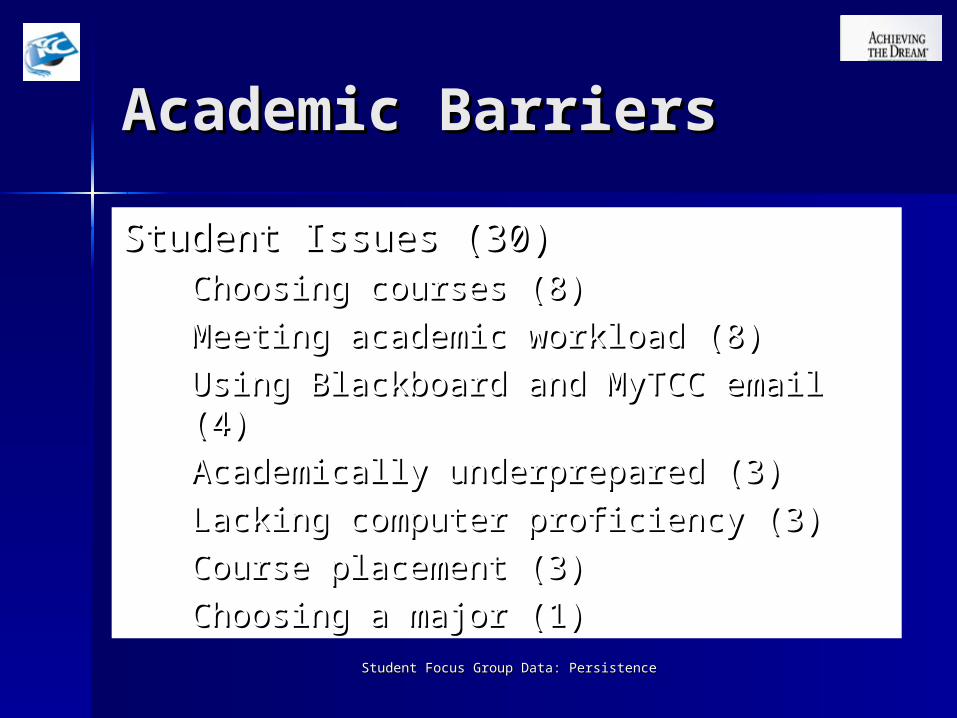
Academic BarriersAcademic Barriers
Student Issues (30)Student Issues (30)• Choosing courses (8)Choosing courses (8)• Meeting academic workload (8)Meeting academic workload (8)• Using Blackboard and MyTCC email (4)Using Blackboard and MyTCC email (4)• Academically underprepared (3)Academically underprepared (3)• Lacking computer proficiency (3)Lacking computer proficiency (3)• Course placement (3)Course placement (3)• Choosing a major (1)Choosing a major (1)
Student Focus Group Data: PersistenceStudent Focus Group Data: Persistence
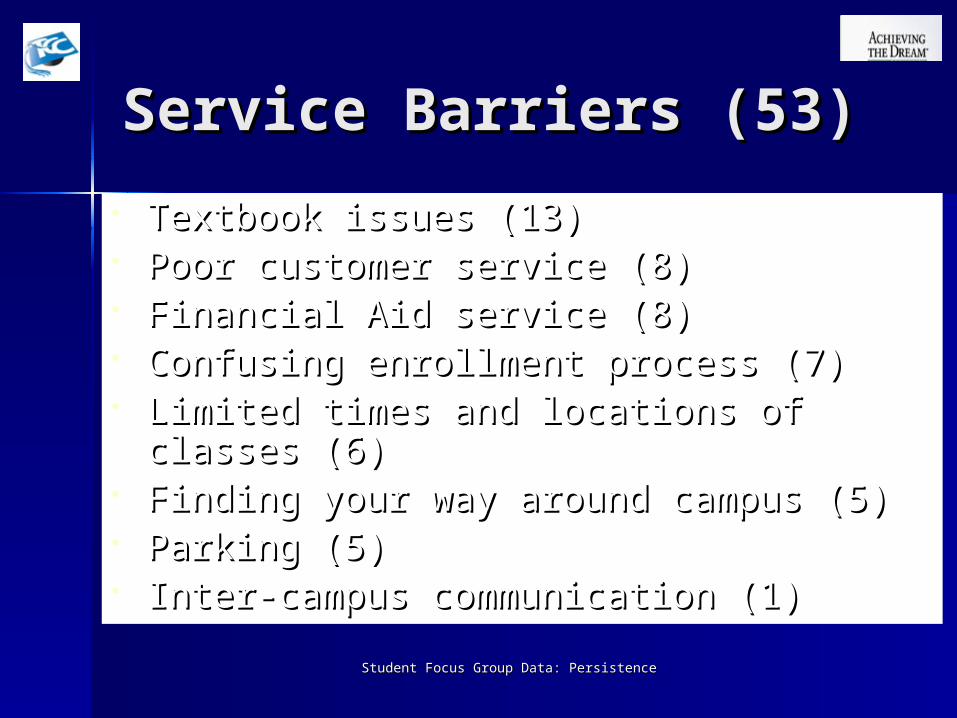
Service Barriers (53)Service Barriers (53)
Textbook issues (13)Textbook issues (13) Poor customer service (8)Poor customer service (8) Financial Aid service (8)Financial Aid service (8) Confusing enrollment process (7)Confusing enrollment process (7) Limited times and locations of classes (6)Limited times and locations of classes (6) Finding your way around campus (5)Finding your way around campus (5) Parking (5)Parking (5) Inter-campus communication (1)Inter-campus communication (1)
Student Focus Group Data: PersistenceStudent Focus Group Data: Persistence
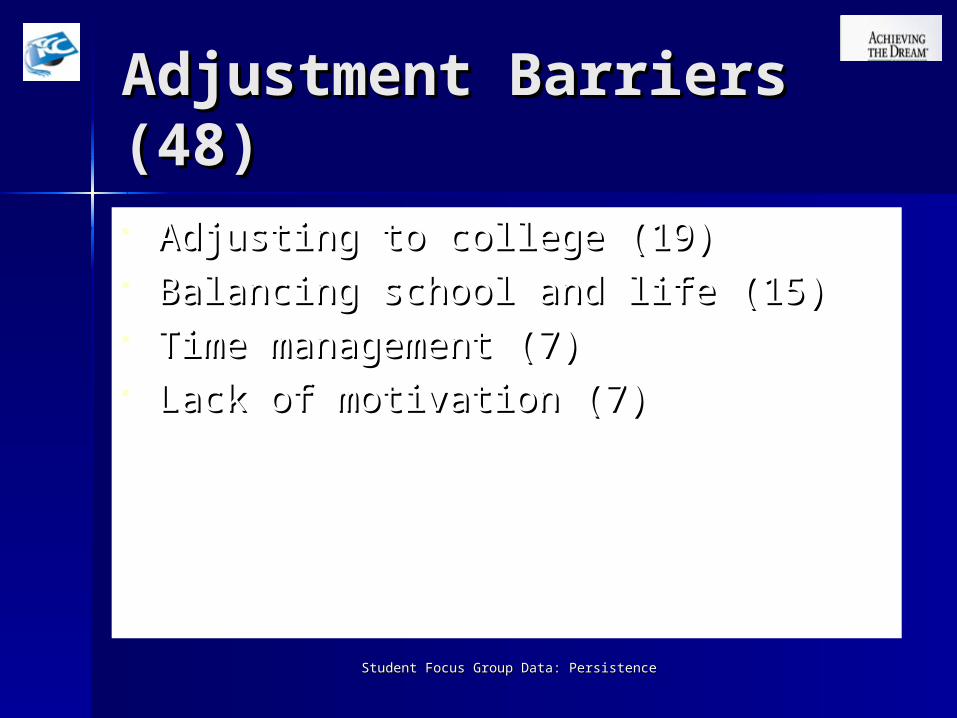
Adjustment Barriers Adjustment Barriers (48)(48) Adjusting to college (19)Adjusting to college (19) Balancing school and life (15)Balancing school and life (15) Time management (7)Time management (7) Lack of motivation (7)Lack of motivation (7)
Student Focus Group Data: PersistenceStudent Focus Group Data: Persistence
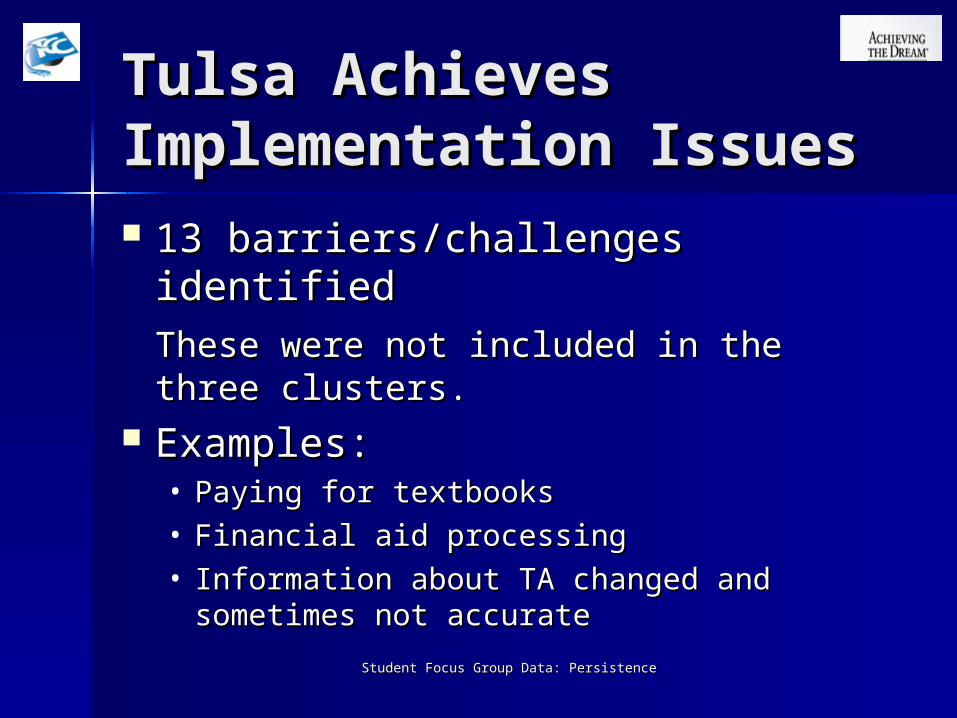
Tulsa Achieves Tulsa Achieves Implementation IssuesImplementation Issues 13 barriers/challenges identified13 barriers/challenges identified
These were not included in the three These were not included in the three clusters.clusters.
Examples:Examples:• Paying for textbooksPaying for textbooks• Financial aid processingFinancial aid processing• Information about TA changed and Information about TA changed and
sometimes not accuratesometimes not accurate
Student Focus Group Data: PersistenceStudent Focus Group Data: Persistence
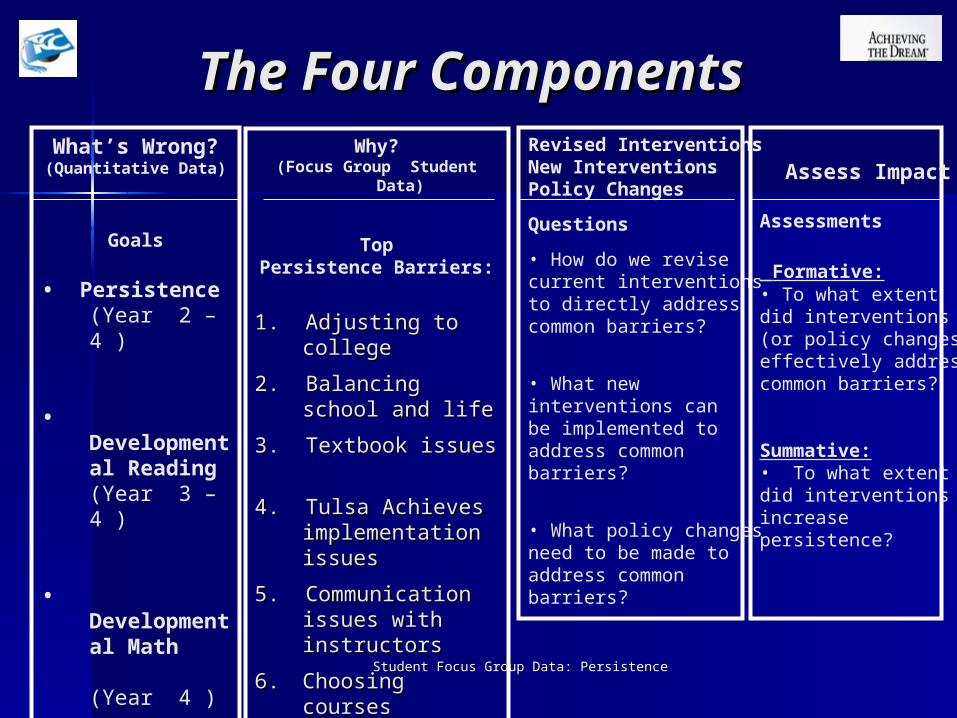
The Four ComponentsThe Four ComponentsWhat’s Wrong?(Quantitative Data)
Goals
• Persistence (Year 2 – 4 )
• Developmental Reading (Year 3 – 4 )
• Developmental Math (Year 4 )
Why?(Focus Group Student
Data)
TopPersistence Barriers:
1. Adjusting to 1. Adjusting to college college
2. Balancing school 2. Balancing school and life and life
3. Textbook issues 3. Textbook issues
4. Tulsa Achieves 4. Tulsa Achieves implementation implementation issuesissues
5. Communication 5. Communication issues with issues with instructors instructors
6.6. Choosing coursesChoosing courses
Revised InterventionsNew InterventionsPolicy Changes
Questions
• How do we revise current interventions to directly addresscommon barriers?
• What newinterventions canbe implemented toaddress commonbarriers?
• What policy changes need to be made to address common barriers?
Assess Impact
Assessments
Formative:• To what extent did interventions(or policy changes)effectively addresscommon barriers?
Summative:• To what extent did interventionsincrease persistence?
Student Focus Group Data: PersistenceStudent Focus Group Data: Persistence
Next StepsNext Steps
* TCC’s goal is to achieve a 3% increase in TCC’s goal is to achieve a 3% increase in student persistence each year.student persistence each year.
* Based on the data, major barriers are Based on the data, major barriers are selected for intervention and improvement.selected for intervention and improvement.
* Intervention and assessment strategies are Intervention and assessment strategies are then devised or modified for the selected then devised or modified for the selected barriers. barriers.