Embed Size (px)
Citation preview

Student Government | University Life | Office of the Senior Vice President | April 20, 2017

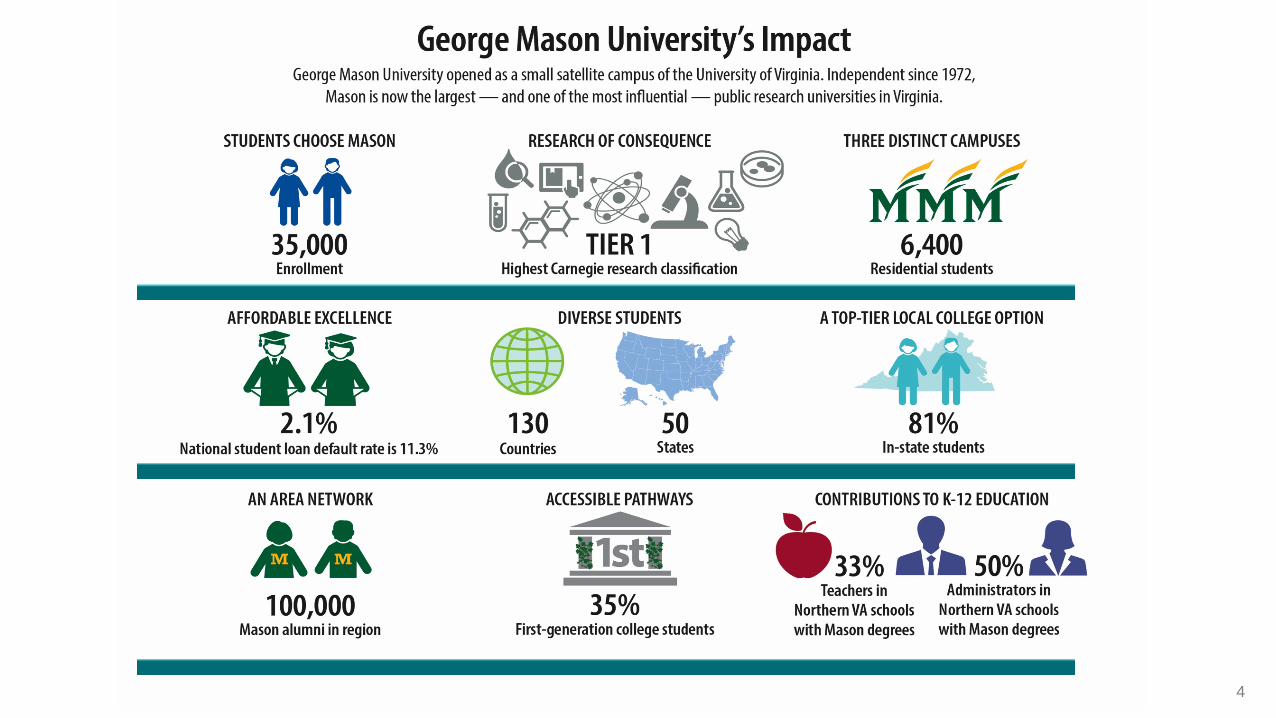
Mason Nation
. . . . . . . . . . .
. . . . . . . . . . .
. . . . . . . . . . .
. . . . . . . . . . .
2

Two New Top 50 Rankings!3
No. 50 in a new ranking by Business First of the top 499 public universities.
No. 47 in Times Higher Education Young University Rankings of 200 colleges and universities around the world. 3
4

New ADVANCE initiativeGreat ROI!
GEORGE MASON UNIVERSITY 5
GMU Transfer

GEORGE MASON UNIVERSITY 6
Our Students

Fall 2016 Enrolled Student Population by Headcount: ~35,000
68%32%
Undergraduate Graduate
68%32%
Full Time Part Time
81%19%
In State Out of State
7

49%51%
UnderrepresentedRacial/EthnicOther
37%
63%
First Generation
Other
15%
85%
Over Age 25 at Entry
Other
1 in 3 1 in 2 1 in 7
8
Fall 2016 Undergraduate Student Population by Headcount: ~24,000

40%
60%
Full Time Part Time
62%20%
9%5%4%
Masters DoctoralsExtended Studies Law SchoolGR Certificates
9
Fall 2016 Graduate Student Population by Headcount: ~11,000
70%
30%
In State Out of State

10
20,000
25,000
30,000
35,000
FY 2010 FY 2011 FY 2012 FY 2013 FY 2014 FY 2015 FY 2016 FY 2017
Fall Headcount Annualized FTE
Source: Office of Institutional Research & Reporting, enrollment excludes Mason Korea
Increasing Enrollment Trend

11Source: Office of Institutional Research & Reporting, enrollment excludes Mason Korea
STUDENT SUCCESS - No Disparity in Graduation RatesGRADUATION GAPS:
Nationally, 62% of white students, but only 53% of Latino students, and 40% of African American students who started college in 2009 at a public four-year institution, hold bachelor’s degrees from that institution six years later.
HISPANIC STUDENTS
AFRICAN AMERICAN STUDENTS
White student graduation rates surpass those of Hispanic students by
9%-pts at public institutions nationwide
White student graduation rates surpass those of African American students by
21%-pts at public institutions nationwide
No Disparity at George Mason University
Source: National Center for Education Statistics 2016 Digest and GMU IRR, Fall 2009 entering cohort 11
No Disparity at George Mason University

0
5
10
15
George MasonUniversity three-year
loan default rate
National three-yearloan default rate
Public four-yearthree-year loan
default rate
Virginia three-yearloan default rate
Virginia public four-year three-year loan
default rate*
Virginia doctoraluniversities three-year loan default
rate*
2011 2012 2013
How George Mason University’s student loan default rates compare
* Excludes MasonSource: U.S. Department of Education 12
Student Debt Mason, Virginia and the U.S.

Mason’s Default Rate is 2.1% compared to a National Three-
Year Average Default Rate of 10.3% for Public Universities
44% of Mason students incurred no debt prior to graduation
For those students graduating with debt, Mason undergraduate debt averaged $30,132
Source: Common Data Set 2016-17, H5Federal Student Financial Aid, Three-year default rate (cohort 2013) 13
Student Debt & Repayment Below National Average

GEORGE MASON UNIVERSITY 14
FY 2018Financial Orientation

GEORGE MASON UNIVERSITY 15

PROPOSED FY 2018 REVENUE BUDGET $1.0B
pie chart $ in millions
16GEORGE MASON UNIVERSITY
Operating$131.4
Financial Aid$22.6
Capital Improvements$48.9
Mason Capital Funds$18.8
Tuition$380.7
Mandatory Student Services & Activity Fees
$91.5
Room & Board$71.4
Community & User Service Fee
$84.3
Sponsored Research$104.7
Philanthropic Activities$60.0
Enrollment Related Fees, 54%
Capital
All Other Activities, 25%
VA State Funding, 20%

LONG TERM FINANCIAL SHIFT FROM TAXPAYER TO STUDENT
67%
33%
75%
0%
10%
20%
30%
40%
50%
60%
70%
80%
George Mason UniversityGeneral Fund vs. Tuition and Other as a Percent of the E&G Budget
State Appropriations Tuition & Other67%
33%
1985
57%43%
2000
25%
75%
2018
17GEORGE MASON UNIVERSITY
25%

Doctoral Average
w/o Mason
General fund estimate is based on SCHEV FTE projection in the 2B report, numbers for all institutions will change with actual revised numbers for FY 2017
FY 2017 STATE FUNDING DISPARITY
18
General Fund $8,294 $9,088 $7,397 $7,209 $6,391 $7,676 $5,854
In-State Tuition 15,810 13,515 10,941 10,989 6,348 $11,521 $8,204
Total 24,104 22,603 18,338 18,198 12,739 19,197 $14,058
Mason percent of average is 73% of total

$2,000
$4,000
$6,000
$8,000
$10,000
$12,000
$14,000
$16,000
$18,000
$20,000
$22,000
FY 2001 FY 2009 FY 2017
W&M
UVa
VCU
VT
Mason
Source: SCHEV 2000-01, 2008-09, 2015-16 Tuition and Fee Report – Tuition and Total Mandatory Fees
Range of ∆ $1,552 to $9,934
per student
∆ = $1,047 per student
FY 2001 - 2017 IN-STATE TUITION AND FEES COMPARISON
19

Institution Faculty or Staff Students Ratio
William and Mary 1 to 3.6
Doctoral Average 1 to 5.6
Virginia Commonwealth University
1 to 7.1
George Mason University 1 to 8
Mason would need to add over 1,000 people to be comparable with state average.
Efficient: Faculty/Staff to Student Comparison
20Source: IPEDS HR Data 2015-16

21
Internal and External Pressures on the Mission
Disinvestment
HS Graduates
Federal & State Policy
High Cost of Living
Infrastructure
Increased Diversity
EnrollmentGrowth Mix
Strategic Plan

FY 2015 Budget Cuts
FY 2016 Budget Cuts
22
-$9.4-$8.0 -$6.9
-$10
-$9
-$8
-$7
-$6
-$5
-$4
-$3
-$2
-$1
$0
Story of the Last Four Years: Cuts
FY 2017Budget Cuts
FY 2018 Budget Cuts
one-time
permanent
one-time
permanent
dollars in millions
-$3.0
permanent
-$6.0

Examine the Base: Efficiency & Effectiveness MeasuresDebt Deauthorization: 4 Year Total $230M
Partial List Fairfax Concert Hall $41.1MHousing IX $41.1MEconomics Building $30.7MParking Deck IV $27.2MSW Campus Dining $14.6M
Asset ReutilizationMason Inn Conversion Historical Loss $12MMason Hall Phase I & II Cost Avoidance $13MScience & Technology CampusBroadlands Properties TBD
Base Budget Reductions & Reallocation 5 Year Total $33.1M
No Added Debt FY 2015, 2016, 2017 $0
FY 2
013
-201
7
GEORGE MASON UNIVERSITY 23
*Commonwealth budget revisions after appropriations

AA- Aa3
A+ A1A A2A- A3
BBB+ Baa1
GEORGE MASON UNIVERSITY 24
STABLE FINANCIAL RATINGS IN 2017
January 2017Received Two
RatingsGMUF’s Prince William Lab LLC Refunding Bonds
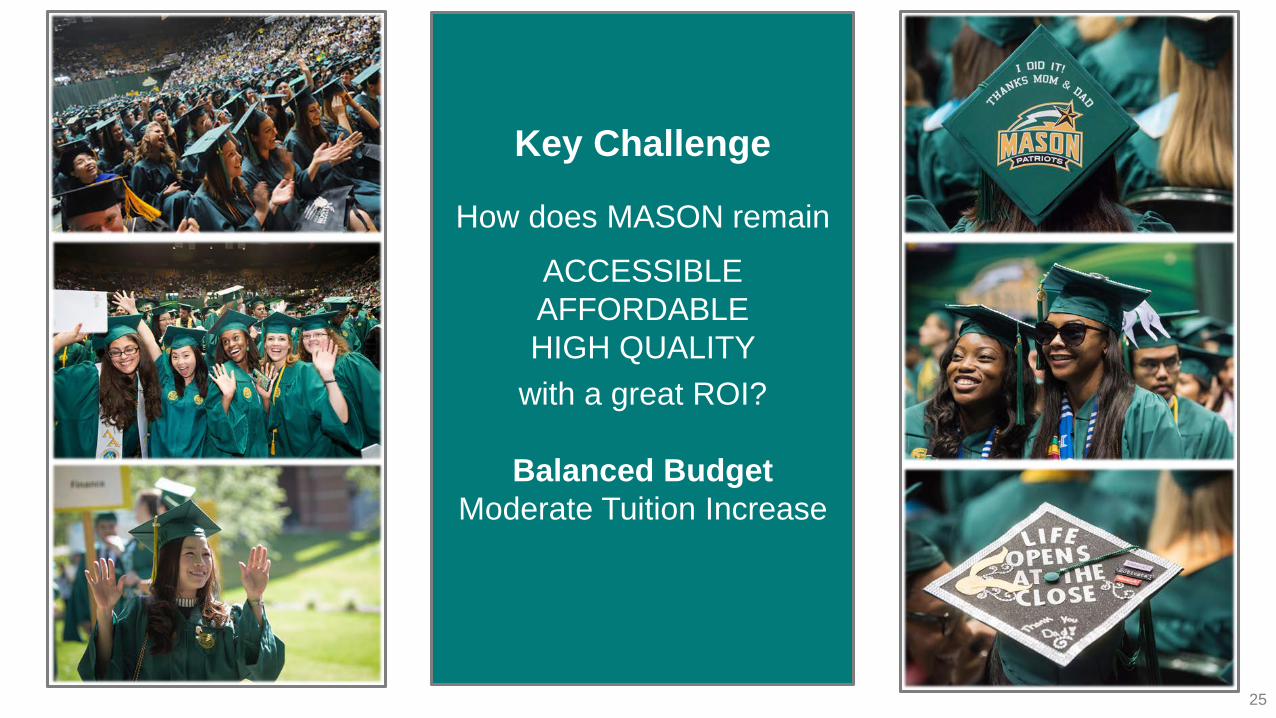
Key Challenge
How does MASON remainACCESSIBLEAFFORDABLE HIGH QUALITY
with a great ROI?
Balanced BudgetModerate Tuition Increase
25

Mason Priorities
Increase Student Financial Aid
Attract & Retain Top Talent
Multidisciplinary Research Institute for Biomedical Innovation
Career-ready graduates with equitable resources to support enrollment growth
Governor’s Amended
Increase undergraduate
financial aid $3.1M
1.5% One-Time Bonus
Block Grant - $1.25M for IBI Initiative
-$9.3M budget reduction
Conference Amendments
Increase undergraduate
financial aid $3.1M
2% Faculty* and 3% Classified Staff
Salary Increase
Block Grant - $1.25M for IBI Initiative
-$6.9M budget reduction
FY 2018 PROPOSED BUDGET AMENDMENTS
Amendments are subject to change and Governor’s line item veto.
*Faculty salary has allowance for an additional 1% increase IF funded 100% from University funds.
26

GEORGE MASON UNIVERSITY 27
MASON MAGICDEDICATED FACULTY & STAFF &
AWESOME STUDENTS!
27

28GEORGE MASON UNIVERSITY
INSTRUCTIONAL FACULTY MARKET TREND
$101,589 $102,896$105,948
$94,716 $94,194 $95,508
32.9% 29.2%22.6%
$70,000
$90,000
$110,000
0%
20%
40%
60%
80%
100%
Fall 2013 Fall 2014 Fall 2015
MASON AVERAGE FACULTY SALARY AND PERCENTILE RANK AMONG PEER INSTITUTIONS
ALL RANKS
SCHEV Conventional Goal (60th Percentile of Peers) Mason Average Salary Mason Salary Percentile Rank
Percentile Rank

29GEORGE MASON UNIVERSITY
FY 2018 TUITION STRATEGY FOCUS
STRATEGIC PLANFACULTY/STAFF
Stay Mason
Financial Aid
Student Experience
Compensation
Disability Insurance
Healthcare
Well-being Initiatives
Student Experience
IT Infrastructure
Research
Innovation
TBD
STUDENTS
. . . . . . . . . . . . . . . . . . . . . .
. . . . . . . . . . . . . . . . . . . . . .

PRICING STUDY MAJOR FINDINGS
GEORGE MASON UNIVERSITY 30
FY 2018Mason can increase:• resident tuition a moderate amount• nonresident tuition, with discounting• funds for most needy - Stay Mason
Examine the credit hour windowEnhance summer offerings Support financially needy studentsInvest in Information Technology InfrastructureFocus on recruitment and retention, new and existing
FY 2019 AND BEYOND

A mind that is stretched by a new experience can never go back to its old dimensions.
Oliver Wendell Holmes. Jr.
GEORGE MASON UNIVERSITY 31