Embed Size (px)
Citation preview

STUDENT LAPTOP USE AND SCORES ON
STANDARDIZED TESTS*
AUGUSTINE J. KPOSOWA
University of California, Riverside
AMANDA D. VALDEZ
University of Chicago
ABSTRACT
Objectives: The primary objective of the study was to investigate the rela-
tionship between ubiquitous laptop use and academic achievement. It was
hypothesized that students with ubiquitous laptops would score on average
higher on standardized tests than those without such computers. Methods:
Data were obtained from two sources. First, demographic and computer
usage information was obtained through face-to-face interviews of 4th and
5th grade students enrolled in an ethnically diverse elementary school in
Southern California. Student achievement and related data were obtained
from existing school records. An unmatched case-control group design was
implemented. Descriptive, bivariate, and multivariate techniques were per-
formed on the data. Results: Overall English/Language Arts and Mathematics
scores for the entire sample were 359 and 396 respectively in 2008. Students
who were given 24/7 laptop computers, however, had higher scores in
English/Language Arts (M = 392.7, SD = 34.98) than students without
laptops (M = 338.54, SD = 39.69). In Mathematics, students with laptops had
a mean of 448.1 (M = 448.1, SD = 56.83), whereas those without laptops
*This research was funded by Grant #A01044-57832-44 awarded to Dr. Kposowa in 2008
by The Wallace P. Brithinee Charitable Donor Advised Fund at The Community Foundation,
Serving Riverside and San Bernardino Counties. The funding source played no role in research
design, data collection, or preparing the manuscript.
345
� 2013, Baywood Publishing Co., Inc.
doi: http://dx.doi.org/10.2190/EC.48.3.d
http://baywood.com
J. EDUCATIONAL COMPUTING RESEARCH, Vol. 48(3) 345-379, 2013

had an average of 365.05 (M = 365.05, SD = 52.64). Independent sample
t-tests showed that these differences between cases and controls were statis-
tically significant. Conclusions: Results showed that, in general, ubiquitous
laptop computers improve student performance in English Language/Arts,
Mathematics, and Science. These findings contradict other studies that
have shown that 24/7 laptops have no effect on student achievement. It is
suggested that policy makers continue judicious use of technology in the
education curriculum.
INTRODUCTION
In an increasingly globalized and interdependent world, competition among
nations in economic and social development is likely to increase and intensify
with time. For a modern state to survive and advance economically, it needs a
highly educated workforce that is capable of adapting to advances in technology
to meet job demands of the 21st century and beyond. Where work related skills
of the labor force do not match the requirements of jobs, the result may well be
wage and social inequality (Handel, 2003). There are indications that while the
United States still maintains some degree of overall economic and military
supremacy (International Institute for Strategic Studies, 2012; Nuxoll, 1994;
Summers & Heston, 1991), it lags behind most countries in the Organization for
Economic Cooperation and Development (OECD) in student academic achieve-
ment (National Center for Education Statistics [NCES], 2008). For instance,
while the average (PISA) mathematics literacy score for 15-year-olds in all
OECD countries was 496 in 2009, that of the United States was 487, a figure that
was significantly below average (OECD, 2010). Countries such as Australia
(514), Belgium (515), Canada (527), Finland (541), Germany (513), the United
Kingdom (492), the Netherlands (526), Korea (546), and Japan (529) all had
mathematics literacy scores that were much higher than that of the United States
(OECD, 2010). American students also scored much lower (502) than students in
many other OECD countries in Science literacy (OECD, 2010).
Concerns about an academic achievement gap have been raised not only with
regard to the standing of U.S. students relative to those in other countries, but
about racial/ethnic group disparities within the country (Balfanz & Byrnes,
2006; Flores, 2007; Geary, 1996). Debates have focused on three central issues.
First, is there an achievement gap, and what is its nature? Second, how wide-
spread is the gap? Third, what are the causes and consequences of the gap? In
responding to the first question, analysts appear to be in general agreement that a
gap exists between European American students and African American, and
between European American and Hispanic students in Mathematics, Science,
and Reading (Gregory, Skiba, & Noguera, 2010; Lee, 2002; Reardon & Galindo,
2009). In an analysis of National Assessment of Educational Progress (NAEP)
346 / KPOSOWA AND VALDEZ

data and SAT results, Lee (2002, p. 5) reported that between 1970 and 1980,
academic improvement occurred among all lower performing students across all
racial and ethnic groups, and the black-white gap in achievement in reading,
mathematics, and science narrowed. Black and Hispanic students narrowed test
gaps in verbal and mathematics skills substantially in the 1970s through the
first half of the 1980s. The pace of improvement in closing the achievement gap
for Black and Hispanic students (relative to non-Hispanic White students) slowed
in the late 1980s, and there is evidence to suggest that by the late 1990s a reversal
had begun to occur (Lee, 2002, p. 8).
Perhaps more controversial in the education literature is not the extent of the
academic gap between racial/ethnic groups, but reasons for its existence and
persistence. Earlier studies pointed to residential segregation (Flores, 2007; Gaskin,
Dinwiddie, Chan, & McCleary, 2012; Kozol, 1967, 1991; Massey & Denton, 1993).
Where racial segregation exists, opportunities and life chances for individuals in the
racial/ ethnic groups involved tend to be fundamentally unequal (Kozol, 1991, 2006;
Gaskin et al., 2012). The tradition of local control of public education in the United
States entails that schools located in predominantly white and often affluent
neighborhoods tend to have greater and higher quality resources than those located in
predominantly minority neighborhoods (Kozol, 1991, 2006, 2012; Ryan, 1999). More
white and affluent communities have a higher tax base, and this enables them to afford
better funding for schools, which can be seen in up-to-date textbooks, better paid
teachers, smaller class sizes, and an overall physical environment that fosters learning
(Kozol, 2006, 2012; Ryan, 1999). Schools in less affluent neighborhoods, on the other
hand, tend to have out-of-date textbooks, less paid teachers, beginning and less
prepared teachers, larger class sizes, crumbling infrastructure, and low teacher
expectations (Gregory et al., 2010; Hanushek & Rivkin, 2009; Kozol, 1991). Students
may also come from families that experience high rates of joblessness, poverty, and
income inequality (Duncan, Brooks-Gunn, & Klebanov, 1994; Wilson, 1987, 1996).
The above position locates causal factors of the academic gap in socio-structural and
socioeconomic attributes. Some analysts also propose that the racial/ethnic academic
gap lies in the differentials between minority and white students in disciplinary
sanctions given out in schools (Gregory et al., 2010; Wallace, Goodkind, Wallace, &
Bachman, 2008). In this view, some school administrators tend to be biased, if not
prejudiced, and that they disproportionately sanction Black, Hispanic, and Native
American students in the form of suspensions, expulsions, and other away from
classroom punishments compared to white students (Gregory et al., 2010; Gregory &
Weinstein, 2008; Skiba, Simmons, Ritter, Gibb, Rausch, & Cuadrado, 2008). If
students are forced to be out of class for infractions, they tend to miss out on lessons,
and this could affect not only their attitudes toward learning itself, but eventually their
test scores (Gregory &Wenstein, 2008; Noguera, 2007; Skiba et al., 2008; Wallace et
al., 2008).
Regardless of the academic gap sources, attention has increasingly focused
on information technology, primarily using computers as a means of increasing
UBIQUITOUS LAPTOPS AND ACHIEVEMENT / 347

student academic achievement (Penuel, 2006), and also closing a perceived
digital divide within the United States (Becker, 2000; Judge, Puckett, & Cabuk,
2004; Light, 2001; Swaine & Pearson, 2002).
In the past decade, there has been an increasing use of laptops in U.S.
elementary, middle, and high schools. Lowther et al. (2003, p. 23) observe that
there are over a thousand schools using some type of laptop program in the
United States, and Windschitl and Sahl (2002) point out that the number of
schools with such programs is growing. Many analysts note apparent advantages
that laptops have over desktops in school settings, including reduced computer to
student ratios, increased home-to-school connectedness, and increased accessi-
bility (Funkhauser, Steif, & Allen, 1998; Penuel, Kim, Michalchik, Lewis, Means,
Murphy, et al., 2002).
Despite this growing use of computers in schools, however, there is a paucity
of research that examines their effectiveness, especially their impact on student
academic achievement. Different investigators often working with the same set
of variables have produced remarkably different results. A review of the extant
literature by Penuel (2006) found only 12 studies on classroom laptops, and of
these, only one appeared in a peer reviewed journal. In general, research findings
on the impact of laptop computers on student academic achievement are mixed.
Some investigators have found significant effects of laptop use on student
achievement (Efaw, Hampton, Martinez, & Smith, 2004; Gulek & Demirtas,
2005; Light, McDermott, & Honey, 2002; Siegle & Foster, 2001). Other analysts
report negligible or no statistically significant effects of laptop use on achieve-
ment (Dunleavy & Heinecke, 2007; Gardner, Morrison, & Jarman, 1993;
Gardner, Morrison, Jarman, Reilly, & McNally, 1994; Rockman, 1999). As
Lowther et al. (2003, p. 25) observe, however, it is unclear from the existing
literature why any effects could be found because of serious limitations in study
research designs.
In a further effort to eliminate some of the inconsistencies observed in past
work and to fill existing gaps in knowledge about the link between laptop
computers and student academic achievement, the present study was designed
to systematically reassess the effects of laptops on student academic achieve-
ment using a combination of descriptive and multivariate statistics. The research
questions asked are simple:
1. Do students with ubiquitous laptops have higher tests scores on average
than their counterparts without such laptops?
2. Are the effects of laptops on achievement reduced or eliminated once
appropriate controls are made for potentially confounding variables?
3. What are the implications of answers to the above questions for past and
future research?
4. What are implications of answers to the above questions for education
policy in the United States?
348 / KPOSOWA AND VALDEZ
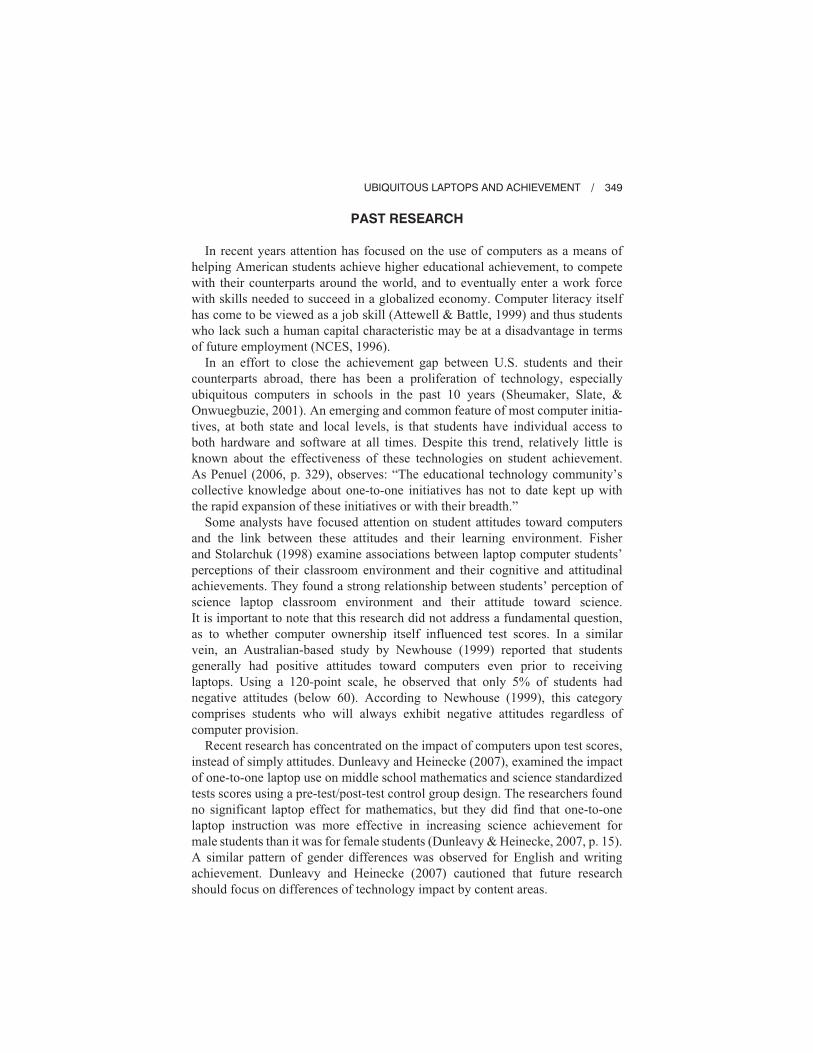
PAST RESEARCH
In recent years attention has focused on the use of computers as a means of
helping American students achieve higher educational achievement, to compete
with their counterparts around the world, and to eventually enter a work force
with skills needed to succeed in a globalized economy. Computer literacy itself
has come to be viewed as a job skill (Attewell & Battle, 1999) and thus students
who lack such a human capital characteristic may be at a disadvantage in terms
of future employment (NCES, 1996).
In an effort to close the achievement gap between U.S. students and their
counterparts abroad, there has been a proliferation of technology, especially
ubiquitous computers in schools in the past 10 years (Sheumaker, Slate, &
Onwuegbuzie, 2001). An emerging and common feature of most computer initia-
tives, at both state and local levels, is that students have individual access to
both hardware and software at all times. Despite this trend, relatively little is
known about the effectiveness of these technologies on student achievement.
As Penuel (2006, p. 329), observes: “The educational technology community’s
collective knowledge about one-to-one initiatives has not to date kept up with
the rapid expansion of these initiatives or with their breadth.”
Some analysts have focused attention on student attitudes toward computers
and the link between these attitudes and their learning environment. Fisher
and Stolarchuk (1998) examine associations between laptop computer students’
perceptions of their classroom environment and their cognitive and attitudinal
achievements. They found a strong relationship between students’ perception of
science laptop classroom environment and their attitude toward science.
It is important to note that this research did not address a fundamental question,
as to whether computer ownership itself influenced test scores. In a similar
vein, an Australian-based study by Newhouse (1999) reported that students
generally had positive attitudes toward computers even prior to receiving
laptops. Using a 120-point scale, he observed that only 5% of students had
negative attitudes (below 60). According to Newhouse (1999), this category
comprises students who will always exhibit negative attitudes regardless of
computer provision.
Recent research has concentrated on the impact of computers upon test scores,
instead of simply attitudes. Dunleavy and Heinecke (2007), examined the impact
of one-to-one laptop use on middle school mathematics and science standardized
tests scores using a pre-test/post-test control group design. The researchers found
no significant laptop effect for mathematics, but they did find that one-to-one
laptop instruction was more effective in increasing science achievement for
male students than it was for female students (Dunleavy & Heinecke, 2007, p. 15).
A similar pattern of gender differences was observed for English and writing
achievement. Dunleavy and Heinecke (2007) cautioned that future research
should focus on differences of technology impact by content areas.
UBIQUITOUS LAPTOPS AND ACHIEVEMENT / 349

A study by Lei and Zhao (2007) showed that there may be a threshold at
which computer use affects test scores. The analysts evaluated the impact of a
laptop project launched at a middle school in Ohio in fall 2003. The outcome
variable utilized in the study was grade point average (GPA). Lei and Zhao (2007,
p. 288) found in regression analysis that 3 hours per day was the threshold. For
instance, among students that spent less than 3 hours per day, the more time spent
on computers the higher the returns to their GPA. At the same time, students who
spent more than 3 hours per day experienced reductions in their GPA. Findings
from the Lei and Zhao (2007) study seem to suggest that some law of diminishing
returns may be at work, whereby computer use benefits rise up to a point (3 hours),
but beyond that threshold, benefits turn into deficits. According to the analysts, it
may not be the amount of time spent on computers that influences achievement,
but the quality of time (activities done), for example, doing homework versus
playing computer games, writing or taking notes versus e-mailing friends,
researching for educational purposes versus visiting non-academic websites, etc.
In his study of technology enriched classrooms, Page (2002, p. 402) found
that participants in technology enriched classrooms appeared to have higher
achievement in mathematics than their counterparts in non-technology enriched
classrooms. According to Page (2002), the differences may be due to the fact
that technology enriched classrooms are more likely to produce more student-
centered and individualized interactions, whereas non-technological classrooms
tend to follow a traditional model of teacher centeredness (Clements, Nastasi,
& Swaminathan, 1993).
In a recent study of 5th, 6th, and 7th graders by Lowther et al. (2003), a
chi-square test of independence revealed that laptop classes had no signifi-
cant advantage over control classes. At the same time, in the 6th grade, laptop
students were rated significantly higher than control students on meaning-
fulness of computer usage. Lowther et al. (2003, p. 33) further looked at
specific measures of learning achievement, for example writing and problem
solving. Using MANOVA, they reported a highly significant difference
between ubiquitous laptop students and control students in the 6th grade. In
the area of writing skills, they also found nontrivial program effects favoring
laptop students.
Becker (2000) studied students’ access to computers at school and at home.
He reported that while the number of instructional computers in U.S. schools
has risen by millions since 1983, there are wide variations in terms of how these
machines are used. Becker (2000) observed that students from higher socio-
economic backgrounds used computers at home at a higher rate than those from
low socioeconomic backgrounds. He found, however, that regardless of socio-
economic status, a higher percentage of students used computers for playing
games than school work, including doing school assignments or working on
educational programs.
350 / KPOSOWA AND VALDEZ
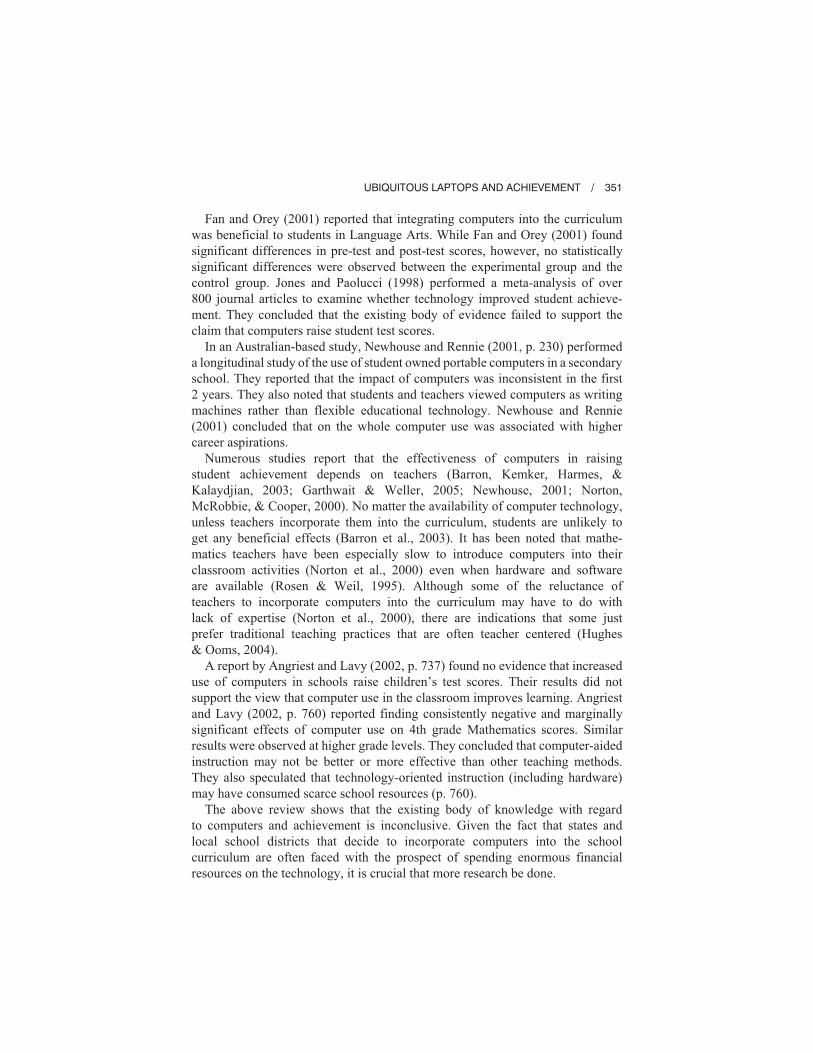
Fan and Orey (2001) reported that integrating computers into the curriculum
was beneficial to students in Language Arts. While Fan and Orey (2001) found
significant differences in pre-test and post-test scores, however, no statistically
significant differences were observed between the experimental group and the
control group. Jones and Paolucci (1998) performed a meta-analysis of over
800 journal articles to examine whether technology improved student achieve-
ment. They concluded that the existing body of evidence failed to support the
claim that computers raise student test scores.
In an Australian-based study, Newhouse and Rennie (2001, p. 230) performed
a longitudinal study of the use of student owned portable computers in a secondary
school. They reported that the impact of computers was inconsistent in the first
2 years. They also noted that students and teachers viewed computers as writing
machines rather than flexible educational technology. Newhouse and Rennie
(2001) concluded that on the whole computer use was associated with higher
career aspirations.
Numerous studies report that the effectiveness of computers in raising
student achievement depends on teachers (Barron, Kemker, Harmes, &
Kalaydjian, 2003; Garthwait & Weller, 2005; Newhouse, 2001; Norton,
McRobbie, & Cooper, 2000). No matter the availability of computer technology,
unless teachers incorporate them into the curriculum, students are unlikely to
get any beneficial effects (Barron et al., 2003). It has been noted that mathe-
matics teachers have been especially slow to introduce computers into their
classroom activities (Norton et al., 2000) even when hardware and software
are available (Rosen & Weil, 1995). Although some of the reluctance of
teachers to incorporate computers into the curriculum may have to do with
lack of expertise (Norton et al., 2000), there are indications that some just
prefer traditional teaching practices that are often teacher centered (Hughes
& Ooms, 2004).
A report by Angriest and Lavy (2002, p. 737) found no evidence that increased
use of computers in schools raise children’s test scores. Their results did not
support the view that computer use in the classroom improves learning. Angriest
and Lavy (2002, p. 760) reported finding consistently negative and marginally
significant effects of computer use on 4th grade Mathematics scores. Similar
results were observed at higher grade levels. They concluded that computer-aided
instruction may not be better or more effective than other teaching methods.
They also speculated that technology-oriented instruction (including hardware)
may have consumed scarce school resources (p. 760).
The above review shows that the existing body of knowledge with regard
to computers and achievement is inconclusive. Given the fact that states and
local school districts that decide to incorporate computers into the school
curriculum are often faced with the prospect of spending enormous financial
resources on the technology, it is crucial that more research be done.
UBIQUITOUS LAPTOPS AND ACHIEVEMENT / 351

METHODS
Background
The present study was conducted at an elementary school in the Palm Springs
Unified School District (PSUSD) in Eastern Riverside County, California.
Neighborhood Characteristics
To describe neighborhood characteristics, the institution’s zip code (92264)
was utilized. Nearly 65% of students in the sample resided within this zip code.
According to the 2000 U.S. Census of Population (U.S. Census Bureau, 2009),
the percentage of persons of Hispanic or Latino ethnicity was 18.3%, while the
corresponding figure for California was 32.4%, and that of the United States
was 12.5%. Non-Hispanic Whites comprised 84.4% of the school area popula-
tion in 2000, while they made up 59.5% of the California’s population, and
75.1% of the U.S. population (U.S. Census Bureau, 2009). The school area
population had much smaller percentages of other racial/ethnic groups. For
instance, African Americans were 1.4%, American Indians were 0.9%, Asians
were 4.4%, Native Hawaiian and Pacific Islanders made 0.1%, and other races
were 8.7%. The average household size in the Cielo Vista vicinity was 1.9 persons
in 2000. Figures for the state and for the nation were slightly higher (2.87 and 2.59
respectively). The percentage distribution of persons that reported themselves as
speaking a language other than English at home was as follows: 23.5% (Cielo
Vista), 39.5% (California), and 17.9% (United States). Immigration remains a
contentious issue in the United States. In 2000, the Cielo Vista area foreign-born
population was 20.2%, a figure that was much higher than the U.S. average
(11.1%), but lower than the state average (26.2%) (U.S. Census Bureau, 2009).
With regard to economic characteristics, median household income in the
school vicinity was $39,173. Comparable figures for the state and the nation were
$47,493 and $41,994 respectively. The percentage of persons below poverty in
the zip code encompassing the school was 12.1%. Corresponding figures for the
city of Palm Springs (15.1%) and California (14.2%) were both above the U.S.
average (12.4%). In terms of educational attainment, the percentage with a
Bachelor’s degree or higher was 29.5% in the Cielo Vista vicinity. Figures
for California and the United States were 26.6% and 24.4% respectively. The
labor force participation rate in the Cielo Vista vicinity was 48.2% in 2000. This
number was lower for the Palm Springs average (52.4%), the California average
(62.4%), and the U.S. average (63.9%).
The School Profile
The school is one of 16 elementary schools within the Palm Springs Unified
School District. Enrollment has been on the decline since the 2001-2002 academic
year. This decline is conveyed by the data shown in Figure 1. As may be observed,
352 / KPOSOWA AND VALDEZ

the school experienced a steady increase in enrollment from the 1998-1999
school year, followed by a gradual decline. It then experienced a precipitous
drop in student enrollment between 2004-2005 and 2005-2006. This period was
accompanied first by a stable enrollment until 2006-2007, and then by a slight
decline. In the 2007-2008 academic year, student enrollment at Cielo Vista was
565. This represented a drop of over 19.3% from 2001-2002 when enrollment
stood at nearly 700.
Average class sizes at the school have fluctuated over the years based on
enrollment, state mandates, supply of teachers, and the fiscal impacts of federal,
state, and local budgets. As shown in Figure 2, the average school-wide class
size was 24 in the 1999-2000 school year. It then dropped to 21 the following
academic year, rose all the way to 23 in 2006-2007. By 2007-2008, the class
size had declined to 21, a figure that was below the state average (25).
Based on the 2007-2008 school year, the school had 90% fully credentialed
teachers. This was relatively close to the state average of 95%. There were 7%
emergency credential waiver teachers, compared to the 4% statewide average.
The mean teacher experience at the school was 14 years of teaching (state mean =
13 years). The percentage of students participating in free or reduced lunch
programs was 76% compared to the state average of 51%. Data show that 44%
of students were English language learners (ELLs). The corresponding state-
wide average was 25% in 2007-2008. What was the home language of English
Language Learners? The distribution was as follows: Spanish (93%), Filipino
UBIQUITOUS LAPTOPS AND ACHIEVEMENT / 353
Figure 1. Trends in enrollment, Cielo Vista Elementary School,
1998 to 2008.
Source: CDE, 2009.

(4%), and Illocano (2%). Comparable state figures were 85% (Spanish), 1%
(Filipino), and less than 1% (Illocano). Per capita spending per pupil in the
Palm Springs Unified School District as a whole was $7,639 in 2007-2008,
compared with the statewide average of $10,805 (California Department of
Education [CDE], 2009).
The distribution of students at the selected school by race/ethnicity is depicted
in Figure 3. As may be observed, 68% of students were of Hispanic/Latino
background, 16% were non-Hispanic White, 11% were Filipino, and 4%
were African American/Black. Persons of other or multiple races comprised
3%. Comparable state figures were 49% (Hispanic), 29% (non-Hispanic
White), 3% (Filipino), 7% (African American/Black), and 5% (other races)
(CDE, 2009).
Participants and Research Design
In spring of 2007, laptop computers were donated to the Elementary School
for student use, with the intention of launching a 24/7 laptop program the fol-
lowing school year. Over summer 2007, various preparations were made by the
Principal, teachers, and staff for initiating this 24/7 Laptop Program. The
program would entail students using the machines in an ubiquitous manner
(that is, both at home and school). Due to the fact that the number of laptops
donated was limited, not all classrooms received them. The selection criteria
were based on:
354 / KPOSOWA AND VALDEZ
Figure 2. School-wide average class size,
Cielo Vista Elementary School, 1998 to 2008.
Source: CDE, 2009.

1. teachers’ willingness to incorporate the technology into their teaching
curriculum; and
2. teachers’ willingness to participate in technology training for computer use
in the classroom.
Based on these criteria, students in two classrooms (1-4th grade and 1-5th grade),
obtained iBook laptops. Over the summer, teachers received 5 days of Apple
Training during which they learned all programs that were on the laptops, as
well as how to maintain the hardware. Teachers trained with programs such as
KidBiz and learned how to compose PowerPoint presentations for classroom
instruction. After program inception, teachers continued to receive classroom
technology training as part of their professional development. Training is usually
held at the school site. Demonstration lessons and instruction on designing
curriculum-based classroom lessons using research and websites are also pro-
vided. Apart from the Apple training, the school is supplied with a district and
Apple coach. Teachers are to employ their acquired knowledge of the technology
until they feel they are ready to expand. When this occurs, a coach will provide
UBIQUITOUS LAPTOPS AND ACHIEVEMENT / 355
Figure 3. Percentage of racial/ethnic background of
Cielo Vista Students, 2007-2008 academic year.
Source: CDE, 2009.

additional demonstration lessons to introduce new techniques. These coaches
are also contacted if a teacher is experiencing difficulties. Thus, demonstration
lessons will be provided for further assistance and clarification. Teachers also
gather together for peer coaching, during which they share previously mastered
techniques with their counterparts.
Participants in the study were students in grades 4 and 5 in the 2007-2008
academic year. Due to the criteria by which laptops had been assigned to class-
rooms, the present study employed a case-control design of the unmatched
type.
Instruments and Data Collection
Data were obtained from two sources. First, information was collected via
surveys over a 3 week period in May and June, 2008 using face-to-face inter-
views. Prior to the interviews, written consent was sought from students and their
parent(s) or guardian. The entire study protocol was also presented to and
approved by the Human Research Review Board (HRRB) at the University of
California, Riverside. In addition, permission letters to conduct the interviews
and carry out the study at the school were obtained from the Principal of the
institution and the Superintendent of Schools for the Palm Springs Unified
School District. Specially trained interviewers were hired to administer the
survey instruments in the form of face-to-face interviews. The survey instrument
employed was a modified version of that used by Warschauer and Grimes
(2005) in their study of a similar program in the Fullerton School District. In
all, out of 154 consent forms sent, 143 (92.9%) were returned. Out of the 143
returned, 122 agreed to be interviewed, representing a response rate of 86%. In all,
102 interviews were completed. The discrepancy in the number of interviews
versus the actual number of returned consent forms was due to student absences
or other school functions (i.e., field trips during the survey period). The second
source of data comprised student information obtained from existing school
records. Although 20 students were not interviewed for the first source of data,
further information on them was available in school records. Moreover, they
were easily classified as cases or controls based on their teacher and classroom.
Therefore, they were included in the analysis. One participant was deleted from
the analysis because he lacked information on the outcome variables. There were
45 cases and 74 controls, reflecting an effective sample size of 119.
Variables and Measures
Dependent Variables
Three outcome variables were used in the analyses, including the California
Standards Test (CST) scores for English/Language Arts, Mathematics, and
Science for the 2007-2008 academic year. The selection of these dependent
356 / KPOSOWA AND VALDEZ

variables was based on the prevailing assumption that proficiency in these core
content areas is a reliable indicator of successful progression through the various
levels in the U.S. education system. The chosen subject areas may also prepare
students better for competition at the global level (OECD, 2004). In California,
Standardized Testing for Science begins at the 5th grade level. Therefore, when
analyses are limited to the 4th grade, there will be only two dependent variables.
The dependent variables were measured as overall raw scores and they were
obtained from existing school records.
Independent Variables
The primary independent variable in this study was status. It was con-
ceptualized in terms of whether a participant received a 24/7 laptop and there-
fore belonged to the case group, or whether he or she did not receive a 24/7 laptop
and therefore belonged to the control group. The variable was measured as a
dummy covariate with 1 for cases; the reference group comprised the controls.
All other variables in the analyses were used to assess whether any differen-
tials between cases and controls persist after controlling for the potentially con-
founding effects of other relevant variables. The first variable controlled was sex.
It was measured as 1 for females, and males were the reference group. Parental
education was available in existing school records in an ordinal format, with
the following codes: 1 = less than high school, 2 = high school graduate, 3 = some
college, 4 = graduate school, 9 = unknown. For the purpose of this article, parental
education was measured as a series of dummy variables, with 1 for parents with
less than high school education, and 1 for those with some college education
(including college graduates, graduate school). Parents with high school educa-
tion constituted the reference group for comparison. The covariate skill was
conceptualized in terms of ability to, knowledge of, and dexterity at using
computers. Students were asked to rate themselves on an ordinal scale ranging
from 1 = complete beginner, 2 = beginner, 3 = intermediate, 4 = advanced, and
5 = expert. Students who said they did not know or refused to answer the question
were given a score of 8, and those with missing information were coded 9. For
the analysis the variable was left in its ordinal form. No respondent scored 8,
but 19 had a value of 9. To determine whether their exclusion from the analysis
might bias results, a regression model was run whereby the missing cases were
included as a covariate category (SKILLMIS = 1). The obtained regression
coefficient was not statistically significant (� = 34.34, t = 1.35, p = .180),
indicating no difference between those in the equation and those outside the
model and, therefore, suggesting a reduced likelihood of selection bias in
parameter estimates if the 19 missing cases were excluded from the analysis.
To improve statistical power, however, the mean on skill level was substituted
as the score for those participants with missing information and the 19 cases were
kept in all analyses.
UBIQUITOUS LAPTOPS AND ACHIEVEMENT / 357

The variable games was specified in terms of the frequency of playing computer
games at home per week. Respondents were asked to indicate how often they
used computers to play games at home. Responses ranged from 1 = never, 2 = less
than once a week, 3 = weekly, 4 = several times a week, 5 = everyday, for less
than 1 hour, 6 = everyday, for more than 1 hour, 8 = don’t know/refuse, and
9 = missing. In the statistical analysis, the variable was kept in its ordinal form.
However, to determine whether selection bias problems might bedevil the
analysis if those with missing information were left out of equations, a dummy
variable was created (GAMEMIS = 1) and placed in a regression model. The
variable was statistically significant (� = –48.82, t = –2.12, p = .035) indicating
that parameter estimates would be biased if the missing cases were left out of
the model. To minimize the problem and also to improve statistical power given
the overall relatively small sample size, mean substitution was performed for
respondents with missing game playing information. GATE refers to the Gifted
and Talented Education program. Students are invited to the program based
upon their scholastic aptitude. It was specified in the analysis as a dummy
variable, with 1 for students in the program, and students not in the program being
the omitted category.
Statistical Methods
To assess the association between the response variables and the predictors,
bivariate analysis was performed by computing Pearson’s correlation coeffi-
cients. To estimate the effect of 24/7 laptop use on test scores, multiple regression
techniques were applied to the data. Ideally, we would have liked to use hier-
archical linear modeling to estimate the effects of neighborhood characteristics on
individual student test scores, but with 65% of respondents residing in one zip
code, there were not enough cases at level 2 to permit such an analysis.
RESULTS
Descriptive Analysis
Student Use of 24/7 Laptops
The first stage of the analysis was to determine how ubiquitous laptop students
used their machines. To investigate student use of technology, analysis was
limited to those that had received the 24/7 laptops. Furthermore, both grades
(4th and 5th) were combined. Given that in the school environment (within
classrooms) there is organized or structured learning and teachers more or
less guide students about which activities to engage in during a period, survey
questions concentrated more on how students used their laptops outside school,
primarily at home. Furthermore, attempts were made to gauge student morale
since the program began.
The survey sought to elicit from students the frequency with which they
used their laptops for specified activities at home. A typical item was asked
358 / KPOSOWA AND VALDEZ

as follows: “How often in the week do you use your laptop at home to write
papers?” Response categories ranged from (1) Never; (2) Less than once a week;
(3) Weekly; (4) Several times a week; (5) Everyday, for less than 1 hour;
(6) Everyday, for more than 1 hour; (8) Don’t know/refused to answer. To
come up with percentage distributions for Figure 4, responses 5 and 6 were
combined into “Daily Use” and determined to reflect the highest level of fre-
quency. As shown in the figure, the most popular use of the laptops at home
was for browsing the internet (37.8%), followed by writing papers (24.4%), and
playing computer games (22.2%).
Attention shifted next to an inquiry into how often students used their laptops
to obtain information relevant to selected subject areas. Like before, a typical
question was asked as follows: “How often in the week do you use your laptop
at home for English/Language Arts?” Response categories were as follows:
1. I do not take this class;
2. Less than an hour each week;
3. 1-2 hours each week;
4. 3-4 hours each week;
5. 5-6 hours each week;
6. 7 or more hours each week;
8. don’t know/refused to answer.
UBIQUITOUS LAPTOPS AND ACHIEVEMENT / 359
Figure 4. Percent of students reporting using laptop several times
per day to perform various activities at home.
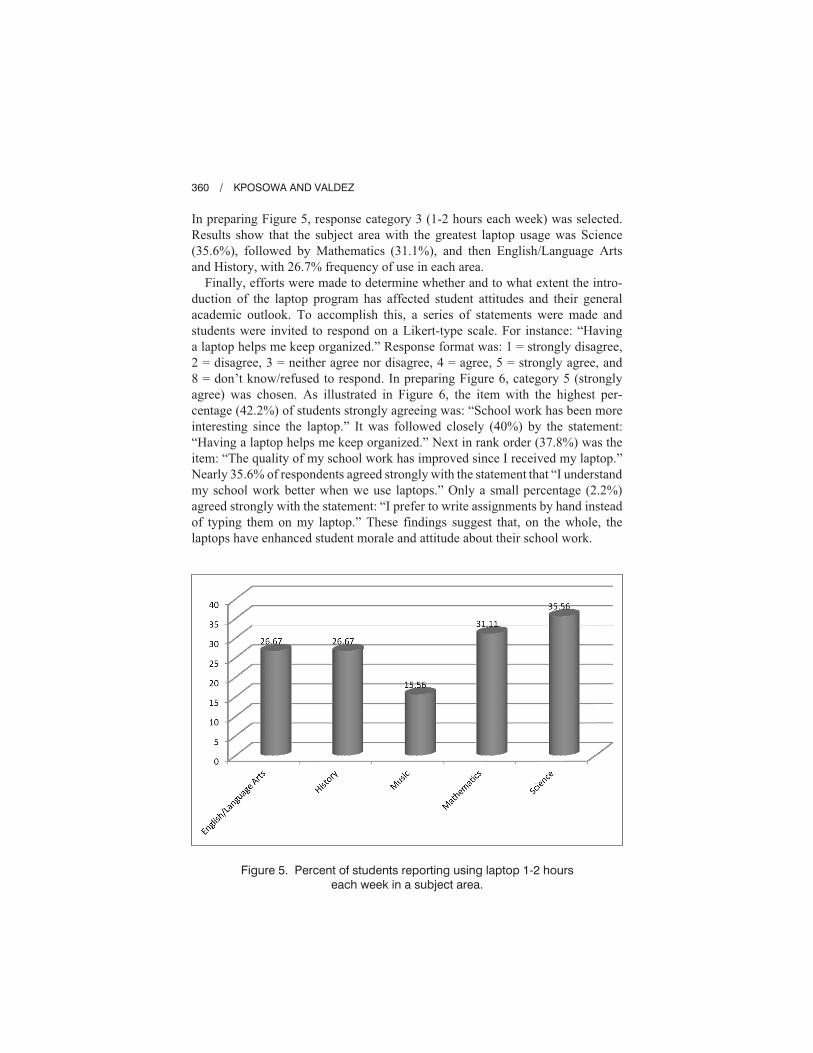
In preparing Figure 5, response category 3 (1-2 hours each week) was selected.
Results show that the subject area with the greatest laptop usage was Science
(35.6%), followed by Mathematics (31.1%), and then English/Language Arts
and History, with 26.7% frequency of use in each area.
Finally, efforts were made to determine whether and to what extent the intro-
duction of the laptop program has affected student attitudes and their general
academic outlook. To accomplish this, a series of statements were made and
students were invited to respond on a Likert-type scale. For instance: “Having
a laptop helps me keep organized.” Response format was: 1 = strongly disagree,
2 = disagree, 3 = neither agree nor disagree, 4 = agree, 5 = strongly agree, and
8 = don’t know/refused to respond. In preparing Figure 6, category 5 (strongly
agree) was chosen. As illustrated in Figure 6, the item with the highest per-
centage (42.2%) of students strongly agreeing was: “School work has been more
interesting since the laptop.” It was followed closely (40%) by the statement:
“Having a laptop helps me keep organized.” Next in rank order (37.8%) was the
item: “The quality of my school work has improved since I received my laptop.”
Nearly 35.6% of respondents agreed strongly with the statement that “I understand
my school work better when we use laptops.” Only a small percentage (2.2%)
agreed strongly with the statement: “I prefer to write assignments by hand instead
of typing them on my laptop.” These findings suggest that, on the whole, the
laptops have enhanced student morale and attitude about their school work.
360 / KPOSOWA AND VALDEZ
Figure 5. Percent of students reporting using laptop 1-2 hours
each week in a subject area.

Descriptive statistics of all the variables are shown in Table 1. As may be
observed, the overall mean for the sample on English/Language Arts was a
little over 359 in 2008. The corresponding figure for Mathematics was 396.4.
When the cases for English/Language Arts are compared to the controls, the
mean for the cases was 392.7 and that for the controls was 338.5. An independent
sample t-test assuming equality of variances revealed that the two groups were
significantly different (t = –7.54, p = .001). The findings suggest that students
with laptops scored on average 54.13 points higher in English/Language Arts
than those without laptops.
In Mathematics the mean score for the case group was 448.1, and comparatively
the mean for the controls was 365.1. An independent sample t-test assuming
equal variances revealed that the two groups were significantly different
(t = –8.10, p = .001). An implication of these findings is that pupils with laptops
on average scored 83.03 points higher than their counterparts who did not
receive laptops. The sample comprised 55% females and 45% males. Forty-nine
percent have parents with less than high school education. Corresponding per-
centages for high school and some college were both 25%. A little over 14% of
the sample was GATE students.
UBIQUITOUS LAPTOPS AND ACHIEVEMENT / 361
Figure 6. Percent of students agreeing strongly with statements
about laptop effect since program inception.

The next stage of the analysis was to calculate the Pearson’s correlation
coefficients of the variables and relevant results are shown in Table 2. As may
be observed, 24/7 laptop ownership was associated with significantly higher
scores in Mathematics (r = 0.599, p = .0001) and English/Language Arts
(r = 0.572, p = .0001). Female students had higher test scores than male students
(r = 0.250, p = .0061) in English/Language Arts and in Mathematics (r = 0.211,
p = .0212). Students whose parents had less than high school education
were associated with significantly lower English/Language Arts scores
(r = –0.272, p = .0028) and significantly lower Mathematics scores (r = –0.223,
p = .0146).
362 / KPOSOWA AND VALDEZ
Table 1. Descriptive Statistics of the Variables,
4th and 5th Graders, 2008
Variable Mean
Standard
deviation Min. Max.
ELACSTA
MathCSTA
Status (laptop = 1)
Sex (female = 1)
Parental education
Less high school
High school
Some college
Computer skill
Games
GATE student (yes = 1)
Case group English
Control group English
Case group Math
Control group Math
359.008
396.453
0.378
0.554
0.495
0.252
0.252
3.126
3.285
0.142
392.667
338.541
448.089
365.054
46.100
67.480
0.486
0.499
0.502
0.436
0.436
1.037
1.390
0.351
34.982
39.683
56.829
52.641
227
234
0
0
0
0
0
1
1
0
319
227
328
234
483
555
1
1
1
1
1
5
6
1
483
410
555
488
Note: ELACSTA = California Standards Test (CST) Score for English/Language
Arts, 2008; MathCSTA = California Standards Test (CST) Score for Mathematics, 2008;
Status = whether student received a laptop (yes = 1); < HS = parents’ educational
attainment is less than high school; High School = parents’ educational attainment is
high school; Some College = parents’ educational attainment is some college; Computer
Skill = Self-reported computer skill level; Games = Frequency of playing computer games at
home per week; GATE = whether student is a participant in the Gifted and Talented
Education program, 2008.

Tab
le2
.P
ears
on
’sP
rod
uct
Mo
men
tC
orr
ela
tio
nC
oeffic
ien
tso
fth
eV
ari
ab
les,4
than
d5
thG
rad
ers
,
20
07
-20
08
Sch
oo
lY
ear
ELA
CS
TA
Math
CS
TA
Sta
tus
Sex
<H
S
Hig
h
sch
oo
l
So
me
co
lleg
e
Co
mp
skill
Gam
es
GA
TE
ELA
CS
TA
Math
CS
TA
Sta
tus
Sex
<H
S
Hig
hsch
oo
l
So
me
co
lleg
e
Co
mp
skill
Gam
es
GA
TE
1.0
00
0.6
88
**
0.5
72
**
0.2
50
**
–0
.27
2**
0.0
02
0.3
11
**
0.5
09
**
–0
.09
0
0.3
87
**
1.0
00
0.5
99
**
0.2
11
*
–0
.22
3**
–0
.11
6
0.3
74
**
0.4
75
**
–0
.03
4
0.5
58
**
1.0
00
0.0
71
–0
.25
3**
0.0
26
0.2
66
**
0.5
58
**
0.0
39
0.5
23
**
1.0
00
–0
.22
7**
0.1
69
0.0
92
0.0
60
–0
.02
2
0.0
27
1.0
00
–0
.57
6**
–0
.57
6**
–0
.25
3**
0.0
38
–0
.30
8**
1.0
00
–0
.33
7**
0.0
60
–0
.00
8
–0
.07
1
1.0
00
0.3
41
**
–0
.03
5
0.4
26
**
1.0
00
0.0
39
0.3
45
**
1.0
00
–0
.04
91
.00
0
*S
ign
ific
an
tat
p<
.05
;**sig
nific
an
tat
p<
.01
.
No
te:
ELA
CS
TA
=C
alif
orn
iaS
tan
dard
sT
est(C
ST
)S
co
refo
rE
ng
lish
/Lan
gu
ag
eA
rts,2
00
8;M
ath
CS
TA
=C
alif
orn
iaS
tan
dard
sT
est(C
ST
)S
co
re
forM
ath
em
atics,2
00
8;S
tatu
s=
wh
eth
er
stu
den
tre
ceiv
ed
ala
pto
p(y
es
=1
);<
HS
=p
are
nts
’ed
ucatio
nala
ttain
men
tis
less
than
hig
hsch
oo
l;H
igh
Sch
oo
l=
pare
nts
’ed
ucatio
nal
att
ain
men
tis
hig
hsch
oo
l;S
om
eC
olle
ge
=p
are
nts
’ed
ucatio
nal
att
ain
men
tis
so
me
co
lleg
e;
Co
mp
ute
rS
kill
=
Self-r
ep
ort
ed
co
mp
ute
rskill
level;
Gam
es
=F
req
uen
cy
ofp
layin
gco
mp
ute
rg
am
es
ath
om
ep
erw
eek;G
AT
E=
wh
eth
erstu
den
tis
ap
art
icip
an
tin
the
Gifte
dan
dT
ale
nte
dE
du
catio
np
rog
ram
,2
00
8.
UBIQUITOUS LAPTOPS AND ACHIEVEMENT / 363

There was no significant association between students’ parental high school
education and any other covariate. Pupils from parents with some college edu-
cation were associated with significantly higher English/Language Arts scores
(r = 0.311, p = .0006) and Mathematics (r = 0.374, p = .0001). Students whose
parents had some college education were more likely to be in the case group
than in the control group (r = 0.266, p = .0035). Higher computer skill level was
significantly correlated with English/Language Arts (r = 0.509, p = .0001),
Mathematics (r = 0.475, p = .0001), parental education below high school
(r = –0.253, p = .0001), and parental collegiate education (r = 0.341, p = .0001).
Computer game playing was not significantly associated with any covariate.
GATE students were significantly related to higher scores in English/Language
Arts (r = 0.387, p = .0001), Mathematics (r = 0.558, p = .0001), and being in the
case group (r = 0.523, p = .0001). Students in the GATE program were less likely
to come from parents without high school education (r = –0.308, p = .0006).
They were, however, more likely to have parents with some college education
(r = 0.426, p = .0001) and they also reported having higher computer skill levels
(r = 0.345, p = .0001).
Multivariate Analysis
In the multivariate analyses that follow, models on the effect of laptops on
student achievement are estimated first for the entire sample combined (4th
and 5th graders), then for 4th and 5th graders separately. Relevant regression
estimates of the effect of laptops on English/Language Arts are shown in Table 3.
As may be observed, students that got laptop computers scored on average
a little over 35 points higher (� = 35.02, t = 3.91, p = .0002) than students without
laptops. Female students scored on average 18.83 points higher than male students
(� = 18.83, t = 2.80, p = .0060). There was no significant association between
parental education and English/Language Arts, but students reporting higher
computer skill levels also tended to score significantly higher on English/
Language Arts (� = 11.17, t = 2.83, p = .0056). Computer game playing at home
had no statistically significant impact on English/Language Arts scores, although
the estimated coefficients were in the negative direction. On the whole, the
model was able to explain nearly 45% of the variance in English/Language Arts
scores (F = [7,112] = 12.76, p = 0.0001).
Parameter estimates showing the effect of 24/7 laptops on student achievement
in Mathematics are presented in Table 4. As may be seen, students that received
laptops scored on average 45.62 higher than students without laptops (� = 45.62,
t = 3.72, p = .0003). Female students scored on average 25.36 points higher than
male students (� = 25.36, t = 2.75, p = .0069). Results also show that children
whose parents had some college education scored on average 26.6 points
higher than students whose parents had only high school education (� = 26.60,
t = 2.00, p = .0482).
364 / KPOSOWA AND VALDEZ

UBIQUITOUS LAPTOPS AND ACHIEVEMENT / 365
Table 3. Results of the Multiple Regression Analysis of the Impact of
Laptaps on California Standards Test (CST) English/Language
Arts Scores, 4th and 5th Graders, 2008
Variable �
Standardized
estimate t-Value Probability
Status
Did not get laptop
Got laptop
Sex
Male
Female
Parental education
High school graduate
Less high school
Some college
Skill
Computer skill level
Games
Frequency of computer
game playing at home
GATE
Not a GATE student
GATE student
Intercept
F-value
R2
Number of cases
Number of controls
Total observations
(Reference)
35.02**
(Reference)
18.83**
(Reference)
3.35
10.37
11.17**
–3.347
(Reference)
8.55
306.32
12.76***
0.446
45
74
119
(Reference)
0.370
(Reference)
0.204
(Reference)
0.036
0.098
0.251
–0.105
(Reference)
0.065
(Reference)
3.91
(Reference)
2.80
(Reference)
0.40
1.07
2.83
–1.47
(Reference)
0.73
.0002
.0060
.6870
.2884
.0056
.1431
.4651
*Significant at p < .10; **significant at p < .05; ***significant at p < .01.

366 / KPOSOWA AND VALDEZ
Table 4. Results of the Multiple Regression Analysis of the Impact of
Laptaps on California Standards Test (CST) Mathematics
Scores, 4th and 5th Graders, 2008
Variable �
Standardized
estimate t-Value Probability
Status
Did not get laptop
Got laptop
Sex
Male
Female
Parental education
High school graduate
Less high school
Some college
Skill
Computer skill level
Games
Frequency of computer
game playing at home
GATE
Not a GATE student
GATE student
Intercept
F-value
R2
Number of cases
Number of controls
Total observations
(Reference)
45.62***
(Reference)
25.36***
(Reference)
20.81*
26.60**
11.44**
–1.70
(Reference)
56.22***
309.92
16.83***
0.515
45
74
119
(Reference)
0.329
(Reference)
0.188
(Reference)
0.155
0.172
0.176
–0.035
(Reference)
0.293
(Reference)
3.72
(Reference)
2.75
(Reference)
1.83
2.00
2.11
–0.53
(Reference)
3.52
.0003
.0069
.0697
.0482
.0368
.5985
.0006
*Significant at p < .10; **significant at p < .05; ***significant at p < .01.

In general the higher the self-reported skill level, the higher the test score
(� = 11.44, t = 2.11, p = .0368). Computer game playing had no effect on
Mathematics scores, although the regression estimate was in the negative
direction. Students in the GATE program had elevated test scores compared to
those not in the program (� = 56.22, t = 3.52, p = .0006). The model was able to
explain nearly 52% of the variance in Mathematics test scores (F = [7,112] =
16.83, p = 0.0001).
The remainder of the analyses concentrates on the influence of laptops on
achievement in grades 4 and 5 separately. Relevant multiple regression results of
the effect of ubiquitous laptops on standardized scores in English Language/Arts
in Grade 4 are shown in Table 5. As may be seen in the table, students that had
24/7l laptops scored significantly higher in English/Language Arts than those
without laptops (� = 42.94, t = 3.22, p = .0024). Students reporting higher
computer skill levels experienced higher test score returns on average (� = 14.48,
t = 2.41, p = .0199). Parental education had no statistically significant effect on
English Language/Arts scores. Similarly, the parameter estimates for frequency
of playing computer games at home and belonging to the GATE program did
not reach statistical significance by conventional criteria. The model explained
nearly 49% of the variation in English/Language Arts scores.
Results showing the effect of laptops on standardized Mathematics scores
for 4th graders are presented in Table 6. Laptop students scored on average
53.4 points higher than students without laptops (� = 53.40, t = 3.29, p = .0019).
Parental education, computer skill level, and computer game playing frequency
all had no significant effect on test scores. Students in the GATE program
scored on average 56.22 points higher in Mathematics than non-GATE students
(� = 56.22, t = 2.29, p < .0268). A little over 47% of the variance in Mathematics
scores was explained by the relevant independent variables.
Results of the impact of 24/7 laptops on English/Language Arts scores among
5th graders are shown in Table 7. As may be observed from the table, 5th graders
with ubiquitous laptops scored on average 26.04 points higher than students
without laptops (� = 26.04, t = 2.25, p = .0286). Female students scored sig-
nificantly higher than male students in English/Language Arts (� = 23.35, t = 2.67,
p = .0098). Parental education, computer skill level, home computer game playing
and belonging to the GATE program had no significant influence on 5th
grade English/Language Arts scores. Nearly 48% of the variance in the response
variable was explained by the model (F = [7, 58] = 7.47, p = 0.0001).
Relevant regression results of the effect of laptops on 5th grade Mathematics
scores are shown in Table 8. Students with 24/7 laptops had much elevated
test scores than their counterparts without laptops (� = 63.15, t = 3.40, p = .0012).
More precisely laptop students had 63.15 points higher on average in their
test scores than non-laptop students. Respondents whose parents had less than
high school education scored a little over 41 points higher on average than those
whose parents who had high school education (� = 41.03, t = 2.37, p = .0210).
UBIQUITOUS LAPTOPS AND ACHIEVEMENT / 367

368 / KPOSOWA AND VALDEZ
Table 5. Results of the Multiple Regression Analysis of the Impact of
Laptaps on California Standards Test (CST) English/Language
Arts Scores, 4th Graders, 2008
Variable �
Standardized
estimate t-Value Probability
Status
Did not get laptop
Got laptop
Sex
Male
Female
Parental education
High school graduate
Less high school
Some college
Skill
Computer skill level
Games
Frequency of computer
game playing at home
GATE
Not a GATE student
GATE student
Intercept
F-value
R2
Number of cases
Number of controls
Total observations
(Reference)
42.94***
(Reference)
18.53*
(Reference)
6.09
8.79
14.48***
–4.94
(Reference)
14.97
305.08
6.39***
0.488
20
34
54
(Reference)
0.428
(Reference)
0.189
(Reference)
0.062
0.074
0.313
–0.129
(Reference)
0.088
(Reference)
3.22
(Reference)
1.74
(Reference)
0.47
0.59
2.41
–1.18
(Reference)
0.74
.0024
.0890
.6417
.5558
.0199
.2429
.4629
*Significant at p < .10; **significant at p < .05; ***significant at p < .01.

UBIQUITOUS LAPTOPS AND ACHIEVEMENT / 369
Table 6. Results of the Multiple Regression Analysis of the Impact of
Laptaps on California Standards Test (CST) Mathematics
Scores, 4th Graders, 2008
Variable �
Standardized
estimate t-Value Probability
Status
Did not get laptop
Got laptop
Sex
Male
Female
Parental education
High school graduate
Less high school
Some college
Skill
Computer skill level
Games
Frequency of computer
game playing at home
GATE
Not a GATE student
GATE student
Intercept
F-value
R2
Number of cases
Number of controls
Total observations
(Reference)
53.40***
(Reference)
24.42*
(Reference)
–3.67
1.14
5.94
0.49
(Reference)
56.22**
328.34
6.00***
0.472
20
34
54
(Reference)
0.444
(Reference)
0.209
(Reference)
–0.031
0.008
0.107
0.011
(Reference)
0.277
(Reference)
3.29
(Reference)
1.88
(Reference)
–0.23
0.06
0.81
0.10
(Reference)
2.29
.0019
.0660
.8174
.9499
.4203
.9240
.0268
*Significant at p < .10; **significant at p < .05; ***significant at p < .01.

370 / KPOSOWA AND VALDEZ
Table 7. Results of the Multiple Regression Analysis of the Impact of
Laptaps on California Standards Test (CST) English/Language
Arts Scores, 5th Graders, 2008
Variable �
Standardized
estimate t-Value Probability
Status
Did not get laptop
Got laptop
Sex
Male
Female
Parental education
High school graduate
Less high school
Some college
Skill
Computer skill level
Games
Frequency of computer
game playing at home
GATE
Not a GATE student
GATE student
Intercept
F-value
R2
Number of cases
Number of controls
Total observations
(Reference)
26.04**
(Reference)
23.35***
(Reference)
7.69
17.39
8.08
–2.46
(Reference)
12.04
302.4
7.47***
0.479
25
40
65
(Reference)
0.299
(Reference)
0.272
(Reference)
0.091
0.183
0.196
–0.085
(Reference)
0.110
(Reference)
2.25
(Reference)
2.67
(Reference)
0.71
1.28
1.62
–0.89
(Reference)
0.77
.0286
.0098
.4792
.2054
.1100
.3792
.4466
*Significant at p < .10; **significant at p < .05; ***significant at p < .01.

UBIQUITOUS LAPTOPS AND ACHIEVEMENT / 371
Table 8. Results of the Multiple Regression Analysis of the Impact of
Laptaps on California Standards Test (CST) Mathematics
Scores, 5th Graders, 2008
Variable �
Standardized
estimate t-Value Probability
Status
Did not get laptop
Got laptop
Sex
Male
Female
Parental education
High school graduate
Less high school
Some college
Skill
Computer skill level
Games
Frequency of computer
game playing at home
GATE
Not a GATE student
GATE student
Intercept
F-value
R2
Number of cases
Number of controls
Total observations
(Reference)
63.15***
(Reference)
21.16
(Reference)
41.03**
56.87***
4.73
–3.15
(Reference)
33.38
325.48
9.96***
0.550
25
40
65
(Reference)
0.420
(Reference)
0.143
(Reference)
0.280
0.348
0.067
–0.063
(Reference)
0.177
(Reference)
3.40
(Reference)
1.51
(Reference)
2.37
2.62
0.59
–0.71
(Reference)
1.33
.0012
.1359
.0210
.0113
.5556
.4825
.1898
*Significant at p < .10; **significant at p < .05; ***significant at p < .01.

Likewise, pupils whose parents had some college education scored 56.87 points
higher on average than their counterparts whose parents had only high
school education (� = 56.87, t = 2.62, p = .0113). Home computer game playing
and being a GATE student had no significant influence on standardized
Mathematics scores in the 5th grade. Overall, the model explained 55% of
the variance in Mathematics scores (F = [7, 64] = 9.96, p = 0.0001).
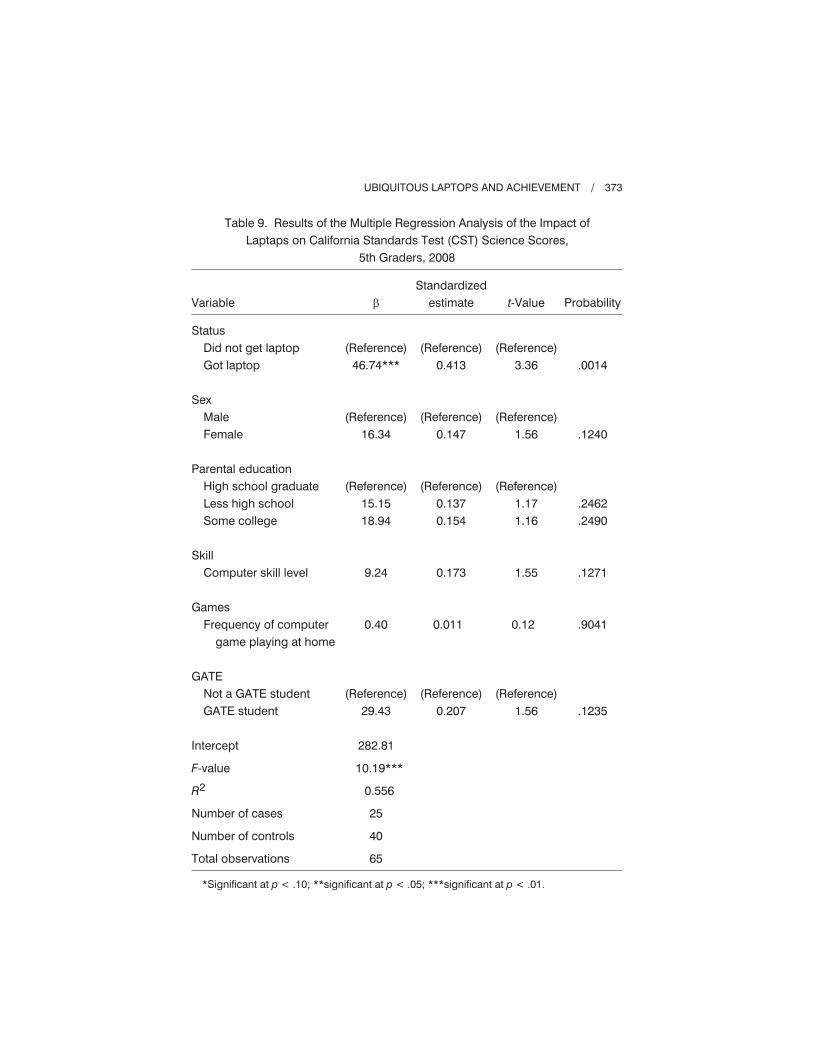
The multivariate results of the impact of laptops on standardized Science
scores for the 5th grade are presented in Table 9. As seen in the table, students
that had one-to-one laptops scored over 46 points higher on average than those
without such laptops (� = 46.74, t = 3.36, p = .0014). No other variable in
the model reached statistical significance using conventional criteria. The
proportion of variance explained by the equation was nearly 56% (F = [7, 57] =
10.19, p = 0.0001).
DISCUSSION
The primary objective of this study was to examine the impact of ubiquitous
(1:1) laptop computers on student academic achievement. Results of data
analyses show evidence to suggest that provision of 24/7 laptops to students
contributes significantly to achievement as measured by standardized scores.
In the entire sample studied, that included both 4th and 5th graders, students
that had ubiquitous laptops scored higher in English/Language Arts than their
counterparts without laptop computers. Likewise, students with ubiquitous
laptops had higher scores in Mathematics than those without 24/7 laptops.
More importantly, the effects of laptops persisted even after controlling for the
potentially confounding effects of variables such as sex and parental educa-
tional background.
When the sample was stratified by grade level, it was observed that in the
4th grade laptop computer ownership elevated scores in English/Language Arts
and Mathematics. A similar result was found when analysis was limited to
5th graders. Among that group, test score in English/Language Arts were raised
by laptop ownership; however, the disparity in scores between laptop students
and non-laptop students was even more dramatic in Mathematics. Analysis
further showed a significant difference between laptop and non-laptop students
in Science scores in the 5th grade.
A key question to ask is: How or why might ubiquitous laptops elevate student
scores? One explanation is that if the laptops are included in the curriculum,
students may not only learn what is taught in the classroom, but over time they
may look up information faster and in the process learn to take initiatives.
It may well be that students with laptops develop better attitudes toward learning
and the subject matter (Wong, 2001). In addition, access to computers has been
shown to raise student self-esteem (Page, 2002) and to promote higher career
aspirations (Newhouse & Rennie, 2001).
372 / KPOSOWA AND VALDEZ
UBIQUITOUS LAPTOPS AND ACHIEVEMENT / 373
Table 9. Results of the Multiple Regression Analysis of the Impact of
Laptaps on California Standards Test (CST) Science Scores,
5th Graders, 2008
Variable �
Standardized
estimate t-Value Probability
Status
Did not get laptop
Got laptop
Sex
Male
Female
Parental education
High school graduate
Less high school
Some college
Skill
Computer skill level
Games
Frequency of computer
game playing at home
GATE
Not a GATE student
GATE student
Intercept
F-value
R2
Number of cases
Number of controls
Total observations
(Reference)
46.74***
(Reference)
16.34
(Reference)
15.15
18.94
9.24
0.40
(Reference)
29.43
282.81
10.19***
0.556
25
40
65
(Reference)
0.413
(Reference)
0.147
(Reference)
0.137
0.154
0.173
0.011
(Reference)
0.207
(Reference)
3.36
(Reference)
1.56
(Reference)
1.17
1.16
1.55
0.12
(Reference)
1.56
.0014
.1240
.2462
.2490
.1271
.9041
.1235
*Significant at p < .10; **significant at p < .05; ***significant at p < .01.

Some analysts contend, however, that the use of computers may hinder learn-
ing or serve as a diversion (Angriest & Lavy, 2002; Bielefeldt, 2005; Lei,
Conway, & Zhao, 2008). One path to hindrance noted by some observers is
the likely use of computers by students on non-curricular related matters, such
as playing video/computer games, sending e-mail, visiting chat rooms, surfing
the internet for fun, and so on (Angriest & Lavy, 2002; Bielefeldt, 2005; Lei
& Zhao, 2007). The present study, however, found no evidence of computers
being distractions in relation to achievement indicators. For example, frequency
of playing computer games at home was not significant in any equation.
Furthermore, laptop use showed a consistent and statistically strong effect on
student scores. Ultimately, one policy implication arising out of this study to
address the concern about student use of computers as a diversion is better
teacher training and more efficient student use of computers for obtaining
academic related information, completing assignments, etc. If positive results
are forthcoming, then there is less likelihood of detrimental consequences
stemming from student use of laptops on extra-curricular affairs.
Results presented here are at variance with those reported by Angriest and
Lavy (2002). In their study, computers had negative effects on student test
scores in 4th grade Mathematics. It should be noted, though, that the Angriest
and Lavy (2002) study was based on classroom computers, and its findings
may not be comparable to studies on ubiquitous laptops. Results are consistent
with those of Dunleavy and Heinecke’s (2007), which found access to laptops
at school having a positive effect on science learning. However, results here
are inconsistent with their findings that laptops had no impact on Mathematics
achievement.
A further pathway that computers may aid in raising students’ overall achieve-
ment is that they have the potential to help students acquire problem-solving
skills, communicate better, and conduct research through looking up information.
Indeed, Barron et al. (2003, p. 501) found in their study of technology investi-
gation in K-12 schools that computer integration and its use as a problem-solving
tool was statistically significant. The same result held for the association between
computers and their use as a research tool. Their utilization for communication
and productivity, however, was not statistically significant.
There are limitations to the study that need to be pointed out. The first is
that analyses have been undertaken using only one school site in a relatively large
school district. It would be inappropriate to generalize results to other schools,
especially those outside the state of California. The second limitation is that
the research did not control for all possible sources of distraction in terms of how
students use laptops. Although the impact of computer game playing at home
was not statistically significant, the sign of the coefficient was negative in most
models. Therefore, the distraction argument advanced by some analysts should
not be completely dismissed. Indeed, Lei and Zhao (2007, p. 290) found that
374 / KPOSOWA AND VALDEZ

58% of students in their sample reported using computers to surf online for fun.
A further 48% used the machines to play computer games. Despite the above
caveats, results from this study suggest that public policies aimed at increasing
ubiquitous laptop use in elementary schools have the potential to raise student
academic achievement.
REFERENCES
Angrist, J., & Lavy, V. (2002). New evidence on classroom computers and pupil learning.
The Economic Journal, 112, 735-765.
Attewell, P., & Battle, J. (1999). Home computers and school performance. The Infor-
mation Society, 15, 1-10.
Balfanz, R., & Byrnes, V. (2006). Closing the mathematics achievement gap in high-
poverty middle schools: Enablers and constraints. Journal of Education for Students
Placed at Risk, 11(2), 143-159.
Barron, A. E., Kemker, K., Harmes, C., & Kalaydjian, K. (2003). Large-scale research
study on technology in K-12 schools: Technology integration as it relates to the
national technology standards. Journal of Research on Technology in Education,
35, 489-507.
Becker, H. J. (2000). Who’s wired and who’s not: Children’s access to and use of computer
technology. The Future of Children, 10, 44-75.
Bielefeldt, T. (2005). Computers and student learning: Interpreting the multivariate
analysis of PISA 2000. Journal of Research on Technology in Education, 37,
339-344.
California Department of Education (CDE). (2009). Education data partnership. Retrieved
January 18, 2009 from http://www.ed-data.k12.ca.us
Clements, D. H., Nastasi, B. K., & Swaminathan, S. (1993). Young children and computers:
Crossroads and directions from research. Young Children, 48, 56-64.
Duncan, G. J., Brooks-Gunn, J., & Klebanov, P. K. (1994). Economic deprivation and
early childhood development. Child Development, 65, 296-318.
Dunleavy, M., & Heinecke, W. F. (2007). The impact of 1:1 laptop use on middle
school math and science standardized test scores. Computers in the Schools, 24,
7-22.
Efaw, J., Hampton, S., Martinez, S., & Smith, S. (2004). Teaching and learning with
laptop computers in the classroom. Educause Quarterly, 3, 10-18.
Fan, H. L., & Orey, M. (2001). Multimedia in the classroom. Journal of Research on
Computing in Education, 33, 1-12.
Fisher, D., & Stolarchuk, E. (1998). The effect of using laptop computers on
achievement, attitude to science and classroom environment in science. Pro-
ceedings Western Australian Institute for Educational Research Forum 1998.
Retrieved November 10, 2008 from http://www.waier.org.au/forums/1998/
fisher.html
Flores, A. (2007). Examining disparities in mathematics education: Achievement gap
or opportunity gap? The High School Journal, 91, 29-42.
UBIQUITOUS LAPTOPS AND ACHIEVEMENT / 375

Funkhauser, J. E., Steif, E. A., & Allen, S. E. (1998). Title I school-parent compacts:
Supporting partnerships to improve learning: Final Report. Washington, DC: Policy
Studies Associates.
Gardner, J., Morrison, H., & Jarman, R. (1993). The impact of portable computers on
learning. Journal of Computer Assisted Learning, 9, 2-16.
Gardner, J., Morrison, H., Jarman, R., Reilly, C., & McNally, H. (1994). Learning with
portable computers. Computers & Education, 22, 161-171.
Garthwait, A., & Weller, H. G. (2005). A year in the life: Two seventh grade teachers
implement one-to-one computing. Journal of Research on Technology in Education,
37, 361-377.
Gaskin, D. J., Dinwiddie, G. Y., Chan, K. S., & McCleary, R. (2012). Residential
segregation and disparities in health care services utilization. Medical Care Research
and Review, 69, 158-175.
Geary, D. C. (1996). International differences in mathematical achievement: Their
nature, causes, and consequences. Current Directions in Psychological Science, 5(5),
133-137.
Gregory, A., Skiba, R. J., & Noguera, P. A. (2010). The achievement gap and the disci-
pline gap: Two sides of the same coin? Educational Researcher, 39, 59-68.
Gregory, A., & Weinstein, R. S. (2008). The discipline gap and African Americans:
Defiance, or cooperation in the high school classroom. Journal of School Psychology,
46, 455-475.
Gulek, J. C., & Damirtas, H. (2005). Learning with technology: The impact of laptop use
on student achievement. The Journal of Technology, Learning, and Assessment, 3,
5-38.
Handel, M. J. (2003). Skills mismatch in the labor market. Annual Review of Sociology,
29, 135-165.
Hanushek, E. A., & Rivkins, S. G. (2009). Harming the best: How schools affect the
black-white achievement gap. Journal of Policy Analysis and Management, 28(3),
366-393.
Hughes, J. E., & Ooms, A. (2004). Content-focused technology inquiry groups: Preparing
urban teachers to integrate technology to transform student learning. Journal of
Research on Technology in Education, 36, 397-411.
International Institute for Strategic Studies. (2012). The military balance, 2012. London,
UK: IISS.
Jones, T. H., & Paolucci, R. (1998). The learning effectiveness of education technology:
A call for further research. Educational Technology Review, 10, 10-12.
Judge, S., Puckett, K., & Cabuk, B. (2004). Digital equity: New findings from the early
childhood longitudinal study. Journal of Research on Technology in Education, 36,
383-396.
Kozol, J. (1967). Death at an early age: The destruction of the hearts and minds of
negro children in the Boston public schools. New York, NY: Houghton Mifflin
Harcourt.
Kozol, J. (1991). Savage inequalities: Children in America’s schools. New York, NY:
Broadway Paperbacks.
Kozol, J. (2006). The shame of the nation: The restoration of apartheid schooling in
America. New York, NY: Three Rivers Press.
376 / KPOSOWA AND VALDEZ

Kozol, J. (2012). Amazing grace: The lives of children and the conscience of a nation.
New York, NY: Broadway.
Lee, J. (2002). Racial and ethnic achievement gap trends: Reversing the progress
toward equity? Educational Researcher, 31, 3-12.
Lei, J., Conway, P., & Zhao, Y. (2008). The digital pencil: One-to one computing for
children. Mahwah, NJ: Lawrence Erlbaum Associates.
Lei, J., & Zhao, Y. (2007). Technology uses and student achievement: A longitudinal
study. Computers & Education, 49, 284-296.
Light, J. (2001). Rethinking the digital divide. Harvard Educational Review, 71,
709-735.
Light, D., McDermott, M., & Honey, M. (2002). Project hiller: The impact of ubiquitous
portable technology on an urban school. New York, NY: Educational Development
Center.
Lowther, D., Ross, S. M., & Morrison, G. M. (2003). When each one has one: The
influences on teaching strategies and student achievement of using laptops in
the classroom. Educational Technology Research and Development, 51,
23-44.
Massey, D., & Denton, N. (1993). American apartheid: Segregation and the making of the
underclass. Cambridge, MA: Harvard University Press.
National Center for Education Statistics (NCES). (1996). The condition of education 1996.
Washington, DC: National Center for Education Statistics, Institute of Education
Sciences, U.S. Department of Education.
National Center for Education Statistics (NCES). (2008). The condition of education 2008.
Washington, DC: National Center for Education Statistics, Institute of Education
Sciences, U.S. Department of Education.
Newhouse, P. (1999). Portable computers supporting secondary school learning.
Proceedings Western Australian Institute for Educational Research Forum
1999. Retrieved October 29, 2008 from http://www.waier.org.au/forums/1999/
newhouse.html
Newhouse, P. (2001). A follow-up study of students using portable computers at a
secondary school. British Journal of Educational Technology, 32, 209-219.
Newhouse, P., & Rennie, L. (2001). A longitudinal study of the use of student-
owned portable computers in a secondary school. Computers & Education, 36,
223-243.
Noguera, P. A. (2007). How listening to students can help schools to improve. Theory Into
Practice, 46, 205-211.
Norton, S., McRobbie, C. J., & Cooper, T. J. (2000). Exploring secondary mathematics
teachers’ reasons for not using computers in their teaching: five case studies. Journal
of Research on Computing in Education, 33, 87-109.
Nuxoll, D. A. (1994, December). Differences in relative prices and international differ-
ences in growth rates. American Economic Review, 84, 1423-1436.
Organization for Economic Cooperation & Development (OECD). (2004). Learning
for tomorrow’s world: First results from PISA 2003. Paris: OECD.
Organization for Economic Cooperation & Development (OECD). (2010). What
students know and can do: Student performance in reading, mathematics and science.
Retrieved February 23, 2012 from www.oecd.org/edu/pisa/2009
UBIQUITOUS LAPTOPS AND ACHIEVEMENT / 377
Page, M. S. (2002). Technology-enriched classrooms: Effects on students of low
socioeconomic status. Journal of Research on Technology in Education, 34,
389-409.
Penuel, W. R. (2006). Implementation and effects of one-to-one computing initia-
tives: A research synthesis. Journal of Research on Technology in Education, 38,
329-348.
Penuel, W. R., Kim, D. Y., Michalchik, V., Lewis, S., Means, B., Murphy, R., et al. (2002).
Using technology to enhance connections between home and school: A research
synthesis. Washington, DC: Planning and Evaluation Service, U.S. Department of
Education, DHHS Contract #282-00-008-Task 1.
Reardon, S. F., & Galindo, C. (2009). The Hispanic-White achievement gap in math and
reading in the elementary grades. American Educational Research Journal, 46(3),
853-891.
Rockman, S. (1999). A more complex picture: Laptop use and impact in the context of
changing home and school access. San Francisco, CA: Rockman Educational Reform.
Rosen, L. D., & Weil, M. M. (1995). Computer availability, computer experience
and technophobia among public school teachers. Computers in Human Behavior, 11,
9-31.
Ryan, J. E. (1999). The influence of race in school finance reform. Michigan Law
Journal, 98(2), 432-481.
Sheumaker, F., Slate, J. R., & Onwuegbuzie, A. J. (2001). The role on intech training
in the integration of technology into instructional practices among Georgia middle
school teachers. Journal of Research on Computing in Education, 33, 1-12.
Siegle, D., & Foster, T. (2001). Laptop computers and multimedia and presentation
software: Their effects on student achievement in anatomy and physiology. Journal
of Research on Technology in Education, 34, 29-37.
Skiba, R. J., Simmons, A. B., Ritter, S., Gibb, A. C., Rausch, M. K., & Cuadrado, J . (2008).
Achieving equity in special education: History, status, and current challenges.
Exceptional Children, 74, 264-288.
Summers, R., & Heston, A. (1991, May). The Penn World Table (Mark 5): An expanded
set of international comparisons, 1950-1988. Quarterly Journal of Economics, 106(2),
327-368.
Swaine, C., & Pearson, T. (2002). Educators and technology standards: Influencing the
digital divide. Journal of Research on Technology in Education, 34, 326-336.
U.S. Census Bureau. (2009). State and county quick facts. Retrieved June 12, 2009 from
http://quickfacts.census.gov/qfd/states/06000.html
Warschauer, M., & Grimes, D. (2005). First year evaluation report Fullerton school
district laptop program. Irvine, CA: University of California, Department of
Education.
Wallace, J. M., Jr., Goodkind, S., Wallace, C. M., & Bachman, J. G. (2008). Racial,
ethnic, and gender differences in school discipline among U.S. high school students:
1991-2005. Negro Educational Review, 59, 47-62.
Wilson, W. J. (1987). The truly disadvantaged: The inner city, the underclass, and public
policy. Chicago, IL: University of Chicago Press.
Wilson, W. J. (1996). When work disappears: The world of the new urban poor. New York,
NY: Vintage Books.
378 / KPOSOWA AND VALDEZ

Windschitl, M., & Sahl, K. (2002). Tracing teachers’ use of technology in a laptop
computer school: The interplay of teacher beliefs, social dynamics and institutional
change. American Educational Research Journal, 39(1), 165-205.
Wong, C. K. (2001). Attitudes and achievements: Comparing computer-based and paper-
based homework assignments in mathematics. Journal of Research on Computing
in Education, 33, 1-13.
Direct reprint requests to:
Dr. Augustine J. Kposowa
Department of Sociology
1150 Watkins Hall
University of California
900 University Avenue
Riverside, CA 92521
e-mail: [email protected]
UBIQUITOUS LAPTOPS AND ACHIEVEMENT / 379

Copyright of Journal of Educational Computing Research is the property of BaywoodPublishing Company, Inc. and its content may not be copied or emailed to multiple sites orposted to a listserv without the copyright holder's express written permission. However, usersmay print, download, or email articles for individual use.