Embed Size (px)
Citation preview

STUDENT OUTCOMES REPORTGA’s Full-Time Program Data: Jan. 1, 2019–Dec. 31, 2019
2
3
4
5
6
8
12
18
24
Overview
A Note from Our CEO
A Note From Our Vice President of Consumer Operations: The State of Hiring & How General Assembly Meets Global Shifts
About General Assembly
About Career Services
Our Latest Data: Outcomes & Demographics
Appendix
Independent Accountants’ Review Report
TABLE OF CONTENTS
2
General Assembly Student Outcomes Report: 2019

3
General Assembly (GA) is a pioneer in education and career transformation, specializing in today’s most in-demand skills. As the leading source for training, staffing, and career transitions, we foster a flourishing community of professionals pursuing careers they love. We have helped more than 13,000 career-changers land jobs in software engineering, data, and user experience (UX) design over the past eight years through our Immersive courses and Outcomes program.
ABOUT GENERAL ASSEMBLY IMMERSIVE COURSES
Led by seasoned practitioners in software engineering, data science, and user experience (UX) design, participants in our Immersive training programs complete 400–500 hours of training.
Students work hand-in-hand with dedicated career coaches who help them confidently build a personal brand, apply for jobs, prep for interviews, and tackle technical assessments.
ABOUT THE OUTCOMES IN THIS REPORT
This report includes outcomes data for 4,313 students who participated in our programs that ended between January 1, 2019, and December 31, 2019. Of those 4,313 students, 3,663 graduated from their respective programs, and 2,511 participated in our Career Services program. Six months post-Immersive course completion, 90.5% of GA graduates who participated in a full-time job search secured a job; three months post-Immersive course completion, 61.5% of GA graduates who participated in a full-time job search secured a job. An additional 8.7% accepted a job offer after 180 days, for a total of 99.2% of this eligible population working in their field of study.
Our graduates secure jobs at top companies across sectors including Adobe, Amazon, Apple, Bank of America, Capital One, Cisco, CVS Health, Deloitte, Dish Network, Disney, Express Scripts, Google, HP, Microsoft, Prudential Financial, Salesforce, Verizon, and Visa.
3
OVERVIEW
of graduates who participated in full-time career services secured a job in their field of study.
99.2%
AB
OU
T G
AA
BO
UT
CA
RE
ER
SE
RV
ICE
SO
UR
LA
TE
ST
DA
TAA
PP
EN
DIX
NO
TE
FR
OM
VP
OP
ER
AT
ION
SO
VE
RV
IEW
NO
TE
FR
OM
CE
O
General Assembly Student Outcomes Report: 2019
AC
CO
UN
TAN
TS
’ LE
TT
ER
4
A NOTE FROM OUR CEO
4
OV
ER
VIE
WN
OT
E F
RO
M C
EO
General Assembly Student Outcomes Report: 2019
Hello,
I’m Lisa Lewin, CEO of General Assembly, and it is my pleasure to share our fifth Outcomes report. We began publishing these reports in 2016 as part of our commitment to provide prospective students with clear, validated data about what they can expect from their job search after completing a GA Immersive program.
Across all previously published reports we have shared data on 15,376 career changers in our Outcomes reports — data that has been reviewed by KPMG, one of the largest, most-respected accounting firms in the world. Here, you will find the data-driven stories of the 4,313 students who embarked upon brave education and career-change journeys by enrolling in our Immersive programs in 2019.
Unquestionably, much has changed in our world since the students included in this report attended GA. We are in a new climate for job seekers, and while our students continue to reliably secure employment, we know future reports that capture the period during and after the pandemic will look different than those that came before. The landscape has changed — and many of the former rules no longer apply.
Still, as the leading provider of digital skills education for adults, we know our graduates will have the benefit of access to our global network of over 80,000 alumni (and counting); our consistent track record of getting our graduates hired across 37 markets in 7 countries; and our robust relationships with corporate clients who still face talent shortages for tech, data, and design roles — even as hiring in other sectors is slow to recover.
Our dedicated team of top-caliber instructors, student success specialists, and career coaches are here to ensure our students’ success in the classroom, in the job search arena, and in new beginnings. Our commitment to success will never waver, regardless of what is happening in the outside world.
I joined GA because, as a longtime education executive, I watched GA grow from disruptive innovator to global industry leader — and I wanted to contribute to and be a part of what’s to come. We are proud of our achievements from the first ten years and are doubling down on innovation, impact, and international expansion as we look to the next ten — and beyond.
I’m proud to have joined this extraordinary global community, and I look forward to welcoming you to #TeamGA.
Lisa Lewin (she/her)CEOGeneral Assembly
AB
OU
T G
AA
BO
UT
CA
RE
ER
SE
RV
ICE
SO
UR
LA
TE
ST
DA
TAA
PP
EN
DIX
NO
TE
FR
OM
VP
OP
ER
AT
ION
SA
CC
OU
NTA
NT
S’ L
ET
TE
R
5
THE STATE OF HIRING & HOW GENERAL ASSEMBLY MEETS GLOBAL SHIFTS
General Assembly was founded in 2011, in the aftermath of the last recession, to create pathways to meaningful work for people whose careers had been interrupted and wanted to find inspiration in a strong community of entrepreneurs, technologists, creators, and innovators.
Today, ten years later, that mission remains the same. There’s no question that an increasingly digital world demands digital-first skills — in greater numbers — and that’s not only for full-time software engineers or data scientists, but the people who have to advise, lead, and collaborate with them every day. The technology, marketing, design, and data skills we teach will be more resilient and relevant in a post-COVID-19 era.
While many businesses are still ramping up to their pre-COVID 19 hiring levels, the skills we teach will continue to be in demand and our graduates continue to land aspirational jobs in their field of study. In this Outcomes report, most of our job seekers secured roles before unemployment rose due to the pandemic — we’re proud to share that 99.2% of full-time job seekers in this report had landed roles in their field of study at time of publication.
The purpose of this year’s report is to help you to make an informed decision about whether a GA Immersive program is right for you, and job placement data is critical to that decision. Indisputably, COVID-19 dramatically impacted the hiring landscape; however, not all students
5
A NOTE FROM OUR VICE PRESIDENT OF CONSUMER OPERATIONS
who graduated in 2019 experienced its impact due to varying graduation times. While we have seen reduction in hiring and lengthened job searches for our graduates due to the global health crisis, we see rising demand in the fields of data science, software engineering, and UX design.
Regardless of what is happening in the world, our vision to set our students up for success as they acquire new skills, pursue new careers, and join our thriving global community remains the same. We hope you will join us!
Betsy Leonhardt (she/her)Vice President, Consumer OperationsGeneral Assembly
NO
TE
FR
OM
VP
OP
ER
AT
ION
S
General Assembly Student Outcomes Report: 2019
OV
ER
VIE
WA
BO
UT
GA
AB
OU
T C
AR
EE
R S
ER
VIC
ES
OU
R L
AT
ES
T D
ATA
AP
PE
ND
IXN
OT
E F
RO
M C
EO
AC
CO
UN
TAN
TS
’ LE
TT
ER
6
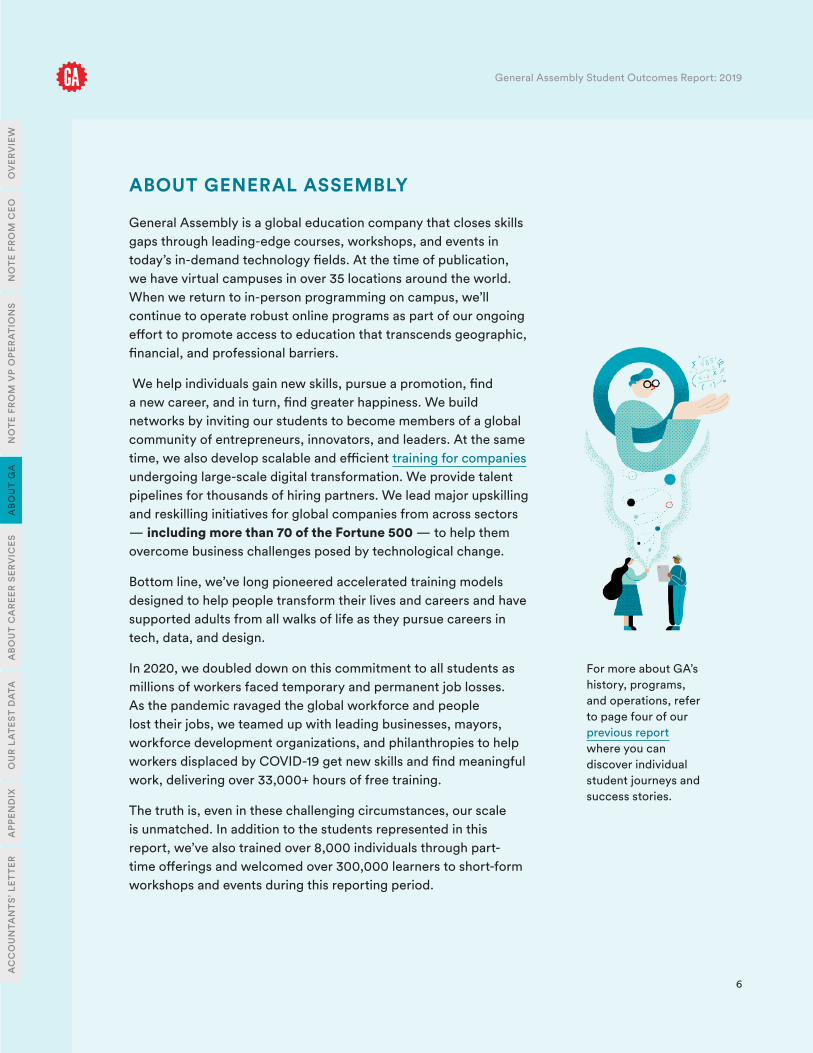
General Assembly is a global education company that closes skills gaps through leading-edge courses, workshops, and events in today’s in-demand technology fields. At the time of publication, we have virtual campuses in over 35 locations around the world. When we return to in-person programming on campus, we’ll continue to operate robust online programs as part of our ongoing effort to promote access to education that transcends geographic, financial, and professional barriers.
We help individuals gain new skills, pursue a promotion, find a new career, and in turn, find greater happiness. We build networks by inviting our students to become members of a global community of entrepreneurs, innovators, and leaders. At the same time, we also develop scalable and efficient training for companies undergoing large-scale digital transformation. We provide talent pipelines for thousands of hiring partners. We lead major upskilling and reskilling initiatives for global companies from across sectors — including more than 70 of the Fortune 500 — to help them overcome business challenges posed by technological change.
Bottom line, we’ve long pioneered accelerated training models designed to help people transform their lives and careers and have supported adults from all walks of life as they pursue careers in tech, data, and design.
In 2020, we doubled down on this commitment to all students as millions of workers faced temporary and permanent job losses. As the pandemic ravaged the global workforce and people lost their jobs, we teamed up with leading businesses, mayors, workforce development organizations, and philanthropies to help workers displaced by COVID-19 get new skills and find meaningful work, delivering over 33,000+ hours of free training.
The truth is, even in these challenging circumstances, our scale is unmatched. In addition to the students represented in this report, we’ve also trained over 8,000 individuals through part-time offerings and welcomed over 300,000 learners to short-form workshops and events during this reporting period.
6
ABOUT GENERAL ASSEMBLY
AB
OU
T G
A
General Assembly Student Outcomes Report: 2019
For more about GA’s history, programs, and operations, refer to page four of our previous report where you can discover individual student journeys and success stories.
OV
ER
VIE
WA
BO
UT
CA
RE
ER
SE
RV
ICE
SO
UR
LA
TE
ST
DA
TAA
PP
EN
DIX
NO
TE
FR
OM
CE
ON
OT
E F
RO
M V
P O
PE
RA
TIO
NS
AC
CO
UN
TAN
TS
’ LE
TT
ER

77
Our team’s work revolves around identifying individuals’ experiences and interests and aligning them with relevant upskilling or reskilling opportunities. In my role, it is my top priority to help potential students find the best fit for their education and career goals. My discussions with potential students are honest and empathetic; they usually focus on where they are currently in their careers and envision themselves going in the future. We talk about interests, career prospects, relevant industries, and match certain areas of study to explore further. Our Admissions Team believes that every student conversation is unique and requires an understanding of their circumstances. Potential students are typically hoping to understand how they can make the best use of their experience and interests to further their careers in the world of tech — I use my knowledge of GA’s offerings and the tech industry to bridge this gap. Once we have identified the best course, I take students through our robust admissions processes to ensure they are fully prepared to study and thrive in that program.
The advice I give most to students thinking about investing in themselves and their education is research — and a lot of it! This will increase the understanding of tech’s specificities and help erase doubts about continuing education. Realizations that an industry may — or may not — be right for you are equally valuable! Books, podcasts, or online tutorials are great resources to help further your understanding and give opportunities to try basic exercises. An intro class or a short workshop with GA is an excellent jumping-off
point that will offer a better understanding of what it could look like to be a developer, designer, or analyst!
For a student to be successful, two key things repeatedly come up: passion and a desire to work towards a job they will love doing. Successful students develop an understanding of what a new role in a specific industry could look like and weigh the pros and cons of continuing in their current industry instead of transitioning. They consider all possible situations due to this big transition and are aware that it will be a challenging yet enriching journey. Successful students — and people — take risks!
INSIDE THE GENERAL ASSEMBLY ADMISSION PROCESS
General Assembly Student Outcomes Report: 2019
KARAN DWIVEDI (HE/HIM)Senior Admissions Producer & Operations Lead
Sydney, Australia

8
If you’re reading this, chances are you’re thinking about taking an Immersive program at General Assembly and want to know what you can expect from our Career Services team during your program, as well as once you graduate.
Here is a high-level view of who we are and how we work with our Immersive students:
• We have a network of over 50 career coaches. Throughout your Immersive program, your dedicated career coach will give you a detailed job search curriculum and work with you to develop the skills and tools you will need to compete in the job market.
• Once you’ve graduated, your career coach will work 1:1 with you on your job search strategy until you’ve achieved an outcome.
• Our coaches support you in developing your personal brand. They’ll make sure that your online presence captures your skills and competencies, that your materials are compelling and error-free, and that you’re prepared for every interview.
• When job opportunities arise within our network, we’ll recommend you for ones that align with your skills and goals.
• We strive to ensure you put your best foot forward by conducting technical interview prep sessions and providing feedback on materials for specific opportunities.
• Our coaches are incredible, but their efforts alone won’t land you a job. You’ll be expected to do weekly work that includes networking, applying to jobs, and continuing to develop technical skills.
ABOUT CAREER SERVICES
General Assembly Student Outcomes Report: 2019
AB
OU
T C
AR
EE
R S
ER
VIC
ES
8
OV
ER
VIE
WO
UR
LA
TE
ST
DA
TAA
PP
EN
DIX
AC
CO
UN
TAN
TS
’ LE
TT
ER
NO
TE
FR
OM
CE
ON
OT
E F
RO
M V
P O
PE
RA
TIO
NS
AB
OU
T G
A

99
INSIDE GENERAL ASSEMBLY’S CAREER SERVICES PROGRAM
Our team understands how huge it is to take the leap, learn a new skill, and go for a new career. We’re passionate about providing the support necessary to help that transition be as smooth as possible because we know how tough it can be.
In working with our Career Services (Outcomes) program, students can expect to be empowered with the right tools and resources to confidently engage in their new industry and succeed in landing their first opportunity. Our team understands that one size does not fit all, and we partner with students to achieve their unique goals for their careers.
The Outcomes team stays abreast of industry and job market trends to ensure our programming is relevant. Plus, we host a wide variety of webinars and events hosted each week that range from panel discussions with recruiters and workshops on personal
branding to portfolio reviews with industry experts. We’re also consistently engaging with companies and hiring managers to share opportunities and resources directly with students.
In the beginning, you may not have any idea of the type of companies you want to work for or even the industries you’re particularly interested in. That’s okay! You can learn a lot from doing your own research and you’ll learn the most from actually engaging with and connecting with other humans.
1. Read as much as you can about what’s happening in the industry, what tools are being used, and the latest trends.
2. Research which companies are making an impact with both their products and internal culture.
3. Find groups and meetups related to your industry and build relationships with GA alumni that have similar interests.
You’ll likely be spending hours outside of class to practice and review, so it’s best to mentally prepare yourself for an intense and rigorous learning journey. Aside from carving out time for study, you should also think through mechanisms to help you unplug, stay healthy, and have a personal life.
There will be times when you are filled with doubts. Just remember that you’re learning something new and being a beginner again — give yourself room for mistakes, breaking things, and not knowing everything already. Keep moving forward and staying curious. You will get it — you’ll find your next opportunity!
GA Students come from all different backgrounds but are passionate about growth, learning, and finding work that aligns with their true skills and interests.
General Assembly Student Outcomes Report: 2019
YVONNE DODD (SHE/HER)Outcomes Manager & Career Coach
Atlanta, Georgia

1010
Let’s start with the best part of my job! My absolute favourite moments are working with students that are nervous and unsure but have excellent problem-solving abilities. They have some rocky moments to start, but with some encouragement and reassurance (as well as a push out of their comfort zone), they thrive and get more confident with each day of new content.
I work with students daily, first in a morning stand-up to check-in and get everyone’s thoughts on the previous day’s content and homework assignment. The instructional team also gives feedback on the day, sprinkled with some advice and reassurance. Stand-up is one of my favourite interactions: we hear from everyone individually and get to know everyone better.
While teaching, I encourage open discussions — and lots of questions — about certain aspects that need further explanation or context. My personal style is to keep things light and relaxed in the classroom — I hope this creates a safe space for students to ask questions that they might think are “stupid” (There are no stupid questions in software engineering). My more personal interactions with students come during labs or code challenges, where I spend more focused 1:1 or small group time with students.
Two questions I often get are how to best prepare for programs at General Assembly and the job search after graduation. My advice is to clear the schedule! The Immersive experience, followed by a job search and career change, is rewarding and exciting. Still, students need to understand that it requires a lot of hard work,
determination, and commitment. I also encourage students to spend some time exploring the growth mindset — “failure” is an opportunity to learn. Things rarely go right the first time when it comes to coding, and the earlier students can switch into the mindset that “I don’t know” is a perfectly acceptable response, the better!
At the end of the day, students can expect support, support, support from their GA instructors. A large part of my job is supporting and encouraging students, whether they are finding everything a breeze or finding things a bit tricky, and it’s one of my favourite things to take on. We encourage an open and honest classroom; if we feel like a student is not making as much progress as we would hope at a certain point, then we’ll make a plan together to get back on track. As long as our students are willing to put in the work, we are here to help! Come prepared to work hard, be kind, and collaborate as much as you can.
INSIDE THE GENERAL ASSEMBLY CLASSROOM
General Assembly Student Outcomes Report: 2019
CHARLOTTE MORGAN (SHE/HER)Lead Instructor, Software Engineering Immersive
London, UK
1111
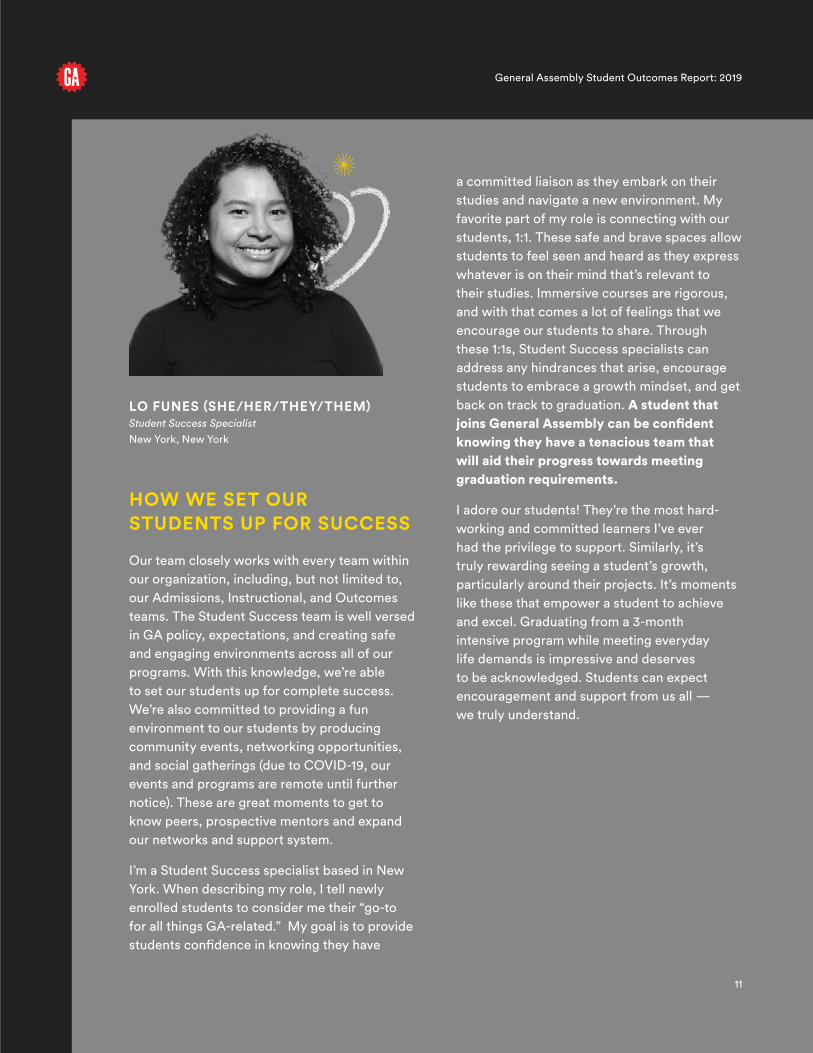
a committed liaison as they embark on their studies and navigate a new environment. My favorite part of my role is connecting with our students, 1:1. These safe and brave spaces allow students to feel seen and heard as they express whatever is on their mind that’s relevant to their studies. Immersive courses are rigorous, and with that comes a lot of feelings that we encourage our students to share. Through these 1:1s, Student Success specialists can address any hindrances that arise, encourage students to embrace a growth mindset, and get back on track to graduation. A student that joins General Assembly can be confident knowing they have a tenacious team that will aid their progress towards meeting graduation requirements.
I adore our students! They’re the most hard-working and committed learners I’ve ever had the privilege to support. Similarly, it’s truly rewarding seeing a student’s growth, particularly around their projects. It’s moments like these that empower a student to achieve and excel. Graduating from a 3-month intensive program while meeting everyday life demands is impressive and deserves to be acknowledged. Students can expect encouragement and support from us all — we truly understand.
Our team closely works with every team within our organization, including, but not limited to, our Admissions, Instructional, and Outcomes teams. The Student Success team is well versed in GA policy, expectations, and creating safe and engaging environments across all of our programs. With this knowledge, we’re able to set our students up for complete success. We’re also committed to providing a fun environment to our students by producing community events, networking opportunities, and social gatherings (due to COVID-19, our events and programs are remote until further notice). These are great moments to get to know peers, prospective mentors and expand our networks and support system.
I’m a Student Success specialist based in New York. When describing my role, I tell newly enrolled students to consider me their “go-to for all things GA-related.” My goal is to provide students confidence in knowing they have
HOW WE SET OUR STUDENTS UP FOR SUCCESS
General Assembly Student Outcomes Report: 2019
LO FUNES (SHE/HER/THEY/THEM)Student Success Specialist
New York, New York

1212
OUR LATEST DATA: OUTCOMES & DEMOGRAPHICS
General Assembly Student Outcomes Report: 2019
OU
R L
AT
ES
T D
ATA
STUDENT OUTCOMES & DEMOGRAPHICS
FULL-TIME STUDENTS Total # Total %
Enrolled 4,313 -
Withdrawals 497 11.5%
Nongraduates 153 3.5%
Graduates 3,663 85.0%
Total Graduation Rate - 85.0%
1 In February 2019, General Assembly re-launched our Web Development Immersive (WDI) as the Software Engineering Immersive (SEI) and added new content focused on computer science. This report reflects student data for both WDI and SEI.
2 In an attempt to deliver the most relevant data, this report scope is beyond one full calendar year. We aim to always deliver the most up-to-date data while also having to let a full 180 days+ cycle to complete for job seekers to accurately represent our population.
This report captures the outcomes for the 4,313 students enrolled in our Software Engineering Immersive1, User Experience Design Immersive, and Data Science Immersive programs that ended between January 1, 2019, and December 31, 20192. The clock for “time to placement” starts the day that a student graduates from their program. (When comparing outcomes of different schools, pay attention to this detail — if graduates or schools can choose the start date of their search, it can distort the data.)
Every GA campus where students were enrolled in Immersive programs during the reporting period is in this report: Atlanta, Austin, Boston, Chicago, Dallas, Denver, London, Los Angeles, Louisville, Melbourne, New York City, Online (Remote), Providence, San Francisco, Seattle, Singapore, Stamford, Sydney, Toronto, and Washington, D.C.
We currently also serve students in Adelaide, Bangkok, Brisbane, Charlotte, Detroit, Edinburgh, Houston, Jeddah, Manchester, Miami, Minneapolis, Nashville, Orlando, Paris, Phoenix, Raleigh, Riyadh, Salt Lake City, San Diego, St. Louis, and Tampa. These locations were not running Immersive programs during this reporting period.
The metrics included on page 12, 13, and 21–23 of this report were reviewed by KPMG LLP (see the Independent Accountants’ Report on page 24). Aside from graduation rate, the data is self-reported by our graduates, as discussed further in the Appendix.
OV
ER
VIE
WA
PP
EN
DIX
AC
CO
UN
TAN
TS
’ LE
TT
ER
NO
TE
FR
OM
CE
ON
OT
E F
RO
M V
P O
PE
RA
TIO
NS
AB
OU
T G
AA
BO
UT
CA
RE
ER
SE
RV
ICE
S

1313
STUDENT OUTCOMES & DEMOGRAPHICS (CONTINUED)
GA CAREER SERVICES Total # Total %
Full-Time Seekers 2,276 -
Placement Within 180 Days of Graduation 2,059 90.5%
Placement More Than 180 Days After Graduation 198 8.7%
No Placement as of This Report 19 0.8%
Total Placement RateOf total placement rate, 96.8% are full-time outcomes; 3.2% are part-time outcomes
- 99.2%
Extended Seekers 235 -
Placement Within 365 Days of Graduation 192 81.7%
Placement More Than 365 Days After Graduation 17 7.2%
No Placement as of This Report 26 11.1%
Extended Seeker Placement RateOf total placement rate, 84.7% are full-time outcomes; 15.3% are part-time outcomes
- 88.9%
Graduates Who Do Not Participate to Completion 1,152 -
Unresponsive to Coach Outreach 432 11.8%
Noncompliant With Career Service Requirements 324 8.8%
Job Seeking Outside of Field of Study 121 3.3%
Return to School 88 2.4%
Family or Health Issue 65 1.8%
Return to Previous Job 57 1.6%
Personal Interest Only 36 1.0%
Visa or Geographic Barrier 28 0.8%
Return to Active Duty 1 <0.01%
Overall Nonparticipant % - 31.5%
General Assembly Student Outcomes Report: 2019
OU
R L
AT
ES
T D
ATA
OV
ER
VIE
WA
PP
EN
DIX
NO
TE
FR
OM
CE
ON
OT
E F
RO
M V
P O
PE
RA
TIO
NS
AB
OU
T G
AA
BO
UT
CA
RE
ER
SE
RV
ICE
SA
CC
OU
NTA
NT
S’ L
ET
TE
R
The accompanying Appendix is an integral part of Student Outcomes and Demographics.

1414
OUR OUTCOMES
General Assembly Student Outcomes Report: 2019
Of the 4,313 students who enrolled in the Immersive programs above, here’s how the data breaks down in aggregate. To see a breakdown of data by course, please refer to the tables included on pages 21-23 of our Appendix.
A YEAR AT A GLANCE
96.8% of graduates who participated in our Full-Time Career Services program accepted a job offer in their field of study within 365 days of graduating. 90.5% of graduates who participated in our Full-Time Career Services program accepted a job offer in their field of study within 180 days of graduating. For graduates of Q1 2019-Q3 2019, this number is 92.4%. For graduates of Q4 2019, who kicked off their job search as COVID-19 impacted the economy, this number is 84.8%. An additional 8.7% of all full-time job seekers accepted a job offer after 180 days, for a total of 99.2% of this eligible population working in the field.
81.7% of graduates who participated in our Extended Seeker Career Services program accepted a job offer in their field of study within 365 days of graduating. An additional 7.2% accepted a job after 365 days. This represents graduates who need to take on contract or part-time work to make extra income as they continue to look for staff positions in their field of study. Contract and part-time work have become especially relevant for graduates over the past year as they navigate life needs and the impact of COVID-19 on their personal worlds, health needs, and job searches. In the past, these graduates were considered nonparticipants in our Career Services program, even if they were actively looking for a job and working with their career coach. We only put graduates on
this pathway if they self-select this option, and it aligns with their personal goals and needs. Extended Job Seekers represents an additional 209 graduates working in their field of study that our career coaches wouldn’t have been able to consistently support in the past.
31.5% of graduates did not participate in GA’s Career Services program. The reasons why graduates fall into this category are provided in the charts provided on page 21–23. While graduates either choose not to participate or do not qualify for continued support due to their lack of engagement in the job search process, we’ve seen a slight increase driven by graduates unresponsive to their Career Coaches during their job search. We know that motivation is drained faster in today’s environment, and we are committed to supporting our grads through their entire job search, through setbacks and triumphs, so long as they are willing to do the work.
OU
R L
AT
ES
T D
ATA
OV
ER
VIE
WA
PP
EN
DIX
NO
TE
FR
OM
CE
ON
OT
E F
RO
M V
P O
PE
RA
TIO
NS
AB
OU
T G
AA
BO
UT
CA
RE
ER
SE
RV
ICE
SA
CC
OU
NTA
NT
S’ L
ET
TE
R

15
OUR COMMUNITY
General Assembly Student Outcomes Report: 2019
Students come to General Assembly from a wide range of professional backgrounds and lived experiences. We ask participants in our Immersive programs to self-report specific demographic data on age, gender, race, and educational attainment, which we outline below. In this report, 76.1% of our student population voluntarily self-reported on these data points.
Note: 24.9% of students elected not to respond.
AGE
More than half of the students who take Immersive training programs at General Assembly are in their mid-twenties to mid-thirties: 60% are between 25–34 at the start of their program, with an additional 20% between 18–24, and 15% between 35–44. The youngest student in this report was 18, and the oldest was 76.
Total Immersives DSI SEI UXDI
3.2%
0.9%
20.3%15.5%
<1% <1%
60.1%
<18 18–24 25–34 35–44 45–54 55–64 65–74 >74
0%
GENDER
The gender breakdown for Immersive programs in aggregate is 58.0% men, 41.0% women, and 1% who identify with another gender identity. On the left, we’ve demonstrated gender breakdown by program type.Women Men Other Prefer Not to Answer
0.4% 1.0% 0.7% 1.1%
28.2%
70.0
%
0.2% 0.5%
29.5%
.69
7%
DATA SCIENCE
IMMERSIVE
SOFTWARE ENGINEERING
IMMERSIVE
.
OU
R L
AT
ES
T D
ATA
OV
ER
VIE
WA
PP
EN
DIX
NO
TE
FR
OM
CE
ON
OT
E F
RO
M V
P O
PE
RA
TIO
NS
AB
OU
T G
AA
BO
UT
CA
RE
ER
SE
RV
ICE
SA
CC
OU
NTA
NT
S’ L
ET
TE
R
15
61.1%
37.5%
UX DESIGN IMMERSIVE
16
FINANCING
For more information on the myriad of financing options available, turn to our Financing Handbook.
General Assembly Student Outcomes Report: 2019
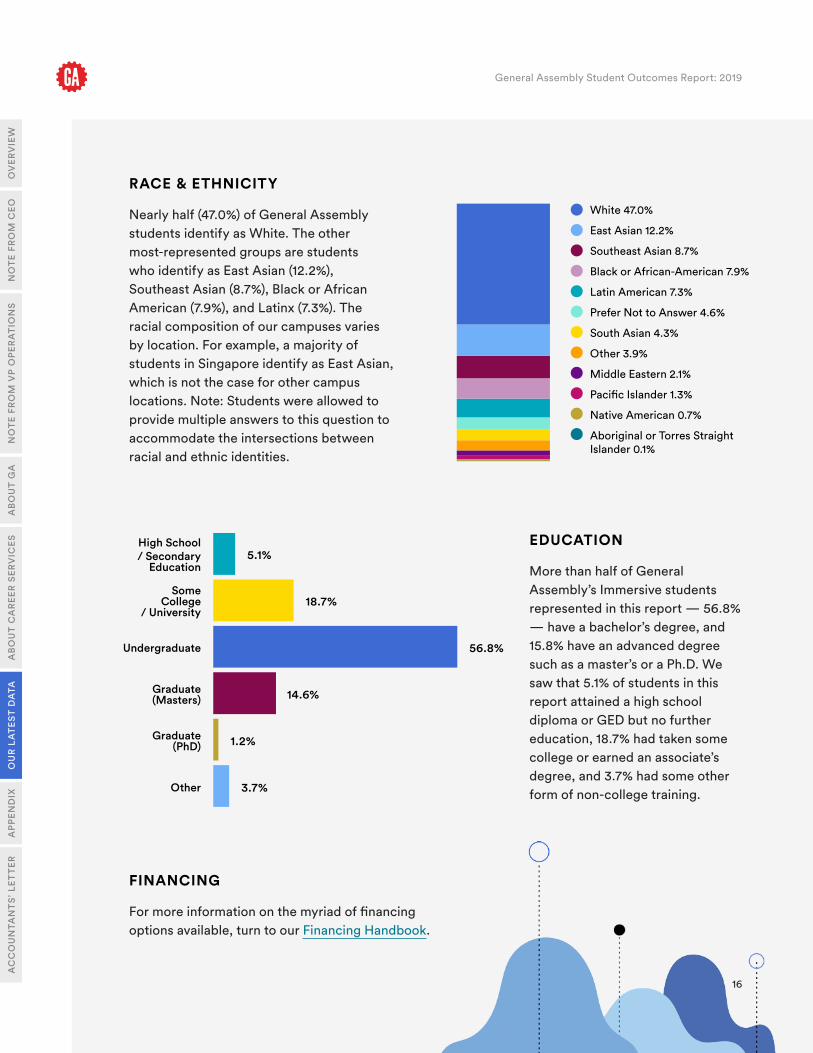
RACE & ETHNICITY
Nearly half (47.0%) of General Assembly students identify as White. The other most-represented groups are students who identify as East Asian (12.2%), Southeast Asian (8.7%), Black or African American (7.9%), and Latinx (7.3%). The racial composition of our campuses varies by location. For example, a majority of students in Singapore identify as East Asian, which is not the case for other campus locations. Note: Students were allowed to provide multiple answers to this question to accommodate the intersections between racial and ethnic identities.
White 47.0%
East Asian 12.2%
Southeast Asian 8.7%
Black or African-American 7.9%
Latin American 7.3%
Prefer Not to Answer 4.6%
South Asian 4.3%
Other 3.9%
Middle Eastern 2.1%
Pacific Islander 1.3%
Native American 0.7%
Aboriginal or Torres Straight Islander 0.1%
EDUCATION
More than half of General Assembly’s Immersive students represented in this report — 56.8% — have a bachelor’s degree, and 15.8% have an advanced degree such as a master’s or a Ph.D. We saw that 5.1% of students in this report attained a high school diploma or GED but no further education, 18.7% had taken some college or earned an associate’s degree, and 3.7% had some other form of non-college training.
High School / Secondary
Education
Some College
/ University
Undergraduate
Graduate (Masters)
Graduate (PhD)
Other
5.1%
1.2%
3.7%
18.7%
14.6%
56.8%
OU
R L
AT
ES
T D
ATA
OV
ER
VIE
WA
PP
EN
DIX
NO
TE
FR
OM
CE
ON
OT
E F
RO
M V
P O
PE
RA
TIO
NS
AB
OU
T G
AA
BO
UT
CA
RE
ER
SE
RV
ICE
SA
CC
OU
NTA
NT
S’ L
ET
TE
R
16

17
Thank you for reading our Outcomes report! The student body represented in this report is just one example of how we continue to expand our reach.
2020 was a tough year, and the pandemic is ongoing as this report goes to publication. We know that so many in our community — students, alumni, staff, and instructors — felt the stress and uncertainty shared by people around the globe.
Nothing will stop us in 2021. We’ll be expanding to new markets to help reskill workforces and giving more workers the chance to reinvent themselves in a world that never stops changing. We will always remain committed to the career success, health, and wellness of our students and graduates. We’re excited to tackle the next set of challenges and meet the education and hiring needs of the future.
If you have any questions about General Assembly or the contents of this report, our Admissions team is here to help: drop us a note at [email protected]. For more information about our vast suite of programs, please visit our education offerings page. Learn more about how our Outcomes support and the people behind it on our career services page.
17
WHAT’S NEXT
General Assembly Student Outcomes Report: 2019
OU
R L
AT
ES
T D
ATA
OV
ER
VIE
WA
PP
EN
DIX
NO
TE
FR
OM
CE
ON
OT
E F
RO
M V
P O
PE
RA
TIO
NS
AB
OU
T G
AA
BO
UT
CA
RE
ER
SE
RV
ICE
SA
CC
OU
NTA
NT
S’ L
ET
TE
R

18
APPENDIX
AP
PE
ND
IX
18
ENROLLED: Student who enrolls in a full-time program and attends the first day of class.
FAMILY OR HEALTH ISSUE: Graduate who notifies GA (via verbal or written communication) that they are not seeking to start and/or continue the job-search process due to family, health, or another personal issue.
FULL-TIME STUDENT: Student who enrolls and pays the enrollment deposit for a full-time program that ends during the reporting period.
GA CAREER SERVICES REQUIREMENTS: Meets Graduation Requirements of GA Immersive Program:
• Actively participates in Outcomes programming in course
• Participates in weekly job search activities (i.e. applying to applicable roles, networking) post course
• Is responsive to their Career Coach
GRADUATE: Full-time student who did not withdraw, passed their course, and was offered Career Services support.
JOB SEEKING OUTSIDE OF FIELD OF STUDY: Graduate who notifies GA (via verbal or written communication) that they are not seeking to start and/or continue the job-search process because they are seeking a job in a field unrelated to the course completed.
NO PLACEMENT WITHIN 180 DAYS OF GRADUATION: Participating graduate who does not achieve job placement within 180 days of graduation.
NONCOMPLIANT WITH CAREER SERVICES: Graduate who does not maintain requirements of GA’s Career Services throughout the duration of the job search.
NONGRADUATES: Students who are enrolled in a full-time program but fail to successfully complete the program.
PARTICIPATING GRADUATES: Graduate who notifies GA (via verbal or written communication) at the time of graduation that they will participate in the GA Career Services program. Once qualified as a Participating Graduate, they must maintain that status through the duration of the job search. These students are known as Full Time Seekers.
PARTICIPATING GRADUATES, EXTENDED: Graduate who notifies GA (via verbal or written communication) that they will participate in the GA Career Services Extended program. Once qualified as a Participating Graduate, Extended, they must maintain that status through the duration of the job search. These students are known as Extended Seekers.
PERSONAL INTEREST ONLY: Graduate who notifies GA (via verbal or written communication) that they are not seeking to start and/or continue the job-search process because they took the course for personal interest only.
PLACEMENT AFTER 180 DAYS SINCE GRADUATION, FULL-TIME OUTCOME: Participating graduate who notifies GA (via verbal or written communication) after 180 days of graduation that they have met one of the following criteria:
General Assembly Student Outcomes Report: 2019
OV
ER
VIE
WN
OT
E F
RO
M C
EO
NO
TE
FR
OM
VP
OP
ER
AT
ION
SA
BO
UT
GA
AB
OU
T C
AR
EE
R S
ER
VIC
ES
OU
R L
AT
ES
T D
ATA
AC
CO
UN
TAN
TS
’ LE
TT
ER

19
• Have accepted an offer that is paid, 32 hours a week or more, and in an occupation for which students are trained (or in a related, comparable, recognized occupation). Contract work for at least one month or freelancing for the equivalent of full-time, as well as internships and apprenticeships, are included as long as they are paid and 32 hours a week or more.
• Have received three offers that meet the above criteria and turn down all offers.
• Are using their new skills to launch a new company or expand a company of their own.
• Have returned to a former company and are utilizing new skills learned through course participation in their role.
PLACEMENT WITHIN 180 DAYS OF GRADUATION, FULL-TIME OUTCOME: Participating graduate who notifies GA (via verbal or written communication) within 180 days of graduation that they have met one of the following criteria:
• Have accepted an offer that is paid, 32 hours a week or more, and in an occupation for which students are trained (or in a related, comparable, recognized occupation). Contract work for at least one month or freelancing for the equivalent of full-time, as well as internships and apprenticeships, are included as long as they are paid and 32 hours a week or more.
• Have received three offers that meet the above criteria and turn down all offers.
• Are using their new skills to launch a new company or expand a company of their own.
• Have returned to a former company and are utilizing new skills learned through course participation in their role.
PLACEMENT AFTER 180 DAYS SINCE GRADUATION, PART-TIME OUTCOME: Participating Graduate who notifies GA (via verbal or written communication) after 180 days of graduation that they have met the following criteria:
• Have accepted an offer in an occupation for which students are trained or in a related, comparable, recognized occupation that is either less than 32 hours a week or unpaid.
• Are self-selecting to end their job search at the given time due to acceptance of this offer.
PLACEMENT WITHIN 180 DAYS OF GRADUATION, PART-TIME OUTCOME: Participating Graduate who notifies GA (via verbal or written communication) within 180 days of graduation that they have met the following criteria:
• Have accepted an offer in an occupation for which students are trained or in a related, comparable, recognized occupation that is either less than 32 hours a week or unpaid.
• Are self-selecting to end their job search at the given time due to acceptance of this offer.
REPORTING PERIOD: The students reported are those who participated in an immersive program (Software Engineering, Data Science, or User Experience Design) that ended between January 1, 2019, and December 31, 2019.
General Assembly Student Outcomes Report: 2019
AP
PE
ND
IXO
VE
RV
IEW
NO
TE
FR
OM
CE
ON
OT
E F
RO
M V
P O
PE
RA
TIO
NS
AB
OU
T G
AA
BO
UT
CA
RE
ER
SE
RV
ICE
SO
UR
LA
TE
ST
DA
TAA
CC
OU
NTA
NT
S’ L
ET
TE
R
19

2020
General Assembly Student Outcomes Report: 2019
AP
PE
ND
IXO
VE
RV
IEW
NO
TE
FR
OM
CE
ON
OT
E F
RO
M V
P O
PE
RA
TIO
NS
AB
OU
T G
AA
BO
UT
CA
RE
ER
SE
RV
ICE
SO
UR
LA
TE
ST
DA
TAA
CC
OU
NTA
NT
S’ L
ET
TE
R
RETURN TO ACTIVE DUTY: Graduate who notifies GA (via verbal or written communication) that they are not seeking to start and/or continue the job-search process because they are returning to active military duty.
RETURN TO PREVIOUS JOB: Graduate who notifies GA (via verbal or written communication) that they are not seeking to start and/or continue the job-search process because they are returning to the same job by which they were employed prior to enrolling in the program.
RETURN TO SCHOOL: Graduate who notifies GA (via verbal or written communication) that they are not seeking to start and/or continue the job-search process because they are returning to school or continuing their education.
UNRESPONSIVE TO COACH OUTREACH: Graduate who does not respond to three or more outreach attempts from GA Career Services staff.
VISA OR GEOGRAPHIC BARRIER: Graduate who notifies GA (via verbal or written communication) that, as of the end of the reporting date, they are relocating to a region where GA did not have a physical presence during the reporting period or did not obtain a visa in the current location, restricting their ability to work in the desired location.
WITHDRAWALS: Student who starts a program but does not complete it. Students may withdraw from GA at any time after their cancellation period, which may vary by state. Students may also be withdrawn by GA for failure to maintain satisfactory progress, failure to abide by rules and regulations, absences in excess of maximum set forth by
GA, and/or failure to meet financial obligations to GA. Refunds for withdrawals are determined in accordance with state-prescribed refund policies. Most states provide for prorated refunds based on the amount of the course attended through a certain duration of the course.
21
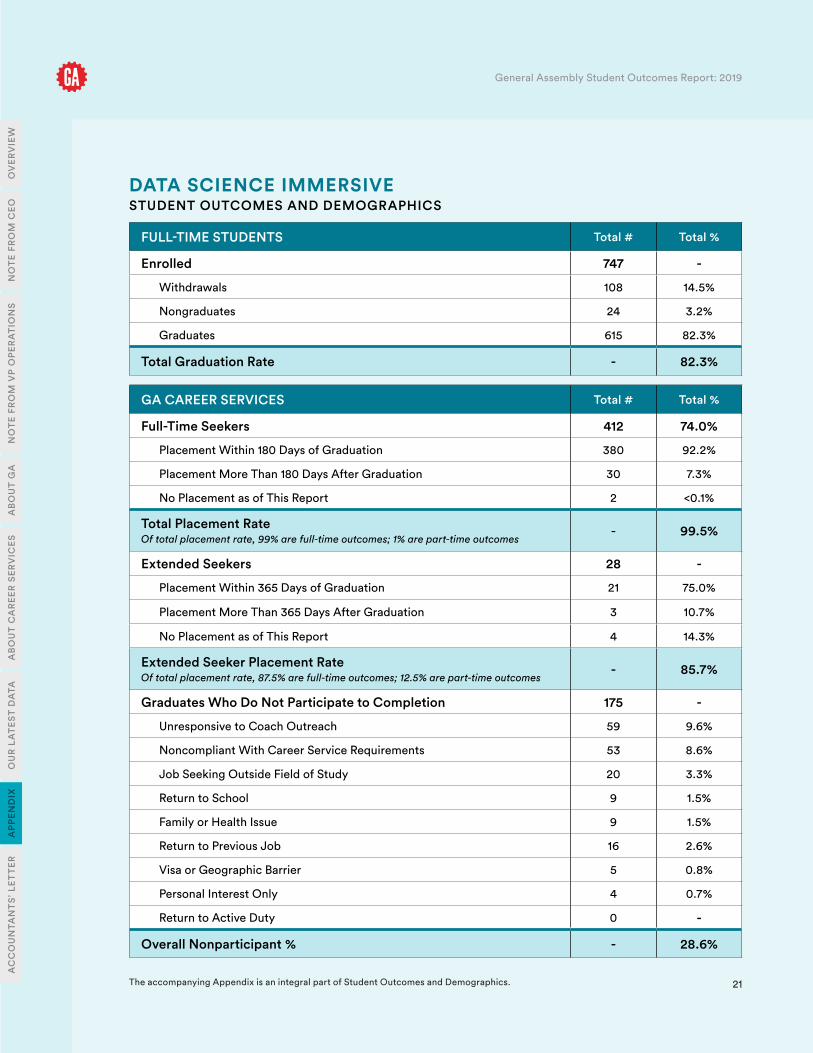
DATA SCIENCE IMMERSIVESTUDENT OUTCOMES AND DEMOGRAPHICS
21
AP
PE
ND
IX
GA CAREER SERVICES Total # Total %
Full-Time Seekers 412 74.0%
Placement Within 180 Days of Graduation 380 92.2%
Placement More Than 180 Days After Graduation 30 7.3%
No Placement as of This Report 2 <0.1%
Total Placement RateOf total placement rate, 99% are full-time outcomes; 1% are part-time outcomes
- 99.5%
Extended Seekers 28 -
Placement Within 365 Days of Graduation 21 75.0%
Placement More Than 365 Days After Graduation 3 10.7%
No Placement as of This Report 4 14.3%
Extended Seeker Placement RateOf total placement rate, 87.5% are full-time outcomes; 12.5% are part-time outcomes
- 85.7%
Graduates Who Do Not Participate to Completion 175 -
Unresponsive to Coach Outreach 59 9.6%
Noncompliant With Career Service Requirements 53 8.6%
Job Seeking Outside Field of Study 20 3.3%
Return to School 9 1.5%
Family or Health Issue 9 1.5%
Return to Previous Job 16 2.6%
Visa or Geographic Barrier 5 0.8%
Personal Interest Only 4 0.7%
Return to Active Duty 0 -
Overall Nonparticipant % - 28.6%
FULL-TIME STUDENTS Total # Total %
Enrolled 747 -
Withdrawals 108 14.5%
Nongraduates 24 3.2%
Graduates 615 82.3%
Total Graduation Rate - 82.3%
General Assembly Student Outcomes Report: 2019
OV
ER
VIE
WN
OT
E F
RO
M C
EO
NO
TE
FR
OM
VP
OP
ER
AT
ION
SA
BO
UT
GA
AB
OU
T C
AR
EE
R S
ER
VIC
ES
OU
R L
AT
ES
T D
ATA
AC
CO
UN
TAN
TS
’ LE
TT
ER
The accompanying Appendix is an integral part of Student Outcomes and Demographics.

22
SOFTWARE ENGINEERING IMMERSIVESTUDENT OUTCOMES AND DEMOGRAPHICS
22
AP
PE
ND
IX
GA CAREER SERVICES Total # Total %
Full-Time Seekers 950 -
Placement Within 180 Days of Graduation 875 92.1%
Placement More Than 180 Days After Graduation 69 7.3%
No Placement as of This Report 6 0.6%
Total Placement RateOf total placement rate, 96.7% are full-time outcomes; 3.3% are part-time outcomes
- 99.4%
Extended Seekers 97 -
Placement Within 365 Days of Graduation 76 78.4%
Placement More Than 365 Days After Graduation 10 10.3%
No Placement as of This Report 11 11.3%
Extended Seeker Placement RateOf total placement rate, 93% are full-time outcomes; 7% are part-time outcomes
- 88.7%
Graduates Who Do Not Participate to Completion 553 -
Unresponsive to Coach Outreach 214 13.4%
Noncompliant With Career Service Requirements 157 9.8%
Job Seeking Outside of Field of Study 55 3.4%
Return to School 41 2.6%
Family or Health Issue 27 1.7%
Return to Previous Job 24 1.5%
Visa or Geographic Barrier 13 0.8%
Personal Interest Only 21 1.3%
Return to Active Duty 1 0.1%
Overall Nonparticipant % - 34.6%
FULL-TIME STUDENTS Total # Total %
Enrolled 1,966 -
Withdrawals 267 13.6%
Nongraduates 99 5.0%
Graduates 1,600 81.4%
Total Graduation Rate - 81.4%
General Assembly Student Outcomes Report: 2019
OV
ER
VIE
WN
OT
E F
RO
M C
EO
NO
TE
FR
OM
VP
OP
ER
AT
ION
SA
BO
UT
GA
AB
OU
T C
AR
EE
R S
ER
VIC
ES
OU
R L
AT
ES
T D
ATA
AC
CO
UN
TAN
TS
’ LE
TT
ER
The accompanying Appendix is an integral part of Student Outcomes and Demographics.

23
USER EXPERIENCE DESIGN IMMERSIVESTUDENT OUTCOMES AND DEMOGRAPHICS
23
AP
PE
ND
IX
GA CAREER SERVICES Total # Total %
Full-Time Seekers 914 -
Placement Within 180 Days of Graduation 804 88.0%
Placement More Than 180 Days After Graduation 99 10.8%
No Placement as of This Report 11 1.2%
Total Placement RateOf total placement rate, 95.9% are full-time outcomes; 4.1% are part-time outcomes
- 98.8%
Extended Seekers 110 -
Placement Within 365 Days of Graduation 95 86.4%
Placement More Than 365 Days After Graduation 4 3.6%
No Placement as of This Report 11 10.0%
Extended Seeker Placement RateOf total placement rate, 76.8% are full-time outcomes; 23.2% are part-time outcomes
- 90.0%
Graduates Who Do Not Participate to Completion 424 -
Unresponsive to Coach Outreach 159 11.0%
Noncompliant With Career Service Requirements 114 7.9%
Job Seeking Outside of Field of Study 46 3.2%
Return to School 38 2.6%
Family or Health Issue 29 2.0%
Return to Previous Job 17 1.2%
Visa or Geographic Barrier 10 0.7%
Personal Interest Only 11 0.8%
Return to Active Duty 0 -
Overall Nonparticipant % - 29.4%
FULL-TIME STUDENTS Total # Total %
Enrolled 1,600 -
Withdrawals 122 7.6%
Nongraduates 30 1.9%
Graduates 1,448 90.5%
Total Graduation Rate - 90.5%
General Assembly Student Outcomes Report: 2019
OV
ER
VIE
WN
OT
E F
RO
M C
EO
NO
TE
FR
OM
VP
OP
ER
AT
ION
SA
BO
UT
GA
AB
OU
T C
AR
EE
R S
ER
VIC
ES
OU
R L
AT
ES
T D
ATA
AC
CO
UN
TAN
TS
’ LE
TT
ER
The accompanying Appendix is an integral part of Student Outcomes and Demographics.