Embed Size (px)
Citation preview
Student Perceptions Toward a High School Advisory Program
Travis R. Gatewood B.A., University of Missouri-Kansas City, 1999 M.S., University of Missouri-Kansas City, 2003
Submitted to the Graduate Department and Faculty of the School of Education of Baker University in partial fulfillment of the requirements for the degree of
Doctor of Education in Educational Leadership
____ ___________________________ Verneda Edwards, Ed.D.
________________________________
Jim Robins, Ed.D.
________________________________ Nicole Baker, Ph.D.
Date Defended: April 3, 2020
Copyright 2020 by Travis R. Gatewood
ii
Abstract
The purpose of this quantitative study was to determine the impact of a high school
advisory program in a large, diverse, midwestern, suburban, public high school, as
measured primarily by a cross-sectional descriptive survey of student perceptions using a
Likert-type scale. Specifically, this research study focused on student perceptions toward
an advisory program. In addition, this research study correlated student perceptions
toward an advisory program and an advisory teacher, toward an advisory teacher and
belonging at school, and toward an advisory program and belonging at school. Lastly,
this research study focused on student perceptions toward the intended outcomes of an
advisory program. The literature review focused on the evolution of college and career
readiness, the transformation in socio-economic dynamics, the proliferation of mental
health issues, the implementation of social-emotional learning, the design of tiered
support systems, the focus on personalized planning, and the efficacy of advisory
programming. To measure student perceptions, a descriptive survey was distributed
during one advisory period to 1,534 students in grades 9 -12 at Primus High School in the
Pressman School District. From the results of 686 respondents, analyzed by ANOVAs
for the hypothesis testing of RQs 1-4 and RQs 8-23 and Pearson product moment
correlation coefficients for the hypothesis testing of RQs 5-7, the researcher has
concluded several key themes about an advisory program: the value of an advisory
program for minority students and academically at-risk students, the impact of the
advisory teacher on an advisory program, and the positive relationship between student
connectedness with an advisory program and student belonging at school.

iii
Dedication
To the teachers who do good work and play from the heart.
To my girls Isela and Elina on which my entire world is built.
To my parents Marcus and Carla who taught me work, sacrifice, and unconditional love.
To Linds for life, love, and magic, for listening to the universe and for saving my life.
To the boy who got everything he always wanted and lived happily ever after.

iv
Acknowledgements
At times, the delicate balance of managing the program, my job, and my family
pushed me into the red zone, testing my abilities to simultaneously, adroitly choreograph
a thousand disparate tasks into some kind of semblance of synthesis—of focus and
direction, alignment and momentum. In the end, I leave the Baker program with a
diploma, a vision, and a design for the final act of my career. I know who I am and what
I will do. I am committed to serving the students, teachers, families, and stakeholders of
my community. I am committed to living with integrity and transparency. I am
committed to leading in such a way that it elevates and empowers those with whom I
interact and engage.
Thank you to my key advisors and course professors who mentored me and
showed me the way. I am indebted for the advice and guidance of Dr. Verneda Edwards
whose leadership course aligned and focused my vision of servant leadership and whose
support and patience piloted me throughout my doctorate journey. Thank you to Dr. Peg
Waterman for her good news and for being so kind and generous with her time and
expertise throughout the data collection and analysis process. Thank you to Dr. Ed King
for being a valuable mentor during my field experiences and my portfolio defense.
Thank you to Dr. Jim Robins for his challenging course and for his hot seat and quality
feedback on my portfolio and my doctorate. Thank you to the entire Baker staff for their
professionalism and for providing me with a valuable, formative experience. Thank you
to my Cohort 20 classmates and my A-team tablemates—Kristin, Julitha, Lori, and
Chacey—who made every Wednesday night enjoyable and who pushed me through the
coursework. Thank you to Dr. Nicole Baker for inspiring me to pursue my doctorate, for

v
being a valuable friend and mentor throughout my career, and for officiating my wedding
ceremony and now serving on my doctorate committee.
Thank you to the Shawnee Mission South community. This doctorate is a
testament and tribute to all of the students and athletes, teachers and coaches with whom I
have worked over twenty years in education. Thank you to Dr. Joe Gilhaus for being an
instrumental leader early in my career, for standing in the fire for your staff, and for
leading with humor and humility. Thank to Dr. Todd Dain for providing me important
leadership opportunities, for celebrating our community, and for building our school
culture for years to come. Thank you to Dr. Jim McMullen for taking a chance on a
nineteen-year old kid to coach and for showing me the ropes and giving me entry into the
profession. Thank you to the district curriculum department for mentoring me in my role
and for pushing me in my thinking on leadership and learning. Thank you to my fellow
English teachers who do the hard, necessary labor for the students they serve.
Thank you to the educators who inspired me to sacrifice myself for this
profession. Each day in the classroom your spirit lives through me, and each day I work
to live the model you set for me. Thank you to Brenda Williams, Randy Gray, Bill
Stiegemeier, and Sandy Hermreck.
Thank you to my lifelong friend Mike Miles, the captain of the ship, the one who
always carries the load and takes responsibility for others. Thank you for the reboot and
vision-setting. From those talks, new worlds were born. Thank you to the Lake Crew for
journeying together on this great big pirate ship through life. Good friends, good times.
Thank you to Les Claypool for being the soundtrack to my life since I was sixteen
years old. Thank you for teaching me about creative control, personal branding, artistic

vi
integrity, and authentic character. Thank you for showing me that we are the music
makers, and we are the dreamers of dreams. Thank you for showing me the power in a
world of pure imagination.
Thank you to my brothers Jordan and Tyler for being so talented, brilliant, and
hilarious. Thank you for inspiring me with your greatness in your personal and
professional lives.
Thank you to my parents Marcus and Carla Gatewood who always put their boys
first, who taught me to sweat for my dreams, who modeled humility in the service of
others, who lived with laughter in the face of challenge. This doctorate is just a big kid
version of the tree diary we made together years ago.
Thank you to my girls Isela and Elina. You fill my life with love. You are my
world. I am so proud of you. You live with such big hearts. You are kind and fun, full
of goodness and joy. You have been so strong and courageous through difficult times.
You have been so patient during this doctorate process. I will forever cherish all of our
little field trips together. You are everything I could have ever wanted as a father. I am
so fortunate that you are in my life.
Thank you to Linds for your patience, care, and support throughout this long
arduous journey. Thank you for love and life. Thank you for our experiences and
adventures. Thank you for our patio sits. Thank you for tapping into the universe.
Thank you for your humor and brilliance. Thank you for rescuing the boy. Thank you
for bringing Ethan, Max, and Quinn into my life. Thank you for being the queen of the
little yellow castle and now the manor. Thank you for playing from the heart as a wife,
mother, and teacher. We are all better for you in our lives. If we go, we go together.

vii
Table of Contents
Abstract ............................................................................................................................... ii
Dedication .......................................................................................................................... iii
Acknowledgements ............................................................................................................ iv
Table of Contents .............................................................................................................. vii
List of Tables .......................................................................................................................x
Chapter 1: Introduction ........................................................................................................1
Background ..............................................................................................................3
Statement of the Problem .......................................................................................11
Purpose of the Study ..............................................................................................11
Significance of the Study .......................................................................................12
Delimitations ..........................................................................................................13
Assumptions ...........................................................................................................13
Research Questions ................................................................................................14
Definition of Terms................................................................................................17
Organization of the Study ......................................................................................22
Chapter 2: Review of the Literature...................................................................................24
The Evolution of College and Career Readiness ...................................................27
The Transformation in Socio-Economic Dynamics ..............................................32
The Proliferation of Mental Health Issues .............................................................35
The Implementation of Social-Emotional Learning ..............................................38
The Design of Tiered Support Systems .................................................................41
The Focus on Personalized Planning .....................................................................45

viii
The Efficacy of Advisory Programming................................................................48
Summary ................................................................................................................53
Chapter 3: Methods ............................................................................................................54
Research Design.....................................................................................................54
Selection of Participants and Sampling Procedure ................................................56
Measurement ..........................................................................................................57
Data Collection Procedures....................................................................................63
Data Analysis and Hypothesis Testing ..................................................................64
Limitations .............................................................................................................82
Summary ................................................................................................................83
Chapter 4: Results ..............................................................................................................85
Descriptive Statistics ..............................................................................................86
Hypothesis Testing.................................................................................................88
Summary ..............................................................................................................132
Chapter 5: Interpretation and Recommendations ............................................................134
Study Summary ....................................................................................................134
Overview of the problem .........................................................................134
Purpose statement and research questions ...............................................135
Review of the methodology .....................................................................136
Major findings ..........................................................................................137
Findings Related to the Literature........................................................................142
Conclusions ..........................................................................................................150
Implications for action .............................................................................150

ix
Recommendations for future research .....................................................154
Concluding remarks .................................................................................158
References ........................................................................................................................160
Appendices .......................................................................................................................175
Appendix A. Primus High School Bell Schedule ................................................176
Appendix B. Response to Intervention (RTI) Pyramid of Interventions .............178
Appendix C. Mike Mattos Pioneer Middle School Tutorial Schedule ................180
Appendix D. Student Survey on High School Advisory .....................................182
Appendix E. Email for Survey Approval from Panorama Education ..................189
Appendix F. Pressman School District Permission to Administer Survey ..........191
Appendix G. Baker University IRB Approval Letter ..........................................193
x
List of Tables
Table 1. Comparison of Primus High School Enrollment to Other District High School
Enrollment 2017-2018 ..........................................................................................4
Table 2. Comparison of Primus High School Racial Demographics to Other District
High School Racial Demographics 2017-2018 ....................................................5
Table 3. Kansas State High Schools Classifications and Enrollments 2019-2020 .............6
Table 4. Comparison of Primus High School Demographics to State Demographics
2012-2013 ............................................................................................................7
Table 5. Comparison of Sample and Total Populations of Primus High School to
Pressman School District 2018-2019 ...................................................................7
Table 6. Pressman School District Demographic Changes 1998-2018 ..............................8
Table 7. Student Survey Participant Characteristics .........................................................87
Table 8. Descriptive Statistics for the Results of the Test for H1 .....................................89
Table 9. Descriptive Statistics for the Results of the Test for H2 .....................................90
Table 10. Descriptive Statistics for the Results of the Test for H3 ....................................91
Table 11. Descriptive Statistics for the Results of the Test for H4 ....................................92
Table 12. Descriptive Statistics for the Results of the Test for H5 ....................................93
Table 13. Descriptive Statistics for the Results of the Test for H6 ....................................94
Table 14. Descriptive Statistics for the Results of the Test for H7 ....................................95
Table 15. Descriptive Statistics for the Results of the Test for H8 ....................................96
Table 16. Descriptive Statistics for the Results of the Test for H9 ....................................97
Table 17. Descriptive Statistics for the Results of the Test for H10 ..................................98
Table 18. Descriptive Statistics for the Results of the Test for H11 ..................................99
xi
Table 19. Descriptive Statistics for the Results of the Test for H12 ................................100
Table 20. Descriptive Statistics for the Results of the Test for H13 ................................101
Table 21. Descriptive Statistics for the Results of the Test for H14 ................................102
Table 22. Descriptive Statistics for the Results of the Test for H15 ................................104
Table 23. Descriptive Statistics for the Results of the Test for H16 ................................105
Table 24. Descriptive Statistics for the Results of the Test for H26 ................................113
Table 25. Descriptive Statistics for the Results of the Test for H27 ................................114
Table 26. Descriptive Statistics for the Results of the Test for H28 ................................115
Table 27. Descriptive Statistics for the Results of the Test for H29 ................................116
Table 28. Descriptive Statistics for the Results of the Test for H30 ................................118
Table 29. Descriptive Statistics for the Results of the Test for H31 ................................119
Table 30. Descriptive Statistics for the Results of the Test for H32 ................................120
Table 31. Descriptive Statistics for the Results of the Test for H33 ................................121
Table 32. Descriptive Statistics for the Results of the Test for H34 ................................123
Table 33. Descriptive Statistics for the Results of the Test for H35 ................................124
Table 34. Descriptive Statistics for the Results of the Test for H36 ................................125
Table 35. Descriptive Statistics for the Results of the Test for H37 ................................127
Table 36. Descriptive Statistics for the Results of the Test for H38 ................................128
Table 37. Descriptive Statistics for the Results of the Test for H39 ................................130
Table 38. Descriptive Statistics for the Results of the Test for H40 ................................131
Table 39. Descriptive Statistics for the Results of the Test for H41 ................................132

Chapter 1
Introduction
Because of the increased focus on College and Career Readiness (CCR) and
Social-Emotional Learning (SEL), some school districts have responded by implementing
advisory programs in secondary schools as a delivery system of supports for college
preparation, career planning, community involvement, and personal development
(Vander Ark, 2015). The Kansas State Department of Education (KSDE, 2018f)
anchored this process with Social-Emotional Character Development (SECD) standards
and required an Individual Plan of Study (IPS), defined as “a product and a process that
students may use with support from school counselors, teachers, and families to help
them define their career goals and postsecondary plans and make informed decisions
about their courses and activities throughout high school” (KSDE, 2018a, p. 1). As of
2019, KSDE was one of only fourteen states with articulated K-12 SEL competencies
(Collaborative for Academic, Social, and Emotional Learning, 2019a). Being one of the
first states to fully implement SEL competencies through its SECD standards and the IPS,
KSDE offered models of implementation on its website by providing examples from
several school districts (KSDE, 2018b). Also, during the 2018-2019 school year, KSDE
offered six SECD roadshows at various locations throughout the state and four SECD
updates at KSDE curriculum leader meetings to support school districts in the
implementation of the SECD standards and the IPS (KSDE, 2018c).
Four of the five measures for Kansas Education Systems Accreditation (KESA)
were tied directly to the SECD standards and the IPS (KSDE, 2018g). In order to meet
these state accreditation requirements established under the Kansans Can vision for

2
education, some school districts have bundled the SECD standards and the IPS into a
collection of prepackaged lessons for teachers to deliver during advisory periods
embedded within the school day.
The implementation of secondary school advisory programs as a means to
encourage positive social behavior, to foster greater school engagement, to support
increased academic achievement, and to promote post-secondary student success began
in the 1990s at the same time schools and legislation began to advocate for more CCR
and Career and Technical Education (CTE). Consequently, the first comprehensive
literature on the effectiveness of advisory programs emerged at the same time (Ayers,
1994; MacIver, 1990; Manning & Saddlemire, 1996; Wilson, 1998; Ziegler & Mulhall,
1994). From the 1990s to the 2010s, the research produced mixed results on the
effectiveness of advisory programs as measured by attitudes, grades, participation,
behavior, and post-secondary success. The studies on the effectiveness of advisory
programs typically focused on middle school environments (Demaray & Malecki, 2002;
Shulkind & Foote, 2009; Weilbacher & Lanier, 2012), often in urban school districts
(Botvin, Griffin, & Nichols, 2006; Gard, 2014; Montague, Enders, Cavendish, & Castro,
2011). With an increase in the implementation of Social-Emotional Learning (SEL)
initiatives in the 2000s, advisory programs had been tasked with an additional level of
responsibility for the education of the whole child (ASCD, 2020). Meta-analyses, such
as those conducted by Durlak, Weissberg, Dymnicki, Taylor, and Schellinger (2011) and
by Taylor, Durlak, Oberle, and Weissberg (2017), examined the findings of other
researchers on the impacts of advisory programs on the social-emotional and character
development of students.

3
Background
During the 2010s, as KSDE emphasized CCR and SECD, Pressman School
District (PSD) experienced growth in subgroup populations. In 1998, the district had a
population of 89.2% White students, 4.1% Black or African-American students, 3.7%
Hispanic or Latino students, and 7.8% Free and Reduced Lunch students (PSD, 2018).
By 2018, the district had a population 64.0% White students, 9.0% Black or African-
American students, 17.0% Hispanic or Latino students, and 35.0% Free and Reduced
Lunch students (PSD, 2018). In addition, the school district experienced a decline in
graduation from 91.0% in 2011 to 88.5% in 2016 (PSD, 2018). In order to meet the
state’s new accreditation standards and to support the school’s increasingly diverse
population, PSD implemented an advisory program during the 2016-2017 school year, a
program which articulated broad principles of college preparation, career readiness,
community service, and personal development for students as documented by an IPS.
The goal of an advisory program was to create opportunities for students to make more
informed decisions about their post-high school transitions, for students to discover more
ways to connect themselves to their school and local communities, and for students to
better understand their own goals, values, strengths, and weaknesses as individuals
(KSDE, 2018h).
Primus High School (PHS), within the Pressman School District, provided a
representative student population for this study. Primus High School housed 1,534
students (PSD, 2018). Primus High School housed 396 freshman students, 369
sophomore students, 369 junior students, and 336 senior students (PSD, 2018). Primus
High School housed a population of 66% White, 9% Black, 17% Hispanic, 4% Asian,

4
and 4% Multi-Racial students (PSD, 2018). In addition, Primus High School housed a
population of 10% Special Education students (SPED), 10% English Language Learner
students (ELL), and 27% Free and Reduced Lunch (FRL) students (PSD, 2018). Primus
High School had a graduation rate of 88.1% (PSD, 2018). The Primus High School total
student enrollment was representative of other total student enrollments in the Pressman
School District (Table 1).
Table 1
Comparison of Primus High School Enrollment to Other District High School Enrollment
2017-2018
Notes: SPED = Special Education students; ELL = English Language Learner students;
and FRL = Free and Reduced Lunch students. Adapted from “Data Gallery Notebook,”
by Pressman School District, Shawnee Mission, KS.
The Primus High School ethnic demographics also were representative of the district
ethnic demographics (Table 2). The Pressman School District is composed of five high
schools with similar ethnic demographics in each school except for high school A, which
housed a predominantly affluent, White population. Of the five schools in the district,
Primus High School had the third most White students, Black students, and Hispanic
Pressman High Schools Enrollment SPED ELL FRL
A 1,790 5% 2% 8%
B 1,467 10% 12% 47%
C 1,653 9% 9% 28%
D 1,723 9% 14% 43%
Primus High School 1,534 10% 10% 27%
Total Enrollment 8,167

5
students, making the high school the median value in the district’s three most populous
ethnic categories.
Table 2
Comparison of Primus High School Ethnic Demographics to Other District High School
Ethnic Demographics 2017-2018
Notes: Adapted from “Data Gallery Notebook,” by Pressman School District, 2018,
Shawnee Mission, KS.
Primus High School also was chosen because of its representative student population size
with other large high schools in the state (Table 3). With a population of 1,534 students,
Primus High School was classified as a 6A public high school (PSD, 2018). This
enrollment made Primus High School one of the 36 largest high schools in the state out of
353 total high schools.
Pressman High Schools White Black Hispanic Asian Multi-Racial
A 85% 2% 7% 2% 4%
B 56% 7% 28% 3% 6%
C 64% 11% 17% 4% 4%
D 55% 15% 21% 2% 5%
Primus High School 66% 9% 17% 4% 4%

6
Table 3
Kansas State High Schools Classifications and Enrollments 2019-2020
Notes: Adapted from “2019-2020 Classifications and Enrollments,” by KSHSAA, 2020,
Retrieved from http://www.kshsaa.org/Public/General/Classifications.cfm.
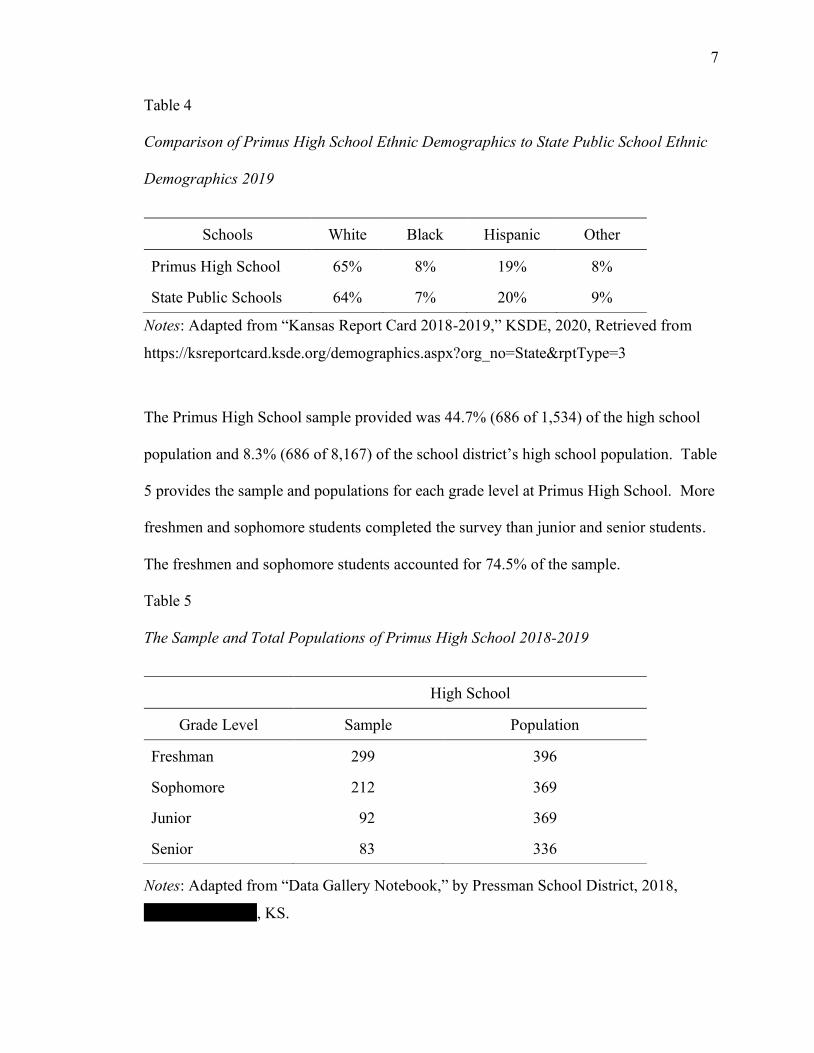
In addition, Primus High School was chosen because of its representative ethnic
demographics when compared to other high schools in the state (Table 4). Primus High
School was almost identical in its ethnic composition to the overall state percentages,
differing by only 1% in each category. The district, like the state, had experienced the
largest growth in its Hispanic population from the year 1999 to the year 2019.
KSHAA Classification Enrollment Schools
6A 1312-2431 36
5A 710-1305 36
4A 312-661 36
3A 172-305 64
2A 109-171 64
1A 14-108 117
7
Table 4
Comparison of Primus High School Ethnic Demographics to State Public School Ethnic
Demographics 2019
Notes: Adapted from “Kansas Report Card 2018-2019,” KSDE, 2020, Retrieved from
https://ksreportcard.ksde.org/demographics.aspx?org_no=State&rptType=3
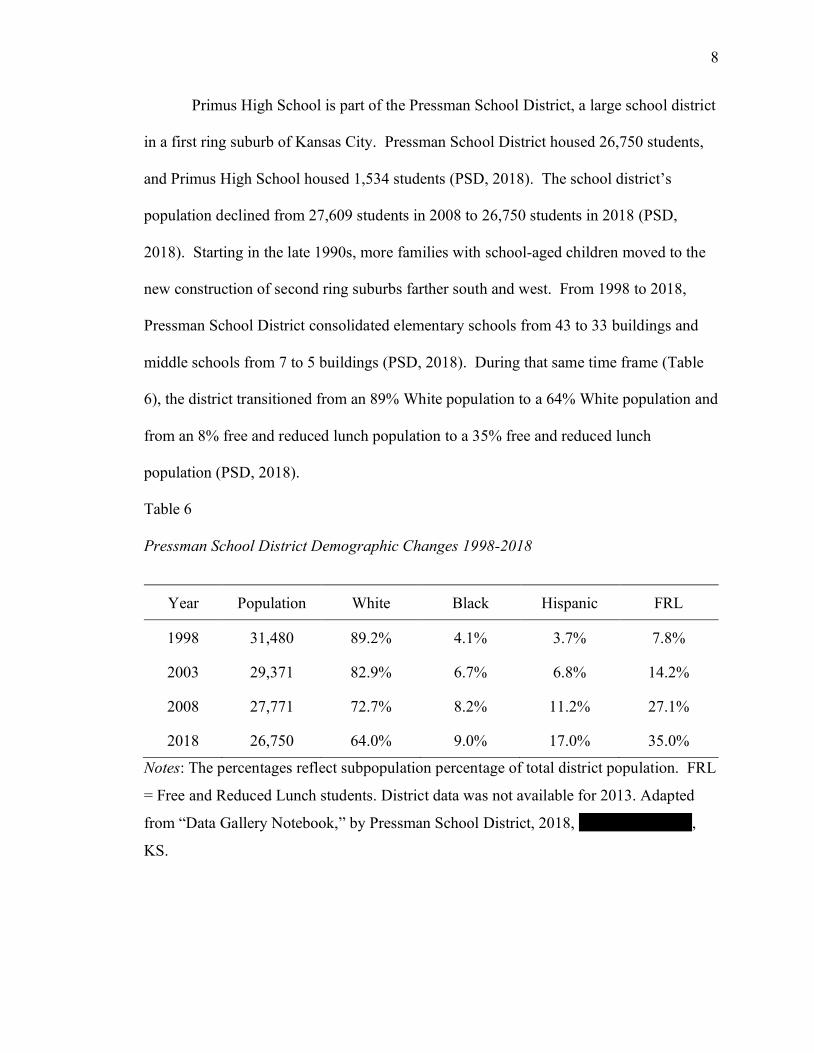
The Primus High School sample provided was 44.7% (686 of 1,534) of the high school
population and 8.3% (686 of 8,167) of the school district’s high school population. Table
5 provides the sample and populations for each grade level at Primus High School. More
freshmen and sophomore students completed the survey than junior and senior students.
The freshmen and sophomore students accounted for 74.5% of the sample.
Table 5
The Sample and Total Populations of Primus High School 2018-2019
Notes: Adapted from “Data Gallery Notebook,” by Pressman School District, 2018,
Shawnee Mission, KS.
Schools White Black Hispanic Other
Primus High School 65% 8% 19% 8%
State Public Schools 64% 7% 20% 9%
High School
Grade Level Sample Population
Freshman 299 396
Sophomore 212 369
Junior 92 369
Senior 83 336
8
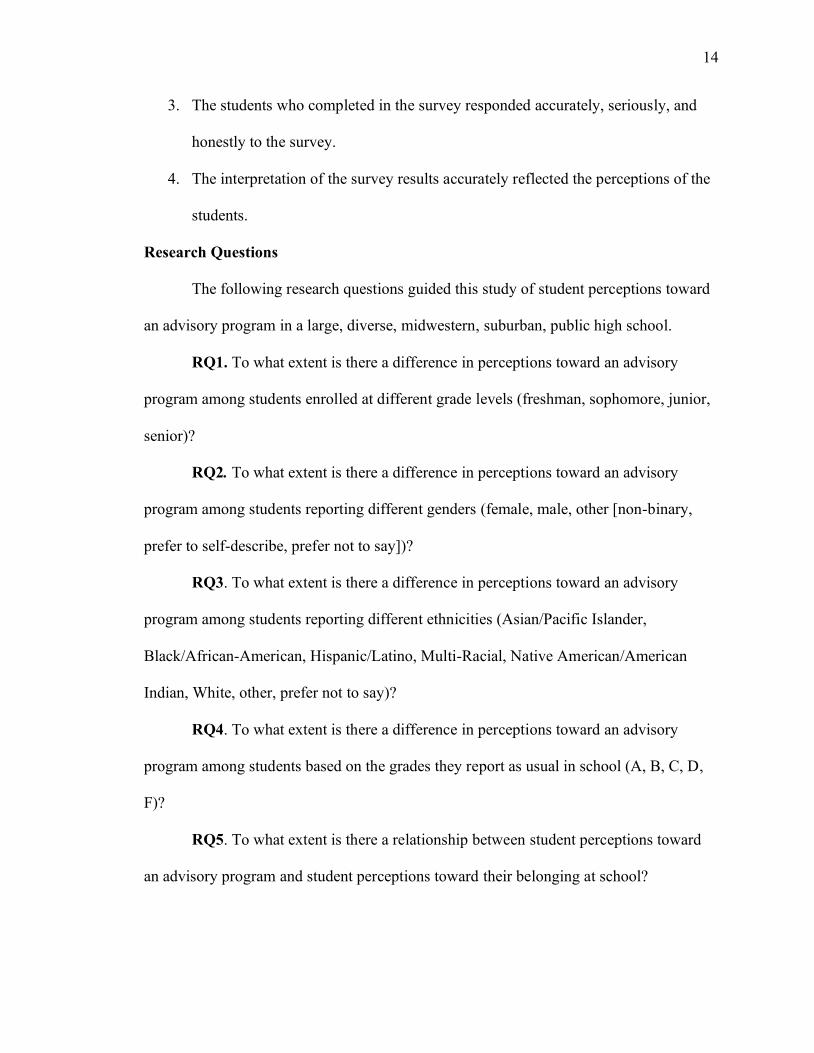
Primus High School is part of the Pressman School District, a large school district
in a first ring suburb of Kansas City. Pressman School District housed 26,750 students,
and Primus High School housed 1,534 students (PSD, 2018). The school district’s
population declined from 27,609 students in 2008 to 26,750 students in 2018 (PSD,
2018). Starting in the late 1990s, more families with school-aged children moved to the
new construction of second ring suburbs farther south and west. From 1998 to 2018,
Pressman School District consolidated elementary schools from 43 to 33 buildings and
middle schools from 7 to 5 buildings (PSD, 2018). During that same time frame (Table
6), the district transitioned from an 89% White population to a 64% White population and
from an 8% free and reduced lunch population to a 35% free and reduced lunch
population (PSD, 2018).
Table 6
Pressman School District Demographic Changes 1998-2018
Notes: The percentages reflect subpopulation percentage of total district population. FRL
= Free and Reduced Lunch students. District data was not available for 2013. Adapted
from “Data Gallery Notebook,” by Pressman School District, 2018, Shawnee Mission,
KS.
Year Population White Black Hispanic FRL
1998 31,480 89.2% 4.1% 3.7% 7.8%
2003 29,371 82.9% 6.7% 6.8% 14.2%
2008 27,771 72.7% 8.2% 11.2% 27.1%
2018 26,750 64.0% 9.0% 17.0% 35.0%

9
The Pressman School District (PSD, 2019) embedded a weekly thirty-minute
advisory period into the district’s high school modified block schedule (see Appendix A).
Students attended all of their seven classes on Monday, Tuesday, and Friday. Students
attended their odd hour classes (hours one, three, five, and seven) on Wednesdays, and
students attended their even hour classes (hours two, four, and six) on Thursdays. An
advisory period was embedded into the Wednesday schedule between hours one and
three. A seminar period was embedded into the Thursday schedule between hours two
and four. Students were assigned to an advisory class based on student last name and
grade level. Building administrators wanted to organize students by grade level so that
students would move through high school with a grade-level cohort and the same
advisory teacher in order to promote the development of a safe space for positive
relationships and school attachment. Building administrators wanted to organize students
by last name so that students in each advisory would share the same administrator and
counselor since Primus High School has designated certain sections of the alphabet to
each administrator and counselor.
Primus High School’s scheduling and rostering structure supported the school’s
Response-to-Intervention (RTI) program, a three-tier system designed to identify and
support students with learning and behavior needs and which begins with high-quality
instructional practices and universal screening of all children in the general classroom
(see Appendix B). Primus High School’s rostering and scheduling system also provided
a stepstone for a Tier 2 schoolwide RTI intervention by utilizing an advisory class to
direct students to a targeted seminar class where students could receive individual
instruction, remediation, and extension. The building administration wanted to connect

10
advisory and seminar through a system similar to Mattos’s (2018) Pioneer Middle School
tutorial model (see Appendix C). By linking advisory and seminar, the building
administration wanted to maximize its modified block schedule to provide interventions
and enrichments within the school day for all students. By triangulating the advisory
roster, the administrator roster, and the counselor roster, the building administration also
wanted to create a more aligned and responsive approach to the academic and social-
emotional needs of students.
To implement a guaranteed, viable advisory curriculum, the building
administration of Primus High School established an advisory committee comprised of a
representative sample of content-area teachers, instructional coaches, elective teachers,
special education teachers, counselors, and administrators. The advisory committee met
multiple times over the summer and periodically throughout the year to design pre-
packaged lessons differentiated by grade. The lessons were shared with advisory
teachers at least two days in advance of each weekly advisory class. The lesson topics
included college and career research projects, goal setting activities, grade tracking
assignments, school spirit competitions, financial literacy education, and personal well-
being strategies. The lessons were populated into an open-source school calendar and
shared with the staff. The lessons also were published on an open-source website to
promote community involvement. The website included other resources, visuals, and
supports for the advisory teachers. The school’s administrative team shared the website
link in a weekly newsletter to parents (PSD, 2019).

11
Statement of the Problem
Advisory programs are a means within the school day for schools to deliver both a
CCR and SEL curriculum. Influential educational foundations, such as Edutopia, Great
Schools Partnership, and Teaching Channel, which reach thousands of educators through
website and social media platforms, promoted the practice of an advisory program as a
way to build positive school culture and to promote higher levels of learning for all
(George Lucas Education Foundation., n.d.; Great Schools Partnership, 2015; Teaching
Channel, n.d.). However, research studies on advisory programs produced mixed results
on the effectiveness of advisory programs through the analysis of student achievement
data, student participation data, behavior data, and perception data (Galassi, Gulledge, &
Cox, 2004; Gard, 2014). In addition, most research on advisory programs focused on
middle school settings (Demaray & Malecki, 2002; Mizelle & Irvin, 2015; Shulkind &
Foote, 2009), often in urban school districts (Botvin et al., 2006; Gard, 2014; Montague
et al., 2011). By focusing on a high school in a suburban setting, the researcher of this
study sought to contribute to the knowledge base related to student age and school
environment. Through the descriptive survey of student perceptions, the researcher also
sought to contribute to the knowledge base by examining student attitudes instead of
academic and behavior data in order to better understand how the consumers of an
advisory program perceive its impact.
Purpose of the Study
The purpose of this quantitative study was to determine the impact of a high
school advisory program in a public high school as measured primarily by a cross-
sectional descriptive survey of student perceptions using a Likert-type scale.

12
Specifically, this research study focused on student perceptions toward excitement about
going to an advisory class, eagerness in participating in an advisory class, interest in the
lessons from an advisory class, and the usefulness of ideas from an advisory class, and
the analyses disaggregated the sample by student demographics (grade level, gender, and
ethnicity) and by self-reported grades. In addition, this research study correlated student
perceptions toward an advisory program and an advisory teacher, toward an advisory
teacher and belonging at school, and toward an advisory program and belonging at
school. Lastly, this research study focused on student perceptions toward the importance
of their participation in school athletics or activities, the importance of their participation
in volunteer work or community service, the usefulness of an advisory program for
college and/or career plans, and the usefulness of an advisory program for social and
emotional development, and the analyses disaggregated the sample by student
demographics (grade level, gender, and ethnicity) and by self-reported grades.
Significance of the Study
The limited information on the impact of advisory programs in high school
settings as well as the inconsistency of findings in the literature on the effectiveness of an
advisory program gave significance to this study regarding the impact of an advisory
program in a large, diverse, midwestern, suburban, public high school. Given the
national and state push for more CCR as well as SEL, this study could have relevance to
districts looking for a high leverage solution to meet state accreditation requirements and
individual student needs. This study could contribute to the knowledge base where there
are inconsistencies in the results and conclusions by examining multiple indicators of
student perceptions toward a high school advisory program in grades 9-12. The potential

13
impact of an advisory program as an embedded intervention within the school day to help
students better understand their college options, their career choices, their community
opportunities, and their personal possibilities makes advisory a subject worthy of
implementing, studying, and improving. The results of this study could contribute
insights into the successful implementation of a high school advisory program in a large,
diverse, midwestern, suburban public high school.
Delimitations
The delimitations of this study were determined to focus the study primarily on
student perceptions toward an advisory program in a public high school setting in grades
9-12. The researcher sought student perceptions about the delivery of and connection to
an advisory program. To gather and analyze data on student perceptions, the researcher
chose a cross-sectional descriptive study by distributing a quantitative survey using a
Likert-type scale at a single point in time to measure the perceptions of a representative
sample of students from one large, diverse, midwestern, suburban public high school.
The students surveyed had participated in a high school advisory program for one to three
years.
Assumptions
The following assumptions were made concerning this quantitative, cross-
sectional study of student perceptions toward an advisory program in a large, diverse,
midwestern, suburban, public high school.
1. The advisory program was implemented with fidelity by the advisory teachers.
2. The students who participated in the research study understood the items on the
survey.
14
3. The students who completed in the survey responded accurately, seriously, and
honestly to the survey.
4. The interpretation of the survey results accurately reflected the perceptions of the
students.
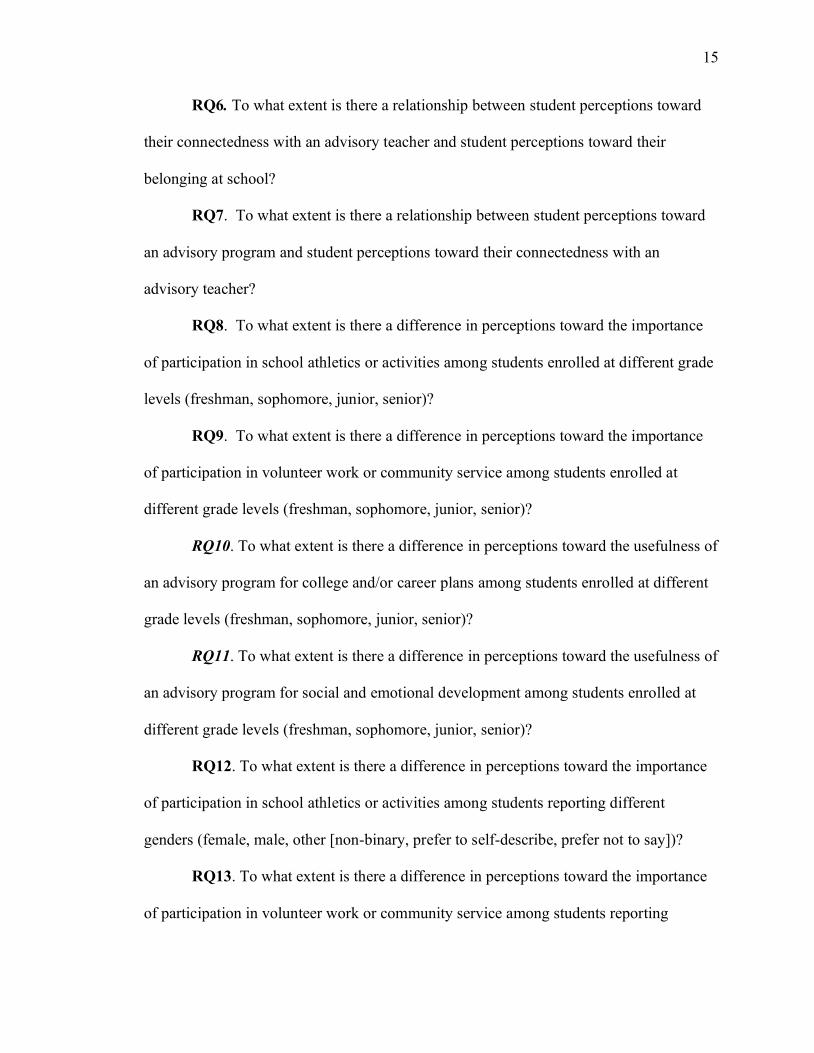
Research Questions
The following research questions guided this study of student perceptions toward
an advisory program in a large, diverse, midwestern, suburban, public high school.
RQ1. To what extent is there a difference in perceptions toward an advisory
program among students enrolled at different grade levels (freshman, sophomore, junior,
senior)?
RQ2. To what extent is there a difference in perceptions toward an advisory
program among students reporting different genders (female, male, other [non-binary,
prefer to self-describe, prefer not to say])?
RQ3. To what extent is there a difference in perceptions toward an advisory
program among students reporting different ethnicities (Asian/Pacific Islander,
Black/African-American, Hispanic/Latino, Multi-Racial, Native American/American
Indian, White, other, prefer not to say)?
RQ4. To what extent is there a difference in perceptions toward an advisory
program among students based on the grades they report as usual in school (A, B, C, D,
F)?
RQ5. To what extent is there a relationship between student perceptions toward
an advisory program and student perceptions toward their belonging at school?
15
RQ6. To what extent is there a relationship between student perceptions toward
their connectedness with an advisory teacher and student perceptions toward their
belonging at school?
RQ7. To what extent is there a relationship between student perceptions toward
an advisory program and student perceptions toward their connectedness with an
advisory teacher?
RQ8. To what extent is there a difference in perceptions toward the importance
of participation in school athletics or activities among students enrolled at different grade
levels (freshman, sophomore, junior, senior)?
RQ9. To what extent is there a difference in perceptions toward the importance
of participation in volunteer work or community service among students enrolled at
different grade levels (freshman, sophomore, junior, senior)?
RQ10. To what extent is there a difference in perceptions toward the usefulness of
an advisory program for college and/or career plans among students enrolled at different
grade levels (freshman, sophomore, junior, senior)?
RQ11. To what extent is there a difference in perceptions toward the usefulness of
an advisory program for social and emotional development among students enrolled at
different grade levels (freshman, sophomore, junior, senior)?
RQ12. To what extent is there a difference in perceptions toward the importance
of participation in school athletics or activities among students reporting different
genders (female, male, other [non-binary, prefer to self-describe, prefer not to say])?
RQ13. To what extent is there a difference in perceptions toward the importance
of participation in volunteer work or community service among students reporting
16
different genders (female, male, other [non-binary, prefer to self-describe, prefer not to
say])?
RQ14. To what extent is there a difference in perceptions toward the usefulness
of an advisory program for college and/or career plans among students reporting different
genders (female, male, other [non-binary, prefer to self-describe, prefer not to say])?
RQ15. To what extent is there a difference in perceptions toward the usefulness
of an advisory program for social and emotional development among students reporting
different genders (female, male, other [non-binary, prefer to self-describe, prefer not to
say])?
RQ16. To what extent is there a difference in perceptions toward the importance
of participation in school athletics or activities among students reporting different
ethnicities (Asian/Pacific Islander, Black/African-American, Hispanic/Latino, Multi-
Racial, Native American/American Indian, White, other, prefer not to say)?
RQ17. To what extent is there a difference in perceptions toward the importance
of participation in volunteer work or community service among students reporting
different ethnicities (Asian/Pacific Islander, Black/African-American, Hispanic/Latino,
Multi-Racial, Native American/American Indian, White, other, prefer not to say)?
RQ18. To what extent is there a difference in perceptions toward the usefulness
of an advisory program for college and/or career plans among students reporting different
ethnicities (Asian/Pacific Islander, Black/African-American, Hispanic/Latino, Multi-
Racial, Native American/American Indian, White, other, prefer not to say)?
RQ19. To what extent is there a difference in perceptions toward the usefulness
of an advisory program for social and emotional development among students reporting

17
different ethnicities (Asian/Pacific Islander, Black/African-American, Hispanic/Latino,
Multi-Racial, Native American/American Indian, White, other, prefer not to say)?
RQ20. To what extent is there a difference in perceptions toward the importance
of participation in school athletics or activities among students based on the grades they
report as usual in school (A, B, C, D, F)?
RQ21. To what extent is there a difference in perceptions toward the importance
of participation in volunteer work or community service among students based on the
grades they report as usual in school (A, B, C, D, F)?
RQ22. To what extent is there a difference in perceptions toward the usefulness
of an advisory program for college and/or career plans among students based on the
grades they report as usual in school (A, B, C, D, F)?
RQ23. To what extent is there a difference in perceptions toward the usefulness
of an advisory program for social and emotional development among students based on
the grades they report as usual in school (A, B, C, D, F)?
Definition of Terms
The definition of terms includes terms which were essential to this study and
terms which may vary depending on educational, cultural, or geographical context.
According to Roberts (2010), “This section of the dissertation provides the definition for
the terms used that do not have a commonly known meaning or that have the possibility
of being misunderstood” (p. 139). The following terms were used in this research study.
The researcher chose to use the definitions as provided by the cited organizations because
the definitions provided the most accurate representation of the terms or concepts related
to this research study.
18
21st Century Skills. Great Schools Partnership (2016) defined 21st Century Skills
as including: critical thinking, problem solving, reasoning, analysis, interpretation,
synthesizing information; research skills and practices, interrogative questioning;
creativity, artistry, curiosity, imagination, innovation, personal expression; perseverance,
self-direction, planning, self-discipline, adaptability, initiative; oral and written
communication, public speaking and presenting, listening; leadership, teamwork,
collaboration, cooperation, facility in using virtual workspaces; information and
communication technology (ICT) literacy, media and internet literacy, data interpretation
and analysis, computer; civic, ethical, and social-justice literacy; economic and financial
literacy, entrepreneurialism; and global awareness, multicultural literacy,
humanitarianism programming.
Advisory. Great Schools Partnership (2015) defined advisory as a scheduled
period of time, typically during the school day, when teachers meet with small groups of
students for the purpose of advising them on academic, social, or future-planning issues.
In some cases, other adults and staff members, such as guidance counselors or social
workers, may act as advisors or participate in an advisory program. Advisories, as these
meetings are commonly called, may be casual and loosely organized in some schools, or
they may follow a prescribed curriculum and clear set of routines determined by school
leaders, teachers, and students. Advisories may meet daily, multiple times a week, or only
a few times a month. Advisory periods tend to be shorter than a typical class, perhaps as
20 or 30 minutes long, and they are often used as an alternative to more traditional
homeroom periods. Advisories are one of many possible strategies that schools use to
make sure that students don’t fall through the cracks—that is, to ensure that their social,

19
emotional, and academic needs are not being overlooked or left unattended. For this
reason, advisories are often considered to be a form of personalized learning or academic
support focused on helping all students succeed academically, stay in school, and make
more informed educational decisions that will help them prepare for the future.
Career and Technical Education (CTE). According to Advance CTE (2019),
The Carl D. Perkins Career and Technical Education Act of 2006 called upon states to
create sequences of academic and CTE coursework to help students attain a
postsecondary degree or industry-recognized certificate or credential, otherwise known as
programs of study (POS). According to the definition in Perkins, programs of study
must: incorporate and align secondary and postsecondary education elements; include
academic and CTE content in a coordinated, non-duplicative progression of courses; offer
the opportunity, where appropriate, for secondary students to acquire postsecondary
credits; and lead to an industry-recognized credential or certificate at the postsecondary
level, or an associate or baccalaureate degree.
College and Career Readiness (CCR). According to Achieve (2019), College-
and career-ready graduates should be able to enter and succeed in entry-level
postsecondary courses without the need for remediation. Specifically, they should have a
mastery of rigorous knowledge and skills in core academic disciplines, including English
language arts/literacy, mathematics, history, civics, science, art, and music. The skills
most demanded by colleges and employers were, by design, inherent in rigorous K–12
expectations—the ability of students to communicate effectively (both verbally and in
written communications), to solve problems, to think critically and develop informed
arguments, and to analyze information and data. Collaborating, communicating and

20
presenting information, and using research to make informed judgments are among the
critical skills that impact success.
Deeper Learning. Vander Ark and Schneider (2013) defined deeper learning as
an umbrella term for the skills and knowledge that students must possess to succeed in
21st century jobs and civic life. At its heart it is a set of competencies students must
master in order to develop a keen understanding of academic content and apply their
knowledge to problems in the classroom and on the job.
Individual Plan of Study (IPS). According to KSDE (2018b), the IPS is a
roadmap, which included the development of a flexible career focus and an education
plan that is clearly defined, rigorous, and relevant to assure a successful and efficient
transition to postsecondary education and/or the workforce.
Local Education Agency (LEA). Cornell Law School (2019) defined an LEA as
a public board of education or other public authority legally constituted within a state for
either administrative control or direction of, or to perform a service function for, public
elementary schools or secondary schools in a city, county, township, school district, or
other political subdivision of a state, or for a combination of school districts or counties
are recognized in a state as an administrative agency for its public elementary schools or
secondary schools.
Personalization. Yonezawa, McClure, & Jones (2012) defined personalization as
the web of positive relationships cultivated among adults and youth in classrooms,
schools, and communities that promotes learning by helping students feel competent in
and connected to the world. The idea is that educators get to know their students well—
not just their abilities and learning styles but also their interests and motivations—and

21
they use this insight to design more effective individualized instruction and guidance.
But these relationships must be reciprocal: Students must also come to know their
educators, to trust them and respect them.
Response to Intervention (RTI). According to the RTI Action Network (2019),
RTI is a multi-tier approach to the early identification and support of students with
learning and behavior needs. The RTI process begins with high-quality instruction and
universal screening of all children in the general education classroom. Struggling
learners are provided with interventions at increasing levels of intensity to accelerate their
rate of learning. RTI is designed for use when making decisions in both general
education and special education, creating a well-integrated system of instruction and
intervention guided by child outcome data.
Social and Emotional Learning (SEL). According to the Collaborative for
Academic, Social, and Emotional Learning (CASEL, 2019b), SEL is the process through
which children and adults understand and manage emotions, set and achieve positive
goals, feel and show empathy for others, establish and maintain positive relationships,
and make responsible decisions. It centers on the education of the whole child with an
emphasis on healthy development, high expectations, and positive outcomes as measured
by five key competencies: self-awareness, self-management, responsible decision
making, relationship skills, and social awareness.
Social-Emotional Character Development (SECD). According to KSDE
(2012), the purpose of the SECD standards was to provide schools a framework for
integrating SEL with character development so that students will learn, practice, and
model essential personal life habits that contribute to academic, vocational, and personal

22
success. It was about learning to be caring and civil, to make healthy decisions, to
problem solve effectively, to value excellence, to be respectful and responsible, to be
good citizens, and to be empathic and ethical individuals.
Whole Child Approach. The ASCD (2020) defined the whole child approach as
a means to ensure that each student is healthy, safe, engaged, supported, and challenged”
and that it “sets the standard for comprehensive, sustainable school improvement and
provides for long-term student success.
Organization of the Study
This research study was organized in five chapters. Chapter 1 presents the
background of the study, statement of the problem, purpose of the study, significance of
the study, delimitations, limitations, assumptions, research questions, definition of terms,
overview of the methodology, and organization of the study. Chapter 2 presents a review
of the literature, which includes the evolution of college and career readiness, the
transformation in socio-economic dynamics, the proliferation of mental health issues, the
implementation of social-emotional learning, the design of tiered support systems, the
focus on personalized planning, and the efficacy of advisory programming pertinent to
this study on student perceptions toward an advisory program in a large, diverse,
midwestern, suburban, public high school. Chapter 3 presents the methodological
information about the research study, which includes the research design, selection of
participants, sampling procedure, measurement, data collection procedures, data analysis,
hypothesis testing, and limitations. Chapter 4 presents a summary of the research
findings and the analysis of the data. Chapter 5 presents a study summary, findings

23
related to the literature review, implications for action, recommendations for future
research, and the concluding remarks.

24
Chapter 2
Review of the Literature
Achieve (2015), a bipartisan, nonprofit organization of governors and business
leaders, conducted a national study of 767 college faculty and 407 employers in 2015 and
found that 78% of college faculty felt that public high schools were not adequately
preparing students for success in college and career, a number which had increased from
65% in 2004 (Achieve, 2015). The researchers also found that 62% of employers felt
that public high schools were not adequately preparing students for success in college and
career, a number which had increased from 38% in 2004 (Achieve, 2015). The findings
from the Achieve (2015) study were supported by the findings of an ACT (2013) study
which reported that 33% of college-bound students were not ready for English
Composition, and 54% of college-bound students were not ready for College Algebra.
The College Board (2014) reported the positive correlation between SAT and AP scores
and college completion and argued for more exposure to rigorous coursework in high
school, concluding that “it is important for students to engage in the college-preparation
process early and regularly monitor whether they are on target for college and career
readiness” (p. 8). The College Board (2014) emphasized the important role that middle
schools and high schools played in the creation of a college preparatory culture anchored
with tangible plans for post-secondary success. This early and continuous engagement
tracked by a concrete, individualized plan would help match the abilities and interests of
students with appropriate, corresponding college choices, another marker for higher rates
of college completion (College Board, 2014).

25
The exigency of various business leaders and community stakeholders for
improved post-secondary success of high school graduates has motivated local education
agencies (LEAs) to find structural solutions for the delivery of academic interventions
and social-emotional learning within the school day. Advisory programs have become
the solution for some school districts to provide “personalized learning or academic
support focused on helping all students succeed academically, stay in school, and make
more informed educational decisions that will help them prepare for the future” (Great
Schools Partnership, 2015, para. 4). This scheduled, embedded, guaranteed time within
the school day in which teachers can meet with students to advise them on academic,
civic, social-emotional, and future-planning issues is driven by the theoretical framework
of SEL, which centers on the education of the whole child with an emphasis on healthy
development, high expectations, and positive outcomes as measured by five key
competencies: self-awareness, self-management, responsible decision-making,
relationship skills, and social awareness (CASEL, 2019b). SEL is based upon an
integrated, responsive, and systematic approach to reducing risk factors and promoting
positive adjustments in students. SEL is a framework similar to the whole child approach
as advocated by the ASCD which seeks to ensure that “each student is healthy, safe,
engaged, supported, and challenged…and…sets the standard for comprehensive,
sustainable school improvement and provides for long-term student success” (ASCD,
2020, para. 2). In their white paper for the Digital Learning Now (DLN) national
initiative, Ryerse, Schneider, and Vander Ark (2014) found that advisory programs
provide the opportunity for increase student motivation through relationships and high
interest curriculum; increased customization through personalized goals for college,

26
career, and community service; and increased equalization through opportunities for all
students to explore colleges and careers.
Kansas is one state that has been at the forefront in seeking solutions to the issues
outlined by Achieve (2015) and ACT (2013) through the implementation of
individualized CCR programming, as discussed in the Great Schools Partnership (2015),
and responsive SEL programming, as discussed in CASEL (2019b). In October 2015, the
Kansas State Department of Education (KSDE) launched its Kansans Can initiative in
order to create “a more student-focused system that provides support and resources for
individual success” (KSDE, 2018g, para. 1). This vision for education in which Kansas
leads the world in the success of each student promoted “academic preparation, cognitive
preparation, technical skills, employability skills, and civic engagement” (KSDE, 2018g,
para. 4). The Kansans Can initiative articulated five key measurements for
accountability: kindergarten readiness, social-emotional growth, IPS, high school
graduation, and postsecondary success (KSDE, 2018g). In addition, the KSDE had a
clear set of social, emotional, and character development standards as part of its college
and career readiness plan (KSDE, 2018f). In January 2018, the United States Department
of Education approved the KSDE’s plan for the Every Student Succeeds Act (ESSA), a
plan which set a target of 95% graduation and a target of 75% proficiency on state exams
across all students and subgroups (KSDE, 2018e). The KSDE had implemented these
standards and measures in order to prepare its students for the 71% of all Kansas jobs
which will require a postsecondary degree or certificate by 2020 (KSDE, 2018g). The
KSDE’s vision and initiatives for the students of the state correspond with the larger
national landscape driven by a call from corporations, colleges, politicians, and families

27
for schools to better prepare students for post-secondary success. In fact, KSDE’s school
redesign principles focused on student success skills, personalized learning, real world
application, and community partnerships with a movement toward social-emotional
character development standards implemented throughout the state (KSDE, 2018g).
This chapter reviews the literature related to the motivation for and the
effectiveness of advisory programs. The information is organized into sections which
review the evolution of college and career readiness, the transformation in socio-
economic dynamics, the proliferation of mental health issues, the implementation of
social-emotional learning, the design of tiered support systems, the focus on personalized
planning, and the efficacy of advisory programming.
The Evolution of College and Career Readiness
At the same time colleges and companies like Achieve (2015), ACT (2013), and
The College Board (2014) reported that high school graduates were not properly prepared
for post-secondary success, the job market itself was rapidly changing due to
technological advances, economic shifts, and demographic changes. In The Future of
Jobs Report, the World Economic Forum (2016) listed the top ten skills for jobs by the
year 2020: complex problem solving, critical thinking, creativity, people management,
coordinating with others, emotional intelligence, judgment and decision making, and
service orientation. While three of the skills dealt with critical and creative thinking, the
majority of the skills dealt with social-emotional learning and interpersonal skills.
Similarly, Levy and Cannon (2016), the authors of the Bloomberg Job Skills Report,
listed communication, collaboration, leadership, motivation, adaptability, decision
making, risk taking, and mindset as eight of the fourteen skills that managers want in top

28
talent. Again, the majority of the skills for jobs required social-emotional learning and
interpersonal skills. Such reports motivated a reimagining of the purpose of school, the
structure of scheduling, and the profile of a graduate. No longer were critical and
creative cognitive abilities enough; college and career readiness became more expansive
to include communication skills and interpersonal competencies to prepare high school
graduates for post-secondary success. In addition, students played a more active role in
the development of their individualized plans of study: their personalized blueprints to
navigate the high school experience and to design more purposefully and strategically
their post-secondary plans (KSDE, 2018b).
Because the future of jobs was rapidly changing, many educational, corporate,
and philanthropic entities invested funds into developing alternatives to traditional
education. They sought personalization in the form of individualized pathways for
students to plan more critically and intentionally for their futures beyond high school.
Starting with the Carl D. Perkins Vocational and Applied Technology Education Act of
1990, politicians and reformers began to make the push for higher academic standards,
vocational-technical curriculum integration, state performance standards, and post-
secondary transition opportunities (Pankake & Littleton, 2012). The educational
philosophy underpinning the first Perkins act was bolstered by the Goals 2000: Educate
America Act of 1994, which led to the development of The National Skill Standards
Board (NSSB), and the School-to-Work Act of 1994, which introduced the concepts of
career pathways, course sequences, and professional mentoring (Pankake & Littleton,
2012). Since the 1990s, Congress had reauthorized the Perkins Act numerous times with
a progressively more targeted and focused definition of CTE (Pankake & Littleton,

29
2012). With the Carl D. Perkins Career and Technical Education Act of 2006, funds
were provided to local education agencies (LEAs) based upon their offering of accredited
programs of studies (POSs) that included at a minimum four criteria: align secondary and
post-secondary standards, assessments, and credentialing; develop course pathways in
coordinated, nonduplicative progressions; create opportunities for post-secondary credits;
and lead students to an industry-recognized post-secondary certificate, credential, or
degree (Pankake & Littleton, 2012). The Perkins IV Act also established sixteen Career
Clusters to more clearly articulate the sequences or pathways of academic, career, and
technical courses. With the evolution of CTE pathway programming came an increased
need for districts to find a means to advertise and promote their pathway programs as
well as for students to explore and identify individualized pathway programs.
The same societal impetus for the burgeoning of CTE pathway programming
helped to usher in a broader educational wave of small learning communities, local
business partnerships, and college and career integrated curricula (Kemble, 2008). For
example, major philanthropic organizations—The Bill & Melinda Gates Foundation, the
Carnegie Corporation, and The W.K. Kellogg Foundation Initiative—invested millions of
dollars in the development of the Early College High School Initiative (ECHSI), a means
for high school students to earn both a high school degree and a two-year associate’s
degree (or two years’ credit toward a bachelor’s degree) to increase access to a post-
secondary education (Pankake & Littleton, 2012). Such philanthropic foundations and
progressive organizations, through their political influence, financial assets, and
community reach, motivated public school systems to be responsive and inventive in

30
their design of scheduling and programming to meet individual student needs and to
provide accelerated credit opportunities.
In an effort to increase the academic rigor, professional opportunities, and
interpersonal competencies of high school graduates, Jobs for the Future (JFF) partnered
with a diverse range of influential business, education, and technology entities, such as
Google, Department of Education, Bill and Melinda Gates Foundation, Walmart, and
Department of Labor to become a leader in the research and implementation of deeper
learning, an educational model which focused on rigorous instruction tailored to
individual needs and interests; course credit or student grades based on demonstrations of
skills and content knowledge; and an active student role in defining personal educational
pathways (Mehta & Fine, 2015). The ultimate goal of JFF was to deliver a rigorous
secondary school curriculum at an accelerated pace with more college access for more
students (JFF, 2018). Cueves (2018), a senior policy manager at JFF, reported that JFF
supported bipartisan legislation called The Strengthening Career and Technical Education
for the 21st Century Act, which would overhaul federal support for CTE programs and
make improvements to the existing Perkins Act. The JFF’s platform, like the Perkins Act
before it, wanted to:
encourage the development of high-quality programs of study; emphasize the
importance of work-based learning, encourage the expansion of dual enrollment
and early college high school opportunities; require that CTE programs align with
the skill needs of employers in in-demand industries and occupations; focus on
transferable job skills. (Cuevas, 2018, para. 2)
31
In order to support their vision for the reimagining of education, the JFF cited
research from Levine & Kawashima-Ginsberg (2014) who, in their analysis of a national
survey of 18-24 year-olds, found that schools must provide opportunities for high-quality
discussion of controversial issues to develop increased civic engagement. The
researchers also cited Gandara (2015) who, in a report to The White House Initiative on
Educational Excellence for Hispanics, argued that to improve economic outcomes for
Latinas, school systems must reduce the need to incur debt to complete college, provide
access to rigorous academic programs especially in STEM courses, and assist with more
access to counselors for post-secondary planning and social-emotional wellbeing. Lastly,
the researchers cited Conley (2015) who, in a synthesis of literature for the Educational
Policy Improvement Center, advocated for districts to provide a clear and comprehensive
definition of CCR, which could be articulated in a strategic plan or a profile of a
graduate, and a multi-dimensional student profile, which could involve a comprehensive
system of assessments tied to an IPS. This coordinated and individualized strategic plan
for students is designed to facilitate deeper learning which Vander Ark and Schneider
(2013) identified as:
an umbrella term for the skills and knowledge that students must possess to
succeed in 21st century jobs and civic life. At its heart is a set of competencies
students must master in order to develop a keen understanding of academic
content and apply their knowledge to problems in the classroom and on the job.
(p. 66)
The intended educational outcome of the 6Cs of deeper learning—character, citizenship,
collaboration, communication, creativity, and critical thinking—is transference, or when

32
“an individual becomes capable of transferring what was learned in one situation and
applying it to new situations” (Pellegrino and Hilton, 2012, p. 5).
The policy work of JFF (2018) emphasized a vision for learning in which
individualized planning, community partnerships, early college opportunities, civic
engagement, and multi-dimensional assessments provided the most effective practices for
increased CCR for high school students. The ideological framework of deeper learning
paralleled the motivation for the implementation of advisory programs in high schools as
a response to a rapidly changing cultural, technological, and economic landscape and
influenced by corporate, political, and philanthropic influence. For some school districts,
advisory programs served as an expedient vehicle for the delivery of individualized
college and career plans, for social-emotional competencies, and for civic engagement
opportunities (Great Schools Partnership, 2015).
The Transformation in Socio-Economic Dynamics
The rise in personalized career pathways, accelerated college initiatives, and
deeper learning programming during the early 2000s paralleled a transformation in socio-
economic dynamics. According to a TED Talk by Rosin (2010), changes in the
economy, industry, and technology impacted gender and identity as well as the skills
required by the workplace and the nature of the work itself. Rosin (2010) cited numerous
statistics to demonstrate the demographic shifts in gender on college campuses and in
office workplaces: three women to two men were earning college degrees; over 50% of
managers were women; in the 15 professions projected to grow the most by 2020, all but
two were dominated by women; men represented 3/4 of the 8 million job losses since the
recession of 2008; in 1,997 of 2000 communities, young single women made more

33
money than young single men; and more women than men were earning doctorate
degrees (Rosin, 2010). In addition, Rosin (2010) argued that our economy had gone from
a manufacturing economy to a service economy and an information economy, which
required intelligence, focus, close listening, open communication, workplace fluidity,
team-building, and critical and creative thinking, skills which she argued traditionally had
been strengths of women (Rosin, 2010). This new economy was dividing into high skill,
high wage jobs and low skill, low wage jobs with middle wage jobs dropping out of the
economy (Rosin, 2010).
Because low skill jobs were becoming more and more automated and dropping
from the economy, as further documented in several reports (McFarland, 2017; Webber,
2018; Wingfield, 2017), school systems became increasingly responsible for providing
students with the 6Cs of the deeper learning model—character, citizenship, collaboration,
communication, creativity, and critical thinking (Fullan, Quinn, & McEachen, 2017).
The deeper learning model extended the Partnership for 21st Skill’s (P21) framework,
endorsed by the National Education Association (NEA, 2020), which focused on the
4Cs—critical thinking, communication, collaboration, and creativity—as well as a need
for life and career skills. Bishop (2010), the director of the Center for Transformation of
Schools at UCLA and former senior policy advisor with the Learning Policy Institute,
presented to the Institute of Museum and Library Services (IMLS) the P21 framework to
serve as a catalyst to position 21st Century Skills at the center of U.S. K-12 education by
building collaborative partnerships among education, business, community, and
government leaders.

34
Affirming the findings of Rosin (2010) and the intended educational outcomes of
the deeper learning model and P21 frameworks, Zlab (2019), a data analytics specialist at
Garmin, presented the findings of a mixed methods study of 347 Gen Z interns and
employees at the company. In her presentation at the Garmin Educator’s Summit, Zlab
(2019) reported that the company’s Gen Z interns and employees had gaps in their in-
person communication, critical thinking, collaborative projects, practical life skills, and
professional life preparation. As a major international company, Garmin provided a
representative example of an employer with a vested interest in the hiring of post-
secondary students with the competencies articulated in the deeper learning model and
the P21 framework. The findings from Zlab’s (2019) study also affirmed the call by
national think tanks, philanthropic organizations, and sociological researchers for post-
secondary students to solve complex problems in critical, creative, and collaborative
ways and to be life-long, self-directed learners who can adapt to a rapidly evolving job
market. While high school graduates must possess the hard skills—the 21st Century skills
as promoted in the research of Trilling and Fadel (2009)—high school graduates also
must be able to apply these hard skills in context-sensitive ways and through an
understanding of perspectives and ideologies as fostered by civic engagement programs
(Levinson, 2012). Understanding this economic and social trend, the KSDE launched its
SECD standards in 2012 and revised the standards in 2018, establishing an articulated set
of standards from pre-kindergarten to twelfth grade meant to address the needs outlined
in the research of Rosin (2010) and Zlab (2019). In fact, the KSDE was one of the first
state departments of education to partner with P21 and to adopt such a set of SECD
standards (KSDE, 2018c).
35
The Proliferation of Mental Health Issues
During the time of socio-economic shifts from the 1990s to the 2010s, our society
also experienced a mental health crisis as documented in the rise of suicide and
depression rates. Plemmons et al. (2018), using a retrospective analysis of administrative
billing data from the Pediatric Health Information System database, found that the annual
percentage of all visits for suicide ideation and suicide attempts among children 10-18
years old “almost doubled, increasing from 0.66% in 2008 to 1.82% in 2015” (p. 1). In
addition, Curtin, Warner, and Hedegaard (2016), in a National Center for Health
Statistics report to the United States Department of Health and Human Services,
presented results that indicated that, while suicide rates had declined from 1986 to 1999,
suicide rates from 1999 to 2014 increased 24% from 10.5 to 13.0 per 100,000 population.
The Centers for Disease Control and Prevention (2017), in its Morbidity and Mortality
Weekly Report, confirmed the findings of Curtin et al. (2016), citing the doubling of
suicide rates from 2.4 to 5.1 per 100,000 for females in the years 2007 to 2015, the
highest rate for females in the 1975 to 2015 period. The Centers for Disease Control and
Prevention (2017) also provided evidence that the suicide rate for males aged 15 to 19
years increased 31% from 10.8 in 2007 to 14.2 in 2015.
The evident rise in adolescent suicide rates from the early 2000s to the late 2010s
was an outgrowth of the rise in adolescent depression and anxiety rates during that same
period. Twenge, Cooper, Joiner, Duffy, and Binau (2019), in an examination of survey
data from more than 200,000 adolescents from the ages of 12 to 17 between the years
2005 to 2017, found the rate of adolescents reporting major depression symptoms had
increased 52%, including 20% of female respondents reporting major depression
36
symptoms in the last year of the survey data. The National Institute of Mental Health
(NIMH, 2019) corroborated Twenge et al.’s (2019) findings indicating that 2.3 million
adolescents from 12 to 17 years old had experienced at least one depressive episode with
severe impairment, which represented 9.4% of United States population 12 to 17 years
old.
Additionally, the NIMH (2019) reported that in 2017, 60.1% of adolescents who
reported major depressive episodes received no treatment. With the rise in suicide rates
and depression and anxiety rates, combined with a lack of treatment for approximately
60% of the adolescent population, schools had been tasked by state agencies and
community stakeholders to provide more strategic mental health services and
professional partnerships as discussed in Ayasse and Stone’s (2015) analysis of social
work services delivered between 2000 and 2012 in a large urban school district. The
researchers found that for social work services to be systemic and sustainable, funding
must be aligned with a community needs survey and district data-based decision-making
and must include the delivery of preservice training and ongoing professional learning for
district staff (Ayasse & Stone, 2015).
The findings of Ayasse and Stone (2015) are important to the study of an advisory
program because life-long mental health issues begin during the schooling years.
Merikangas et al. (2010) found that 22.2% of adolescents demonstrated signs of mental
health disorders, such as mood, anxiety, and behavior disorders, with the median age for
the onset of such disorders primarily falling between 11-15 years old. However, Swick
and Powers (2018) identified multiple barriers when referring students with mental health
issues to community providers, such as “a language barrier, a lack of transportation or

37
health insurance, or lack of flexibility with their jobs leaving them unable to make
appointments” (p. 129). In addition to barriers of language, travel, cost, and time, Swick
and Powers (2018) also identified stigma as a reason for students not seeking help and
receiving services. The feeling of stigma included shame, negative social judgement, and
potential discrimination. This finding was relevant because the ultimate goal of an
advisory program is, as Hertz (2016) posited, to be a “guiding force, safe space, and
advocate” (para. 2).
The National Center for Injury Prevention and Control (n.d.), as part of their
suicide prevention series, advocated for a population approach to preventing suicide,
which included a peer, family, and community approach, with an emphasis on primary
prevention, which focused on positive relationships, community connectedness, and early
detection. Their campaign corroborated the work of Lane, Oakes, Crocker, and Weist
(2017) who called for early detection in the form of self-reported high school mental
health screenings. Lane et al. cited Wagner and Newman (2015) who found that students
with emotional and behavior disorders faced negative outcomes, including “peer
rejection, impaired interpersonal relationships, academic underachievement, limited
school engagement, unemployment and underemployment, and high need for mental
health supports” (p. 3). In combination with the findings of Merikangas et al. (2010) that
life-long mental health issues begin during the schooling years, typically between the
ages of 11-15, a growing demand arose for schools to provide not only prevention and
intervention but detection as well. Most notably, in an interview with California Surgeon
General Nadine Burke Harris, a pediatrician who developed screening tools to assess
children’s exposure to adverse childhood experiences (ACEs), Waters (2019) reported

38
that Harris worked on legislation for the screening of children and adults for ACEs and
argued that “adverse childhood experiences and toxic stress constitute the major public
health issue of our time” (para. 7). Harris’s goal to screen children for ACEs is relevant
to school districts who are utilizing advisory programs and investing in student self-
reporting survey software to measure school climate, social-emotional learning, and
student mental health.
The Implementation of Social-Emotional Learning
In order to combat the rising rates of suicide, depression, and anxiety in
adolescent students, high schools implemented advisory programs not only to deliver a
social-emotional learning curriculum, such as those promoted by organizations like
CASEL, but also to make large high schools feel smaller by providing a grade-level
cohort of students with which to navigate the high school experience and by assigning a
consistent teacher from grades nine through to twelve to foster stability, trust, and
connection. This approach to advisory was founded upon research like that of Bergin and
Bergin (2009) who built from the concept that attachment is the foundation of social-
emotional wellbeing and that social-emotional wellbeing is the foundation of school
success. The researchers compiled an extensive review of literature on attachment in
children with primary attachment figures. The findings from their review of literature
were applicable and relevant to teacher behavior and modeling in an advisory program.
Bergin and Bergin’s (2009) review of literature emphasized that children develop internal
working models based on memories and expectations which are carried into new
interactions with others. Secure children see others as trustworthy, the self as valuable,
and the self as effective in interacting with others (Bergin & Bergin, 2009). Bergin and

39
Bergin (2009) also reported that insecure students experienced less academic success,
were less confident and able to handle frustration and stress, were less likely to be
socially competent, struggled with emotion regulation, were more likely to be diagnosed
with ADHD, and were at a higher risk for mental illness. Bergin and Bergin (2009)
examined the issue of developing attachment in high school because students spend less
time with specific teacher. The issue of student attachment to high school is important
because Larose, Bernier, and Tarabulsy (2005) found that insecure students had lower
rates of achievement during their first year of college.
To foster student attachment, Bergin and Bergin (2009) identified several key
teacher behaviors. Bergin and Bergin (2009) found that teachers who were well prepared
for class, showed their “real” self, granted student autonomy, and held high expectations
created classroom environments that promoted student attachment. Yonezawa et al.
(2012) confirmed Bergin and Bergin’s (2009) findings on effective teacher behaviors,
concluding “positive teacher-student relationships can help buffer students against a host
of problems, from disengagement in a specific academic subject to engaging in risky
social behaviors such as smoking or alcohol abuse” (p. 6). However, Yonezawa et al.
(2012) also acknowledged the limitations of studies involving teacher attachment because
most of the studies have focused on elementary school contexts.
Demaray and Malecki (2002) studied the relationship between social support and
behavior indicators. The researchers focused their study on at-risk Hispanic students in a
midwestern urban middle school. Through a quantitative survey design, the researchers
measured the correlation between social support as measured by Child and Adolescent
Social Support Scale scores and maladjustment indicators as measured by Behavior

40
Assessment System for Children Self Report of Personality scores. The researchers
predicted a significant positive relationship between social support (parent, teacher,
classmate, friend, and school) and positive adjustment indicators as well as a significant
negative relationship between social support and maladjustment indicators. The
researchers also predicted the highest correlation between parent support and
maladjustment indicators. In their analysis of the quantitative survey data, the
researchers found a moderate significant relationship between overall social support and
maladjustment indicators. In addition, the researchers only found significant
relationships between parent support and maladjustment indicators as well as classmate
support and maladjustment indicators. However, Demaray and Malecki (2002) found no
significant relationship between teacher support or school support and maladjustment
indicators.
While Demaray and Malecki (2002) studied the relationship between teacher and
school support and behavioral adjustment, Gard (2014) studied the relationship between
teacher and school support and academic achievement by analyzing archived
achievement data from the Explorer exam to measure the specific academic performance
of students in English and math and to rank the students into three performance
categories—top, middle, and bottom. Similar to Demaray and Malecki’s (2002) findings
related to behavior, Gard (2014), who analyzed the testing data three years before the
implementation of an advisory program and four years after the implementation of an
advisory program, found no significant relationship between teacher and school support
and academic achievement. The results of these two studies, limited by urban

41
populations of primarily Hispanic students, created a need for further research on diverse
populations in suburban settings.
The Design of Tiered Support Systems
In order to foster attachment, increase engagement, and improve achievement,
schools have attempted to identify the effective structural components of a systemic and
sustainable environment that fosters support, hope, engagement, and achievement for
students. By studying the perceptions of 423 students across five secondary schools in
the Midwest, Van Ryzin (2011) affirmed the importance of school engagement for
academic achievement. Van Ryzin (2011) concluded that interventions that increase
student perceptions toward autonomy, that provide teacher and peer support, and that
develop student goal setting may create the environmental conditions to positively impact
student academic achievement and behavior performance over time. Less clear from the
research was the way in which schools and districts can structurally maintain and
systemically continue the positive impacts over time as students graduate, populations
shift, and demographics change (Van Ryzin, 2011).
Solution Tree (2020), an influential education consulting organization that
advertises its global reach to include 515 publications and 42,984 educators attending its
4,260 annual professional learning events, has offered a framework for addressing the
Van Ryzin (2011) question through a Response to Intervention (RTI) system. RTI begins
with quality Tier 1 academic instruction and behavior expectations, which involves a
guaranteed, viable curriculum delivered to all students (RTI Action Network, 2019). The
RTI system provides follow up Tier 2 remediation and reteaching for students who have
not mastered Tier 1 instruction, and it provides extension and enrichment for students
42
who have mastered Tier 1 instruction (RTI Action Network, 2019). Tier 2 interventions,
for both academics and behavior, are targeted, individualized, and typically delivered by
a push-in, within the classroom model or through an intervention period embedded within
the school day (RTI Action Network, 2019). Finally, the RTI system provides a Tier 3
support system for students in need of intensive services for academic deficiencies and/or
behavioral issues, typically delivered in a pull-out model with the aid of a specialist (RTI
Action Network, 2019). Students eligible for Tier 3 academic and/or behavioral services
have not responded effectively to Tier 1 and Tier 2 instruction and typically have been
referred through a faculty intervention team composed of administrators, counselors, and
teachers (RTI Action Network, 2019).
For example, in the context of this RTI framework, the advisory program in
Gard’s (2014) study was implemented to provide a guaranteed academic support within
the school day, a concept supported by the RTI research of Mattos (2018), in order to
improve student academic success as measured by testing data, graduation rate, and grade
distribution. The advisory program was an intentional strategy to improve human
relationships and school culture, thus increasing engagement and achievement, by
providing an intervention period within the school day to maximize student reach by
avoiding the before school and after school conflicts of motivation, transportation, and
extracurricular activities. However, Gard (2014) found no significant improvement in
academic achievement after the implementation of an advisory program.
Solimene (2012) also studied the effectiveness of advisory on a targeted
population, utilizing a mixed methods study in order to investigate whether an advisory
program impacted the student achievement, connectedness, and belongingness of ninth

43
grade students. Solimene (2012) documented the evolution of Smaller Learning
Communities (SLC) in the American educational system. Similar to Gard (2014) and
Meloro (2005), Solimene (2012) sought answers to questions about the effectiveness of
an advisory program on school climate and culture, about the effectiveness of activities
within an advisory program, and the effectiveness of an advisory program on student
academic achievement and future planning. Solimene (2012) also studied the role of
leadership in the successful implementation of an advisory program.
In order to develop a successful and sustainable advisory program, Solimene
(2012) found, as with the PLC research of DuFour and Marzano (2011), that a strong,
effective guiding coalition is essential. Solimene (2012) utilized a mixed methods study
through interviews with students and teachers about advisory structures, schedules, and
relationships as well as an online survey to collect data on student demographics and
perceptions. Solimene (2012) conducted the study at two high schools – one school with
an integrated, scheduled advisory and one school with an additive, bi-weekly advisory.
Based on the qualitative responses of School B, the twice-a-month advisory lacked
consistency and continuity, creating difficulty for student and teacher acceptance.
Solimene (2012) further suggested that challenges in scheduling classes, in creating
resources, and in offering professional development must be anticipated by district and
building leadership.
Advisory as an RTI strategy embedded within the school day also has roots in the
small schools movement. Darling-Hammond, Ancess, and Ort (2002) reported that
schools have higher levels of achievement when they create smaller units within the
school and keep students together over multiple years. Among Darling-Hammond et al.’s

44
(2002) seven factors influencing school success, the researchers identified
personalization, relationships, flexible supports, and teacher quality, all of which are
foundational components of an advisory program. Legters, Balfanz, and McPartland
(2002) supported Darling-Hammond et al. (2002) by identifying the shortcomings of
traditional comprehensive schools and advocating for structural reforms founded upon
high standards, personalization, relevance, flexible supports, and multiple opportunities
for success. As part of their personalization discussion, the researchers promoted an
advisory program as a means to provide students with consistent and multi-faceted adult
support throughout high school (Legters et al., 2002). In addition, the researchers
endorsed the inclusion of real-world activities, career themes, and community service
opportunities to engage and connect students (Legters et al., 2002). The conclusions of
Legters et al. (2002) align with the conclusions of Rosin (2010)—as well as the
conclusions of Fullan et al.’s (2017) deeper learning model and Bishop’s (2010) P21
framework—in that the economy of industrialization and conformity has shifted in
dynamic ways requiring a new set of skills and structures from high school graduates. It
also has created a need for schools to build communities, not control behavior (Darling-
Hammond et al., 2002).
The idea of a teacher serving as an advisor to assist students with academic and
social-emotional issues during a protected time embedded into the school day is not only
ideological but practical. Fuschillo (2018) reported that, although the American School
Counselor Association recommended student-to-counselor ratio is 250-to-1, it was
actually 482-to-1. Teachers have been tasked with covering this academic and
interpersonal gap through the RTI model, which includes interventions such as an

45
advisory program. For an advisory program to be successful, as Solimene (2012)
concluded, schools must have strong guiding coalitions to build positive momentum for
the implementation of an advisory program. Because an advisory program comes with
additional responsibility and potentially additional emotional stress for teachers, schools
must have clear communication, sound justification, and seamless organization for the
intervention system and advisory program (Yonezawa et al., 2012). In addition, teachers
must have adequate training. Jordan (2015), in an evaluation of a rural high school
advisory program using a mixed methods approach, found an overall positive perception
of the advisory program, especially in the area of teacher connectedness and parent
communication. However, Jordan (2015) also found that teachers needed more training
in order to feel confident and competent in handling sensitive topics and personal issues
with students.
The Focus on Personalized Planning
The concepts of intervention and advising as part of a school-wide support system
merge into the movement toward personalization. In their synthesis of research,
Yonezawa et al. (2012) advocated for personalization in schools, which they defined as
“the web of positive relationships cultivated among adults and youth in classrooms,
schools, and communities that promotes learning by helping students feel competent in
and connected to the world” (p. 1) in order to combat the “anonymity, irrelevance, and
disengagement” (p. 1) that some students feel in large high school environments.
Specifically, the researchers wanted to find evidence of the impact of personalization
programs on academics and for low-income and minority students. They articulated in
their research questions that they wanted to study the history of personalization programs,

46
the outcomes of student-teacher relationships, the success of intervention programs, the
best practices for low-income and minority students, and the next steps for increasing
personalization in schools.
In order to establish the context of personalization, Yonezawa et al. (2012)
pointed to Theodore Sizer and his Coalition of Essential Schools as the contemporary
progenitors of personalized education. The findings of their work have been driven by
millions of dollars in investments from the Bill and Melinda Gates Foundation and the
Annenberg Foundation in smaller schools and personalization programs. Yonezawa et al.
(2012) acknowledged many social-emotional benefits of personalization—students less
likely to engage in risky behavior, students more likely to matriculate smoothly through
grades and between schools, students less likely to be disengaged with class. They
further distinguished between warmth and conflict in student-teacher relationships. They
defined warmth as involving “teacher interest, high expectations for student achievement,
praise, and willingness to listen to students” (p. 6) and conflict as involving “coercive
disciplinary practices, unwillingness to incorporate student choice, and low expectations
for student achievement” (Yonezawa et al., 2012).
However, Yonezawa et al. (2012) also discussed the limitations of research on
advisory programs. The researchers noted that much of the literature on personalization
has been limited to elementary and middle school populations. The researchers further
discussed that personalization programs in high school face two key challenges that
differentiate high schools from elementary schools: structural (fifty-minute classes with
seven teachers) and personal (independent young adults who broker power and control
dynamics with authority figures). Yonezawa et al. (2012) also discussed potential

47
resistance from teachers who see advisory as a forced, mandated, extra responsibility,
leading to lack of fidelity in the implementation of advisory. The researchers
recommended a need for developing a functional and effective advisory program for
specific student populations as well as embedded and consistent professional
development for teachers. This finding was confirmed by Van Ornum (2014) and Jordan
(2015) whose descriptive surveys from advisory teachers found that advisory teachers
need more training and support to teach advisory effectively. Yonezawa et al. (2012)
recommended Professional Learning Communities (PLCs) as a delivery system to
support these goals, which was supported by Legters et al. (2002) who found that for
small school initiatives to work teachers must be collaborative and have shared plan time.
Yonezawa et al. (2012) ended their study with a concern about the financial sustainability
of reform and redesign for personalization programs and the need for more studies that
demonstrate measurable quantitative academic benefits of advisory programs.
In another study involving the impact of personalized programming, McClure,
Yonezawa, and Jones (2010) studied the relationship among student perceptions toward
personalization, student opinions of advisory, and student outcomes of academic
performance. In order to analyze this relationship, the researchers correlated student
survey data with grade point averages and standardized test scores English Language Arts
(ELA scaled scores) subtest of the California Standards Test (CST). Their study was
conducted in a large, urban school district in California over three years in 14 schools,
and it involved 10,044 total collected surveys. McClure et al. (2010) attempted to
address gaps in the literature on advisory programs by focusing their study on an advisory
program’s relationship with specific, quantitative academic outcomes. The researchers

48
found that more positive feelings about advisory period were associated with worse
academic outcomes. Their finding about the perceptions and outcomes with an advisory
program complicates the picture of an advisory program.
The findings of McClure et al. (2010), limited by a population in one urban school
district, also prompted new research questions: Do high-achieving students have lower
opinions of advisory because advisory is not driven by specific, practical academic
outcomes, or do high-achieving students see advisory as unnecessary because many high-
achieving students already feel intrinsically motivated and personally connected at
school? Do low-achieving students have higher opinions of an advisory program because
an advisory program provides these students with a safe, supportive space to help with
social-emotional development and coping strategies? In their discussion section, the
researchers provided their interpretations on their advisory program findings and on these
research questions, suggesting that the students who needed an advisory program the
most valued it the most; that an advisory program is too artificial, institutionalize, and
generic for authentic personalization; that advisory programs are unevenly and poorly
implemented without consistent fidelity; and that schools should work on organic,
embedded, authentic personalization throughout their classes and culture (McClure et al.,
2010).
The Efficacy of Advisory Programming
Besides the goals of increased student achievement and personalization, the goals
of increased student connectedness and engagement have been factors in the overall
evaluation of the effectiveness of advisory programs. Meloro’s (2005) study provided a
bridge between these goals as she examined components related both to individualization

49
and belonging. Meloro’s (2005) study, a single school quasi-experimental design, which
examined the relationship between an advisory program structure, student perceptions
toward an advisory program, and student sense of school belonging, yielded results which
more specifically defined which populations were best served by advisory programs, thus
extending the research of McClure et al. (2010). Meloro formulated her research
questions based on three key points in the definition of school personalization: every
child has an advocate, every child has an individual plan of progress, and every child has
goals and expectations for success. Meloro (2005) further defined a personalized
advisory program as including “recognition, trust, respect, acceptance, confirmation, and
relevance” (p. 6). Together, these two definitions form the foundation of Meloro’s
research which used the review of literature to define other essential terms, such as
school connectedness, school membership, and social support.
Meloro (2005) sought answers to questions on the student and teacher advisory
program experience based on the types of activities completed, on the perception of the
activities, on the sense of belonging, and on the consistency between student and teacher
perceptions of an advisory program. To answer these questions, Meloro (2005) selected
a diverse high school in Rhode Island with 1,580 students and 123 teachers. Meloro
(2005) used a single school quasi-experimental design measured by two school belonging
instruments and by the primary independent variables of student demographic
characteristics and student perceptions toward the advisory program and the advisory
teacher. Meloro (2005) concluded that there was variability in the delivery of the
advisory programs, that freshman advisory programs focused more on academics, that
students did not view an advisory program as positively as the teachers, that female

50
students liked an advisory program more than male students, that freshman students liked
an advisory program more than students in other grades, and that students with a more
positive perception of an advisory program had a more positive connection to school.
Weilbacher and Lanier (2012) extended the work of Meloro (2005) by focusing
on the effectiveness of an advisory program with specific populations. In this qualitative
study, using interview data from student focus groups and teacher focus groups,
Weilbacher and Lanier (2012) approached the study of an advisory program in two
original ways: by examining the implementation of an advisory program in a model
middle school for exemplary practice and by examining the implementation of an
advisory program with students separated by gender. The researchers studied the impact
of gender separation on the perceptions of trust, openness, and confidentiality within an
advisory program. The researchers chose qualitative interviews with semi-structured
focus groups to replicate an advisory setting, to describe perceptions openly and
interactively, and to create a student-centered research process.
Weilbacher and Lainer (2012) provided a succinct definition and history of
advisory programs; in addition, their study provided a framework—advocacy,
community, skills, invigoration, academic, and administrative—for an advisory program.
However, the population which they studied had little diversity (5.9% non-White) and
little economic need (9.6% low income). The researchers focused in particular on the
role of advocacy, community, and skills within an advisory program. Their research
addressed a gap in the literature as they found no other study dealing with gender
separation in an advisory program. The researchers found that smaller groups facilitated
communication, openness, and trust. In addition, their study found that this sense of

51
community was supported by a gender-separate advisory program design which allowed
for more confidentiality. Their study also found that students were more likely to be
authentic with a teacher of the same gender. The results of their study were limited by
two key factors. Their qualitative study included no observational data to corroborate the
interview data. Weilbacher and Lanier (2012) utilized seven semi-structured focus
groups with a total of 52 students participating to replicate an advisory setting, to
describe perceptions openly and interactively, and to create a student-centered research
process. In addition, one of the researchers of the study was a building principal in the
school of the study which may have led to research bias. The results of their study
provided three questions for further research: Is confidentiality developmental and
related to levels of student maturity? Would gender-separate advisories work in high
school after students have moved beyond middle school? Do male teachers perceive the
benefits of an advisory program in the same way as female teachers?
While McClure et al. (2010) and Meloro (2005) found weaknesses in the
effectiveness of advisory programs, Shulkind and Foote (2009), using a mixed methods
explanatory sequential study of middle school students, designed their study in such a
way to focus factors that promoted student academic success and school connectedness
through an advisory program. Shulkind and Foote (2009) studied this issue because,
according to Galassi et al. (2004), there was a lack of empirical evidence in the
effectiveness of advisory programs. Shulkind and Foote (2009) distributed a quantitative
survey to identify three advisory programs with the highest levels of connectedness
between advisees and advisors. Once determined, the researchers extended their
quantitative data collection with qualitative data collection through interviews,
52
observations, and focus groups. The mixed methods research design produced seven
common characteristics found in advisory programs with high levels of school
connectedness. Strong advisory programs addressed issues of community, promoted
open communication, functioned as a community of learners, perceived advisory as
improving academic performance, had advisors who knew and cared about their advisees,
had advisors who monitored the academic progress of the advisees, and had advisors who
were problem solvers and advice givers. Shulkind and Foote (2009) suggested further
research into the role of student mentoring through advisory programs and grade-level
specific advisory content.
Like Shulkind and Foote (2009), Van Ornum (2014) also researched both advisor
and advisee perceptions of advisory; however, Van Ornum (2014) utilized a quantitative
survey instrument administered to a sample size of 28 advisors and 145 advisees to
measure the effectiveness of an advisory program in a rural Hawaii high school based on
student attitudes and perceptions. The purpose of the study was to determine the
advisory program’s efficacy in achieving its goals, to identify weaknesses in the program,
and to propose suggestions for improvement (Van Ornum, 2014, p. 7). The survey
assessed the advisory participants’ perceptions of relationships, planning, competency,
and recommendations for the school’s advisory program (Van Ornum, 2014).
Van Ornum (2014) conducted a quantitative study that examined advisory
participants’ perceptions of student and advisor relationships, assistance in making post-
high school plans, advisor content knowledge, and recommendations for program
improvement. Van Ornum (2014) found that the advisors and advisees perceived that the
advisory program supported the formation of positive student relationships with adults in

53
the school and the effective development of post-secondary school plans. In addition, the
advisory students perceived their advisory teachers to value student ideas, to help with
personal issues, to be dependable.
Summary
Chapter 2 provided literature about the evolution of college and career readiness,
the transformation in socio-economic dynamics, the proliferation of mental health issues,
the implementation of social-emotional learning, the design of tiered support systems, the
focus on personalized planning, and the efficacy of advisory programming pertinent to
this study on student perceptions toward a high school advisory program. As part of this
discussion, the review of literature established the origin and utilization of RTI as a tiered
system of embedded responses to support students academically and behaviorally within
the school day, which played into the larger of goal of an advisory program: to deliver
college and career planning and social and emotional development. The review of
literature also included an overview of CTE, SEL, P21, and deeper learning to establish
the ways in which government, corporate, philanthropic, and community organizations
have sought to ensure that high school students are prepared for post-secondary success.
Chapter 3 includes a description of the methodology used for the study, the research
design, the selection of participants, the measurement, the data collection procedures, the
data analysis and hypothesis testing procedures, and the limitations.

54
Chapter 3
Methods
The purpose of this quantitative study was to determine the impact of a high
school advisory program in a public high school as measured primarily by a cross-
sectional descriptive survey of student perceptions using a Likert-type scale.
Specifically, this research study focused on student perceptions toward excitement about
going to an advisory class, eagerness in participating in an advisory class, interest in the
lessons from an advisory class, and the usefulness of ideas from an advisory class, and
the analyses disaggregated the sample by student demographics (grade level, gender, and
ethnicity) and by self-reported grades. In addition, this research study correlated student
perceptions toward an advisory program and an advisory teacher, toward an advisory
teacher and belonging at school, and toward an advisory program and belonging at
school. Lastly, this research study focused on student perceptions toward the importance
of their participation in school athletics or activities, the importance of their participation
in volunteer work or community service, the usefulness of an advisory program for
college and/or career plans, and the usefulness of an advisory program for social and
emotional development, and the analyses disaggregated the sample by student
demographics (grade level, gender, and ethnicity) and by self-reported grades.
Research Design
According to Creswell and Creswell (2018), research designs are “types of
inquiry within qualitative, quantitative, and mixed methods approaches that provide
specific direction for procedures in a research study” (p. 11). A quantitative descriptive
survey, designed with a Likert-type scale, was used to measure student perceptions

55
toward a high school advisory program through four components: excitement about going
to an advisory class, eagerness in participating in an advisory class, interest in the lessons
from an advisory class, and the usefulness of ideas from an advisory class. In addition,
the survey was used to correlate student perceptions toward an advisory program and an
advisory teacher, toward an advisory teacher and belonging at school, and toward an
advisory program and belonging at school. Lastly, the survey was used to measure
student perceptions toward the intended outcomes of a high school advisory program
through four components: the importance of their participation in school athletics or
activities, the importance of their participation in volunteer work or community service,
the usefulness of an advisory program for college and/or career plans, and the usefulness
of an advisory program for social and emotional development. The student survey in this
cross-sectional descriptive study was used to investigate who is benefitting from and who
is best served by a high school advisory program.
Although descriptive research is one of the most basic forms of research, this
research design allows researchers to examine what the “phenomena look like from the
perspective of…the participants in the research [which is of value] to the public and to
educators” (Lunenburg & Irby, 2008, p. 31). Quantitative studies typically involve
descriptive, correlational, causal-comparative, quasi-experimental, or experimental
methods. Due to access and privacy issues with public high school students, a
quantitative research design proved the most effective and expedient means to gather data
related to the impact of a high school advisory program on student perceptions toward a
high school advisory program, toward an advisory teacher, toward belonging at school,
and toward the intended outcomes of an advisory program. Creswell and Creswell
56
(2018) enumerated the advantages of survey design, which provides “the economy of the
design, rapid turnaround in data collection, and constraints that preclude (researchers)
from pursuing other designs” (p. 149).
Prior to conducting the study, the variables were identified. The independent
variables included in this study were grade level, gender, ethnicity, and self-reported
grades. The variables of interest included in this study were student perceptions toward
the importance of their participation in school athletics or activities; student perceptions
toward the importance of their participation in volunteer work or community service;
student perceptions toward the usefulness of an advisory program for college and/or
career plans; student perceptions toward the usefulness of an advisory program for social
and emotional development; student perceptions toward belonging in school; student
perceptions toward an advisory teacher; and student perceptions toward an advisory
program as measured by students perceptions toward their excitement about going to
advisory class, toward their eagerness in participating in advisory class, toward their
interest in the lessons from advisory class, and toward the usefulness of the ideas from
advisory class.
Selection of Participants and Sampling Procedure
Lunenburg and Irby (2008) identified purposive sampling as the selection of “a
sample based on the researcher’s experience or knowledge of the group to be sampled”
(p. 175). The researcher chose a purposive sample because of the researcher’s
knowledge of the district and the school. This allowed the researcher to distribute the
student survey electronically during one advisory period to students in all grade levels at

57
Primus High School. The students voluntarily responded to the survey administered
during one advisory class on May 1, 2019.
Lunenburg and Irby (2008) established criteria for deciding on the numbers of
participants. According to their heuristic guideline, a survey should use 800 or more
participants. In addition, according to their formula guideline, a sample size of at least
400 is adequate for a population of 5,000 or more. The sample for this study meets both
of these guidelines for the number of participants.
Measurement
Creswell and Creswell (2018) defined survey design as a “quantitative description
of trends, attitudes, and opinions of a population, or tests for associations among
variables of a population, by studying a sample of that population” (p. 147). Surveys
help researchers to answer descriptive questions, questions about relationships between
variables, and questions about predictive relationships between variables (Creswell &
Creswell, 2018). Surveys can be a preferred data collection procedure because of their
economy of design and because of their expediency in data collection. In all cases, a
survey instrument must be valid and reliable. Lunenburg and Irby (2008) defined validity
as “the degree to which an instrument measures what it purports to measure” (p. 181) and
reliability as “the degree to which an instrument consistently measures whatever it is
measuring” (p. 182).
Conducting this study involved the use of a survey modified from Panorama
Education’s Student Survey, which is a “set of survey scales, or groups of questions, that
measure student perceptions toward teaching and learning, as well as perceptions of
school climate” (Panorama Education, 2018, p. 2). Panorama Education designed the

58
open-source student survey to allow educators to “customize the survey by selecting
topics they value most without compromising the integrity of the survey” (Panorama
Education, 2018, p. 2). The Panorama Education researchers designed the student survey
utilizing the best practices in design: wording items as questions not statements, asking
one idea at a time, using five response options, and phrasing questions with positive
language (Artino, Gehlbach, & Durning, 2011; Dillman, Smyth, & Christian, 2014). The
Panorama researchers used a six-step design process developed by Gehlbach and
Brinkworth (2011) to build evidence of validity, including literature review, interviews
and focus groups, synthesis of indicators, item (question) creation, expert review, and
cognitive pre-testing and interviewing. After the completion of the six steps, the
Panorama Education researchers revised the items and subjected them to large-scale pilot
tests in schools and districts in the southeastern and southwestern United States. The
pilot in the southwestern United States included a large, diverse high school with
representation across multiple grade levels and racial groups. In their summary, the
Panorama Education (2018) researchers noted that their student survey items had a
coefficient alpha greater than .70, had undergone confirmatory factor analysis to analyze
factor structure, and had evidence of convergent and discriminant validity. The
coefficient alpha is an index of the reliability of a measurement instrument. It varies
between 0 and 1.0. The closer to 1.0 the better the strength of the evidence for reliability.
A coefficient alpha greater than .70 is considered strong evidence for the reliability of the
measurement.
Panorama Education allows for the customization of the survey by selecting items
from “the scales that…matter most to (the) community...[and]…meet the unique needs of

59
(the) specific context” (Panorama Education, 2018, p. 4). The survey for this research
study included 20 total items to gather student demographic information as well as
student perceptions toward school, the advisory course, and the advisory teacher. The
survey items were designed with a Likert-type scale, and the response options were
verbally labeled and numerically coded. The 5-point scales depended on the nature of the
content of the item. A copy of the student survey is included in Appendix D.
Item 1 addressed the grade level of the respondent: What is your grade level in
school? Student respondents selected from the following options: freshman, sophomore,
junior, and senior.
Item 2 addressed the gender of the respondent: What best describes your gender?
Student respondents selected from the following options: female, male, other (non-
binary, prefer to self-describe, and prefer not to say).
Item 3 addressed the ethnicity of the respondent: What best describes your
ethnicity? Student respondents selected from the following options: Asian/Pacific
Islander, Black/African American, Hispanic/Latino, Multi-Racial, Native
American/American Indian, White, other, and prefer not to say.
Item 4 addressed the self-reported grades of the respondent: What grades do you
typically earn in school? Student respondents selected from the following options: A, B,
C, D, and F.
Item 5 addressed the respondent’s perceptions toward the importance of
participation in school athletics or activities: How important to you is participation in
school athletics or activities? Student respondents selected from the following options:

60
not at all important, slightly important, somewhat important, quite important, and
extremely important.
Item 6 addressed the respondent’s perceptions toward the importance of
participation in volunteer work or community service: How important to you is
participation in volunteer work or community service? Student respondents selected
from the following options: not at all important, slightly important, somewhat important,
quite important, and extremely important.
Item 7 addressed the respondent’s excitement about going to advisory class: How
excited are you about going to your advisory class? Student respondents selected from
the following options: not all excited, slightly excited, somewhat excited, quite excited,
and extremely excited.
Item 8 addressed the respondent’s eagerness in participating in advisory class:
How eager are you to participate in your advisory class? Student respondents selected
from the following options: not all eager, slightly eager, somewhat eager, quite eager, and
extremely eager.
Item 9 addressed the respondent’s interest in the lessons of advisory class: How
interesting do you find the things you learn in your advisory class? Student respondents
selected from the following options: not all interesting, slightly interesting, somewhat
interesting, quite interesting, and extremely interesting.
Item 10 addressed the respondent’s perceptions toward the usefulness of the ideas
from advisory class: How often do you use ideas from your advisory class in your daily
life? Student respondents selected from the following options: almost never, once in a
while, sometimes, frequently, and almost always.

61
Item 11 addressed the respondent’s perceptions toward the enthusiasm of an
advisory teacher: How often does your advisory teacher seem excited to be teaching your
advisory class? Student respondents selected from the following options: almost never,
once in a while, sometimes, frequently, and almost always.
Item 12 addressed the respondent’s perceptions toward the clarity of the advisory
teacher: How clearly does your advisory teacher present the information that you need to
learn? Student respondents selected from the following options: not all clearly, slightly
clearly, somewhat clearly, quite clearly, and extremely clearly.
Item 13 addressed the respondent’s connectedness with an advisory teacher: How
connected do you feel to your advisory teacher? Student respondents selected from the
following options: not at all connected, slightly connected, somewhat connected, quite
connected, and extremely connected.
Item 14 addressed the respondent’s perception toward an advisory teacher’s
control of an advisory class: How good is your advisory teacher at making sure students
do not get out of control? Student respondents selected from the following options: not
good at all, slightly good, somewhat good, quite good, and extremely good.
Item 15 addressed the respondent’s perception toward belonging at school: How
much do you feel like you belong at your school? Student respondents selected from the
following options: do not belong at all, belong a little bit, belong somewhat, belong quite
a bit, and completely belong.
Item 16 addressed the respondent’s perception toward the usefulness of an
advisory program for college and/or career plans: How useful is your advisory class to
your future college and/or career plans? Student respondents selected from the following

62
options: not at all useful, slightly useful, somewhat useful, quite useful, and extremely
useful.
Item 17 addressed the respondent’s perception toward the usefulness of an
advisory program in developing social and emotional learning: How useful is your
advisory class to your social and emotional development? Student respondents selected
from the following options: not at all useful, slightly useful, somewhat useful, quite
useful, and extremely useful.
Items 18 through 20 addressed earlier questions in the survey but in inverse
construction as a measure of internal reliability.
Item 18 addressed the respondent’s perception toward an advisory teacher’s
enthusiasm in teaching the advisory class: How often does your teacher seem
unenthusiastic to be teaching your advisory class? Student respondents selected from the
following options: almost never, once in a while, sometimes, frequently, and almost
always.
Item 19 addressed the respondent’s perception toward the respondent’s own
interest in participating in advisory class: How disinterested are you to participate in your
advisory class? Student respondents selected from the following options: not at all
disinterested, slightly disinterested, somewhat disinterested, quite disinterested, and
extremely disinterested.
Item 20 addressed the respondent’s perception toward the respondent’s sense of
belonging at school: How much do you feel like you are alone at your school? Student
respondents selected from the following options: not at all alone, a little alone, somewhat
alone, quite a bit alone, and completely alone.

63
Data Collection Procedures
The researcher submitted an email proposal to the Panorama company to use the
company’s student survey on December 28, 2018. The researcher received approval
from the Panorama company to use and modify the company’s student survey on
December 28, 2018 (see Appendix E). In addition, Panorama Education (2015) in a user
guide stated that the student survey is “available as a free and open-source resource for
educators” (p. 2). The researcher submitted the requests to the appropriate district and
building administration to conduct the survey on March 15, 2019. The research received
approval from the district Director of Assessment and Research on March, 20, 2019 (see
Appendix F). The researcher submitted the IRB form to Baker University on March 20,
2019. The IRB committee approved the IRB request on March 29, 2019 (see Appendix
G). After permission to conduct the survey and use of archived data had been granted,
the researcher scheduled the administration of the student survey with Primus High
School for May 1, 2019.
The student survey, administered electronically through a Google Form during
one advisory period on May 1, 2019, allowed the researcher to collect data from 686
students in Grades 9-12. The researcher provided the student survey link through email
to advisory teachers at Primus High School one week prior to the advisory period. In the
email, the researcher also provided instructions for the administration of the survey,
including language from the IRB reflecting the protections for the participants, including
clear statements that the survey was voluntary; that no participant name would be used;
that no participant would encounter the risk of psychological, social, physical, or legal
risk; that no participant would be subjected to stress; that no participant would be

64
deceived or misled; that no participant would be requested to provide personal or
sensitive information; that no aspect of the data would be made part of any permanent
record that would be identified with the participant; that the completion of the survey
would indicate permission to participate in the research study; that participants have the
right not to answer any question; and that participants have the right to discontinue
participation at any time (see Appendix D). During the advisory period on May 1, 2019,
the teachers were instructed to read the survey instructions to students and to post the
survey link in the advisory classroom. The survey instructions and protections also were
listed at the top of the student survey. Students, using their school district MacBook
computers, typed the link to the Google Form into an internet browser and completed the
survey. The researcher set the Google Form survey settings to protect student anonymity,
to provide only one response per student, and to close the survey administration window
after the advisory period concluded. The data gathered from the Google Form was
exported to a Google Sheet and saved on a password protected online account and
downloaded to a password protected computer. The researcher loaded the data into the
IBM SPSS Faculty Stats Pack Version 25 to complete the hypothesis testing, including
the determination of the effect size.
Data Analysis and Hypothesis Testing
Data from the Google Form student survey were downloaded and imported into
IBM SPSS Faculty Stats Pack Version 25. The data analysis focused on 23 research
questions with 41 hypotheses. Each research question is described below with the
corresponding hypothesis and statistical analysis method. The research questions were
organized to parallel the organization of the questions on the student survey.

65
RQ1. To what extent is there a difference in perceptions toward an advisory
program among students enrolled at different grade levels (freshman, sophomore, junior,
senior)?
H1. There is a statistically significant difference in excitement about going to
advisory class among students enrolled at different grade levels (freshman, sophomore,
junior, senior).
A one-factor analysis of variance (ANOVA) was conducted to test H1. The
categorical variable used to group the dependent variable, student perceptions toward
their excitement about going to advisory class, was grade level (freshman, sophomore,
junior, senior). The level of significance was set at .05.
H2. There is a statistically significant difference in eagerness about participating
in advisory class among students enrolled at different grade levels (freshman, sophomore,
junior, senior).
A one-factor ANOVA was conducted to test H2. The categorical variable used to
group the dependent variable, student perceptions toward their eagerness about
participating in advisory class, was grade level (freshman, sophomore, junior, senior).
The level of significance was set at .05.
H3. There is a statistically significant difference in interest in the lessons from
advisory class among students enrolled at different grade levels (freshman, sophomore,
junior, senior).
A one-factor ANOVA was conducted to test H3. The categorical variable used to
group the dependent variable, student perceptions toward their interest in the lessons

66
from advisory class, was grade level (freshman, sophomore, junior, senior). The level of
significance was set at .05.
H4. There is a statistically significant difference in perceptions toward the
usefulness of ideas from advisory class in their daily lives among students enrolled at
different grade levels (freshman, sophomore, junior, senior).
A one-factor ANOVA was conducted to test H4. The categorical variable used to
group the dependent variable, student perceptions toward the usefulness of ideas from
advisory class in their daily lives, was grade level (freshman, sophomore, junior, senior).
The level of significance was set at .05.
RQ2. To what extent is there a difference in perceptions toward an advisory
program among students reporting different genders (female, male, other [non-binary,
prefer to self-describe, prefer not to say])?
H5. There is a statistically significant difference in excitement about going to
advisory class among students reporting different genders (female, male other [non-
binary, prefer to self-describe, prefer not to say]).
A one-factor ANOVA was conducted to test H5. The categorical variable used to
group the dependent variable, student perceptions toward their excitement about going to
advisory class, was gender (female, male, other [non-binary, prefer to self-describe,
prefer not to say]). The level of significance was set at .05.
H6. There is a statistically significant difference in eagerness about participating
in advisory class among students reporting different genders (female, male, other [non-
binary, prefer to self-describe, prefer not to say]).

67
A one-factor ANOVA was conducted to test H6. The categorical variable used to
group the dependent variable, student perceptions toward their eagerness about
participating in advisory class, was gender (female, male, other [non-binary, prefer to
self-describe, prefer not to say]). The level of significance was set at .05.
H7. There is a statistically significant difference in interest in the lessons from
advisory class among students reporting different genders (female, male other [non-
binary, prefer to self-describe, prefer not to say]).
A one-factor ANOVA was conducted to test H7. The categorical variable used to
group the dependent variable, student perceptions toward their interest in the lessons
from advisory class, was gender (female, male, other [non-binary, prefer to self-describe,
prefer not to say]). The level of significance was set at .05.
H8. There is a statistically significant difference in perceptions toward the
usefulness of ideas from advisory class in their daily lives among students reporting
different genders (female, male, other [non-binary, prefer to self-describe, prefer not to
say]).
A one-factor ANOVA was conducted to test H8. The categorical variable used to
group the dependent variable, student perceptions toward the usefulness of ideas from
advisory class in their daily lives, was gender (female, male, other [non-binary, prefer to
self-describe, prefer not to say]). The level of significance was set at .05.
RQ3. To what extent is there a difference in perceptions toward an advisory
program among students reporting different ethnicities (Asian/Pacific Islander,
Black/African-American, Hispanic/Latino, Multi-Racial, Native American/American
Indian, White, other, prefer not to say)?
68
H9. There is a statistically significant difference in excitement about going to
advisory class among students reporting different ethnicities (Asian/Pacific Islander,
Black/African-American, Hispanic/Latino, Multi-Racial, Native American/American
Indian, White, other, prefer not to say).
A one-factor ANOVA was conducted to test H9. The categorical variable used to
group the dependent variable, student perceptions toward their excitement about going to
advisory class, was ethnicity (Asian/Pacific Islander, Black/African-American,
Hispanic/Latino, Multi-Racial, Native American/American Indian, White, other, prefer
not to say). The level of significance was set at .05.
H10. There is a statistically significant difference in eagerness about participating
in advisory class among students reporting different ethnicities (Black/African-American,
Hispanic/Latino, White, Other [Asian/Pacific Islander, Multi-Racial, Native
American/American Indian, other, prefer not to say]).
A one-factor ANOVA was conducted to test H10. The categorical variable used
to group the dependent variable, student perceptions toward their eagerness about
participating in advisory class, was ethnicity (Asian/Pacific Islander, Black/African-
American, Hispanic/Latino, Multi-Racial, Native American/American Indian, White,
other, prefer not to say). The level of significance was set at .05.
H11. There is a statistically significant difference in interest in the lessons from
advisory class among students reporting different ethnicities (Asian/Pacific Islander,
Black/African-American, Hispanic/Latino, Multi-Racial, Native American/American
Indian, White, other, prefer not to say).
69
A one-factor ANOVA was conducted to test H11. The categorical variable used
to group the dependent variable, student perceptions toward their interest in the lessons
from advisory class, was ethnicity (Asian/Pacific Islander, Black/African-American,
Hispanic/Latino, Multi-Racial, Native American/American Indian, White, other, prefer
not to say). The level of significance was set at .05.
H12. There is a statistically significant difference in perceptions toward the
usefulness of ideas from advisory class in their daily lives among students reporting
different ethnicities (Asian/Pacific Islander, Black/African-American, Hispanic/Latino,
Multi-Racial, Native American/American Indian, White, other, prefer not to say).
A one-factor ANOVA was conducted to test H12. The categorical variable used
to group the dependent variable, student perceptions toward the usefulness of ideas from
advisory class in their daily lives, was ethnicity (Asian/Pacific Islander, Black/African-
American, Hispanic/Latino, Multi-Racial, Native American/American Indian, White,
other, prefer not to say). The level of significance was set at .05.
RQ4. To what extent is there a difference in perceptions toward an advisory
program among students based on the grades they report as usual in school (A, B, C, D,
F)?
H13. There is a statistically significant difference in excitement about going to
advisory class among students based on the grades they report as usual in school (A, B,
C, D, F).
A one-factor ANOVA was conducted to test H13. The categorical variable used
to group the dependent variable, student perceptions toward their excitement about going

70
to advisory class, was grades reported as usual in school (A, B, C, D, F). The level of
significance was set at .05.
H14. There is a statistically significant difference in eagerness about participating
in advisory class among students based on the grades they report as usual in school (A, B,
C, D, F).
A one-factor ANOVA was conducted to test H14. The categorical variable used
to group the dependent variable, student perceptions toward their eagerness about
participating in advisory class, was grades reported as usual in school (A, B, C, D, F).
The level of significance was set at .05.
H15. There is a statistically significant difference in interest in the lessons from
advisory class among students based on the grades they report as usual in school (A, B,
C, D, F).
A one-factor ANOVA was conducted to test H15. The categorical variable used
to group the dependent variable, student perceptions toward their interest in the lessons
from advisory class, was grades reported as usual in school (A, B, C, D, F). The level of
significance was set at .05.
H16. There is a statistically significant difference in perceptions toward the
usefulness of ideas from advisory class in their daily lives among students based on the
grades they report as usual in school (A, B, C, D, F).
A one-factor ANOVA was conducted to test H16. The categorical variable used
to group the dependent variable, student perceptions toward the usefulness of ideas from
advisory class in their daily lives among, was grades reported as usual in school (A, B, C,
D, F). The level of significance was set at .05.

71
RQ5. To what extent is there a relationship between student perceptions toward
an advisory program and student perceptions toward their belonging at school?
H17. There is a statistically significant relationship between student perceptions
toward their excitement about going to advisory class and student perceptions toward
their belonging at school.
A Pearson product moment correlation coefficient was calculated to index the
strength and direction of the relationship between the two numerical variables: student
perceptions toward their excitement about going to advisory class and student perceptions
toward their belonging at school. The statistical significance of the correlation
coefficient was examined to test H17. The level of significance was set at .05.
H18. There is a statistically significant relationship between student perceptions
toward their eagerness about participating in advisory class and student perceptions
toward their belonging at school.
A Pearson product moment correlation coefficient was calculated to index the
strength and direction of the relationship between the two numerical variables: student
perceptions toward their eagerness about participating in advisory class and student
perceptions toward their belonging at school. The statistical significance of the
correlation coefficient was examined to test H18. The level of significance was set at .05.
H19. There is a statistically significant relationship between student perceptions
toward their interest in the lessons from advisory class and student perceptions toward
their belonging at school.
A Pearson product moment correlation coefficient was calculated to index the
strength and direction of the relationship between the two numerical variables: student

72
perceptions toward their interest in the lessons from advisory class and student
perceptions toward their belonging at school. The statistical significance of the
correlation coefficient was examined to test H19. The level of significance was set at .05.
H20. There is a statistically significant relationship between student perceptions
toward the usefulness of ideas from advisory class in their daily lives and student
perceptions toward their belonging at school.
A Pearson product moment correlation coefficient was calculated to index the
strength and direction of the relationship between the two numerical variables: student
perceptions toward their usefulness of ideas from advisory class in their daily lives and
student perceptions toward their belonging at school. The statistical significance of the
correlation coefficient was examined to test H20. The level of significance was set at .05.
RQ6. To what extent is there a relationship between student perceptions toward
their connectedness with an advisory teacher and student perceptions toward their
belonging at school?
H21. There is a statistically significant between student perceptions toward their
connectedness with an advisory teacher and student perceptions toward their belonging at
school.
A Pearson product moment correlation coefficient was calculated to index the
strength and direction of the relationship between the two numerical variables: student
perceptions toward their connectedness with an advisory teacher and student perceptions
toward their belonging at school. The statistical significance of the correlation
coefficient was examined to test H21. The level of significance was set at .05.

73
RQ7. To what extent is there a relationship between student perceptions toward
an advisory program and student perceptions toward their connectedness with an
advisory teacher?
H22. There a statistically significant relationship between student perceptions
toward their excitement about going to advisory class and student perceptions toward
their connectedness with an advisory teacher.
A Pearson product moment correlation coefficient was calculated to index the
strength and direction of the relationship between the two numerical variables: student
perceptions toward their excitement about going to advisory class and student perceptions
toward their connectedness with an advisory teacher. The statistical significance of the
correlation coefficient was examined to test H22. The level of significance was set at .05.
H23. There a statistically significant relationship between student perceptions
toward their eagerness about participating in advisory class and student perceptions
toward their connectedness with an advisory teacher.
A Pearson product moment correlation coefficient was calculated to index the
strength and direction of the relationship between the two numerical variables: student
perceptions toward their eagerness about participating in advisory class and student
perceptions toward their connectedness with an advisory teacher. The statistical
significance of the correlation coefficient was examined to test H23. The level of
significance was set at .05.
H24. There a statistically significant relationship between student perceptions
toward their interest in the lessons from advisory class and student perceptions toward
their connectedness with an advisory teacher.

74
A Pearson product moment correlation coefficient was calculated to index the
strength and direction of the relationship between the two numerical variables: student
perceptions toward their interest in the lessons from advisory class and student
perceptions toward their connectedness with an advisory teacher. The statistical
significance of the correlation coefficient was examined to test H24. The level of
significance was set at .05.
H25. There a statistically significant relationship between student perceptions
toward the usefulness of ideas from advisory class in their daily lives and student
perceptions toward their connectedness with an advisory teacher.
A Pearson product moment correlation coefficient was calculated to index the
strength and direction of the relationship between the two numerical variables: student
perceptions toward the usefulness of ideas from advisory class in their daily lives and
student perceptions toward their connectedness with an advisory teacher. The statistical
significance of the correlation coefficient was examined to test H25. The level of
significance was set at .05.
RQ8. To what extent is there a difference in perceptions toward the importance of
participation in school athletics or activities among students enrolled at different grade
levels (freshman, sophomore, junior, senior)?
H26. There is a statistically significant difference in perceptions toward the
importance of participation in school athletics or activities among students enrolled at
different grade levels (freshman, sophomore, junior, senior).
A one-factor ANOVA was conducted to test H26. The categorical variable used
to group the dependent variable, student perceptions toward the importance of their
75
participation in school athletics or activities, was grade level (freshman, sophomore,
junior, senior). The level of significance was set at .05.
RQ9. To what extent is there a difference in perceptions toward the importance of
participation in volunteer work or community service among students enrolled at
different grade levels (freshman, sophomore, junior, senior)?
H27. There a statistically significant difference in perceptions toward the
importance of participation in volunteer work or community service among students
enrolled at different grade levels (freshman, sophomore, junior, senior).
A one-factor ANOVA was conducted to test H27. The categorical variable used
to group the dependent variable, student perceptions toward the importance of their
participation in volunteer work or community service, was grade level (freshman,
sophomore, junior, senior). The level of significance was set at .05.
RQ10. To what extent is there a difference in perceptions toward the usefulness
of an advisory program for college and/or career plans among students enrolled at
different grade levels (freshman, sophomore, junior, senior)?
H28. There a statistically significant difference in perceptions toward the
usefulness of an advisory program for college and/or career plans among students
enrolled at different grade levels (freshman, sophomore, junior, senior).
A one-factor ANOVA was conducted to test H28. The categorical variable used
to group the dependent variable, student perceptions toward the usefulness of an advisory
program for college and/or career plans, was grade level (freshman, sophomore, junior,
senior). The level of significance was set at .05.

76
RQ11. To what extent is there a difference in perceptions toward the usefulness
of an advisory program for social and emotional development among students enrolled at
different grade levels (freshman, sophomore, junior, senior)?
H29. There is a statistically significant difference in perceptions toward the
usefulness of an advisory program for social and emotional development among students
enrolled at different grade levels (freshman, sophomore, junior, senior).
A one-factor ANOVA was conducted to test H29. The categorical variable used
to group the dependent variable, student perceptions toward the usefulness of an advisory
program for social and emotional development, was grade level (freshman, sophomore,
junior, senior). The level of significance was set at .05.
RQ12. To what extent is there a difference in perceptions toward the importance
of participation in school athletics or activities among students among students reporting
different genders (female, male, other [non-binary, prefer to self-describe, prefer not to
say])?
H30. There is a statistically significant difference in perceptions toward the
importance of participation in school athletics or activities among students reporting
different genders (female, male, other [non-binary, prefer to self-describe, prefer not to
say]).
A one-factor ANOVA was conducted to test H30. The categorical variable used
to group the dependent variable, student perceptions toward the importance of their
participation in school athletics or activities, was gender (female, male, other [non-
binary, prefer to self-describe, prefer not to say]). The level of significance was set at
.05.
77
RQ13. To what extent is there a difference in perceptions toward the importance
of participation in volunteer work or community service among students among students
reporting different genders (female, male, other [non-binary, prefer to self-describe,
prefer not to say])?
H31. There is a statistically significant difference in perceptions toward the
importance of participation in volunteer work or community service among students
reporting different genders (female, male, other [non-binary, prefer to self-describe,
prefer not to say]).
A one-factor ANOVA was conducted to test H31. The categorical variable used
to group the dependent variable, student perceptions toward the importance of their
participation in volunteer work or community service, was gender (female, male, other
[non-binary, prefer to self-describe, prefer not to say]). The level of significance was set
at .05.
RQ14. To what extent is there a difference in perceptions toward the usefulness
of an advisory program for college and/or career plans among students reporting different
genders (female, male, other [non-binary, prefer to self-describe, prefer not to say])?
H32. There is a statistically significant difference in perceptions toward the
usefulness of an advisory program for college and/or career plans among students
reporting different genders (female, male, other [non-binary, prefer to self-describe,
prefer not to say]).
A one-factor ANOVA was conducted to test H32. The categorical variable used
to group the dependent variable, student perceptions toward the usefulness of an advisory

78
program for college and/or career plans, was gender (female, male, other [non-binary,
prefer to self-describe, prefer not to say]). The level of significance was set at .05.
RQ15. To what extent is there a difference in perceptions toward the usefulness
of an advisory program for social and emotional development among students reporting
different genders (female, male, other [non-binary, prefer to self-describe, prefer not to
say])?
H33. There is a statistically significant difference in perceptions toward the
usefulness of an advisory program for social and emotional development among students
reporting different genders (female, male, other [non-binary, prefer to self-describe,
prefer not to say]).
A one-factor ANOVA was conducted to test H33. The categorical variable used
to group the dependent variable, student perceptions toward the usefulness of an advisory
program for social and emotional development, was gender (female, male, other [non-
binary, prefer to self-describe, prefer not to say]). The level of significance was set at
.05.
RQ16. To what extent is there a difference in perceptions toward the importance
of participation in school athletics or activities among students reporting different
ethnicities (Asian/Pacific Islander, Black/African-American, Hispanic/Latino, Multi-
Racial, Native American/American Indian, White, other, prefer not to say)?
H34. There is a statistically significant difference in perceptions toward the
importance of participation in school athletics or activities among students reporting
different ethnicities (Asian/Pacific Islander, Black/African-American, Hispanic/Latino,
Multi-Racial, Native American/American Indian, White, other, prefer not to say).

79
A one-factor ANOVA was conducted to test H34. The categorical variable used
to group the dependent variable, student perceptions toward the importance of their
participation in school athletics or activities, was ethnicity (Asian/Pacific Islander,
Black/African-American, Hispanic/Latino, Multi-Racial, Native American/American
Indian, White, other, prefer not to say). The level of significance was set at .05.
RQ17. To what extent is there a difference in perceptions toward the importance
of participation in volunteer work or community service among students reporting
different ethnicities (Asian/Pacific Islander, Black/African-American, Hispanic/Latino,
Multi-Racial, Native American/American Indian, White, other, prefer not to say)?
H35. There is a statistically significant difference in perceptions toward the
importance of participation in volunteer work or community service among students
reporting different ethnicities (Asian/Pacific Islander, Black/African-American,
Hispanic/Latino, Multi-Racial, Native American/American Indian, White, other, prefer
not to say).
A one-factor ANOVA was conducted to test H35. The categorical variable used
to group the dependent variable, student perceptions toward the importance of their
participation in volunteer work or community service, was ethnicity (Asian/Pacific
Islander, Black/African-American, Hispanic/Latino, Multi-Racial, Native
American/American Indian, White, other, prefer not to say). The level of significance
was set at .05.
RQ18. To what extent is there a difference in perceptions toward the usefulness
of an advisory program for college and/or career plans among students reporting different

80
ethnicities (Asian/Pacific Islander, Black/African-American, Hispanic/Latino, Multi-
Racial, Native American/American Indian, White, other, prefer not to say)?
H36. There is a statistically significant difference in perceptions toward the
usefulness of an advisory program for college and/or career plans among students
reporting different ethnicities (Asian/Pacific Islander, Black/African-American,
Hispanic/Latino, Multi-Racial, Native American/American Indian, White, other, prefer
not to say)
A one-factor ANOVA was conducted to test H36. The categorical variable used
to group the dependent variable, student perceptions toward the usefulness of an advisory
program for college and/or career plans, was ethnicity (Asian/Pacific Islander,
Black/African-American, Hispanic/Latino, Multi-Racial, Native American/American
Indian, White, other, prefer not to say). The level of significance was set at .05.
RQ19. To what extent is there a difference in perceptions toward the usefulness
of an advisory program for social and emotional development among students reporting
different ethnicities (Asian/Pacific Islander, Black/African-American, Hispanic/Latino,
Multi-Racial, Native American/American Indian, White, other, prefer not to say)?
H37. There a statistically significant difference in perceptions toward the
usefulness of an advisory program for social and emotional development among students
reporting different ethnicities (Asian/Pacific Islander, Black/African-American,
Hispanic/Latino, Multi-Racial, Native American/American Indian, White, other, prefer
not to say).
A one-factor ANOVA was conducted to test H37. The categorical variable used
to group the dependent variable, student perceptions toward the usefulness of an advisory

81
program for social and emotional development, was ethnicity (Asian/Pacific Islander,
Black/African-American, Hispanic/Latino, Multi-Racial, Native American/American
Indian, White, other, prefer not to say). The level of significance was set at .05.
RQ20. To what extent is there a difference in perceptions toward the importance
of participation in school athletics or activities among students based on the grades they
report as usual in school (A, B, C, D, F)?
H38. There is a statistically significant difference in perceptions toward the
importance of participation in school athletics or activities among students based on the
grades they report as usual in school (A, B, C, D, F).
A one-factor ANOVA was conducted to test H38. The categorical variable used
to group the dependent variable, student perceptions toward the importance of their
participation in school athletics or activities, was grades reported as usual in school (A,
B, C, D, F). The level of significance was set at .05.
RQ21. To what extent is there a difference in perceptions toward the importance
of participation in volunteer work or community service among students based on the
grades they report as usual in school (A, B, C, D, F)?
H39. There is a statistically significant difference in perceptions toward the
importance of participation in volunteer work or community service among students
based on the grades they report as usual in school (A, B, C, D, F).
A one-factor ANOVA was conducted to test H39. The categorical variable used
to group the dependent variable, student perceptions toward their participation in
community service and volunteer work, was grades reported as usual in school (A, B, C,
D, F). The level of significance was set at .05.
82
RQ22. To what extent is there a difference in perceptions toward the usefulness
of an advisory program for college and/or career plans among students based on the
grades they report as usual in school (A, B, C, D, F)?
H40. There is a statistically significant difference in perceptions toward the
usefulness of an advisory program for college and/or career plans among students based
on the grades they report as usual in school (A, B, C, D, F).
A one-factor ANOVA was conducted to test H40. The categorical variable used
to group the dependent variable, student perceptions toward the usefulness of an advisory
program for college and/or career plans, was grades reported as usual in school (A, B, C,
D, F). The level of significance was set at .05.
RQ23. To what extent is there a difference in perceptions toward the usefulness
of an advisory program for social and emotional development among students based on
the grades they report as usual in school (A, B, C, D, F)?
H41. There a statistically significant difference in perceptions toward the
usefulness of an advisory program for social and emotional development among students
based on the grades they report as usual in school (A, B, C, D, F).
A one-factor ANOVA was conducted to test H41. The categorical variable used
to group the dependent variable, student perceptions toward the usefulness of an advisory
program for social and emotional development, was grades reported as usual in school
(A, B, C, D, F). The level of significance was set at .05.
Limitations
Lunenburg and Irby (2008) defined limitations as “factors that may have an effect
on the interpretation of the findings or on the generalizability of the results” (p. 133).
83
The researcher could not control for the fidelity in which teachers administered the
survey. Because the survey was voluntary, the researcher could not control for all
students completing the survey or answering the survey honestly. The survey was
delivered on one day in one public high school in a suburban school district, so the results
of the study may not be generalizable to other educational environments or reflect student
perceptions over time. The research study was limited to the responses from the
respondents who completed and submitted the survey. Finally, the researcher could not
control for the implementation and interpretation of an advisory program by each
individual teacher within the school.
Summary
This study was conducted to determine the impact of a high school advisory
program in a large, diverse, midwestern, suburban, public high school as measured
primarily by a cross-sectional descriptive survey of student perceptions using a Likert-
type scale. The study also examined whether student perceptions toward an advisory
program and the intended outcomes of an advisory program were affected by student
grade level, gender, race, self-reported grades, or perceptions toward an advisory teacher.
The participants were selected through a purposive, cluster sampling. The researcher
administered the student survey, designed with a quantitative Likert-type scale, to
freshman, sophomore, junior, and senior students at Primus High School in the Pressman
School district. The students surveyed had participated in a high school advisory
program for one to three years. Chapter 3 included the research design, the selection of
the participants and sampling procedures, the validity and reliability of the student
survey, the survey items, the data collection procedures, a description of the hypothesis

84
testing, and the limitations of the study. Chapter 4 contains the results of the analysis of
the data collected in order to address the research questions of this study.

85
Chapter 4
Results
The purpose of this quantitative study was to determine the impact of a high
school advisory program in a public high school as measured primarily by a cross-
sectional descriptive survey of student perceptions using a Likert-type scale.
Specifically, this research study focused on student perceptions toward excitement about
going to an advisory class, eagerness in participating in an advisory class, interest in the
lessons from an advisory class, and the usefulness of ideas from an advisory class, and
the analyses disaggregated the sample by student demographics (grade level, gender, and
ethnicity) and by self-reported grades. In addition, this research study correlated student
perceptions toward an advisory program and an advisory teacher, toward an advisory
teacher and belonging at school, and toward an advisory program and belonging at
school. Lastly, this research study focused on student perceptions toward the importance
of their participation in school athletics or activities, the importance of their participation
in volunteer work or community service, the usefulness of an advisory program for
college and/or career plans, and the usefulness of an advisory program for social and
emotional development, and the analyses disaggregated the sample by student
demographics (grade level, gender, and ethnicity) and by self-reported grades.
Chapter 4 contains the descriptive statistics for the study and the results of the
data analysis and hypothesis testing related to student perceptions toward an advisory
program. The results of the ANOVAs addressed RQ1-RQ4 and RQ8-RQ23, and the
calculations of the Pearson product moment correlation coefficients that addressed RQ5-
RQ7 are presented in this chapter.

86
Descriptive Statistics
The researcher used a purposive sample for this research study. A voluntary
survey was electronically distributed to all students in grades 9-12 at Primus High School
during one advisory period on May 1, 2019. Of the 1,534 students enrolled at Primus
High School, 686 completed the survey. The demographics of the sample and the
response rates that identify the grade level of the respondent, the gender of the
respondent, the ethnicity of the respondent, and the self-reported grades of the respondent
are presented in Table 7.
Because of sample size constraints, categories within the independent variables
gender, ethnicity, and self-reported grades were collapsed. Within gender, the categories
of non-binary, prefer to self-describe, and prefer not to say were collapsed into the
category other, which aligned with the survey question and research question design.
Within ethnicity, the categories Asian/Pacific Islander, Multi-Racial, Native
American/American Indian, other, and prefer not to say were collapsed into the category
other, which was done after the construction of the survey questions and research
questions due to sample size constraints. Within self-reported grades, the categories of D
and F were collapsed into the category D/F, which was done after the construction of the
survey questions and research questions due to sample size constraints. The frequencies
for gender, ethnicity, and self-reported grades in Table 7 were calculated after each of the
variables was recategorized.
The student respondent rates revealed that more freshmen (299) and sophomores
(212) completed the survey than juniors (92) and seniors (83). The student respondent
rates also revealed that more females (379) completed the survey than males (287).

87
Finally, the student respondent rates revealed that White students (456) completed the
survey more than any other ethnicity, representing 66.5% of total completed surveys.
Table 7
Student Survey Participant Characteristics
Note. B/AA = Black/African-American; H/L = Hispanic/Latino; W = White; O = Other.
Data from six survey questions was not used for hypothesis testing. It was
determined that questions 11, 12, and 14 on the student survey focused on specific
teaching behaviors which did not relate to the purpose of the study. In addition,
Characteristic n %
Independent Variables Categories 686 100.0
Grade Level Freshman 299 43.6
Sophomore 212 30.9
Junior 92 13.4
Senior 83 12.1
Gender Female 379 55.2
Male 287 41.8
Other 20 2.9
Ethnicity B/AA 37 5.4
H/L 102 14.9
W 456 66.5
O 91 13.3
Self-Reported Grades A 316 46.1
B 248 36.2
C 94 13.7
D/F 24 3.5

88
questions 18, 19, 20 were not used because it was determined that the questions were
unnecessary for the confirmation of the survey’s reliability and validity.
The descriptive statistics calculated for this study provided specific information
about the sample. The following section contains the results of the hypothesis testing that
was conducted to address the research questions.
Hypothesis Testing
The analysis focused on 23 research questions and 41 hypotheses. Each research
question is presented below with the corresponding hypotheses, the analysis method used
to test each hypothesis, and the results of the statistical analysis.
RQ1. To what extent is there a difference in perceptions toward an advisory
program among students enrolled at different grade levels (freshman, sophomore, junior,
senior)?
H1. There is a statistically significant difference in excitement about going to
advisory class among students enrolled at different grade levels (freshman, sophomore,
junior, senior).
A one-factor ANOVA was conducted to test H1. The categorical variable used to
group the dependent variable, student perceptions toward their excitement about going to
advisory class, was grade level (freshman, sophomore, junior, senior). The level of
significance was set at .05. The results of the analysis, using items 1 and 7 from the
student survey, indicated a marginally significant difference between at least two of the
means, F = 2.584, df = 3, 680, p = .052, η2 = .011. See Table 8 for the means and
standard deviations for this analysis. A follow up post hoc was conducted to determine
which pairs of means were different. The Tukey’s HSD post hoc was conducted at
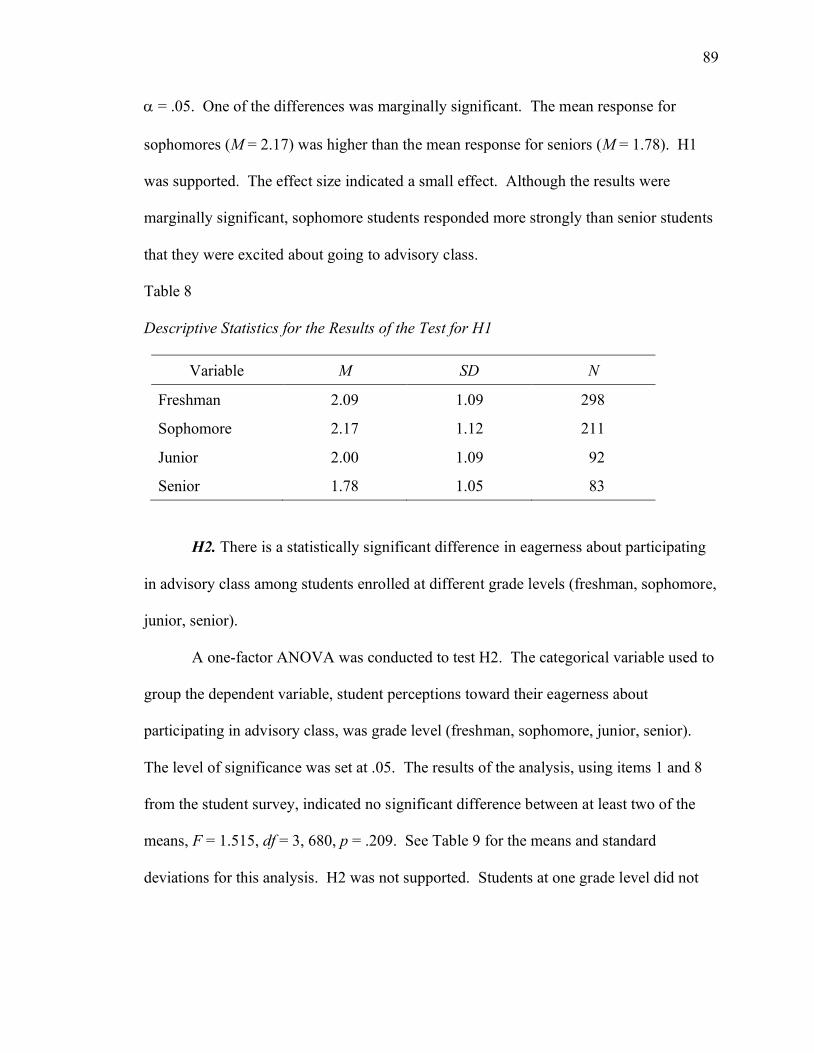
89
D = .05. One of the differences was marginally significant. The mean response for
sophomores (M = 2.17) was higher than the mean response for seniors (M = 1.78). H1
was supported. The effect size indicated a small effect. Although the results were
marginally significant, sophomore students responded more strongly than senior students
that they were excited about going to advisory class.
Table 8
Descriptive Statistics for the Results of the Test for H1
Variable M SD N
Freshman 2.09 1.09 298
Sophomore 2.17 1.12 211
Junior 2.00 1.09 92
Senior 1.78 1.05 83
H2. There is a statistically significant difference in eagerness about participating
in advisory class among students enrolled at different grade levels (freshman, sophomore,
junior, senior).
A one-factor ANOVA was conducted to test H2. The categorical variable used to
group the dependent variable, student perceptions toward their eagerness about
participating in advisory class, was grade level (freshman, sophomore, junior, senior).
The level of significance was set at .05. The results of the analysis, using items 1 and 8
from the student survey, indicated no significant difference between at least two of the
means, F = 1.515, df = 3, 680, p = .209. See Table 9 for the means and standard
deviations for this analysis. H2 was not supported. Students at one grade level did not

90
respond more strongly than students at any other grade level that they were eager to
participate in advisory class.
Table 9
Descriptive Statistics for the Results of the Test for H2
Variable M SD N
Freshman 1.86 1.01 297
Sophomore 1.94 1.02 212
Junior 1.91 1.06 92
Senior 1.66 1.06 83
H3. There is a statistically significant difference in perceptions toward interest in
the lessons from advisory class among students enrolled at different grade levels
(freshman, sophomore, junior, senior).
A one-factor ANOVA was conducted to test H3. The categorical variable used to
group the dependent variable, student perceptions toward their interest in the lessons
from advisory class, was grade level (freshman, sophomore, junior, senior). The level of
significance was set at .05. The results of the analysis, using items 1 and 9 from the
student survey, indicated no significant difference between at least two of the
means, F = 0.083, df = 3, 681, p = .969. See Table 10 for the means and standard
deviations for this analysis. H3 was not supported. Students at one grade level did not
respond more strongly than students at any other grade level that they were interested in
the lessons from advisory class.
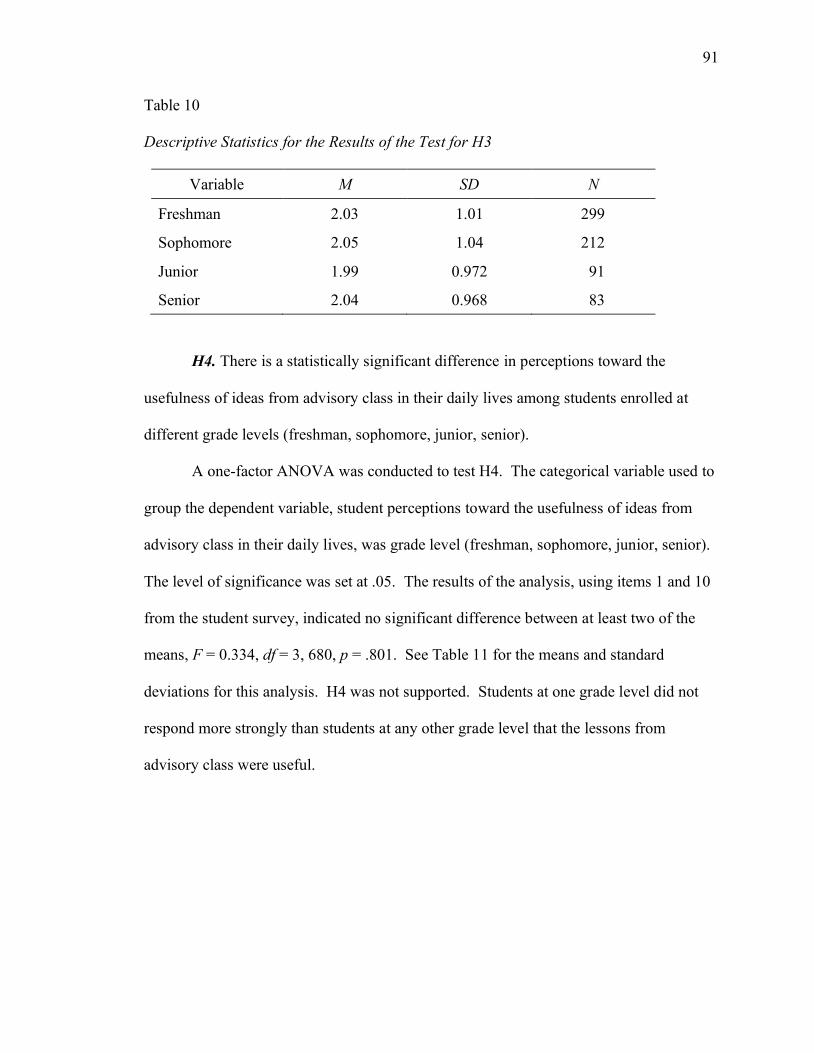
91
Table 10
Descriptive Statistics for the Results of the Test for H3
Variable M SD N
Freshman 2.03 1.01 299
Sophomore 2.05 1.04 212
Junior 1.99 0.972 91
Senior 2.04 0.968 83
H4. There is a statistically significant difference in perceptions toward the
usefulness of ideas from advisory class in their daily lives among students enrolled at
different grade levels (freshman, sophomore, junior, senior).
A one-factor ANOVA was conducted to test H4. The categorical variable used to
group the dependent variable, student perceptions toward the usefulness of ideas from
advisory class in their daily lives, was grade level (freshman, sophomore, junior, senior).
The level of significance was set at .05. The results of the analysis, using items 1 and 10
from the student survey, indicated no significant difference between at least two of the
means, F = 0.334, df = 3, 680, p = .801. See Table 11 for the means and standard
deviations for this analysis. H4 was not supported. Students at one grade level did not
respond more strongly than students at any other grade level that the lessons from
advisory class were useful.

92
Table 11
Descriptive Statistics for the Results of the Test for H4
Variable M SD N
Freshman 1.67 0.89 298
Sophomore 1.72 0.93 211
Junior 1.66 0.80 92
Senior 1.60 0.91 83
RQ2. To what extent is there a difference in perceptions toward an advisory
program among students reporting different genders (female, male, other [non-binary,
prefer to self-describe, prefer not to say])?
H5. There is a statistically significant difference in perceptions toward excitement
about going to advisory class among students reporting different genders (female, male
other [non-binary, prefer to self-describe, prefer not to say]).
A one-factor ANOVA was conducted to test H5. The categorical variable used to
group the dependent variable, student perceptions toward their excitement about going to
advisory class, was gender (female, male, other [non-binary, prefer to self-describe,
prefer not to say]). The level of significance was set at .05. The results of the analysis,
using items 2 and 7 from the student survey, indicated no significant difference between
at least two of the means, F = 0.745, df = 2, 681, p = .475. See Table 12 for the means
and standard deviations for this analysis. H5 was not supported. Students of one gender
did not respond more strongly than students of any other gender that they were excited
about going to advisory class.
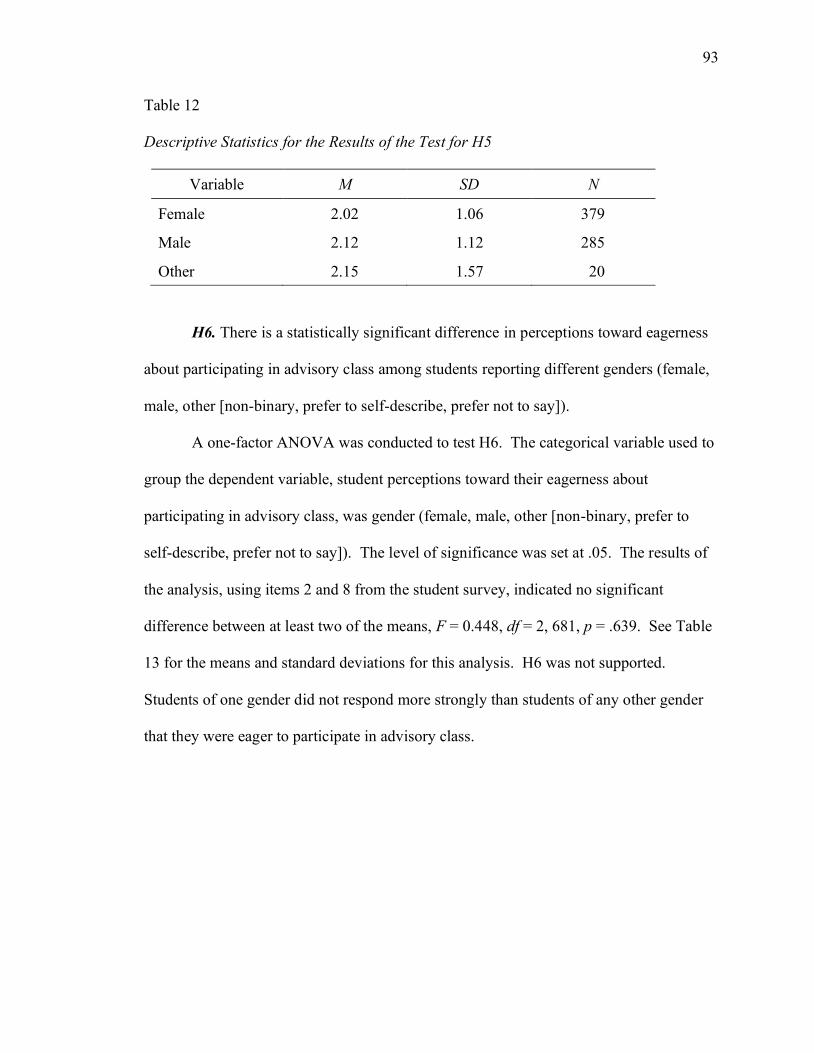
93
Table 12
Descriptive Statistics for the Results of the Test for H5
Variable M SD N
Female 2.02 1.06 379
Male 2.12 1.12 285
Other 2.15 1.57 20
H6. There is a statistically significant difference in perceptions toward eagerness
about participating in advisory class among students reporting different genders (female,
male, other [non-binary, prefer to self-describe, prefer not to say]).
A one-factor ANOVA was conducted to test H6. The categorical variable used to
group the dependent variable, student perceptions toward their eagerness about
participating in advisory class, was gender (female, male, other [non-binary, prefer to
self-describe, prefer not to say]). The level of significance was set at .05. The results of
the analysis, using items 2 and 8 from the student survey, indicated no significant
difference between at least two of the means, F = 0.448, df = 2, 681, p = .639. See Table
13 for the means and standard deviations for this analysis. H6 was not supported.
Students of one gender did not respond more strongly than students of any other gender
that they were eager to participate in advisory class.

94
Table 13
Descriptive Statistics for the Results of the Test for H6
Variable M SD N
Female 1.84 0.99 378
Male 1.91 1.04 286
Other 1.75 1.45 20
H7. There is a statistically significant difference in perceptions toward interest in
the lessons from advisory class among students reporting different genders (female, male
other [non-binary, prefer to self-describe, prefer not to say]).
A one-factor ANOVA was conducted to test H7. The categorical variable used to
group the dependent variable, student perceptions toward their interest in the lessons
from advisory class, was gender (female, male, other [non-binary, prefer to self-describe,
prefer not to say]). The level of significance was set at .05. The results of the analysis,
using items 2 and 9 from the student survey, indicated no significant difference between
at least two of the means, F = 0.110, df = 2, 682, p = .896. See Table 14 for the means
and standard deviations for this analysis. H7 was not supported. Students of one gender
did not respond more strongly than students of any other gender that they were interested
in the lessons from advisory class.

95
Table 14
Descriptive Statistics for the Results of the Test for H7
Variable M SD N
Female 2.04 0.96 379
Male 2.01 1.02 286
Other 2.10 1.59 20
H8. There is a statistically significant difference in perceptions toward the
usefulness of ideas from advisory class in their daily lives among students reporting
different genders (female, male, other [non-binary, prefer to self-describe, prefer not to
say]).
A one-factor ANOVA was conducted to test H8. The categorical variable used to
group the dependent variable, student perceptions toward the usefulness of ideas from
advisory class in their daily lives, was gender (female, male, other [non-binary, prefer to
self-describe, prefer not to say]). The level of significance was set at .05. The results of
the analysis, using items 2 and 10 from the student survey, indicated no significant
difference between at least two of the means, F = 0.253, df = 2, 681, p = .776. See
Table 15 for the means and standard deviations for this analysis. H8 was not supported.
Students of one gender did not respond more strongly than students of any other gender
that the lessons from advisory class were useful.

96
Table 15
Descriptive Statistics for the Results of the Test for H8
Variable M SD N
Female 1.66 0.84 379
Male 1.70 0.94 285
Other 1.60 1.23 20
RQ3. To what extent is there a difference in perceptions toward an advisory
program among students reporting different ethnicities (Asian/Pacific Islander,
Black/African-American, Hispanic/Latino, Multi-Racial, Native American/American
Indian, White, other, prefer not to say)?
H9. There is a statistically significant difference in perceptions toward excitement
about going to advisory class among students reporting different ethnicities
(Black/African-American, Hispanic/Latino, White, Other [Asian/Pacific Islander, Multi-
Racial, Native American/American Indian, other, prefer not to say]).
A one-factor ANOVA was conducted to test H9. The categorical variable used to
group the dependent variable, student perceptions toward their excitement about going to
advisory class, was ethnicity (Black/African-American, Hispanic/Latino, White, Other
[Asian/Pacific Islander, Multi-Racial, Native American/American Indian, other, prefer
not to say]). The level of significance was set at .05. The results of the analysis, using
items 3 and 7 from the student survey, indicated no significant difference between at least
two of the means, F = 1.828, df = 3, 680, p = .141. See Table 16 for the means and
standard deviations for this analysis. H9 was not supported. Students of one ethnicity

97
did not respond more strongly than students of any other ethnicity that they were excited
about going to advisory class.
Table 16
Descriptive Statistics for the Results of the Test for H9
Variable M SD N
Black or African-American 2.27 1.145 37
Hispanic or Latino 2.24 1.04 102
White 2.00 1.08 454
Other 2.11 1.25 91
H10. There is a statistically significant difference in perceptions toward eagerness
about participating in advisory class among students reporting different ethnicities
(Black/African-American, Hispanic/Latino, White, Other [Asian/Pacific Islander, Multi-
Racial, Native American/American Indian, other, prefer not to say])?
A one-factor ANOVA was conducted to test H10. The categorical variable used
to group the dependent variable, student perceptions toward their eagerness about
participating in advisory class, was ethnicity (Black/African-American, Hispanic/Latino,
White, Other [Asian/Pacific Islander, Multi-Racial, Native American/American Indian,
other, prefer not to say]). The level of significance was set at .05. The results of the
analysis, using items 3 and 8 from the student survey, indicated no significant difference
between at least two of the means, F = 0.808, df = 3, 680, p = .490. See Table 17 for the
means and standard deviations for this analysis. H10 was not supported. Students of one
ethnicity did not respond more strongly than students of any other ethnicity that they
were eager to participate in advisory class.

98
Table 17
Descriptive Statistics for the Results of the Test for H10
Variable M SD N
Black or African-American 2.11 0.97 37
Hispanic or Latino 1.84 0.94 101
White 1.84 1.01 455
Other 1.90 1.21 91
H11. There is a statistically significant difference in perceptions toward interest in
the lessons from advisory class among students reporting different ethnicities
(Black/African-American, Hispanic/Latino, White, Other [Asian/Pacific Islander, Multi-
Racial, Native American/American Indian, other, prefer not to say])?
A one-factor ANOVA was conducted to test H11. The categorical variable used
to group the dependent variable, student perceptions toward their interest in the lessons
from advisory class, was ethnicity (Black/African-American, Hispanic/Latino, White,
Other [Asian/Pacific Islander, Multi-Racial, Native American/American Indian, other,
prefer not to say]). The level of significance was set at .05. The results of the analysis,
using items 3 and 9 from the student survey, indicated a significant difference between at
least two of the means, F = 2.840, df = 3, 681, p = .037, η2 = .012. A follow up post hoc
was conducted to determine which pairs of means were different. The Tukey’s HSD post
hoc was conducted at D = .05. One of the differences was statistically significant. The
mean responses for students who reported their ethnicity as Hispanic or Latino (M =
2.25) was higher than the mean responses for students who reported their ethnicity as
White (M = 1.96). See Table 18 for the means and standard deviations for this analysis.

99
H11 was supported. The effect size indicated a small effect. Hispanic or Latino students
responded more strongly than White students that they were interested in the lessons
from advisory class.
Table 18
Descriptive Statistics for the Results of the Test for H11
Variable M SD N
Black or African-American 2.13 1.08 37
Hispanic or Latino 2.25 0.98 101
White 1.96 0.97 456
Other 2.13 1.17 91
H12. There is a statistically significant difference in perceptions toward the
usefulness of ideas from advisory class in their daily lives among students reporting
different ethnicities (Black/African-American, Hispanic/Latino, White, Other
[Asian/Pacific Islander, Multi-Racial, Native American/American Indian, other, prefer
not to say])?
A one-factor ANOVA was conducted to test H12. The categorical variable used
to group the dependent variable, student perceptions toward the usefulness of ideas from
advisory class in their daily lives, was ethnicity (Black/African-American,
Hispanic/Latino, White, Other [Asian/Pacific Islander, Multi-Racial, Native
American/American Indian, other, prefer not to say]). The level of significance was set
at .05. The results of the analysis, using items 3 and 10 from the student survey,
indicated no significant difference between at least two of the means, F = 0.531,

100
df = 3, 680, p = .661. See Table 19 for the means and standard deviations for this
analysis. H12 was not supported. Students of one ethnicity did not respond more
strongly than students of any other ethnicity that the lessons from advisory were useful.
Table 19
Descriptive Statistics for the Results of the Test for H12
Variable M SD N
Black or African-American 1.78 1.23 37
Hispanic or Latino 1.72 0.88 101
White 1.64 0.83 455
Other 1.72 1.07 91
RQ4. To what extent is there a difference in perceptions toward an advisory
program among students based on the grades they report as usual in school (A, B, C,
D/F)?
H13. There is a statistically significant difference in perceptions toward
excitement about going to advisory class among students based on the grades they report
as usual in school (A, B, C, D/F).
A one-factor ANOVA was conducted to test H13. The categorical variable used
to group the dependent variable, student perceptions toward their excitement about going
to advisory class, was grades reported as usual in school (A, B, C, D/F). The level of
significance was set at .05. The results of the analysis, using items 4 and 7 from the
student survey, indicated a significant difference between at least two of the means,
F = 4.397, df = 3, 679, p = .004, η2 = .019. A follow up post hoc was conducted to
determine which pairs of means were different. The Tukey’s HSD post hoc was
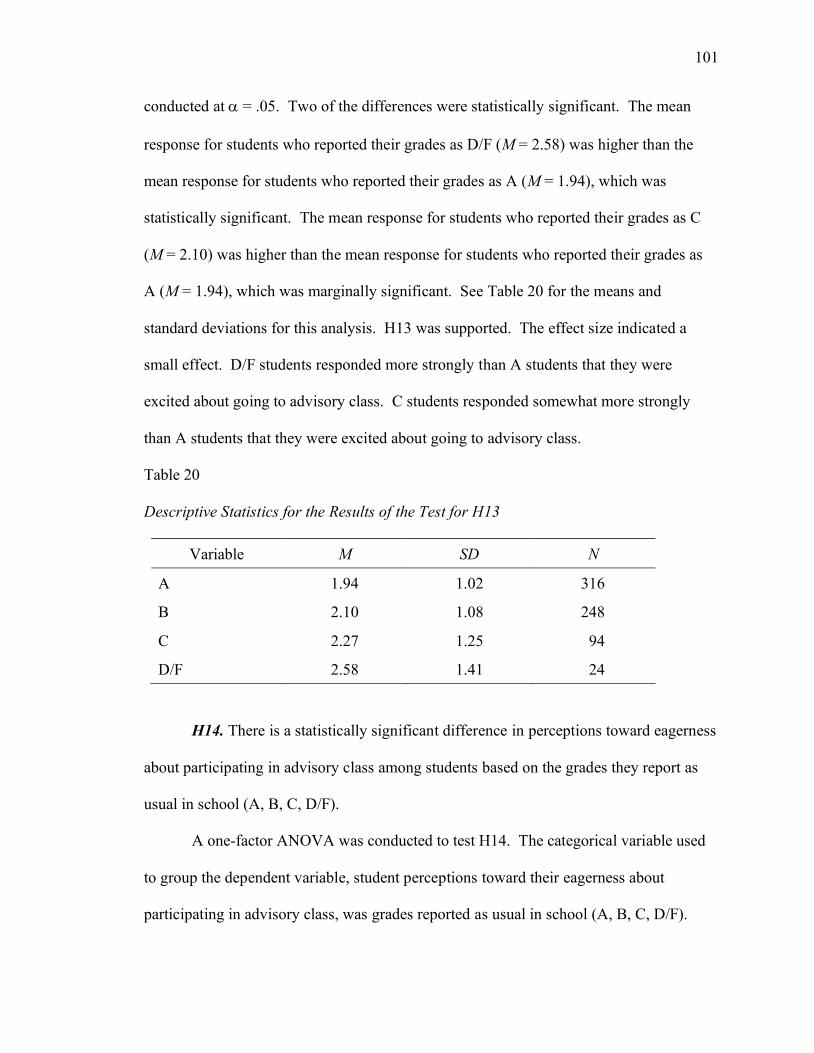
101
conducted at D = .05. Two of the differences were statistically significant. The mean
response for students who reported their grades as D/F (M = 2.58) was higher than the
mean response for students who reported their grades as A (M = 1.94), which was
statistically significant. The mean response for students who reported their grades as C
(M = 2.10) was higher than the mean response for students who reported their grades as
A (M = 1.94), which was marginally significant. See Table 20 for the means and
standard deviations for this analysis. H13 was supported. The effect size indicated a
small effect. D/F students responded more strongly than A students that they were
excited about going to advisory class. C students responded somewhat more strongly
than A students that they were excited about going to advisory class.
Table 20
Descriptive Statistics for the Results of the Test for H13
Variable M SD N
A 1.94 1.02 316
B 2.10 1.08 248
C 2.27 1.25 94
D/F 2.58 1.41 24
H14. There is a statistically significant difference in perceptions toward eagerness
about participating in advisory class among students based on the grades they report as
usual in school (A, B, C, D/F).
A one-factor ANOVA was conducted to test H14. The categorical variable used
to group the dependent variable, student perceptions toward their eagerness about
participating in advisory class, was grades reported as usual in school (A, B, C, D/F).
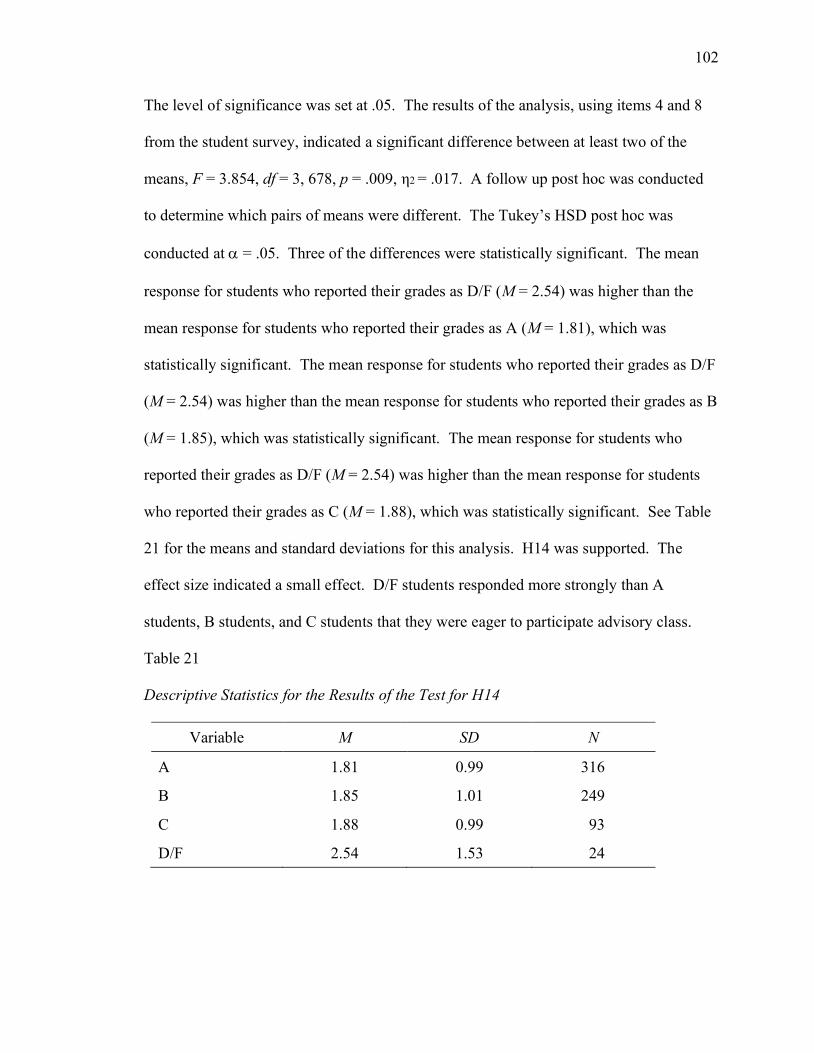
102
The level of significance was set at .05. The results of the analysis, using items 4 and 8
from the student survey, indicated a significant difference between at least two of the
means, F = 3.854, df = 3, 678, p = .009, η2 = .017. A follow up post hoc was conducted
to determine which pairs of means were different. The Tukey’s HSD post hoc was
conducted at D = .05. Three of the differences were statistically significant. The mean
response for students who reported their grades as D/F (M = 2.54) was higher than the
mean response for students who reported their grades as A (M = 1.81), which was
statistically significant. The mean response for students who reported their grades as D/F
(M = 2.54) was higher than the mean response for students who reported their grades as B
(M = 1.85), which was statistically significant. The mean response for students who
reported their grades as D/F (M = 2.54) was higher than the mean response for students
who reported their grades as C (M = 1.88), which was statistically significant. See Table
21 for the means and standard deviations for this analysis. H14 was supported. The
effect size indicated a small effect. D/F students responded more strongly than A
students, B students, and C students that they were eager to participate advisory class.
Table 21
Descriptive Statistics for the Results of the Test for H14
Variable M SD N
A 1.81 0.99 316
B 1.85 1.01 249
C 1.88 0.99 93
D/F 2.54 1.53 24

103
H15. There is a statistically significant difference in perceptions toward their
interest in the lessons from advisory class among students based on the grades they report
as usual in school (A, B, C, D/F).
A one-factor ANOVA was conducted to test H15. The categorical variable used
to group the dependent variable, student perceptions toward their interest in the lessons
from advisory class, was grades reported as usual in school (A, B, C, D/F). The level of
significance was set at .05. The results of the analysis, using items 4 and 9 from the
student survey, indicated a significant difference between at least two of the means,
F = 3.083, df = 3, 679, p = .027, η2 = .013. A follow up post hoc was conducted to
determine which pairs of means were different. The Tukey’s HSD post hoc was
conducted at D = .05. Two of the differences were statistically significant. The mean
response of students who reported their grades as D/F (M = 2.54) was higher than the
mean response of students who reported their grades as A (M = 1.97), which was
statistically significant. The mean response of students who reported their grades as D/F
(M = 2.54) was higher than the mean response of students who reported their grades as B
(M = 2.01), which was marginally significant. See Table 22 for the means and standard
deviations for this analysis. H15 was supported. The effect size indicated a small effect.
D/F students responded more strongly than A students and B students that they were
interested in the lessons from advisory class.

104
Table 22
Descriptive Statistics for the Results of the Test for H15
Variable M SD N
A 1.97 0.91 316
B 2.02 1.04 249
C 2.12 1.08 94
D/F 2.58 1.44 24
H16. There is a statistically significant difference in perceptions toward the
usefulness of ideas from advisory class in their daily lives among students based on the
grades they report as usual in school (A, B, C, D/F).
A one-factor ANOVA was conducted to test H16. The categorical variable used
to group the dependent variable, student perceptions toward the usefulness of ideas from
advisory class in their daily lives among, was grades reported as usual in school (A, B, C,
D/F). The level of significance was set at .05. The results of the analysis, using items 4
and 10 from the student survey, indicated no significant difference between at least two
of the means, F = 1.058, df = 3, 678, p = .366. See Table 23 for the means and standard
deviations for this analysis. H16 was not supported. No one category of students who
self-reported grades responded more strongly than another category of students who self-
reported grades that the lessons from advisory were useful.

105
Table 23
Descriptive Statistics for the Results of the Test for H16
Variable M SD N
A 1.64 0.82 316
B 1.79 0.87 248
C 1.67 0.98 94
D/F 1.96 1.49 24
RQ5. To what extent is there a relationship between student perceptions toward
an advisory program and student perceptions toward their belonging at school?
H17. There is a statistically significant relationship between student perception
toward their excitement about going to advisory class and student perceptions toward
their belonging at school.
A Pearson product moment correlation coefficient was calculated to index the
strength and direction of the relationship between the two numerical variables: student
perceptions toward their excitement about going to advisory class and student perceptions
toward their belonging at school. The statistical significance of the correlation
coefficient, using items 7 and 15 from the student survey, was examined to test H17. The
level of significance was set at .05. The correlation coefficient (r = .085) provided
evidence for a weak positive relationship between the variables. The hypothesis test for
the correlation indicated a statistically significant relationship between student
perceptions toward their excitement about going to advisory class and student perceptions
toward their belonging at school, df = 676, p = .026, r2 = .007. H17 was supported. The
effect size indicated that .7% of the variability in student perceptions toward their

106
excitement about going to advisory class was explained by student perceptions toward
their belonging at school. Although the effect size was small, students who responded
with more excitement about going to advisory class responded with more belonging at
school.
H18. There is a statistically significant relationship between student perceptions
toward their eagerness about participating in advisory class and student perceptions
toward their belonging at school.
A Pearson product moment correlation coefficient was calculated to index the
strength and direction of the relationship between the two numerical variables: student
perceptions toward their eagerness about participating in advisory class and student
perceptions toward their belonging at school. The statistical significance of the
correlation coefficient, using items 8 and 15 from the student survey, was examined to
test H18. The level of significance was set at .05. The correlation coefficient (r = .116)
provided evidence for a moderately weak positive relationship between the variables.
The hypothesis test for the correlation indicated a statistically significant relationship
between student perceptions toward their eagerness about participating in advisory class
and student perceptions toward their belonging at school, df = 676, p = .002, r2 = .013.
H18 was supported. The effect size indicated that 1.3% of the variability in student
perceptions toward their eagerness about participating in advisory class was explained by
student perceptions toward their belonging at school. Although the effect size was small,
students who responded with more eagerness to participate in advisory class responded
with more belonging at school.
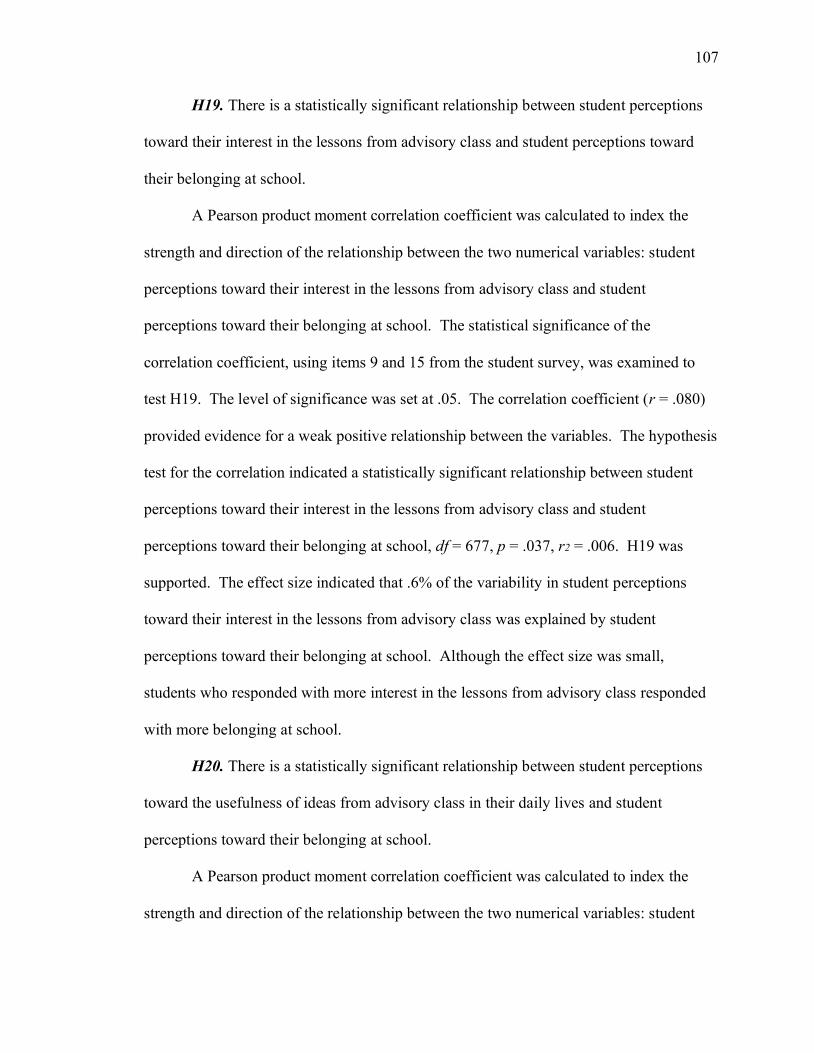
107
H19. There is a statistically significant relationship between student perceptions
toward their interest in the lessons from advisory class and student perceptions toward
their belonging at school.
A Pearson product moment correlation coefficient was calculated to index the
strength and direction of the relationship between the two numerical variables: student
perceptions toward their interest in the lessons from advisory class and student
perceptions toward their belonging at school. The statistical significance of the
correlation coefficient, using items 9 and 15 from the student survey, was examined to
test H19. The level of significance was set at .05. The correlation coefficient (r = .080)
provided evidence for a weak positive relationship between the variables. The hypothesis
test for the correlation indicated a statistically significant relationship between student
perceptions toward their interest in the lessons from advisory class and student
perceptions toward their belonging at school, df = 677, p = .037, r2 = .006. H19 was
supported. The effect size indicated that .6% of the variability in student perceptions
toward their interest in the lessons from advisory class was explained by student
perceptions toward their belonging at school. Although the effect size was small,
students who responded with more interest in the lessons from advisory class responded
with more belonging at school.
H20. There is a statistically significant relationship between student perceptions
toward the usefulness of ideas from advisory class in their daily lives and student
perceptions toward their belonging at school.
A Pearson product moment correlation coefficient was calculated to index the
strength and direction of the relationship between the two numerical variables: student
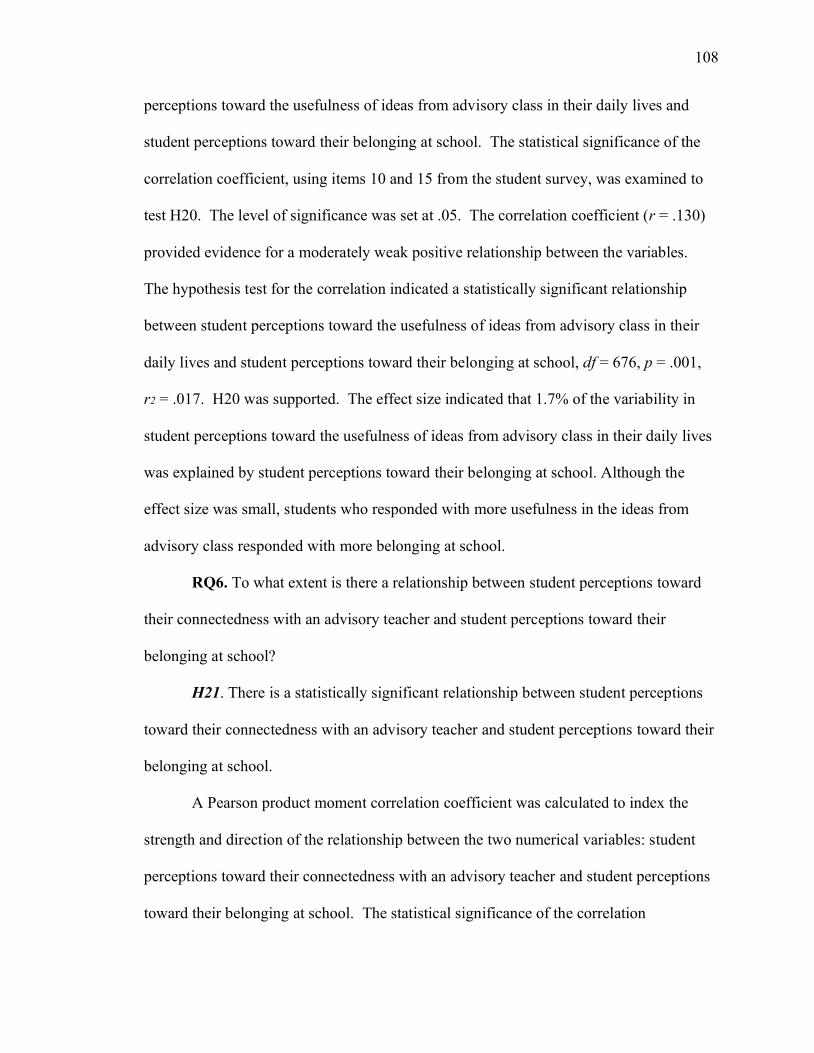
108
perceptions toward the usefulness of ideas from advisory class in their daily lives and
student perceptions toward their belonging at school. The statistical significance of the
correlation coefficient, using items 10 and 15 from the student survey, was examined to
test H20. The level of significance was set at .05. The correlation coefficient (r = .130)
provided evidence for a moderately weak positive relationship between the variables.
The hypothesis test for the correlation indicated a statistically significant relationship
between student perceptions toward the usefulness of ideas from advisory class in their
daily lives and student perceptions toward their belonging at school, df = 676, p = .001,
r2 = .017. H20 was supported. The effect size indicated that 1.7% of the variability in
student perceptions toward the usefulness of ideas from advisory class in their daily lives
was explained by student perceptions toward their belonging at school. Although the
effect size was small, students who responded with more usefulness in the ideas from
advisory class responded with more belonging at school.
RQ6. To what extent is there a relationship between student perceptions toward
their connectedness with an advisory teacher and student perceptions toward their
belonging at school?
H21. There is a statistically significant relationship between student perceptions
toward their connectedness with an advisory teacher and student perceptions toward their
belonging at school.
A Pearson product moment correlation coefficient was calculated to index the
strength and direction of the relationship between the two numerical variables: student
perceptions toward their connectedness with an advisory teacher and student perceptions
toward their belonging at school. The statistical significance of the correlation

109
coefficient, using items 13 and 15 from the student survey, was examined to test H21.
The level of significance was set at .05. The correlation coefficient (r = .097) provided
evidence for a weak positive relationship between the variables. The hypothesis test for
the correlation indicated a statistically significant relationship between student
perceptions toward their connectedness with an advisory teacher and student perceptions
toward their belonging at school, df = 677, p = .012, r2 = .009. H21 was supported. The
effect size indicated that .9% of the variability in student perceptions toward their
connectedness with an advisory teacher was explained by student perceptions toward
their belonging at school. Although the effect size was small, students who responded
with more connection with an advisory teacher responded with more belonging at school.
RQ7. To what extent is there a relationship between student perceptions toward
an advisory program and student perceptions toward their connectedness with an
advisory teacher?
H22. There a statistically significant relationship between student perceptions
toward their excitement about going to advisory class and student perceptions toward
their connectedness with an advisory teacher.
A Pearson product moment correlation coefficient was calculated to index the
strength and direction of the relationship between the two numerical variables: student
perceptions toward their excitement about going to advisory class and student perceptions
toward their connectedness with an advisory teacher. The statistical significance of the
correlation coefficient, using items 7 and 13 from the student survey, was examined to
test H22. The level of significance was set at .05. The correlation coefficient (r = .394)
provided evidence for a moderately strong positive relationship between the variables.
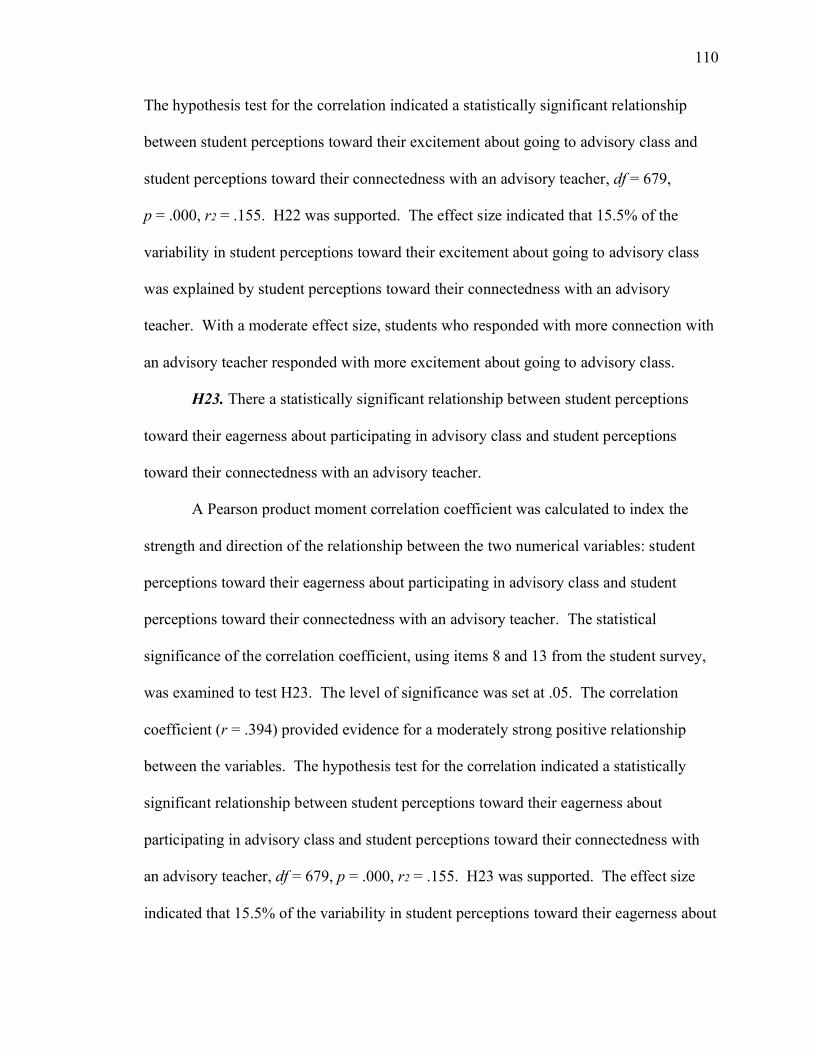
110
The hypothesis test for the correlation indicated a statistically significant relationship
between student perceptions toward their excitement about going to advisory class and
student perceptions toward their connectedness with an advisory teacher, df = 679,
p = .000, r2 = .155. H22 was supported. The effect size indicated that 15.5% of the
variability in student perceptions toward their excitement about going to advisory class
was explained by student perceptions toward their connectedness with an advisory
teacher. With a moderate effect size, students who responded with more connection with
an advisory teacher responded with more excitement about going to advisory class.
H23. There a statistically significant relationship between student perceptions
toward their eagerness about participating in advisory class and student perceptions
toward their connectedness with an advisory teacher.
A Pearson product moment correlation coefficient was calculated to index the
strength and direction of the relationship between the two numerical variables: student
perceptions toward their eagerness about participating in advisory class and student
perceptions toward their connectedness with an advisory teacher. The statistical
significance of the correlation coefficient, using items 8 and 13 from the student survey,
was examined to test H23. The level of significance was set at .05. The correlation
coefficient (r = .394) provided evidence for a moderately strong positive relationship
between the variables. The hypothesis test for the correlation indicated a statistically
significant relationship between student perceptions toward their eagerness about
participating in advisory class and student perceptions toward their connectedness with
an advisory teacher, df = 679, p = .000, r2 = .155. H23 was supported. The effect size
indicated that 15.5% of the variability in student perceptions toward their eagerness about
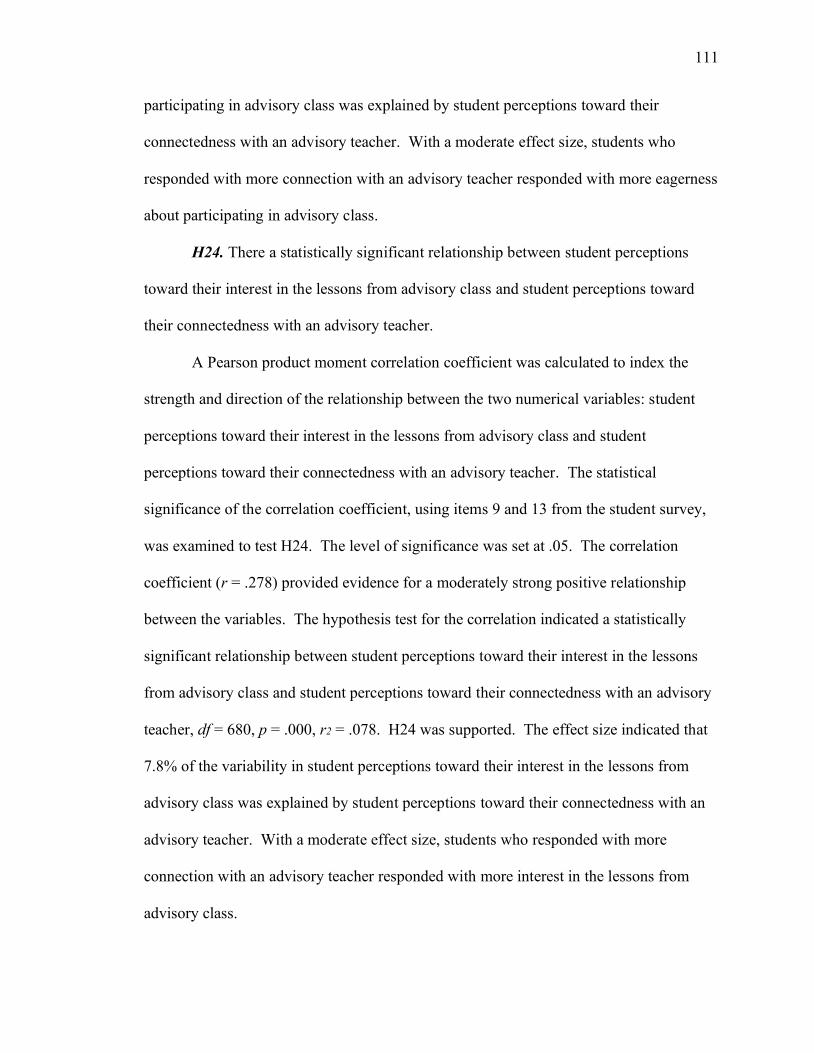
111
participating in advisory class was explained by student perceptions toward their
connectedness with an advisory teacher. With a moderate effect size, students who
responded with more connection with an advisory teacher responded with more eagerness
about participating in advisory class.
H24. There a statistically significant relationship between student perceptions
toward their interest in the lessons from advisory class and student perceptions toward
their connectedness with an advisory teacher.
A Pearson product moment correlation coefficient was calculated to index the
strength and direction of the relationship between the two numerical variables: student
perceptions toward their interest in the lessons from advisory class and student
perceptions toward their connectedness with an advisory teacher. The statistical
significance of the correlation coefficient, using items 9 and 13 from the student survey,
was examined to test H24. The level of significance was set at .05. The correlation
coefficient (r = .278) provided evidence for a moderately strong positive relationship
between the variables. The hypothesis test for the correlation indicated a statistically
significant relationship between student perceptions toward their interest in the lessons
from advisory class and student perceptions toward their connectedness with an advisory
teacher, df = 680, p = .000, r2 = .078. H24 was supported. The effect size indicated that
7.8% of the variability in student perceptions toward their interest in the lessons from
advisory class was explained by student perceptions toward their connectedness with an
advisory teacher. With a moderate effect size, students who responded with more
connection with an advisory teacher responded with more interest in the lessons from
advisory class.

112
H25. There a statistically significant relationship between student perceptions
toward the usefulness of ideas from advisory class in their daily lives and student
perceptions toward their connectedness with an advisory teacher.
A Pearson product moment correlation coefficient was calculated to index the
strength and direction of the relationship between the two numerical variables: student
perceptions toward the usefulness of ideas from advisory class in their daily lives and
student perceptions toward their connectedness with an advisory teacher. The statistical
significance of the correlation coefficient, using items 10 and 13 from the student survey,
was examined to test H25. The level of significance was set at .05. The correlation
coefficient (r = .343) provided evidence for a moderately strong positive relationship
between the variables. The hypothesis test for the correlation indicated a statistically
significant relationship between student perceptions toward the usefulness of ideas from
advisory class in their daily lives and student perceptions toward their connectedness with
an advisory teacher, df = 679, p = .000, r2 = .118. H25 was supported. The effect size
indicated that 11.8% of the variability in student perceptions toward the usefulness of
ideas from advisory class in their daily lives was explained by student perceptions toward
their connectedness with an advisory teacher. With a moderate effect size, students who
responded with more connection with an advisory teacher responded with more
usefulness in the ideas from advisory class.
RQ8. To what extent is there a difference in perceptions toward the importance of
participation in school athletics or activities among students enrolled at different grade
levels (freshman, sophomore, junior, senior)?

113
H26. There is a statistically significant difference in perceptions toward the
importance of participation in school athletics or activities among students enrolled at
different grade levels (freshman, sophomore, junior, senior).
A one-factor ANOVA was conducted to test H26. The categorical variable used
to group the dependent variable, student perceptions toward the importance of their
participation in school athletics or activities, was grade level (freshman, sophomore,
junior, senior). The level of significance was set at .05. The results of the analysis, using
items 1 and 5 from the student survey, indicated no significant difference between at least
two of the means, F = .475, df = 3, 681, p = .700. See Table 24 for the means and
standard deviations for this analysis. H26 was not supported. Students in one grade level
did not respond more strongly than students in any other grade level about the importance
of their participation in school athletics or activities.
Table 24
Descriptive Statistics for the Results of the Test for H26
Variable M SD N
Freshman 3.42 1.29 299
Sophomore 3.29 1.24 211
Junior 3.37 1.30 92
Senior 3.45 1.39 83
RQ9. To what extent is there a difference in perceptions toward the importance of
participation in volunteer work or community service among students enrolled at
different grade levels (freshman, sophomore, junior, senior)?

114
H27. There a statistically significant difference in perceptions toward the
importance of participation in volunteer work or community service among students
enrolled at different grade levels (freshman, sophomore, junior, senior).
A one-factor ANOVA was conducted to test H27. The categorical variable used
to group the dependent variable, student perceptions toward the importance of their
participation in volunteer work or community service, was grade level (freshman,
sophomore, junior, senior). The level of significance was set at .05. The results of the
analysis, using items 1 and 6 from the student survey, indicated no significant difference
between at least two of the means, F = 0.768, df = 3, 682, p = .512. See Table 25 for the
means and standard deviations for this analysis. H27 was not supported. Students in one
grade level did not respond more strongly than students in any other grade level about the
importance of their participation in volunteer work or community service.
Table 25
Descriptive Statistics for the Results of the Test for H27
Variable M SD N
Freshman 2.97 1.05 299
Sophomore 3.00 1.01 212
Junior 3.15 0.99 92
Senior 2.99 1.05 83
RQ10. To what extent is there a difference in perceptions toward the usefulness
of an advisory program for college and/or career plans among students enrolled at
different grade levels (freshman, sophomore, junior, senior)?

115
H28. There a statistically significant difference in perceptions toward the
usefulness of an advisory program for college and/or career plans among students
enrolled at different grade levels (freshman, sophomore, junior, senior).
A one-factor ANOVA was conducted to test H28. The categorical variable used
to group the dependent variable, student perceptions toward the usefulness of an advisory
program for college and/or career plans, was student grade level (freshman, sophomore,
junior, senior). The level of significance was set at .05. The results of the analysis, using
items 1 and 16 from the student survey, indicated a significant difference between at least
two of the means, F = 3.040, df = 3, 680, p = .028, η2 = .013. A follow up post hoc was
conducted to determine which pairs of means were different. The Tukey’s HSD post hoc
was conducted at D = .05. One of the differences was statistically different. The mean
response for students who reported their grade level as freshman (M = 2.50) was higher
than the mean response for students who reported their grade level as senior (M = 2.12),
which was statistically significant. See Table 26 for the means and standard deviations
for this analysis. H28 was supported. The effect size indicated a small effect. Freshman
students responded more strongly than senior students about the usefulness of an advisory
program for college and/or career plans.
Table 26
Descriptive Statistics for the Results of the Test for H28
Variable M SD N
Freshman 2.50 1.07 298
Sophomore 2.43 1.19 211
Junior 2.26 1.16 92
Senior 2.12 1.15 83

116
RQ11. To what extent is there a difference in perceptions toward the usefulness
of an advisory program for social and emotional development among students enrolled at
different grade levels (freshman, sophomore, junior, senior)?
H29. There is a statistically significant difference in perceptions toward the
usefulness of an advisory program for social and emotional development among students
enrolled at different grade levels (freshman, sophomore, junior, senior).
A one-factor ANOVA was conducted to test H29. The categorical variable used
to group the dependent variable, student perceptions toward the usefulness of an advisory
program for social and emotional development, was grade level (freshman, sophomore,
junior, senior). The level of significance was set at .05. The results of the analysis, using
items 1 and 17 from the student survey, indicated no significant difference between at
least two of the means, F = 0.886, df = 3, 682, p = .448. See Table 27 for the means and
standard deviations for this analysis. H29 was not supported. Students from one grade
level did not respond more strongly than students at any other grade level about the
usefulness of an advisory program for social and emotional development.
Table 27
Descriptive Statistics for the Results of the Test for H29
Variable M SD N
Freshman 1.86 1.01 299
Sophomore 1.97 1.10 211
Junior 1.78 0.94 92
Senior 1.82 1.08 83
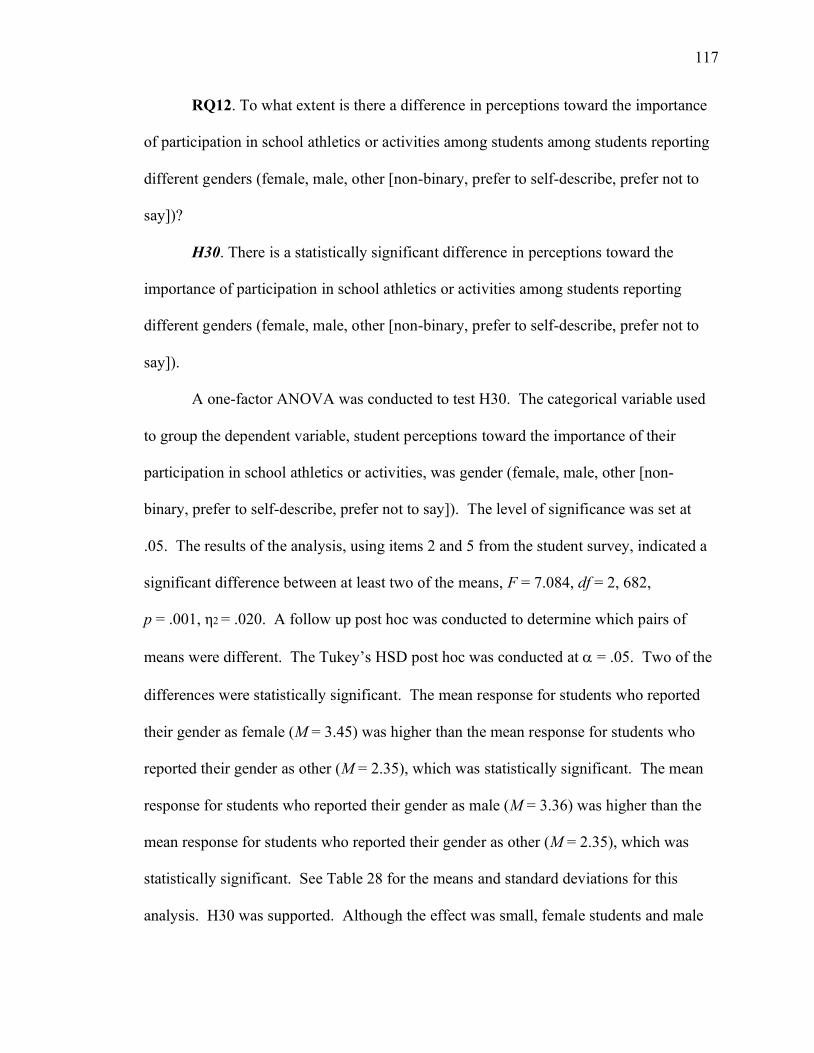
117
RQ12. To what extent is there a difference in perceptions toward the importance
of participation in school athletics or activities among students among students reporting
different genders (female, male, other [non-binary, prefer to self-describe, prefer not to
say])?
H30. There is a statistically significant difference in perceptions toward the
importance of participation in school athletics or activities among students reporting
different genders (female, male, other [non-binary, prefer to self-describe, prefer not to
say]).
A one-factor ANOVA was conducted to test H30. The categorical variable used
to group the dependent variable, student perceptions toward the importance of their
participation in school athletics or activities, was gender (female, male, other [non-
binary, prefer to self-describe, prefer not to say]). The level of significance was set at
.05. The results of the analysis, using items 2 and 5 from the student survey, indicated a
significant difference between at least two of the means, F = 7.084, df = 2, 682,
p = .001, η2 = .020. A follow up post hoc was conducted to determine which pairs of
means were different. The Tukey’s HSD post hoc was conducted at D = .05. Two of the
differences were statistically significant. The mean response for students who reported
their gender as female (M = 3.45) was higher than the mean response for students who
reported their gender as other (M = 2.35), which was statistically significant. The mean
response for students who reported their gender as male (M = 3.36) was higher than the
mean response for students who reported their gender as other (M = 2.35), which was
statistically significant. See Table 28 for the means and standard deviations for this
analysis. H30 was supported. Although the effect was small, female students and male
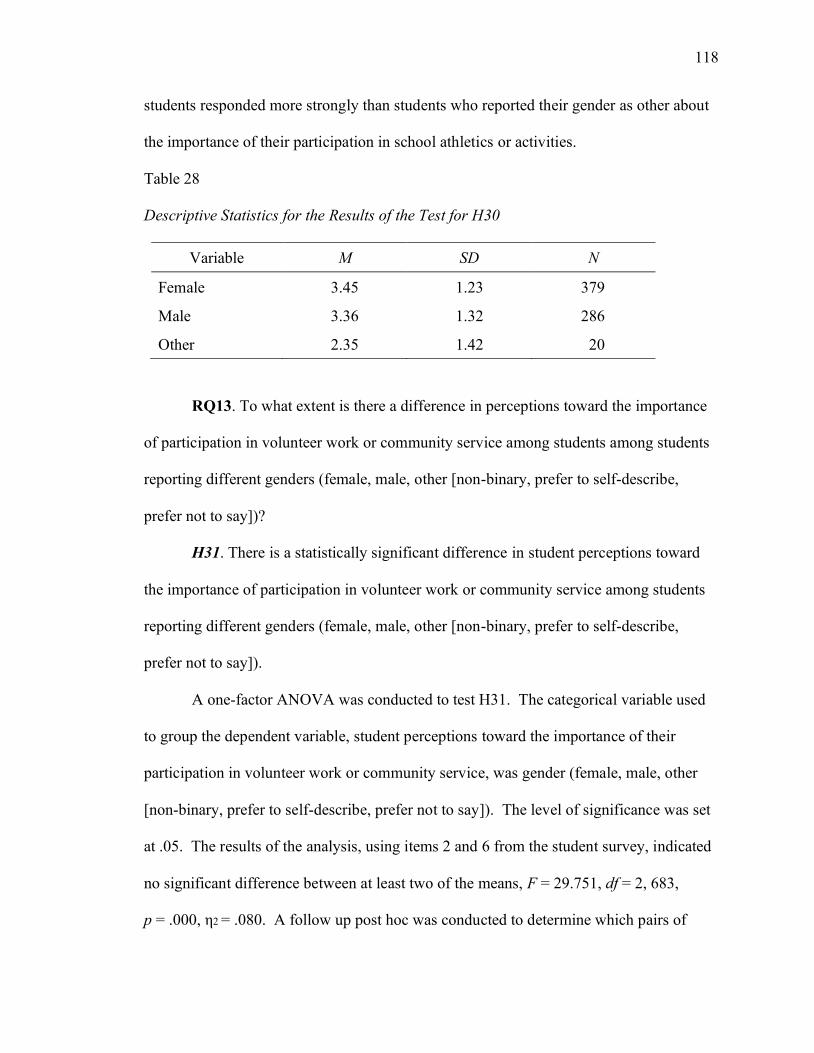
118
students responded more strongly than students who reported their gender as other about
the importance of their participation in school athletics or activities.
Table 28
Descriptive Statistics for the Results of the Test for H30
Variable M SD N
Female 3.45 1.23 379
Male 3.36 1.32 286
Other 2.35 1.42 20
RQ13. To what extent is there a difference in perceptions toward the importance
of participation in volunteer work or community service among students among students
reporting different genders (female, male, other [non-binary, prefer to self-describe,
prefer not to say])?
H31. There is a statistically significant difference in student perceptions toward
the importance of participation in volunteer work or community service among students
reporting different genders (female, male, other [non-binary, prefer to self-describe,
prefer not to say]).
A one-factor ANOVA was conducted to test H31. The categorical variable used
to group the dependent variable, student perceptions toward the importance of their
participation in volunteer work or community service, was gender (female, male, other
[non-binary, prefer to self-describe, prefer not to say]). The level of significance was set
at .05. The results of the analysis, using items 2 and 6 from the student survey, indicated
no significant difference between at least two of the means, F = 29.751, df = 2, 683,
p = .000, η2 = .080. A follow up post hoc was conducted to determine which pairs of

119
means were different. The Tukey’s HSD post hoc was conducted at D = .05. Two of the
differences were statistically significant. The mean response for students who reported
their gender as female (M = 3.26) was higher than the mean response for students who
reported their gender as male (M = 2.72), which was statistically significant. The mean
response for students who reported their gender as female (M = 3.26) was higher than the
mean response for students who reported their gender as other (M = 2.30), which was
statistically significant. See Table 29 for the means and standard deviations for this
analysis. H31 was supported. Although the effect size was small, female students
responded more strongly than male students and students who reported their gender as
other about the importance of their participation in volunteer work or community service.
Table 29
Descriptive Statistics for the Results of the Test for H31
Variable M SD N
Female 3.26 0.96 379
Male 2.72 1.01 287
Other 2.30 1.22 20
RQ14. To what extent is there a difference in perceptions toward the usefulness
of an advisory program for college and/or career plans among students reporting different
genders (female, male, other [non-binary, prefer to self-describe, prefer not to say])?
H32. There is a statistically significant difference in perceptions toward the
usefulness of an advisory program for college and/or career plans among students
reporting different genders (female, male, other [non-binary, prefer to self-describe,
prefer not to say]).
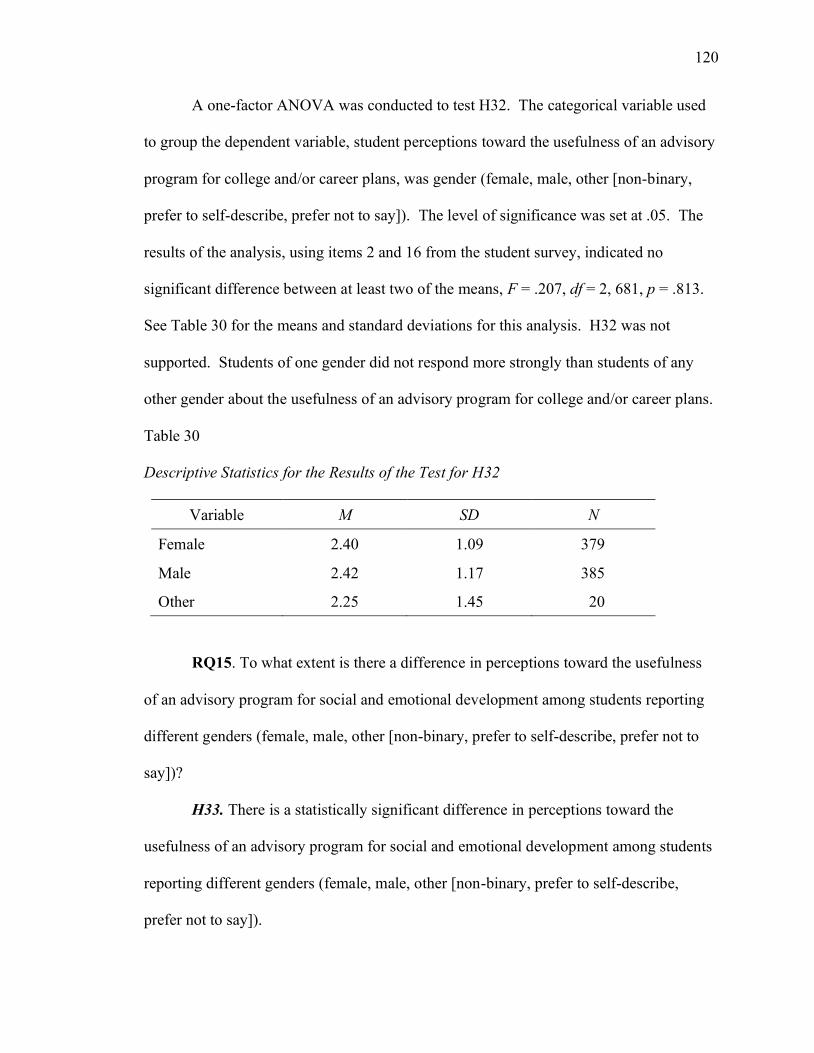
120
A one-factor ANOVA was conducted to test H32. The categorical variable used
to group the dependent variable, student perceptions toward the usefulness of an advisory
program for college and/or career plans, was gender (female, male, other [non-binary,
prefer to self-describe, prefer not to say]). The level of significance was set at .05. The
results of the analysis, using items 2 and 16 from the student survey, indicated no
significant difference between at least two of the means, F = .207, df = 2, 681, p = .813.
See Table 30 for the means and standard deviations for this analysis. H32 was not
supported. Students of one gender did not respond more strongly than students of any
other gender about the usefulness of an advisory program for college and/or career plans.
Table 30
Descriptive Statistics for the Results of the Test for H32
Variable M SD N
Female 2.40 1.09 379
Male 2.42 1.17 385
Other 2.25 1.45 20
RQ15. To what extent is there a difference in perceptions toward the usefulness
of an advisory program for social and emotional development among students reporting
different genders (female, male, other [non-binary, prefer to self-describe, prefer not to
say])?
H33. There is a statistically significant difference in perceptions toward the
usefulness of an advisory program for social and emotional development among students
reporting different genders (female, male, other [non-binary, prefer to self-describe,
prefer not to say]).

121
A one-factor ANOVA was conducted to test H33. The categorical variable used
to group the dependent variable, student perceptions toward the usefulness of an advisory
program for social and emotional development, was gender (female, male, other [non-
binary, prefer to self-describe, prefer not to say]). The level of significance was set at
.05. The results of the analysis, using items 2 and 17 from the student survey, indicated
no significant difference between at least two of the means, F = 0.501, df = 2, 681,
p = .606. See Table 31 for the means and standard deviations for this analysis. H33 was
not supported. Students of one gender did not respond more strongly than students of any
other gender about the usefulness of an advisory program for social and emotional
development.
Table 31
Descriptive Statistics for the Results of the Test for H33
Variable M SD N
Female 1.89 1.02 378
Male 1.89 1.05 287
Other 1.65 1.23 20
RQ16. To what extent is there a difference in perceptions toward the importance
of participation in school athletics or activities among students reporting different
ethnicities (Black/African-American, Hispanic/Latino, White, Other [Asian/Pacific
Islander, Multi-Racial, Native American/American Indian, other, prefer not to say])?
H34. There is a statistically significant difference in perceptions toward the
importance of participation in school athletics or activities among students reporting
different ethnicities (Black/African-American, Hispanic/Latino, White, Other

122
[Asian/Pacific Islander, Multi-Racial, Native American/American Indian, other, prefer
not to say]).
A one-factor ANOVA was conducted to test H34. The categorical variable used
to group the dependent variable, student perceptions toward the importance of their
participation in school athletics or activities, was ethnicity (Black/African-American,
Hispanic/Latino, White, Other [Asian/Pacific Islander, Multi-Racial, Native
American/American Indian, other, prefer not to say]). The level of significance was set
at .05. The results of the analysis, using items 3 and 5 from the student survey, indicated
a significant difference between at least two of the means, F = 8.296, df = 3, 681,
p = .000, η2 = .035. A follow up post hoc was conducted to determine which pairs of
means were different. The Tukey’s HSD post hoc was conducted at D = .05. Two of the
differences were statistically significant. The mean response for students who reported
their ethnicity as Black or African-American (M = 3.51) was higher than the mean
response for students who reported their ethnicity as Hispanic or Latino (M = 2.82),
which was statistically significant. The mean response for students who reported their
ethnicity as White (M = 3.50) was higher than the mean response for students who
reported their ethnicity as Hispanic or Latino (M = 2.82), which was statistically
significant. See Table 32 for the means and standard deviations for this analysis. H34
was supported. Although the effect size was small, Black or African-American students
and White students responded more strongly than Hispanic or Latino students about the
importance of their participation in school athletics or activities.

123
Table 32
Descriptive Statistics for the Results of the Test for H34
Variable M SD N
Black or African-American 3.51 1.22 37
Hispanic or Latino 2.82 1.16 102
White 3.50 1.26 456
Other 3.30 1.29 90
RQ17. To what extent is there a difference in perceptions toward the importance
of participation in volunteer work or community service among students reporting
different ethnicities (Black/African-American, Hispanic/Latino, White, Other
[Asian/Pacific Islander, Multi-Racial, Native American/American Indian, other, prefer
not to say])?
H35. There is a statistically significant difference in perceptions toward the
importance of participation in volunteer work or community service among students
reporting different ethnicities (Black/African-American, Hispanic/Latino, White, Other
[Asian/Pacific Islander, Multi-Racial, Native American/American Indian, other, prefer
not to say]).
A one-factor ANOVA was conducted to test H35. The categorical variable used
to group the dependent variable, student perceptions toward the importance of their
participation in volunteer work or community service, was ethnicity (Black/African-
American, Hispanic/Latino, White, Other [Asian/Pacific Islander, Multi-Racial, Native
American/American Indian, other, prefer not to say]). The level of significance was set
at .05. The results of the analysis, using items 3 and 6 from the student survey, indicated
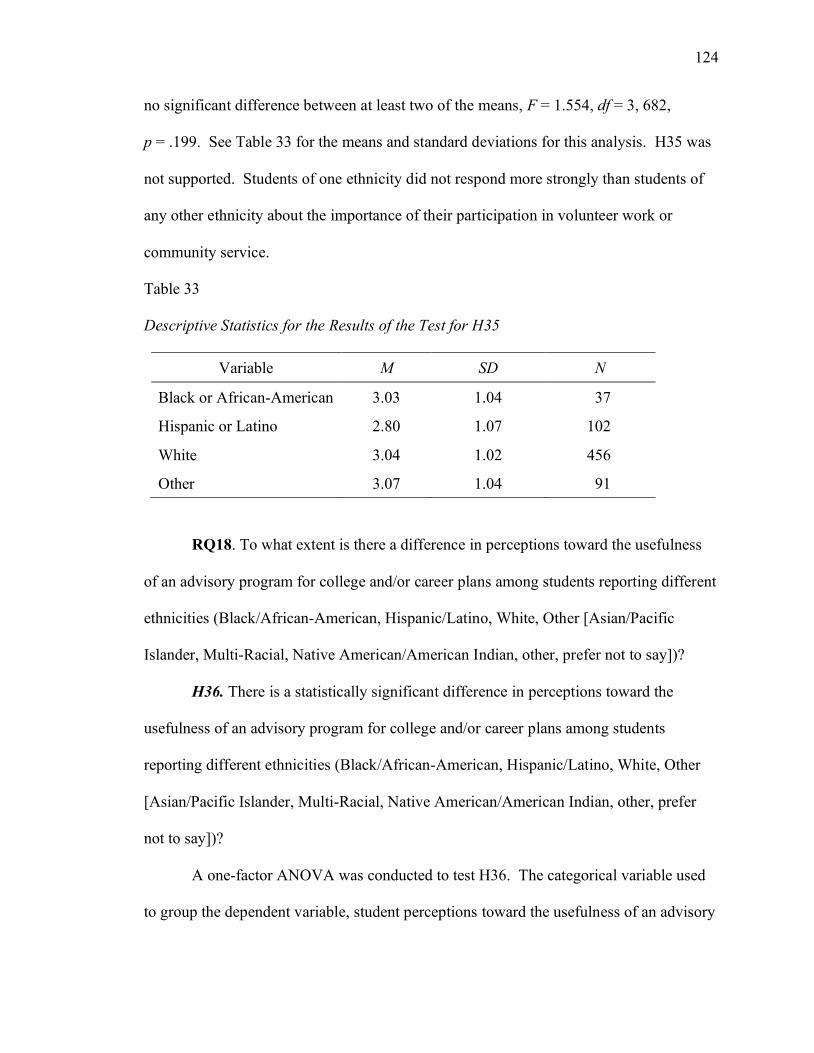
124
no significant difference between at least two of the means, F = 1.554, df = 3, 682,
p = .199. See Table 33 for the means and standard deviations for this analysis. H35 was
not supported. Students of one ethnicity did not respond more strongly than students of
any other ethnicity about the importance of their participation in volunteer work or
community service.
Table 33
Descriptive Statistics for the Results of the Test for H35
Variable M SD N
Black or African-American 3.03 1.04 37
Hispanic or Latino 2.80 1.07 102
White 3.04 1.02 456
Other 3.07 1.04 91
RQ18. To what extent is there a difference in perceptions toward the usefulness
of an advisory program for college and/or career plans among students reporting different
ethnicities (Black/African-American, Hispanic/Latino, White, Other [Asian/Pacific
Islander, Multi-Racial, Native American/American Indian, other, prefer not to say])?
H36. There is a statistically significant difference in perceptions toward the
usefulness of an advisory program for college and/or career plans among students
reporting different ethnicities (Black/African-American, Hispanic/Latino, White, Other
[Asian/Pacific Islander, Multi-Racial, Native American/American Indian, other, prefer
not to say])?
A one-factor ANOVA was conducted to test H36. The categorical variable used
to group the dependent variable, student perceptions toward the usefulness of an advisory
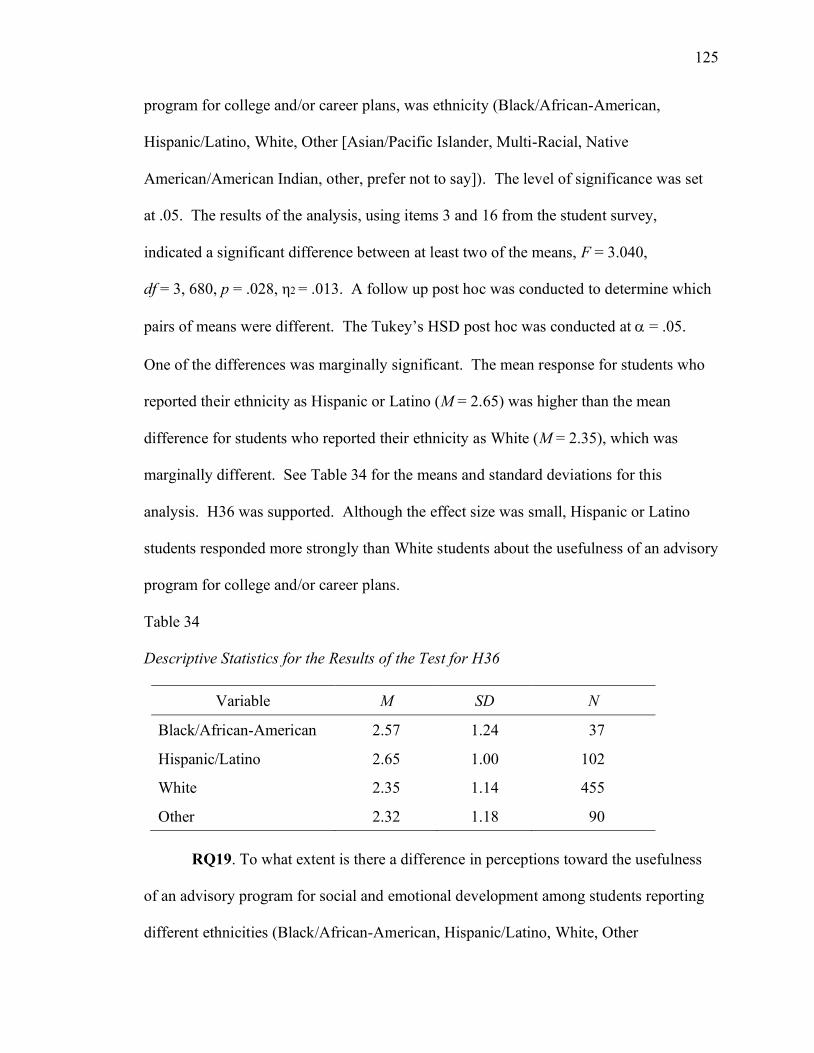
125
program for college and/or career plans, was ethnicity (Black/African-American,
Hispanic/Latino, White, Other [Asian/Pacific Islander, Multi-Racial, Native
American/American Indian, other, prefer not to say]). The level of significance was set
at .05. The results of the analysis, using items 3 and 16 from the student survey,
indicated a significant difference between at least two of the means, F = 3.040,
df = 3, 680, p = .028, η2 = .013. A follow up post hoc was conducted to determine which
pairs of means were different. The Tukey’s HSD post hoc was conducted at D = .05.
One of the differences was marginally significant. The mean response for students who
reported their ethnicity as Hispanic or Latino (M = 2.65) was higher than the mean
difference for students who reported their ethnicity as White (M = 2.35), which was
marginally different. See Table 34 for the means and standard deviations for this
analysis. H36 was supported. Although the effect size was small, Hispanic or Latino
students responded more strongly than White students about the usefulness of an advisory
program for college and/or career plans.
Table 34
Descriptive Statistics for the Results of the Test for H36
Variable M SD N
Black/African-American 2.57 1.24 37
Hispanic/Latino 2.65 1.00 102
White 2.35 1.14 455
Other 2.32 1.18 90
RQ19. To what extent is there a difference in perceptions toward the usefulness
of an advisory program for social and emotional development among students reporting
different ethnicities (Black/African-American, Hispanic/Latino, White, Other

126
[Asian/Pacific Islander, Multi-Racial, Native American/American Indian, other, prefer
not to say])?
H37. There a statistically significant difference in perceptions toward the
usefulness of an advisory program for social and emotional development among students
reporting different ethnicities (Black/African-American, Hispanic/Latino, White, Other
[Asian/Pacific Islander, Multi-Racial, Native American/American Indian, other, prefer
not to say]).
A one-factor ANOVA was conducted to test H37. The categorical variable used
to group the dependent variable, student perceptions toward the usefulness of an advisory
program for social and emotional development, was ethnicity (Black/African-American,
Hispanic/Latino, White, Other [Asian/Pacific Islander, Multi-Racial, Native
American/American Indian, other, prefer not to say]). The level of significance was set
at .05. The results of the analysis, using items 3 and 17 from the student survey,
indicated a significant difference between at least two of the means, F = 4.080,
df = 3, 680, p = .007, η2 = .018. A follow up post hoc was conducted to determine which
pairs of means were different. The Tukey’s HSD post hoc was conducted at D = .05.
Two of the differences were statistically significant. The mean response for students who
reported their ethnicity as Hispanic or Latino (M = 2.11) was higher than the mean
response for students who reported their ethnicity as White (M = 1.80), which was
statistically significant. The mean response for students who reported their ethnicity as
Black or African-American (M = 2.24) was higher than the mean response for students
who reported their ethnicity as White (M = 1.80), which was marginally significant. See
Table 35 for the means and standard deviations for this analysis. H37 was supported.

127
Although the effect size was small, Hispanic or Latino students responded more strongly
than White students about the usefulness of an advisory program for social and emotional
development. In addition, Black or African-American students responded somewhat
more strongly than White students about the usefulness of an advisory program for social
and emotional development.
Table 35
Descriptive Statistics for the Results of the Test for H37
Variable M SD N
Black/African-American 2.24 1.12 37
Hispanic/Latino 2.12 1.03 102
White 1.80 1.01 455
Other 1.86 1.08 91
RQ20. To what extent is there a difference in perceptions toward the importance
of participation in school athletics or activities among students based on the grades they
report as usual in school (A, B, C, D/F)?
H38. There is a statistically significant difference in perceptions of the importance
of participation in school athletics or activities among students based on the grades they
report as usual in school (A, B, C, D/F).
A one-factor ANOVA was conducted to test H38. The categorical variable used
to group the dependent variable, student perceptions toward the importance of their
participation in school athletics or activities, was grades reported as usual in school (A,
B, C, D/F). The level of significance was set at .05. The results of the analysis, using
items 4 and 5 from the student survey, indicated a significant difference between at least

128
two of the means, F = 14.714, df = 3, 679, p = .000, η2 = .061. A follow up post hoc was
conducted to determine which pairs of means were different. The Tukey’s HSD post hoc
was conducted at D = .05. Two of the differences were statistically significant. The
mean response for students who reported their grades as A (M = 3.70) was higher than
the mean response for students who reported their grades as B (M = 3.18), which was
statistically significant. The mean response for students who reported their grades as A
(M = 3.70) was higher than the mean response for students who reported their grades as C
(M = 2.85), which was statistically significant. See Table 36 for the means and standard
deviations for this analysis. H38 was supported. Although the effect size was small, A
students responded more strongly than B students and C students about the importance of
their participation in school athletics or activities.
Table 36
Descriptive Statistics for the Results of the Test for H38
Variable M SD N
A 3.70 1.78 316
B 3.18 1.29 249
C 2.85 1.31 94
D/F 3.17 1.43 24
RQ21. To what extent is there a difference in perceptions toward the importance
of participation in volunteer work or community service among students based on the
grades they report as usual in school (A, B, C, D/F)?

129
H39. There is a statistically significant difference in perceptions toward the
importance of participation in volunteer work or community service among students
based on the grades they report as usual in school (A, B, C, D/F).
A one-factor ANOVA was conducted to test H39. The categorical variable used
to group the dependent variable, student perceptions toward the importance of their
participation in volunteer work or community service, was grades students report as usual
in school (A, B, C, D/F). The level of significance was set at .05. The results of the
analysis, using items 4 and 6 from the student survey, indicated a significant difference
between at least two of the means, F = 11.873, df = 3, 680, p = .000, η2 = .050. A follow
up post hoc was conducted to determine which pairs of means were different. The
Tukey’s HSD post hoc was conducted at D = .05. Three of the differences were
statistically significant. The mean response for students who reported their grades as A
(M = 3.22) was higher than the mean response for students who reported their grades as B
(M = 2.91), which was statistically significant. The mean response for students who
reported their grades as A (M = 3.22) was higher than the mean response for students
who reported their grades as C (M = 2.68), which was statistically significant. The mean
response for students who reported their grades as A (M = 3.22) was higher than the
mean response for students who reported their grades as D/F (M = 2.38), which was
statistically significant. See Table 37 for the means and standard deviations for this
analysis. H39 was supported. Although the effect size was small, A students responded
more strongly than B students, C students, and D/F students about the importance of their
participation in volunteer work or community service.

130
Table 37
Descriptive Statistics for the Results of the Test for H39
Variable M SD N
A 3.22 1.02 316
B 2.91 0.99 249
C 2.68 0.96 95
D/F 2.38 1.24 24
RQ22. To what extent is there a difference in perceptions toward the usefulness
of an advisory program for college and/or career plans among students based on the
grades they report as usual in school (A, B, C, D/F)?
H40. There is a statistically significant difference in perceptions toward the
usefulness of an advisory program for college and/or career plans among students based
on the grades they report as usual in school (A, B, C, D/F).
A one-factor ANOVA was conducted to test H40. The categorical variable used
to group the dependent variable, student perceptions toward the usefulness of an advisory
program for college and/or career plans, was grades reported as usual in school (A, B, C,
D/F). The level of significance was set at .05. The results of the analysis, using items 4
and 16 from the student survey, indicated a significant difference between at least two of
the means, F = 1.550, df = 3, 678, p = .200. See Table 38 for the means and standard
deviations for this analysis. H40 was not supported. No one category of students who
self-reported grades responded more strongly than another category of students who self-
reported grades about the usefulness of an advisory program for college and/or career
plans.

131
Table 38
Descriptive Statistics for the Results of the Test for H40
Variable M SD N
A 2.30 1.07 316
B 2.49 1.15 247
C 2.47 1.20 95
D/F 2.54 1.38 24
RQ23. To what extent is there a difference in perceptions toward the usefulness
of an advisory program for social and emotional development among students based on
the grades they report as usual in school (A, B, C, D/F)?
H41. There a statistically significant difference in perceptions toward the
usefulness of an advisory program for social and emotional development among students
based on the grades they report as usual in school (A, B, C, D/F).
A one-factor ANOVA was conducted to test H41. The categorical variable used
to group the dependent variable, student perceptions toward the usefulness of an advisory
program for social and emotional development, was grades reported as usual in school
(A, B, C, D/F). The level of significance was set at .05. The results of the analysis, using
items 4 and 17 from the student survey, indicated a significant difference between at least
two of the means, F = 6.011, df = 3, 679, p = .000, η2 = .026. A follow up post hoc was
conducted to determine which pairs of means were different. The Tukey’s HSD post hoc
was conducted at D = .05. Two of the differences were statistically significant. The
mean response for students who reported their grades as D/F (M = 2.38) was higher than
the mean response for students who reported their grades as A (M = 1.75), which was

132
statistically significant. The mean response for students who reported their grades as D/F
(M = 2.38) was higher than the mean response for students who reported their grades as B
(M = 1.89), which was statistically significant. See Table 39 for the means and standard
deviations for this analysis. H41 was supported. Although the effect size was small, D/F
students responded more strongly than A students and B students about the usefulness of
an advisory program for social and emotional development.
Table 39
Descriptive Statistics for the Results of the Test for H41
Variable M SD N
A 1.75 0.94 315
B 1.89 1.01 249
C 2.16 1.21 95
D/F 2.38 1.31 24
Summary
Chapter 4 included the data analysis and the hypothesis testing for the research
questions related to the impact of a high school advisory program in a public high school
as measured primarily by a cross-sectional descriptive survey of student perceptions
using a Likert-type scale. The results of the ANOVAs that were used to address research
questions 1-4 and research questions 8-23 and the calculation and testing of Pearson
product moment correlation coefficients that were used to address research questions 5-7
were reported in this chapter. Chapter 5 contains a study summary, including an
overview of the problem, review of the methodology, and major findings. In addition,

133
Chapter 5 contains findings related to the literature, recommendations for future research,
and conclusions.

134
Chapter 5
Interpretation and Recommendations
Chapter 5 includes a summary of the study by providing an overview of the
problem, the purpose statement and research questions, the methodology, and the major
findings. The chapter also includes a discussion of the findings related to the literature.
The chapter concludes with the implications for action for high school advisory programs
as well as recommendations for future research designed to extend or complement the
research completed for this study.
Study Summary
The following section provides a summary of the research conducted for this
study. The summary includes an overview of the problem concerning student
perceptions toward a high school advisory program at Primus High School in the
Pressman School District. The next section states the purpose of the study and the
research questions. The final two sections provide a review of the methodology and
explain the major findings. This study contributed to the body of research on advisory
programs by analyzing student perceptions toward an advisory program at a large,
diverse, midwestern, suburban, public high school. The analyses disaggregated the
sample by student demographics (grade level, gender, and ethnicity) and by self-reported
grades.
Overview of the problem. The utilization of advisory programs in secondary
schools is motivated by a growing investment in CCR and SEL by government, business,
philanthropic, and community stakeholders (Achieve, 2015; ACT, 2013; College Board,
2014; Jobs for the Future, 2018; Ryerse et al., 2014), by the rise of mental health issues in

135
the adolescent population (Centers for Disease Control and Prevention, 2017; Curtin et
al., 2016; National Institute of Mental Health, 2019; Plemmons et al., 2018; Twenge et
al., 2019), and by the advocacy for and implementation of tiered systems of responsive
interventions in public schools (Darling-Hammond et al., 2002; Legters et al., 2002; RTI
Action Network, 2019). The use of an advisory program as a vehicle for academic and
interpersonal supports fits the framework of multiple educational movements, such as
Social-Emotional Learning (SEL), Partnership for 21st Century Skills (P21), and deeper
learning (ASCD, 2020; Bishop, 2010; CASEL, 2019b; Fullan et al., 2017; Great Schools
Partnership, 2015; National Education Association, 2020). However, from the 1990s to
the 2010s, the research on advisory programs had produced mixed results on the
effectiveness of advisory programs as measured by attitudes, grades, participation,
behavior, and post-secondary success. In addition, studies on the effectiveness of
advisory programs typically focused on middle school environments (Demaray &
Malecki, 2002; Shulkind & Foote, 2009; Weilbacher & Lanier, 2012), often in urban
school districts (Botvin et al., 2006; Gard, 2014; Montague et al., 2011).
Purpose statement and research questions. The purpose of this quantitative
study was to determine the impact of a high school advisory program in a public high
school as measured primarily by a cross-sectional descriptive survey of student
perceptions using a Likert-type scale. Specifically, this research study focused on student
perceptions toward excitement about going to an advisory class, eagerness in
participating in an advisory class, interest in the lessons from an advisory class, and the
usefulness of ideas from an advisory class, and the analyses disaggregated the sample by
student demographics (grade level, gender, and ethnicity) and by self-reported grades. In
136
addition, this research study correlated student perceptions toward an advisory program
and an advisory teacher, toward an advisory teacher and belonging at school, and toward
an advisory program and belonging at school. Lastly, this research study focused on
student perceptions toward the importance of their participation in school athletics or
activities, the importance of their participation in volunteer work or community service,
the usefulness of an advisory program for college and/or career plans, and the usefulness
of an advisory program for social and emotional development, and the analyses
disaggregated the sample by student demographics (grade level, gender, and ethnicity)
and by self-reported grades. In order to guide this study, 23 research questions with 41
hypotheses were designed to address the aforementioned purposes.
Review of the methodology. The sample for the current study included 686
students in grades 9-12 at Primus High School in the Pressman School District. The
student data was collected through a quantitative student survey administered
electronically using Google Forms. The survey was designed with a Likert-type scale to
examine student perceptions toward an advisory program. The survey was adapted from
Panorama Education’s Student Survey with the approval from the Panorama company
and was distributed to students with the approval of building and district administration
in the Pressman School District as well as the approval of the Baker IRB committee.
Communication on the purpose and design of the survey was provided to students and
parents in Primus High School. The survey was distributed to all students during one
advisory period. The survey data from the Google Form was downloaded and imported
into the IBM SPSS Faculty Stats Pack Version 25 for analysis. The results of the
ANOVAs that addressed RQ1-RQ4 and RQ8-RQ23, and the calculations of the Pearson

137
product moment correlation coefficients that addressed RQ5-RQ7 were presented in
Chapter 4.
Major findings. A description of the results from the hypothesis testing that
addressed the 23 research questions and 41 hypotheses was presented in Chapter 4. The
analysis of the student perceptions toward an advisory program revealed the following
key findings.
Student perceptions toward an advisory program. Research questions 1-4 and
hypotheses 1-16 examined student perceptions toward an advisory program. The
hypotheses were designed to examine student perceptions toward an advisory program
through four lenses: excitement about going to advisory class, eagerness about
participating in advisory class, interest in the lessons from advisory class, and usefulness
of ideas from advisory class. The analyses disaggregated the sample by student
demographics (grade level, gender, and ethnicity) and by self-reported grades.
Sophomore students responded somewhat more strongly than senior students
about going to advisory class. Hispanic students responded more strongly than White
students about their interest in the lessons from advisory class. D/F students responded
more strongly than A students about their excitement about going to advisory class, their
eagerness to participate in advisory class, and their interest in the lessons from advisory
class. In addition, D/F students responded more strongly than B students about their
eagerness to participate in advisory class as well as their interest in the lessons from
advisory class. Finally, C students responded more strongly than A students about their
excitement about going to advisory class.

138
Student perceptions toward school belonging. Research questions 5 and 6 and
hypotheses 17-21 examined the relationship between student perceptions toward their
belonging at school and student perceptions toward an advisory program as well as
between student perceptions toward their belonging at school and student perceptions
toward an advisory teacher. The hypotheses were designed to examine student
perceptions toward advisory through four lenses: excitement about going to advisory
class, eagerness about participating in advisory class, interest in the lessons from advisory
class, and usefulness of ideas from advisory class.
Students who responded with more excitement about going to advisory class,
more eagerness about participating in advisory class, more interest in the lessons from
advisory class, and more usefulness in the ideas from advisory class also responded with
more belonging at school. Having a statistically significant correlation with a small
effect size, the finding indicates that students who have a positive perception toward an
advisory program also have a more positive perception toward belonging at school.
Similarly, students who responded with more connection to an advisory teacher
responded with more belonging at school. Having a statistically significant correlation
with a small effect size, the finding indicates that students who have a more positive
perception toward an advisory teacher also have a more positive perception toward
belonging at school.
Student perceptions toward an advisory teacher. Research question 7 and
hypotheses 22-25 examined the relationship between student perceptions toward
connectedness with an advisory teacher and student perceptions toward an advisory
program. The hypotheses for student perceptions toward an advisory program were
139
designed to examine the student perceptions toward an advisory program through four
lenses: excitement about going to advisory class, eagerness about participating in
advisory class, interest in the lessons from advisory class, and usefulness of ideas from
advisory class.
Students who responded with more connectedness with an advisory teacher also
responded with more excitement about going to advisory class, more eagerness about
participating in advisory class, more interest in the lessons from advisory class, and more
usefulness in the ideas from advisory class. The finding, which was statistically
significant with a moderate effect size, indicates that students who have a more positive
perception toward an advisory teacher also have a more positive perception toward
advisory class.
Student perceptions toward the intended outcomes of an advisory program:
participation in school athletics or activities. Research questions 8-23 and hypotheses
26-41 examined student perceptions toward the intended outcomes of an advisory
program as measured through four lenses: participation in school athletics or activities,
participation in volunteer work or community service, college and/or career plans, and
social-emotional development.
Research questions 8, 12, 16, and 20 examined student perceptions toward the
importance of their participation in school athletics or activities. Each research question
examined this intended outcome of an advisory program through one of four independent
variables: grade level, gender, ethnicity, and self-reported grades.
Students at one grade level did not respond more strongly than students at any
other grade level about the importance of their participation in school athletics or

140
activities. However, female and male students responded more strongly than students
who reported their gender as other about the importance of their participation in school
athletics or activities. Also, Black or African-American students and White students
responded more strongly than Hispanic or Latino students about the importance of their
participation in school athletics or activities. In terms of self-reported grades, A students
responded more strongly than B students and C students about the importance of their
participation in school athletics or activities.
Student perceptions toward the intended outcomes of an advisory program:
participation in volunteer work or community service.
Research questions 9, 13, 17, and 21 examined student perceptions toward the
importance of their participation in volunteer work or community service. Each research
question examined this intended outcome of an advisory program through one of four
independent variables: grade level, gender, ethnicity, and self-reported grades.
Students at one grade level did not respond more strongly than students at any
other grade level about the importance of their participation in school athletics or
activities. However, female students responded more strongly than male students and
students who reported their gender as other about the importance of their participation in
volunteer work or community service. Students of one ethnicity did not respond more
strongly than students of any other ethnicity about the importance of their participation in
volunteer work or community service. In terms of self-reported grades, A students
responded more strongly than B students, C students, and D/F students about the
importance of their participation in volunteer work or community service.
141
Student perceptions toward the intended outcomes of an advisory program:
college and/or career plans.
Research questions 10, 14, 18, and 22 examined student perceptions toward the
usefulness of an advisory program for college and/or career plans. Each research
question examined this intended outcome of an advisory program through one of four
independent variables: grade level, gender, ethnicity, and self-reported grades.
Freshman students responded more strongly than senior students about the
usefulness of an advisory program for college and/or career plans. No one gender
responded more strongly than another gender about the usefulness of an advisory
program for college and/or career plans. However, Hispanic or Latino students
responded more strongly than White students about the usefulness of an advisory
program for college and/or career plans. No one category of students who self-reported
grades responded more strongly than another category of students who self-reported
grades about the usefulness of an advisory program for college and/or career plans.
Student perceptions toward the intended outcomes of an advisory program:
social and emotional development.
Research questions 11, 15, 19, and 23 examined student perceptions toward the
usefulness of an advisory program for social and emotional development. Each research
questions examined this intended outcome of an advisory program through one of four
independent variables: grade level, gender, ethnicity, and self-reported grades.
Students at one grade level did not respond more strongly than students at any
other grade level about the usefulness of an advisory program for social and emotional
development. Students of one gender did not respond more strongly than students of any

142
other gender about the usefulness of an advisory program for social and emotional
development. However, Hispanic or Latino students responded more strongly than White
students about the usefulness of an advisory program for social and emotional
development. In addition, Black or African-American responded somewhat more
strongly than White students about the usefulness of an advisory program for social and
emotional development. In terms of self-reported grades, D/F students responded more
strongly than A students and as B students about the usefulness of an advisory program
for social and emotional development.
Findings Related to the Literature
Because of the increased focus on CCR and SEL, some school districts have
responded by implementing advisory programs in secondary schools as a delivery system
of supports for college preparation, career planning, community involvement, and
personal development (Vander Ark, 2015). The implementation of advisory programs as
a means to encourage positive social behavior, to foster greater school engagement, to
support increased academic achievement, and to promote post-secondary student success
began in the 1990s at the same time schools and legislation began to advocate for more
CCR and CTE. Consequently, the first comprehensive literature on the effectiveness of
advisory programs emerged at the same time (Ayers, 1994; MacIver, 1990; Manning &
Saddlemire, 1996; Wilson, 1998; Ziegler & Mulhall, 1994). From the 1990s to the
2010s, the research had produced mixed results on the effectiveness of advisory programs
as measured by attitudes, grades, participation, behavior, and post-secondary success.
The studies on the effectiveness of advisory programs typically focused on middle school
environments (Demaray & Malecki, 2002; Shulkind & Foote, 2009; Weilbacher &
143
Lanier, 2012), often in urban school districts (Botvin et al., 2006; Gard, 2014; Montague
et al., 2011). With an increase in the implementation of SEL initiatives in the 2000s,
advisory programs had been tasked with an additional level of responsibility for the
education of the whole child (ASCD, 2018). Meta-analyses, such as those by Durlak et
al. (2011) and by Taylor et al. (2017), examined the findings of other researchers on the
impacts of advisory programs on the social-emotional and character development of
students.
Student perceptions toward an advisory program. Legters et al. (2002) promoted
advisories as a means to provide students with consistent and multi-faceted adult support
throughout high school. In addition, Legters et al. (2002) endorsed the inclusion of real-
world activities, career themes, and community service opportunities in advisory
programs to engage and connect students to school and community. The conclusions of
the authors about the role of an advisory program align with the purpose and design of an
advisory program in the current study. The impetus for the creation of an advisory
program in the current study also was found in research like Darling-Hammond et al.
(2002), who reported that schools have higher levels of achievement when they create
smaller units within the school and keep students together over multiple years.
Weilbacher and Lainer (2012) also found that smaller groups facilitated communication,
openness, and trust.
However, the research on the benefits of advisory programs has been inconsistent.
For example, McClure et al. (2010) found more positive feelings about an advisory
program were associated with worse academic outcomes. The findings of the current
study supported the finding of McClure et al. (2010) because students who reported their
144
grades as D/F responded more strongly than students who reported their grades as A
about their excitement about going to advisory class, their eagerness to participate in
advisory class, and their interest in the lessons from advisory class. In addition, students
who reported their grades as D/F responded more strongly than students who reported
their grades as B about their eagerness to participate in advisory class as well as their
interest in the lessons from advisory class. In McClure et al.’s (2010) discussion section,
the researchers suggested that the students who needed an advisory program the most
valued it the most; that an advisory program is too artificial, institutionalize, and generic
for authentic personalization; that advisory programs are unevenly and poorly
implemented without consistent fidelity; and that schools should work on organic,
embedded, authentic personalization throughout their classes and culture. It is possible
that academically talented students do not find value in an advisory program because they
may already possess the strategies and skills to be successful and may see an advisory
program as redundant and unnecessary.
Student perceptions toward school belonging. Meloro (2005) sought answers to
research questions based on three key points in the definition of school personalization:
every child has an advocate, every child has an individual plan of progress, and every
child has goals and expectations for success. Meloro (2005), studying a diverse
population in the northeast, found that freshman advisories focused more on academics,
that students did not view advisory as positively as the teachers, that females liked
advisory more than males, that freshman students liked advisory more than students in
other grades, and that students with a more positive perception of advisory had a more
positive connection to school. The last finding about connection to school is relevant to

145
the current study because students who responded more strongly about their excitement
about going to advisory class, their eagerness in participating in advisory class, their
interest in the lessons from advisory class, and the usefulness in the ideas from advisory
class also responded more strongly about their belonging at school. Shulkind & Foote
(2009) suggested additional research into the role of student mentoring through
advisories and grade-level specific advisory content, which was relevant to the current
study and aligned with Meloro’s (2005) finding on freshmen, because the high school in
the current study differentiated its advisory program curriculum by grade level and
offered senior peer mentors in freshman advisory classes. Perhaps because of this peer
mentoring, the freshman students of the current study responded more strongly than
senior students about the usefulness of an advisory program for college and/or career
plans. However, Meloro’s (2005) finding about female perceptions toward an advisory
program was not support by the current study, which did not indicate a statistically
significant difference between the genders in their perceptions toward an advisory
program.
Van Ryzin (2011) affirmed the importance of school engagement for academic
achievement. Van Ryzin (2011) concluded that interventions that increase student
perceptions toward autonomy, that provide teacher and peer support, and that develop
student goal setting may create the environmental conditions to positively impact student
academic achievement and behavior performance over time. In addition, Shulkind and
Foote (2009) concluded that strong advisory programs addressed issues of community,
promoted open communication, functioned as a community of learners, perceived
advisory as improving academic performance, had advisors who knew and cared about

146
their advisees, had advisors who monitored the academic progress of the advisees, and
had advisors who were problem solvers and advice givers. Shulkind and Foote (2009)
and Van Ryzin (2011) outlined the conditions through which schools can optimize the
effectiveness of their advisory program to connect students to the school. The findings of
the current study supported Shulkind and Foote (2009) and Van Ryzin (2011) because
students who responded more strongly about the connectedness with their advisory
teacher also responded more strongly about their connectedness with an advisory
program, and students who responded more strongly about their connectedness with an
advisory program also responded more strongly about their belonging at school.
Student perceptions toward an advisory teacher. Bergin and Bergin (2009) built
from the concept that attachment is the foundation of social-emotional wellbeing and that
social-emotional wellbeing is the foundation of school success. Bergin and Bergin
(2009) also reported that teachers who built attachment with students were teachers who
were well prepared for class, showed their “real” self, granted student autonomy, and
held high expectations. Yonezawa et al. (2012) confirmed Bergin and Bergin’s (2009)
findings on effective teacher behaviors, concluding “positive teacher-student
relationships can help buffer students against a host of problems, from disengagement in
a specific academic subject to engaging in risky social behaviors, such as smoking or
alcohol abuse” (p. 6). However, Yonezawa et al. (2012) also acknowledged the
limitations of studies involving teacher attachment because most of the studies have
focused on elementary school contexts. The findings of the current study extend the
findings of Bergin and Bergin (2009) and Yonezawa et al. (2012) by examining student
perceptions toward an advisory program in a large, diverse, midwestern, suburban public

147
school. The research conducted for the current study indicated a weak positive
correlation between student perceptions toward their connectedness with an advisory
teacher and student perceptions toward their belonging at school. In addition, the
researcher of the current study found a moderately strong positive correlation between
student perceptions toward their connectedness with an advisory teacher and student
perceptions toward an advisory program. According to the current study, an advisory
teacher plays a significant role in the perceptions of students toward an advisory program
and toward belong at school.
As with the findings of the current study, Van Ornum (2014) found that the
advisees perceived that an advisory program supported the formation of positive student
relationships with adults in the school and the effective development of post-secondary
school plans. In addition, Van Ornum (2014) also found that advisory students perceived
their advisory teachers to value student ideas, to help with personal issues, and to be
dependable. The current study confirmed the findings of Van Ornum (2014) because
students who reported more connectedness with an advisory teacher also reported more
excitement about going to advisory class, more eagerness about participating in advisory
class, more interest in the lessons from advisory class, and more usefulness in the ideas
from advisory class.
Student perceptions toward the intended outcomes of an advisory program.
Fuschillo (2018) reported that, although the American School Counselor Association
recommended student-to-counselor ratio is 250-to-1, the ratio was actually 482-to-1.
Because of these numbers, some responsibilities traditionally assigned to school
counselors have been outsourced to teachers (Great Schools Partnership, 2015).
148
Advisory programs have been tasked with providing academic interventions, delivering
social-emotional supports, facilitating college and college planning, and promoting
school participation and civic engagement (Great Schools Partnership, 2015). Driven by
studies like those conducted by Achieve (2015), ACT (2013), Bishop (2010), Conley
(2015), Fullan et al. (2017), Levinson (2012), Levy and Cannon (2016), Mehta and Fine
(2015), Trilling and Fadel (2009), World Economic Forum (2016), and Zlab (2019),
schools have sought a vehicle to deliver personalized post-secondary planning and
interpersonal skill development. In regard to this context about the intended outcomes of
an advisory program, the current study results included one key finding on student
perceptions toward the usefulness of an advisory program for college and/career plans.
The researcher of the current study found that freshman students responded more strongly
than senior students about the usefulness of advisory class for college and/or career plans.
This finding may be attributed to the curriculum being new to freshman students as well
as freshman students having senior mentors in their advisory class.
Besides the current study’s findings on student perceptions toward the usefulness
of an advisory program for college and/or career plans, the current study also reported
findings on student perceptions toward the usefulness of an advisory program for social
and emotional development. The researcher of the current study found that Hispanic or
Latino students and Black or African-American students responded more strongly than
White students about the usefulness of an advisory program for social and emotional
development. In addition, Hispanic or Latino students responded more strongly than
White students about the usefulness of advisory class for college and/career plans.
Finally, students who reported their grades as D/F responded more strongly than students

149
who reported their grades A about the usefulness of an advisory program for social and
emotional development. These findings of the current study indicate the potential of an
advisory program in helping minority populations and at-risk students with post-
secondary success and social-emotional learning.
These findings of the current study are also important because the district of the
large, diverse, midwestern, suburban, public high school of the current study had
implemented a new strategic plan at the time of the current study which included a stated
goal of an equitable and inclusive culture. The district also had invested money in deep
equity training for all district staff members. The findings of the current study related to
Hispanic or Latino students and Black or African-American students indicate that an
advisory program has a role to play in the action steps of the district strategic plan. The
findings of the current study extend Bergin and Bergin (2009), who discussed the role of
attachment in promoting social-emotional wellbeing and reducing negative behavioral
outcomes. The findings also extend Yonezawa et al. (2012), who sought evidence of the
impact of personalization programs for low-income and minority students in high school
contexts. Yonezawa et al. (2012) and Bergin and Bergin (2009) focused on teacher
behaviors to promote this sense of student wellbeing and school attachment, which the
current study addressed in the finding that students who responded more strongly about
their connectedness toward an advisory teacher also responded more strongly about their
connectedness with an advisory program. In addition, students who responded more
strongly about their connectedness toward an advisory teacher also responded more
strongly about their belonging at school.

150
Conclusions
This section provides conclusions from the current study on student perceptions
toward an advisory program at a public high school. Implications for action and
recommendations for further research are included. This section ends with concluding
remarks.
Implications for action. The results of the current study have implications for the
implementation, evaluation, and improvement of a high school advisory program.
Through the descriptive research design, which “allows researchers to examine what the
“phenomena look like from the perspective of…the participants in the research,” this
research study revealed the perceptions of a key stakeholder of an advisory program—the
student, the consumer, the end user of the advisory curriculum and its intended outcomes
(Lunenburg & Irby, 2008, p. 31). The data from the current study could be used to
enhance the product delivered to students in order to maximize the impact and efficacy of
an advisory program. Based on the data from the current study, the researcher would like
to focus on two main implications for action.
In order to address the two main implications for action, a first key step should be
taken. The quantitative data of the current study, which provides insight into student
perceptions toward an advisory program and its intended outcomes, should be
supplemented with qualitative data from stakeholder surveys and student committees.
Ayasse and Stone (2015) argued that for social work services to be systemic and
sustainable, funding must be aligned with community need. This essential input was not
part of the implementation of the advisory program in the current study. In fact, none of
the literature reviewed for the current study mentioned the use of a student committee to

151
select and evaluate advisory lessons. A committee of students, which is representative of
the school demographics, should be given the opportunity to submit and evaluate ideas
for advisory lessons. The lessons should continue to be differentiated by grade level to
maximize responsiveness and relevance to grade level concerns and focuses. Each lesson
could be individually evaluated at the end of advisory class through an online survey or
exit ticket, which would allow the advisory committee or building leadership team to
maintain, revise, or delete lessons from year to year. Besides creating systems for student
input on advisory lessons, schools also could leverage their parent community through
electronic surveys and site council meetings to evaluate the content of the advisory
lessons. In short, students and parents should play a role and have a voice in the
implementation of an advisory program in order to improve the perception of an advisory
program and the intended outcomes of an advisory program.
In regard to the findings of the current study related to school participation and
civic engagement—two of the intended outcomes of an advisory program—the current
study indicated a relevant finding, which establishes the first implication for action.
According to the data from the current study, female and male students responded more
strongly than students who reported their gender as other about the importance of their
participation in school athletics or activities. In addition, female students responded more
strongly than students who reported their gender as other about the importance of their
participation volunteer work or community service. The findings indicate that students
who reported their gender as other responded less strongly about the school participation
and civic engagement intended outcomes of an advisory program. To address this issue,
Weilbacher and Lainer (2012) found that smaller groups facilitated communication,

152
openness, and trust. Their study also found that students were more likely to be authentic
with a teacher of the same gender. School districts should consider the inclusion of safe
spaces during an advisory class for students who reported their gender as other. This
population, which includes students who describe themselves as non-binary or prefer to
self-describe, is especially vulnerable for mental health issues and suicide attempts.
Haas, Rodgers, and Herman (2014) reported that the suicide attempts among transgender
people is 41%, which is almost nine times the suicide attempts among the general
population in the United States. Because this community is particularly vulnerable for
mental health issues, schools should consider the creation of opportunities for
inclusiveness by providing a sense of place for students who reported their gender as
other.
In addition to addressing the school participation and community engagement of
students who reported their gender as other, districts also must address the paradox that
exists in the student categories of ethnicity and self-reported grades. Despite the positive
findings related to the perceptions of minority students and academically at-risk students
toward the usefulness of an advisory program for social and emotional development, the
overall picture of an advisory program is complicated. Although Hispanic or Latino
students responded more strongly than White students about the usefulness of an advisory
program for college and/or career plans and the usefulness of an advisory program for
social and emotional development, White students responded more strongly than
Hispanic or Latino students about the importance of their participation in school athletics
or activities. Similarly, students who reported their grades as D/F responded more
strongly than students who reported their grades as A about their excitement about going

153
to advisory class, their eagerness in participating in advisory class, and their interest in
the lessons from advisory class. On the other hand, students who reported their grades as
A responded more strongly than students who reported their grades as D/F about the
importance of their participation in volunteer work or community service. While
Hispanic or Latino students and students who reported their grades as D/F responded
more strongly about the social and emotional intended outcomes of an advisory program,
White students and students who reported their grades as A felt more strongly about the
school participation and civic engagement intended outcomes.
The challenge for school districts looking to implement or improve an advisory
program is two-fold: How does a school improve the school participation and civic
engagement of Hispanic students and academically at-risk students who find more value
in an advisory program while simultaneously improving the connection with an advisory
program for White students and students who report their grades as A who find more
value in school participation and civic engagement? It is a challenge that would best be
addressed at a local level through the use of student surveys and student committees as
recommended at the start of this section.
Besides these two key implications for action, districts should consider two other
findings from the current study which may guide the successful implementation or
improvement of an advisory program. Because freshman students responded more
strongly than senior students about the importance of an advisory program for college
and/or career plans, a freshman advisory program appears to have value for academic and
post-secondary planning. The high school of the current study incorporated student
mentors into its freshmen advisory classes, and so districts may want to explore the use of
154
student mentors as a way of making individualized CCR planning relevant and
meaningful for freshman students. In addition to the finding related to freshman students,
sophomore students responded more strongly than senior students about their excitement
in going to advisory class. Because of these two findings in the current study in which
seniors responded less strongly than freshman students and sophomore students in two
measures of connectedness with an advisory program, districts may want to explore
alternative or flexible advisory program options for senior students.
Lastly, given the finding from the current study that students who responded with
more connectedness with an advisory teacher also responded with more connectedness
with an advisory program and with more belonging at school, districts should recognize
the importance of an advisory teacher to the success of an advisory program and in the
promotion of school belonging. To build urgency at the onset of an advisory program or
to maintain fidelity throughout an advisory program, districts should create positive
messaging about the importance of the teacher in the success of an advisory program.
This positive messaging may sustain the mission and morale of advisory teachers who are
the deliverers of the content and the builders of the relationships in an advisory program.
Recommendations for future research. While the current study focused on
student perceptions toward an advisory program, more research on teacher perceptions
toward an advisory program is recommended. With the emerging research on secondary
trauma in teachers, such as that conducted by Alisic (2012) and Borntrager et al. (2012),
future studies should examine the impact of the teaching of social-emotional learning on
teacher’s own social-emotional wellbeing. The responsibility of teachers for not only the
155
academic achievement of students but for the interpersonal skills, character development,
and civic engagement of students could impact the mental health of teachers.
Similarly, the issue of initial teacher training and ongoing professional
development is also recommended for future study. The researcher of the current study
found that an advisory teacher plays a significant role in student perceptions toward an
advisory program and toward belonging at school. Therefore, the more confident and
competent the teacher, the more connected the student. Teachers must be equipped to
succeed in the dynamic and challenging role as an advisory teacher through initial
training and ongoing professional development. Jordan (2015) and Ornam (2014) found
that teachers needed more training in order to feel confident and competent in handling
sensitive topics and personal issues with students. Solimene (2012) suggested that
challenges in scheduling classes, in creating resources, and in offering professional
development must be anticipated by district and building leadership if an advisory
program is to be successful. Ayasse and Stone (2015) found that for social work services
to be systemic and sustainable, funding must be aligned with a community needs survey
and district data-based decision-making and must include the delivery of preservice
training and ongoing professional learning for district staff. If advisory teachers—the
frontline delivery system of an advisory program—are struggling with preparing advisory
lessons on top of their core courses and are stressed by discussing sensitive topics for
which they may not feel comfortable or prepared, school districts may experience a lack
of fidelity with advisory and a rise in burnout with teachers. As Greenberg, Putnam, and
Walsh (2014) reported in a National Council on Teacher Quality publication, teachers
indicated their preparation experiences did not sufficiently empower them with the skill
156
sets needed to meet the behavioral and social-emotional needs of students, which is
important perception data because the absence of adequate classroom management skills
is one of the main reasons teachers leave the field.
In addition, more studies should be conducted to examine the impact of an
advisory program on student academic achievement by comparing indicators of academic
achievement before and after the implementation of an advisory program. These pre and
post indicators could include graduation rates as well as test scores from standardized
exams, such as graduation rates, state assessments, ACT exams, and Advanced
Placement exams. These measurements before and after the implementation of an
advisory program should not be limited to academics. Indicators of social and emotional
wellbeing, such as attendance rates and suspension rates, should be studied as well. More
study of the academic benefits of an advisory program should be conducted because, in
addition to the current study’s data on student perceptions toward an advisory program as
disaggregated by self-reported grades, Gard (2014) found no significant academic
improvement due to the implementation of an advisory program. Galassi et al. (2004)
also reported on the lack of empirical evidence in the academic effectiveness of advisory
programs. Demaray and Malecki (2002) found no significant relationships between
teacher support or school support and maladjustment indicators. The findings of
Demaray and Malecki (2002) are relevant to future research because the advisory
program of the current study, like the advisory program in Demaray and Malecki’s
(2002) study, was designed to provide a small, stable cohort of students to travel through
high school together in order to foster not only positive attachment with an advisory
157
teacher, but also positive attachment with advisory peers and, by extension, with the
school itself.
Besides analyzing the perceptions related to an advisory program through
quantitative measures, perceptions toward an advisory program should be studied through
qualitative measures. Future studies should include observations and interviews to better
understand the motivations for student and teacher perceptions toward an advisory
program, especially toward the key topics of the implications for action section—
increasing minority and academically at-risk student participation, enhancing school
belonging for students who report their gender as other, and improving advisory teacher
preparation programs. Larger, more comprehensive studies are required to achieve a
more accurate and refined understanding of those who are required to deliver and
consume an advisory program curriculum. In addition, more qualitative studies could be
conducted with stakeholders, including owners of local businesses and providers of
community services, to measure the impact of an advisory program.
Finally, more research could be conducted on the most effective structure for an
advisory program. The advisory class of this study utilized a thirty-minute, once-per-
week delivery model. The advisory class was partnered with a seminar class as part of
triangulated system with the core academic classes to deliver a tiered system of
responsive interventions both academically and behaviorally within the school day to
guarantee high level of learning for all students. However, some schools have
implemented other delivery models, including zero hours at the start or end of a day,
which typically serve as a daily academic advisory period, as well as power hours during
lunch, which typically offer more autonomy and flexibility for students to self-select
158
where they wish to go for academic remediation or extension. More research on the
scheduling of an advisory program could provide insights into which time of day and
what type of structure is associated with the most positive outcomes.
Concluding remarks. With more responsibilities beyond academics delegated to
schools by government agencies, corporate interests, philanthropic organizations, and
community stakeholders, more districts have sought solutions through embedded,
responsive, and systemic interventions. Advisory programs have the potential of being a
high leverage tool to deliver curriculum to improve CCR and SEL. However, to do so
successfully, guiding coalitions must create a sense of urgency to justify the
implementation of such a program. The guiding coalition of influential building leaders
must identify with data the gaps and needs which an advisory program will address. A
system, such as an advisory committee or building leadership team, must be established
to provide ongoing support for and to analyze current data from an advisory program.
Students and stakeholders should have a voice in an advisory program through surveys in
order to select and vet advisory lessons in initial stages and ongoing iterations of an
advisory program. As part of this ongoing lesson design, the guiding coalition should
evaluate best practices for engaging students, especially in the area of social and
emotional development. In addition, more attention must be focused on connecting
Hispanic or Latino students and students who reported their gender as other to school and
community.
For teachers to feel confident and competent in their delivery of an advisory
curriculum, teachers must receive appropriate professional development at the onset and
throughout the duration of an advisory program. The professional development should
159
be responsive and differentiated by the level of attitude and aptitude, experience and
expertise of each teacher in the areas of college and career readiness and social-emotional
learning. The empowerment of teachers is imperative because they have the power to
influence student perceptions toward an advisory program and toward belonging at
school.
Through a guiding coalition to establish the exigency, a student and stakeholder
committee to evaluate the lessons, and a professional development system to enhance
teacher efficacy, an advisory program has the potential of being an effective
transformative agent for student outcomes and school culture, pushing education closer to
a realization of the vision inherent in the Social-Emotional Learning, the 21st Century
Skills, and the deeper learning movements.
160
References
Achieve. (2015, April). Rising to the challenge: Views on high school graduates’
preparedness for college and careers. Retrieved from
https://www.achieve.org/files/AchieveSurveyIIPowerPoint.pdf
Achieve. (2019, March 13). College and career readiness. Retrieved from
https://www.achieve.org/college-and-career-readiness
ACT. (2013, February). Readiness matters: The impact of college readiness on college
persistence and degree completion. Retrieved from
https://www.act.org/content/dam/act/unsecured/documents/Readiness-Matters.pdf
Advance CTE. (2019, March 12). Programs of study. Retrieved from
https://careertech.org/programs-study
Alisic, E. (2012). Teachers’ perspectives on providing support to children after trauma: A
qualitative study. School Psychology Quarterly, 27(1), 51-59.
doi:10.1037/a0028590
Artino, A. R., Jr., Gehlbach, H., & Durning, S. J. (2011). AM last page: Avoiding five
common pitfalls of survey design. Academic Medicine: Journal of The
Association of American Medical Colleges, 86(10), 1327.
doi:10.1097/ACM.0b013e31822f77cc
Association for Supervision and Curriculum Development. (2020). Whole child.
Retrieved from http://www.ascd.org/whole-child.aspx
Ayasse, R. H., & Stone, S. I. (2015, July 24). The evolution of school social work
services in an urban school district. Children & Schools, 37(4), 215-222.
doi:10.1093/cs/cdv025

161
Ayers, L. R. (1994). Middle school advisory programs: Findings from the field. Middle
School Journal, 25(3), 8-14. doi:10.1080/00940771.1994.11494540
Bergin, C. & Bergin, D. (2009, June). Attachment in the classroom. Educational
Psychology Review, 21(2), 141-170. doi:10.1007/s10648-009-9104-0
Bishop, J. (2010). Partnership for 21st century skills (P21). Presentation to the Institute of
Museum and Library Services (IMLS).
Borntrager, C., Caringi, J. C., Van Den Pol, R., Crosby, L., O’Connell, K., Trautman, A.,
& McDonald, M. (2012, March 13). Secondary traumatic stress in school
personnel. Advances in Mental Health Promotion, 5(1), 38-50.
doi:10.1080/1754730X.2012.664862
Botvin, G. J., Griffin, K. W., & Nichols, T. D. (2006). Preventing youth violence and
delinquency through a universal school-based prevention approach. Prevention
Science, 7(4), 403-408. doi: 10.1007/s11121-006-0057-y
Centers for Disease Control and Prevention. (2017, August 4). QuickStats: Suicide rates
for teens aged 15-19 years, by sex—United States, 1975-2015. Morbidity and
Mortality Weekly Report, 66(30), 816. Retrieved from
https://www.cdc.gov/mmwr/volumes/66/wr/mm6630a6.htm
Collaborative for Academic, Social, and Emotional Learning. (2019a, March 11).
Collaborating states initiative. Retrieved from https://casel.org/collaborative-
state-initiative/
Collaborative for Academic, Social, and Emotional Learning. (2019b, March 13). What is
SEL? Retrieved from https://casel.org/what-is-sel/

162
College Board. (2014). Research foundations: Empirical foundations for college and
career readiness. Retrieved from
https://collegereadiness.collegeboard.org/pdf/research-foundations-college-career-
readiness.pdf
Conley, D. T. (2015). A new era for educational assessment. Education Policy Analysis
Archives, 23(8). doi:10.14507/epaa.v23.1983
Cornell Law School. (2019, March 13). Local education agency. Retrieved from
https://www.law.cornell.edu/cfr/text/34/303.23
Creswell, J. W., & Creswell, J. D. (2018). Research design: Qualitative, quantitative, and
mixed methods approaches. Los Angeles, CA: Sage.
Cuevas, E. (2018, June 27). Career and technical education overhaul advances in
Congress. Retrieved from https://www.jff.org/points-of-view/career-and-
technical-education-overhaul-advances-congress/=
Curtin, S. C., Warner, M., & Hedegaard, H. (2016, April). Increase in suicide in the
United States, 1999-2014. NCHS Data Brief, 241, 1-8. Retrieved from
https://www.ncbi.nlm.nih.gov/pubmed/27111185
Darling-Hammond, L., Ancess, J, & Ort, S.W. (2002, January 1). Reinventing high
school: Outcomes of the Coalition Campus Schools Project. American
Educational Research Journal, 39(3), 639-673.
Demaray, M. K., & Malecki, C. K. (2002). The relationship between perceived social
support and maladjustment for students at risk. Psychology in the Schools, 39(3),
305-316. doi: 10.1002/pits.10018

163
Dillman, D. A., Smyth, J. D., & Christian, L. M. (2014). Internet, phone, mail, and
mixed-mode surveys: The tailored design method (4th edition. ed.). Wiley.
DuFour, R., & Marzano, R. J. (2011). Leaders of learning: How district, school, and
classroom leaders improve student achievement. Bloomington, IN: Solution Tree
Press.
Durlak, J. A., Weissberg, R. P., Dymnicki, A. B., Taylor, R. D., & Schellinger, K. B.
(2011, January/February). The impact of enhancing students’ social and
emotional learning: A meta-analysis of school-based universal interventions.
Child Development, 82(1), 405-432. doi:10.1111/j.1467-8624.2010.01564.x
Fullan, M., Quinn, J. & McEachen, J. (2017, April). Deep learning: Shaking the
foundations. Retrieved from https://www.npdl.global/wpcontent/uploads/2017/07
/DL-shaking-the-foundation.pdf
Fuschillo, A. (2018, August 14). The troubling student-to-counselor ratio that doesn’t add
up. Education Week. Retrieved from
https://www.edweek.org/ew/articles/2018/08/14/the-troubling-student-to-
counselor-ratio-that-doesnt-add.html?cmp=eml-enl-eu-
news1&M=58578827&U=1001093
Galassi, J. P., Gulledge, S. A., & Cox, N. D. (2004). Advisory. Westerville, OH: National
Middle School Association.
Gandara, P. (2015). Fulfilling America’s future: Latinas in the U.S., 2015.
Retrieved from https://www.civilrightsproject.ucla.edu/research/college-
access/underrepresented-students/fulfilling-america2019s-future-latinas-in-the-
u.s.-2015/Fulfilling-Americas-Future-Latinas-in-the-US-2015.pdf

164
Gard, M. (2014). Are academic advisory periods having an effect in a large urban
southwest high school? (Doctoral Dissertation). Retrieved from
https://repository.asu.edu/attachments/135077/content/Gard_asu_0010E_13914.p
df
Gehlbach, H., & Brinkworth, M. E. (2011). Measure twice, cut down error: A process for
enhancing the validity of survey scales. Review of General Psychology, 15(4),
380-387. doi:10.1037/a0025704
George Lucas Education Foundation. (n.d.). Advisory. Retrieved from
https://www.edutopia.org/topic/advisory
Great Schools Partnership. (2015, December 4). Advisory. The Glossary of Educational
Reform. Retrieved from https://www.edglossary.org/advisory/
Great Schools Partnership. (2016, August 25). 21st century skills. The Glossary of
Education Reform. Retrieved from https://www.edglossary.org/21st-century-
skills/
Greenberg, J., Putman, H., & Walsh, K. (2014, January). Training our future teachers:
Classroom management. Retrieved from
https://files.eric.ed.gov/fulltext/ED556312.pdf
Haas, A. P., Rodgers, P. L., & Herman, J. L. (2014, January). Suicide attempts among
transgender and gender non-conforming adults. Retrieved from
https://williamsinstitute.law.ucla.edu/wp-content/uploads/AFSP-Williams-
Suicide-Report-Final.pdf

165
Hertz, M. B. (2016, August 8). Student centered advisory: Establishing a positive
community. Retrieved from https://www.edutopia.org/blog/student-centered-
advisory-positive-community-mary-beth-hertz
Jobs for the Future. (2018). Our research at work. Retrieved from
https://www.jff.org/resources/page/1/
Jordan, B. (2015, Summer). An evaluation of a secondary student advisement program
(Doctoral dissertation). Retrieved from
http://citeseerx.ist.psu.edu/viewdoc/download?doi=10.1.1.850.1290&rep=rep1&t
ype=pdf
Kansas State Department of Education. (2012, April 17). Kansas social, emotional,
character development model standards. Retrieved from
https://www.ksde.org/Portals/0/CSAS/Content%20Area%20(M-
Z)/School%20Counseling/Soc_Emot_Char_Dev/SECD%20FINAL.pdf
Kansas State Department of Education. (2018a). Individual plan of study: An overview
for families. Retrieved from
https://www.ksde.org/Portals/0/CSAS/CSAS%20Home/Plan_Of_Study/Family%
20IPS%20Resource.pdf?ver=2016-09-15-160508-253
Kansas State Department of Education. (2018b). Individual plans of study for Kansas
students. Retrieved from
https://www.ksde.org/Portals/0/CSAS/CSAS%20Home/Plan_Of_Study/Kansas%
20Individual%20Plans%20Narrative%202014.pdf?ver=2014-02-28-165106-090

166
Kansas State Department of Education. (2018c, August 31). Kansas State Department of
Education roadshow: Social-emotional character development. Retrieved from
https://padlet.com/ksvision/secd
Kansas State Department of Education. (2018d). Report card 20016-2017. Retrieved
from https://ksreportcard.ksde.org/home.aspx?org_no=D0512&bldg_
no=8892&rptType=1
Kansas State Department of Education. (2018e, January). Kansas’ ESSA plan approved
by U. S. Department of Education. Retrieved from
http://www.ksde.org/Home/Quick-Links/News-Room/kansas-essa-plan-approved-
by-us-department-of-education
Kansas State Department of Education. (2018f). Kansas social, emotional, and character
development (SECD) standards.” Retrieved from
http://www.ksde.org/Portals/0/Learning%20Services%20Documents/Fact%20She
ets/Social,%20Emotional,%20and%20Charcter%20Development%20Standards.p
df.
Kansas State Department of Education. (2018g). Kansas vision for education. Retrieved
from http://www.ksde.org/Agency/Fiscal-and-Administrative-
Services/Communications-and-Recognition-Programs/Vision-Kansans-Can
Kansas State Department of Education. (2018h). Kansas career advising model: Advisor
guide. Retrieved from
https://www.ksde.org/Portals/0/CSAS/CSAS%20Home/Plan_Of_Study/Kansas%
20Career%20Advising%20Model.pdf?ver=2019-01-04-124858-667

167
Kansas State High School Activities Association. (2019). 2019-2020 classifications and
enrollments. Retrieved from
http://www.kshsaa.org/Public/General/Classifications.cfm
Keegan, C. (2019, August 9). Zero Reasons Why suicide prevention campaign hopes to
expand in school year. Retrieved from https://www.kshb.com/news/local-
news/zero-reasons-why-suicide-prevention-campaign-hopes-to-expand-in-new-
school-year
Kemble, J. J. (2008). Career academies: Long-term impacts on labor market outcomes,
education attainment, and transitions to adulthood. New York, NY: MDRC.
Lane, K. L., Oakes, W. P., Crocker, J., & Weist, M. D. (2017, Fall). Building strong
partnerships: Education and mental health systems working together to advance
behavioral health screening in schools. Report on Emotional & Behavioral
Disorders in Youth, 17(4), 93-101. Retrieved from
https://www.ncbi.nlm.nih.gov/pmc/articles/PMC6075829/
Larose, S., Bernier, A., & Tarabulsy, G. (2005). Attachment state of mind, learning
dispositions, and academic performance during the college transition.
Developmental Psychology, 41(1), 281–289. doi:10.1037/0012-1649.41.1.281
Legters, N., Balfanz, R., & McPartland, J. (2002, March 1). Solutions for failing high
schools: Converging visions and promising models. Retrieved from
https://pdfs.semanticscholar.org/9d50/6c85ee7b12e9f32633c646b5f83333a38c81.
pdf?_ga=2.160182077.1609220815.1579895103-1913315550.1579895103
Levine, P., & Kawashima-Ginsberg, K. (2015, February). Civic education and deeper
learning. Retrieved from https://files.eric.ed.gov/fulltext/ED559676.pdf

168
Levinson, M. (2012). No citizen left behind. Cambridge, MA: Harvard University Press.
Levy, F., & Cannon, C. (2016, February). The Bloomberg job skills reports 2016: What
recruiters want. Retrieved from https://www.bloomberg.com/graphics/2016-job-
skills-report/
Lunenburg, F. C., & Irby, B. J. (2008). Writing a successful thesis or dissertation: Tips
and strategies for students in the social and behavioral science. Thousand Oaks,
CA: Corwin Press.
MacIver, D. J. (1990, February). Meeting the needs of young adolescents: Advisory
groups, interdisciplinary teaching teams, and social transition programs. The Phi
Delta Kappan, 71(6), 458-464. https://www.jstor.org/stable/20404181
Manning, M., & Saddlemire, R. (1996). Implementing middle school concepts into high
schools. The Clearing House, 69(6), 339-342. Retrieved from
www.jstor.org/stable/30189209
Mattos, M. (2018). Creating flexible time worksheet. Retrieved from
http://mattos.info/Support_Materials_files/Pioneer%20Tutorial%20Materials.pdf
McClure, L., Yonezawa, S., & Jones, M. (2010). Can school structures improve teacher-
student relationships? The relationship between advisory programs,
personalization and students’ academic achievement. Education Policy Analysis
Archives, 18(17), 1-17. doi:10.14507/epaa.v18n17.2010
McFarland, M. (2017, February 21). UPS drives may tag team deliveries with drones.
CNN. Retrieved from https://money.cnn.com/2017/02/21/technology/ups-drone-
delivery/index.html
169
Mehta, J., & Fine, S. (2015, December). The why, what, where, and how of deeper
learning in American secondary schools. Retrieved from
https://studentsatthecenterhub.org/wp-content/uploads/2010/01/The-Why-What-
Where-How-121415.pdf
Meloro, P. (2005). Do high school advisory programs promote personalization?
Correlates of school belonging (Doctoral dissertation). Retrieved from
https://digitalcommons.uri.edu/dissertations/AAI3188841/
Merikangas, K. R., He, J., Burstein, M. B., Swanson, S. A., Avenevoli, S., Cui, L.,
Benjet, C.,…Swendsen, J. (2010, October). Lifetime prevalence of mental
disorders in U.S. adolescents: Results from the National Comorbidity Survey
Replication-Adolescent Supplement (NCS-A). Journal of the American Academy
of Child & Adolescent Psychiatry, 49(10), 980-989.
doi:10.1016/j.jaac.2010.05.017
Mizelle, N. B., & Irvin, J. L. (2015, September). Transition from middle school into high
school. Middle School Journal, 31(5), 57-61.
doi:10.1080/00940771.2000.11494654
Montague, M. Enders, C. Cavendish, W., & Castro, M. (2011). Academic and
behavioral trajectories for at-risk adolescents in urban schools. Behavioral
Disorders, 36(2), 141-156. doi:10.1177/019874291103600205
National Center for Injury Prevention and Control. (n.d.). Suicide prevention: A public
health issue. Retrieved from
https://www.cdc.gov/violenceprevention/pdf/asap_suicide_issue2-a.pdf
170
National Education Association. (2020, January 23). Partnership for 21st century skills.
Retrieved from http://www.nea.org/home/34888.htm
National Institute of Mental Health. (2019, February 1). Major depression. Retrieved
from https://www.nimh.nih.gov/health/statistics/major-depression.shtml
Panorama Education. (2015). Validity brief: Panorama student survey. Retrieved from
https://go.panoramaed.com/hubfs/Panorama_January2019%20/Docs/validity-
brief.pdf
Panorama Education. (2018). User guide: Panorama student survey. Retrieved from
https://www.panoramaed.com/panorama-student-survey
Pankake, A., & Littleton, M. (2012). The administration & supervision of special
programs in education. Dubuque, IA: Kendall/Hunt Publishing. \
Pellegrino, J. W., & Hilton, M. L. (2012). Education for life and work: Developing
transferable knowledge and skills in the 21st century. Retrieved from
https://hewlett.org/wpcontent/uploads/2016/08/Education_for_
Life_and_Work.pdf
Plemmons, G., Hall, M., Doupnik, S., Gay, J., Brown, C., Browning, W., …Williams, D.
(2018, June). Hospitalization for suicide ideation or attempt: 2008-2015.
Pediatrics, 141(6). doi:10.1542/peds.2017-2426
Pressman School District. (2018). Data gallery notebook. Shawnee Mission, KS:
Pressman School District.
Pressman School District. (2019). Advisory. Retrieved from https://smsdolc.org/advisory/

171
Roberts, C. (2010). The dissertation journey: A practical and comprehensive guide to
planning, writing, and defending your dissertation. Thousand Oaks, CA: Corwin
Press.
Rosin, H. (2010, December). New data on the rise of women [Video file]. Retrieved
from https://www.ted.com/talks/hanna_rosin_new_data_on_the_rise_of_women?
language=en
RTI Action Network. (2019, March 13). What is RTI? Retrieved from
http://www.rtinetwork.org/learn/what/whatisrti
Ryerse, M., Schneider, C., & Vander Ark, T. (2014). Core & more: Guiding and
personalizing college & career readiness. Retrieved from
http://digitallearningnow.com/site/uploads/2014/05/FINAL-Smart-Series-Core-
and-More-Guidance.pdf
Shorman, J. (2019, September 25). Kansas youth suicide increased by 50 percent in one
year, report says. The Wichita Eagle. Retrieved from
https://www.kansas.com/news/politics-government/article235477917.html
Shulkind, S. B., & Foote, J. (2009, September). Creating a culture of connectedness
through middle school advisory programs. Middle School Journal, 41(1), 20-27.
doi:10.1080/00940771.2009.11461700
Solimene, D. N. (2012). Implementing a student advisory program for ninth graders:
Two high school models in action (Doctoral dissertation). Retrieved from the
ProQuest Dissertations & Theses Global: The Humanities and Social Sciences
Collection. (UMI Number 3517905)

172
Solution Tree. (2020). About Solution Tree. Retrieved from
https://www.solutiontree.com/about/overview
Swick, D., & Powers, J. D. (2018). Increasing access to care by delivering mental health
services in schools: The school-based support program. School Community
Journal, 28(1), 129-144.
Taylor, R. D., Durlak, J. A., Oberle, E., & Weissberg, R. P. (2017, July/August).
Promoting positive youth development through school-based social and emotional
learning interventions: A meta-analysis of follow-up effects. Child Development,
88(4), 1156-1171. doi:10.1111/cdev.12864
Teaching Channel. (n.d.). Advisory: Check-in and support. Retrieved from
https://www.teachingchannel.org/video/benefits-of-advisory-
eed?notebook_code=MmhX6CX6t4vW9vDnN1MG&tab=1
Trilling, B., & Fadel, C. (2009). 21st century skills: Learning for life in our times. San
Francisco, CA, US: Jossey-Bass.
Twenge, J. M., Cooper, A. B., Joiner, T. E., Duffy, M. E. & Binau, S. G. (2019). Age,
period, and cohort trends in mood disorder indicators and suicide-related
outcomes in a nationally representative dataset, 2005-2007. Journal of Abnormal
Psychology, 128(3), 185-199. doi:10.1037/abn0000410
Vander Ark, T. (2015, April 21). The role of advisory in personalizing the secondary
experience. Retrieved from https://www.gettingsmart.com/2015/04/the-role-of-
advisory-in-personalizing-the-secondary-experience/
173
Vander Ark, T., & Schneider, C. (2013). Deeper learning for every student every day.
Retrieved from https://www.gettingsmart.com/wpcontent/uploads/2013/
12/DLForEveryStudent_FINAL.pdf
Van Ornum, J. W. (2014). Evaluation and improvement of an advisory program.
Retrieved from http://scholarworks.waldenu.edu/cgi/viewcontent.cgi?
article=1170&context=dissertations
Van Ryzin, M. J. (2011). Protective factors at school: Reciprocal effects among
adolescents’ perceptions of the school environment, engagement in learning, and
hope. Journal of Adolescence, 40(12), 1568-1580. doi: 10.1007/s10964-011-
9637-7
Wagner, M., & Newman, L. (2015, July 15). Longitudinal post-high school outcomes of
young adults with learning disabilities or emotional/behavioral disorders.
Transition of Youth and Young Adults, 28, 31-61. doi:10.1108/S0735-
004X20150000028003
Waters, R. (2019, May 23). California surgeon general puts spotlight on childhood
trauma. Retrieved from https://www.chcf.org/blog/california-surgeon-general-
puts-spotlight-on-childhood-trauma/
Webber, V. (2018, February 28). What impact will automation have on our future
society? Here are four possible scenarios. Retrieved from
https://www.weforum.org/agenda/2018/02/what-impact-will-automation-have-on-
society-four-scenarios/
Weilbacher, G., & Lanier, J. (2012). An examination of a gender-separate advisory
program. Middle Grades Research Journal, 7(1), 17-35.
174
Wilson, C. (1998, Winter). The real meaning of middle school advisory programs.
Contemporary Education, 69(2), 100.
Wingfield, N. (2017, September 10). As Amazon pushes forward with robots, workers
find new roles. The New York Times. Retrieved from
https://www.nytimes.com/2017/09/10/technology/amazon-robots-workers.html
World Economic Forum. (2016). The future of jobs report. Retrieved from
http://reports.weforum.org/future-of-jobs-2016/
Yonezawa, S., McClure, L., & Jones, M. (2012, April). Personalization in schools: The
students at the center series. Quincy, MA: Nellie Mae Education Foundation.
Ziegler, S., & Mulhall, L. (1994). Establishing and evaluating a successful advisory
program in a middle school. Middle School Journal, 4, 42-46.
doi:10.1080/00940771.1994.11496110
Zlab, J. (2019, June 13). New grads in the working world. Presentation at the Garmin
Educators Summit, Olathe, KS.

175
Appendices

176
Appendix A: Primus High School Bell Schedule

177

178
Appendix B: Response to Intervention (RTI) Pyramid of Interventions
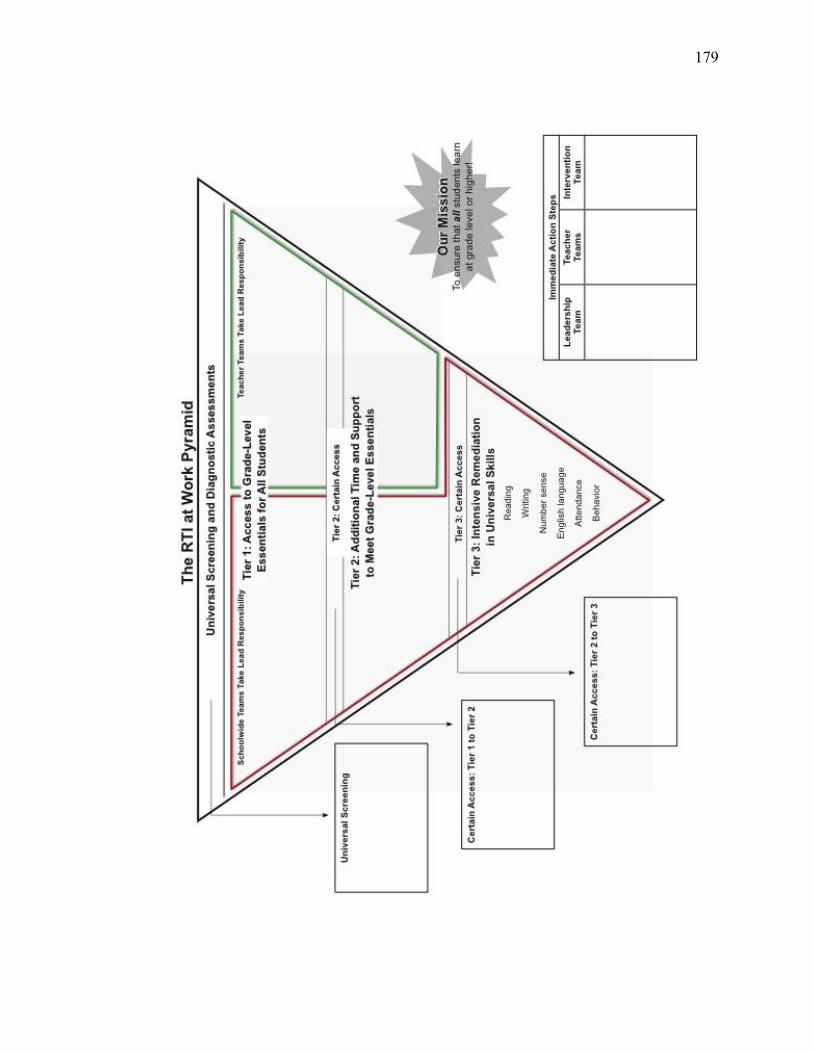
179

180
Appendix C: Mike Mattos Pioneer Middle School Tutorial Schedule

181

182
Appendix D: Student Survey on High School Advisory

183
3/14/2
019Stu
dent Su
rvey o
n High
Schoo
l Advi
sory
https://
docs.g
oogle.c
om/fo
rms/d
/1u0R
S6Gv3s
rMcxH
etNUA
FBISf
1fL1cX
TXUrH
nLx1n
DwU/e
dit1/6
Studen
t Surv
ey on
High
School A
dvisor
yThank you
for participating
in this
student s
urvey on
high scho
ol advisory. Your honest a
nd sin
cere
response
s are much appreciated
and m
ost important to th
e integrity
of the
resea
rch stu
dy. Yo
ur survey
response
s are anonymous. Your participation
is voluntary. You w
ill not b
e requested to
provide
personal
or sen
sitive info
rmatio
n. No
aspect o
f the data
will be m
ade part
of any perm
anent record th
at can
be
identified
with y
ou. Your co
mpletion
of the
survey w
ill indicate y
our perm
ission
to participate in th
e research
study.
You have
the right n
ot to answ
er any questio
n. You have
the right to discontinu
e participation
at any time.
1. 1. W
hat is you
r grad
e level
in sch
ool?
Mark only o
ne oval.
Fresh
man
Sophomore
Junior
Senior
2. 2. W
hat is you
r gend
er?Mark only o
ne oval.
Female
Male
Nonbinary
Prefer to
selfdesc
ribe
Prefer not to say

184
3/14/2019 Student Survey on High School Advisory
https://docs.google.com/forms/d/1u0RS6Gv3srMcxHetNUAFBISf1fL1cXTXUrHnLx1nDwU/edit 2/6
3. 3. What is your ethnicity?Mark only one oval.
Asian / Pacific Islander
Black or African American
Hispanic or Latino
MultiRacial
Native American or American Indian
White
Other
Prefer not to say
4. 4. What grades do you typically earn in school?Mark only one oval.
A
B
C
D
F
5. 5. How important to you is participation in school athletics or activities?Mark only one oval.
Not at all important
Slightly important
Somewhat important
Quite important
Extremely important

185
3/14/2019 Student Survey on High School Advisory
https://docs.google.com/forms/d/1u0RS6Gv3srMcxHetNUAFBISf1fL1cXTXUrHnLx1nDwU/edit 3/6
6. 6. How important to you is participation in volunteer work or community service?Mark only one oval.
Not at all important
Slightly important
Somewhat important
Quite important
Extremely important
7. 7. How excited are you about going to your Advisory class?Mark only one oval.
Not at all excited
Slightly excited
Somewhat excited
Quite excited
Extremely excited
8. 8. How eager are you to participate in your Advisory class?Mark only one oval.
Not at all eager
Slightly eager
Somewhat eager
Quite eager
Extremely eager
9. 9. How interesting do you find the things you learn in your Advisory class?Mark only one oval.
Not at all interesting
Slightly interesting
Somewhat interesting
Quite interesting
Extremely interesting

186
3/14/2019 Student Survey on High School Advisory
https://docs.google.com/forms/d/1u0RS6Gv3srMcxHetNUAFBISf1fL1cXTXUrHnLx1nDwU/edit 4/6
10. 10. How often do you use ideas from your Advisory class in your daily life?Mark only one oval.
Almost never
Once in a while
Sometimes
Frequently
Almost always
11. 11. How often does your Advisory teacher seem excited to be teaching your Advisory class?Mark only one oval.
Almost never
Once in a while
Sometimes
Frequently
Almost always
12. 12. How clearly does your Advisory teacher present the information that you need to learn?Mark only one oval.
Not at all clearly
Slightly clearly
Somewhat clearly
Quite clearly
Extremely clearly
13. 13. How connected do you feel to your Advisory teacher?Mark only one oval.
Not all connected
Slightly connected
Somewhat connected
Quite connected
Extremely connected

187
3/14/2019 Student Survey on High School Advisory
https://docs.google.com/forms/d/1u0RS6Gv3srMcxHetNUAFBISf1fL1cXTXUrHnLx1nDwU/edit 5/6
14. 14. How good is your Advisory teacher at making sure students do not get out of control?Mark only one oval.
Not good at all
Slightly good
Somewhat good
Quite good
Extremely good
15. 15. How much do you feel like you belong at your school?Mark only one oval.
Do not belong at all
Belong a little bit
Belong somewhat
Belong quite a bit
Completely belong
16. 16. How useful is your Advisory class to your future college and/or career plans?Mark only one oval.
Not at all useful
Slightly useful
Somewhat useful
Quite useful
Extremely useful
17. 17. How useful is your Advisory class to your social and emotional development?Mark only one oval.
Not at all useful
Slightly useful
Somewhat useful
Quite useful
Extremely useful

188

189
Appendix E: Email for Survey Approval from Panorama Education

190

191
Appendix F: Pressman School District Permission to Administer Survey

192

193
Appendix G: Baker University IRB Approval Letter
194