Embed Size (px)
Citation preview
i
Students’ production and processing of mathematical explanations
by
Xingyu Pan
A dissertation submitted in partial fulfillment of the requirements for the degree of
Doctor of Philosophy (Education and Psychology) in the University of Michigan
2014
Doctoral Committee:
Professor Kevin F. Miller, Chair Associate Professor Kai S. Cortina Professor Susan A. Gelman Professor Priti R. Shah
ii
Table of Contents
List of tables ............................................................................................................................. iv
List of figures ............................................................................................................................. v
Chapter 1 Literature Review ............................................................................................... 1
1. Background ..................................................................................................................................... 1 1.1 Overarching questions and significance ........................................................................................... 1 1.2 The production and processing of mathematical explanations: a framework .................. 3 1.3 The Mathematical Context ................................................................................................................ 13
2. Research Questions ................................................................................................................... 16
Chapter 2. Students’ production of mathematic explanations through
classroom discourse ............................................................................................................ 21
Research efforts to decipher classroom discourse ............................................................................ 24 Conceptualization of student mathematical explanation in classroom discourse ............... 26 Automated modeling of classroom discourse ..................................................................................... 31 Exploring student production of math explanations in classroom discourse ........................ 32
Method ............................................................................................................................................... 33 Datasets ............................................................................................................................................................ 33 Procedure ......................................................................................................................................................... 34
Results ................................................................................................................................................ 40 1. Reliability of the algorithm .................................................................................................................. 40 2. Utterance-‐level analysis ........................................................................................................................ 44 3. Classroom-‐level analysis ...................................................................................................................... 46
Discussion ......................................................................................................................................... 49 Summary ........................................................................................................................................... 58
Chapter 3 Quality of mathematical explanation generated by Chinese and US
elementary students: The case of mathematical equivalence .............................. 64
Method ............................................................................................................................................... 73
iii
Participants ..................................................................................................................................................... 73 Procedure ......................................................................................................................................................... 74 Coding ................................................................................................................................................................ 75
Results ................................................................................................................................................ 79 Equation solving task ................................................................................................................................... 79 Equation judgment task .............................................................................................................................. 81 Problem posing task ..................................................................................................................................... 84
Discussion ......................................................................................................................................... 84
Chapter 4. Consider the source: Children’s processing of peer and adult
explanations of mathematical equivalence ................................................................. 93
The role of self-‐explanation in learning .............................................................................................. 95 A good explanation is not always the best source for learning ................................................ 96 Can unreliable explanations be beneficial? ....................................................................................... 98 The current study ......................................................................................................................................... 99
Method ............................................................................................................................................. 101 Participants .................................................................................................................................................. 101 Procedure ...................................................................................................................................................... 101 Scoring and Coding ................................................................................................................................... 102
Results .............................................................................................................................................. 104 1. Differences in video evaluation ...................................................................................................... 105 2. Difference in learning outcome ...................................................................................................... 107
Discussion ....................................................................................................................................... 111 Why does the source of the explanation matter? ........................................................................... 112 The link between processing difference and learning outcome ............................................... 114 Role of teachers in eliciting peer explanation and monitoring peer interaction ............... 116
Chapter 5 Closing remarks .............................................................................................. 123
Summary of findings ................................................................................................................... 124 Implications ................................................................................................................................... 127
iv
List of tables
Table 1 Average percentage of problems per lesson with each major- and sub- category
topic area, by country (reproduced from Hiebert et al., 2003, p69) ............................... 34
Table 2. Features identified in each lesson and the rationale for using them ....................... 36
Table 3 Accuracy of classification at utterance level ................................................................... 40
Table 4. Mixed linear model using human code and algorithm predictions ......................... 43
Table 5. Categories of the utterance immediately precedes a student explanation or
non-explanation. .............................................................................................................................. 44
Table 6 Predicting amount of student explanations in 3 countries .......................................... 47
Table 7. Different effectiveness in teacher’s use of questioning to probe student
explanations ...................................................................................................................................... 55
Table 8. Items used in equation solving task ................................................................................... 75
Table 9. Codes used in problem posing ............................................................................................ 78
Table 10. Number of effective and ineffective strategies reported by students .................. 80
Table 11. Children’s reported strategies in equation solving tasks ......................................... 81
Table 12 Accuracy and richness of student explanation in equation judgment .................. 83
Table 13 Accuracy of student explanations in problem posing task ....................................... 83
Table 14. Relationship between critical evaluation of different types of explanations and
pre- & post-test performances .................................................................................................. 108
Table 15. Regression models in predicting students’ post-test scores ................................. 108
v
List of figures
Figure 1 Relationship between machine and human code at classroom level (N=138) ... 42
Figure 2. Words with greatest discrepancy in their frequencies leading an explanation (Nex=3568) and a non-explanation (Nnon=29590) ................................................................ 45
Figure 3. Relationship between classroom features and proportion of S explanations in 3 countries. ............................................................................................................................................ 49
Figure 4 the experiment procedure .................................................................................................. 102
Figure 5. Percentage of students who reported gaps in the explanations ........................... 106
Figure 6. Percentage of information recalled from the video ................................................. 107
Figure 7. Moderation effect of noticing the gap in pre- to post- learning gain. ................ 110
1
Chapter 1
Literature Review
1. Background
1.1 Overarching questions and significance
The longstanding pattern of classroom mathematics discourse is characterized by
the dominance of teachers in classroom discourse and the limited to brief, “fill in the
blank” student responses (e.g., Cazden, 1988; Pinnell & Jaggar, 1991). For example,
Hiebert and Wearne (1993) found that teacher talk ranged from 77% to 91% in their
sample of six classrooms. And Pianta, Belsky, Houts, & Morrison (2007) concluded after
their large scale observational study of more than 1000 classrooms that American
elementary school students have few opportunities to discuss mathematics or do anything
beyond listening to the teacher demonstrate basic skills followed by individual practice.
The same patterns were reported as far back as the start of systematic classroom
observation (e.g. Stevens, 1910; Flanders, 1970).
Despite the prevalence of this pattern of discourse, it differs from what is
recommended both by standards proposed for mathematics education (i.e. NCTM, 2000)
and recommendations drawn from current cognitive research (e.g., Rittle-Johnson, 2006;
Siegler, 2002). NCTM’s (1989, 2002) Standard for Communication stresses the central
role of student communication in mathematics instruction, arguing that instructional
programs should help students to organize and consolidate their mathematical thinking as
well as to analyze and evaluate the thinking and strategies of others. Ball (1991) provided
2
a good discussion of the rationale behind the earlier version of this standard, arguing that
questions such as who talks, how they explain their ideas, and the kinds of evidence that
is encouraged or accepted all are central to defining the nature of classroom mathematics.
Hiebert & Grouws (2007) provided a concise specification of essential features of
effective teacher-student interaction. They concluded that effective mathematical
teaching requires two features: an explicit focus on mathematical concepts, and student
struggle with important mathematics.
This dissertation is aimed at addressing some of the empirical questions that are
raised by this gap between educational practice and the recommendations of educational
standards. I attempted to answer the following three sets of questions:
1) Do US lessons feature fewer student explanations than those of high-achieving
East Asian countries? Do the same factors account for variation in the prevalence of
explanations within each country?
2) Do US and Chinese children differ in the nature and quality of mathematical
explanations they produce?
3) Looking at how students process these explanations, do students listen
differently to explanations from peers and adults? And if so, what implications do these
differences have for how classroom discourse should be structured?
Because classroom discourse leaves no visible trace, it can be difficult for
teachers and students to attend to it. But we can make progress in understanding the
nature and role of student explanations by comparing how explanation-focused student
discourse differs across countries that differ in mathematics achievement, analyzing the
3
quality of explanations, and looking at how students process explanations from peers vs.
adults.
1.2 The production and processing of mathematical explanations: a framework
1.2.1 What counts as a mathematical explanation?
Location of mathematical explanation in the family of explanations
In this project, I will focus on mathematical explanation in teaching and learning
settings. In such settings, mathematical explanations rest at the intersection of two kinds
of activity. The first trajectory consists of the division between common and disciplinary
explanation. And the second consists of the division between instructional and
self-explanations (Leinhardt, 1993). In this sense, mathematical explanations consists
both instructional as well as self explanations, but specific to the discipline of
mathematics, as elaborated in the following:
Common vs Disciplinary explanations. Common explanations occur all of the
time in everyday face-to-face conversation. There is an implicit coordination in the
discussion that suggests the level of detail and content required in the answer. For
example, the expected answer to the question of “why have they set up a detour here?” is
a description of the logic or illogic of the choice (e.g. “Construction work will take place
starting today.”), rather than an elaboration about policy implications of sending traffic
one way or the other. At the other end of the trajectory, disciplinary explanations require
reference to “agreed-upon discussions to date, an adherence to the rules and formalisms
of the discussion in the discipline, and coordinated use of formal and informal
representations” (Leinhardt, 2010). Disciplinary explanations answer questions that are of
value and salience to the discipline. For example, the expected answer to the question of
4
“how do you know the two triangles are identical?” will typically involve the use of
mathematical theorems.
Instructional vs. Self explanation. Instructional explanation, as its name suggests,
aims at teaching and sharing with others. They need to coordinate informal colloquial
familiar forms of language and understanding with more formal disciplinary ones in the
interests of improving learning. In order for an explanation to serve instructional
purposes, the implicit assumptions need to be made explicit, connections between ideas
need to be justified, representations need to be explicitly mapped, and the central query
that guides the explanatory discussion must be identified. On the other hand, self
explanations occur when an individual experiences an interruption in some aspect of
comprehension. By definition, self-explanations are constructed to serve the needs of the
self. Therefore, the language use can be internal, informal, fragmentary, and colloquial.
Usually, the goal of a self-explanation is to link a current piece of information (in a text,
figure, or speech) with an understood self-defined learning goal.
Forms of mathematical explanations
In teaching and learning settings, mathematical explanations typically cover
content about how and why a procedure works or not (Siegler, 2002). A mathematical
explanation can take different forms. For example, Hill, Schilling & Ball (2004)
differentiated 3 forms of a mathematical explanation typically used in teacher’s
instructions: description, explanation, and justifications. Descriptions provide
characterizations of the steps of mathematical procedure or a process, but they do not
necessarily address the meaning or reason for these steps. Explanations give
5
mathematical meaning to ideas or procedures. Justifications include deductive reasoning
about why a procedure works or why something is true or valid in general.
Curriculum standards have also provided an extensive list of kinds of student
explanations. Specifically, they include self explanations to make sense of problems,
communications to others regarding one’s own stances, as well as their reasoning and
sense making of other’s solutions (Common Core Standards of Mathematics, 2010).
Self explanations to make sense of problems. The content may include 1)
analysis of givens, constraints, relationships, and goals; 2) conjectures about the form and
meaning of the solution; 3) attempt on analogous problems, and special cases and simpler
forms of the original problem; 4) monitoring and evaluation of their progress.
Communication with others about one’s mathematical ideas. Such explanations
may include 1) the usage of stated assumptions, definitions, and previously established
results in constructing arguments; 2) use of example and counter-examples; 3)
construction of formal proofs; and 4) determination of domains to which an argument
applies.
Reasoning about others’ solution. These explanations include students’ request
for clarification, identification of flaws in others’ argument, use of examples and
counter-examples to make sense of or to falsify others’ arguments.
Quality of mathematical explanation
Not only do mathematical explanations take different forms, but they are also
of different qualities. On the perceptual level, explanations differ in terms of speech
fluency, such as whether the explanation was given in fragmented or completed sentences,
whether the speech is coherent (Ellis, 2009), and whether the explanation is articulate
6
(Hill, Ball & Schilling, 2008). On the content level, some dimensions of the explanation
quality include mathematical accuracy (also referred to as mathematical fidelity, see Bos,
2009, Moyer, Salkind, & Bolyard, 2008; or phrased as absence of mathematical error and
imprecision, see Hill, et al., 2008) and mathematical richness (see Hill et al., 2008; Hill,
Charalambous, & Kraft, 2012).
Mathematical accuracy. This dimension refers to whether an explanation contains
major errors that indicate gaps in one’s mathematical knowledge (Hill et al., 2008),
whether the explanation features imprecision in language and notation (Moyer et al.,
2008), for instance when the explainer cannot differentiate numerator and denominator.
Mathematical richness. Richness includes two elements: attention to the meaning
of mathematical facts and procedures and engagement with mathematical practices and
language. Meaning-making element refers to that an explanation not only describes a
mathematical idea, but also draws connections to other related mathematical ideas (e.g.,
fractions and ratios) or different representations of the same idea (e.g., number line,
counters, and number sentence). Mathematical practices include the presence of multiple
solution methods, where more credit is given for comparisons of solution methods for
ease or efficiency; selective use of efficient strategies, and developing mathematical
generalizations from specific examples (Hill et al., 2012).
Previous research on self-explanation has also proposed several features that
differentiate successful learners from unsuccessful ones (Chi et a, 1989; Renkl, 1997,
2002; Siegler 2002). Renkl (1997) found that quality of explanations produced by
successful and unsuccessful learners differ in the following aspects. (1) The successful
learners frequently assigned meaning to operators by identifying the underlying domain
7
principle (principle-based explanations). (2) They frequently assigned meaning to
operators by identifying the (sub-) goals achieved by those operators (explication of goal–
operator combinations). (3) They tended to anticipate the next solution step instead of
looking it up (anticipative reasoning). (4) The less successful learners explicated a
greater number of comprehension problems, that is, they had metacognitive awareness of
their own learning difficulties (metacognitive monitoring). Therefore, based on the
relationship between explanation features and learning outcome, Renkl (1997) identified
that explanations with the use of principle-based reasoning, explication of goal–operator
combinations, and anticipative reasoning are of higher quality.
Source of mathematical explanations
Previous research recognizes the following two sources of mathematical explanations:
instructional explanation, or self-explanation. An instructional explanation is part of an
instructional process wherein an agent, other than the student, provides an explanation for
the student to comprehend. Instructional explanations usually contain the target
knowledge components, which is the goal of the instruction (Schworm & Renkl, 2006;
Hausmann & VanLehn, 2007). A self-explanation is defined as self-generated
explanation of presented instruction that integrates the presented information with
background knowledge and fills in tacit inferences (Chi et al, 1989).
However, in a classroom environment where there are more than two agents, there is
also a third source of mathematical explanation. This third source is peer explanation. A
peer explanation differs from an instructional explanation in that the former is produced
by a student rather than the teacher. A peer explanation differs from a self-explanation in
that the explanation is produced by others rather than oneself.
8
1.2.2 Explanation generation
Question or Request for explanations: the explanation-eliciting context
The explanation-eliciting context is the immediate context in a classroom setting
where explanations happen. For instructional explanations, the question can be the
overall learning goal of the lesson. For example, Wittwer and Renkl (2010) shows that
instructional explanations takes 70-80% of the lecturing time. The explanation-eliciting
context could also be students’ feedback during classes, such as students’ wrong answers,
misunderstanding, or disagreement between the students.
As for the contexts where student explanations were elicited, examples may
include a teacher asking the class how to carry out a particular procedure (e.g. “How do
you solve the equation 3X+8=14?”), students’ request for clarification in the small group
discussion (e.g. “Prove it to us. Prove that 6 is an odd number.” See MTLT, 2010a), a
student’s disagreement with his/her peers (e.g. “He said he’s looking at the rectangle, but
he’s not looking at the whole, he’s just…”, see MTLT, 2010b), and many others.
The exact form of an explanation-eliciting context may differ across classrooms and
across instructional activities. For example, peer’s questions, disagreement, and
help-seeking behavior are more likely to be followed by students’ explanations in small
group work, while the overall learning goal that teachers have in mind are more likely to
elicit instructional explanations in
Effect of generating explanations on learning outcome: the case of self-explanation
The term “self-explanation” or “self-generated explanation” (Chi, et al., 1989)
refers to the explanation a learner generates on his or her own as opposed to the
explanation(s) provided by an external source (e.g., instructor, book).
9
The beneficial effect of generating explanations on students’ learning outcome is
supported by two decades of cognitive research. In the initial study, Chi et al (1989)
found that “good” physics students differed from their less successful peers in generating
what the researchers termed “self-explanations,” elaborations of what they learned that
attempted to fit it into a larger context. Chi, de Leeuw, Chiu, and LaVancher (1994)
found that simply prompting 8th graders periodically to “explain what it means to you”
led to significantly increased learning. More recently, Rittle-Johnson (2006) included
self-explanation instructions in a mathematics learning task that also compared both
direct instruction or invention. Under both instructional conditions, self-explanations
led to increased learning of a correct procedure and transfer to new problems. Chi, Siler,
Jeong, Yamauchi, & Hausmann (2001) compared learning by college students in tutoring
sessions that varied in the degree to which tutors provided didactic information or asked
leading questions to encourage the tutees to figure the problems out on their own. Results
strongly favored the latter format. More recently, Chi, Roy, & Hausmann (2008) found
that under some circumstances watching someone else receive tutoring can be as
effective as being tutored yourself. In their paradigm, pairs of students watched a third
student being tutored. Chi and colleagues argued that this can combine the effects of
tutoring and collaboration, encouraging learners to become active and constructive
observers. At least under some circumstances, watching a peer working through a
problem can be as effective as personalized tutoring.
1.2.3 Explanation processing
Student processing of a mathematical explanation may be influenced by the
following factors: characteristics of the explanation (e.g. quality of the explanation),
10
characteristics of the explainer (e.g. perception of explainer’s competence), and
characteristics of the student him/herself (e.g. one’s prior knowledge).
Quality of explanation
Physicists have used the term “Feynman effect” (after the Nobel laureate Richard
Feynman) to refer to a paradox in which a famously clear explainer fails to succeed in
teaching novices. According to Jacoby, Bjork & Kelley (1994), students of the famous
physicist and lecturer Richard Feynman actually performed worse in tests compared to
students of others. This may partly due to Mr. Feynman’s ability in providing lucid
explanations and making difficult materials easy to understand, students got a false and
fleeting “feeling of knowing” that accompanies these lucid explanations by the expert;
the student leaves feeling that he or she has a solid grasp on a topic because everything
the expert said made sense. Only when they then try to apply what they’ve learned do
they realize they didn’t understand it. Thus, very clarity of a high quality explanation may
interfere with student learning if it serves to short cut the difficult reflection and
integration required to make sense of new information. Both perceptual disfluency effect
and the generation effect provided supporting evidence to this point.
Perceptual disfluency effect. Disfluency refers to the subjective experience of
difficulty associated with cognitive operations (Alter & Oppenheimer, 2008; Alter et al.,
2007; Novemsky, Dhar, Schwarz, & Simonson, 2007; Reber & Zupanek, 2002).
Disfluency can be easily produced by presenting study material in a slightly more
difficult to read font (e.g., a small, gray, italicized font: sample, or condensed font like
Haettenschweiler or Impact). For example, Alter et al (2007) presented participants with
logical syllogisms in either an easy- or difficult-to-read font. Participants were less
11
confident in their ability to solve the problems when the font was hard-to-read, yet they
were in reality more successful. On a similar note, Diemand-Yauman, Oppenheimer, &
Vaughan (2010) presented subjects fictional biological taxonomies in either easy or
challenging fonts in the studying phase. Participants were more successful in recalling
when studied the taxonomies in challenging fonts. Diemand-Yauman et al (2010) later
demonstrated that the disfluency effect retains in real classroom settings. The
experimenters altered the fonts of the study material from the teachers before they were
distributed. After one-week to one-month of exposure to study materials of different fonts,
students who received study material in challenging fonts performed better in the end of
the unit exams. Effects were consistent across subject areas as well across class difficulty
levels.
Generation effect. Generation effect refers to benefits of learning and retention
related to the increased depth of processing by requiring the learner to generate rather
than passively read information. For example, Hirshman & Bjork (1988) found that
requiring participants to generate letters in a word pair (e.g. “Bread: B_tt_r”) during
memorization resulted in a higher retention rate of the word pairs than when the pairs
were presented entirely (e.g. “Bread: Butter”). The retention rate of the generation group
triples that of the reading group. The striking benefits of generation are not limited in the
context of word pair learning. Richland et al. (2005) reported similar effect in the context
of science education. Undergraduates who went through the generation/retrieval test
during the re-study session outperformed their peers who re-read the material. In the
domain of mathematics, participants who generated answers to calculation problems
remembered the answer better than the ones who simply read the answer, and the effect
12
size of generation is almost a full standard deviation (Slamecka & Graf, 1978; Pesta,
Sanders, & Murphy, 1999; Bertsch et al, 2007).
Perception of explainer’s competence
Previous studies on peer interaction and modeling suggested that students may gain
from interaction with similarly competent peers, and the essential condition for such
gains include disagreement and being strategic (i.e. being able to give reasons or
arguments for a specific solution or offering an operational solution). For example, Miller
and Brownell (1975) used Piagetian conservation task and showed that conservers
influenced nonconservers and not vice versa because they could give consistent reasons
for their solution when arguing with their peer. In contrast, the nonconservers kept
asserting their solution without invoking reasons in favor of their assertions. Moreover,
these researchers also suggested that simply hearing a contradicting solution plays a
major part in the cognitive gains of peer interaction. Therefore, when two interacting
solvers disagree, their cognitive gains originate not only from a pragmatic
component—the disagreement—but also from the contradicting solution itself. In another
study, Doise and Mugny (1979) showed that interaction with a less capable child who
proposed a contradicting solution led even the more capable child to progress. In the
same study, Doise and Mugny showed that when interacting students used different
strategies, they progressed, whereas when they used the same strategies, they did not. A
key result obtained by Doise and Mugny was that if the ability difference between the
two students was too big, low-level students did not progress.
Schwarz, Neuman & Biezuner (2000) provided a possible explanation why the
low-level students did not progress when there is a great discrepancy between them and
13
their peers. They proposed that greater competence difference between the dyads might
hinder the key process--hypothesis testing, to constructing or evaluating arguments. In
other words, the low-level students trust the information provided by their high-level peer,
due to the perception of the peer being competent. The lack of critical processing
prevented them from gaining from these interactions.
Students’ prior knowledge
Prior knowledge is deployed in evaluation of the new information. For example,
Legare, Gelman and Wellman (2010) showed that when the new information contains
inconsistency with prior knowledge, young children were more likely to provide causal
explanations for the new information. Similarly, Williams and Lombrozo (2013)
suggested that explanation recruits prior knowledge to assess whether candidate patterns
are likely to have broad scope (i.e., to generalize within and beyond study observations).
Williams and Lombrozo showed that the effects of explanation on prior knowledge were
attenuated when learners believe prior knowledge was irrelevant to generalizing category
membership.
1.3 The Mathematical Context
In current study, I will focus on students’ understanding of mathematical
equivalence. Mathematical equivalence refers to the understanding of the equal sign, the
principle that the sum of the numbers on one side of an equation is equal to the sum of
the numbers on the other side of the equation. It is fundamental to understanding algebra,
which serves as a gatekeeper for future educational opportunities and has an important
role in mathematics. The importance of understanding mathematical equivalence serves
as the first reason why it is selected as the mathematical context in the current study.
14
The second reason lies in the pervasive misunderstanding of mathematical
equivalence among elementary and middle school students in the United States. 70% or
more of 3rd to 6th grade students in US misunderstand the principle of mathematical
equivalence (Rittle-Johnson, Taylor, Matthews & McEldoon, 2011). Given a problem
such as “4+6+9=__+9”, they will calculate “4+6+9” and fill in the blank with the
answer “19”. Some children will continue with “19+9” and get “28” as the answer
(Alibali, 2005). In both cases, children appear to be interpreting the equal sign as an
announcement of the result of an arithmetic operation rather than as a symbol of
mathematical equivalence. Moreover, many middle school students still lack a
sophisticated understanding of the equal sign, which resulted in difficulties in working
with symbolic expressions and equations (Knuth, Stephens, McNeil, & Alibali, 2006).
This misunderstanding of the mathematical equivalence is characterized as the
“operational” understanding (e.g. Knuth, Alibali, Hattikudur, McNeil, & Stephens, 2008;
Knuth, Stephens, McNeil, & Alibali, 2006; Rittle-Johnson, Taylor, Matthews, &
McEldoon, 2010). Students with the operational understanding view the equal sign as a
“do something” signal, where they are supposed to calculate what is on the left of the
equal sign, and put the answer on the right of the equal sign. The pervasive
misunderstanding of the mathematical equivalence may due to the engagement in
arithmetic activities prior to middle school mathematics (McNeil, 2008). A more
sophisticated understanding, that allows future progressive understanding of algebra, is
the relational understanding, which the equal sign expresses a balance between quantities
in an equation, i.e. balance between both sides of the equal sign.
The third reason of the selection is the possibility to induce conceptual changes
15
regards mathematical equivalence within a short amount of time. Perry (1991) and
Rittle-Johnson & Alibali (1999) found that conceptual instruction focusing on the
meaning of “=” helps a majority of children to come up with procedures sufficient to
solve the task. Siegler (2002) reported that a condition in which children were presented
with examples of both correct and incorrect answers and were required to explain them
led to significantly better learning than conditions in which children were just required to
explain either their own answer or just the correct answer.
The mathematical equivalence appears ideal as the mathematical context of the
current study. Most students initially fail the task, yet real progress can be made in a
single session. Several studies show that self-explanations can lead to improved learning.
The specific form that self-explanation instructions took in these studies involve asking
children to evaluate the explanations given by others. Thus it appears an ideal task to
begin to look at how the nature and number of explanations, who gives them, and how
children are asked to respond to them, all affect children’s learning.
16
2. Research Questions
This project is aimed at answering three questions about the role of discussion in
elementary student learning.
Question 1 focuses on the contexts in which students produce mathematical
explanations and the relation of explanations to achievement on the level of countries. In
order to do this, I developed and validated a machine-learning system for identifying
explanations in transcripts of lessons. This allowed me to look at two related questions: 1)
Are there in fact fewer student explanations in US than in the higher achieving East
Asian locales such as Japan and Hong Kong? 2) What factors predict the prevalence of
student explanations, and do those predictors vary across countries? .
Question 2 focuses on US and Chinese students’ production of mathematics
explanation. Specifically, what is the quality of student generated explanations? How do
US students differ from their Chinese peers in the quality of their explanations? Both
questions will be examined in the context of mathematical equivalence.
Question 3 focuses on whether students process peer explanations differently than
those of adults. Specifically, would students processing of the information vary with the
sources (adults vs. peers) and with the quality of the explanation? How do these
differences, if any, relate to students’ learning outcome?
17
Reference
Alibali, M. W. (2005). Gesture in spatial cognition: Expressing, communicating, and thinking about spatial information. Spatial Cognition and Computation, 5(4), 307-331.
Alter, A. L., Oppenheimer, D. M., Epley, N., & Eyre, R. N. (2007). Overcoming intuition: Metacognitive difficulty activates analytic reasoning. Journal of Experimental Psychology-General, 136(4), 569-576.
Alter, A. L., & Oppenheimer, D. M. (2008). Easy on the mind, easy on the wallet: The effects of familiarity and fluency on currency valuation. Psychonomic Bulletin and Review, 15, 985-990.
Ball, D. L. (1991). What’s all this talk about discourse. The Arithmetic Teacher, 39(3), 44.
Bertsch, S., Pesta, B. J., Wiscott, R., & McDaniel, M. A. (2007). The generation effect: A
meta-analytic review. Memory & Cognition, 35(2), 201-210.
Bos, B. (2009). Technology with cognitive and mathematical fidelity: What it means for
the math classroom. Computers in the Schools, 26(2), 107-114.
Cazden, C. (1988). Classroom Discourse: The Language of Teaching and Learning. Portsmouth, NH: Heinemann.
Chapin, S. H., O’Connor, C., & Anderson, N. C. (2003). Classroom discussions: Using Math Talk to help students learn. Sausalito, CA: Math Solutions.
Chi, M. T. H., Bassok, M., Lewis, M., Reimann, P., & Glaser, R. (1989). Self-explanations: How students study and use examples in learning to solve problems. Cognitive Science, 13: 145-182.
Chi, M.T.H., de Leeuw, N., Chiu, M.H., LaVancher, C. (1994). Eliciting self-explanations improves understanding. Cognitive Science, 18: 439-477.
Chi, M.T.H., Siler, S., Jeong, H., Yamauchi, T., & Hausmann, R.G. (2001). Learning from tutoring. Cognitive Science, 25: 471-533.
Chi, M. T., Roy, M., & Hausmann, R. G. (2008). Observing tutorial dialogues collaboratively: Insights about human tutoring effectiveness from vicarious learning. Cognitive science, 32(2), 301-341.
Diemand-Yauman, C., Oppenheimer, D. M., & Vaughan, E. B. (2011). Fortune favors the bold (and the italicized): Effects of disfluency on educational outcomes. Cognition, 118(1), 111-115.
Doise, W., & Mugny, G. (1979). Individual and collective conflicts of centrations in cognitive development. European Journal of Social Psychology,9(1), 105-108.
Duffy, G. G., Roehler, L. R., Meloth, M. S., & Vavrus, L. G. (1986). Conceptualizing instructional explanation. Teaching and Teacher Education,2(3), 197-214.
18
Ellis, R. (2009). The differential effects of three types of task planning on the fluency, complexity, and accuracy in L2 oral production. Applied Linguistics,30(4), 474-509.
Flanders, N. A. (1970). Analyzing teaching behavior. Reading, MA: Addison-Wesley. Hausmann, R. G. M. & VanLehn, K. (2007). A test of the interaction hypothesis: Joint
explaining vs. self-explaining. In D. McNamara & G. Trafton (Eds.) Proceedings of the 29th Annual Conference of the Cognitive Science Society. pg. 1770 New York, NY: Erlbaum.
Hiebert, J., & Wearne, D. (1993). Instructional tasks, classroom discourse, and students' learning in second-grade arithmetic. American Educational Research Journal, 30(2), 393-425.
Hiebert, J., & Grouws, D. A. (2007). The effects of classroom mathematics teaching on students' learning. In F. K. Lester (Ed.), Second handbook of research on mathematics teaching and learning (pp. 371-404). Charlotte, NC: Information Age Publishing.
Hill, H. C., Schilling, S. G., & Ball, D. L. (2004). Developing measures of teachers’ mathematics knowledge for teaching. The Elementary School Journal, 105(1), 11-30.
Hill, H. C., Ball, D. L., & Schilling, S. G. (2008). Unpacking pedagogical content knowledge: Conceptualizing and measuring teachers' topic-specific knowledge of students. Journal for Research in Mathematics Education, 372-400.
Hill, H. C., Umland, K., Litke, E., & Kapitula, L. R. (2012). Teacher quality and quality teaching: Examining the relationship of a teacher assessment to practice. American Journal of Education, 118(4), 489-519.
Hirshman, E. L., & Bjork, R. A. (1988). The generation effect: Support for a two-factor theory. Journal of Experimental Psychology: Learning, Memory, and Cognition, 14, 484-494.
Jacoby, L. L., Bjork, R. A., & Kelley, C. M. (1994). Illusions of comprehension, competence, and remembering. In D. Druckman & R. A. Bjork (Eds.), Learning, remembering, believing: Enhancing human performance (pp. 57-80). Washington, DC: National Academy Press
Knuth, E. J., Alibali, M. W., Hattikudur, S., McNeil, N. M., & Stephens, A. C. (2008). The Importance of Equal Sign Understanding in the Middle Grades. Mathematics teaching in the Middle School, 13(9), 514-519.
Knuth, E. J., Stephens, A. C., McNeil, N. M., & Alibali, M. W. (2006). Does understanding the equal sign matter? Evidence from solving equations. Journal for Research in Mathematics Education, 37(4), 297-312.
Legare, C. H., Gelman, S. A., & Wellman, H. M. (2010). Inconsistency with prior knowledge triggers children’s causal explanatory reasoning. Child Development, 81(3), 929-944.
Leinhardt, G. (1993). Instructional explanations in history and mathematics. In Proceedings of the fifteenth annual conference of the cognitive science society(pp. 5-16). Hillsdale, NJ: Lawrence Erlbaum Associates.
19
Leinhardt, G. (2010). Introduction: Explaining instructional explanations. InInstructional explanations in the disciplines (pp. 1-5). Springer US.
Mathematics Teaching and Learning to Teach, University of Michigan.
(2010a). SeanNumbers-Ofala[Online]. Available:
http://hdl.handle.net/2027.42/65013.
Mathematics Teaching and Learning to Teach, University of Michigan.
(2010b). Mamadou-Half-Rectangle[Online]. Available:
http://hdl.handle.net/2027.42/78024.
McNeil, N. M. (2008). Limitations to teaching children 2 + 2 = 4: Typical arithmetic problems can hinder learning of mathematical equivalence. Child Development, 79, 1524-1537.
Miller, S. A., & Brownell, C. A. (1975). Peers, persuasion, and Piaget: Dyadic interaction between conservers and nonconservers. Child Development, 992-997.
Moyer, P. S., Salkind, G., & Bolyard, J. J. (2008). Virtual Manipulatives Used by K-8 Teachers for Mathematics Instruction: The Influence of Mathematical, Cognitive, and Pedagogical Fidelity. Contemporary Issues in Technology and Teacher Education, 8(3), 202-218.
National Council of Teachers of Mathematics. (1989). Curriculum and evaluation standards for school mathematics. Reston, VA: Author.
National Council of Teachers of Mathematics. (2000). Principles and Standards for School Mathematics. Reston, VA: Author.
Novemsky, N., Dhar, R., Schwarz, N., & Simonson, I. (2007). Preference fluency in choice. Journal of Marketing Research, 44(3), 347-356.
Perry, M. (1991). Learning and transfer: Instructional conditions and conceptual change. Cognitive Development, 6(4), 449-468.
Pesta, B. J., Sanders, R. E., & Murphy, M. D. (1999). A beautiful day in the neighborhood: What factors determine the generation effect for simple multiplication problems?. Memory & cognition, 27(1), 106-115.
Pianta, R. C., Belsky, J., Houts, R., & Morrison, F. (2007). Opportunities to learn in America's elementary classrooms. Science, 315(5820), 1795-1796.
Pinnell, G. S., & Jagger, A. M. (1991). Oral language: Speaking and listening in the classroom. In J. Flood, J. M. Jensen, D. Lapp, & J. R. Squire (Eds.), Handbook of research on teaching the English language arts. (pp. 691-720). New York: Macmillan.
Reber, R., & Zupanek, N. (2002). Effects of processing fluency on estimates of probability and frequency. In P. Sedlmeier & T. Betsch (Eds.), Etc. Frequency Processing and Cognition (pp. 175–188). Oxford University Press.
20
Renkl, A. (1997). Learning from worked‐out examples: A study on individual differences. Cognitive science, 21(1), 1-29.
Renkl, A. (2002). Worked-out examples: Instructional explanations support learning by self-explanations. Learning and instruction, 12(5), 529-556.
Rittle-Johnson, B. (2006). Promoting Transfer: Effects of Self-Explanation and Direct Instruction. Child Development, 77(1), 1-15.
Rittle-Johnson, B., Taylor, R., Matthews, P.G., & McEldoon, K. (2011). Assessing Knowledge of Mathematical Equivalence: A Construct Modeling Approach. Journal of Educational Psychology, 103 (1), 85-104.
Rittle-Johnson, B., & Alibali, M. W. (1999). Conceptual and procedural knowledge of mathematics: Does one lead to the other? Journal of Educational Psychology, 91(1), 175-189.
Schwarz, B. B., Neuman, Y., & Biezuner, S. (2000). Two Wrongs May Make a Right ... If They Argue Together! Cognition and Instruction, 18(4), 461–494.
Siegler, R. S. (2002). Microgenetic studies of self-explanation. In N. Garnott & J. Parziale (Eds.), Microdevelopment: A process-oriented perspective for studying development and learning (pp. 31 – 58). Cambridge, MA: Cambridge University Press.
Slamecka, N. J., & Graf, P. (1978). The generation effect: Delineation of a phenomenon. Journal of experimental Psychology: Human learning and Memory, 4(6), 592-604.
Stevens, R. (1910). Stenographic reports of high school lessons. Teachers College Record, 11 (entire issue).
Sullivan, P., & Lilburn, P. (2002). Good questions for math teaching. Sausalito, CA: Math Solutions
Williams, J. J., & Lombrozo, T. (2013). Explanation and prior knowledge interact to guide learning. Cognitive Psychology, 66(1), 55–84.
Wittwer, J., & Renkl, A. (2010). How Effective are Instructional Explanations in Example-Based Learning? A Meta-Analytic Review. Educational Psychology Review, 22(4), 393–409.
21
Chapter 2.
Students’ production of mathematic explanations through classroom
discourse
The centrality of providing students opportunities to communicate mathematics ideas
has long been recognized. In their Professional Standards for Teaching Mathematics,
the National Council of Teachers of Mathematics (NCTM) stress the importance of
communication in mathematics classes: instructional programs should enable children to
“organize and consolidate their mathematical thinking through communication”, to
“communicate their mathematical thinking coherently and clearly to peers, teachers and
others” (NCTM, 2000).
After an extensive meta analysis of research aimed at improving elementary
mathematics achievement, Slavin & Lake (2008) concluded:
“The research on these instructional process strategies suggests that the
key to improving math achievement outcomes is changing the way teachers and
students interact in the classroom. It is important to be clear that the
well-supported programs are not ones that just provide generic professional
development or professional development focusing on mathematics content
22
knowledge. What characterizes the successfully evaluated programs in this section
is a focus on how teachers use instructional process strategies, such as using time
effectively, keeping children productively engaged, giving children opportunities
and incentives to help each other learn, and motivating students to be interested in
learning mathematics.” (p. 475)
Hiebert & Grouws (2007) also reviewed the literature on effects of mathematics
teaching and their conclusions provide a concise specification of the essential features of
that interaction between teacher and student. They concluded that effective teaching of
mathematical concepts requires two key features: 1) Teachers and students attend
explicitly to concepts, and 2) Students struggle with important mathematics.
These recommendations are consistent with research on the relation between
classroom discourse and student learning. For example, Smith (1977) has discovered that
classroom discourse that allows more student involvement leads to more critical thinking
and better learning outcome. Tobin (1984; 1986) reported that better questioning
practices by the teacher encouraged student involvement and promoted learning.
However, observations indicate that most teachers are not proficient in promoting
student involvement. Pianta, Belsky, Houts and Morrison (2007) reported their analysis
of the observation of over 1000 classrooms across 10 sites in the U.S. They found that
most teachers only provided students with feedback on the correctness of their answer,
rather than asking them to elaborate on their reasoning. This followed the simple teacher
23
initiation-student response-teacher evaluation IRE pattern (Mehan, 1979), reflecting a
transmissionist view of learning that has been criticized by many contemporary
researchers (e.g. Inagaki, Hatano & Morita, 1998; Nassaji & Wells, 2000; Waring, 2009).
For example, Inagaki, Hatano & Morita (1998) argued that IRE instruction left little room
for “negotiation”; in contrast, if a teacher allowed other students to elaborate or criticize
their original responses, they would have the opportunity to construct their mathematical
thinking by assimilating similar ideas from their peers or revising their current conceptual
model to accommodate conflicting ideas from others, both of which have been confirmed
by their study.
This pattern of limited student opportunity to explain mathematics may not be
universal. Sims and colleagues (Sims et al., 2008) compared the opportunity to talk in
American and Chinese classrooms. She found that in US, 21% of utterances were
generated by students, whereas in China the number was 69%. The fact that US students
were not given enough opportunity to express their mathematical thinking in class may
indicate a lack of facilitation from the teachers.
One obstacle that prevents teachers from gaining expertise in discourse
management is the implicit nature of this skill and the ephemeral nature of classroom
discourse. It is difficult to pay attention to something like the distribution of talk or
eliciting students’ explanations when one is teaching, at the same time that teachers need
to worry about covering all the material, managing the classrooms and the accuracy of
24
their own explanations. Traditional teacher training does not provide many opportunities
for teachers in training to develop skill at eliciting student explanations or managing
student discussions. Eilam & Poyas (2006) described this process as consisting of three
elements: learning theoretical knowledge, observing experienced teachers and teaching
practice. None of these are directly aimed at improving skill in managing classroom
discourse. Rather, it has been assumed that novice teachers can gain this skill
automatically through experience.
Research efforts to decipher classroom discourse
A number of efforts have been made to increase teachers’ awareness in their
classroom discourse. Teacher training programs have been carefully designed to help
teachers better organize classroom talk (e.g. Chapin, O’Connor & Anderson, 2003).
Researchers have also been investigating factors that affect the quality of classroom
discourse. Using transcripts of lessons, Bellack and his colleagues discovered some
universal features of talk moves in different classrooms, based on which they categorized
teaching into four categories: structuring, soliciting, responding and reacting (Bellack,
Kliebard, Hyman and Smith, 1966). The dynamic change of teaching activities among the
four categories has been further used to define the “teaching cycle”, which reflects the
instruction features in a class. For example, the average length of teaching cycles could
represent the pace of instruction; by analyzing the initiator of each teaching cycle (be it
25
teacher or students), one could also obtain the “relative proportion of teacher and pupil
discourse” (Kliebard, 1966).
In an effort to help teachers visualize their classroom instruction, Walsh (2006)
identified four classroom “modes”, including Managerial, Materials, Skills and systems
and Classroom context. These categories were then introduced to teachers to help them
perform “self-evaluation of teacher talk” (SETT), in which teachers watched their own
classroom recordings and identified their teaching activities based on the given categories.
Final interviews with these teachers indicated that their awareness of discourse
management was improved after the practice.
Cazden and Beck (2003) summarized five discourse features that can be
consciously controlled by a teacher: speaking rights and listening responsibilities, teacher
questions, teacher feedback, pace and sequence, and classroom routines. Variations on
these features result in different types of classroom discourse, which further influences
students’ learning. For example, a teacher can encourage student involvement by giving
them more “speaking rights” and making sure other students take their “listening
responsibilities”; she can also slow down the “pace” by providing more wait time before
calling a student to answer a question so that other students may have longer time to think
about it.
The video project (Stigler, Gonzales, Kawanaka, Knoll, & Serrano,1999)
conducted as part of the original TIMSS (Trends in International Mathematics and
26
Science Study) project (Peak, 1996) is perhaps the most ambitious effort to date to code
classroom discourse in classrooms internationally. In the initial round of research, the
team recorded middle school mathematics lessons in the U.S., Japan, and Germany,
transcribing all classroom discourse. In later work, the method was extended to additional
countries and expanded to include science as well as mathematics. The code book used
by this project distinguished between whether or not interactions were public (i.e.,
involving the whole class as a unit) or individual/small-group work, and whether the
teacher or the student was providing the bulk of the information (LessonLab, n.d.). Based
on the coding system, eighth-grade mathematics lessons from the U.S., Germany and
Japan have been compared and significant cross-country differences have been identified.
For example, in the classes of Germany and Japan much more topics were “developed”
instead of simply “stated” by the teacher, whereas in the U.S. the pattern was the opposite
(Stigler, Gallimore & Hiebert, 2000).
Conceptualization of student mathematical explanation in classroom discourse
In addition to these studies of classroom discourse in general, there has been a
specific focus on students’ mathematical explanations in several coding systems of
mathematics instruction (e.g. Mathematical Quality of Instruction, or MQI) as well as in
standards for mathematics instruction, particularly the Common Core State Standards
(CCSSI, 2010) developed by the National Governors Association Center for Best
Practices and Council of Chief State School Officers. The Mathematical Quality of
27
Instruction (MQI) provides specific standards for a variety of aspects of instruction such
as teachers’ interactions with students and students’ interaction with mathematical
content (Hill et al., 2008). Specifically, MQI captures the ways in which student engage
with meaning making and reasoning. For example, it put an emphasis on the cognitive
requirements of classroom tasks—e.g. whether student were required to find patterns,
draw connections, determine the meaning of mathematical concepts, or justify and reason
about their conclusions. On the students’ action part, MQI captures whether students ask
mathematically motivated questions, examine claims and counter-claims, or make
conjectures; and whether they provide mathematical explanations spontaneously or upon
request by the teacher. In summary, MQI indicated that both the tasks students facing and
the input they provided constitutes students’ sense making and reasoning of mathematics,
yet what differentiates an explanation from other student statements is not clear.
The Common Core State Standards (CCSSI, 2010, see
CCSS.MATH.PRACTICE), on the other hand, described the ideals of mathematical
explanations that mathematically proficient students should provide. The CCSS classified
explanations into the following three types: 1) Statements student make to themselves in
order to make sense of the problem; 2) Explanations students provide to others in order to
convey mathematical ideas, to convince, and; and 3) Students’ inspection and reasoning
of other’s solutions. Specifically, students’ sense making statements may include them
analyzing givens, constraints, relationships, and goals of a task. The sense making
28
statements may also include their conjectures about the form and meaning of the solution
and their plan of a solution pathway before jumping into a solution attempt. They also
include students’ consideration of analogous problems, their trying of special cases or
simpler forms of the original problem, as well as their making correspondence between
different representations of a problem, such as equations, verbal descriptions, tables,
graphs or diagrams. Students’ effort to communicate mathematical ideas starts with their
awareness about the assumptions, definitions, and previously established results. Their
making those explicit in their verbal communication marks their effort to construct
arguments and explanations. Students may communicate their mathematical ideas
through making conjectures and building a logical progression of statements, or they may
construct arguments using concrete referents such as objects and diagrams. Students’
effort to communicate mathematical ideas also includes their attempts to convince others
by justifying their conclusions and responding to the arguments of others. Finally,
students’ inspection and reasoning of others’ solutions start with them listening to or read
others’ solutions, students may then ask questions to determine the correctness of other’s
solution, compare the effectiveness of plausible arguments, distinguish correct logic or
reasoning from that which is flawed, and—if there is a flaw in an argument—identify
what it is. In summary, CCSS defined student explanations through how they function
(i.e. explain to self, convey information to others, and responding to others). It also
provided exemplar cases which should be considered as explanations in mathematical
29
classrooms.
Besides the functions an utterance may serve, the nature of information presented
in the utterance also determines whether it should be treated as an explanation or not.
Duffy and colleagues (Duffy, Roehler, Meloth, & Vavrus, 1986) pointed out three kinds
of information that are essential in an explanation: the declarative information about the
task, the conditional information about when and why things should be used, and the
procedural information about how to successfully apply a strategy. The declarative
information needs to be precise and relevant to the task at hand. For example, the
statement “we need to find out what number can make the two sides the same” contains
such declarative information, but the statement “you do the problem and put the answer
down” does not. The conditional information describes conditions under which a
particular strategy can be employed and why one strategy is more likely to be successful
than another. An example with conditional information is “you can use this strategy when
there is a number on the left side of the equation, and it is on the right side too”, while the
following is considered to be lacking of conditional information, “you use this strategy to
do math problems”. The procedure information is the explicit verbal statement of one’s
understanding of how to apply a strategy in the problem solving. For example, the
following statement contains the procedure information, “ the strategy is to cross out the
same numbers. If the number on the left (of the equal sign) is the same as the one on the
right, you cross them out”. Compare this to a statement showing less awareness of how to
30
use the same strategy: “you cross out numbers to make it right.”
In the current study, both the function of and the nature of information in student
utterances will be used to determine whether they are mathematical explanation.
Specially, a statement needs to satisfy the following two conditions to be considered as a
mathematical explanation. First, the statement needs to convey complete information. For
example, in the following teacher-student interaction, only the bolded student utterance
contains complete information. Therefore, even the first student statement signals the
beginning of the students reasoning process, only the second statement would count as a
student mathematical explanation.
T: also, Kawamura says here and here are equal. Why is so?
S: Because of the sizes of opposing angles.
T: Huh?
S: The sizes of opposing angles in a parallelogram are the same.
Second, the statement needs to be one or more of the following: a description of a
procedure, a rule, or a definition; an analysis of problem conditions, its givens, structure,
and the information in need to solve the problem; a justification of one’s solution. These
statements can be produced spontaneously or upon request (e.g. respond to the teacher or
a peer). And finally, statements can be mathematically accurate or not.
31
Automated modeling of classroom discourse
The aforementioned coding systems have yielded useful information in
educational research. However, they have important practical limitations. Coders need to
receive many hours of training and certification before they can begin to use the
instruments reliably. Even then, coding remains a time-consuming activity.
An alternative could be machine coding of explanations from transcripts. If this is
successful, it could make it easier and faster to code large amounts of lesson data.
Ultimately it may be possible to incorporate this kind of analysis into a feedback system
that gives teachers prompt feedback on the nature of classroom discourse in lessons they
have just taught.
If we could automatically distinguish between an explanation and a
non-explanation, and record the total amount of student explanations in a lesson, it might
be possible to automatically identify student’s meaningful engagement with mathematics
during lessons based on the nature of discourse involved. Such a system would not be
able to evaluate the quality of students’ explanations, but information about the quantity
might nonetheless provide a useful index to some important aspects of a lesson.
The current study will use combine text mining and machine learning techniques
to achieve the automated identification of student explanations. Specifically, the Random
Forest algorithm was applied due to its ability to handle multiple variables at the same
time, its classification robustness and its flexibility on the distribution of each individual
32
variable (Breiman, 1996, 2001). After model tuning and initial training to establish
parameters in the algorithm, RF algorithm can automatically apply to an extended dataset
and obtain classification results within seconds (Breiman, 2001).
Exploring student production of math explanations in classroom discourse
The current study aims to explore students’ production of mathematical explanations
in classroom discourse. To identify any pattern in classroom discourses, a large dataset is
needed. Transcripts from 1999 TIMSS video study will satisfy the requirement of sample
size. Among all 8 locales included in 1999 TIMSS 8th grade mathematics class recordings
dataset, two English speaking countries, Hong Kong SAR and the United States, were
selected to eliminate concerns about translation inaccuracy. In addition, Japanese
classrooms were selected due to Japan’s unique classroom structure and the potential this
might have for identifying similarity and variability in the relationship between
classroom features and students’ production of explanations. The current study will focus
on how discourse contexts affects student production of mathematical explanations. This
question is multi-level in nature. Firstly, within a classroom, which features in the teacher
utterance are more likely to elicit an explanation? Secondly, at the classroom level, which
classroom characteristics predict the proportion of student explanation among all student
utterances? Finally, how does the predictive value of the classroom characteristics differ
across the countries? Multi-level analysis will be employed to answer these questions.
33
Method
Datasets
The dataset in this study includes transcripts of 232 video recordings of lessons from
the 1999 TIMSS video study (Hiebert et al., 2003). 1999 TIMSS video study recorded 8th
grade mathematics lessons from 7 countries and 8th grade science lessons from 5
countries. In each country, lessons were videotaped across the school year to try to
capture the range of topics and activities that can take place throughout an entire school
year.
The current sample includes all recordings of mathematics lessons from the
following 3 countries, Japan (JP, N=50), Hong Kong SAR (HK, N=98), and the United
States (US, N=84). Transcripts from all the 232 lessons were obtained and were used for
analysis. All analysis is based on the English transcripts, which are original transcripts for
US and Hong Kong lessons and translations for Japanese lessons. There are 3 variables
available in each transcript, namely the timestamp of an utterance (i.e. the starting time of
the utterance), the role of the person who produced the utterance (i.e. the teacher or a
student), and the content of the utterance (i.e. the transcript of the utterance).
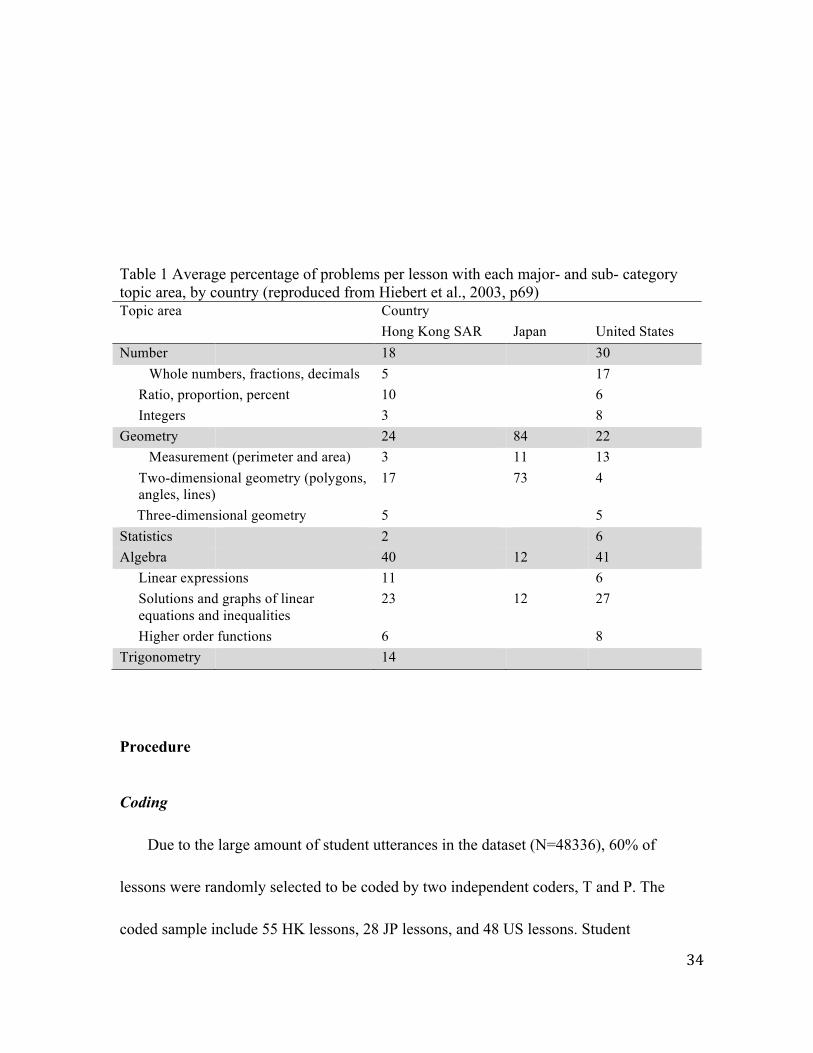
The mathematical topics covered in each lesson cover the following areas: number,
geometry, algebra, and statistics. Table 1 (reproduced from 1999 TIMSS video technical
report, see Hiebert et al., 2003) includes a detailed description of the average percentage
per lesson in each topic area.
34
Table 1 Average percentage of problems per lesson with each major- and sub- category topic area, by country (reproduced from Hiebert et al., 2003, p69) Topic area Country
Hong Kong SAR Japan United States Number 18 30 Whole numbers, fractions, decimals 5 17
Ratio, proportion, percent 10 6 Integers 3 8
Geometry 24 84 22 Measurement (perimeter and area) 3 11 13
Two-dimensional geometry (polygons, angles, lines)
17 73 4
Three-dimensional geometry 5 5 Statistics 2 6 Algebra 40 12 41
Linear expressions 11 6 Solutions and graphs of linear equations and inequalities
23 12 27
Higher order functions 6 8 Trigonometry 14
Procedure
Coding
Due to the large amount of student utterances in the dataset (N=48336), 60% of
lessons were randomly selected to be coded by two independent coders, T and P. The
coded sample include 55 HK lessons, 28 JP lessons, and 48 US lessons. Student
35
utterances were coded into the following three categories: a mathematical explanation, a
non- explanation, or missing. A mathematical explanation is defined as an utterance
which comprised an analysis of the requirement of a task (e.g. the conditions and the
requirements of the problem), or a description of problem solving procedure rather than
just an answer, or a justification of why a problem solving procedure works or not, or a
definition of a concept before applying it. All other student utterances are coded as
non-explanations. Non-explanations may include students’ off-topic chatting, their
“yes/no” answers, or their simple numeric answers with no reference to how such
answers were produced. In some cases, students’ utterance recorded as “inaudible” in the
transcripts. Such cases were coded as missing.
Feature identification
Computer assisted processing was used to identify features of students’ utterance
as well as the teacher’s utterance immediately prior to any student utterance. I focused on
these features because they may have predictive value on the
explanation/non-explanation status of the student utterance.
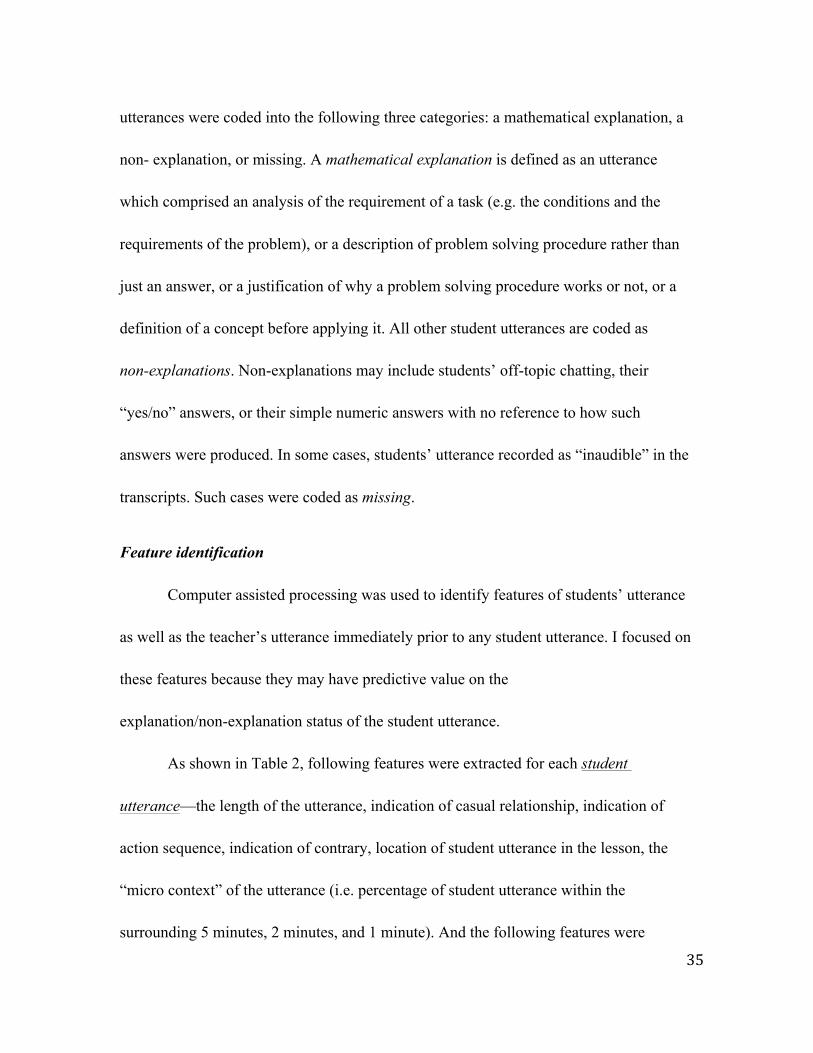
As shown in Table 2, following features were extracted for each student
utterance—the length of the utterance, indication of casual relationship, indication of
action sequence, indication of contrary, location of student utterance in the lesson, the
“micro context” of the utterance (i.e. percentage of student utterance within the
surrounding 5 minutes, 2 minutes, and 1 minute). And the following features were
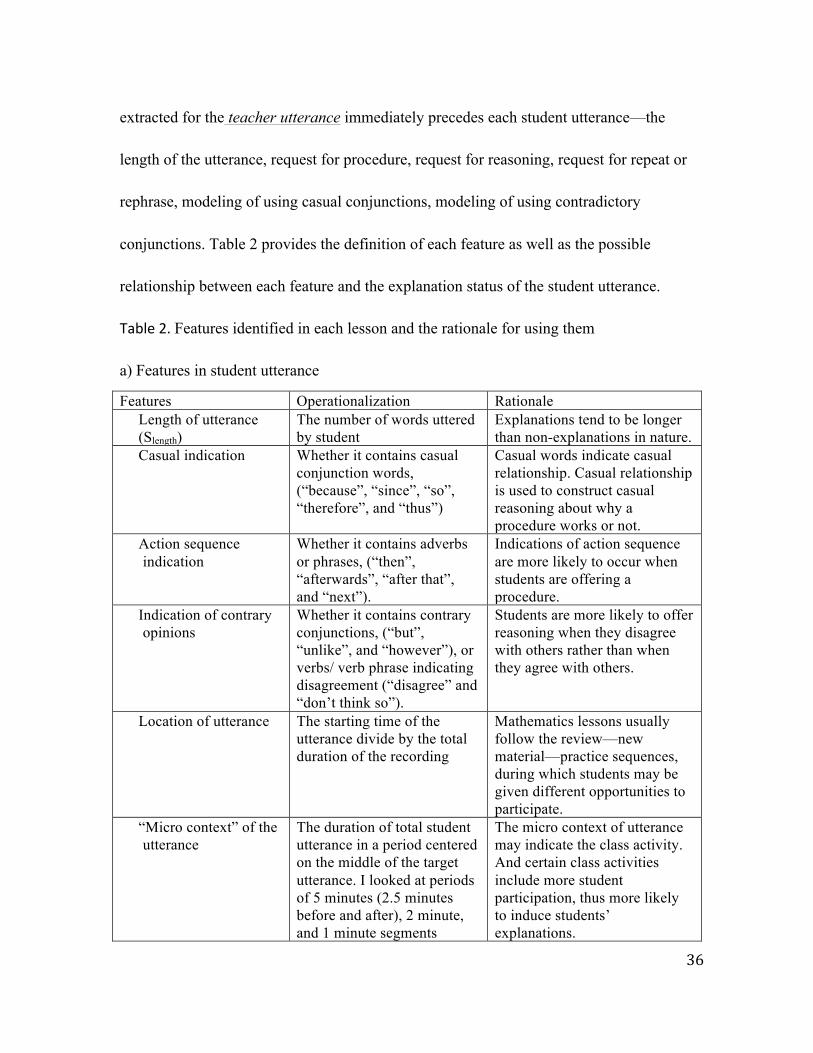
36
extracted for the teacher utterance immediately precedes each student utterance—the
length of the utterance, request for procedure, request for reasoning, request for repeat or
rephrase, modeling of using casual conjunctions, modeling of using contradictory
conjunctions. Table 2 provides the definition of each feature as well as the possible
relationship between each feature and the explanation status of the student utterance.
Table 2. Features identified in each lesson and the rationale for using them
a) Features in student utterance
Features Operationalization Rationale Length of utterance (Slength)
The number of words uttered by student
Explanations tend to be longer than non-explanations in nature.
Casual indication Whether it contains casual conjunction words, (“because”, “since”, “so”, “therefore”, and “thus”)
Casual words indicate casual relationship. Casual relationship is used to construct casual reasoning about why a procedure works or not.
Action sequence indication
Whether it contains adverbs or phrases, (“then”, “afterwards”, “after that”, and “next”).
Indications of action sequence are more likely to occur when students are offering a procedure.
Indication of contrary opinions
Whether it contains contrary conjunctions, (“but”, “unlike”, and “however”), or verbs/ verb phrase indicating disagreement (“disagree” and “don’t think so”).
Students are more likely to offer reasoning when they disagree with others rather than when they agree with others.
Location of utterance The starting time of the utterance divide by the total duration of the recording
Mathematics lessons usually follow the review—new material—practice sequences, during which students may be given different opportunities to participate.
“Micro context” of the utterance
The duration of total student utterance in a period centered on the middle of the target utterance. I looked at periods of 5 minutes (2.5 minutes before and after), 2 minute, and 1 minute segments
The micro context of utterance may indicate the class activity. And certain class activities include more student participation, thus more likely to induce students’ explanations.
37
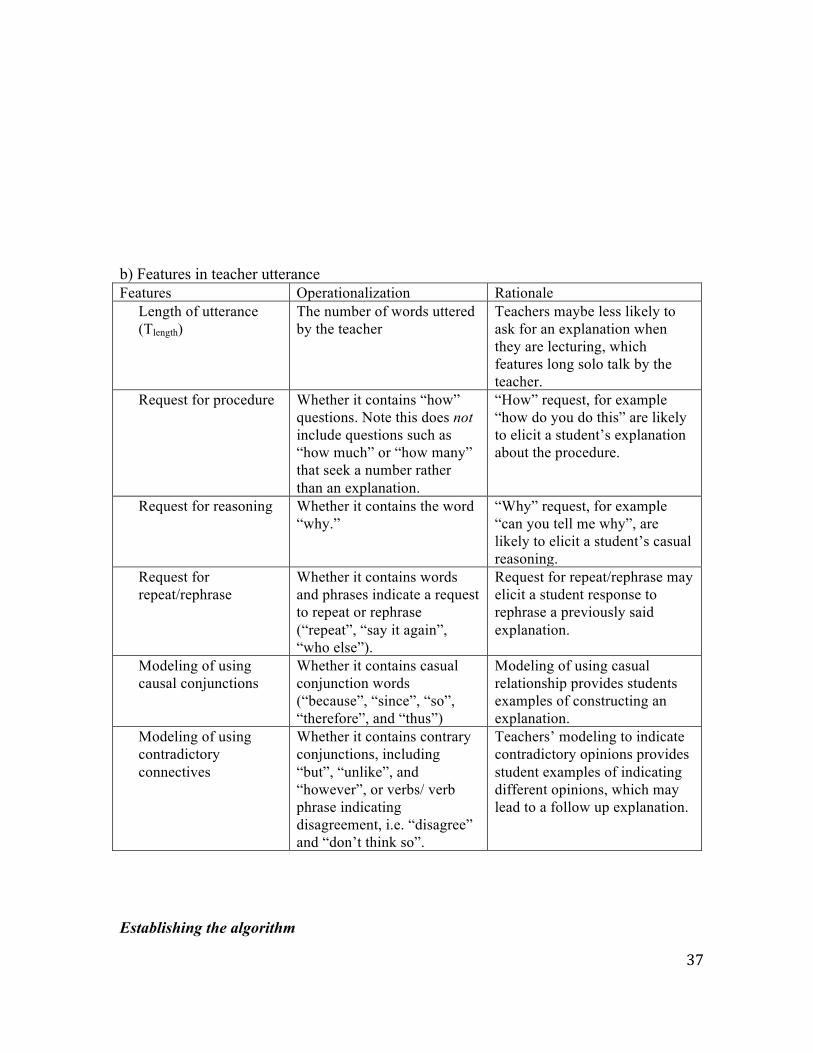
b) Features in teacher utterance Features Operationalization Rationale
Length of utterance (Tlength)
The number of words uttered by the teacher
Teachers maybe less likely to ask for an explanation when they are lecturing, which features long solo talk by the teacher.
Request for procedure Whether it contains “how” questions. Note this does not include questions such as “how much” or “how many” that seek a number rather than an explanation.
“How” request, for example “how do you do this” are likely to elicit a student’s explanation about the procedure.
Request for reasoning Whether it contains the word “why.”
“Why” request, for example “can you tell me why”, are likely to elicit a student’s casual reasoning.
Request for repeat/rephrase
Whether it contains words and phrases indicate a request to repeat or rephrase (“repeat”, “say it again”, “who else”).
Request for repeat/rephrase may elicit a student response to rephrase a previously said explanation.
Modeling of using causal conjunctions
Whether it contains casual conjunction words (“because”, “since”, “so”, “therefore”, and “thus”)
Modeling of using casual relationship provides students examples of constructing an explanation.
Modeling of using contradictory connectives
Whether it contains contrary conjunctions, including “but”, “unlike”, and “however”, or verbs/ verb phrase indicating disagreement, i.e. “disagree” and “don’t think so”.
Teachers’ modeling to indicate contradictory opinions provides student examples of indicating different opinions, which may lead to a follow up explanation.
Establishing the algorithm
38
Half of the coded transcripts (30 HK lessons, 15 JP lessons, and 24 US lessons) were
used as the training set, while the remaining coded sample were used as testing set to
establish the reliability of the algorithm.
The Random Forest (RF) algorithm was used to tune the model. The main idea of
RF algorithm is to generate perturbed versions of the training data by drawing from that
dataset a series of samples (with replacement) of the same size as the original set T, then
training a classification tree on each perturbed version, and aggregating the results by
majority voting (Breiman, 2001). The perturbed versions of the training data are obtained
by creating B bootstrapped training data sets T1, T2… TB. The observations not included
in the bootstrapped sample Tb form an out-of-bag sample that can be used to calculate the
error for that training set. The training of each classification tree is described as follows:
at every node, consider only a random set of variables for the next split. Trees will be
grown to maximum size and not pruned. The majority voting process will classify each
new observation X to the majority class predicted by the B classifiers.
Empirical evidence suggests several advantages of the RF algorithm. Firstly,
over-fitting due to growing the tree to maximum size is not an issue (Breiman, 2001).
Secondly, performance of RF is insensitive to outliers in the training data. Thirdly, RF
algorithm requires the selection of only a small number of variables at every node, hence
is more efficient than other algorithms such as traditional classification tree. Finally, the
algorithm provides a mechanism for estimating the importance of each variable in the
39
ensemble, which provides a way to directly examine the predictive power of each
indicator.
The variable importance estimate is obtained as follows: After each tree is
constructed, the values of each variable in the out-of-sample sample are randomly
permuted and the out-of-bag sample is run down the tree and therefore a classification for
each observation is obtained. Thus, p misclassification error rates are obtained and the
output is the percent increase in misclassification rate as compared to the out-of-sample
rate with all variables intact.
Analysis plan
Firstly, reliability of the algorithm prediction will be examined on both the utterance
and the classroom level. Algorithm predictions will be used for further analysis only if its
agreement with a human coder is at least as good as the agreement between two human
coders.
Secondly, utterance level analysis will focus on the context of student explanations.
Specifically, I will examine the utterance immediately preceding a student explanation. I
will also examine the classroom activity during which student explanations were
produced.
Lastly, classroom level analysis will focus on the classroom discourse features which
predict the amount of students’ explanations in that class. Cross-national differences in
the amount of student explanations as well as its association with other classroom
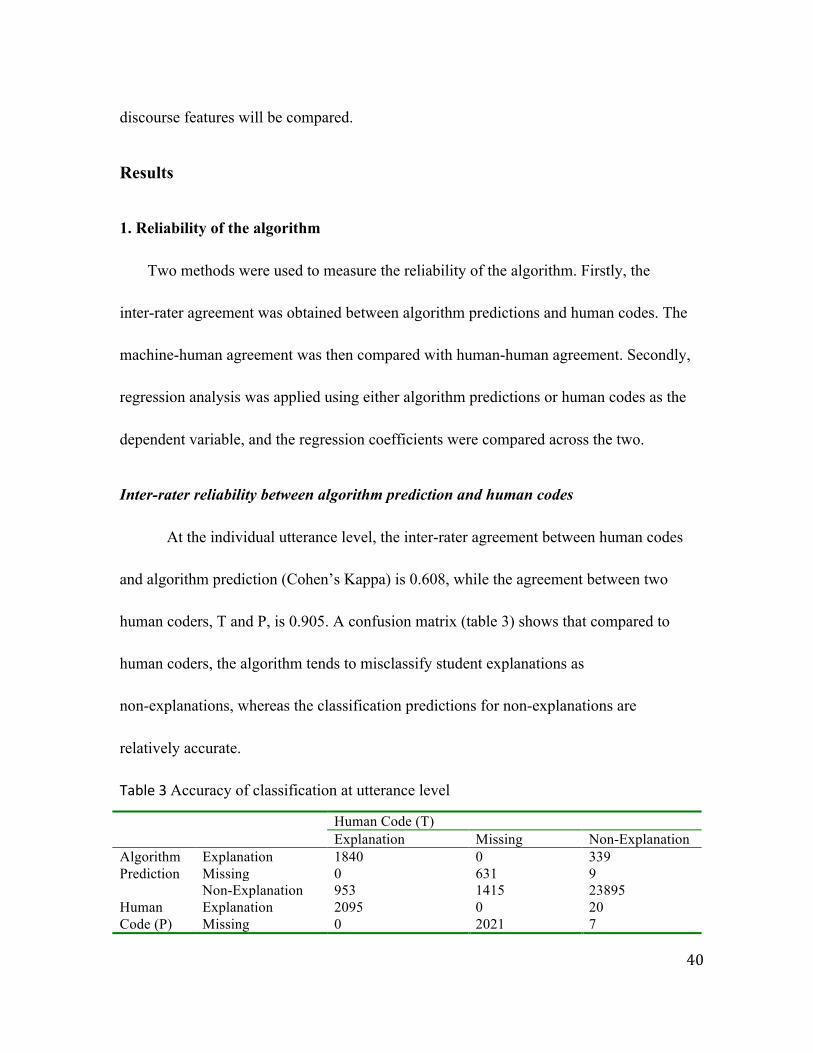
40
discourse features will be compared.
Results
1. Reliability of the algorithm
Two methods were used to measure the reliability of the algorithm. Firstly, the
inter-rater agreement was obtained between algorithm predictions and human codes. The
machine-human agreement was then compared with human-human agreement. Secondly,
regression analysis was applied using either algorithm predictions or human codes as the
dependent variable, and the regression coefficients were compared across the two.
Inter-rater reliability between algorithm prediction and human codes
At the individual utterance level, the inter-rater agreement between human codes
and algorithm prediction (Cohen’s Kappa) is 0.608, while the agreement between two
human coders, T and P, is 0.905. A confusion matrix (table 3) shows that compared to
human coders, the algorithm tends to misclassify student explanations as
non-explanations, whereas the classification predictions for non-explanations are
relatively accurate.
Table 3 Accuracy of classification at utterance level
Human Code (T) Explanation Missing Non-Explanation
Algorithm Prediction
Explanation 1840 0 339 Missing 0 631 9 Non-Explanation 953 1415 23895
Human Code (P)
Explanation 2095 0 20 Missing 0 2021 7
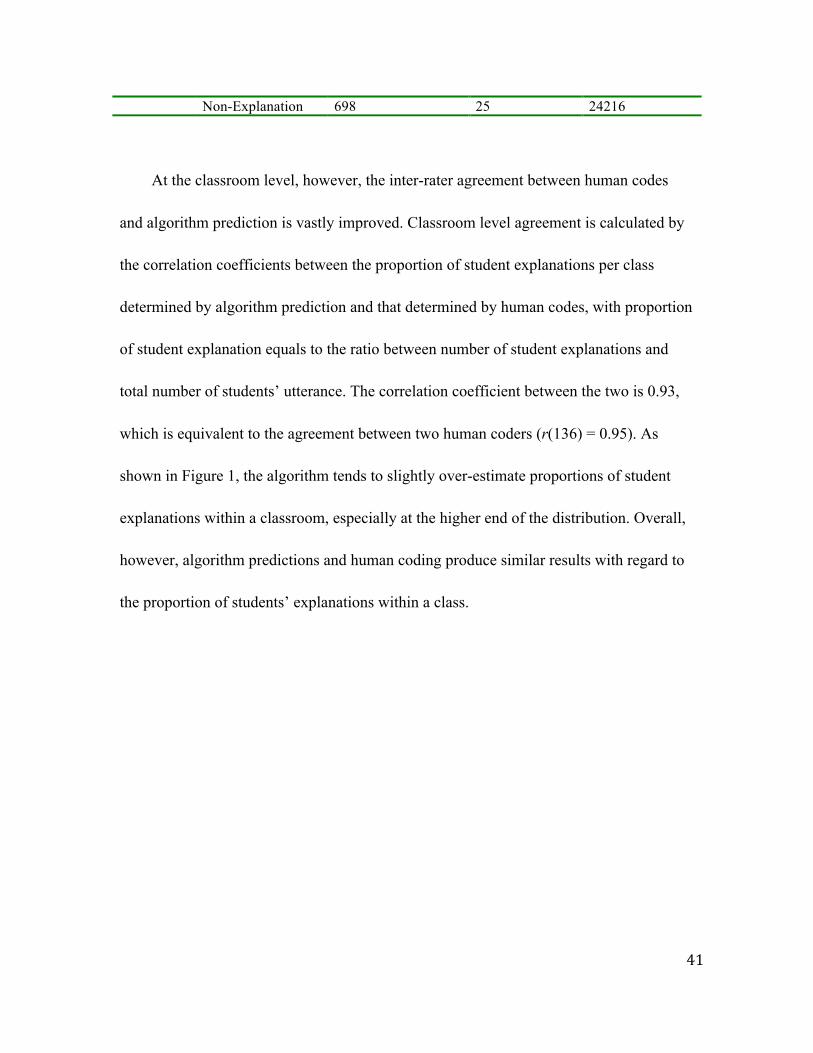
41
Non-Explanation 698 25 24216
At the classroom level, however, the inter-rater agreement between human codes
and algorithm prediction is vastly improved. Classroom level agreement is calculated by
the correlation coefficients between the proportion of student explanations per class
determined by algorithm prediction and that determined by human codes, with proportion
of student explanation equals to the ratio between number of student explanations and
total number of students’ utterance. The correlation coefficient between the two is 0.93,
which is equivalent to the agreement between two human coders (r(136) = 0.95). As
shown in Figure 1, the algorithm tends to slightly over-estimate proportions of student
explanations within a classroom, especially at the higher end of the distribution. Overall,
however, algorithm predictions and human coding produce similar results with regard to
the proportion of students’ explanations within a class.

42
Figure 1 Relationship between machine and human code at classroom level (N=138)
Comparison of regression results using algorithm prediction or human codes
Mixed linear models (see lme4 package in R, Bates, Maechler & Bolker, 2012)
were used to estimate the influence of classroom features as well as country of origin on
the proportion of student explanations per class. Forward stepwise selection method was
used to select the best-fitting model. Forward selection starts with a null model that
contains only the random effect of country and no classroom level predictors. Predictors
are then entered into the model one at a time. Only the ones who significantly improve
0.0 0.1 0.2 0.3 0.4 0.5
0.0
0.1
0.2
0.3
0.4
0.5
0.6
Percentage of S explanation, Human codes
Per
cent
age
of S
exp
lana
tion,
Mac
hine
cod
es
Correlation between Machine & Human codes
=0.93
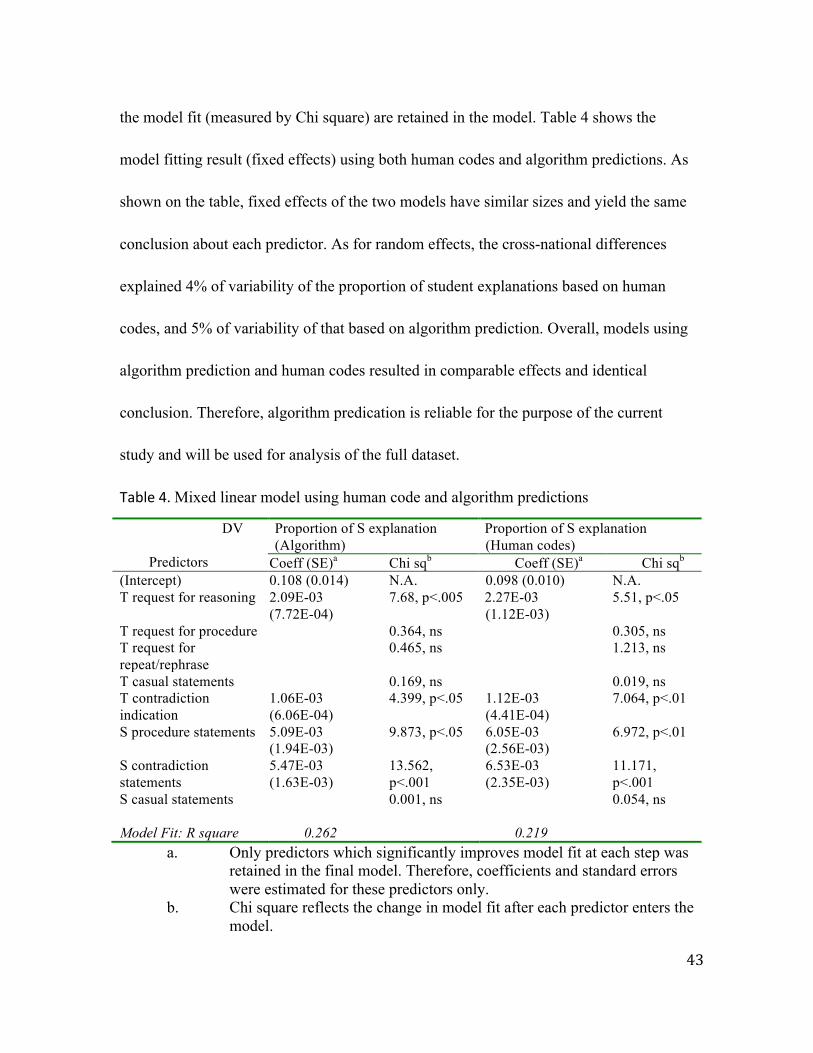
43
the model fit (measured by Chi square) are retained in the model. Table 4 shows the
model fitting result (fixed effects) using both human codes and algorithm predictions. As
shown on the table, fixed effects of the two models have similar sizes and yield the same
conclusion about each predictor. As for random effects, the cross-national differences
explained 4% of variability of the proportion of student explanations based on human
codes, and 5% of variability of that based on algorithm prediction. Overall, models using
algorithm prediction and human codes resulted in comparable effects and identical
conclusion. Therefore, algorithm predication is reliable for the purpose of the current
study and will be used for analysis of the full dataset.
Table 4. Mixed linear model using human code and algorithm predictions
DV Predictors
Proportion of S explanation (Algorithm)
Proportion of S explanation (Human codes)
Coeff (SE)a Chi sqb Coeff (SE)a Chi sqb (Intercept) 0.108 (0.014) N.A. 0.098 (0.010) N.A. T request for reasoning 2.09E-03
(7.72E-04) 7.68, p<.005 2.27E-03
(1.12E-03) 5.51, p<.05
T request for procedure 0.364, ns 0.305, ns T request for repeat/rephrase
0.465, ns 1.213, ns
T casual statements 0.169, ns 0.019, ns T contradiction indication
1.06E-03 (6.06E-04)
4.399, p<.05 1.12E-03 (4.41E-04)
7.064, p<.01
S procedure statements 5.09E-03 (1.94E-03)
9.873, p<.05 6.05E-03 (2.56E-03)
6.972, p<.01
S contradiction statements
5.47E-03 (1.63E-03)
13.562, p<.001
6.53E-03 (2.35E-03)
11.171, p<.001
S casual statements 0.001, ns 0.054, ns Model Fit: R square 0.262 0.219
a. Only predictors which significantly improves model fit at each step was retained in the final model. Therefore, coefficients and standard errors were estimated for these predictors only.
b. Chi square reflects the change in model fit after each predictor enters the model.
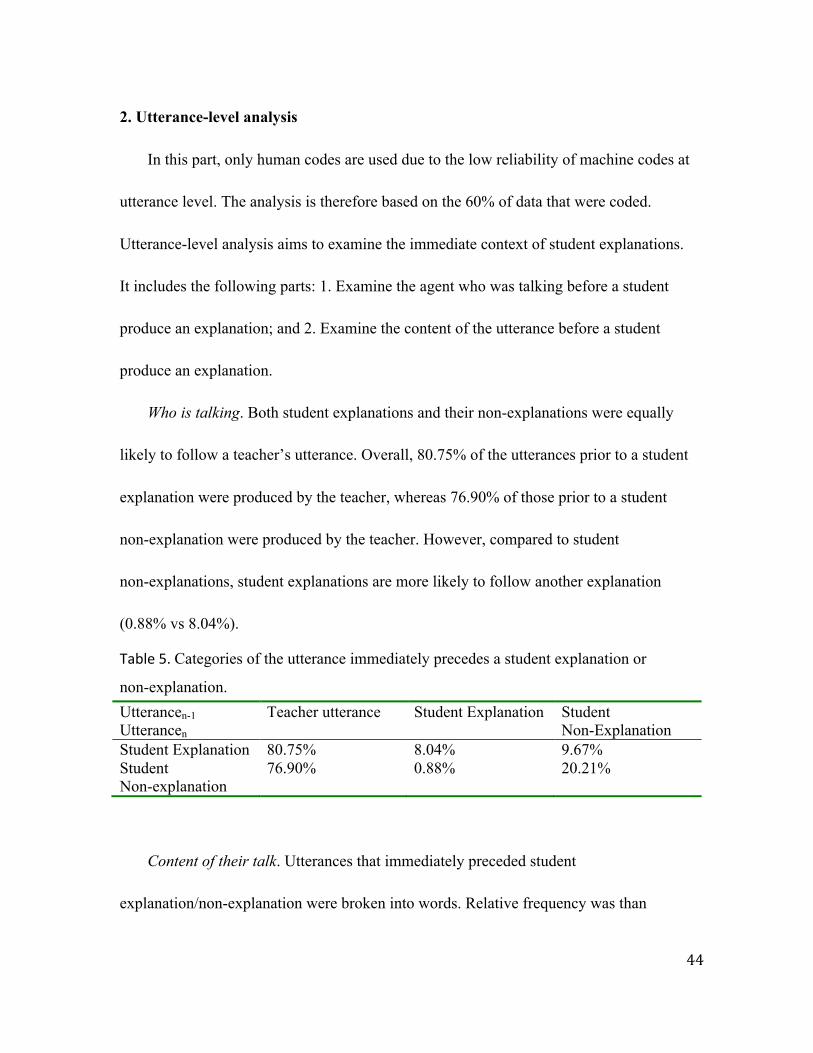
44
2. Utterance-level analysis
In this part, only human codes are used due to the low reliability of machine codes at
utterance level. The analysis is therefore based on the 60% of data that were coded.
Utterance-level analysis aims to examine the immediate context of student explanations.
It includes the following parts: 1. Examine the agent who was talking before a student
produce an explanation; and 2. Examine the content of the utterance before a student
produce an explanation.
Who is talking. Both student explanations and their non-explanations were equally
likely to follow a teacher’s utterance. Overall, 80.75% of the utterances prior to a student
explanation were produced by the teacher, whereas 76.90% of those prior to a student
non-explanation were produced by the teacher. However, compared to student
non-explanations, student explanations are more likely to follow another explanation
(0.88% vs 8.04%).
Table 5. Categories of the utterance immediately precedes a student explanation or
non-explanation. Utterancen-1 Utterancen
Teacher utterance Student Explanation Student Non-Explanation
Student Explanation 80.75% 8.04% 9.67% Student Non-explanation
76.90% 0.88% 20.21%
Content of their talk. Utterances that immediately preceded student
explanation/non-explanation were broken into words. Relative frequency was than
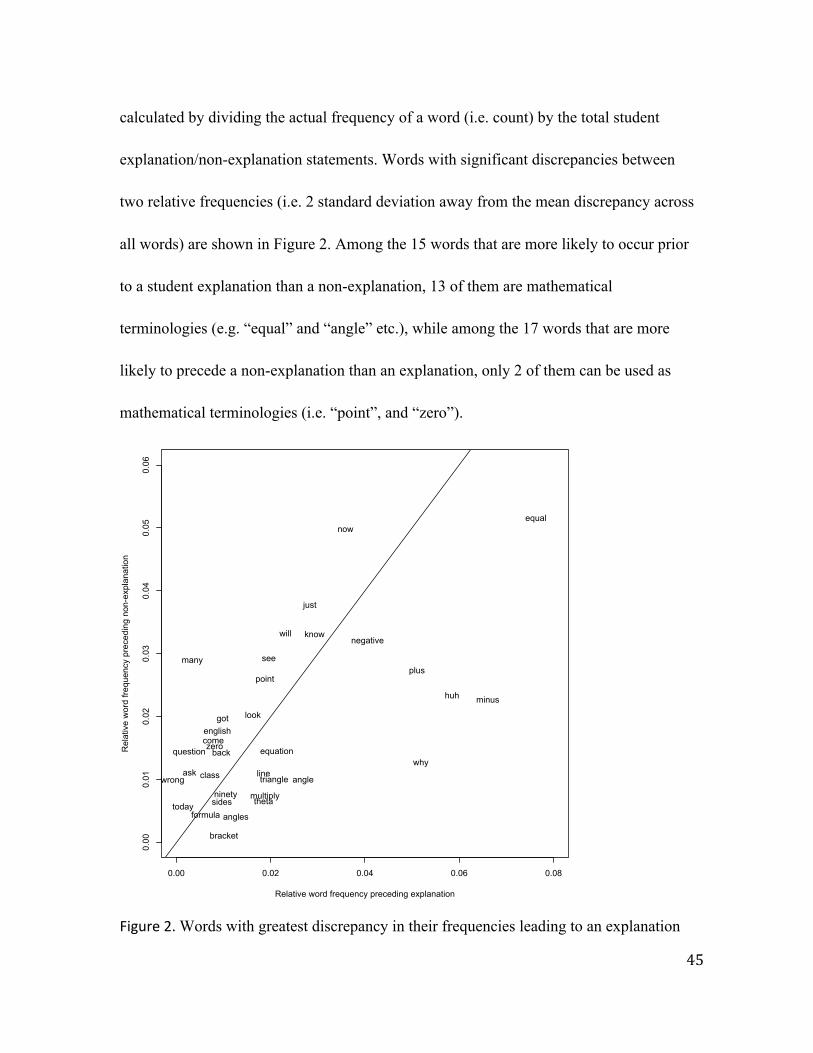
45
calculated by dividing the actual frequency of a word (i.e. count) by the total student
explanation/non-explanation statements. Words with significant discrepancies between
two relative frequencies (i.e. 2 standard deviation away from the mean discrepancy across
all words) are shown in Figure 2. Among the 15 words that are more likely to occur prior
to a student explanation than a non-explanation, 13 of them are mathematical
terminologies (e.g. “equal” and “angle” etc.), while among the 17 words that are more
likely to precede a non-explanation than an explanation, only 2 of them can be used as
mathematical terminologies (i.e. “point”, and “zero”).
Figure 2. Words with greatest discrepancy in their frequencies leading to an explanation
0.00 0.02 0.04 0.06 0.08
0.00
0.01
0.02
0.03
0.04
0.05
0.06
Relative word frequency preceding explanation
Rel
ativ
e w
ord
frequ
ency
pre
cedi
ng n
on-e
xpla
natio
n
minushuh
plus
why
negative
equalnow
just
knowwill
angle
equation
triangle
see
point
line
thetamultiplyninety
look
sides
anglesformula
bracket
got
back
english
zerocome
question
many
ask classwrong
today
46
(Nex=3568) and a non-explanation (Nnon=29590)
3. Classroom-level analysis
In this part, I will focus on the factors that predict the differences in the percent of
student math explanations across classrooms. The percent of student math explanations
per classroom is defined as the ratio between total number of student explanations and the
total number of student utterances.
There are significant differences in the amount of student explanations in three
countries, F(2, 229)=21.21, p<. 0.001. HK students (M=.0583, SD=.0466) and JP
students (M=.0465, SD=.0422) both produced higher proportion of explanations than
students in US (M=.0227, SD=.0145).
Linear regression was conducted separately within each country, and relationships
between classroom features and proportions of students’ explanations were estimated. In
each model, the length of classes was controlled by dividing the number of class features
by the total time of that class. As shown in table 6, relationships between class features
and amount of student explanation show both similarity as well as difference between 3
countries. Looking first at commonalities, in all 3 countries, the more chance students get
to talk (i.e. higher percentage of student talk time), the more explanations they produce.
Other student related features (i.e. the amount of students’ procedure statements,
contradiction indication, as well as their causal statements) do not have a significant
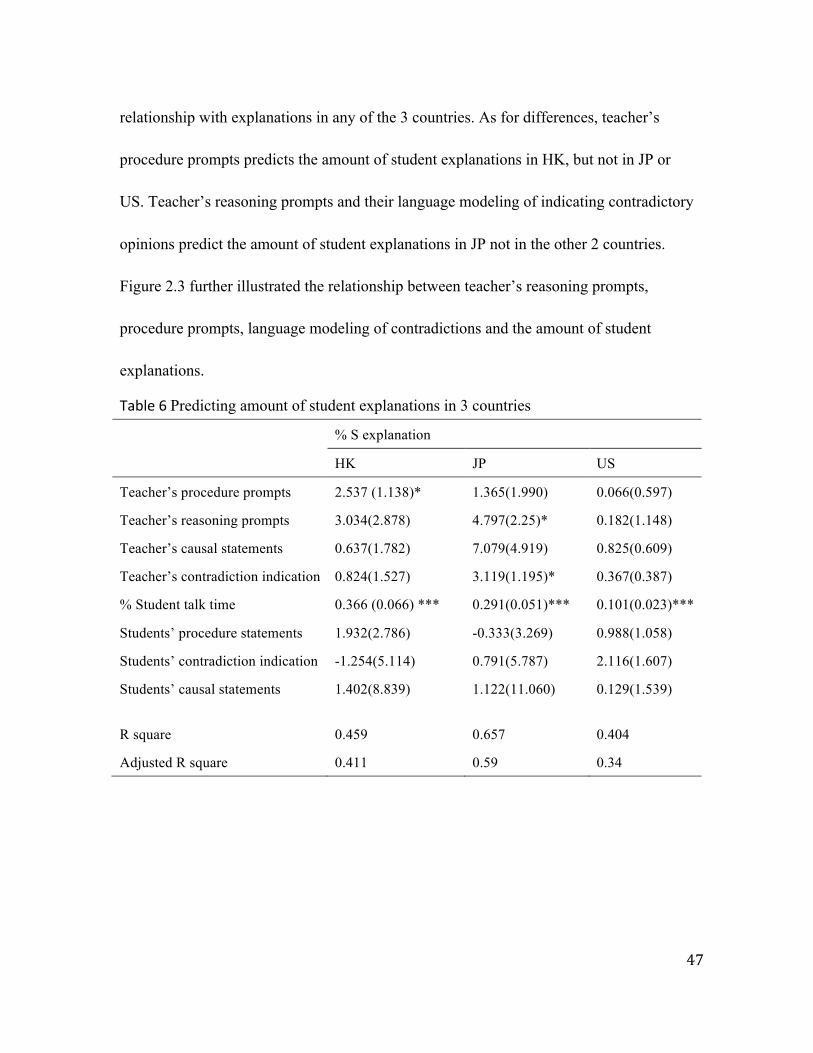
47
relationship with explanations in any of the 3 countries. As for differences, teacher’s
procedure prompts predicts the amount of student explanations in HK, but not in JP or
US. Teacher’s reasoning prompts and their language modeling of indicating contradictory
opinions predict the amount of student explanations in JP not in the other 2 countries.
Figure 2.3 further illustrated the relationship between teacher’s reasoning prompts,
procedure prompts, language modeling of contradictions and the amount of student
explanations.
Table 6 Predicting amount of student explanations in 3 countries
% S explanation
HK JP US
Teacher’s procedure prompts 2.537 (1.138)* 1.365(1.990) 0.066(0.597)
Teacher’s reasoning prompts 3.034(2.878) 4.797(2.25)* 0.182(1.148)
Teacher’s causal statements 0.637(1.782) 7.079(4.919) 0.825(0.609)
Teacher’s contradiction indication 0.824(1.527) 3.119(1.195)* 0.367(0.387)
% Student talk time 0.366 (0.066) *** 0.291(0.051)*** 0.101(0.023)***
Students’ procedure statements 1.932(2.786) -0.333(3.269) 0.988(1.058)
Students’ contradiction indication -1.254(5.114) 0.791(5.787) 2.116(1.607)
Students’ causal statements 1.402(8.839) 1.122(11.060) 0.129(1.539)
R square 0.459 0.657 0.404
Adjusted R square 0.411 0.59 0.34

48
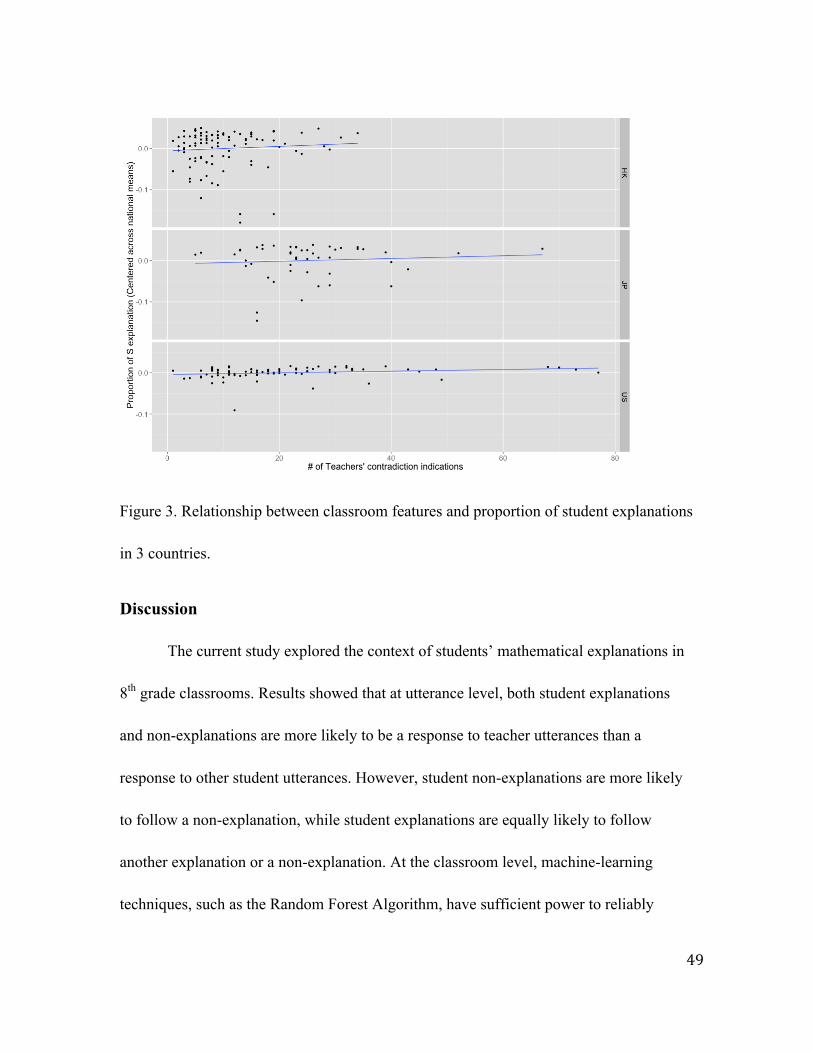
49
Figure 3. Relationship between classroom features and proportion of student explanations
in 3 countries.
Discussion
The current study explored the context of students’ mathematical explanations in
8th grade classrooms. Results showed that at utterance level, both student explanations
and non-explanations are more likely to be a response to teacher utterances than a
response to other student utterances. However, student non-explanations are more likely
to follow a non-explanation, while student explanations are equally likely to follow
another explanation or a non-explanation. At the classroom level, machine-learning
techniques, such as the Random Forest Algorithm, have sufficient power to reliably
50
predict total number of student explanations per class. Associations between classroom
linguistic features and the amount of student explanations differ across countries. In
United States, only the proportion of student talk time has a significant positive
relationship with the amount of students’ math explanations produced (adjusted for total
class length). In Hong Kong, both the proportion of student talk time and teacher’s
prompts for problem solving procedures significantly predict the amount of student math
explanations per class. In Japan, beyond the proportion of student talk time, teacher’s
prompts for reasoning, as well as their language modeling of offering contradicting
opinions possess significant positive relationship with the amount of student math
explanations.
The categorization of explanation and non-explanation was based on prior
analysis of mathematical explanations (Hill et. al., 2008; CCSS, 2010; Duffy et al., 1986).
Specifically, both functions as well as content of statements were used to determine
whether it qualifies as an explanation. As for function, statements may be a medium for
student interaction with peers and the teacher (e.g. communicating their math ideas or
responding to others), or they can serve as self-explanations. As for content of the
statements, they need to convey complete meanings on its own and contain one of the
following information: a description of a procedure or a definition/rule; an analysis of the
problem’s condition, including its givens, structures, and breakdown of the problem
solving goals; a justification of one’s (or other’s) problem solving. The validity of such
51
categorization is justified by the agreement between human coders. As shown in table 3,
there is high agreement between two independent human coders at both utterance level as
well as classroom level. At utterance level, Cohen’s Kappa between two human coders is
0.905, with a 95% confidence interval of (0.897, 0.913). According to Landis and Koch
(1977), this value indicates almost perfect agreement. At class level, the correlations
between the percentage of student explanations using codes from two human coders
reaches 0.95, which again indicates almost perfect agreement.
The agreement between algorithm prediction and human coder shows similar
level of agreement at classroom level yet less satisfactory result at utterance level. The
moderate agreement between human code and algorithm prediction (Cohen’s
Kappa=0.608, 95% CI 0.594- 0.622) is significantly lower than the agreement between
two human coders. This may due to the difficulty the algorithm may have locating an
explanation within teachers’ conversational exchange with several students in a row. For
example, in the following segment, human coders will only classify the first two student
utterances explanations, as they were used to describe Jen’s problem solving process. The
third statement, provided by Alex, however, was simply repeating teachers’ sentence and
hence were not classified as an explanation. However, the algorithm recognizes all
bolded statements as explanations, as the 2nd and the 3rd statements looked almost
identical in the linguistic features.
T: Ok next problem. What do you start with, Jen?
52
S: I start with 6
T: Then you do what?
S: 6 times x plus 2…
T: Okay. Alex, were you listening? 6 times x plus what?
S: 6 times x plus what…
T: What would you do next? Plus 2 or minus 2?
S: Minus 2.
These classification errors, although they influenced utterance level accuracy,
showed little impact on classroom level reliability. At the classroom level, the correlation
between human codes and algorithm prediction reaches 0.93, which is similar in size to
the correlation between two human codes. In summary, the total amount of student
explanations obtained from the algorithm prediction and that from manual coding showed
high convergence; thus the classification algorithm provide reliable information on this
measure.
This classification of student mathematical explanations, together
with computerized processing, inform us about the students’ involvement in class, and
has the potential to create meaningful feedback for teachers’ classroom discourse
management. First, the amount of student explanations per class can inform teachers
about their students’ involvement in mathematics. Recent work in teachers’ professional
development (e.g. Pianta, Belsky, Houts & Morrison, 2007; Walkowiak, Berry, Meyer,
53
Rimm-Kaufman, & Ottmar, 2014) showed that providing teachers with feedback on how
much their students were meaningfully involved in mathematics discussion could
potentially help teachers to provide instructional support for students when needed. These
support, including language modeling, encouraging analysis and inquiry, have potential
to improve students’ learning outcome (Allen, Gregory, Mikami, Lun, Hamre, & Pianta,
2013).
Moreover, current results also indicated potential instructional strategies to
encourage students’ mathematical explanations in classrooms. As shown in Table 2.6 and
Figures 2.3, the overall quantity of student talk positively relates to the amount of
explanations produced by students. Over and above the overall amount of student talks,
however, teachers’ discourse features also positively predict the amount of student math
explanations. These features include teachers’ request for procedure description or
reasoning, and their indication of contradictory opinions. Teachers’ request for procedure
and reasoning, or their how and why questions, may request their effort in using
instructional discussions and activities to promote students higher-order thinking. Higher
percent of such requests can result from frequent teacher questions or back-and-forth
exchanges between the teacher and students, known as “feedback loops”(Pianta & Hamre,
2009). Meanwhile, teachers’ use of contradictory indications may serve as feedback for
students or an invitation for brainstorming of ideas (Hamre, LoCasale-Crouch, & Pianta,
2008), it may also model how to propose different ideas and solutions in the classroom
54
(Yackel & Cobb, 1996). Higher percent of such features may reflect teacher’s effort to
extend students’ learning through their responses to students’ ideas, comments, and work.
It is also worth noticing that the amount of student mathematical explanations, as
well as its relationship with teachers’ language features, differs across countries.
Compared to HK and JP classrooms, the amount of student explanations in US
classrooms is much lower. This result coincide with previous findings that not only US
students get fewer opportunities to talk in classroom (Sims et al., 2008), and when they
talk, they are less likely to be asked for explanations.
As for the relationship between teachers’ language features and the amount of
student explanations, current result suggest moderate positive relation between the two in
both Japan and Hong Kong, but no significant relationship were detected between the two
in the United States classrooms. These findings can be explained by the possible
difference in teachers’ effectiveness in using instructional methods, specifically the
richness of feedback and the effectiveness of teacher questioning. Prior research
suggested that US teachers tend to only provide their students with feedback on the
correctness of their answer rather than asking them to elaborate on their reasoning (Pianta,
Belsky, Houts & Morrison, 2007). And when teachers do ask for elaborations, they vary
in how persistent they are with such efforts as well as how successful they are to elicit
student explanations. For example, in the following table, the teacher in Segment A asked
the question “What is it”, which can be interpreted as either asking for a description of
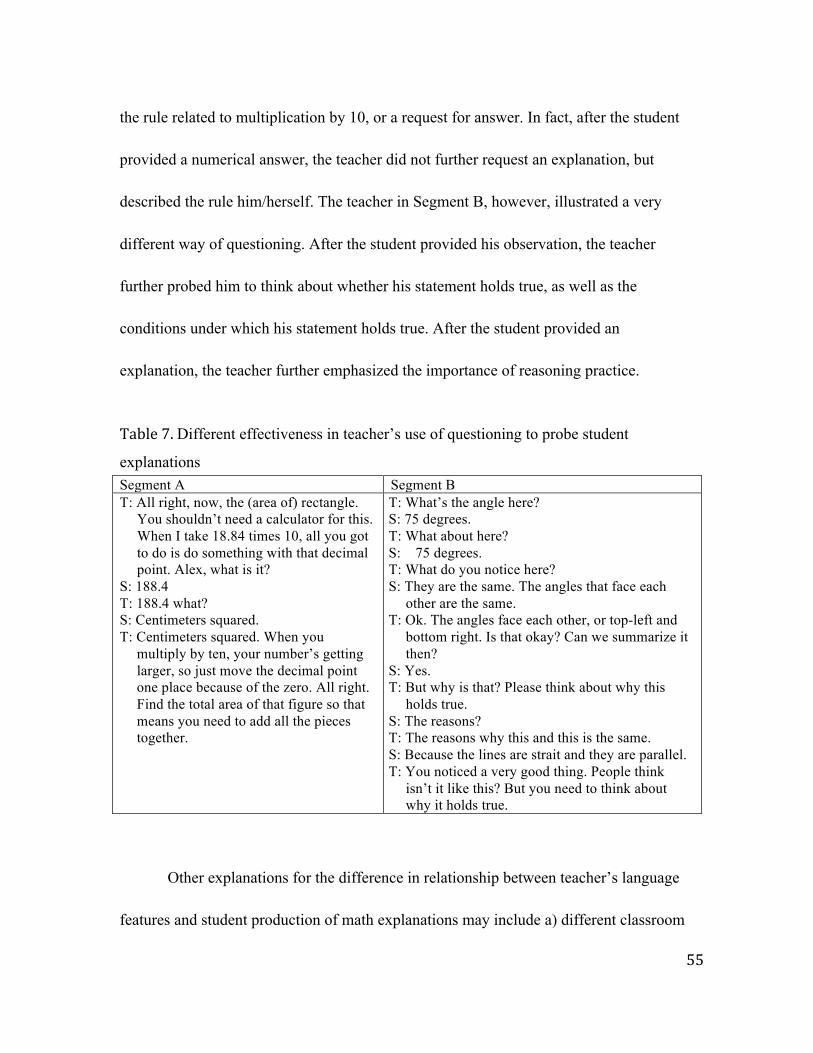
55
the rule related to multiplication by 10, or a request for answer. In fact, after the student
provided a numerical answer, the teacher did not further request an explanation, but
described the rule him/herself. The teacher in Segment B, however, illustrated a very
different way of questioning. After the student provided his observation, the teacher
further probed him to think about whether his statement holds true, as well as the
conditions under which his statement holds true. After the student provided an
explanation, the teacher further emphasized the importance of reasoning practice.
Table 7. Different effectiveness in teacher’s use of questioning to probe student
explanations Segment A Segment B T: All right, now, the (area of) rectangle.
You shouldn’t need a calculator for this. When I take 18.84 times 10, all you got to do is do something with that decimal point. Alex, what is it?
S: 188.4 T: 188.4 what? S: Centimeters squared. T: Centimeters squared. When you
multiply by ten, your number’s getting larger, so just move the decimal point one place because of the zero. All right. Find the total area of that figure so that means you need to add all the pieces together.
T: What’s the angle here? S: 75 degrees. T: What about here? S: 75 degrees. T: What do you notice here? S: They are the same. The angles that face each
other are the same. T: Ok. The angles face each other, or top-left and
bottom right. Is that okay? Can we summarize it then?
S: Yes. T: But why is that? Please think about why this
holds true. S: The reasons? T: The reasons why this and this is the same. S: Because the lines are strait and they are parallel. T: You noticed a very good thing. People think
isn’t it like this? But you need to think about why it holds true.
Other explanations for the difference in relationship between teacher’s language
features and student production of math explanations may include a) different classroom
56
norms across three countries, and b) different mathematics topics influence the nature of
interaction. Yackel & Cobb (1996) proposed that what is considered as an acceptable
mathematical explanation differs across classrooms. This normative aspect of
mathematics discourse is almost never stated explicitly in a classroom, but established
implicitly through teacher’s response to students’ input. Hence, teachers may direct
students’ input as well as their attention to different directions. Secondly, different
mathematics topics may also influence the nature of discussion. Within the current
dataset, over 80% of Japanese lessons were focusing on geometry, compared to about 20%
of such content focus in two other countries. Compared to other content areas such as
arithmetic and algebra, problem solving in geometry makes the need for mathematical
proof explicit (Bell, 1976; Maher & Martino, 1996; Shoenfeld, 1989). The differences in
contents of classes across the three countries may therefore influence both how students
approach the problems as well as teachers’ expectation for students interaction with
mathematical content.
Limitations of the study and future directions:
One obvious limitation of the current study is that the analysis was based on a
historical dataset. TIMSS videos were collected in 1999, and classrooms may have
changed in the past 15 years. Change in educational policy (e.g. curriculum standards,
teacher accountability policies) as well as new technology (e.g. computer and mobile
devices, see Seol, Sharp & Kim, 2011 for example) may both influence teacher-student
57
interaction hence the quantity and quality of students’ explanations in the classroom. The
current large-scale classroom-video collection effort (e.g. Bill and Melinda Gates
Foundation, see Ho & Kane, 2013) can possibly inform us about the changes and the
trends in classroom interactions.
Another limitation of the current study involves the form of explanations. With
the current dataset, I focused on students’ audible verbal explanations only. This means
that students talk in private or small groups were not captured (i.e. inaudible) due to the
limitation of recording. Students’ talk in pairs and in small groups can differ from how
they talk in whole class discussions. When students work in small groups, their verbal
expressions are more likely to be influenced by the nature of task as well as the peers
than the teacher. They may be more likely to produce elaborated explanations when there
is a disagreement within their group (Schwarz, Neuman, & Biezuner, 2000; Reznitskaya,
& Geogory, 2013). Using classroom transcripts on focusing on verbal explanations also
means that non-verbal information is beyond the current scope. Non-verbal information
includes diagrams and other visuals students create, the tools they choose to use, and their
gestures. Prior studies have shown that students’ thinking and reasoning happens in and is
expressed through semiotic coordination between speech, body, gestures, symbol, and
tools (Novack, Congdon, Hemani-Lopez, & Goldin-Meadow, 2014; Radford, 2009).
Collecting and recording information from all such modalities is certainly challenging
and usually requires one-on-one testing. Though hard to achieve in large scale classroom
58
observation, incorporating non-verbal information to verbal expressions will create a
more comprehensive look of students’ productions of explanations, and providing
teachers with more tools to improve students’ learning (Cook, Duffy & Fenn, 2013).
Finally, the current study focused on the quantity of the explanations in
classrooms, but the quality of these explanations can provide additional information
regarding the quality of student math input in classrooms. In the same way that methods
such as latent semantic analysis have proven to be effective at identifying the quality of
written text (Landauer, Foltz & Laham, 1998), techniques such as word-spotting
(Barnwal, Sahni, Singh & Raj, 2012) that look for instances of particularly important
keywords hold promise for adding information about the quality of explanations to the
methods used here.
Summary
The current study focuses on the contexts in which students produce mathematical
explanations and the relation of explanations to achievement on the level of countries. In
order to do this, I developed and validated a machine-learning system for identifying
explanations in transcripts of lessons. This allowed me to look at two related questions: 1)
Are there in fact fewer student explanations in US than in the higher achieving East
Asian locales such as Japan and Hong Kong? 2) What factors predict the prevalence of
student explanations, and do those predictors vary across countries? Through examining
232 mathematics classes in Japan, Hong Kong, and United States, results suggest that
59
Japan and Hong Kong lessons feature more student explanations than US lessons do.
Also, teacher’s request for procedure, reasoning, as well as their language modeling of
providing contradicting opinions positively predicts the number of student explanations
in Hong Kong and Japan, while in US the only factor relates to student explanations is
the portion of student talk per class.
These differences in the amount of student mathematical explanations, as well as its
relationship with teachers’ language features across nations, may indicate variant
emphasis of student explanations across nations, as well as cross-national differences in
effectiveness of instructional practices. One reason for this difference may be that
teachers in the East Asian settings were more stringent in what they accepted as an
adequate explanation.
60
Reference Allen, J., Gregory, A., Mikami, A., Lun, J., Hamre, B., & Pianta, R. (2013). Observations
of effective teacher-student interactions in secondary school classrooms: Predicting student achievement with the classroom assessment scoring system--secondary. School Psychology Review, 42(1), 76-97.
Bates, D., Maechler, M., & Bolker, B. (2012). lme4: Linear mixed-effects models using S4 classes. R package version 0.999999-0. http://CRAN.R-project.org/package=lme4
Bell, A. W. (1976). A study of pupils' proof-explanations in mathematical situations. Educational Studies in Mathematics, 7(1), 23-40.
Bellack, A. A., Kliebard, H., Hyman, R. and Smith, F. (1966). The language of the classroom. New York: Teachers College Press.
Barnwal, S., Sahni, K., Singh, R., & Raj, B. (2012, March). Spectrographic seam patterns for discriminative word spotting. In Acoustics, Speech and Signal Processing (ICASSP), 2012 IEEE International Conference on (pp. 4725-4728).
Breiman, L. (2001). Random forests. Machine learning, 45(1), 5-32.
Cazden, C. B., & Beck, S. W. (2003). Classroom Discourse. In A. C. Graesser, M. A. Gernsbacher & S. R. Goldman (Eds.), Handbook of Discourse Processes (pp. 165-197). Mahwah, New Jersey: Lawrence Erlbaum Associations, Inc.
Chapin, S. H., O’Connor, C., & Anderson, N. C. (2003). Classroom discussions: Using Math Talk to help students learn. Sausalito, CA: Math Solutions.
Cook, S. W., Duffy, R. G., & Fenn, K. M. (2013). Consolidation and transfer of learning after observing hand gesture. Child development, 84(6), 1863-1871.
Duffy, G. G., Roehler, L. R., Meloth, M. S., & Vavrus, L. G. (1986). Conceptualizing instructional explanation. Teaching and Teacher Education,2(3), 197-214.
Eilam, B., & Poyas, Y. (2006). Promoting awareness of the characteristics of classrooms’ complexity: A course curriculum in teacher education. Teaching and Teacher Education, 22(3), 337-351.
Givvin, K. B., Hiebert, J., Jacobs, J. K., Hollingsworth, H., & Gallimore, R. (2005). Are there national patterns of teaching? Evidence from the TIMSS 1999 video study. Comparative Education Review, 49(3), 311-343.
Hamre, B. K., LoCasale-Crouch, J., & Pianta, R. C. (2008). Formative assessment of classrooms: Using classroom observations to improve implementation quality. In L. M. Justice, & C. Vukelich (Eds.), Achieving excellence in preschool literacy instruction (pp. 102-119). New York: Guilford Press.
Hiebert, J., Gallimore, R., Gernier, H., Bogard Givvin, K., Hollingsworth, H., Jacobs, J., … Stigler, J. (2003, March 26). Teaching Mathematics in Seven Countries: Results from the TIMSS 1999 Video Study. Retrieved October 31, 2013, from http://nces.ed.gov/pubsearch/pubsinfo.asp?pubid=2003013
Hiebert, J., & Grouws, D. A. (2007). The effects of classroom mathematics teaching on
61
students' learning. In F. K. Lester (Ed.), Second handbook of research on mathematics teaching and learning (pp. 371-404). Charlotte, NC: Information Age Publishing.
Hill, H. C., Blunk, M. L., Charalambous, C. Y., Lewis, J. M., Phelps, G. C., Sleep, L., & Ball, D. L. (2008). Mathematical Knowledge for Teaching and the Mathematical Quality of Instruction: An Exploratory Study. Cognition and Instruction, 26(4), 430-511.
Ho, A. D., & Kane, T. J. (2013). The Reliability of Classroom Observations by School Personnel. Research Paper. MET Project. Bill & Melinda Gates Foundation.
Inagaki, K., Hatano, G., & Morita, E. (1998). Construction of mathematical knowledge through whole-class discussion. Learning and Instruction, 8(6), 503-526.
Kliebard, H. M. (1966). The Patterning of Classroom Discourse. Journal of Teacher Education, 17(4), 469-480.
Landauer, T. K., Foltz, P. W., & Laham, D. (1998). An introduction to latent semantic analysis. Discourse processes, 25(2-3), 259-284.
Landis, J. R., & Koch, G. G. (1977). The Measurement of Observer Agreement for Categorical Data. Biometrics, 33(1), 159-174.
LessonLab. (n.d.). TIMSS-R video math coding manual. Retrieved from http://timssvideo.com/sites/default/files/Math%20Coding%20Manual.pdf
Maher, C. A., & Martino, A. M. (1996). The development of the idea of mathematical proof: A 5-year case study. Journal for Research in Mathematics Education, 27, 194-214.
Mehan, H. (1979). Learning lessons: Social organization in the classroom (p. 80). Cambridge, MA: Harvard University Press.
Nassaji, H., & Wells, G. (2000). What's the use of'triadic dialogue'?: An investigation of teacher-student interaction. Applied linguistics, 21(3), 376-406.
National Governors Association Center for Best Practices, & Council of Chief State School Officers. (2010). Common Core State Standards for Mathematics. Washington D.C. : National Governors Association Center for Best Practices, Council of Chief State School Officers.
National Council of Teachers of Mathematics (NCTM). (1991, 2000). Professional standards for teaching mathematics. Reston, VA: National Council of Teachers of Mathematics.
Novack, M. A., Congdon, E. L., Hemani-Lopez, N., & Goldin-Meadow, S. (2014). From Action to Abstraction Using the Hands to Learn Math. Psychological science, 25(4), 903-910.
Pianta, R. C., & Hamre, B. K. (2009). Conceptualization, measurement, and improvement of classroom processes: Standardized observation can leverage capacity. Educational Researcher, 38(2), 109-119.
Peak, L. (1996). Pursuing excellence: Initial findings from the Third International
62
Mathematics and Science Study, NCES 97–198. Washington, DC: U.S. Government Printing Office.
Pianta, R. C., Belsky, J., Houts, R., & Morrison, F. (2007). Opportunities to learn in America's elementary classrooms. Science, 315(5820), 1795-1796.
Radford, L. (2009). Why do gestures matter? Sensuous cognition and the palpability of mathematical meanings. Educational Studies in Mathematics,70(2), 111-126.
Reznitskaya, A., & Gregory, M. (2013). Student thought and classroom language: Examining the mechanisms of change in dialogic teaching. Educational Psychologist, 48(2), 114-133.
Schwarz, B. B., Neuman, Y., & Biezuner, S. (2000). Two wrongs may make a right... if they argue together!. Cognition and Instruction, 18(4), 461-494.
Schoenfeld, A. H. (1989). Explorations of students' mathematical beliefs and behavior. Journal for research in mathematics education, 338-355.
Sims, L., Perry, M., McConney, M., Schleppenbach, M., Miller, K., & Wilson, T. (2008). Look who's talking: Differences in math talk in U.S. and Chinese classrooms. Teaching Children Mathematics, 15(2), 120-124.
Slavin, R.E., & Lake, C. (2008). Effective programs in elementary math: An evidence-based synthesis. Review of Educational Research, 78(3), 427-515.
Seol, S., Sharp, A., & Kim, P. (2011). Stanford Mobile Inquiry-based Learning Environment (SMILE): using mobile phones to promote student inquires in the elementary classroom. In Proceedings of the 2011 International Conference on Frontiers in Education: Computer Science & Computer Engineering (pp. 270-276).
Smith, D. G. (1977). College classroom interactions and critical thinking. Journal of Educational Psychology, 69(2), 180-190.
Stigler, J. W., Gonzales, P., Kawanaka, T., Knoll, S., & Serrano, A. (1999). The TIMSS videotape classroom study: Methods and findings from an exploratory research project on eighth-grade mathematics instruction in Germany, Japan, and the United States. Washington, DC: U.S. Department of Education, National Center for Education Statistics.
Stigler, J. W., Gallimore, R., & Hiebert, J. (2000). Using video surveys to compare classrooms and teaching across cultures: Examples and lessons from the TIMSS video studies. Educational Psychologist, 35(2), 87-100.
Tobin, K. (1984). Effects of extended wait time on discourse characteristics and achievement in middle school grades. Journal of Research in Science Teaching, 21(8), 779-791.
Tobin, K. (1986). Effects of teacher wait time on discourse characteristics in mathematics and language arts classes. American Educational Research Journal, 23(2), 191-200.
63
Walkowiak, T., Berry, R., Meyer, J. P., Rimm-Kaufman, S., & Ottmar, E. (2014). Introducing an observational measure of standards-based mathematics teaching practices: Evidence of validity and score reliability. Educational Studies in Mathematics, 85(1), 109-128.
Walsh, S. (2006). Talking the talk of the TESOL classroom. ELT Journal, 60(2), 133-141.
Waring, H. Z. (2009). Moving out of IRF (Initiation‐Response‐Feedback): A Single Case Analysis. Language Learning, 59(4), 796-824.
Yackel, E., & Cobb, P. (1996). Sociomathematical norms, argumentation, and autonomy in mathematics. Journal for research in mathematics education, 458-477.
64
Chapter 3
Quality of mathematical explanation generated by Chinese and US
elementary students: The case of mathematical equivalence
Student explanation can provide learners the opportunity to work through their
understanding and learn from ideas of others. The quality of student explanations varies,
and there is evidence that it is a challenge for many teachers to have a proper expectation
about the quality of student explanations and therefore establish the standards for
acceptable mathematical explanations in classroom discussion. The current study aims at
exploring the quality of mathematical explanations students produced in an inter-personal
setting, with regard to mathematical equivalence. The goal of this study is to determine
(a) quality of student explanations when they need to describe a solution
(b) quality of student explanations when they need to justify their reasoning
(c) quality of student explanations when they need to draw connections between
representations
Before describing the ways to achieve above specific goals, I will first discuss,
(1) why producing mathematical explanations is important for learning, (2) research on
65
quality of mathematical explanations, (3) what kinds of variation we might expect for the
quality of student explanations across different problem contexts.
1. Producing mathematical explanation benefits learning
The importance of student explanations in mathematics has been part of
mathematics standards for several decades. NCTM’s (1989, 2000) Standard for
Communication stresses the central role of student communication in mathematics
instruction, arguing that instructional programs should help students to organize and
consolidate their mathematical thinking as well as to analyze and evaluate the thinking
and strategies of others. Ball (1991) provided a good discussion of the rationale behind
the earlier version of this standard, arguing that questions such as who talks, how they
explain their ideas, and the kinds of evidence that is encouraged or accepted all are
central to defining the nature of classroom mathematics.
The importance of student-generated explanations is also supported by two
decades of cognitive research. In the initial study, Chi, Bassok, Lewis, Reimann, &
Glaser (1989) found that high achieving physics students differed from their less
successful peers in generating what the researchers termed “self-explanations,”
elaborations of what they learned that attempted to fit it into a larger context. Chi, de
Leeuw, Chiu, and LaVancher (1994) found that simply prompting 8th graders periodically
to “explain what it means to you” led to significantly increased learning. More recently.
Rittle-Johnson (2006) included self-explanation instructions in a mathematics learning
66
task that also compared both direct instruction or invention. Under both instructional
conditions, self-explanations led to increased learning of a correct procedure and transfer
to new problems. Chi, Siler, Jeong, Yamauchi, & Hausmann (2001) compared learning
by college students in tutoring sessions that varied in the degree to which tutors provided
didactic information or asked leading questions to encourage the tutees to figure the
problems out on their own. Results strongly favored the latter format.
Despite the benefits of generating mathematical explanation stated both in Standards
and through research evidence. Consistent pattern of lacking discussion and student
explanation in US classroom mathematics instruction has emerged from both direct
observation (e.g., Hiebert et al., 2005; Stake & Easley, 1978; Stigler, Gonzalez,
Kawanaka, Knoll, & Serrano, 1999; Stodolsky, 1988) and teacher self-report (e.g.,
Grouws, Smith, & Stajn, 2000; Weiss, Banilower, McMahon, & Smith, 2001).
Decipher quality of mathematical explanations
Previous research on self-explanation has proposed several features that
differentiate successful learners from unsuccessful ones. Self-explanation is typically
examined in student’s learning of worked-examples (Chi et al., 1989; Renkl, 1997, 2002;
Siegler 2002). Renkl (1997) found that the quality of self-explanation is significantly
related to learning outcome, even after controlling for time on task. Quality of
explanations produced by successful and unsuccessful learners differ in the following
aspects. 1) The successful learners frequently assigned meaning to operators by
67
identifying the underlying domain principle (principle-based explanations). 2) They
frequently assigned meaning to operators by identifying the (sub-) goals achieved by
those operators (explication of goal–operator combinations). 3) They tended to anticipate
the next solution step instead of looking it up (anticipative reasoning). 4) The less
successful learners described a greater number of comprehension problems, that is, they
had metacognitive awareness of their own learning difficulties (metacognitive
monitoring). Renkl further illustrated that successful learners did not necessarily show all
characteristics which related to better learning outcome. Instead, he identified two types
of successful learners: principle-based explainers and anticipative reasoners.
Principle-based explainers concentrated their self-explanation efforts on the assignment
of meaning to operators, both by principle-based explanations and by explicating goal–
operator combinations. They did not frequently anticipate solution steps. The anticipative
reasoners, however, refrained from many principle-based explanations and from the
repeated explication of goal–operator combinations, yet they anticipated solution steps
extensively (Renkl, 1997).
Students’ self-explanations occur in individual work settings, especially when
they experience an interruption in some aspect of comprehension (Leinhardt, 1993, 2010).
These explanations are constructed to serve the needs of the self; thus language can be
internal, fragmentary, and colloquial as well as fuzzy. Usually, the goal of a
self-explanation is to link a current piece of information (in a text, figure, or speech) with
68
an understood self-defined learning goal. The internal and private nature of
self-explanation make them distinct from the explanations students are expected to give
in group work as well as classroom discussion settings.
Explanations in interpersonal settings, such as within a small group or in whole
class discussion, have different requirements than do students’ self-explanations. These
include awareness of audience, formality of language and the purpose of speech, just to
name a few. Implicit assumptions need to be made explicit, representations need to be
explicitly mapped, and the central query that guides the explanatory statements need to be
identified. Students may also be requested to replace informal colloquial forms of
language and understanding with more formal disciplinary ones in the interest of
improving learning. In such interpersonal settings, students’ production of explanations
show similarities with instructional explanations, although the latter are typically
expected from teachers and learning material (i.e. textbook).
Prior work on the quality of instructional explanations also provided insights on
evaluating quality of student math explanations. For example, Duffy et al (1986)
identified three characteristics of effective instructional explanation. Firstly, an effective
explanation needs to contain all three types of knowledge: declarative, conditional, and
procedure. It needs to identify the task, its characteristics and structure. It also needs to
state when and why a strategy should be used. And it needs to provide information about
how to apply a strategy. Secondly, an effective explanation needs to be precise and
69
explicit. It needs to be definitely stated and clearly expressed so that students become
aware of the lesson content. Finally, an effective explanation needs to be presented within
a meaningful framework. Duffy and colleagues’ emphasis on precision and meaning
making is reflected in Hill and colleagues’ evaluation of Mathematical Quality of
Instruction (MQI). MQI (Hill et al., 2008) listed both accuracy and richness as two
dimensions to consider while evaluating teachers’ interaction with mathematical content.
In their coding instrument, Mathematical Quality of Instruction, mathematical accuracy
refers to the absence of mathematical errors and distortion of mathematical content. Lack
of mathematical accuracy may result from gaps in one’s mathematical knowledge, the
imprecision in language and notation, or a lack of clarity in the presentation of
explanation. Mathematical richness contains two elements: attention to the meaning of
mathematical facts and procedures and engagement with mathematical practices.
In sum, prior efforts in evaluating self-explanation and instructional
explanations indicated that mathematical precision, meaning making and connection
building, use of anticipatory reasoning, and rule-based generalizations are characteristics
of high-quality mathematical explanations.
2. Variability in the quality of students’ explanations
Explanations may take different forms, and each form carries different demands.
For example, Hill, Schilling & Ball (2004) differentiated 3 forms of a mathematical
explanation: description, argumentation, and justifications. The descriptions provide
70
characterizations of the steps of mathematical procedure or a process, but they do not
necessarily address the meaning or reason for these steps. Argumentation gives
mathematical meaning to ideas or procedures. Argumentation may involve the use of
examples and counter-examples, estimation or approximation, as well as evaluating
reasonableness through substituting and real-world knowledge (Kilpatrick, et. al., 2001).
Justification includes deductive reasoning about why a procedure works or why
something is true or valid in general. Recent efforts in the development of mathematical
argumentation proposed that students first learn to describe their solutions. Then they
learn to provide examples that support an argument. This is not to say that a positive
example is easy to find, but just that it is easier to use. Next, students may learn to
identify falsifying cases and counterexamples; this would be followed by informal
methods of direct proof, and finally by a variety of formal proof methods (Graf, 2009;
Bennett, 2010; Sireci, 2013). However, this proposed sequence of stages is still very
loose, and it is expected that there would be significant variation across different tasks
and problems. For example, some false statements may have counterexamples that are
difficult to identify, and some true statements may be very straightforward to verify
directly. Similarly, although students may be more comfortable using simple language to
make mathematical observations early on, developing an extended verbal argument is
more demanding than producing a simple diagram.
Students’ mathematical knowledge and competence also influence the quality of
71
their explanations. Misconceptions often lead to inaccurate explanations, although
students may create “mal-rules”, or incorrect rules, to justify their solutions (e.g., Payne
& Squibb, 1990; Resnick, Cauzinille- Marmeche, & Mathieu, 1987; Sleeman, 1984). For
example, Lee and Wheeler (1989) presented students with several algebraic statements
and asked them to determine whether a given statement was definitely true, possibly true,
or never true—students were also asked to justify the response. One of these statements
was as follows:
(a2 + b2)3 = a6 + b6 (Lee & Wheeler, 1989, p. 42)
Half of the 10th-grade students queried believed this statement was true; the
following was among the justifications that were provided:
“ This statement is definitely true. There are several laws in dealing with exponents.
And the one that applies here is you multiply the number (outside the bracket) with those
exponents inside the bracket. You don’t add them like you normally do. If you had an
example like a2 + a3 you add them so you get a5 but the brackets tell us to multiply.” (Lee
& Wheeler, 1989, p. 42)
In sum, explanations may take different forms and each creates various levels of
demands for students. On the other hand, the quality of students’ explanations is also
influenced by their understanding of mathematical content.
3. The current study
72
The current study explored the quality of students’ explanations in the context of
mathematical equivalence. The concept of mathematical equivalence, i.e. the principle
that the sum of the numbers on one side of an equation is equal to the sum of the numbers
on the other side of the equation, is fundamental to understanding algebra, which in turn
serves as a gatekeeper for future educational opportunities and has an important role in
mathematics. However, this concept does not come easily. Rittle-Johnson, Taylor,
Matthews & McEldoon (2011) found that 70% or more of a sample of 3rd to 6th grade
students in US misunderstand the principle of mathematical equivalence. Given a
problem such as “4+6+9=__+9”, they will calculate “4+6+9” and fill in the blank with
the answer “19”. Some children will continue with “19+9” and get “28” as the answer
(Alibali, 1999). In both cases, children appear to be interpreting the equal sign as an
announcement of the result of an arithmetic operation rather than as a symbol of
mathematical equivalence. Moreover, many middle school students still lack a
sophisticated understanding of the equal sign, which resulted in difficulties in working
with symbolic expressions and equations (Knuth, Stephens, McNeil, & Alibali, 2006).
Mathematical equivalence comes up in the daily practice of elementary math
classrooms, often in the context of equation solving and word problems (Pepin &
Haggarty, 2001; McNeil, et al., 2006; Newton & Newton, 2007). The meaning of the
equal sign is typically defined in textbooks (Mayer, Sims, & Taijka, 1995). The
availability of examples and definitions provides a foundation for students to build their
73
explanations upon. Therefore, I expect that elementary students in the current study will
be able to provide explanations, although the quality of their explanations may vary
depending on students’ understanding of the particular mathematical content.
To tap into the different types of explanations students may provide, three
different tasks were adopted to elicit explanations. These tasks include equation solving,
equation judgment, and problem posing. Equation solving task requires students to
calculate an unknown number in an equation (e.g. Rittle-Johnson, et al., 2011).
Explanations for this task may involve their description of their procedure as well as
justification of their procedure. The equation judgment task requires students to judge the
correctness of a worked example. Students may utilize examples or counter-examples,
estimation or approximation, evaluating reasonableness through substitution, as well as
using formal proof (e.g. Lee & Wheeler, 1989). The problem-posing task asks students to
propose a word problem base on an equation. It requires the specification of the
connections across representations (i.e. an equation and a real-life situation, e.g., Silver,
1979; Singer, & Voica, 2013; Singer, Ellerton, & Cai, 2013).
Method
Participants
Sixty Chinese (including thirty 2nd graders and thirty 4th graders) and 48 US
74
elementary school students (including twenty-four 2nd graders and twenty-four 4th graders)
participated in the study. Chinese students were recruited from an elementary school
located in a suburb of Beijing, and US students were recruited from public schools in
southeast Michigan. All Chinese children were Mandarin speakers, and all US children
have English as their first language. Parental permission to participate was obtained for
all children.
Procedure
Students were interviewed individually in their native language by an
experimenter. Interviews took place in a separate room in the child's own school lasting
for approximately 15–20 min and were videotaped. During the interview, students were
asked to solve on a white board the following mathematical equivalence problems. They
were also requested to explain their solution as if they were explaining it to their peers.
Students were encouraged to generate solutions and provide explanations, but no
feedback was given regarding the accuracy of their solutions and explanations.
Tasks. Three types of tasks were used in the study: Equation solving, Equation
judgment, and Problem posing.
For Equation solving tasks, students were presented with several equations
with blanks in them, one at a time. They were asked to fill in the blanks as well as to
explain the meaning of the equal sign and how they figured the answer out. Table 8
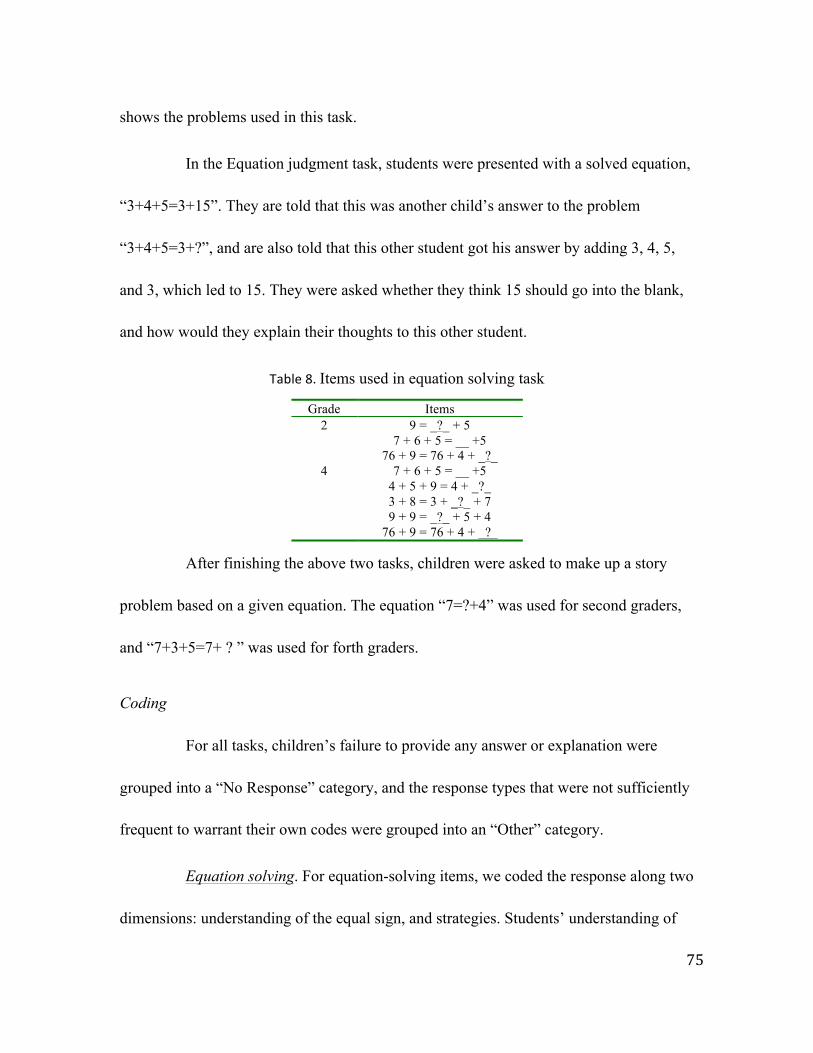
75
shows the problems used in this task.
In the Equation judgment task, students were presented with a solved equation,
“3+4+5=3+15”. They are told that this was another child’s answer to the problem
“3+4+5=3+?”, and are also told that this other student got his answer by adding 3, 4, 5,
and 3, which led to 15. They were asked whether they think 15 should go into the blank,
and how would they explain their thoughts to this other student.
Table 8. Items used in equation solving task
Grade Items 2 9 = _?_ + 5
7 + 6 + 5 = __ +5 76 + 9 = 76 + 4 + _?_
4 7 + 6 + 5 = __ +5 4 + 5 + 9 = 4 + _?_ 3 + 8 = 3 + _?_ + 7 9 + 9 = _?_ + 5 + 4
76 + 9 = 76 + 4 + _?_
After finishing the above two tasks, children were asked to make up a story
problem based on a given equation. The equation “7=?+4” was used for second graders,
and “7+3+5=7+ ? ” was used for forth graders.
Coding
For all tasks, children’s failure to provide any answer or explanation were
grouped into a “No Response” category, and the response types that were not sufficiently
frequent to warrant their own codes were grouped into an “Other” category.
Equation solving. For equation-solving items, we coded the response along two
dimensions: understanding of the equal sign, and strategies. Students’ understanding of
76
equal sign were coded as relational, operational, no response, or other, with the majority
of responses falling into the first two categories. A response was coded as relational if a
student expressed the general idea that the equal sign means “the same as”, and as
operational if he/she expressed the general idea that the equal sign means “the answer” or
“add the numbers”. This dimension reflects the mathematical accuracy of student
explanations.
Students’ problem solving strategies were coded as “add all”, “add left”, “add
and subtract”, “cancel”, “equalize”, and “other”, with the majority of responses falling
into the first 5 categories. A strategy was coded as “add all” if a student put the sum of all
numbers on the blank. For example, a student answered 22 for the question “7+3+5=7+_”
by attempting to add all four numbers together. A strategy was coded as “add left” if the
student adds all the numbers left to the equal sign. In previous example, a student
applying “add left” strategy will attempt to put the answer of 7+3+5 on the blank. A
response was coded as “add and subtract” if the student adds the numbers on the one
sides of the equal sign then subtract the numbers on the other dies. In previous example, a
student using this strategy will explain that 7+3+5 is 15, and then subtract 7 on the right
on the equation from 15 to get the answer 8. A response was coded as “cancel” if the
student ignores the same number on both sides of the equation and only do the rest. In
previous example, a response will be counted as “cancel” if the student directly add 3+5
and put the answer 8 in the blank, whether or not he/her explains why 7 can be ignored.
77
Finally, a response was coded as “equalize” if the student explained that the number in
question could make the two sides equal but did not provide explicit calculation. “Other”
strategies usually involved student’s picking two random numbers from the equation and
adding them up. Using effective strategies, including cancel, equalize, and add and
subtract, rather than ineffective ones, reflected the accuracy of student explanations.
Students’ use of more than one strategy, and comparison between strategies reflected the
mathematical richness of their explanations.
Equation judgment. For equation judgment task, the accuracy of the
explanation is defined by students’ operational or relational reasoning about the equal
sign, and the mathematical richness of the explanation is based on evaluations of their
justifications. A justification is considered as answer-based if the child identified another
value to fill in the blank or expressed agreement with the value offered in the problem,
procedure-based if the student expressed agreement or disagreement with the procedure
used in the problem, and principle-based if the student explicitly talked about the
definition of the equal sign (e.g. “It means the two sides are the same rather than to add
everything up”, “the number on the blank cannot make the two sides equal to each
other”).
Problem posing. Students’ representations of equal sign in their story problems
were coded. Table 9 described the codes we used. This code reflects the accuracy
dimension of explanation quality. Specifically, the explicit or implicit equivalent
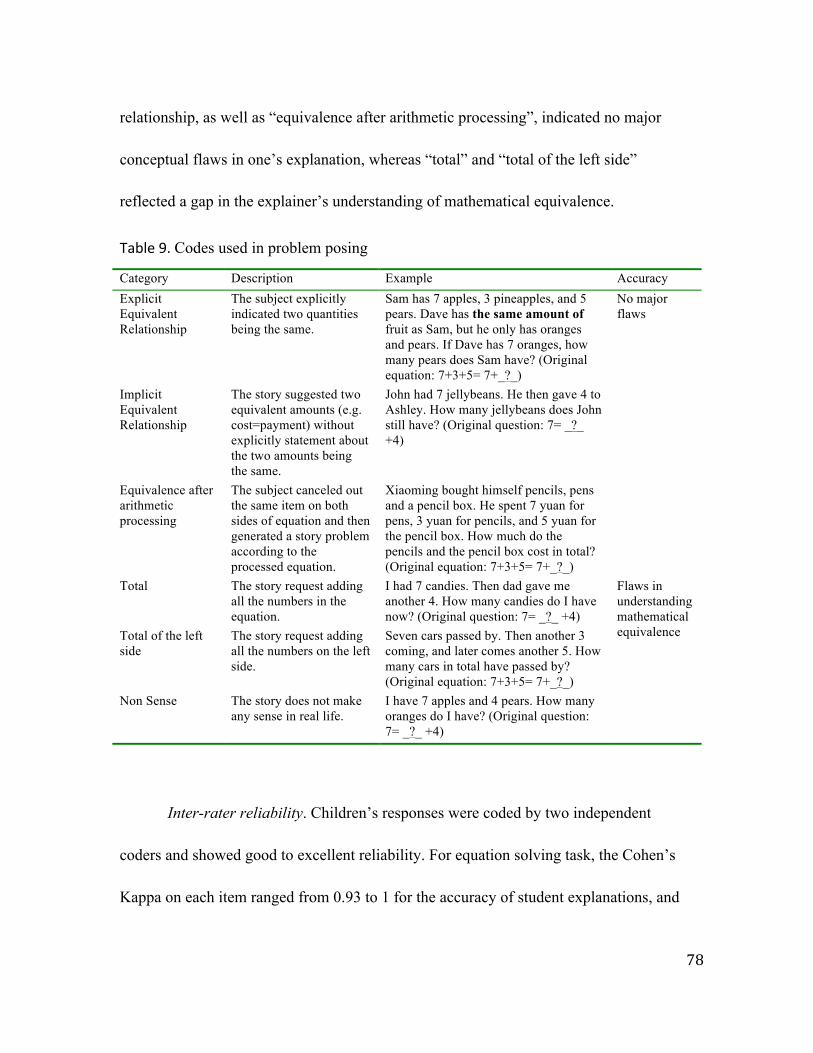
78
relationship, as well as “equivalence after arithmetic processing”, indicated no major
conceptual flaws in one’s explanation, whereas “total” and “total of the left side”
reflected a gap in the explainer’s understanding of mathematical equivalence.
Table 9. Codes used in problem posing
Category Description Example Accuracy Explicit Equivalent Relationship
The subject explicitly indicated two quantities being the same.
Sam has 7 apples, 3 pineapples, and 5 pears. Dave has the same amount of fruit as Sam, but he only has oranges and pears. If Dave has 7 oranges, how many pears does Sam have? (Original equation: 7+3+5= 7+_?_)
No major flaws
Implicit Equivalent Relationship
The story suggested two equivalent amounts (e.g. cost=payment) without explicitly statement about the two amounts being the same.
John had 7 jellybeans. He then gave 4 to Ashley. How many jellybeans does John still have? (Original question: 7= _?_ +4)
Equivalence after arithmetic processing
The subject canceled out the same item on both sides of equation and then generated a story problem according to the processed equation.
Xiaoming bought himself pencils, pens and a pencil box. He spent 7 yuan for pens, 3 yuan for pencils, and 5 yuan for the pencil box. How much do the pencils and the pencil box cost in total? (Original equation: 7+3+5= 7+_?_)
Total The story request adding all the numbers in the equation.
I had 7 candies. Then dad gave me another 4. How many candies do I have now? (Original question: 7= _?_ +4)
Flaws in understanding mathematical equivalence Total of the left
side The story request adding all the numbers on the left side.
Seven cars passed by. Then another 3 coming, and later comes another 5. How many cars in total have passed by? (Original equation: 7+3+5= 7+_?_)
Non Sense The story does not make any sense in real life.
I have 7 apples and 4 pears. How many oranges do I have? (Original question: 7= _?_ +4)
Inter-rater reliability. Children’s responses were coded by two independent
coders and showed good to excellent reliability. For equation solving task, the Cohen’s
Kappa on each item ranged from 0.93 to 1 for the accuracy of student explanations, and
79
ranged from 0.81 to 0.93 for their strategy usage. As for the justification and
representations of equal sign in story problems, the Cohen’s Kappa was 0.96 and 0.88
respectively.
Results
Equation solving task
Overall, US students provided accurate explanations on a bit over half of the items
(4th grader: M=0.59, SD=0.46; 2nd grader, Mean=0.51, SD=0.33). Their explanations
were significantly less accurate than those of their Chinese peers (4th grader: M=1.00,
SD=0.00; 2nd grader, Mean=0.93, SD=0.20), F(1,104)=4.568, p<.001. Yet no significant
difference between 2nd and 4th graders was found in accuracy of their explanations.
Examples of inaccurate explanations include:
“Add all the numbers. That’s how you get the answer.” (A US second grader)
“You don’t add the last number because it doesn’t matter. Just add the ones on the
left (of the equal sign).” (A US fourth grader)
In contrast, the following students’ explanations are considered to be accurate,
“You add the left first. Then you need to think five add what equals to that
number.” (A US fourth grader)
“It is a plus sign on this side, so you change it into minus sign when you move it
to the other side.” (A Chinese fourth grader, translated)
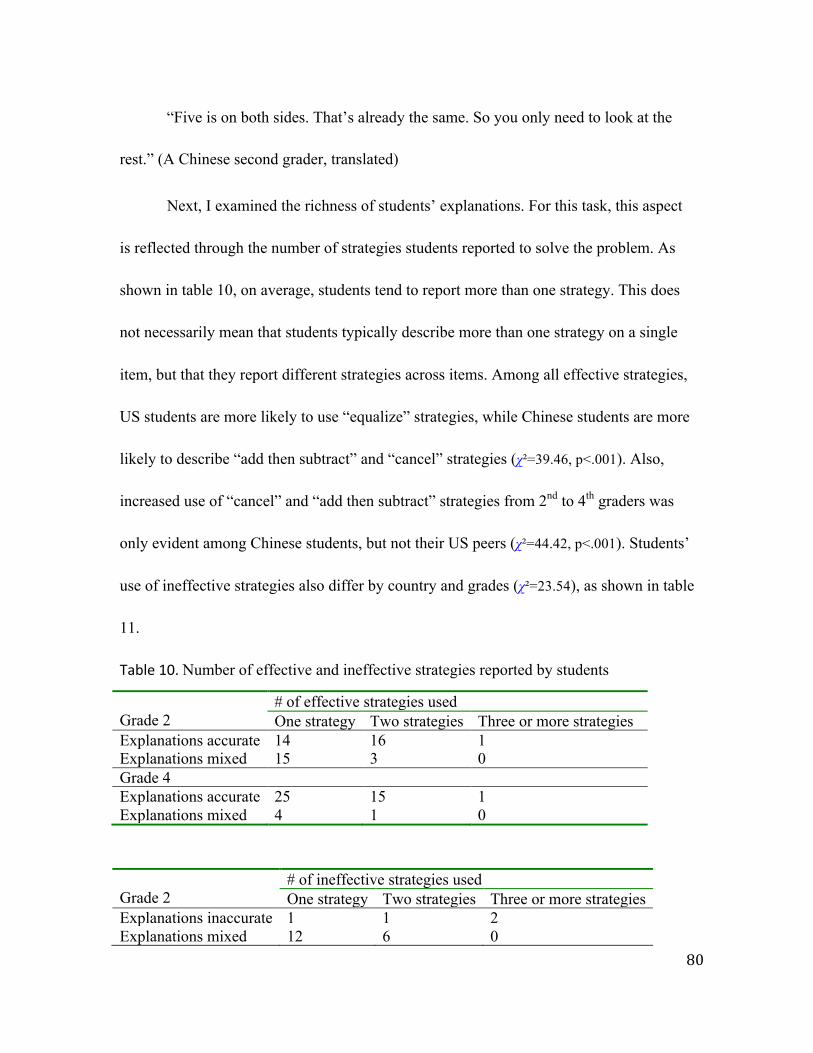
80
“Five is on both sides. That’s already the same. So you only need to look at the
rest.” (A Chinese second grader, translated)
Next, I examined the richness of students’ explanations. For this task, this aspect
is reflected through the number of strategies students reported to solve the problem. As
shown in table 10, on average, students tend to report more than one strategy. This does
not necessarily mean that students typically describe more than one strategy on a single
item, but that they report different strategies across items. Among all effective strategies,
US students are more likely to use “equalize” strategies, while Chinese students are more
likely to describe “add then subtract” and “cancel” strategies (χ²=39.46, p<.001). Also,
increased use of “cancel” and “add then subtract” strategies from 2nd to 4th graders was
only evident among Chinese students, but not their US peers (χ²=44.42, p<.001). Students’
use of ineffective strategies also differ by country and grades (χ²=23.54), as shown in table
11.
Table 10. Number of effective and ineffective strategies reported by students
Grade 2
# of effective strategies used One strategy Two strategies Three or more strategies
Explanations accurate 14 16 1 Explanations mixed 15 3 0 Grade 4 Explanations accurate 25 15 1 Explanations mixed 4 1 0
Grade 2
# of ineffective strategies used One strategy Two strategies Three or more strategies
Explanations inaccurate 1 1 2 Explanations mixed 12 6 0
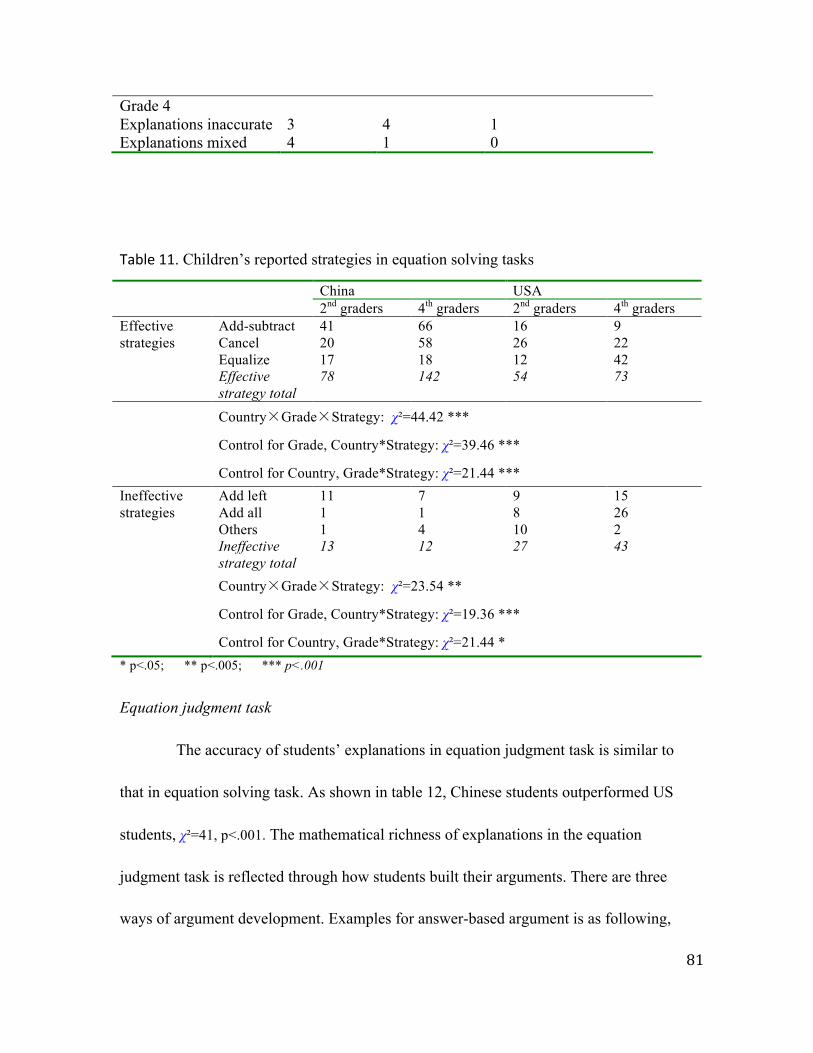
81
Grade 4 Explanations inaccurate 3 4 1 Explanations mixed 4 1 0
Table 11. Children’s reported strategies in equation solving tasks
China USA 2nd graders 4th graders 2nd graders 4th graders
Effective strategies
Add-subtract 41 66 16 9 Cancel 20 58 26 22 Equalize 17 18 12 42 Effective strategy total
78 142 54 73
Country×Grade×Strategy: χ²=44.42 ***
Control for Grade, Country*Strategy: χ²=39.46 ***
Control for Country, Grade*Strategy: χ²=21.44 *** Ineffective strategies
Add left 11 7 9 15 Add all 1 1 8 26 Others 1 4 10 2 Ineffective strategy total
13 12 27 43
Country×Grade×Strategy: χ²=23.54 **
Control for Grade, Country*Strategy: χ²=19.36 ***
Control for Country, Grade*Strategy: χ²=21.44 * * p<.05; ** p<.005; *** p<.001
Equation judgment task
The accuracy of students’ explanations in equation judgment task is similar to
that in equation solving task. As shown in table 12, Chinese students outperformed US
students, χ²=41, p<.001. The mathematical richness of explanations in the equation
judgment task is reflected through how students built their arguments. There are three
ways of argument development. Examples for answer-based argument is as following,
82
“I got the same answer.” (A US second grader)
“He’s wrong. I got a different number.” (A US second grader)
Compare this to procedure-based arguments,
“You can’t add everything like this. You add some, then stop.” (A US fourth
grader)
“I won’t add these numbers up. It is an equal sign, not a plus sign. He can’t treat
it like a plus sign.” (A Chinese second grader, translated)
And principle-based argument,
“Well if an answer is right, you should get the two sides to be equal when you
put that answer back. But here the right side is bigger.” (A Chinese fourth grader,
translated)
“You need to get the same sum for both sides.” (A US fourth grader)
“He can’t exchange the plus sign and the equal sign. They mean different things.”
(A US second grader)
Students tend to combine multiple types of arguments to support their judgments.
On average, each student provided 1.54 arguments. Chinese students provided more
arguments (M=1.83, SD=0.52) than their US peers (M=1.17, SD=0.37), F(1, 104)=59.73,
p<.001. Further, log-linear analysis suggested that students from two countries also differ
in the types of arguments they provided. Compared to US students, Chinese students
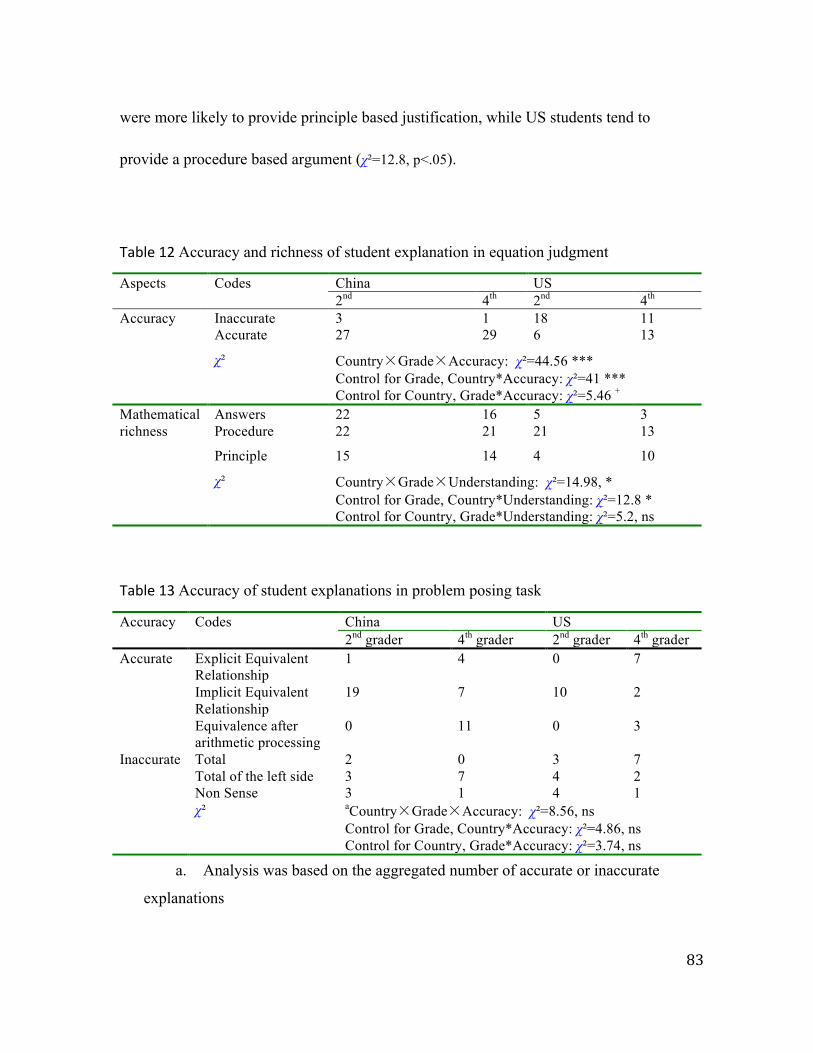
83
were more likely to provide principle based justification, while US students tend to
provide a procedure based argument (χ²=12.8, p<.05).
Table 12 Accuracy and richness of student explanation in equation judgment
Aspects Codes China US 2nd 4th 2nd 4th
Accuracy Inaccurate 3 1 18 11 Accurate 27 29 6 13
χ² Country×Grade×Accuracy: χ²=44.56 *** Control for Grade, Country*Accuracy: χ²=41 *** Control for Country, Grade*Accuracy: χ²=5.46 +
Mathematical richness
Answers 22 16 5 3 Procedure 22 21 21 13
Principle 15 14 4 10
χ² Country×Grade×Understanding: χ²=14.98, * Control for Grade, Country*Understanding: χ²=12.8 * Control for Country, Grade*Understanding: χ²=5.2, ns
Table 13 Accuracy of student explanations in problem posing task
Accuracy Codes China US 2nd grader 4th grader 2nd grader 4th grader
Accurate Explicit Equivalent Relationship
1 4 0 7
Implicit Equivalent Relationship
19 7 10 2
Equivalence after arithmetic processing
0 11 0 3
Inaccurate Total 2 0 3 7 Total of the left side 3 7 4 2 Non Sense 3 1 4 1
χ² aCountry×Grade×Accuracy: χ²=8.56, ns Control for Grade, Country*Accuracy: χ²=4.86, ns Control for Country, Grade*Accuracy: χ²=3.74, ns
a. Analysis was based on the aggregated number of accurate or inaccurate
explanations
84
Problem posing task
In the problem posing task, explanations take the form of representation
mapping. Accuracy of explanation in this task refers to whether the word problem
students created reflect the mathematical relationship between numbers and operations in
the original equation. Overall, students provided similar amounts of accurate explanations
as inaccurate ones (as shown in table 13). And loglinear analysis revealed no country or
grade differences in the accuracy of students explanations in this task.
Discussion
The current study explored the quality of elementary students’ mathematical
explanations in the context of mathematical equivalence. Results indicated that
elementary students could verbalize their thoughts and provide explanations when
requested to, although the quality of explanation varies across grades and countries, as
well as is influenced by the task demand.
The three tasks adopted in current study were aimed at eliciting different forms
of explanation, namely explanation as descriptions, explanation as argument and proof,
and explanation as building links across representations (Hill et al., 2008). Both the
accuracy and the mathematical richness of each explanation was coded (Duffy, Roehler,
Meloth, & Vavrus, 1986; Hill, Umland, Litke, & Kapitula, 2012). The reliability of the
coding system was supported by high inter-rater agreement across all tasks.
85
The accuracy of students’ explanations is limited by students’ understanding of
the mathematical content. In the current study, about half of the US students defined the
equal sign as an indication of the end of operation. This finding is in agreement with
previous research that operational understanding of the equal sign is prevalent among the
US elementary or even middle school students (e.g., Knuth, Alibali, Hattikudur, McNeil,
& Stephens, 2008; Knuth, Stephens, McNeil, & Alibali, 2006; Rittle-Johnson, Taylor,
Matthews, & McEldoon, 2010). On the other hand, Chinese students in the current study
displayed more accurate explanations, interpreting the equal sign as a balance between
quantities in an equation, i.e. balance between both sides of the equal sign. These
differences in explanation accuracy between students from the two countries may result
from different instructional materiasl as well as instructional practice (Confrey & Stohl,
2004; Reys et al., 2004). For example, Chinese and US teachers have different tolerance
about students’ having two different values on each side of an equal sign (Ma, 1999;
Ding & Li, 2006; Li, Ding, Capraro & Capraro, 2008). US teachers are more likely to
accept student work like “3 + 3×4 =12 = 15,” because in the U.S. the order of operations
is paramount and the focus is on whether or not students are able to get correct answers
(Ma, 1999). In fact, U.S. teachers themselves pay little attention on their equation solving
demonstrations, and made errors such as writing 360÷4=90×3=270 on the blackboard or
overhead (Ding & Li, 2006).
As for mathematical richness, students tend to engage in certain meaningful
86
mathematical practices when requested to. The types of mathematical practice they
engage in vary across tasks. For example, when students were explaining their own
answer, they tended to focus exclusively on the reasonableness of arithmetic operations,
making explicit statements regarding the order of arithmetic operation. They tend to not,
however, substitute their answer back into the equation to check its correctness.
Meanwhile, when they were given a worked out solution and were asked about its
correctness, students may use both forward as well as backward reasoning in their
explanations. That is, they may choose to follow the procedure described in the given
solution, as well as choose to substitute the answer into the original equation.
Mathematical richness also differed between American and Chinese students. In
equation solving tasks, US students are more likely to state an answer without explicitly
presenting the procedure (i.e. “equalize” strategy), while Chinese students are more likely
to report step-by-step arithmetic operations (i.e. “add then subtract”), or discuss possible
shortcuts (i.e. “cancel” strategy) when applicable. Such differences may reflect one of the
two possibilities. The first possibility is that students in two countries do not differ in
their ability to offer mathematical explanations of the same richness, but that what counts
as a mathematical explanation differs in US and Chinese classrooms. The second
possibility is that due to different instructional practice and therefore experience, US and
Chinese students differ in their abilities in providing explanations of mathematical
richness. The current study cannot differentiate the two possibilities, yet previous large
87
scale classroom observational studies seem to indicate that there is a lack of explanation
requests in US classrooms. Studies have shown that US lessons tend to focus on:
low-level rather than high-level cognitive processes (i.e., memorizing and recalling facts
and procedures rather than reasoning about and connecting ideas or solving complex
problems), asking students to work alone (with little opportunity for discussion and
collaboration), focusing attention on a narrow band of mathematics content (i.e.,
arithmetic in the elementary and middle grades), and doing little to help students develop
a deep understanding of mathematical ideas (rarely asking for explanations, using
physical models, or calling for connections to real world situations) (Hiebert, et al., 2005;
Stake & Easley, 1978; Stigler, Gonzalez, Kawanaka, Knoll, & Serrano, 1999; Stodolsky,
1988).
It is worth noticing that although accuracy and mathematical richness are two
important aspects of the quality of mathematical explanation, some other factors also play
a role. For example, Berland and others (Berland & McNeil, 2010; Alonzo, & Gotwals,
2012; Song, Deane, Graf, & van Rijn, 2013) proposed that social and discourse
dimensions would also influence the quality of an argument. The social dimension refers
to students’ realization about the need to persuade another person, their effort in making a
persuasive appeal, as well as their metacognitive awareness of such effect. The discourse
dimension refers to the organization and presentation students used to frame his or her
case. These dimensions are beyond the scope of the current study, as they focus more on
88
the generic characteristics of any explanation rather than being specific to the content of
mathematics.
Finally, although the current study involves students’ production of
mathematical explanation in an interpersonal setting (i.e. student with an interviewer), it
still differs from the interpersonal environment of a math classroom in terms of the
audience as well as the (lack of) instructional purpose. Segments of student discussions
from classroom observation/recordings maybe utilized to further explore the quality of
students’ mathematical explanations in action, although one should be cautious in
controlling class mathematical content as well as the nature of problems presented.
89
Reference
Alibali, M. W. (1999). How children change their minds: Strategy change can be gradual or abrupt. Developmental Psychology, 35, 127 – 145
Alonzo, A. C., & Gotwals, A. W. (2012). Learning progressions in science: Current challenges and future directions. Springer.
Ball, D. L. (1991). What’s all this talk about discourse. The Arithmetic Teacher, 39(3), 44.
Bennett, R. E. (2010). Cognitively based assessment of, for, and as learning (CBAL): A preliminary theory of action for summative and formative assessment. Measurement, 8(2-3), 70-91.
Berland, L. K., & McNeill, K. L. (2010). A learning progression for scientific argumentation: Understanding student work and designing supportive instructional contexts. Science Education, 94(5), 765-793.
Chi, M. T. H., Bassok, M., Lewis, M., Reimann, P., & Glaser, R. (1989). Self-explanations: How students study and use examples in learning to solve problems. Cognitive Science, 13: 145-182.
Chi, M.T.H., de Leeuw, N., Chiu, M.H., LaVancher, C. (1994). Eliciting self-explanations improves understanding. Cognitive Science, 18: 439-477.
Chi, M.T.H., Siler, S., Jeong, H., Yamauchi, T., & Hausmann, R.G. (2001). Learning from tutoring. Cognitive Science, 25: 471-533.
Confrey, J., & Stohl, V. (2004). On evaluating curricular effectiveness: Judging the quality of K- 12 mathematics evaluations. Washington, DC: The National Academies.
Ding, M., & Li, X. (2006, Feb). Errors in students’ transition from verbal to symbolic understanding: Case study. Paper presented at the 33rd annual meeting of the Research Council on Mathematic Learning, University of Nevada Las Vegas.
Duffy, G. G., Roehler, L. R., Meloth, M. S., & Vavrus, L. G. (1986). Conceptualizing instructional explanation. Teaching and Teacher Education,2(3), 197-214.
Graf, E. A. (2009). Defining mathematics competency in the service of cognitively based assessment for grades 6 through 8. ETS Research Report No. RR-09-42). Princeton, NJ: ETS.
Grouws, D., Smith, M. K., & Stajn, P. (2000). The preparation and teaching practices of United States mathematics Teachers: Grades 4 and 8. In P. Kloosterman & J. Frank K. Lester (Eds.), Results and interpretations of the 1990-2000 mathematics assessment of the National Assessment of Educational Progress (pp. 221-267). Reston, VA: National Council of Teachers of Mathematics.
Hiebert, J., Stigler, J., Jacobs, J., Givvin, K., Garnier, H., Smith, M., et al. (2005). Mathematics teaching in the United States today (and tomorrow): Results from the TIMSS 1999 video study. Educational Evaluation and Policy Analysis, 27, 111-132.
90
Hill, H. C., Schilling, S. G., & Ball, D. L. (2004). Developing measures of teachers’ mathematics knowledge for teaching. The Elementary School Journal, 105(1), 11-30.
Hill, H.C., Blunk, M., Charalambous, C., Lewis, J., Phelps, G.C., Sleep, L., & Ball, D.L. (2008). Mathematical Knowledge for Teaching and the Mathematical Quality of Instruction: An exploratory study. Cognition and Instruction, 26, 430-511.
Hill, H. C., Umland, K., Litke, E., & Kapitula, L. R. (2012). Teacher quality and quality teaching: Examining the relationship of a teacher assessment to practice. American Journal of Education, 118(4), 489-519.
Kilpatrick, J., Swafford, J., & Findell, B. (Eds.). (2001). Adding it up: Helping children learn mathematics. Washington, DC: National Academy Press.
Knuth, E. J., Alibali, M. W., Hattikudur, S., McNeil, N. M., & Stephens, A. C. (2008). The Importance of Equal Sign Understanding in the Middle Grades.Mathematics teaching in the middle school, 13(9), 514-519.
Knuth, E. J., Stephens, A. C., McNeil, N. M., & Alibali, M. W. (2006). Does understanding the equal sign matter? Evidence from solving equations. Journal for Research in Mathematics Education, 37(4), 297-312.
Lee, L., & Wheeler, D. (1989). The arithmetic connection. Educational Studies in Mathematics, 20, 41-54.
Leinhardt, G. (1993). Instructional explanations in history and mathematics. InProceedings of the fifteenth annual conference of the cognitive science society(pp. 5-16). Hillsdale, NJ: Lawrence Erlbaum Associates.
Leinhardt, G. (2010). Introduction: Explaining instructional explanations. InInstructional explanations in the disciplines (pp. 1-5). Springer US.
Li, X., Ding, M., Capraro, M. M., & Capraro, R. M. (2008). Sources of differences in children's understandings of mathematical equality: Comparative analysis of teacher guides and student texts in China and the United States.Cognition and Instruction, 26(2), 195-217.
Ma, L. (1999). Knowing and teaching elementary mathematics: Teachers' understanding of fundamental mathematics in China and the United States. Mahwah, NJ: Lawrence Erlbaum Associates.
Mayer, R. E., Sims, V., & Tajika, H. (1995). Brief Note: A Comparison of How Textbooks Teach Mathematical Problem Solving in Japan and the United States. American Educational Research Journal, 32(2), 443-460.
McNeil, N. M., Grandau, L., Knuth, E. J., Alibali, M. W., Stephens, A. C., Hattikudur, S., & Krill, D. E. (2006). Middle-school students' understanding of the equal sign: The books they read can't help. Cognition and Instruction, 24(3), 367-385.
National Council of Teachers of Mathematics. (1989). Curriculum and evaluation standards for school mathematics. Reston, VA: Author.
National Council of Teachers of Mathematics. (2000). Principles and Standards for School Mathematics. Reston, VA: Author.
91
Newton, D. P., & Newton, L. D. (2007). Could elementary mathematics textbooks help give attention to reasons in the classroom?. Educational Studies in Mathematics, 64(1), 69-84.
Payne, S. J., & Squibb, H. R. (1990). Algebra mal-rules and cognitive accounts of error. Cognitive Science, 14(3), 641-642.
Pepin, B., & Haggarty, L. (2001). Mathematics textbooks and their use in English, French and German classrooms. Zentralblatt für Didaktik der Mathematik, 33(5), 158-175.
Renkl, A. (1997). Learning from worked‐out examples: A study on individual differences. Cognitive science, 21(1), 1-29.
Renkl, A. (2002). Worked-out examples: Instructional explanations support learning by self-explanations. Learning and instruction, 12(5), 529-556.
Resnick, L. B., Cauzinille-Marmeche, E., & Mathieu, J. (1987). Understanding algebra. In J. A. Sloboda & D. Rogers (Eds.), Cognitive processes in mathematics (pp. 169-203). New York: Clarendon Press.
Reys, R. E., Lindquist, M., Lambdin, D., Smith, N., & Suydam, M. (2003). Helping children learn mathematics: Active learning edition with integrated field activities. (7th ed.). Hoboken, NJ: John Wiley & Sons.
Rittle-Johnson, B. (2006). Promoting Transfer: Effects of Self-Explanation and Direct Instruction. Child Development, 77(1), 1-15.
Rittle-Johnson, B., Taylor, R., Matthews, P.G., & McEldoon, K. (2011). Assessing Knowledge of Mathematical Equivalence: A Construct Modeling Approach. Journal of Educational Psychology, 103 (1), 85-104.
Siegler, R. S. (2002). Microgenetic studies of self-explanation. In N. Garnott & J. Parziale (Eds.), Microdevelopment: A process-oriented perspective for studying development and learning (pp. 31 – 58). Cambridge, MA: Cambridge University Press.
Silver, E. A. (1979). Student perceptions of relatedness among mathematical verbal problems. Journal for research in mathematics education, 195-210.
Singer, F. M., & Voica, C. (2013). A problem-solving conceptual framework and its implications in designing problem-posing tasks. Educational Studies in Mathematics, 83(1), 9-26.
Singer, F. M., Ellerton, N., & Cai, J. (2013). Problem-posing research in mathematics education: new questions and directions. Educational Studies in Mathematics, 83(1), 1-7.
Sireci, S. G. (2013). Agreeing on validity arguments. Journal of educational measurement, 50(1), 99-104.
Sleeman, D. (1984). An attempt to understand students’ understanding of basic algebra. Cognitive Science, 8, 387-412.
92
Song, Y., Deane, P., Graf, E. A., & van Rijn, P. (2013). Using Argumentation Learning Progressions to Support Teaching and Assessments of English Language Arts. ETS R&D Connections (22), 1-14.
Stake, R. E., & Easley, J. (1978). Case studies in science education. Urbana, IL: University of Illinois.
Stigler, J. W., Gonzalez, P., Kawanaka, T., Knoll, S., & Serrano, A. (1999). The TIMSS videotape classroom study: Methods and findings from an exploratory research project on eighth-grade mathematics instruction in Germany, Japan, and the United States. (NCES 1999-074). Washington, DC: US Department of Education, National Center for Education Statistics.
Stodolsky, S. S. (1988). The subject matters: Classroom activities in math and social sciences. Chicago: University of Chicago.
Weiss, I. R., Banilower, E. R., McMahon, K. C., & Smith, P. S. (2001). Report of the 2000 National Survey of Science and Mathematics Education. Chapel Hill, NC: Horizon Research Inc.
93
Chapter 4.
Consider the source: Children’s processing of peer and adult
explanations of mathematical equivalence
For more than 20 years, the National Council of Teachers of Mathematics
(NCTM, 1991, 2000) has argued that student explanations of mathematics are a vital part
of effective classroom lessons. In describing how mathematics classrooms should
function, they note:
“Like a piece of music, the classroom discourse has themes that pull together to create a
whole that has meaning. The teacher has a central role in orchestrating the oral and written
discourse in ways that contribute to students' understanding of mathematics…
One aspect of the teacher's role is to provoke students' reasoning about
mathematics...Instead of doing virtually all the talking, modeling, and explaining themselves,
teachers must encourage and expect students to do so. Teachers must do more listening, students
more reasoning.” (NCTM, 1991: 35-36).
Despite this clear and longstanding advice, the realities of American mathematics
94
classroom reveal a quite different picture. For example, the 1999 TIMSS video study
revealed that student talk occupies less than 20% of class time (Roth et al., 2006).
Looking specifically at explanations, Sims et al. (2008) found that the discourse that
American elementary students produce during mathematics lessons consisted primarily of
fragments, such as answering “4” to questions such as “what is 2 + 2?”, with many fewer
opportunities to provide explanations than their peers in Beijing have.
Why might this be? Our informal conversations with teachers have revealed an
interesting argument about the possible limitations of student explanations. In this view,
although it is useful for students to have the opportunity to explain what they understand,
this comes at a cost to the rest of the class. Because student explanations are likely to
contain errors and to be fragmentary, they may mislead or confuse the rest of the class.
Thus it may be better for the teacher to take on the role of explainer, because she is more
likely to provide a complete and accurate explanation.
In order to determine the utility of student vs. teacher explanations, we need better
data on how students make sense of mathematical explanations provided by students
compared with adults. After reviewing past research on the role of self-explanations in
learning and the processing of lucid vs. difficult explanations, we will report a study that
looked at how students process different kinds of explanations about mathematical
equivalence from adult and child explainers.
95
The role of self-explanation in learning
The relation between the quality of teacher explanations and student learning is
neither as clear nor as direct as one might hope. For example, VanLehn et al. (2003)
examined how tutors’ explanations of different types and quality may influence students’
learning gains through tutoring sessions and discovered no significant relationship
between the two. Furthermore, Chi et al. (2001) demonstrated that students’ learning
outcome was not impaired when the tutorial explanations were removed altogether.
A possible explanation for this puzzling gap may lie in research on the importance
of self-explanations, i.e., explanations generated by the learner. Self-explanations are
related to deep processing and better learning outcomes (e.g., Chi et al. 1994; McNamara
2004), even when their self-generated explanations are fragmented (Roy & Chi, 2005) or
incorrect (Renkl, 2002). For example, students learned more when they generated
explanations on a standardized achievement test regardless of their scores on the test.
Even after controlling for students’ time on task, the ones who generated explanations
still performed better than their peers who read the text twice (Chi et al., 1994). The
positive effect of self-explanation on learning has been reported across in different age
groups. Children as young as age 5 may benefit from explaining to themselves when
learning strategies of tic-tac-toe games (Crowley & Siegler, 1999). When children learn a
new strategy through observation and also explain the new strategy to themselves, they
generalize the strategy more widely than children who learn a new strategy but do not
96
explain. The benefits of self-explaining last through the school years. For example,
Bielaczyc, Pirolli, & Brown (1995) reported that prompts to self-explain, when compared
with no-prompts, lead to immediate improvement in undergraduate’s learning of
computer programing. The benefit of self-explaining is also found across subject domains
and under different instructional conditions. The contexts in which prompts to
self-explain led to improved learning outcomes include various domains in mathematics
and science (Aleven & Koedinger, 2002; Atkinson, Renkl, & Merrill, 2003; Renkl, Stark,
Gruber, & Mandl, 1998; Wong, Lawson, & Keeves, 2002).
The key to the beneficial effect of self-generated explanations is believed to be
the generation process itself (Renkl, 1997; Hausmann & VanLehn, 2007),). In this view,
self-explanation causes students to engage in active processing, which includes accessing
prior knowledge from long-term memory, using common-sense reasoning, identifying
goal structure and employing sense-making strategies. The resulting increase in depth of
processing leads to benefits in memory retention and learning transfer.
A good explanation is not always the best source for learning
According to Jacoby et al. (1994), the physicist Richard Feynman was known for his
clear and lucid explanations of difficult physics concepts. However, his students
performed worse on tests than students from other sections (Jacoby, Bjork, & Kelly,
1994). The “Feynman effect”, is the claim that Feynman’s ability to make difficult
concepts easily accessible to novices led students to get a false and fleeting “feeling of
97
knowing”, which led them to believe they had a solid grasp on a topic because everything
the expert said made sense. This feeling of knowing serves as a misleading guide to their
actual level of comprehension, with detrimental consequences to their subsequent
learning. Only when they then try to apply what they’ve learned do they realize they
didn’t understand it. Thus, the very clarity of a teacher’s explanation may interfere with
student learning if it serves to short cut the difficult reflection and integration required to
make sense of new information (Wittwer & Renkl, 2008).
Although lucid explanations from adults may lead to a false feeling of knowing,
incomplete or difficult-to-process explanations may stimulate learners to engage in
deeper cognitive processing therefore have an impact on learning outcome. Two related
lines of research shed light on the potential benefits of incomplete, or difficult-to-process
explanations. First, work on the “generation effect” pointed to the benefits of learning and
retention related to the increased depth of processing by requiring the learner to generate
rather than passively read information. Richland et al. (2005) reported that undergraduates
who went through a generation/retrieval test during a re-study session outperformed their
peers who re-read the material. In the domain of mathematics, participants who generated
answers to calculation problems remembered the answer better than the ones who simply
read the answer, and the effect size of generation is almost a full standard deviation
(Slamecka & Graf, 1978; Pesta, Sanders, & Murphy, 1999; Bertsch et al, 2007).
Second, research on “disfluency” indicates that difficult presentations can result in
98
effortful processing and improved outcome (Alter & Oppenheimer, 2008; Alter et al.,
2007; Novemsky, Dhar, Schwarz, & Simonson, 2007; Reber & Zupanek). For example,
Alter et al (2007) presented participants with logical syllogisms in either an easy- or
difficult-to-read font. Participants were less confident in their ability to solve the
problems when the font was hard-to-read, yet they were in reality more successful.
Moreover, Diemand-Yauman et al (2010) demonstrated that the disfluency effect remains
in real classroom settings. The experimenters altered the fonts of the study material from
the teachers before they were distributed. After one-week to one-month of exposure to
study materials of different fonts, students who received study material in challenging
fonts performed better in the end of the unit exams. Effects were consistent across subject
areas as well across class difficulty levels.
Bjork (1994) coined the term “desirable difficulties” for conditions that make
learning harder over the very short term but lead to more lasting and integrated
knowledge over the long run. Both generation effects and disfluency fall into this
category. In this view, to the extent that other students’ explanations are more difficult to
process than are those of teachers, the activity of students in overcoming those difficulties
may ultimately lead to better understanding.
Can unreliable explanations be beneficial?
Even with the evidence on the benefits of self-explanation and the interference of
lucid explanation, there are still concerns that deficits in students’ explanations may
99
confuse or mislead the class and impede other students’ learning. However, several
studies suggest that students might not be as vulnerable to peers’ unreliable explanations
as one may expect. Instead, students may view their peers as less reliable information
sources therefore be more skeptical towards them. For example, Jaswal and Neely (2006)
demonstrated that, when other things were equal, children showed preference for an adult
as a credible source for object naming over a young girl. Research in college physics
education has also revealed that students are not vulnerable to errors in peers’
explanations; at least they are aware errors may exist. For example, Rao & Dicalo (2000)
demonstrated that undergraduates actually performed better in quizzes when they were
exposed to common difficulties at the beginning of the class and had a chance to hear
from each other before proposing a solution. Enhanced performance was reported on
physics concept mastery as well as quantitative problem solving skills (Crouch & Mazur,
2001). To the extent that peer explanations are incomplete, and learners notice that
incompleteness, they may elicit gap-filling activity that will lead to better understanding.
The current study
Given the above evidence, the question becomes whether a student would be
spontaneously skeptical towards a peer’s explanation due to peers being less reliable
information resources; and whether students being skeptical would lead to deeper
cognitive processing and better learning outcomes. Put another way, when a peer
indicates that “1/2 + 1/3 = 2/5, because 1+1=2 and 2+3=5”, would a student be skeptical
100
towards the answer and think twice? Would their effortful processing towards this
explanation lead to a closer examination and discover that the sum should not be smaller
than the addend (i.e. 2/5 VS 1/2)? And would they therefore question the procedure? The
current study aims to answer these questions. Specifically, we aim to test: a) whether
children process peer and adult explanations differently; b) whether the difference in
processing leads to enhanced understanding, and therefore better learning outcomes; and
c) whether these effects depend on the mathematical quality of the explanations.
We explored the above questions in the context of mathematical equivalence, i.e.,
the understanding of the equal sign. Prior research has characterized students’
development of mathematical equivalence concept as passing through two stages, an
operational stage and a relational stage (e.g. Knuth, Alibali, Hattikudur, McNeil, &
Stephens, 2008; Knuth, Stephens, McNeil, & Alibali, 2006; Rittle-Johnson, Taylor,
Matthews, & McEldoon, 2010). In the operational understanding stage, students view the
equal sign as a “do something” signal. For example, given the question “7+3=__ +5”,
students at this stage will put 10 on the blank, thinking that the equal sign signals the
need to perform an arithmetic operation and cues one to write down the answer right after.
Students with relational understanding, on the other hand, treat the equal sign as a
balance between the quantities on both sides, and therefore allow operations on both sides
while still holding the equivalence. The change from operational to relational
understanding typically happens between 2nd and 4th grade (McNeil, 2008; McNeil &
101
Alibali, 2005), yet many students enter middle school without a relational understanding
of the equal sign (Knuth et al., 2006). We chose this mathematics domain because of the
clearly defined mathematical misunderstanding (i.e. the operational understanding of the
equal sign) as well as the prevalence of such understanding among elementary school
students.
Method
Participants
Participants were recruited from four public schools in Southeast Michigan. 92
third grade students participated in the study (Age: mean=8.64 yrs, SD=0.51 yrs). A
female research assistant interviewed students one-to-one. The interview took about 20
minutes and all the interviews took place in a quiet room in students’ own schools.
Procedure
The interview was divided into three parts: a pretest, a video watching session,
and a post-test (see Figure 4). In both pre- and post- test, students need to solve some
equations (e.g. 7+3+5= __ +5), explain their answers, and explain the meaning of the
equal sign in each item. During the video watching phase, each student will watch 4 short
clips. A video clip lasts about 1 minute and contains a female explaining how she solved
an equation. The female explainer is either a 9-year-old girl or an adult in her early
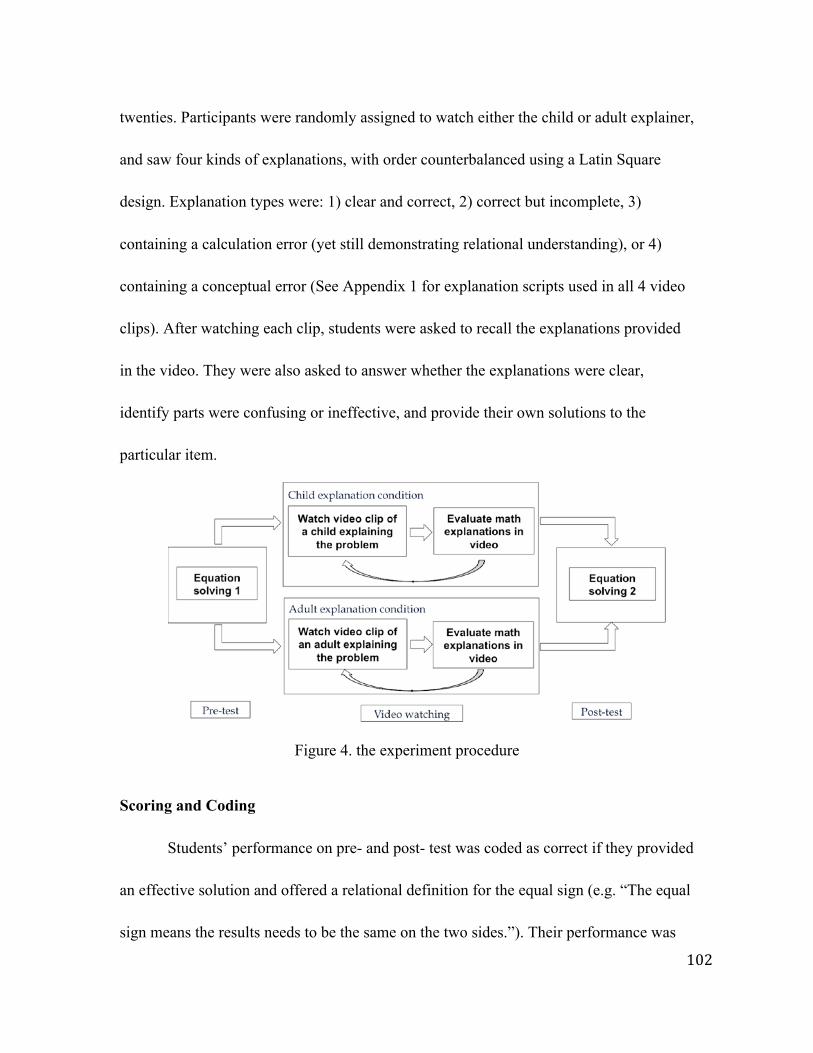
102
twenties. Participants were randomly assigned to watch either the child or adult explainer,
and saw four kinds of explanations, with order counterbalanced using a Latin Square
design. Explanation types were: 1) clear and correct, 2) correct but incomplete, 3)
containing a calculation error (yet still demonstrating relational understanding), or 4)
containing a conceptual error (See Appendix 1 for explanation scripts used in all 4 video
clips). After watching each clip, students were asked to recall the explanations provided
in the video. They were also asked to answer whether the explanations were clear,
identify parts were confusing or ineffective, and provide their own solutions to the
particular item.
Figure 4. the experiment procedure
Scoring and Coding
Students’ performance on pre- and post- test was coded as correct if they provided
an effective solution and offered a relational definition for the equal sign (e.g. “The equal
sign means the results needs to be the same on the two sides.”). Their performance was
103
coded as incorrect if their solutions were mathematically incorrect or they have offered
an operational definition of the equal sign (e.g. “The equal sign means you add
everything and get the answer.”). It is worth noticing that in the current experiment, all
the students’ errors involved operational understanding of the equal sign. Students
received 1 point for each item they have solved correctly. The total possible score for the
pre-test is 5 points, and 7 points for the post-test. To facilitate pre- to post-test
performance comparison, we converted the raw scores to accuracy rates for both tests.
Students’ evaluation of each video clip was coded into the following 2
dimensions: the completeness of their recall, and whether students reported gaps in the
explanation.
Completeness of the recall. Student’s recall of the explanation was coded as
“complete” if they have provided all the key points in the explanation. Missing any key
point would result in the “incomplete” code on this dimension.
Noticing gaps in the explanation. A “gap” is defined as the reason to carry out a
particular procedure that was not offered in the explanation. For example, in the “correct
but incomplete” explanation, students who noticed the gap in the explanation may
mention that “There are two 3s in the problem. She didn’t say what to do with them”. Or
in the “correct and complete” explanation, students were considered as “noticing a gap”
when they indicated using “7+7” to approach the answer of “7+6” only works when the
knowledge of the “double” is much easier to access than the arithmetic fact of “7+6”.
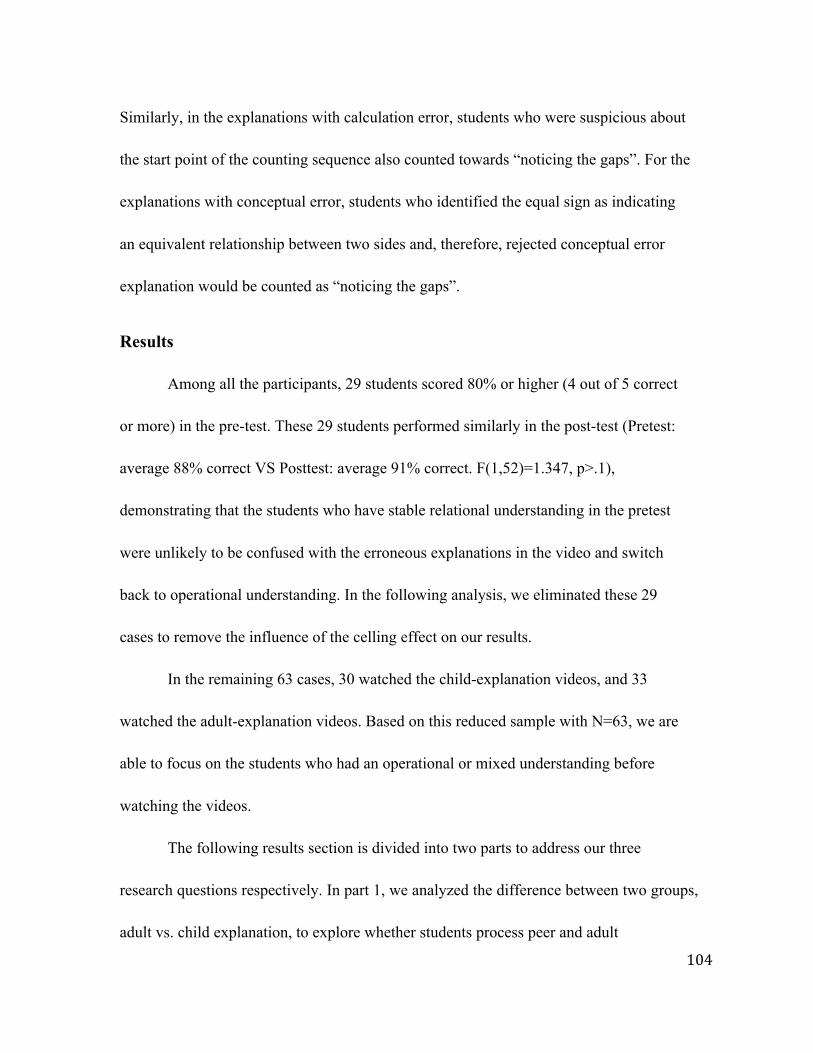
104
Similarly, in the explanations with calculation error, students who were suspicious about
the start point of the counting sequence also counted towards “noticing the gaps”. For the
explanations with conceptual error, students who identified the equal sign as indicating
an equivalent relationship between two sides and, therefore, rejected conceptual error
explanation would be counted as “noticing the gaps”.
Results
Among all the participants, 29 students scored 80% or higher (4 out of 5 correct
or more) in the pre-test. These 29 students performed similarly in the post-test (Pretest:
average 88% correct VS Posttest: average 91% correct. F(1,52)=1.347, p>.1),
demonstrating that the students who have stable relational understanding in the pretest
were unlikely to be confused with the erroneous explanations in the video and switch
back to operational understanding. In the following analysis, we eliminated these 29
cases to remove the influence of the celling effect on our results.
In the remaining 63 cases, 30 watched the child-explanation videos, and 33
watched the adult-explanation videos. Based on this reduced sample with N=63, we are
able to focus on the students who had an operational or mixed understanding before
watching the videos.
The following results section is divided into two parts to address our three
research questions respectively. In part 1, we analyzed the difference between two groups,
adult vs. child explanation, to explore whether students process peer and adult
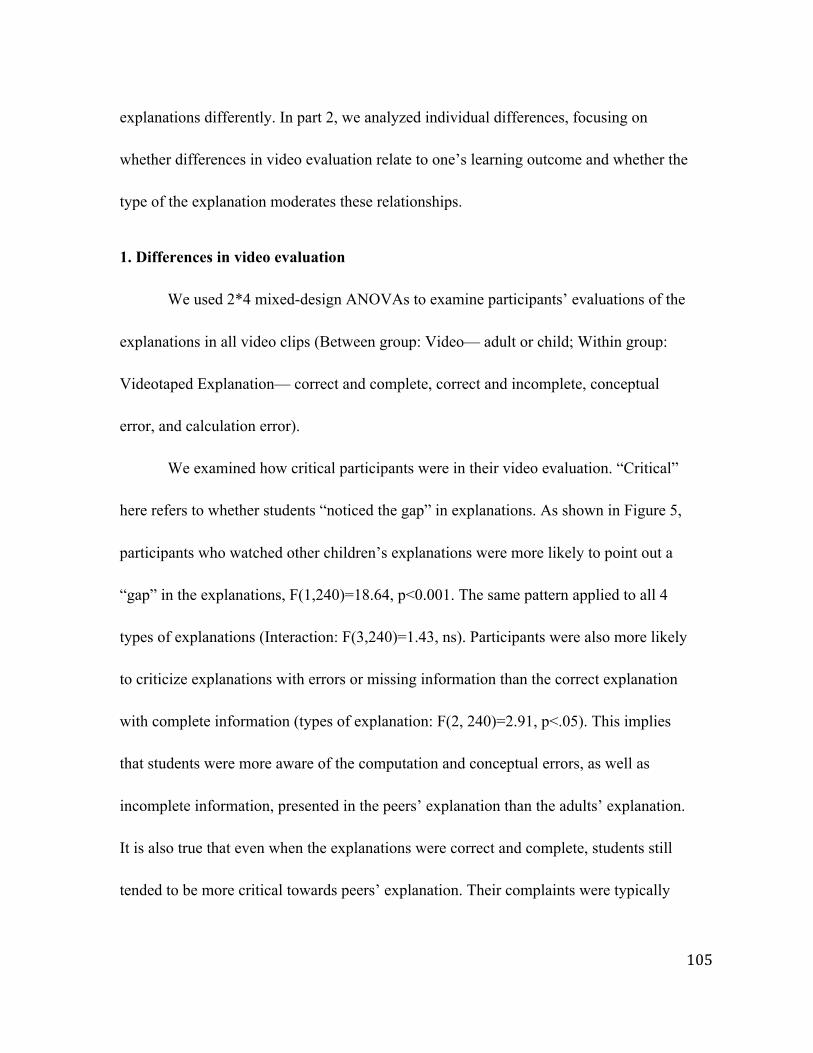
105
explanations differently. In part 2, we analyzed individual differences, focusing on
whether differences in video evaluation relate to one’s learning outcome and whether the
type of the explanation moderates these relationships.
1. Differences in video evaluation
We used 2*4 mixed-design ANOVAs to examine participants’ evaluations of the
explanations in all video clips (Between group: Video— adult or child; Within group:
Videotaped Explanation— correct and complete, correct and incomplete, conceptual
error, and calculation error).
We examined how critical participants were in their video evaluation. “Critical”
here refers to whether students “noticed the gap” in explanations. As shown in Figure 5,
participants who watched other children’s explanations were more likely to point out a
“gap” in the explanations, F(1,240)=18.64, p<0.001. The same pattern applied to all 4
types of explanations (Interaction: F(3,240)=1.43, ns). Participants were also more likely
to criticize explanations with errors or missing information than the correct explanation
with complete information (types of explanation: F(2, 240)=2.91, p<.05). This implies
that students were more aware of the computation and conceptual errors, as well as
incomplete information, presented in the peers’ explanation than the adults’ explanation.
It is also true that even when the explanations were correct and complete, students still
tended to be more critical towards peers’ explanation. Their complaints were typically
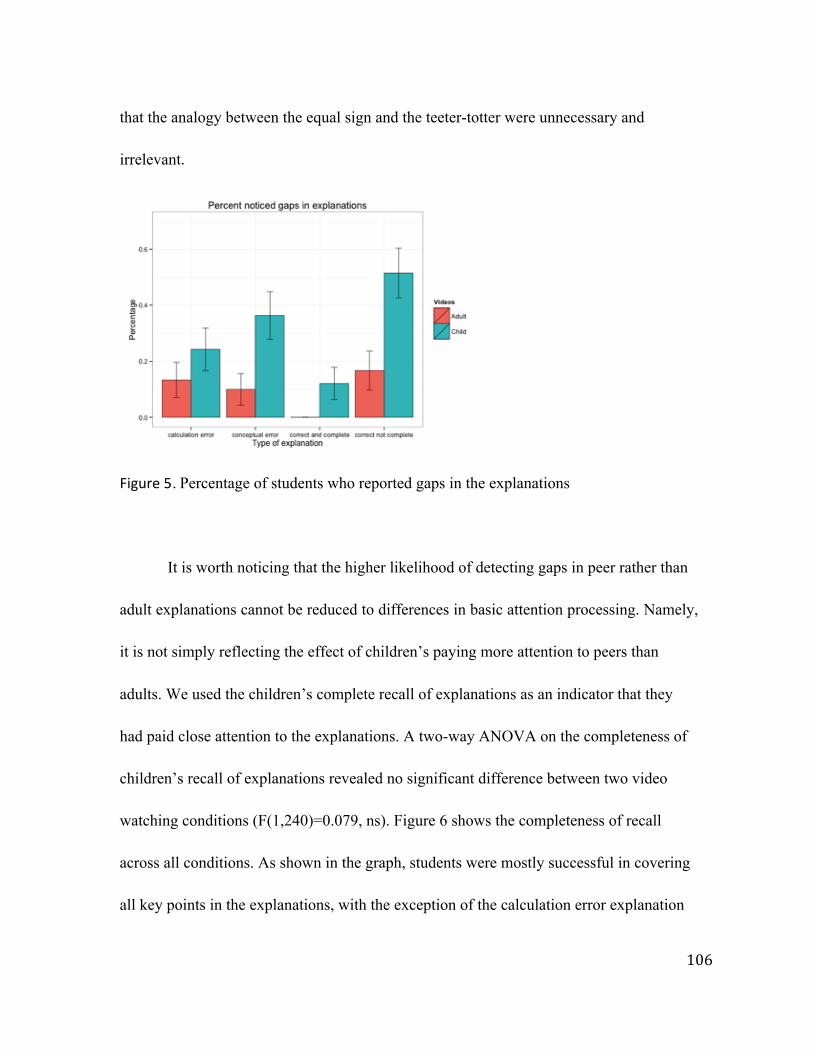
106
that the analogy between the equal sign and the teeter-totter were unnecessary and
irrelevant.
Figure 5. Percentage of students who reported gaps in the explanations
It is worth noticing that the higher likelihood of detecting gaps in peer rather than
adult explanations cannot be reduced to differences in basic attention processing. Namely,
it is not simply reflecting the effect of children’s paying more attention to peers than
adults. We used the children’s complete recall of explanations as an indicator that they
had paid close attention to the explanations. A two-way ANOVA on the completeness of
children’s recall of explanations revealed no significant difference between two video
watching conditions (F(1,240)=0.079, ns). Figure 6 shows the completeness of recall
across all conditions. As shown in the graph, students were mostly successful in covering
all key points in the explanations, with the exception of the calculation error explanation
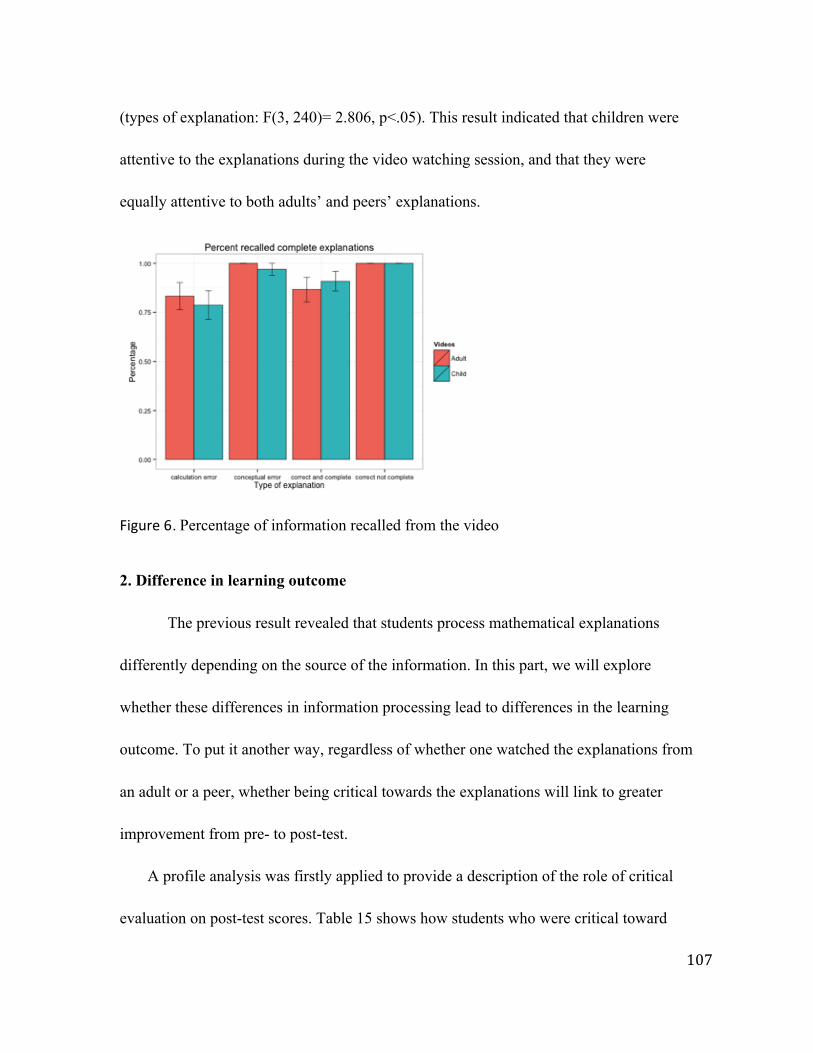
107
(types of explanation: F(3, 240)= 2.806, p<.05). This result indicated that children were
attentive to the explanations during the video watching session, and that they were
equally attentive to both adults’ and peers’ explanations.
Figure 6. Percentage of information recalled from the video
2. Difference in learning outcome
The previous result revealed that students process mathematical explanations
differently depending on the source of the information. In this part, we will explore
whether these differences in information processing lead to differences in the learning
outcome. To put it another way, regardless of whether one watched the explanations from
an adult or a peer, whether being critical towards the explanations will link to greater
improvement from pre- to post-test.
A profile analysis was firstly applied to provide a description of the role of critical
evaluation on post-test scores. Table 15 shows how students who were critical toward
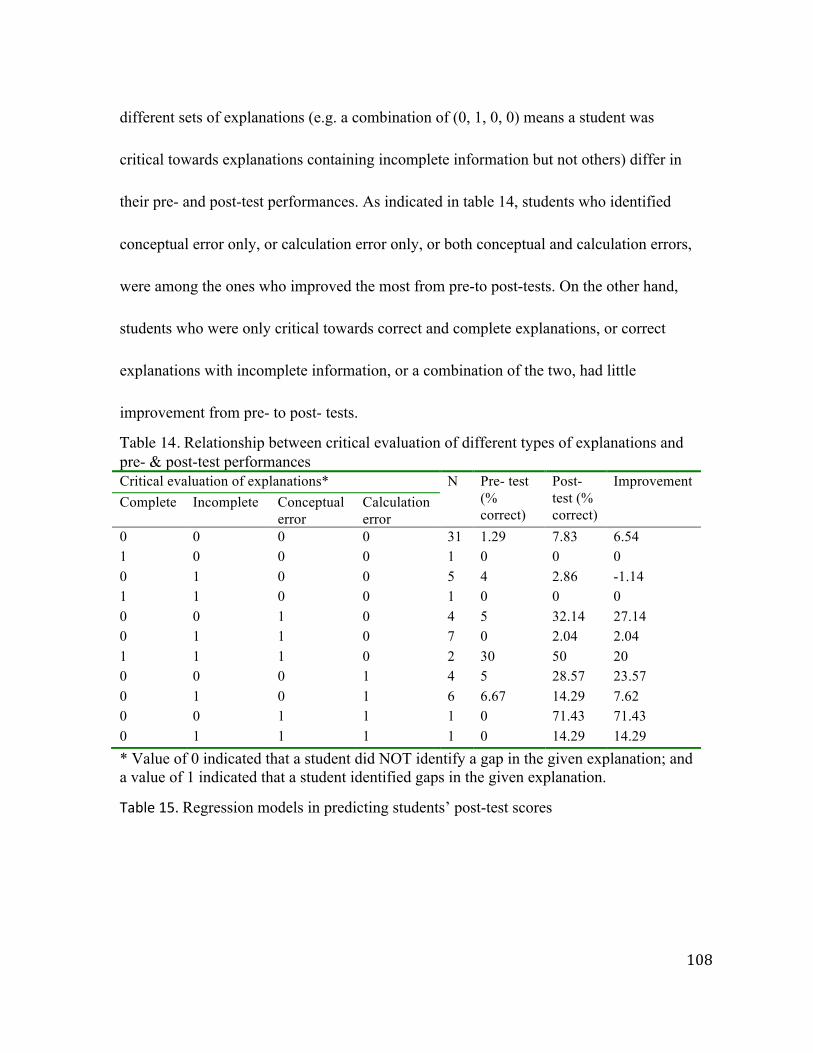
108
different sets of explanations (e.g. a combination of (0, 1, 0, 0) means a student was
critical towards explanations containing incomplete information but not others) differ in
their pre- and post-test performances. As indicated in table 14, students who identified
conceptual error only, or calculation error only, or both conceptual and calculation errors,
were among the ones who improved the most from pre-to post-tests. On the other hand,
students who were only critical towards correct and complete explanations, or correct
explanations with incomplete information, or a combination of the two, had little
improvement from pre- to post- tests.
Table 14. Relationship between critical evaluation of different types of explanations and pre- & post-test performances Critical evaluation of explanations* N Pre- test
(% correct)
Post- test (% correct)
Improvement Complete Incomplete Conceptual
error Calculation error
0 0 0 0 31 1.29 7.83 6.54 1 0 0 0 1 0 0 0 0 1 0 0 5 4 2.86 -1.14 1 1 0 0 1 0 0 0 0 0 1 0 4 5 32.14 27.14 0 1 1 0 7 0 2.04 2.04 1 1 1 0 2 30 50 20 0 0 0 1 4 5 28.57 23.57 0 1 0 1 6 6.67 14.29 7.62 0 0 1 1 1 0 71.43 71.43 0 1 1 1 1 0 14.29 14.29 * Value of 0 indicated that a student did NOT identify a gap in the given explanation; and a value of 1 indicated that a student identified gaps in the given explanation.
Table 15. Regression models in predicting students’ post-test scores
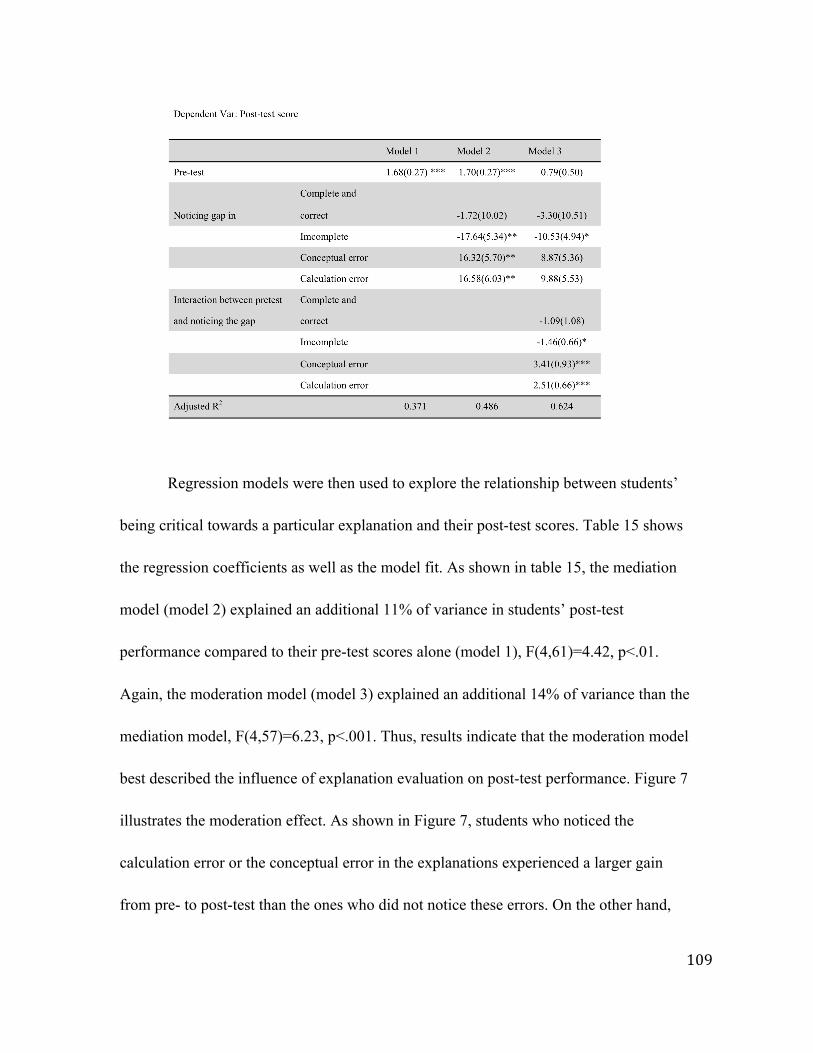
109
Regression models were then used to explore the relationship between students’
being critical towards a particular explanation and their post-test scores. Table 15 shows
the regression coefficients as well as the model fit. As shown in table 15, the mediation
model (model 2) explained an additional 11% of variance in students’ post-test
performance compared to their pre-test scores alone (model 1), F(4,61)=4.42, p<.01.
Again, the moderation model (model 3) explained an additional 14% of variance than the
mediation model, F(4,57)=6.23, p<.001. Thus, results indicate that the moderation model
best described the influence of explanation evaluation on post-test performance. Figure 7
illustrates the moderation effect. As shown in Figure 7, students who noticed the
calculation error or the conceptual error in the explanations experienced a larger gain
from pre- to post-test than the ones who did not notice these errors. On the other hand,
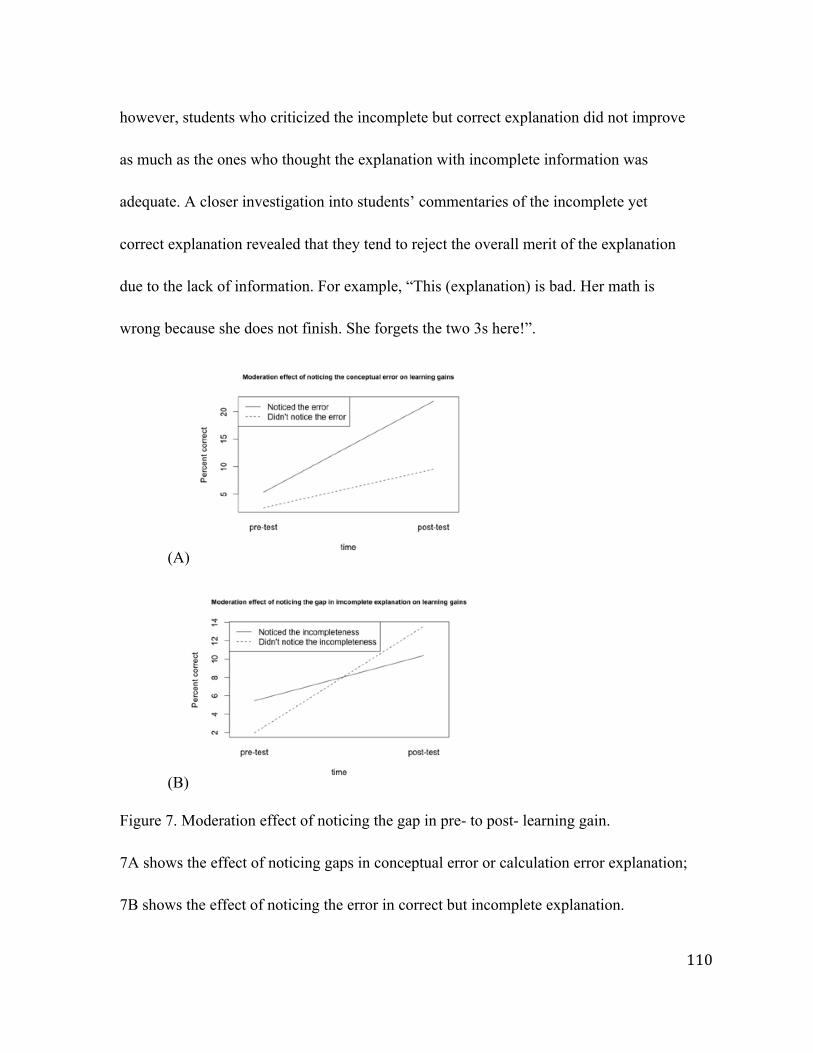
110
however, students who criticized the incomplete but correct explanation did not improve
as much as the ones who thought the explanation with incomplete information was
adequate. A closer investigation into students’ commentaries of the incomplete yet
correct explanation revealed that they tend to reject the overall merit of the explanation
due to the lack of information. For example, “This (explanation) is bad. Her math is
wrong because she does not finish. She forgets the two 3s here!”.
(A)
(B)
Figure 7. Moderation effect of noticing the gap in pre- to post- learning gain.
7A shows the effect of noticing gaps in conceptual error or calculation error explanation;
7B shows the effect of noticing the error in correct but incomplete explanation.
111
Discussion
The goal of the current study is to examine whether students would process adult
and peer explanations differently, and how these differences would lead to difference in
learning outcome. Results demonstrate that elementary students are more critical towards
peer than adult mathematical explanations, even when the content of the explanations are
identical. Students are more likely to criticize peer-generated explanations when the
explanations contain conceptual errors, miscalculations, or missing information. Their
criticism identifies the errors or the insufficient information in the explanations. Students
are also more likely to criticize peer-generated explanations even when the explanations
are mathematically correct and sufficient. In such cases, students’ criticism was that the
analogy between the teeter-totter and the equal sign are unnecessary.
Moreover, students in the current study identify explanations as either good or
bad ones with no “gray” areas in between. They do not treat explanations with
conceptual/calculation errors and explanations with missing information differently in
their evaluation. Rather, if they treat one as a “wrong” explanation, they also treat the
other two as “wrong” or “bad” explanations. They also came to the conclusion that wrong
explanation would result in wrong solution (i.e. “The math is wrong!”), which is not
always the case. For instance, when a conceptual error or a calculation error occurred in
the explanation, the given numerical answer is incorrect. But when an explanation
112
contains insufficient information, the given numerical answer is still correct. If one
rejects the solution resulted from both erratic explanations (i.e. conceptual error or
calculation error) and insufficient explanation, he/she is making mathematically correct
decision for the former but not the latter. Therefore, students’ lack of differentiation
between actual errors and insufficient information, together with their conclusion that
both errors and insufficient information would lead to incorrect solutions, may explain
the moderation effect of the types of explanations. As shown in the results, the types of
explanations moderate the relationship between criticizing an explanation and the
learning outcome. Students who criticized the conceptual or calculation error showed
greater improvement from pre- to post-test, while the ones who criticized for the missing
information in the explanations showed less improvement.
Taken together, the current study indicates that peer explanations elicit students’
deep cognitive processing rather than confusing or misleading them, and such a
difference in cognitive processing influences their learning outcomes. Identifying the
calculation error or the conceptual error relates to larger improvement from pre- to post-
test, whereas identifying missing information in a correct yet incomplete explanation
relates to reduced improvement.
Why does the source of the explanation matter?
Students’ more critical stance towards peer explanation may result from their
expectation that peers are a less reliable source of knowledge. There are at least two
113
reasons they might think so. Age is a cue that students use when they are screening
sources for reliability (Lutz & Keil, 2002; Jaswal & Neely, 2006). Their own classroom
experience may include experiences where their peers had difficulty solving a problem,
or produced a wrong solution, and this may work against the credibility of an unknown
peer in offering a math explanation.
Besides the effect of the explainer’s age, the quality of explanations also matters
in eliciting students’ criticism. Students were less likely to criticize the correct and
complete explanation than the other three types. This result seems counterintuitive given
that most students at pre-test hold the same erratic interpretation of the equal sign as that
offered in the conceptual error explanation, and that students prefer the information
which agrees with their own belief over that which challenges their own belief (Jaswal &
Neely, 2006; Jaswal & Malone, 2007). If students were more likely to agree with what
they already believed, they should have been less likely to raise criticism towards
conceptual errors explanation than towards other explanations. One interpretation for this
result is that in current studies, all explanations challenge students’ previous beliefs about
the meaning of the equal sign to some degree. In the conceptual error explanation, the
explainer added all the numbers to the left of the equal sign, which correspond to some
students’ understanding about the meaning of the equal sign. Yet she continued adding
numbers from the right side of the equation as well, which could challenge students’
beliefs that the equal sign “signals the end of operation”. In the calculation error
114
condition, the calculation error contradicts the arithmetic fact students may retrieve from
memory. In both the correct and complete explanation as well as the explanation with
missing information, the equal sign was treated as a relational sign to indicate the
equivalent relationship between the two sides, which is contrary to students’ prior beliefs.
Thus, when all the explanations offer some degree of challenge to students’ prior
knowledge and understanding, they may update their previous knowledge to the
explanations or criticize the explanation to be “bad”.
The link between processing difference and learning outcome
Identifying an explanation as a “bad” one is not the end of the story. Results
reveal that the negative evaluation of the mathematical explanations relates to students
learning outcome. Students’ subjective experience of difficulty in information processing,
known as “disfluency” (Oppenheimer, 2008) will act as an indirect cue that serves as a
metacognitive signal to prompt more elaborated processing of the information (Alter et
al., 2007). This more elaborated processing makes students less vulnerable to errors.
Moreover, students benefit from identifying the errors. The relationship between
identifying the conceptual and calculation errors and the learning outcome may also
result from the self-explanation process (Renkl, 1999; Siegler, 2002; Rittle-Johnson,
2006). Students in the current study were asked to explain why they thought a particular
explanation was good or bad. While their reasoning behind judgments of a “good”
explanation is usually superficial, such as that the explanation was clear, students’
115
reasoning behind judgments of a “bad” explanation involves identifying the possible
errors in the explanation, which has been shown to lead to immediate procedural learning
(Pine & Messer, 2000) and procedural transfer (Aleven & Koedinger, 2002; Atkinson,
Renkl, & Merrill, 2003; Wong, Lawson, & Keeves, 2002). From this point of view,
students should be encouraged to explain their problem solving and their reasoning in the
math class, because their peers are more likely to engage in analytic reasoning towards
students’ explanations than the teacher’s. The peers are able to identify the errors in the
explanations and benefit from such practice.
On the other hand, more elaborated processing of the information does not
guarantee that students will attend to the important aspects of the explanations. Let’s take
the correct yet incomplete explanation for example. Students who identified this
explanation as “confusing” pointed out that “she missed some numbers here”. They went
ahead and determined that one cannot delete numbers from a math problem but have to
do something with them. They later focused their attention on putting these numbers back
into the calculation, rather than whether it is OK to omit numbers and operations in
certain cases. This way, students who reject the merits of the correct yet incomplete
explanation were less likely to switch from an operational to a relational understanding.
From this point of view, students need instructional help in where to pay attention to
when a mathematical explanation is given.
Results answers to teachers’ concerns that students may remember the erratic
116
explanation from their peers. The current research suggests that students are not so
vulnerable. They are able to identify errors and missing information even when they may
hold similar erratic understanding themselves, and students who identified the actual
errors showed improvements in solving problems which they cannot solve in pre-test and
have not seen in the video clips. Thus, students can benefit from peers’ math
explanations.
Role of teachers in eliciting peer explanation and monitoring peer interaction
What is the role of teachers when peers are providing explanations? First of all,
teachers’ instructions and questions are needed to elicit students’ mathematical
explanations. This is because students do not usually spontaneously engage in providing
mathematical explanations to their class. Students do not elaborate on material unless
prompted to (Britton, Van Dusen, Glynn, & Hemphill, 1990), and they do not ask thought
provoking questions without training on question asking (King, 1992). Secondly, teachers
need to assure students are paying attention to each other. Students’ analytic reasoning of
peers’ explanations is only possible if they paid attention to their peers. In current study,
students were directed to attend to the explanations in the video by experimenters’
instructions as well as questions eliciting evaluations after their watching each of the
video clips. While in the classroom, the complexity of the classroom environment and
concurrent tasks may distract students when their peers are explaining, and thus eliminate
the possibility of benefiting from the explanations. Teachers may use repeat or rephrase
117
requests to direct students’ attention as well as encourage their engagement in the sense
making process (Chapin, O’Connor, & Anderson, 2009). Finally, teachers need to direct
students’ attention to important aspects of explanations, especially when students reject
the merits of peer explanations when the explanations are fragmented. Students’
over-simplification may keep them from further and deeper processing of the explanation
and therefore hinder their learning. In these cases, teachers may use questions to direct
students to attend to positive aspects of peers’ explanations, or to ask for elaboration from
the students who offered the explanation.
Overall, the current study suggests that students should be given opportunities to
discuss their peer’s solutions and explanations. Teachers’ role in promoting students’
explaining and learning from others’ explanations include asking how and why questions
to prompt explaining and elaborating, directing students attention to their peers’
explanations, and discouraging over-simplification in evaluating peers’ explanations.
118
References
Aleven, V. A., & Koedinger, K. R. (2002). An effective metacognitive strategy: Learning by doing and explaining with a computer-based Cognitive Tutor. Cognitive science, 26(2), 147-179.
Alter, A. L., Oppenheimer, D. M., Epley, N., & Eyre, R. N. (2007). Overcoming intuition: Metacognitive difficulty activates analytic reasoning. Journal of Experimental Psychology-General, 136(4), 569-576.
Alter, A. L., & Oppenheimer, D. M. (2008). Easy on the mind, easy on the wallet: The effects of familiarity and fluency on currency valuation. Psychonomic Bulletin and Review, 15, 985-990.
Atkinson, R. K., Renkl, A., & Merrill, M. M. (2003). Transitioning From Studying Examples to Solving Problems: Effects of Self-Explanation Prompts and Fading Worked-Out Steps. Journal of Educational Psychology, 95(4), 774.
Bartlett, A. A. (1992). The Feynman Effect and the Boon Docs. Physics Today, 45(1), 67-69.
Begg, I., Duft, S., Lalonde, P., Melnick, R., & Sanvito, J. (1989). Memory predictions are based on ease of processing. Journal of Memory and Language, 28, 610–632.
Bertsch, S., Pesta, B. J., Wiscott, R., & McDaniel, M. A. (2007). The generation effect: A meta-analytic review. Memory & Cognition, 35(2), 201-210.
Bjork, E. L., & Bjork, R. A. (2011). Making things hard on yourself, but in a good way: Creating desirable difficulties to enhance learning. In M. A. Gernsbacher, R. W. Pew, L. M. Hough, & J. R. Pomerantz (Eds.), Psychology and the real world: Essays illustrating fundamental contributions to society (pp. 56-64). New York: Worth Publishers.
Britton, B. K., Van Dusen, L., Glynn, S. M., & Hemphill, D. (1990). The impact of inferences on instructional text. Psychology of learning and motivation, 25, 53-70.
Chi, M.T.H., de Leeuw, N., Chiu, M.H., LaVancher, C. (1994). Eliciting self-explanations improves understanding. Cognitive Science, 18, 439-477.
Chi, M. T. H., Siler, S., Jeong, H., Yamauchi, T., & Hausmann, R. G. (2001). Learning from tutoring. Cognitive Science, 25, 471–533.
Chapin, S. H., O'Connor, C., & Anderson, N. C. (2009). Classroom Discussions: Using Math Talk to Help Students Learn, Grades K-6. Math Solutions.
Crouch, C. H., & Mazur, E. (2001). Peer instruction: Ten years of experience and results. American Journal of Physics, 69, 970.
Diemand-Yauman, C., Oppenheimer, D. M., & Vaughan, E. B. (2011). Fortune favors the bold (and the italicized): Effects of disfluency on educational outcomes. Cognition, 118(1), 111-115.
Hirshman, E. L., & Bjork, R. A. (1988). The generation effect: Support for a two-factor theory. Journal of Experimental Psychology: Learning, Memory, and Cognition,
119
14, 484-494. Hausmann, R. G., & Vanlehn, K. (2007). Explaining self-explaining: A contrast between
content and generation. Frontiers in Artificial Intelligence and Applications, 158, 417.
Ivie, C. (2006). Einstein’s coffee. [Electronic version] Retrieved 12/9/2013 from: http://www.writerscramp.ca/docs/einsteins_coffee.htm
Jaswal, V.K., & Neely, L.A. (2006). Adults don’t always know best: preschoolers use past reliability over age when learning new words. Psychological Science 17(9): 757–758.
Jaswal, V.K., & Malone, P.S. (2007). Turning believers into skeptics: 3-year-olds’ sensitivity to cues to speaker credibility. Journal of Cognition and Development 8(3): 263–283.
Jacoby, L. L., Bjork, R. A., & Kelley, C. M. (1994). Illusions of comprehension, competence, and remembering. In D. Druckman & R. A. Bjork (Eds.), Learning, remembering, believing: Enhancing human performance (pp. 57-80). Washington, DC: National Academy Press.
King, A. (1992). Facilitating elaborative learning through guided student-generated questioning. Educational Psychologist, 27(1), 111-126.
Knuth, E. J., Alibali, M. W., Hattikudur, S., McNeil, N. M., & Stephens, A. C. (2008). The Importance of Equal Sign Understanding in the Middle Grades. Mathematics teaching in the Middle School, 13(9), 514-519.
Knuth, E. J., Stephens, A. C., McNeil, N. M., & Alibali, M. W. (2006). Does understanding the equal sign matter? Evidence from solving equations. Journal for Research in Mathematics Education, 37(4), 297-312.
Lutz, D. J., & Keil, F. C. (2002). Early understanding of the division of cognitive labor. Child development, 73(4), 1073-1084.
McNamara, D. S. (2004). SERT: Self-explanation reading training. Discourse Processes, 38(1), 1-30.
McNeil, N. M. (2008). Limitations to teaching children 2 + 2 = 4: Typical arithmetic problems can hinder learning of mathematical equivalence. Child Development, 79, 1524-1537.
McNeil, N. M., & Alibali, M. W. (2005). Why won’t you change your mind? Knowledge of operational patterns hinders learning and performance on equations. Child Development, 76, 883-899.
National Council of Teachers of Mathematics (1991). Professional standards for teaching mathematics. Reston, VA: NCTM.
Novemsky, N., Dhar, R., Schwarz, N., & Simonson, I. (2007). Preference fluency in choice. Journal of Marketing Research, 44(3), 347-356.
Oppenheimer, D. M. (2008). The secret life of fluency. Trends in cognitive sciences, 12(6), 237-241.
120
Pine, K. J., & Messer, D. J. (2000). The effect of explaining another's actions on children's implicit theories of balance. Cognition and Instruction, 18(1), 35-51.
Rao, S. P., & DiCarlo, S. E. (2000). Peer instruction improves performance on quizzes. Advances in Physiology Education, 24(1), 51-55.
Reber, R., & Zupanek, N. (2002). Effects of processing fluency on estimates of probability and frequency. In P. Sedlmeier & T. Betsch (Eds.), Etc. Frequency Processing and Cognition (pp. 175–188). Oxford University Press.
Renkl, A. (1999). Learning mathematics from worked-out examples: Analyzing and fostering self-explanations. European Journal of Psychology of Education,14(4), 477-488.
Renkl, A. (2002). Worked-out examples: Instructional explanations support learning by self-explanations. Learning and Instruction, 12, 529–556.
Richland, L. E., Bjork, R. A., Finley, J. R., & Linn, M. C. (2005). Linking cognitive science to education: Generation and interleaving effects. In Proceedings of the twenty-seventh annual conference of the cognitive science society. Mahwah, NJ: Erlbaum.
Rittle-Johnson, B. (2006). Promoting transfer: Effects of self‐explanation and direct instruction. Child development, 77(1), 1-15.
Rittle-Johnson, B., Matthews, P., Taylor, R. & McEldoon, K. (2010, October). Assessing knowledge of mathematical equivalence: A construct modeling approach. In P. Brosnan, D. B. Erchick, & L. Flevares (Eds.) Proceedings of the Thirty Second Annual Meeting of the North American Chapter of the International Group for the Psychology of Mathematics Education: Optimizing Student Understanding in Mathematics (p. 211). Columbus, OH: ERIC Clearinghouse for Science, Mathematics, and Environmental Education.
Roth, K. J., Druker, S. L., Garnier, H. E., Lemmens, M., Chen, C., & Kawanaka, T. et al. (2006). Teaching Science in Five Countries: Results From the TIMSS 1999 Video Study. Statistical Analysis Report. NCES 2006-011. National Center for Education Statistics.
Roy, M. & Chi, M.T.H. (2005). Self-explanation in a multi-media context. In R. Mayer (Ed.), Cambridge Handbook of Multimedia Learning (pp. 271-286). Cambridge Press.
Pesta, B. J., Sanders, R. E., & Murphy, M. D. (1999). A beautiful day in the neighborhood: What factors determine the generation effect for simple multiplication problems?. Memory & cognition, 27(1), 106-115.
Schworm, S., & Renkl, A. (2006). Computer-supported example-based learning: When instructional explanations reduce self-explanations. Computers & Education, 46(4), 426-445.
Siegler, R. S. (2002). Microgenetic studies of self-explanation. Microdevelopment: Transition processes in development and learning, 31-58.
121
Sims, L., Perry, M., McConney, M., Schleppenbach, M., Miller, K., & Wilson, T. (2008). Look who's talking: Differences in math talk in U.S. and Chinese classrooms. Teaching Children Mathematics, 15(2), 120-124.
Slamecka, N. J., & Graf, P. (1978). The generation effect: Delineation of a phenomenon. Journal of experimental Psychology: Human learning and Memory, 4(6), 592-604.
VanLehn, K., Siler, S., Murray, C., Yamauchi, T., & Baggett, W. B. (2003). Why do only some events cause learning during human tutoring?. Cognition and Instruction, 21(3), 209-249.
Wittwer, J., & Renkl, A. (2008). Why instructional explanations often do not work: A framework for understanding the effectiveness of instructional explanations. Educational Psychologist, 43, 49–64.
Wong, R. M., Lawson, M. J., & Keeves, J. (2002). The effects of self-explanation training on students' problem solving in high-school mathematics. Learning and Instruction, 12(2), 233-262.
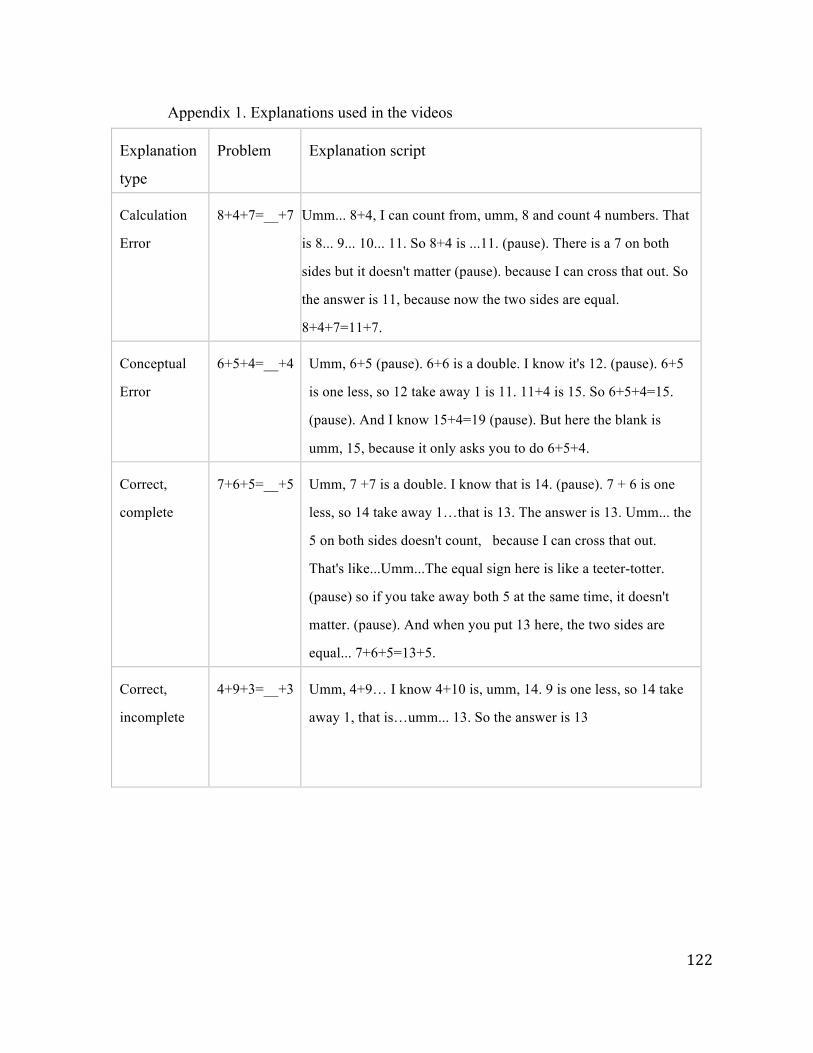
122
Appendix 1. Explanations used in the videos
Explanation
type
Problem Explanation script
Calculation
Error
8+4+7=__+7 Umm... 8+4, I can count from, umm, 8 and count 4 numbers. That
is 8... 9... 10... 11. So 8+4 is ...11. (pause). There is a 7 on both
sides but it doesn't matter (pause). because I can cross that out. So
the answer is 11, because now the two sides are equal.
8+4+7=11+7.
Conceptual
Error
6+5+4=__+4 Umm, 6+5 (pause). 6+6 is a double. I know it's 12. (pause). 6+5
is one less, so 12 take away 1 is 11. 11+4 is 15. So 6+5+4=15.
(pause). And I know 15+4=19 (pause). But here the blank is
umm, 15, because it only asks you to do 6+5+4.
Correct,
complete
7+6+5=__+5 Umm, 7 +7 is a double. I know that is 14. (pause). 7 + 6 is one
less, so 14 take away 1…that is 13. The answer is 13. Umm... the
5 on both sides doesn't count, because I can cross that out.
That's like...Umm...The equal sign here is like a teeter-totter.
(pause) so if you take away both 5 at the same time, it doesn't
matter. (pause). And when you put 13 here, the two sides are
equal... 7+6+5=13+5.
Correct,
incomplete
4+9+3=__+3 Umm, 4+9… I know 4+10 is, umm, 14. 9 is one less, so 14 take
away 1, that is…umm... 13. So the answer is 13
123
Chapter 5
Closing remarks
This set of studies set out to explore the discrepancy between the emphasis on
students engaging in mathematical explanation in curriculum standards and the dearth of
student explanations in US mathematics classrooms. Underlying reasons for such
discrepancy may include a lack of understanding about which instructional features may
effectively elicit explanations, the concern about young students’ competence in
constructing any form of explanation, as well as the concern that a students’ inaccurate
explanation may impede the learning of whole class.
These concerns were addressed in the following three studies. The first study aimed
to provide a benchmark about the quantity of students’ explanations in US in comparison
with other countries, as well as to explore the links between classroom features and the
amount of students’ explanations. The second study focused on the quality of students’
explanations in the context of mathematical equivalence. It aimed to provide a
benchmark about the quality of students’ explanations in terms of both accuracy and
mathematical richness. The third study focused on students’ processing of explanations.
124
It aimed to examine the effects of explanation source (i.e. from adults versus from peers)
on students’ processing the explanation, specifically, whether students’ processing of the
information varies with the sources and with the quality of the explanation, and how do
these differences relate to students’ learning outcome.
Summary of findings
1. How many mathematical explanations do students provide in a class? Which
classroom features predict students’ production of explanations?
Firstly, students’ production of mathematical explanation is universally a rare
phenomenon, and US classrooms are particularly low in this dimension. Study 1 showed
that across three countries (United States, Japan, and Hong Kong SAR), less than 5% of
students’ statements in a mathematics lesson are explanations. And the amount in US is
half of that in Japan or Hong Kong.
Secondly, the more talk opportunities students were given, the more
explanations they may provide. Across all three countries, the proportion of student talk
time in a class positively predicted the amount of students’ explanations produced in that
class.
Thirdly, teachers’ use of questioning and language modeling predicted the
amount of students’ explanations, except in US. Teacher’s request for procedure, or their
“how” questions, predict the amount of student explanations in Hong Kong. In Japan, it is
teacher’s request for reasoning, or their “why” questions, as well as their use of
125
contradictory indication (i.e. disagree, different opinion) that predicted the amount of
student explanations. In US, however, none of the teacher’s talk features examined in the
current study exhibit a significant relationship with the amount of student explanations.
Why might this be? This result suggests that simply asking “why” questions is
not enough to ensure that the outcome of these questions will be explanations. What an
explanation is is a complicated question in itself, and so it’s not surprising that students
do not automatically know how to give a useful answer to “why” questions. More
research on how teachers can help students learn how to engage in explanations will help
us to understand how teachers can socialize students to focus on explanations.
2. What can we expect from students’ explanations?
Firstly, accuracy of students’ explanations is limited by their understanding of
the mathematical content. Misconceptions are reflected in students’ inaccurate
explanations. Study 2 showed that US students provided inaccurate explanations on about
half of the items on mathematical equivalence. And their inaccuracy had to do with
interpreting equal sign as an indication of the end of operations rather than an indication
of relationship.
Secondly, students’ explanations can take different forms, and tasks they were
given influence the form of explanation provided. For equation solving problems,
students’ most common explanations took the form of description, stating the steps they
took to calculate the answer. When they were asked to judge the correctness of a given
126
solution, forms of explanation diverged. Some chose to solve the question themselves
then compared the answer to what they got, some focused on whether the procedure
described in the given solution made sense, while others substituted the number back into
the original question to check if conditions were met.
Results from Study 2 suggest that US children have a less clear sense of what an
explanation is than do their peers in China, which is perhaps not surprising given their
relative lack of opportunities to produce explanations in class.
3. Will a student’s erroneous explanations impede other students’ understanding?
We described a concern of some teachers that letting their students hear the
erroneous explanations of peers might be an obstacle to learning, as the confusion of the
original student would spread to his or her peers. Our results tend to allay these fears.
Firstly, students are not as vulnerable to erroneous explanations as one may expect,
especially when those explanations come from a peer. Compare to students who watched
adult explanations, the ones who watched peers’ explanations were more likely to
identify the insufficiency in the explanations.
Secondly, elementary students’ criticalness towards an explanation is “all or
none”. They tend to either accept an explanation to be a “good one”, or reject its merit
altogether. Study 3 showed that students do not differentiate errors and inadequacy. They
tend to reject the merit of an explanation when they identify a conceptual or calculation
error, or when they realize there is information missing (and therefore perceive difficulty
127
in processing such information).
Thirdly, being critical towards an explanation has an impact in one’s learning
from these explanations. Students who identified the inaccurate information showed
greater gain from pre- to post-test. On the other hand, students who were caught up with
missing information, but not inaccuracy, in an explanation, showed smaller gains from
pre- to post- test.
Results suggest that the problem children have in evaluating peer explanations is
not that they blindly accept them but that they tend to be overly critical, failing to
distinguish real errors from minor oversights. These results suggest that students will
need help in learning how to be appropriately critical of their peers’ explanations so as to
focus on the underlying concepts.
Implications
These studies have important implications for instructions. The question of when and
how errors should be handled is a key issue in managing a classroom discussion, and one
of the reasons that some teachers have given for eschewing classroom discussions
(Correa & Miller, 2007). The current study provided evidence that it is unnecessary for
teachers to worry that if a student says something wrong, it will influence others to have
the same erroneous belief. In fact, students are more likely to identify the errors from
their peers and benefit from the recognition of such errors. To attain such benefits,
however, two conditions have to be met. The first condition is that students have to be
128
paying attention to their peers, and the second condition is that students need to be given
the opportunity to respond to their peers. Giving students opportunities to respond to peer
explanation also provides teachers with an opportunity to observe which part of the
information were students focusing on, and whether an erroneous explanation has gained
prevalence in the class. Moreover, the current study shed light on the potential of
instructional practices to effectively elicit student explanations. Such practices include
how and why questions and teacher’s language modeling. What differentiates the
effective and ineffective questioning is that whether teacher focuses on the critical
mathematical concept during the question, and whether he/she is persistent in requesting
student elaborations.
My studies also helped to advance the measurement of students’ explanations. Study
1 proposed a categorization algorithm which has the capacity to automatically categorize
students’ utterance with high reliability at classroom level. This model, when combined
with automatic speech recognition tools, has the power of providing real-time feedback
about the quality of student explanations in the classroom, and the potential to both
reduce the cost and increase the efficiency for classroom observation based professional
development programs.