Embed Size (px)
Citation preview
THE COMPARISON OF THE COLLEGE OF ARTS AND
SCIENCES UNDECLARED MAJOR DEVELOPMENTAL
STUDENTS TO HEAVY SCIENCE MAJOR
DEVELOPMENTAL STUDENTS
by
SHEYLEAH VERNESE HARRIS, B.A.
A THESIS
IN
MATHEMATICS
Submitted to the Graduate Faculty of Texas Tech University in
Partial Fulfillment of the Requirements for
the Degree of
MASTER OF SCIENCE
Approved
Chafllperson of ii\^ Codfaiittee
• ^ ~ / '
Accepted
Dean of the Graduate School
May, 2004
TABLE OF CONTENTS
LIST OF TABLES iv
CHAPTER
L INTRODUCTION 1
Statement of Problem 1
Purpose of Study l
Research Questions 2
Definition of Terms 2
II. REVIEW OF THE LITERATURE 7
Introduction 7
Research Question #1 9
Research Question #2 9
Research Question #3 11
Research Question #4 11
Research Question #5 12
m. METHODOLOGY 14
Introduction 14
Research Design 14
Data Analysis 15
IV. FINDINGS 17
Introduction 17
n
V. RESULTS 19
Developmental Mathematics Course 19
First College-Level Mathematics Course 20
Gender 22
Age 25
Ethnicity 28
Summary 31
REFERENCE LIST 33
APPENDIX A GENERAL STATISTICS FORMULAS 36
APPENDIX B TABLES OF INTERMEDIATE ALGEBRA GRADES, COLLEGE-LEVEL MATHEMATICS COURSES, GENDERS, AGES, ETHNICITY 39
HI
LIST OF TABLES
1.1: Heavy Science Majors 6
4.1: Number of Heavy Science Majors in Developmental Mathematics by Semesters... 18
4.2: Intermediate Algebra Course Outcome by Major 20
4.3: College-Level Mathematics Course Outcome by Major 21
4.4: College-Level Mathematics Course Outcome by Gender 24
4.5: College-Level Mathematics Course Outcomes by Age 26
4.6: College-Level Mathematics Course Outcome by Minority or Non-minority 29
4.7: Summary of Results of Success 31
B.l: Intermediate Algebra Grade by Majors 40
B.2: College-Level Mathematics Course Grade Distribution by Intermediate Algebra Grade 40
B.3: College-Level Mathematics Course Grade Distribution by Major 41
B.4: College-Level Mathematics Course Grade Distribution by Course 42
B.5: College-Level Mathematics Course Outcome by Course 43
B.6: College-Level Mathematics Courses by Major 44
B.7: College-Level Mathematics Course Grade Distribution by Gender 44
B.8: College-Level Course by Gender 45
B.9: College-Level Mathematics Course Grade Distribution by Age 45
B.IO: College-Level Mathematics Courses by Age 46
B. 11: College-Level Mathematics Course Grade Distribution by Ethnicity 47
B.12: College-Level Mathematics Courses by Ethnicity 48
iv

B.13: College-Level Mathematics Course Outcome by Ethnicity 49
CHAPTER I
INTRODUCTION
Statement of Problem
There seems to be some confusion among those who are involved in mathematics
education about whether developmental mathematics courses are effective. O'Connor
and Morrison (1997) found that developmental mathematics did not have a positive
measurable effect on the students in their first college-level mathematics course.
However, Peimy and White (1998) found sufficient evidence that successful completion
of developmental mathematics does have a positive measurable effect on the students in
their first college-level mathematics course. It has come to the researchers' attention that
many students who want to have a career in either the medical field, engineering field,
architecture field, or scientific research enter postsecondary education unprepared to do
college-level mathematics work. This presents a problem because the pre-professional,
science, engineering, mathematics, and architecture majors require more mathematics
and/or logic in their curriculum.
Purpose of Study
The purpose of this study in to determine if heavy science (HS) majors perform
better than Arts and Sciences undeclared (ASUD) majors in their first college-level
mathematics course at Texas Tech university. Factors considered were gender, age, and
ethnicity.
Research Ouestions
The research questions looked at is as follows:
1. How did the pre-professional, science, engineering, mathematics, and architecture
majors perform in the developmental mathematics course compared to the Arts
and Sciences undeclared majors?
2. How did the pre-professional, science, engineering, mathematics, and architecture
majors perform in their first college-level mathematics course compared to the
Arts and Sciences undeclared majors?
3. How did each gender of the pre-professional, science, engineering, mathematics,
and architecture majors, perform in their first college-level mathematics course
compared to the Arts and Science imdeclared majors?
4. How did the traditional students in both groups perform in comparison to non-
traditional students in their first college-level mathematics course?
5. How did minorities and non-minorities in both groups perform in their first
college-level mathematics course?
Definition of Terms
The terms needed, to be understood, in the paper are defined in the following list:
1, College-ready students are students that have the skills and knowledge necessary
to perform college-level work upon entering postsecondary schools (Van Etten,
1997).
2. Developmental courses provide instruction for students who are not expected
ordinarily to succeed in college without these courses (Kulik & Kulik, 1991).
This instruction includes skills and knowledge from the discipline areas of
mathematics, writing, reading, study skills, and English as a Second Language
that are required for student success in college-level course work (Van Etten,
1997).
3. Developmental students are students who need to learn skills that had not been
taught previously. Thus, the responsibility lies with their preparation, not their
capability (Van Etten, 1997).
4. Remedial students are students that have been taught the skills, but did not learn
them, hence the student must be retaught the same skills again. Remedial
instruction may be a tool used in a developmental program (Van Etten, 1997).
5. Students that are full-time, residential students within the ages of 18-22 are called
traditional students (Van Etten, 1997). For this paper, the researcher will only
be using the age component as an indicator of whether or not a student is
traditional. This is because the data set used does not distinguish whether a
person was full-time or part-time or if they commuted to or lived on campus.
6. A heavy science major (HS) is considered to have greater than two semesters of
mathematics and/or greater than two semesters of natural sciences with lab in
their curriculum. All natural sciences courses are taught in the College of Arts
and Sciences and all mathematics courses are taught by the Department of
Mathematics and Statistics.
7. The Mathematics Placement Exam (MPE) is the placement exam used by Texas
Tech University to assess a student's mathematical skill level. The exam guides
the student to the course he or she wishes to take or to a course that develops the
necessary prerequisite skills for the required courses in his or her degree program
(Texas Tech University, "Mathematics Placement Exam," 2003).
All of the major degree programs came from the Texas Tech University Catalog
for 2003 and 2004 (Texas Tech University, 2003). The researcher compared the
programs to the criteria stated above, and this dictated if a major was a heavy science or
not. Heavy science majors based upon this criterion include pre-professional majors,
science majors, engineering majors, architecture and other selected majors.
The researcher decided that Pre-dentistry, Pre-hearing Professional Assistant, Pre-
medicine, Pre-medicine Technology, Pre-nursing, Pre-optometry, Pre-pharmacy, Pre-
veterinary medicine, Pre-physical Therapy, Nursing, and Allied Health are the pre-
professional majors. The researcher also decided that Applied Physics, Biochemistry,
Biology, Cell and Molecular Biology, Chemistry, Geology, Geophysics, Geochemistry,
Mathematics, Microbiology, Physics, and Zoology are the science majors. The
researcher also decided that Chemical Engineering, Civil Engineering, Computer
Science, Construction Technology, Electrical Engineering, Electronics Technology,
Engineering, Engineering Physics, Environmental Engineering, Mechanical Engineering,
Mechanical Technology, and Petroleum Engineering are the engineering majors. Other
majors that fall into the heavy science majors are from the College of Agricultural
Sciences and Natural Resources are Animal Science, Environmental Conservation of
Natural Resources, Horticulture, Range Management, and Wildlife and Fisheries
Management. From the College of Architecture, the majors Architecture/ Civil
Engineering and Architecture fall into the heavy science category. The College of
Human Sciences has a heavy science major in Food and Nutrition. These are seen in
Table 1.1.
The researcher compared the number of heavy science majors in developmental
mathematics each semester in the data set. From this comparison, it came to the attention
of the researcher that there was an increase in the number of students that declared a
heavy science major in developmental mathematics courses. The researcher is interested
in how the heavy science majors do in their first college-level mathematics after their
developmental mathematics course in comparison to the College of Arts and Science
undeclared majors. We will be comparing the two groups by looking at grades in their
last developmental mathematics course, grades of the first college-level mathematics
course, gender, age, and ethnicity.
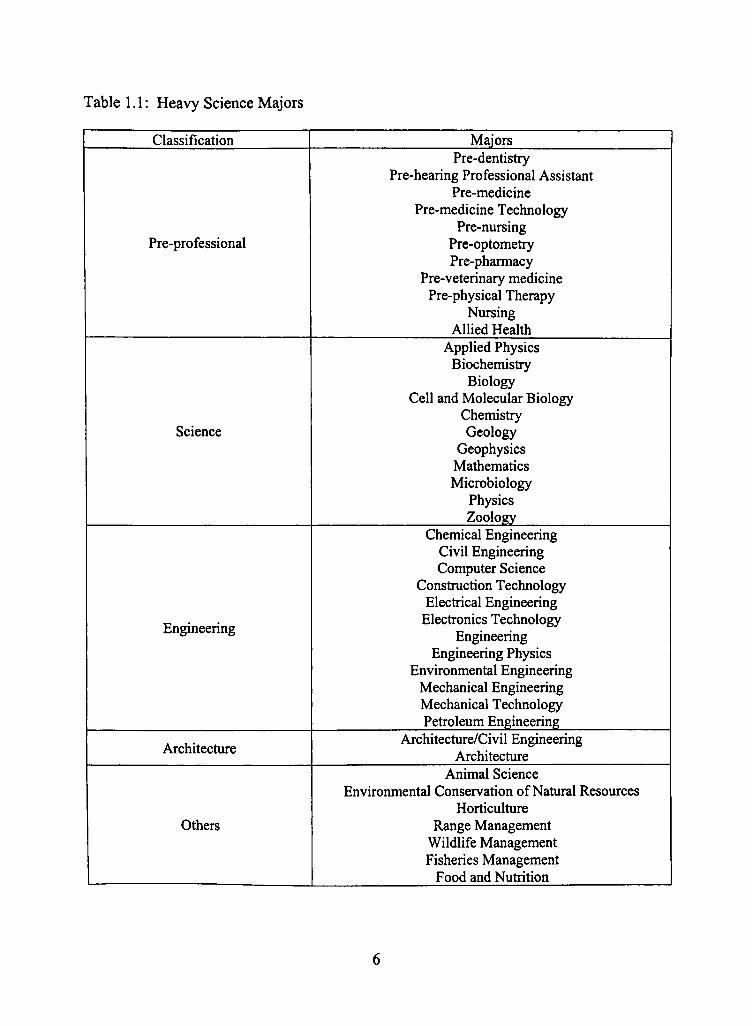
Table 1.1: Heavy Science Majors
Classification
Pre-professional
Science
Engineering
Architecture
Others
Majors Pre-dentistry
Pre-hearing Professional Assistant Pre-medicine
Pre-medicine Technology Pre-nursing
Pre-optometry Pre-pharmacy
Pre-veterinary medicine Pre-physical Therapy
Nursing Allied Health
Applied Physics Biochemistry
Biology Cell and Molecular Biology
Chemistry Geology
Geophysics Mathematics Microbiology
Physics Zoology
Chemical Engineering Civil Engineering Computer Science
Constmction Technology Electrical Engineering
Electronics Technology Engineering
Engineering Physics Environmental Engineering
Mechanical Engineering Mechanical Technology Petroleum Engineering
Architecture/Civil Engineering Architecture
Animal Science Environmental Conservation of Natural Resources
Horticulture Range Management
Wildlife Management Fisheries Management
Food and Nutrition
CHAPTER II
REVIEW OF THE LITERATURE
Introduction
At Texas Tech University, a student has to score below 230 on the Texas
Academic Skills Program (TASP) mathematics test (Texas Tech University, "TASP",
2004) or score below a 3 on the Mathematics Placement Exam (Texas Tech University,
"Mathematics Placement Exam", 2003) to be required to take Math 0301 (Essential
Mathematics) and/or Math 0302 (Intermediate Algebra). Students that successfully
complete Math 0302 with a grade of A or B will be allowed to eru-oU in college-level
mathematics courses, either Math 1320 (College Algebra), Math 1321 (Trigonometry),
Math 1330 (Introductory Mathematical Analysis), Math 1420 (College Algebra with
Review), Math 1430 (Introductory Mathematical Analysis with Review), Math 1550
(Pre-calculus), or Math 2300 (Statistical Methods). The curriculum requires most of the
students of the pre-professional, sciences, engineering, mathematics, and architecture
majors enter Math 1320, while mostly business majors enter Math 1330. Students who
exit Math 0302 with a grade of C or lower are required to retake the Mathematics
Placement Test or retake Math 0302. While success in developmental mathematics is
either an A or B, we will consider success in a college-level mathematics coiu-se as
passing with a C or better.
Some people consider mathematics to be the "Mother of all Logic" since it has a
very strong basis in logic. Everything in mathematics has to be proven to be accepted

and has an algorithm. This has bearing on the heavy science majors because physics is
applied mathematics and engineering is applied physics. At the same time, chemistry is
also applied physics and biology is applied chemistry. Therefore, even if a student will
not be using algebra overtly on an everyday basis, the student still has to use analytical
and critical thinking skills. This is true for all college majors. This is the point that most
instructors of mathematics try to convey to their students. Every major requires its
students to be able to recognize a problem, recognize what tools are needed to solve the
problem, and find the most efficient way to use those tools. This is solving word
problems and using critical thinking skills. This use of critical thinking skills is needed
especially for the heavy science majors that we are comparing to the undeclared majors
of the College of Arts and Sciences, and this is the reason the researcher is interested in
how each group did respectively.
In effect, failure in mathematics courses can be a limiting factor in an
undergraduate's choice of major (Berenson, Carter, & Norwood, 1992). One will often
come across a student that enters a field because of the amount of math required (or not
required) in the curriculimi. The researcher's biggest concern comes in the form of the
educational system of the future. Who will teach the next generation the skills of the
discipline that has been avoided?
Research Ouestion #1
Most instructors of developmental mathematics at Texas Tech University
emphasize or require attendance. According to Thomas and Higbee (2000), attendance is
an important factor in the success of students in developmental mathematics courses.
At Texas Tech University, intermediate algebra does not receive any college
credit. Waits and Demana (1988) found there was a strong relationship between
mathematics skills and college success, regardless of the major. Conversely, students
often feel that intermediate algebra will have little or no effect on their performance in
later mathematics courses (Wheland, Konet, & Butler, 2003).
Research Ouestion #2
Hoyt and Sorensen (2001) found that students needed at least 3 years of college
preparatory mathematics in high school and a B average in the courses to be successful in
college-level mathematics. According to Hoyt (1999), students often needed to repeat, in
college, the same level or a lower level of mathematics than they took in high school.
Both Hoyt (1999) and Hoyt and Sorensen (2001) studies raise a question about the level
of preparation in secondary schools and the level of commitment by the students toward
their studies while in secondary schools. An earlier study conducted by Lappan and
Phillips (1984) found that almost 70% of students enrolled in intermediate algebra at a
university had 3 to 4 years of Algebra I and higher level mathematics in high school. In
the same study, another 42% of students in elementary algebra had 2 to 3 years of college
mathematics preparatory courses in high school.
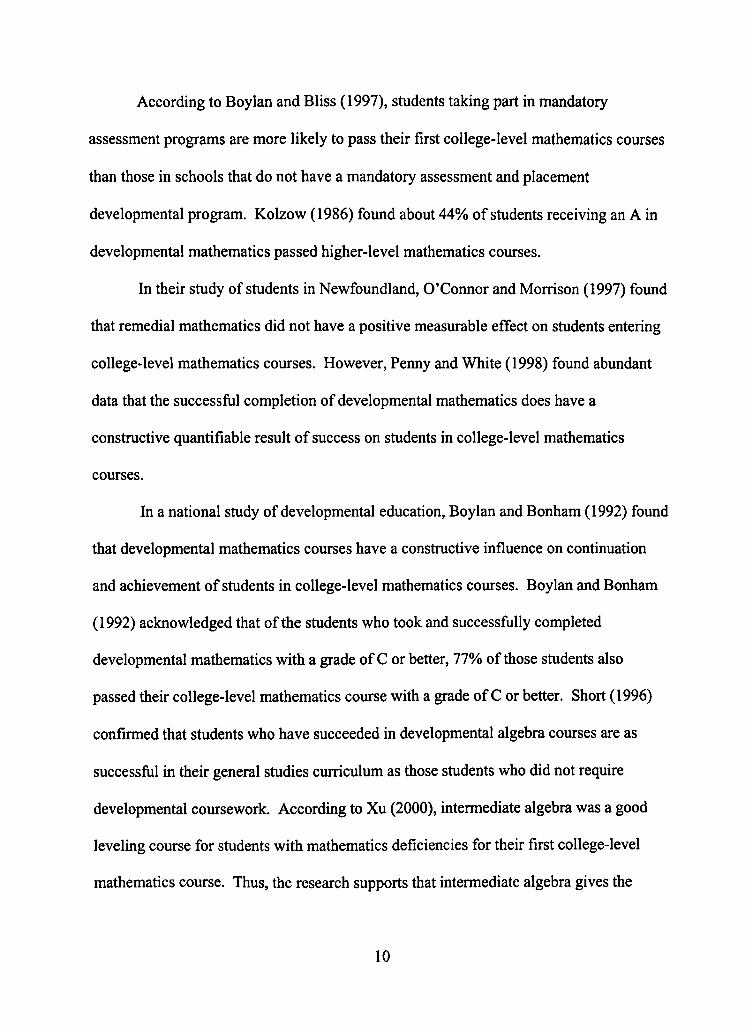
According to Boylan and Bliss (1997), students taking part in mandatory
assessment programs are more likely to pass their first college-level mathematics courses
than those in schools that do not have a mandatory assessment and placement
developmental program. Kolzow (1986) found about 44% of students receiving an A in
developmental mathematics passed higher-level mathematics courses.
In their study of students in Newfoundland, O'Connor and Morrison (1997) found
that remedial mathematics did not have a positive measurable effect on students entering
college-level mathematics coiu ses. However, Penny and White (1998) found abundant
data that the successful completion of developmental mathematics does have a
constructive quantifiable result of success on students in college-level mathematics
courses.
In a national study of developmental education, Boylan and Bonham (1992) found
that developmental mathematics courses have a constructive influence on continuation
and achievement of students in college-level mathematics courses. Boylan and Bonham
(1992) acknowledged that of the students who took and successfully completed
developmental mathematics with a grade of C or better, 77% of those students also
passed their college-level mathematics course with a grade of C or better. Short (1996)
confirmed that students who have succeeded in developmental algebra courses are as
successful in their general studies curriculum as those students who did not require
developmental coursework. According to Xu (2000), intermediate algebra was a good
leveling course for students with mathematics deficiencies for their first college-level
mathematics course. Thus, the research supports that intermediate algebra gives the
10
students in developmental mathematics courses the same opportunity to be successfiil in
their college-level mathematics courses.
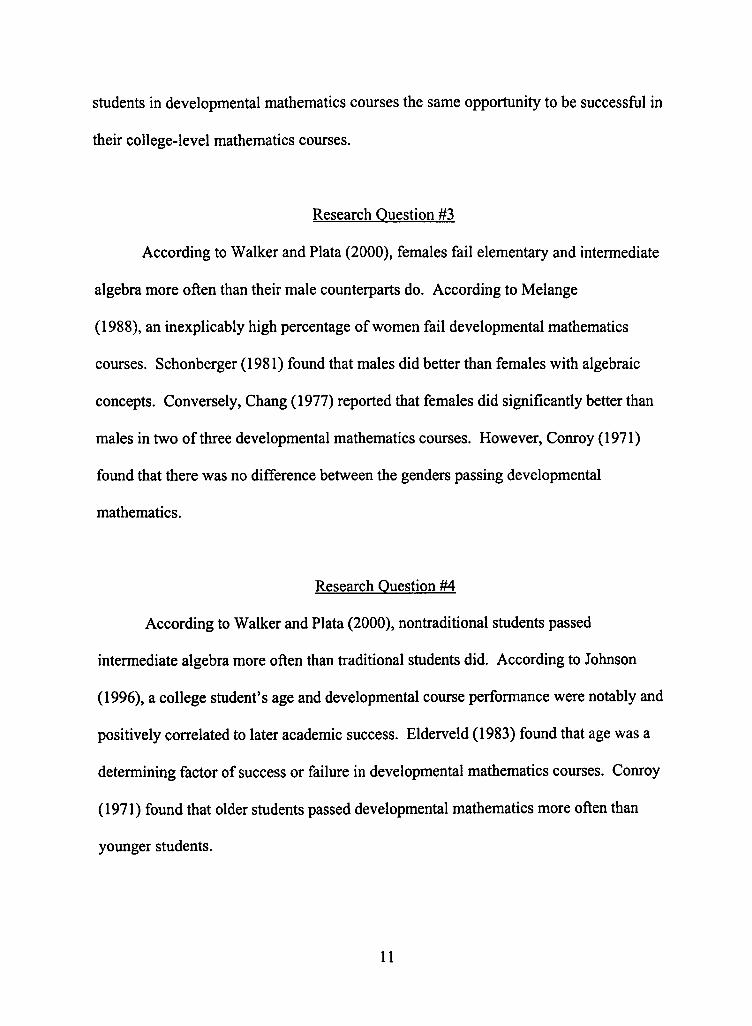
Research Question #3
According to Walker and Plata (2000), females fail elementary and intermediate
algebra more often than their male counterparts do. According to Melange
(1988), an inexplicably high percentage of women fail developmental mathematics
courses. Schonberger (1981) found that males did better than females with algebraic
concepts. Conversely, Chang (1977) reported that females did significantly better than
males in two of three developmental mathematics courses. However, Conroy (1971)
foimd that there was no difference between the genders passing developmental
mathematics.
Research Question #4
According to Walker and Plata (2000), nonti-aditional students passed
intermediate algebra more often than traditional students did. According to Johnson
(1996), a college student's age and developmental course performance were notably and
positively correlated to later academic success. Elderveld (1983) found that age was a
determining factor of success or failure in developmental mathematics courses. Conroy
(1971) found that older students passed developmental mathematics more often than
younger students.
11
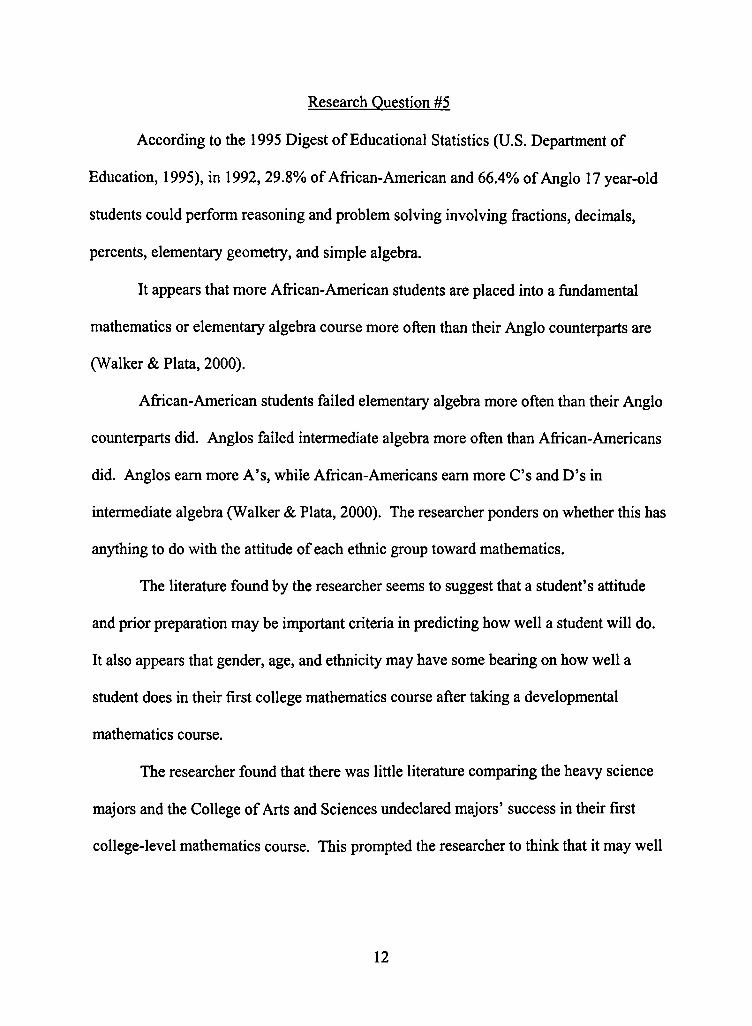
Research Ouestion #5
According to the 1995 Digest of Educational Statistics (U.S. Department of
Education, 1995), in 1992, 29.8% of African-American and 66.4% of Anglo 17 year-old
students could perform reasoning and problem solving involving fractions, decimals,
percents, elementary geometry, and simple algebra.
It appears that more African-American students are placed into a fundamental
mathematics or elementary algebra course more often than their Anglo counterparts are
(Walker & Plata, 2000).
African-American students failed elementary algebra more often than their Anglo
counterparts did. Anglos failed intermediate algebra more often than Afiican-Americans
did. Anglos earn more A's, while African-Americans earn more C's and D's in
intermediate algebra (Walker &, Plata, 2000). The researcher ponders on whether this has
anything to do with the attitude of each ethnic group toward mathematics.
The literature found by the researcher seems to suggest that a student's attitude
and prior preparation may be important criteria in predicting how well a student will do.
It also appears that gender, age, and ethnicity may have some bearing on how well a
student does in their first college mathematics course after taking a developmental
mathematics course.
The researcher found that there was little literature comparing the heavy science
majors and the College of Arts and Sciences undeclared majors' success in their first
college-level mathematics course. This prompted the researcher to think that it may well
12

be time for this type of research, especially since the nation wants to become more
competitive in the fields that are being studied.
13
CHAPTER III
METHODOLOGY
Introduction
The purpose of this study is to examine whether major, gender, age, and ethnicity
determine whether a student who has taken a developmental mathematics course
succeeds in their first college-level mathematics course. We will be examining the
variables through descriptive statistics, test of independent proportions, and Fisher's
exact test.
Research Design
Microsoft® Excel is the program in which the data set was prepared. The
researcher combined the four data sets into one worksheet. Afterwards, the researcher
made one entry for each student, which contained the last developmental mathematics
course and the first college-level mathematics course. The researcher then deleted all
majors that were not classified as a heavy science major or as an Arts and Sciences
undeclared major. All remaining records that did not have MATH 0302 or SPCM 0320
as the last developmental mathematics course were deleted. This brought the total
number of records in the database to 428 for the Arts and Sciences undeclared and heavy
science majors.
Microsoft® Access is the program that queried the data set. The students' records
were queried according to the variables listed. The files that contain missing data for any
14
student were deleted. The results from the queries where put into the tables in Chapter
IV.
Data Analysis
Subjects for this study were acquired from the Office of Institutional Research at
Texas Tech University. A data set was received from the Texas Tech Office of
Institutional Research that contains data for developmental mathematics students taking
courses at Texas Tech University from fall 2001 to spring 2002. The variables sex,
ethnicity, age, college, major, last developmental mathematics course taken, grade for the
last developmental mathematics course, semester the last developmental mathematics
course was taken, first college-level mathematics course taken, grade for the first college-
level mathematics course, and semester the first college-level mathematics course was
taken are some of the variables in the data set. All of the variables listed before will be
used in the analysis of the database. Student privacy was preserved since those directly
involved in this study did not receive the names or social security numbers of the
students. All tables and queries include all four semesters.
In this particular database received from the Office of Institutional Research,
students that took their developmental mathematics courses with South Plains College
receive a PR. Texas Tech University did not know if the student had made an A, B, or C
at the time the database was requested. The researcher had Microsoft® Access query out
the necessary variables for each question.
15
The researcher used the test of independent proportions and Fisher's exact test to
determine if there was a sufficient difference between the independent groups being
studied. The researcher used a level of significance of 0.05, thus the critical value of the
test statistic is ± 1.96. The researcher also computed a 95% confidence interval where
possible. The general formulas can be found in Appendix A.
16
CHAPTER IV
FINDINGS
Introduction
The purpose of this section is to find how each group performed in their
developmental mathematics course, how each of the groups performed in their first
college-level mathematics course, how each gender of each group performed in their first
college-level mathematics course, how the age of students in each group performed in
their first college-level mathematics course, and how minorities and non-minorities in
each group performed in their first college-level mathematics course on Texas Tech
University campus. This chapter will discuss the results found through the methodology.
As mentioned earlier in this study, the researcher noticed a growing trend in the
number of heavy science major students taking developmental mathematics courses.
Please refer to Table 4.1. These numbers yield 130 heavy science majors and 298 Arts
and Sciences undeclared majors in developmental mathematics courses.
17

Table 4.1: Number of Heavy Science Majors in Developmental Mathematics by Semesters
Semester
Spring
2001
2002
2003
Summer I
2001
2002
2003
Summer II
2001
2002
2003
Fall
2001
2002
2003
Total
Number of HS Majors
2
14
28
0
0
0
0
0
2
10
10
64
130
Number of ASUD Majors
73
5
48
7
3
3
4
2
4
16
100
33
298
18
CHAPTER V
RESULTS
From the results of the queries, described in Chapter III, tables were created for
the research questions.
Developmental Mathematics Course
Missing Data
Out of 428 developmental mathematics students for Fall and Spring semesters of
2001 and 2002, cases were omitted that contained the following:
• no developmental mathematics grade since they were taking developmental
mathematics the semester this thesis was written, 43 cases;
• no developmental math grade, 6 cases.
As seen in Table 4.2, in the 379 cases remaining, 189 (0.724) Arts and Sciences
undeclared were successful in their last developmental mathematics course. Also as seen
in Table 4.2,96 (0.814) heavy science majors were successful in their last developmental
mathematics course. The researcher considered Cs, Ds, Fs, and withdrawals as students
who were unsuccessful. The researcher tested the hypothesis that the proportion of Arts
and Sciences undeclared majors' success in intermediate algebra is equal to the
proportion of heavy science majors' success in intermediate algebra. Conducting a test of
independent proportions the researcher found the difference between the proportions has
a p-value of 0.0562 at a level of significance of 0.05 and reserved judgment and makes no
19
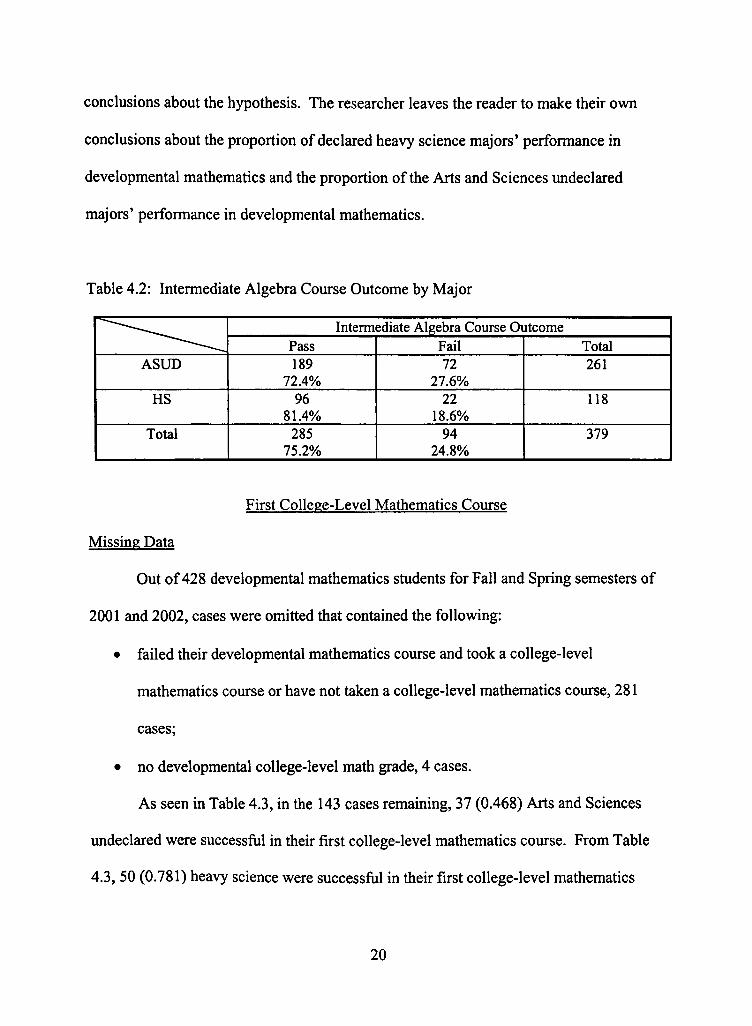
conclusions about the hypothesis. The researcher leaves the reader to make their own
conclusions about the proportion of declared heavy science majors' performance in
developmental mathematics and the proportion of the Arts and Sciences undeclared
majors' performance in developmental mathematics.
Table 4.2: Intermediate Algebra Course Outcome by Major
~ ~ ^ ~ ~ ^ - . _ ^
ASUD
HS
Total
Intermediate Algebra Course Outcome Pass 189
72.4% 96
81.4% 285
75.2%
Fail 72
27.6% 22
18.6% 94
24.8%
Total 261
118
379
First College-Level Mathematics Course
Missing Data
Out of 428 developmental mathematics students for Fall and Spring semesters of
2001 and 2002, cases were omitted that contained the following:
• failed their developmental mathematics course and took a college-level
mathematics course or have not taken a college-level mathematics course, 281
cases;
• no developmental college-level math grade, 4 cases.
As seen in Table 4.3, in the 143 cases remaining, 37 (0.468) Arts and Sciences
undeclared were successful in their first college-level mathematics coiu-se. From Table
4.3, 50 (0.781) heavy science were successful in their first college-level mathematics
20
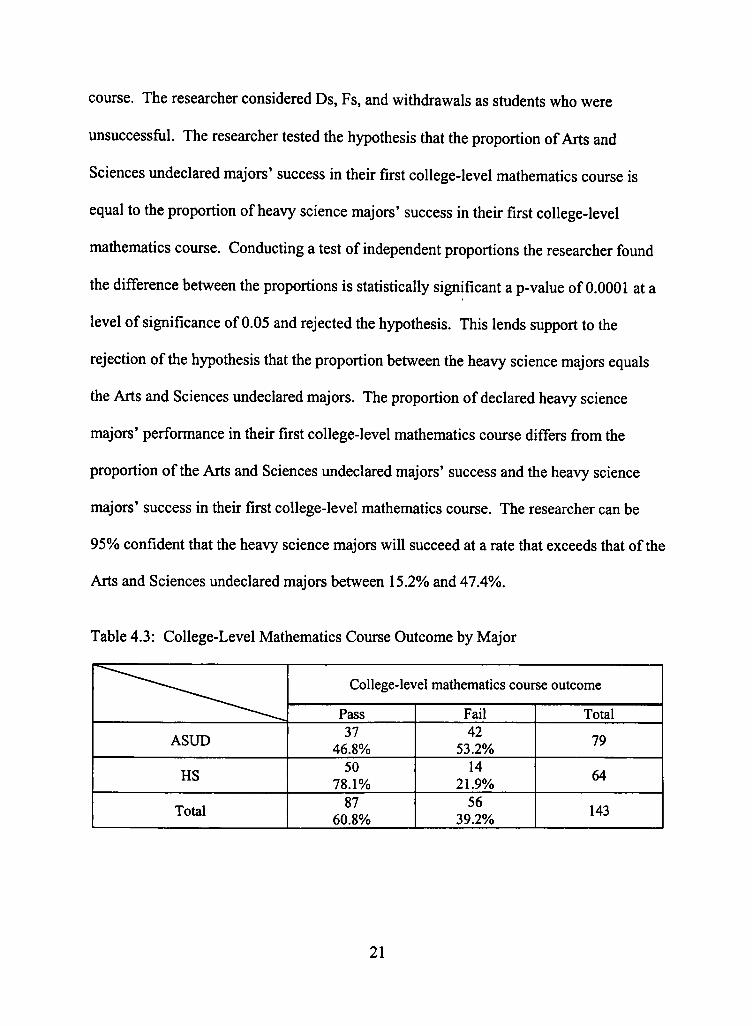
course. The researcher considered Ds, Fs, and withdrawals as students who were
unsuccessfiil. The researcher tested the hypothesis that the proportion of Arts and
Sciences undeclared majors' success in their first college-level mathematics course is
equal to the proportion of heavy science majors' success in their first college-level
mathematics course. Conducting a test of independent proportions the researcher found
the difference between the proportions is statistically significant a p-value of 0.0001 at a
level of significance of 0.05 and rejected the hypothesis. This lends support to the
rejection of the hypothesis that the proportion between the heavy science majors equals
the Arts and Sciences undeclared majors. The proportion of declared heavy science
majors' performance in their first college-level mathematics course differs from the
proportion of the Arts and Sciences undeclared majors' success and the heavy science
majors' success in their first college-level mathematics course. The researcher can be
95% confident that the heavy science majors will succeed at a rate that exceeds that of the
Arts and Sciences undeclared majors between 15.2% and 47.4%.
Table 4.3: College-Level Mathematics Course Outcome by Major
^ ^ ^ ^ ^ ^
ASUD
HS
Total
College-level mathematics course outcome
Pass 37
46.8% 50
78.1% 87
60.8%
Fail 42
53.2% 14
21.9% 56
39.2%
Total
79
64
143
21
The researcher found that unlike in Kolzow (1986) where 44% of students that
made an A in developmental mathematics passed their first college-level mathematics
course, of this set of students that made an A in developmental mathematics 72.5% of
them passed their first college-level mathematics course. Please refer to Table B.2 in
Appendix B.
According to Table 4.3, it would seem a larger percentage of the heavy science
majors pass their first college-level mathematics courses. Please refer to Table A.2 in
Appendix A to see the breakdown of the students that passed intermediate algebra and
how they did in their college-level mathematics course.
Gender
Missing Data
Out of 428 developmental mathematics students for Fall and Spring semesters of
2001 and 2002, cases were omitted that contained the following:
• failed their developmental mathematics course and took a college-level
mathematics course or have not taken a college-level mathematics course, 281
cases;
• no developmental college-level math grade, 4 cases.
As seen in Table 4.4, in the 143 cases remaining, 15 (0.366) Arts and Sciences
undeclared males were successful in their first college-level mathematics course. From
Table 4.4, 30 (0.750) heavy science males were successful in their first college-level
mathematics course. The researcher considered Ds, Fs, and withdrawals as students who
22
were unsuccessful. The researcher tested the hypothesis that the proportion of Arts and
Sciences undeclared males' success in their first college-level mathematics course is
equal to the proportion of heavy science males' success in their first college-level
mathematics course. Conducting Fisher's exact test the researcher found the difference
between the proportions is statistically significant a p-value of 0.0001 at a level of
significance of 0.05 and rejected the hypothesis. This lends support to the rejection of the
hypothesis that the proportion between the heavy science majors equals the Arts and
Sciences undeclared majors. The proportion of declared heavy science majors'
performance in their fist college-level mathematics course differs from the proportion of
the Arts and Sciences undeclared majors' performance in their first college-level
mathematics course. Since the samples are so small, the researcher cannot compute the
confidence interval.
23
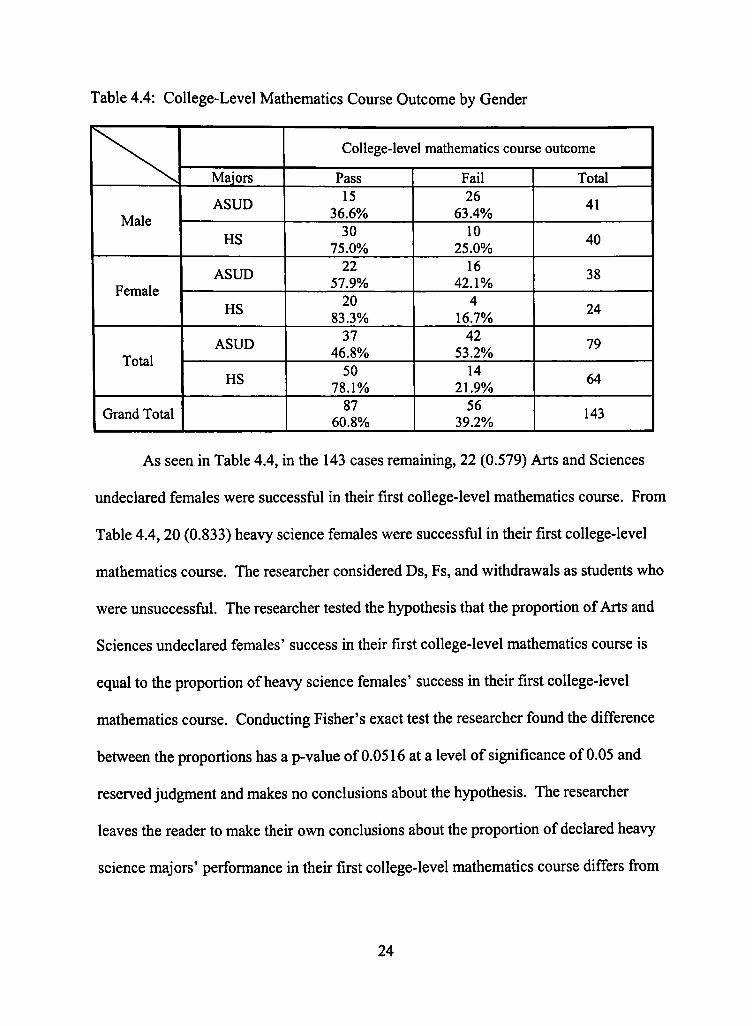
Table 4.4: College-Level Mathematics Course Outcome by Gender
Male
Female
Total
Grand Total
Majors
ASUD
HS
ASUD
HS
ASUD
HS
College-level mathematics course outcome
Pass 15
36.6% 30
75.0% 22
57.9% 20
83.3% 37
46.8% 50
78.1% 87
60.8%
Fail 26
63.4% 10
25.0% 16
42.1% 4
16.7% 42
53.2% 14
21.9% 56
39.2%
Total
41
40
38
24
79
64
143
As seen in Table 4.4, in the 143 cases remaining, 22 (0.579) Arts and Sciences
undeclared females were successful in their first college-level mathematics course. From
Table 4.4,20 (0.833) heavy science females were successful in their first college-level
mathematics course. The researcher considered Ds, Fs, and withdrawals as students who
were unsuccessful. The researcher tested the hypothesis that the proportion of Arts and
Sciences undeclared females' success in their first college-level mathematics course is
equal to the proportion of heavy science females' success in their first college-level
mathematics course. Conducting Fisher's exact test the researcher found the difference
between the proportions has a p-value of 0.0516 at a level of significance of 0.05 and
reserved judgment and makes no conclusions about the hypothesis. The researcher
leaves the reader to make their own conclusions about the proportion of declared heavy
science majors' performance in their first college-level mathematics course differs from
24
the proportion of the Arts and Sciences undeclared majors' performance in their first
college-level mathematics course.
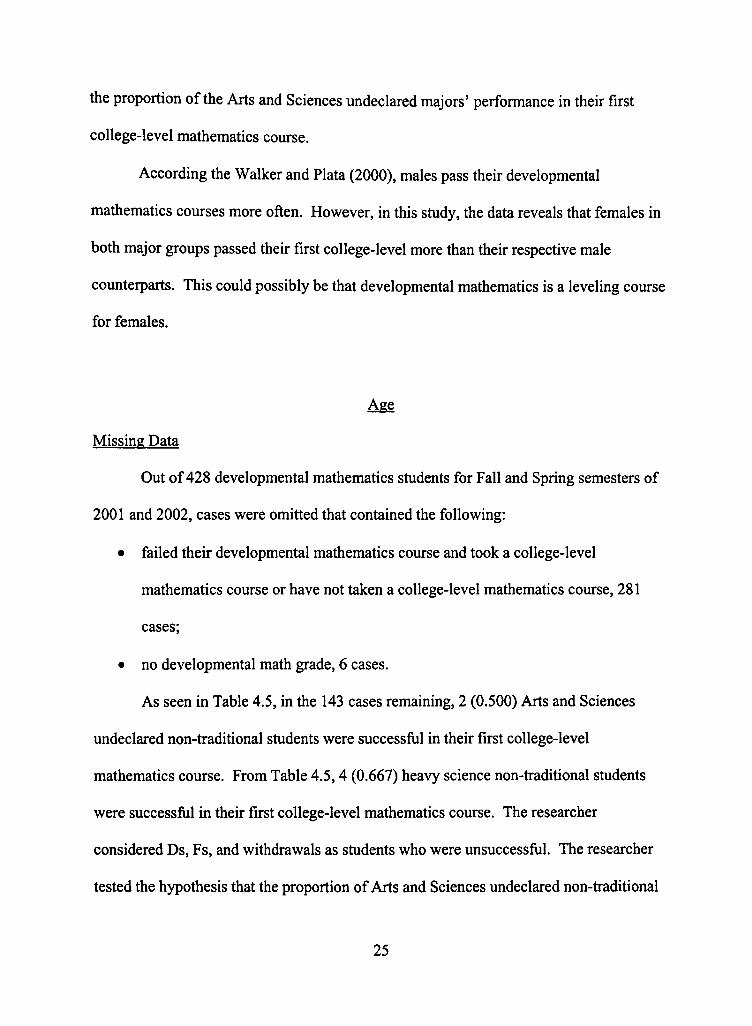
According the Walker and Plata (2000), males pass their developmental
mathematics courses more often. However, in this study, the data reveals that females in
both major groups passed their first college-level more than their respective male
counterparts. This could possibly be that developmental mathematics is a leveling course
for females.
Age
Missing Data
Out of 428 developmental mathematics students for Fall and Spring semesters of
2001 and 2002, cases were omitted that contained the following:
• failed their developmental mathematics course and took a college-level
mathematics course or have not taken a college-level mathematics course, 281
cases;
• no developmental math grade, 6 cases.
As seen in Table 4.5, in the 143 cases remaining, 2 (0.500) Arts and Sciences
undeclared non-traditional students were successful in their first college-level
mathematics course. From Table 4.5,4 (0.667) heavy science non-traditional students
were successful in their first college-level mathematics course. The researcher
considered Ds, Fs, and withdrawals as students who were unsuccessful. The researcher
tested the hypothesis that the proportion of Arts and Sciences undeclared non-traditional
25
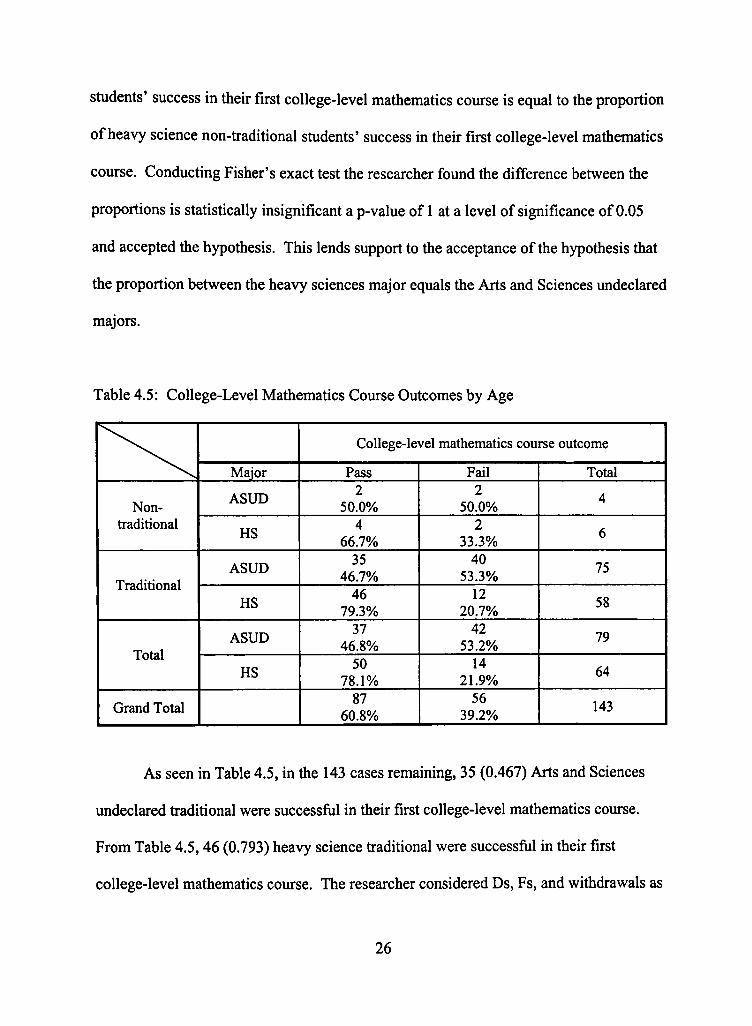
students' success in their first college-level mathematics course is equal to the proportion
of heavy science non-traditional students' success in their first college-level mathematics
course. Conducting Fisher's exact test the researcher found the difference between the
proportions is statistically insignificant a p-value of 1 at a level of significance of 0.05
and accepted the hypothesis. This lends support to the acceptance of the hypothesis that
the proportion between the heavy sciences major equals the Arts and Sciences undeclared
majors.
Table 4.5: College-Level Mathematics Course Outcomes by Age
Non-traditional
Traditional
Total
Grand Total
Major
ASUD
HS
ASUD
HS
ASUD
HS
College-level mathematics course outcome
Pass 2
50.0% 4
66.7% 35
46.7% 46
79.3% 37
46.8% 50
78.1% 87
60.8%
Fail 2
50.0% 2
33.3% 40
53.3% 12
20.7% 42
53.2% 14
21.9% 56
39.2%
Total
4
6
75
58
79
64
143
As seen in Table 4.5, in the 143 cases remaining, 35 (0.467) Arts and Sciences
undeclared traditional were successful in their first college-level mathematics course.
From Table 4.5,46 (0.793) heavy science traditional were successful in their first
college-level mathematics course. The researcher considered Ds, Fs, and withdrawals as
26
students who were unsuccessful. The researcher tested the hypothesis that the proportion
of Arts and Science undeclared ti-aditional students' success in their first college-level
mathematics course is equal to the proportion of heavy science ti-aditional students'
success in their first college-level mathematics course. Conducting Fisher's exact test the
researcher found the difference between the proportions is statistically significant a p-
value of 0.0002 at a level of significance of 0.05 and rejected the hypothesis. This lends
support to the rejection of the hypothesis that the proportion between the heavy science
majors equals the Arts and Sciences undeclared majors. The proportion of declared
heavy science majors' performance in their first college-level mathematics course differs
from the proportion of the Arts and Sciences undeclared majors' performance in their
first college-level mathematics course. Since the samples are so small, the researcher
cannot compute the confidence interval.
According to Walker and Plata (2000), non-traditional students pass
developmental more often than traditional students do. Non-traditional students having
more obligations than their younger counterparts can explain this, as they have to be
more focused and studious. This study showed that Arts and Sciences undeclared non-
traditional students passed their first college-level mathematics course more often than
Arts and Science imdeclared traditional students. However, heavy science non-ft-aditional
students passed their first college-level mathematics course less often than heavy science
ti-aditional students did. This may be explained by developmental mathematics course
makes the heavy science traditional students more focused.
27
Ethnicity
Missing Data
Out of 428 developmental mathematics stiidents for Fall and Spring semesters of
2001 and 2002, cases were omitted that contained the following:
• failed their developmental mathematics course and took a college-level
mathematics course or have not taken a college-level mathematics course, 281
cases;
• no developmental college-level math grade, 4 cases;
• no identified gender, 1 case.
As seen in Table 4.6, in the 142 cases remaining, 30 (0.484) Arts and Sciences
undeclared non-minority students were successful in their first college-level mathematics
course. From Table 4.6,30 (0.750) heavy science non-minority students were successful
in their first college-level mathematics course. The researcher considered Ds, Fs, and
withdrawals as students who were unsuccessful. The researcher considered all ethnic
groups that were not considered minorities by the Federal Government to be non-
minority. The researcher tested the hypothesis that the proportion of Arts and Sciences
undeclared non-minority students' success in their first college-level mathematics course
is equal to the proportion of heavy science non-minority students' success in their first
college-level mathematics course. Conducting Fisher's exact test the researcher foimd
the difference between the proportions is statistically significant a p-value of 0.0129 at a
level of significance of 0.05 and rejected the hypothesis. This lends support to the
rejection of the hypothesis that the proportion between the heavy sciences major equals
28
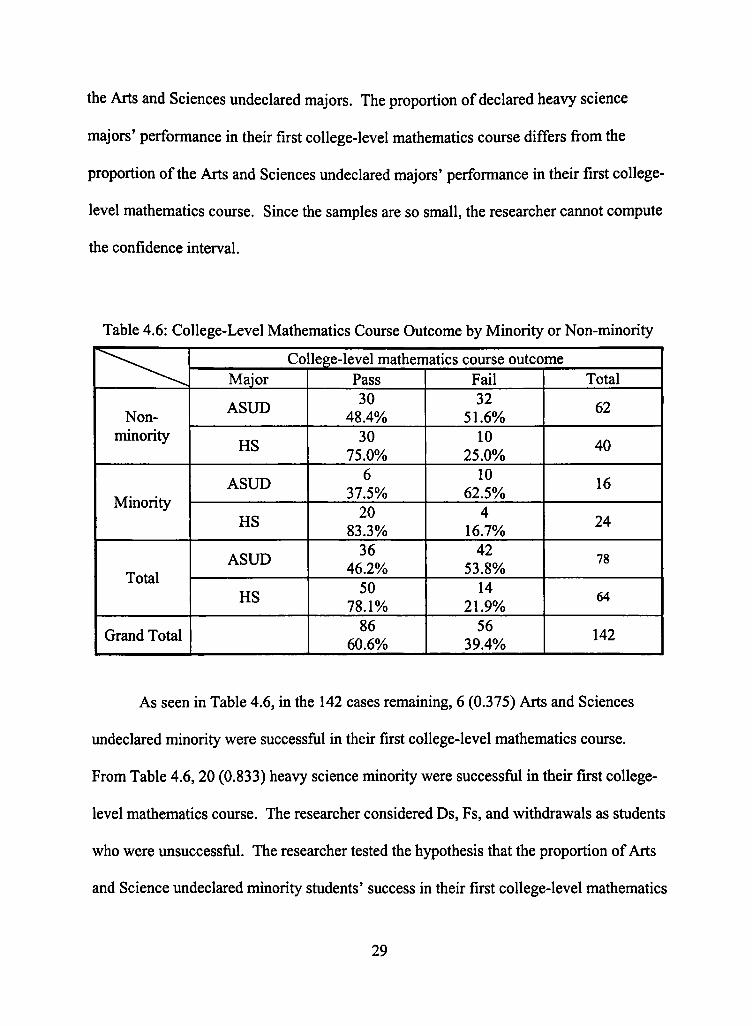
the Arts and Sciences undeclared majors. The proportion of declared heavy science
majors' performance in their first college-level mathematics course differs from the
proportion of the Arts and Sciences undeclared majors' performance in their first college-
level mathematics course. Since the samples are so small, the researcher cannot compute
the confidence interval.
Table 4.6: College-Level Mathematics Course Outcome by Minority or Non-minority
^ ^ - ^
Non-minority
Minority
Total
Grand Total
Co Major
ASUD
HS
ASUD
HS
ASUD
HS
lege-level mathematics course outcome Pass 30
48.4% 30
75.0% 6
37.5% 20
83.3% 36
46.2% 50
78.1% 86
60.6%
Fail 32
51.6% 10
25.0% 10
62.5% 4
16.7% 42
53.8% 14
21.9% 56
39.4%
Total
62
40
16
24
78
64
142
As seen in Table 4.6, in the 142 cases remaining, 6 (0.375) Arts and Sciences
undeclared minority were successful in their first college-level mathematics course.
From Table 4.6, 20 (0.833) heavy science minority were successful in their first college-
level mathematics coiu-se. The researcher considered Ds, Fs, and withdrawals as students
who were unsuccessful. The researcher tested the hypothesis that the proportion of Arts
and Science undeclared minority students' success in their first college-level mathematics
29
course is equal to the proportion of heavy science minority students' success in their first
college-level mathematics course. Conducting Fisher's exact test the researcher found
the difference between the proportions is statistically significant a p-value of 0.0059 at a
level of significance of 0.05 and rejected the hypothesis. This lends support to the
rejection of the hypothesis that the proportion between the heavy science majors equals
the Arts and Sciences undeclared majors. The proportion of declared heavy science
majors' performance in their first college-level mathematics course differs from the
proportion of the Arts and Sciences undeclared majors' performance in their first college-
level mathematics course. Since the samples are so small, the researcher cannot compute
the confidence interval.
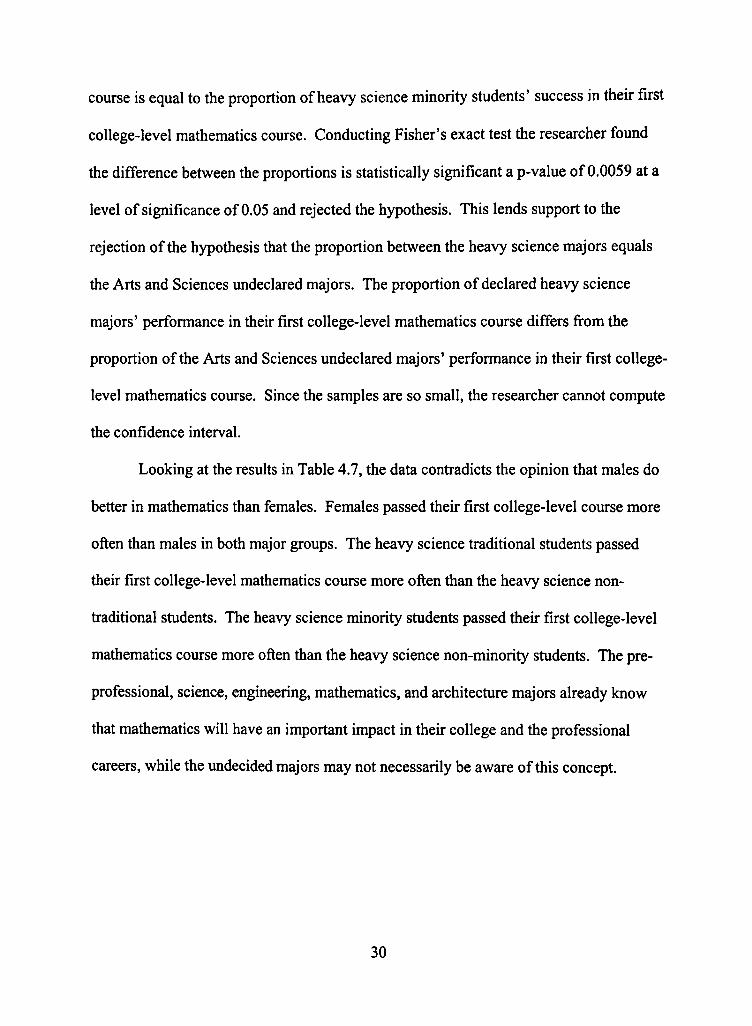
Looking at the results in Table 4.7, the data contiadicts the opinion that males do
better in mathematics than females. Females passed their first college-level course more
often than males in both major groups. The heavy science traditional students passed
their first college-level mathematics course more often than the heavy science non-
traditional students. The heavy science minority students passed their first college-level
mathematics course more often than the heavy science non-minority students. The pre-
professional, science, engineering, mathematics, and architecture majors already know
that mathematics will have an important impact in their college and the professional
careers, while the undecided majors may not necessarily be aware of this concept.
30
Table 4.7: Summary of Results of Success
^ ~ - - - _ _
Developmental Mathematics Course First College-Level Mathematics Course Gender
Females
Males Age
Non-traditional Traditional
Ethnicity Non-minority
Minority
HS
81.4%
78.1%
83.3%
75.0%
66.7% 79.3%
75.0% 83.3%
ASUD
72.4%
46.8%
57.9%
36.6%
50.0% 46.7%
48.4% 37.5%
Statistically Significant Marginally
(left to reader)
Highly
Marginally (left to reader)
Highly
Not Highly
Significant Highly
p-value
0.0562
0.0001
0.0516
0.0001
1 0.0002
0.0129 0.0059
Summary
The purpose of this study is to determine if heavy science (HS) majors perform
better than Arts and Sciences undeclared (ASUD) majors in their first college level
mathematics course at Texas Tech University. Factors considered were gender, age, and
ethnicity. This study has shown there is a difference between heavy science majors and
Arts and Science undeclared majors in all areas except non-traditional students. There
needs to be continued study on the majors to find out which major does better and why.
Future research could involve a study to determine how Arts and Sciences undeclared
majors compare to other majors, if developmental mathematics courses makes students
more focused, if a student having a declared major does better in developmental
mathematics courses and college-level mathematics courses, if the heavy science major
31

students' and Arts and Sciences undeclared major students' attitudes are different toward
mathematics, and if this has any effect on their performance.
32
REFERENCES LIST
Berenson, S., Carter, G., & Morwood, K. (1992). The at-risk stiident in college developmental algebra. School Science and Mathematics, 92(2), 55-58.
Boylan, H. R., Bliss, L. B. (1997). Program components and their relationship to stiidents performance. Journal of Developmental Education. 20(3), 2-7.
Boylan, H. & Bonham, B. (1992). The impact of developmental education programs. Review of Research in Developmental Education, 9(5), 1-4.
Chang, P. T. (1977). Persistence in Small Group Instiaiction in Developmental Mathematics Courses on Relationships among Academic Performance, Sex Difference, Attitude, and Persistence. Paper Presented at the Annual Meeting of the American Mathematical Association of Two Year Colleges (Atianta, Georgia, October 1997). (ED162862).
Conroy, D. E. (1971). The Effects of Age and Sex Upon a Comparison Between Achievement Gains in Programmed Instruction and Conventional Instruction in Remedial Algebra I at Northem Virginia Community College. Ed.D. Dissertation, American University. (ED078640).
Elderveld, P. J. (1983). Factors related to success and failure in developmental mathematics in the community college. Community/Junior College Quarterly of Research and Practice, 7(2), 161-74. (EJ278390).
Hoyt, I.E. (1999). Level of math preparation in high school and its impact on remedial placement at an urban state college. College & University, 74,37-43.
Hoyt, J.E. & Sorensen, C. T. (2001). High school preparation, placement testing, and college remediation. Journal of Developmental Education, 25(2), 26-33.
Johnson, L. F. (1996). Developmental performance as a predictor of academic success in entry-level college mathematics. Community College Journal of Research and Practice, 20(A), 333-344.
Kolzow, L.C. (1986). Stiidy of Academic Progress by stiidents at Harper after Enrolling in Developmental Courses. (ERIC Document Reproduction Service No. ED 265 914).
Kulik, J.A. & Kulik, C.-L.C. (1991) Developmental instruction: An analysis of the ' research. (Research Report #1). Boone, NC: National Center for Developmental
Education and the Exxon Education Foundation.
33
Lappan, G. & Phillips, E. (1984). The mathematical preparation of entering college freshmen. NASSP Bulletin, (55(468), 79-84.
"Melange: Superconducting Supercollider and a Final Theory in Physics; Self-Segregation of Black Stiidents; The Mathematics Pipeline." Chronicle of Higher Education, 6 May 1988.
O'Connor, W. & Morrison.T. (1997). Do remedial mathematics programmes improve students' mathematical ability? Studies in Educational Evaluation, 23(3), 201-207.
Penny, M. & White, W. (1998). Developmental mathematics stiidents' performance: Impact of faculty and student characteristics. Journal of Developmental Education, 22(2), 2-12.
Schonberger, A. K. (1981). Gender Differences in Solving Mathematics Problems among Two-Year College Students in a Developmental Algebra Class and Related Factors. Paper presented at the Midyear Meeting of the American Education Research Association Special Interest Group on Women in Education (Washington, DC, October 17,1981). (ED214602).
Short, C. (1996). Stiong success in developmental algebra: Implications for retention and success in general studies. Research in Developmental Education, 13(4), 1-4.
Texas Tech University. (2003). Texas Tech University Catalog 2003-04. Lubbock, TX: Official Publication.
Texas Tech University, Lubbock, Mathematics Placement Exam (2003, June) Retiieved September 10,2003. from Texas Tech University Mathematics Web page. http://www.math.ttu.edu/placement/.
Texas Tech University, Lubbock, TASP (2004) Retiieved April 1,2004. from Tevas Tech University Office of Texas Academic Skills Program.
Thomas, P. & Higbee, J. (2000). The relationship between involvement and success in developmental algebra. Journal of College Reading and Learning, 30(2), 222-232.
United States Department of Education. (1995). Digest of Education Statistics 1995 (NCES 95-029). Washington, DC: National Center for Education Statistics, U.S. Government Printing Office.
34
Van Etten, Karl. (1997) The Comparative Undergraduate Performance and Persistence of Students who do not enroll in Developmental Classes at Colorado State System Community Colleges. Dissertation Abstiacts International, 58(4A), 1187.
Walker, W. & Plata, M. (2000). Race/gender/age differences in college mathematics students. Journal of Developmental Educational, 23(3), 24-30.
Waits, B.K. & Demana, F. (1988). Relationship between mathematics skills of entering students and their success in college. The School Counselor, 35(4), 307-310.
Wheland, E, Konet, R. M., & Butler (2003). Perceived inhibitors to mathematics success. Journal of Developmental Education, 26(3), 18-20, 22, 24,26-7.
Xu, Bei. (2000). Intermediate algebra as a predictor of success in college-level math courses. University of Cential Oklahoma.
35
APPENDIX A
GENERAL STATISTICS FORMULAS
36
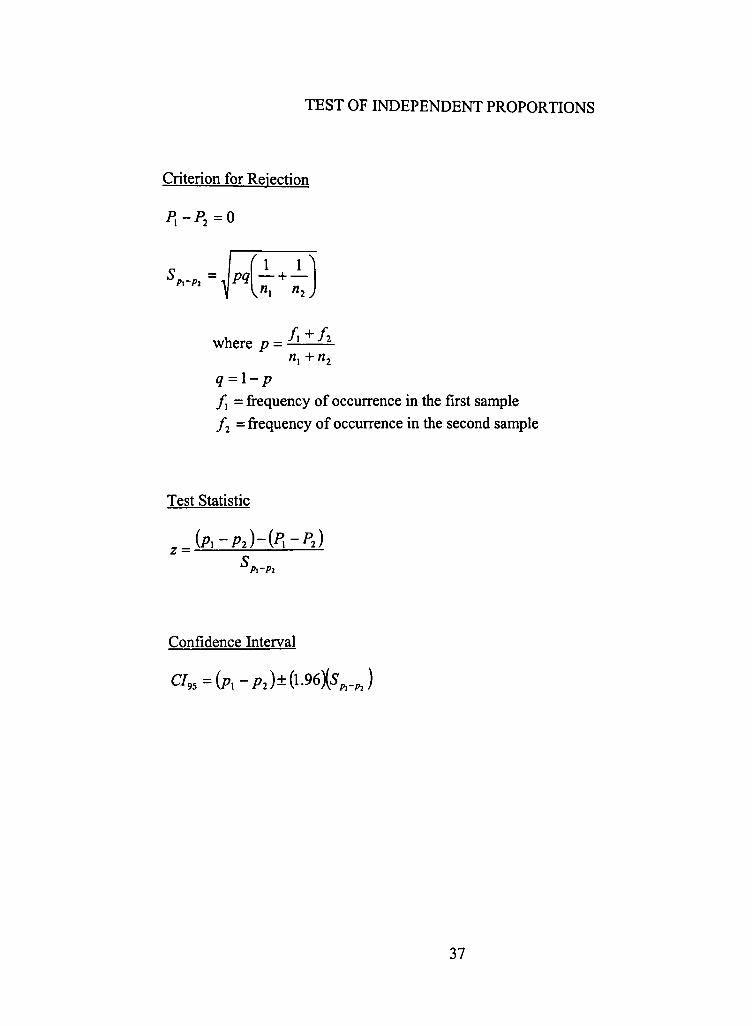
TEST OF INDEPENDENT PROPORTIONS
Criterion for Rejection
/ > - P , = 0
1 P » P . - P : = 1 ^ ^ - + —
/J, « 2 y
where p =
q = \-p f = frequency of occurrence in the first sample / j = frequency of occurrence in the second sample
Test Statistic
Confidence Interval
C / , 5 = U - P 2 ) ± ( 1 - 9 6 X V P J
37
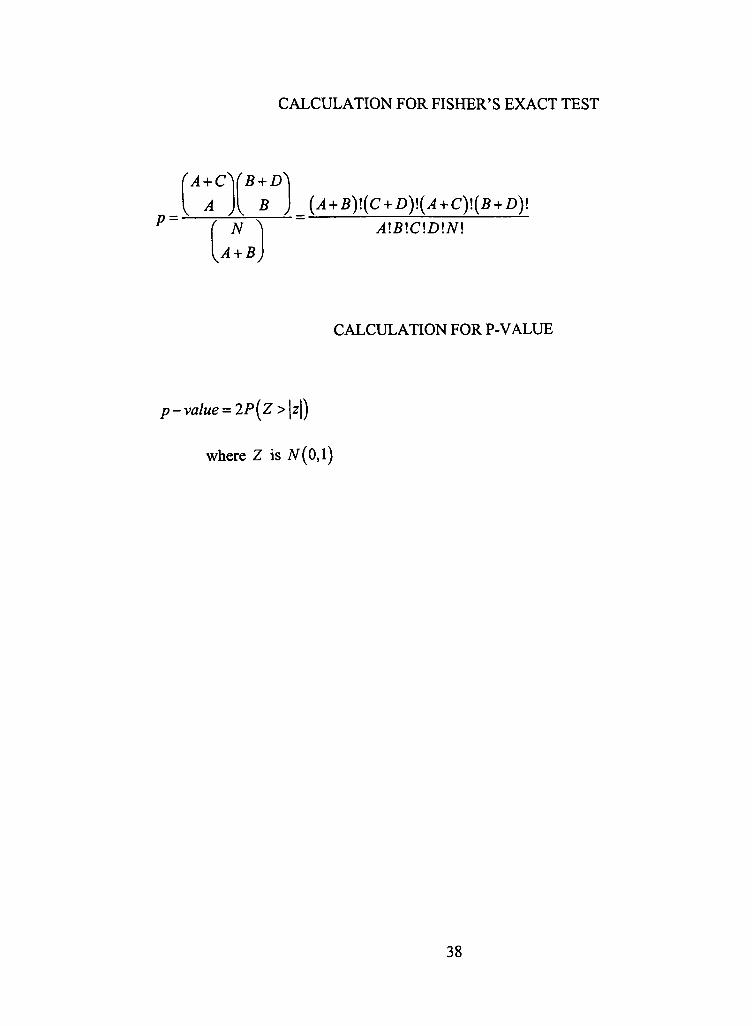
CALCULATION FOR FISHER'S EXACT TEST
P = -
A+CYB+D^
A + B
(A + B)\(C + D)\{A + C)\{B + D)\
A\B\C\D\N\
CALCULATION FOR P-VALUE
p - value = 2P{Z>\z\)
where Z is N{0,\)
38
APPENDIX B
TABLES OF INTERMEDIATE ALGEBRA GRADES, COLLEGE-LEVEL
MATHEMATICS COURSES, GENDERS, AGES, ETHNICITY
39
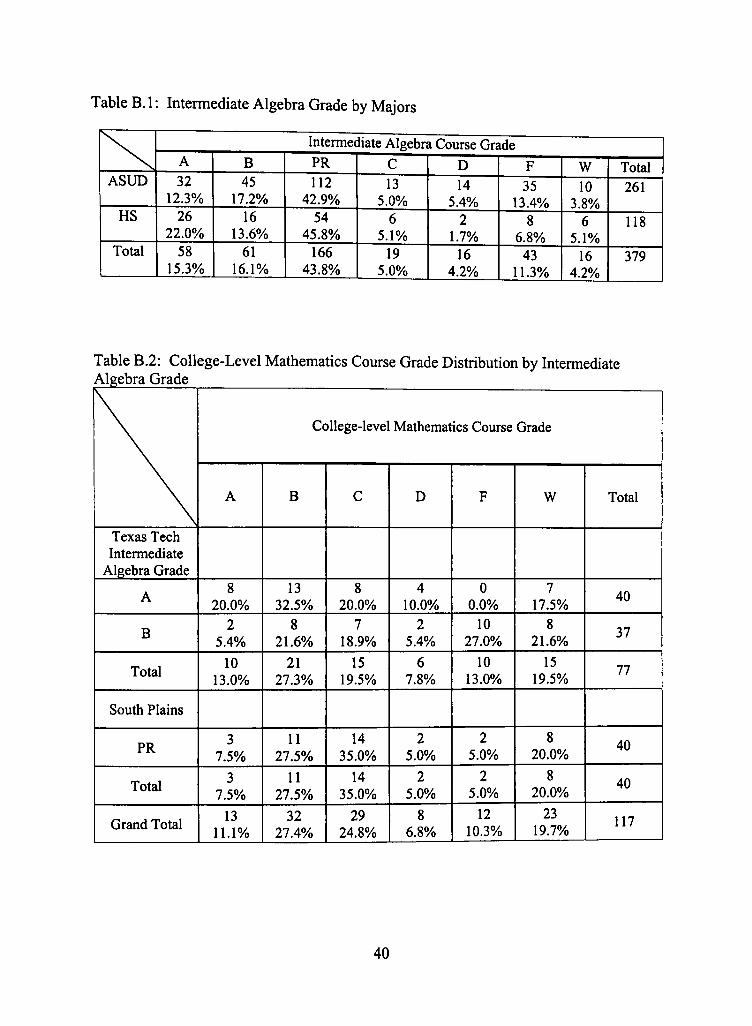
Table B. 1: Intermediate Algebra Grade by Majors
\
ASUD
HS
Total
A 32
12.3% 26
22.0% 58
15.3%
B 45
17.2% 16
13.6% 61
16.1%
Intermediate Algebra Course Grade PR 112
42.9% 54
45.8% 166
43.8%
C 13
5.0% 6
5.1% 19
5.0%
D 14
5.4% 2
1.7% 16
4.2%
F 35
13.4% 8
6.8% 43
11.3%
W 10
3.8% 6
5.1% 16
4.2%
Total 261
118
379
Table B.2: College-Level Mathematics Course Grade Distiibution by Intermediate Algebra Grade
Texas Tech Intermediate
Algebra Grade
A
B
Total
South Plains
PR
Total
Grand Total
College-level Mathematics Course Grade
A
8 20.0%
2 5.4%
10 13.0%
3 7.5%
3 7.5%
13 11.1%
B
13 32.5%
8 21.6%
21 27.3%
11 27.5%
11 27.5%
32 27.4%
C
8 20.0%
7 18.9%
15 19.5%
14 35.0%
14 35.0%
29 24.8%
D
4 10.0%
2 5.4%
6 7.8%
2 5.0%
2 5.0%
8 6.8%
F
0 0.0%
10 27.0%
10 13.0%
2 5.0%
2 5.0%
12 10.3%
W
7 17.5%
8 21.6%
15 19.5%
8 20.0%
8 20.0%
23 19.7%
Total
40
37
77
40
40
117
40
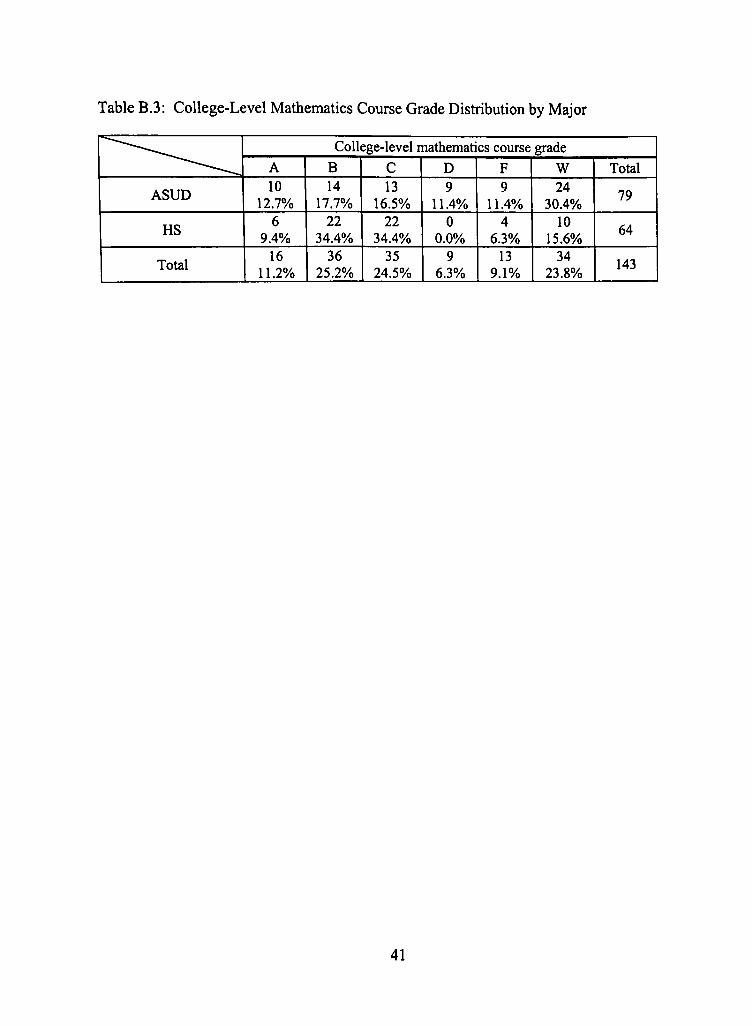
Table B.3: College-Level Matiiematics Course Grade Distribution by Major
^ ^ ^ ^ - ~ , , ^
ASUD
HS
Total
College-level mathematics course grade A 10
12.7% 6
9.4% 16
11.2%
B 14
17.7% 22
34.4% 36
25.2%
C 13
16.5% 22
34.4% 35
24.5%
D 9
11.4% 0
0.0% 9
6.3%
F 9
11.4% 4
6.3% 13
9.1%
W 24
30.4% 10
15.6% 34
23.8%
Total
79
64
143
41
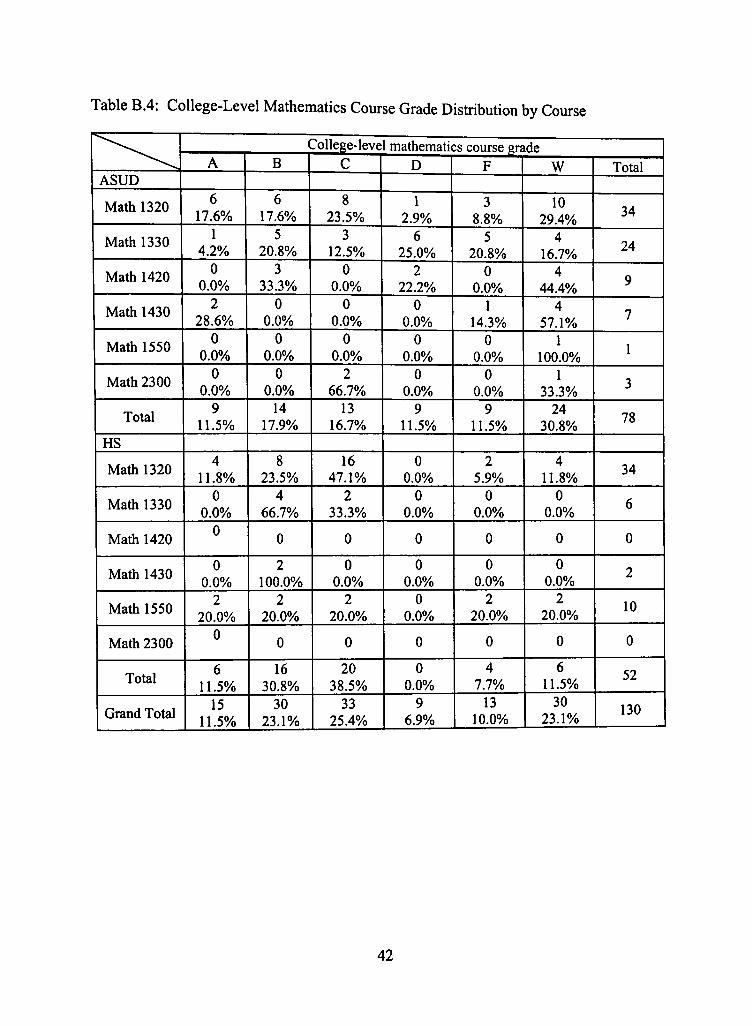
Table B.4: College-Level Mathematics Course Grade Distiibution by Course
^ - ^ ^
ASUD
Math 1320
Math 1330
Math 1420
Math 1430
Math 1550
Math 2300
Total
HS
Math 1320
Math 1330
Math 1420
Math 1430
Math 1550
Math 2300
Total
Grand Total
A
6 17.6%
1 4.2%
0 0.0%
2 28.6%
0 0.0%
0 0.0%
9 11.5%
4 11.8%
0 0.0%
0
0 0.0%
2 20.0%
0
6 11.5%
15 11.5%
College-level mathematics course grade B
6 17.6%
5 20.8%
3 33.3%
0 0.0%
0 0.0%
0 0.0%
14 17.9%
8 23.5%
4 66.7%
0
2 100.0%
2 20.0%
0
16 30.8%
30 23.1%
C
8 23.5%
3 12.5%
0 0.0%
0 0.0%
0 0.0%
2 66.7%
13 16.7%
16 47.1%
2 33.3%
0
0 0.0%
2 20.0%
0
20 38.5%
33 25.4%
D
1 2.9%
6 25.0%
2 22.2%
0 0.0%
0 0.0%
0 0.0%
9 11.5%
0 0.0%
0 0.0%
0
0 0.0%
0 0.0%
0
0 0.0%
9 6.9%
F
3 8.8%
5 20.8%
0 0.0%
1 14.3%
0 0.0%
0 0.0%
9 11.5%
2 5.9%
0 0.0%
0
0 0.0%
2 20.0%
0
4 7.7%
13 10.0%
W
10 29.4%
4 16.7%
4 44.4%
4 57.1%
1 100.0%
1 33.3%
24 30.8%
4 11.8%
0 0.0%
0
0 0.0%
2 20.0%
0
6 11.5%
30 23.1%
Total
34
24
9
7
1
3
78
34
6
0
2
10
0
52
130
42
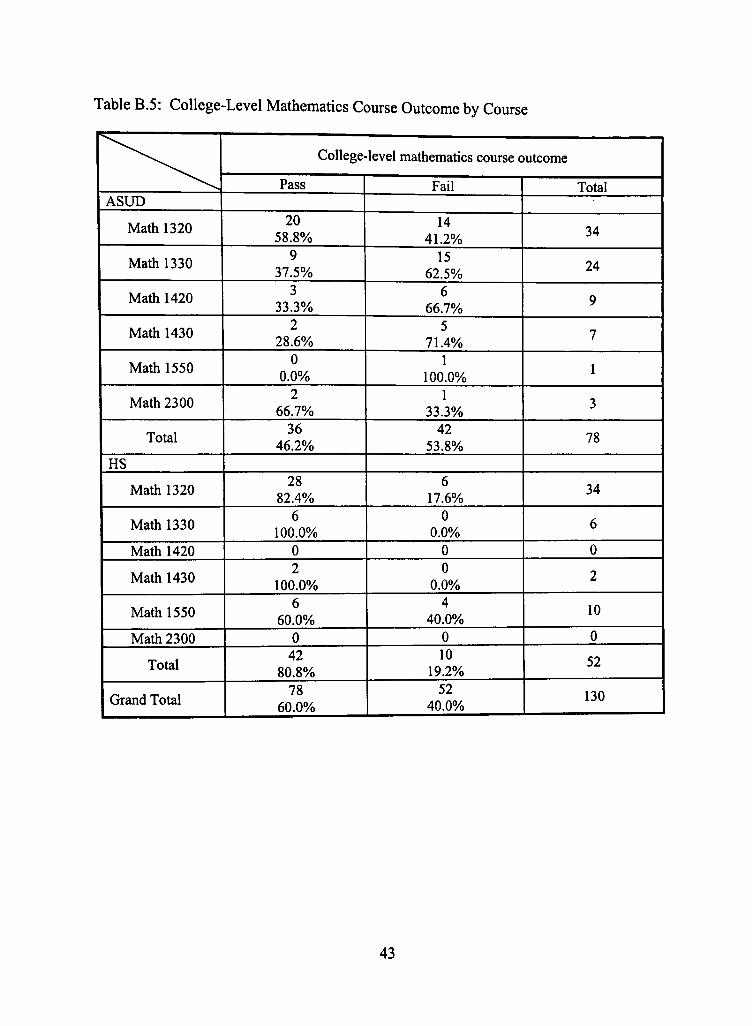
Table B.5: College-Level Mathematics Course Outcome by Course
" ^ ^ - ^ ^
ASUD
Math 1320
Math 1330
Math 1420
Math 1430
Math 1550
Math 2300
Total
HS
Math 1320
Math 1330
Math 1420
Math 1430
Math 1550
Math 2300
Total
Grand Total
College-level mathematics course outcome
Pass
20 58.8%
9 37.5%
3 33.3%
2 28.6%
0 0.0%
2 66.7%
36 46.2%
28 82.4%
6 100.0%
0 2
100.0% 6
60.0% 0
42 80.8%
78 60.0%
Fail
14 41.2%
15 62.5%
6 66.7%
5 71.4%
1 100.0%
1 33.3%
42 53.8%
6 17.6%
0 0.0%
0 0
0.0% 4
40.0% 0 10
19.2% 52
40.0%
Total
34
24
9
7
1
3
78
34
6
0
2
10
0
52
130
43
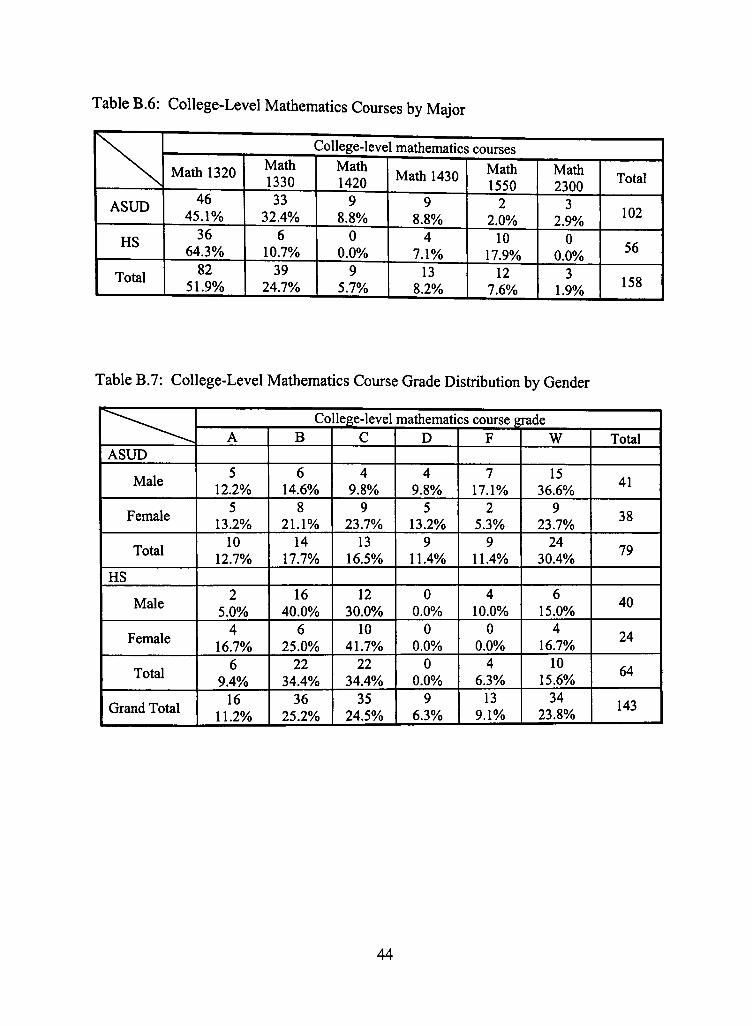
Table B.6: College-Level Matiiematics Courses by Major
ASUD
HS
Total
College-level mathematics courses
Math 1320
46 45.1%
36 64.3%
82 51.9%
Math 1330 33
32.4% 6
10.7% 39
24.7%
Math 1420
9 8.8%
0 0.0%
9 5.7%
Math 1430
9 8.8%
4 7.1%
13 8.2%
Math 1550
2 2.0%
10 17.9%
12 7.6%
Math 2300
3 2.9%
0 0.0%
3 1.9%
Total
102
56
158
Table B.7: College-Level Mathematics Course Grade Distiibution by Gender
^ " ^ ^ ^
ASUD
Male
Female
Total
HS
Male
Female
Total
Grand Total
Co A
5 12.2%
5 13.2%
10 12.7%
2 5.0%
4 16.7%
6 9.4%
16 11.2%
B
6 14.6%
8 21.1%
14 17.7%
16 40.0%
6 25.0%
22 34.4%
36 25.2%
lege-level mathematics course grade C
4 9.8%
9 23.7%
13 16.5%
12 30.0%
10 41.7%
22 34.4%
35 24.5%
D
4 9.8%
5 13.2%
9 11.4%
0 0.0%
0 0.0%
0 0.0%
9 6.3%
F
7 17.1%
2 5.3%
9 11.4%
4 10.0%
0 0.0%
4 6.3%
13 9.1%
W
15 36.6%
9 23.7%
24 30.4%
6 15.0%
4 16.7%
10 15.6%
34 23.8%
Total
41
38
79
40
24
64
143
44
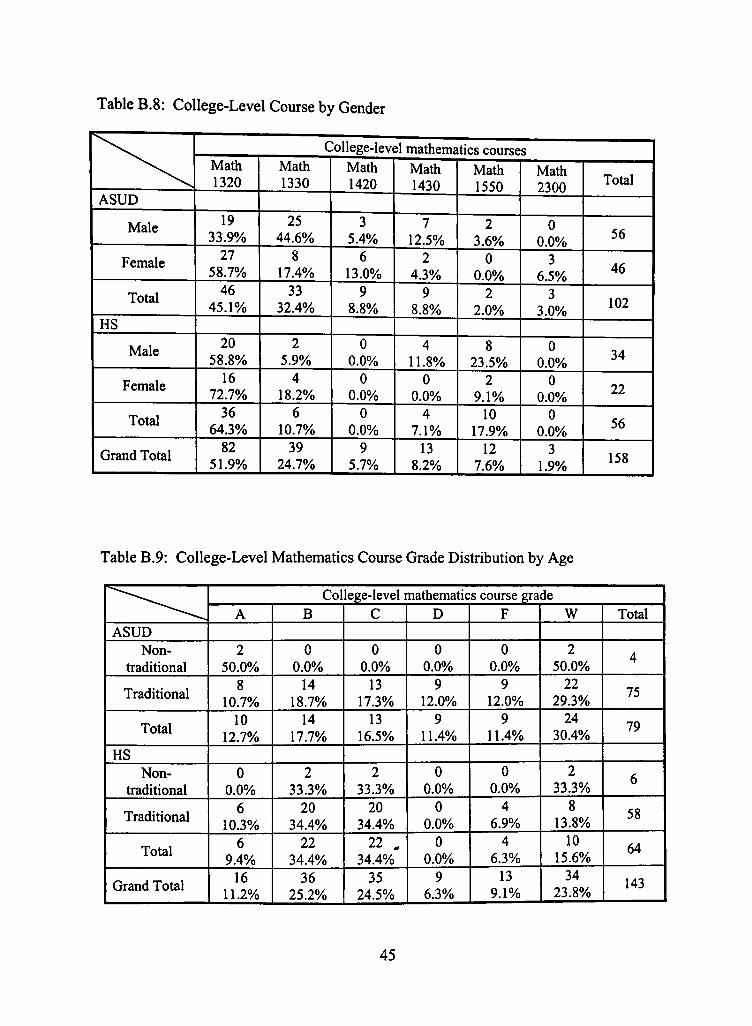
Table B.8: College-Level Course by Gender
ASUD
Male
Female
Total
HS
Male
Female
Total
Grand Total
College-level mathematics courses Math 1320
19 33.9%
27 58.7%
46 45.1%
20 58.8%
16 72.7%
36 64.3%
82 51.9%
Math 1330
25 44.6%
8 17.4%
33 32.4%
2 5.9%
4 18.2%
6 10.7%
39 24.7%
Math 1420
3 5.4%
6 13.0%
9 8.8%
0 0.0%
0 0.0%
0 0.0%
9 5.7%
Math 1430
7 12.5%
2 4.3%
9 8.8%
4 11.8%
0 0.0%
4 7.1%
13 8.2%
Math 1550
2 3.6%
0 0.0%
2 2.0%
8 23.5%
2 9.1%
10 17.9%
12 7.6%
Math 2300
0 0.0%
3 6.5%
3 3.0%
0 0.0%
0 0.0%
0 0.0%
3 1.9%
Total
56
46
102
34
22
56
158
Table B.9: College-Level Mathematics Course Grade Distribution by Age
^ ^ ^ - ^ ^
ASUD Non-
traditional
Traditional
Total
HS Non-
traditional
Traditional
Total
Grand Total
Col A
2 50.0%
8 10.7%
10 12.7%
0 0.0%
6 10.3%
6 9.4%
16 11.2%
B
0 0.0%
14 18.7%
14 17.7%
2 33.3%
20 34.4%
22 34.4%
36 25.2%
ege-level mathematics course grade C
0 0.0%
13 17.3%
13 16.5%
2 33.3%
20 34.4%
22 . 34.4%
35 24.5%
D
0 0.0%
9 12.0%
9 11.4%
0 0.0%
0 0.0%
0 0.0%
9 6.3%
F
0 0.0%
9 12.0%
9 11.4%
0 0.0%
4 6.9%
4 6.3%
13 9.1%
W
2 50.0%
22 29.3%
24 30.4%
2 33.3%
8 13.8%
10 15.6%
34 23.8%
Total
4
75
79
6
58
64
143
45
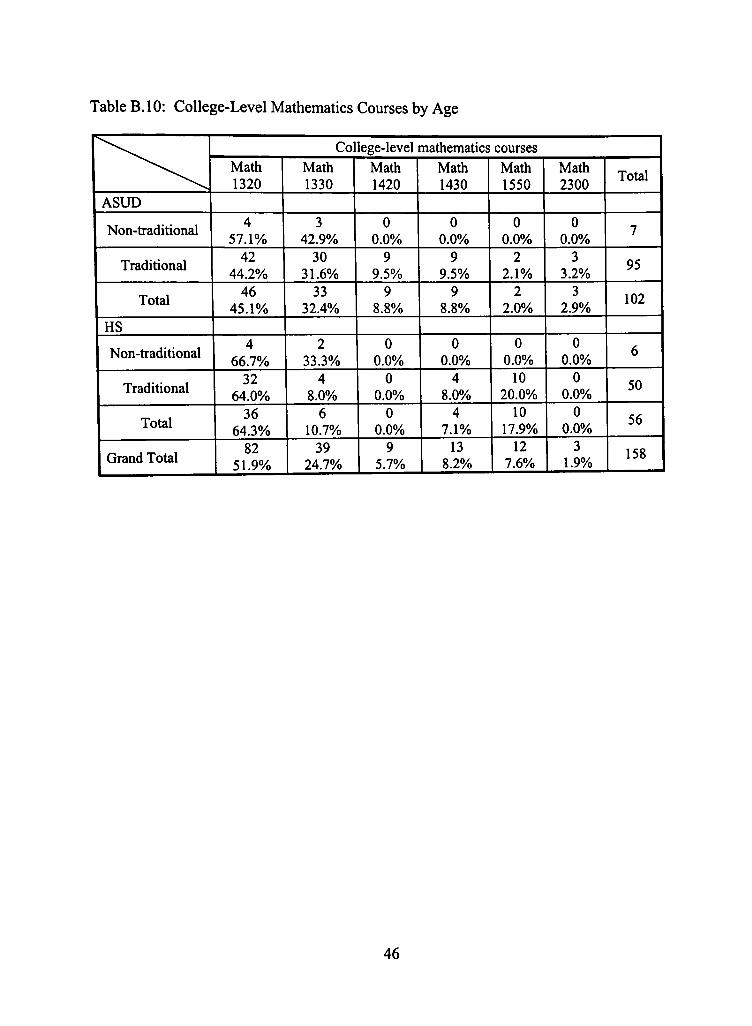
Table B.IO: College-Level Mathematics Courses by Age
^ " ^ - ^
ASUD
Non-traditional
Traditional
Total
HS
Non-traditional
Traditional
Total
Grand Total
Co Math 1320
4 57.1%
42 44.2%
46 45.1%
4 66.7%
32 64.0%
36 64.3%
82 51.9%
Math 1330
3 42.9%
30 31.6%
33 32.4%
2 33.3%
4 8.0%
6 10.7%
39 1 24.7%
lege-level mathematics courses Math 1420
0 0.0%
9 9.5%
9 8.8%
0 0.0%
0 0.0%
0 0.0%
9 5.7%
Math 1430
0 0.0%
9 9.5%
9 8.8%
0 0.0%
4 8.0%
4 7.1%
13 8.2%
Math 1550
0 0.0%
2 2.1%
2 2.0%
0 0.0%
10 20.0%
10 17.9%
12 7.6%
Math 2300
0 0.0%
3 3.2%
3 2.9%
0 0.0%
0 0.0%
0 0.0%
3 1.9%
Total
7
95
102
6
50
56
158
46
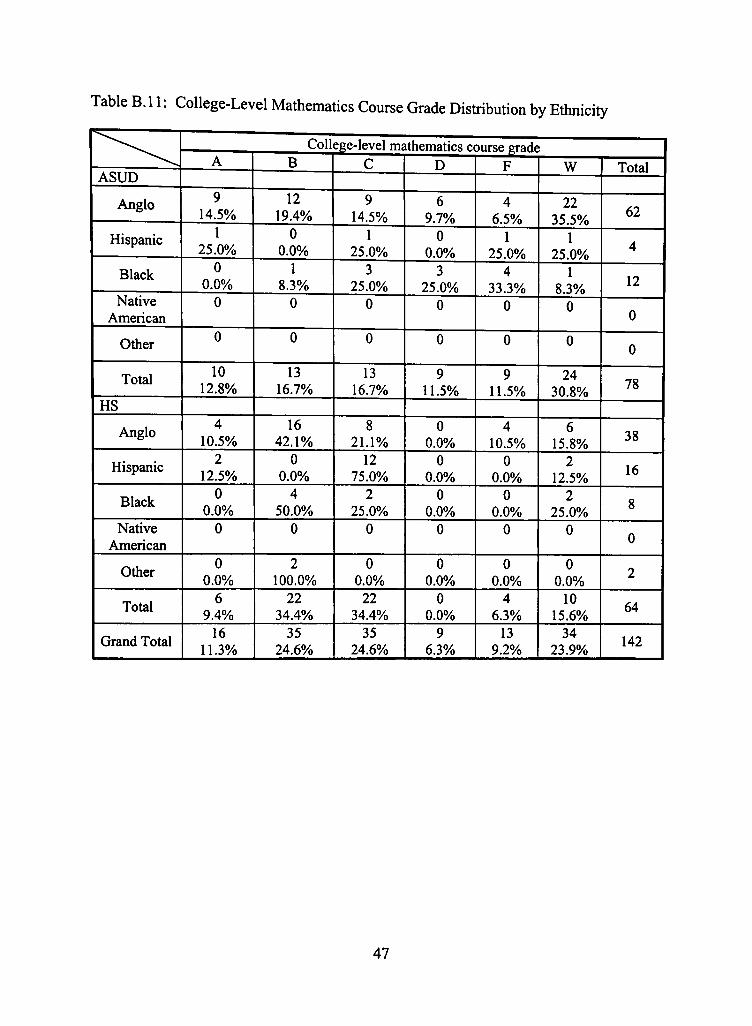
Table B. 11: College-Level Mathematics Course Grade Distiibution by Ethnicity
^ ^ - \
ASUD
Anglo
Hispanic
Black
Native American
Other
Total
HS
Anglo
Hispanic
Black
Native American
Other
Total
Grand Total
A
9 14.5%
1 25.0%
0 0.0%
0
0
10 12.8%
4 10.5%
2 12.5%
0 0.0%
0
0 0.0%
6 9.4%
16 11.3%
College-level mathematics course erade B
12 19.4%
0 0.0%
1 8.3%
0
0
13 16.7%
16 42.1%
0 0.0%
4 50.0%
0
2 100.0%
22 34.4%
35 24.6%
C
9 14.5%
1 25.0%
3 25.0%
0
0
13 16.7%
8 21.1%
12 75.0%
2 25.0%
0
0 0.0%
22 34.4%
35 24.6%
D
6 9.7%
0 0.0%
3 25.0%
0
0
9 11.5%
0 0.0%
0 0.0%
0 0.0%
0
0 0.0%
0 0.0%
9 6.3%
F
4 6.5%
1 25.0%
4 33.3%
0
0
9 11.5%
4 10.5%
0 0.0%
0 0.0%
0
0 0.0%
4 6.3%
13 9.2%
W
22 35.5%
1 25.0%
1 8.3%
0
0
24 30.8%
6 15.8%
2 12.5%
2 25.0%
0
0 0.0%
10 15.6%
34 23.9%
Total
62
4
12
0
0
78
38
16
8
0
2
64
142
47
Table B.12: College-Level Mathematics Courses by Ethnicity
^ - \
ASUD
Anglo
Hispanic
Black
Native American
Other
Total
HS
Anglo
Hispanic
Black
Native American
Other
Total
Grand Total
College-level mathematics courses Math 1320
31 40.8%
5 55.6%
8 53.3%
1 100.0%
0
45 44.6%
20 62.5%
12 85.7%
4 50.0%
0
0 0.0%
36 64.3%
81 51.6%
Math 1330
27 35.5%
1 11.1%
5 33.3%
0 0.0%
0
33 32.7%
4 12.5%
0 0.0%
2 25.0%
0
0 0.0%
6 10.7%
39 24.8%
Math 1420
9 11.8%
0 0.0%
0 0.0%
0 0.0%
0
9 8.9%
0 0.0%
0 0.0%
0 0.0%
0
0 0.0%
0 0.0%
9 5.7%
Math 1430
7 9.2%
2 22.2%
0 0.0%
0 0.0%
0
9 8.9%
2 6.3%
2 14.3%
0 0.0%
0
0 0.0%
4 7.1%
13 1 8.3%
Math 1550
1 1.3%
1 11.1%
0 0.0%
0 0.0%
0
2 2.0%
6 18.8%
0 0.0%
2 25.0%
0
2 100.0%
10 17.9%
12 7.6%
Math 2300
1 1.3%
0 0.0%
2 13.3%
0 0.0%
0
3 3.0%
0 0.0%
0 0.0%
0 0.0%
0
0 0.0%
0 0.0%
3 1.9%
Total
76
9
15
1
0
101
32
14
8
0
2
56
157
48
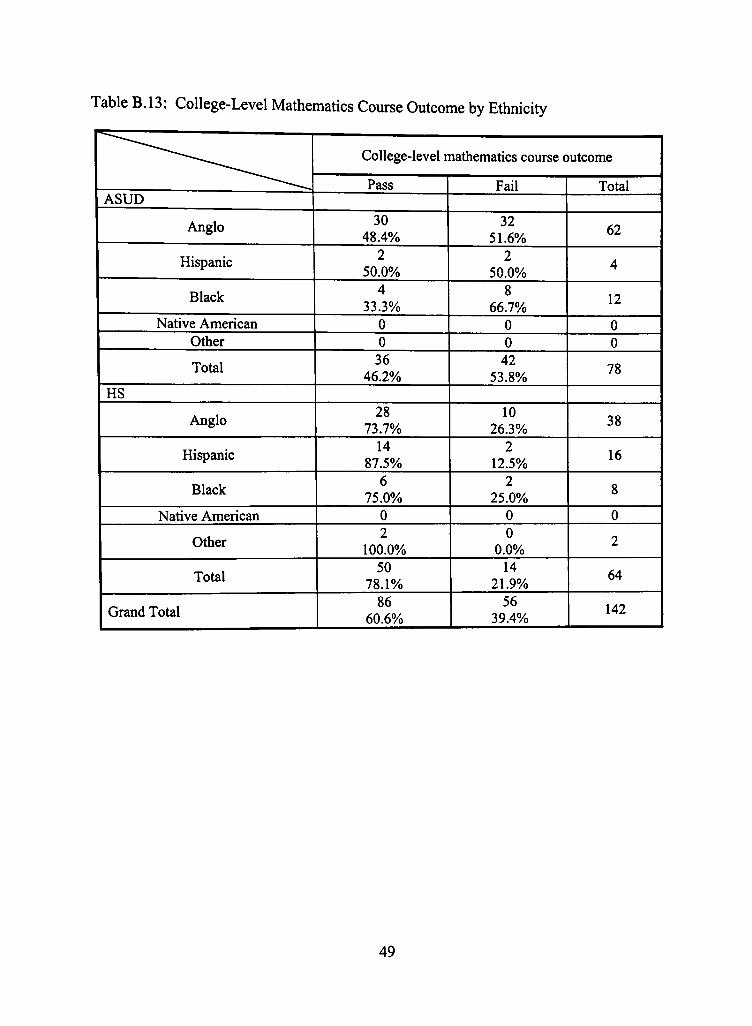
Table B.13: College-Level Mathematics Course Outcome by Etimicity
ASUD
Anglo
Hispanic
Black
Native American Other
Total
HS
Anglo
Hispanic
Black
Native American
Other
Total
Grand Total
College-level mathematics course outcome
Pass
30 48.4%
2 50.0%
4 33.3%
0 0 36
46.2%
28 73.7%
14 87.5%
6 75.0%
0 2
100.0% 50
78.1% 86
60.6%
Fail
32 51.6%
2 50.0%
8 66.7%
0 0
42 53.8%
10 26.3%
2 12.5%
2 25.0%
0 0
0.0% 14
21.9% 56
39.4%
Total
62
4
12
0 0
78
38
16
8
0
2
64
142
49
PERMISSION TO COPY
In presenting this thesis in partial fiilfilhnent of the requirements for a master's
degree at Texas Tech University or Texas Tech University Health Sciences Center, I
agree that the Library and my major department shall make it freely available for
research purposes. Permission to copy this thesis for scholarly purposes may be
granted by the Director of the Library or my major professor. It is understood that any
copying or publication of this thesis for financial gain shall not be allowed without my
further written permission and that any user may be liable for copyright infringement.
Agree (Permission is granted.)
Student Signature Date
Disagree (Permission is not granted.)
Student Signatiire Date

![Award Number: W81XWH- &KDUDFWHUL]DWLRQ RI … · developmental alterations are the major contributors to early onset of epilepsy ... Developmental Delay of ... This Program Project](https://img.pdfslide.net/doc/110x75/5b7b636f7f8b9a483c8e097a/award-number-w81xwh-kdudfwhuldwlrq-ri-developmental-alterations-are-the.jpg)