Embed Size (px)
Citation preview
!
!
December 8, 2014 To the Committee on Awards for Innovation in Higher Education: I am writing to support the California Acceleration Project’s application for an Innovation Award. This statewide faculty-led effort is playing a critical role in addressing the low completion rates among community college students placed into remediation. I serve as Executive Director of the statewide professional development network 3CSN, which is funded by the California Community Colleges’ Chancellor’s Office, and CAP has been one of our primary initiatives since 2011. We are incredibly proud of all that we’ve accomplished over the last four years and look forward to continuing this partnership in the future. Through the 3CSN-CAP partnership, faculty and administrators from all 112 community colleges have participated in outreach and workshops about the need to transform remediation. We have also provided sustained professional development to 47 colleges to offer new accelerated English and math pathways for underprepared students. An RP Group evaluation of 16 colleges working with CAP found “large and robust” increases in student completion of transferable gateway courses, with gains across all demographic groups and placement levels. In effective accelerated English pathways, students’ odds of completing a college-level course were 2.3 times higher than in traditional remediation. In math, accelerated students’ odds of completing a transfer-level course were 4.5 times higher. A follow-up analysis found that the achievement gap for African-American students was eliminated in CAP accelerated math pathways. Further, an analysis by the National Center for Inquiry and Improvement showed that the accelerated math pathways offered in CAP enable colleges to lower their remediation costs and reallocate existing resources toward college-level offerings, while providing substantial savings to students through expedited completion. The Innovation Award would enable us to expand our support to California community colleges. We would use the funds to help colleges scale up their accelerated pathways and consider additional high-leverage reforms for increasing equity and completion among incoming students. Sincerely,
Deborah L. Harrington Executive Director 3CSN: the California Community Colleges’ Success Network Dean for Student Success Los Angeles Community College District !
OFFICE OF THE PRESIDENT !3300 College Drive, San Bruno, CA 94066 TELEPHONE 650-738-4100 WEBSITE www.SkylineCollege.edu
December 12, 2014
Committee on Awards for Innovation in Higher Education California Department of Finance Education Systems Unit—Innovation Awards 915 L Street - 7th Floor Sacramento, CA 95814
Dear Committee Members,
Please allow me to submit this letter of support for the California Acceleration Project’s (CAP) application for the Department of Finance Award for Innovation in Higher Education. The California Acceleration Project supports Skyline College and 46 other community colleges to redesign, streamline, and accelerate remediation with the goal of improving completion of college level gatekeeper courses in math and English. Through the CAP professional development program, Skyline College faculty have developed and offered accelerated courses in both English and math, and they are enthusiastic about the results they’re seeing.
Skyline College serves a diverse population of students traditionally underrepresented in higher education. More than 70 % of the students test into remedial levels of either math or English. This is an unfortunate impact of typical assessment processes that not only are not connected to the courses but have the effect of further marginalizing students by locking them into unreasonable sequences of remediation courses. While this is costly to the student, it is even more costly to the communities and society at large because there is a decreased likelihood that the students will actually complete the courses and consequently, their degrees and certificates. Statewide, only 31% of students in math remediation complete a college-level math course in 6 years and only 44% complete a college level English course in 6 years.
As an institution that has engaged in a comprehensive diversity framework that rejects most student deficit based assumptions that rationalize why “they are not successful”, Skyline College has taken on the evidenced based approach to equity that answers the question, “What about our practices, processes, and policies negatively impact the ways in which student connect to, enter, transition through and complete their educational goals in our institution?” This fundamental question that served as an overall research question lead us to pilot the approach offered by the California Acceleration Project—and it
OFFICE OF THE PRESIDENT !3300 College Drive, San Bruno, CA 94066 TELEPHONE 650-738-4100 WEBSITE www.SkylineCollege.edu
has made a tremendous difference to our students and faculty. Indeed it is an integral component of our Student Equity Plan and student success strategy.
CAP’s evaluation results show substantial improvements in student outcomes for underprepared students with less time spent in remediation and no additional add-on costs to the college. Of particular importance, equity gaps for African American students were eliminated in accelerated math pathways.
An Innovation Award will support CAP’s ability to continue important work and acknowledge their contribution to improving student outcomes across multiple colleges. It will also highlight accelerated remediation as a crucial cost-effective strategy for achieving equity goals, improving rates of completion of lower division transfer requirements, and decreasing time-to-transfer for community college students.
As the President of Skyline College, I am enthusiastic about the potential for continuing our collaboration with the California Acceleration Project. We need the support and expertise in CAP to expand early pilots to reach more students. Remediation redesign at Skyline College is sustainable and has the potential for dramatic impact if the Math and English departments are supported to teach these new courses on a wider scale.
I hope you are able to recognize the significance of this work and the impact it can have on our success in educating students.
Respectfully submitted,
Dr. Regina Stanback Stroud President, Skyline College
December 12, 2014 From: Dr. Rob Johnstone Founder & President National Center for Inquiry & Improvement To: Consideration Committee Department of Finance Award for Innovation in Higher Education Re: Support for the California Acceleration Project’s Application Selection Committee: My name is Dr. Rob Johnstone, and I am honored to write a hearty letter of recommendation for the California Acceleration Project (CAP) for the Department of Finance Award for Innovation in Higher Education. CAP, under the tutelage of my colleagues Katie Hern and Myra Snell, has achieved notably higher levels of achievement of the only real outcome for developmental mathematics – successfully passing a transfer level course of appropriate rigor. At the heart of CAP’s innovation is this improvement in outcomes – students’ odds of completion are 4.5 times higher than a matched comparison group. Given that the program can and is in the process of being operated at scale, these results are incredibly worthy of recognition. In addition, as I will outline below, these increases in the completion rate are associated with significant increases in cost efficiency. As far as the credentials to write such a recommendation, I am the Founder & President of the National Center for Inquiry & Improvement (www.inquiry2improvement.com), an organization that fuses the worlds of foundations, policy and practice, working with community colleges and regional four-year schools around the country on improving student outcomes. I formerly served as Senior Research Fellow and Vice President at The RP Group for California Community Colleges (where I worked with Katie & Myra), as well as a Dean and Vice President of Instruction at Foothill and Skyline Community Colleges in California. Over the past ten years, I've had the opportunity to work on a large number of state and national improvement initiatives such as Completion by Design, the Aspen Prize for Community College Excellence, Achieving the Dream, Lumina’s Guided Pathways to Success, Kresge’s Pathways Initiatives, Lumina’s Beyond Financial Aid, Carnegie's Statway / Quantway, and Edtrust's Access to Success. On these projects I have worked on the ground with over 100 colleges around the country in one form or another, and combined with a decade of experience as a Dean and VP in the California Community College system, I have a pretty good sense of what the field needs to meet the aggressive goals of fundamentally improving outcomes for our students. In addition, I’ve conducted cost efficiency and return-on-investment analyses on CAP and a
number of other projects in higher education, following having done this as a strategic consultant in industry with a wide range of Fortune 1000 companies. This all brings us to the California Acceleration Project, a project about which I’ve known since its inception and also for which I developed a cost efficiency model in 2012-13. As noted above, CAP has significantly increased the transfer course pathway rate; with this increase comes a number of notable increases in cost efficiency. The model I created, which is an Excel spreadsheet can be customized on a number of levels, including:
• the number of students at a college or in a state system • the relative ratios of students placed into various levels under the traditional pathway • the average instructional cost per unit of both PT & FT faculty in the traditional and CAP
sequences • the ratio of courses taught in the sequence by PT & FT faculty in the traditional and CAP
sequences • the number of units in the traditional and CAP sequences • average class size in the traditional and CAP sequences • average number of attempts at each level of the traditional and CAP sequences • cohort success rates at each level of the traditional and CAP sequences
Using these inputs of both the traditional and CAP pathways, the model calculates:
• overall entering cohort completion rate of the traditional pathway • overall entering cohort completion rate of the CAP pathway • the cost of the traditional pathway • the cost of the CAP pathway • the cost per completer of the traditional pathway • the cost per completer of the CAP pathway • percentage of the cost each pathway that is in the pre-transfer sequence • an estimate of cost savings to the student due to a reduced semesters to degree estimate
!As you can see from the instance of the model in which Katie & Myra have blended results from the seven initial cap colleges and estimated the effects of CAP at scale. Using current figures on the improvement in the CAP sequence and the cost inputs you can see in the spreadsheet, the key outcomes of the model are:
• a total cost reduction of the CAP pathway of 12% vs. the traditional pathway • a 34% reduction in cost of remediation • a cost per completer of $2,470 for the traditional pathway and $1,301 for the CAP
pathway – a reduction of 47% • a reduction in the cost of courses that are pre-transfer from 71% in the traditional
sequence to 53% in the CAP sequence Clearly, the cost efficiencies achieved by the California Acceleration Project are noteworthy – and are based in the incredible increases in the achievement and success of students under CAP, combined with a model that is scalable and sustainable. In sum, you have in front of you the application of an incredibly important innovation that is worthy of serious consideration for the award. This project has moved the needle in such a significant way that it sits among the elite improvement projects in the community college space.

Feel free to contact me at [email protected] or by phone at 650-740-1796. Sincerely... Rob Johnstone Dr. Rob Johnstone !
T O W A R D A V I S I O N O F A C C E L E R A T E D C U R R I C U L U M & P E D A G O G Y
High Chal lenge , High Support Classrooms for Underprepared Students
B Y K A T I E H E R N | Director, California Acceleration Project | English instructor, Chabot Collegew i t h M Y R A S N E L L | Math lead, California Acceleration Project | Professor of Mathematics, Los Medanos College
e x e c u t i v e
s u mm
a r y
2
Developmental education is under an uncomfortable microscope these days. President Obama has called for dramatic increases in completion of post-secondary creden-tials, and legislators and policy makers have zeroed in on remediation reform as essential to meeting this goal. Four national organizations have called for an overhaul of English and math remediation, including placing most students directly into credit-bearing college courses, tailoring math remediation to students’ chosen pathways, eliminating multi-level remedial sequences, and offering co-requisite support and accelerated models for less prepared students.
The movement to reform remediation is spurred by three important trends in
the national research on community colleges: 1) studies showing that that huge
numbers of students disappear before making meaningful progress in college, and
that the more layers of remedial coursework students must take, the lower their
completion of college-level English and math; 2) studies questioning the accuracy
of the standardized tests that sort students into different levels of remediation,
and 3) studies showing significantly better outcomes among students enrolled in
accelerated models of remediation.
While the research has clarified key problems in developmental education, and
pointed toward promising directions for change, an important question is often
missing from the conversation: What does instruction look like in an accelerated
class? And how is it different from more traditional approaches to remediation?
LearningWorks commissioned the monograph “Toward a Vision of Accelerated
Curriculum and Pedagogy” to address these important questions. Katie Hern and
Myra Snell, leaders of the California Acceleration Project, draw upon their own
classroom experience, and their work with community college faculty across the
state, to articulate a set of core principles and practices for teaching accelerated
English and math – in particular, how teachers can support students with widely
varying backgrounds and skill levels to be successful in an accelerated environ-
ment.
Hern and Snell offer five core design principles for high-challenge, high-support
accelerated classes:
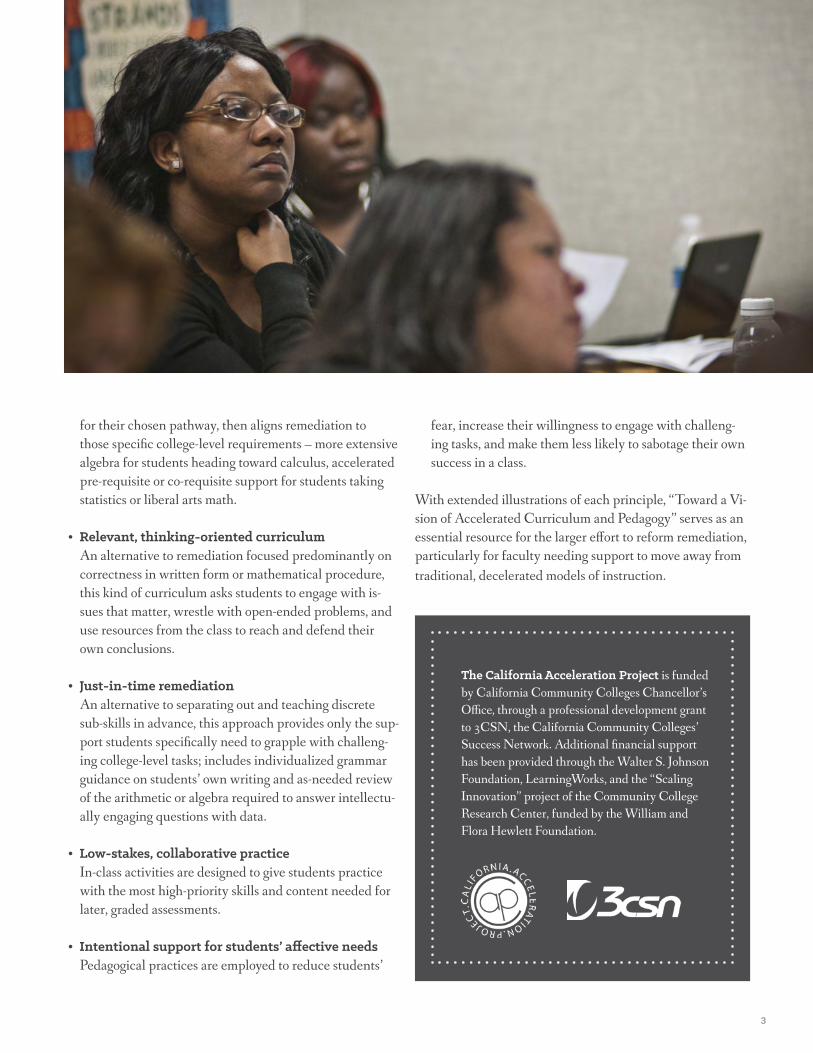
• Backward design from college-level coursesThis design principle addresses the misalignment between traditional remedia-
tion and college-level coursework. In English, backward design holds that a
developmental course should look and feel like a good college English course,
with more support and guidance. In math, it asks which math students need
3
for their chosen pathway, then aligns remediation to
those specific college-level requirements – more extensive
algebra for students heading toward calculus, accelerated
pre-requisite or co-requisite support for students taking
statistics or liberal arts math.
• Relevant, thinking-oriented curriculumAn alternative to remediation focused predominantly on
correctness in written form or mathematical procedure,
this kind of curriculum asks students to engage with is-
sues that matter, wrestle with open-ended problems, and
use resources from the class to reach and defend their
own conclusions.
• Just-in-time remediationAn alternative to separating out and teaching discrete
sub-skills in advance, this approach provides only the sup-
port students specifically need to grapple with challeng-
ing college-level tasks; includes individualized grammar
guidance on students’ own writing and as-needed review
of the arithmetic or algebra required to answer intellectu-
ally engaging questions with data.
• Low-stakes, collaborative practiceIn-class activities are designed to give students practice
with the most high-priority skills and content needed for
later, graded assessments.
• Intentional support for students’ affective needsPedagogical practices are employed to reduce students’
fear, increase their willingness to engage with challeng-
ing tasks, and make them less likely to sabotage their own
success in a class.
With extended illustrations of each principle, “Toward a Vi-
sion of Accelerated Curriculum and Pedagogy” serves as an
essential resource for the larger effort to reform remediation,
particularly for faculty needing support to move away from
traditional, decelerated models of instruction.
The California Acceleration Project is funded
by California Community Colleges Chancellor’s
Office, through a professional development grant
to 3CSN, the California Community Colleges’
Success Network. Additional financial support
has been provided through the Walter S. Johnson
Foundation, LearningWorks, and the “Scaling
Innovation” project of the Community College
Research Center, funded by the William and
Flora Hewlett Foundation.
LearningWorks was founded by the Career Ladders Project for California
Community Colleges, the Research and Planning Group for California
Community Colleges, and the California Community Colleges Success
Network to facilitate, disseminate and fund practitioner-informed recom-
mendations for changes at the community college system and classroom
levels, infusing these strategies with statewide and national insights.
LearningWorks seeks to strengthen the relationships that offer the greatest
potential for accelerating action, including those between policy mak-
ers and practitioners, among overlapping initiatives, and across the 112
colleges. LearningWorks is supported by the William and Flora Hewlett
Foundation and the Walter S. Johnson Foundation.
ADDRESS 678 13th Street, Suite 103 | Oakland, CA 94612
WEB www.LearningWorksCA.org
Printed on recycled paper by Bacchus Press, Inc., a Bay Area Green Certified Business
The Research & Planning Group for California Community Colleges
Curricular Redesign and Gatekeeper Completion: A Multi-College Evaluation of the California Acceleration Project Summary April 2014
Authors: Craig Hayward, Ph.D. Terrence Willett, M.S. Senior Researchers, RP Group
Prepared for: Deborah Harrington
Executive Director, 3CSN Katie Hern, Director
California Acceleration Project
This study was jointly funded by California Community College Success Network (3CSN) and a private grant from the Walter S. Johnson Foundation.
The RP Group California Acceleration Project Evaluation Summary 1
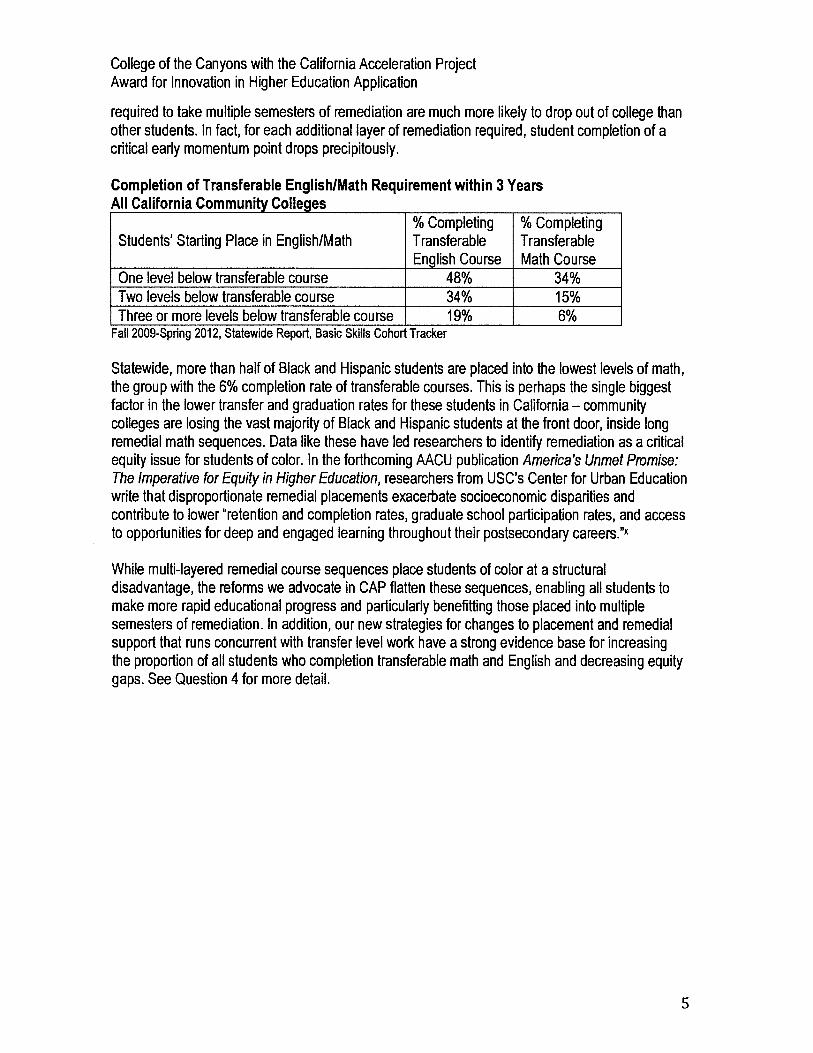
The Problem Large numbers of students are being placed into long remedial or basic skills sequences from which few emerge. Across the California Community College system, only 7% of students beginning at three levels below transfer-‐level successfully complete transferable math within three years. The comparable number for English is only 19%.
The Intervention
The California Acceleration Project (CAP), an initiative of the California Community Colleges’ Success Network (3CSN), provided training in the development of accelerated English and math pathways. While there was variation in the specific models implemented, all participating colleges reduced students’ time in remediation by at least a semester; made no changes to the transferable college-‐level course (only remediation was redesigned); ); and aligned remediation with the college-‐level requirements for college composition and statistics (science specific math such as pre-‐calculus was not included). Most also employed a set of CAP instructional design principles for creating “high-‐challenge, high-‐support classrooms.”
The Study
The RP Group tested the hypothesis that students in accelerated pathways complete the transfer-‐level gatekeeper course at a rate higher than comparable students who participate in the traditional sequence. This hypothesis was examined by contrasting the completion of the transfer-‐level gatekeeper course by accelerated students relative to comparable students who were enrolled in the traditional English and math basic skills sequences in the 2011-‐2012 academic year, CAP’s pilot year. Students were followed through spring 2013.
Main Findings Acceleration effects were large and robust: This study found that accelerated pathways had an overall effect of increasing the odds of completing transfer-‐level gatekeeper courses for students at all levels of the developmental sequence. After controlling for an array of potentially confounding demographic and academic variables, students’ odds of completing a transferable college-‐level course were 1.5 times greater in accelerated English models overall and 2.3 times greater in high-‐acceleration models. Students’ odds of completing a transferable math course were 4.5 times greater in accelerated pathways than for students in traditional remediation. While not all of the accelerated pathways for English showed significant positive effects, no pathways showed significant negative effects.
Statewide progression of students in math from three levels below transfer to transfer-‐level math from fall 2010 through spring 2013.
Executive Summary
The RP Group California Acceleration Project Evaluation Summary 2
Acceleration worked for students of all backgrounds: A diverse range of students in the analysis showed higher outcomes in accelerated pathways regardless of demographics such as ethnicity, gender, financial need, disability status, and prior English as a second language course taking.
Acceleration worked for students at all placement levels: Accelerated pathways were associated with increased odds of sequence completion for students placed at all levels of the basic skills sequence in both math and in English.
Implementation Mattered: Variation in how the 16 participating colleges realized acceleration was an important factor. English acceleration pathways were parsed into low-‐acceleration and high-‐acceleration pathways. Low-‐acceleration pathways imposed additional coursework and/or strong institutional filtering processes and tended to show little or no acceleration effect.
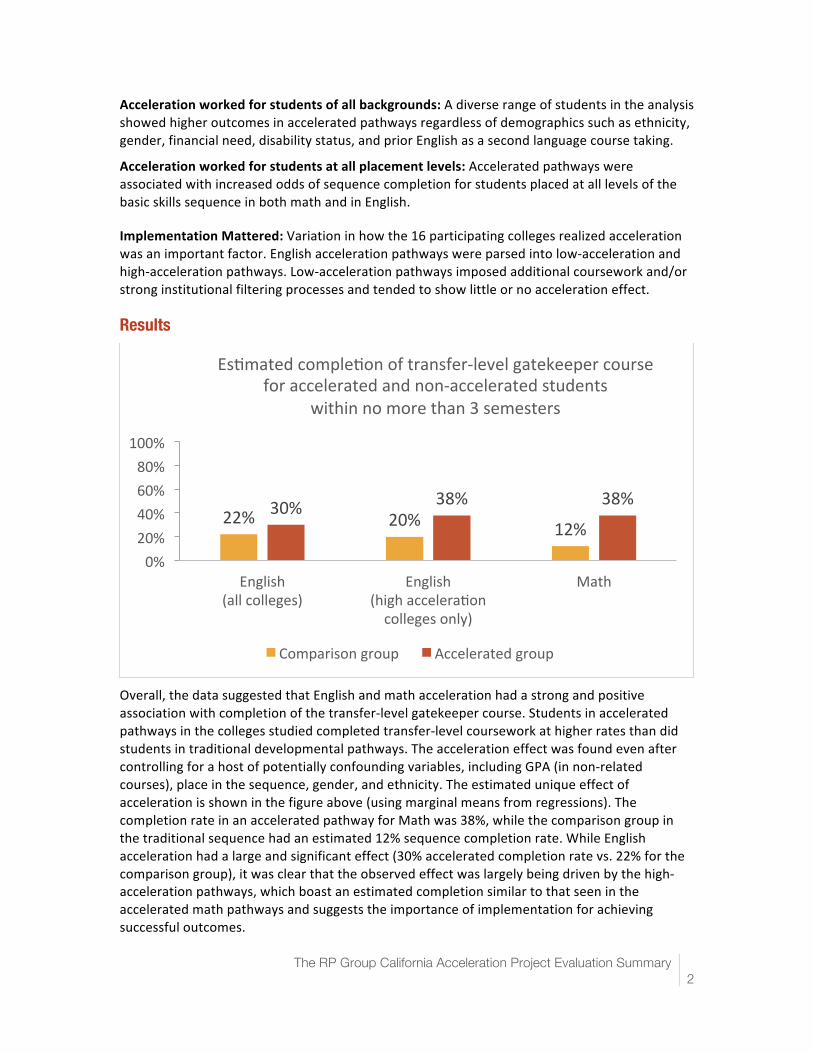
Results
Overall, the data suggested that English and math acceleration had a strong and positive association with completion of the transfer-‐level gatekeeper course. Students in accelerated pathways in the colleges studied completed transfer-‐level coursework at higher rates than did students in traditional developmental pathways. The acceleration effect was found even after controlling for a host of potentially confounding variables, including GPA (in non-‐related courses), place in the sequence, gender, and ethnicity. The estimated unique effect of acceleration is shown in the figure above (using marginal means from regressions). The completion rate in an accelerated pathway for Math was 38%, while the comparison group in the traditional sequence had an estimated 12% sequence completion rate. While English acceleration had a large and significant effect (30% accelerated completion rate vs. 22% for the comparison group), it was clear that the observed effect was largely being driven by the high-‐acceleration pathways, which boast an estimated completion similar to that seen in the accelerated math pathways and suggests the importance of implementation for achieving successful outcomes.
22% 20% 12% 30% 38% 38%
0% 20% 40% 60% 80%
100%
English (all colleges)
English (high accelera`on colleges only)
Math
Es`mated comple`on of transfer-‐level gatekeeper course for accelerated and non-‐accelerated students
within no more than 3 semesters
Comparison group Accelerated group
The RP Group California Acceleration Project Evaluation Summary 3
The study tracked the progress of students from colleges that participated in the first year of the college's CAP implementation through spring 2013 for one to one and a half years after the intervention semester. The evaluation included 16 colleges and 48,450 students: 2,489 accelerated students and 45,961 comparison students. Comparison student data was drawn from students who had enrollments in developmental math and/or English in the same term as the accelerated students.
Data for this evaluation came primarily from the Chancellor's office (COMIS data) combined with assessment/placement data sourced directly from each participating college. A lead faculty member or researcher at each CAP college also completed an implementation survey that provided information on the specific ways in which acceleration was realized at each site. The full technical report is available at www.rpgroup.org/cap.
Stakeholders CAP (http://cap.3csn.org/) is part of the California Community Colleges Success Network (3CSN). The project promotes and supports a community of practice centered on accelerated pathways for English as well as math. CAP provides training, advice, and support to faculty who are interested in implementing accelerated pathways at their local community college. This study was jointly funded by California Community College Success Network (3CSN) and a private grant from the Walter S. Johnson Foundation.
The RP Group Staff Biographies
Craig Hayward [email protected] Dr. Hayward is embedded in the daily work of improving institutional effectiveness and student success at Irvine Valley College as the Director of Research, Planning and Accreditation. He received his Bachelor's in Journalism from Boston University and his Ph.D. in Human Development from the University of
California, Irvine. He has taught statistics, research methods, and psychology to graduate and undergraduate students. In his capacity as a Senior Researcher for the RP Group, he has been involved in a number of prominent statewide projects including the Transfer Velocity Project, the Student Success Scorecard, and the Basic Skills Cohort Progress Tracker.
Terrence Willett [email protected] Mr. Willett is Director of Planning, Research, and Knowledge Systems at Cabrillo College and a Senior Researcher with the RP Group. He received a B.A. in Psychology UC Santa Cruz and an M.S. in Environmental Studies from San José
State University. He was the Director of Research for Cal-PASS and HI-PASS (linked K-12 and high education data systems for California and Hawai`i, respectively) and Director of Research for Gavilan College where he also taught Field Ecology. He is experienced with large relational data bases, predictive modeling using traditional and machine learning/data mining techniques, and geographic information systems (GIS) analyses.
About the Study
Current Grantees
As of August 2014, CEPF has funded four cohorts of grantees:
Cohort Four Grantees Cohort Three Grantees Cohort Two Grantees Cohort One Grantees
CEPF Cohort Four Grantees
In August 2014, CEPF made its fourth round of grant awards. The grants support 10 organizations with the potential to impact education policy reform and policy implementation to promote Deeper Learning in California. A total of $3.65 million was awarded.
CEPF's Fourth Cohort of Grantees Includes:
• California Acceleration Project • California Collaborative on District Reform • Campaign for College Opportunity • Council for a Strong America • Educational Policy Improvement Center • Educators for Excellence • EdVoice Institute • Los Angeles Area Chamber of Commerce Foundation • Policy Analysis for California Education (PACE) • Stanford Center for Opportunity Policy in Education (SCOPE)
California Acceleration Project (CAP):
The CAP supports the state’s 112 community colleges to redesign and accelerate English and math remediation to increase student completion of college courses in those disciplines. Completion of college level math and English is a fundamental momentum point to transfer and degree attainment, and the first hurdle faced by the 70% of California Community College students deemed “underprepared” for college. Relying on research and experimental design, CAP involves grassroots, network-based organizing and professional development to change the structure, curricula, and pedagogy of remediation. CAP collaborates with faculty and partner organizations to reach wider audiences and create an echo chamber for change.
California Collaborative on District Reform:
The California Collaborative on District Reform convenes district leaders and other practitioners, state policymakers, researchers, and funders in ongoing dialogue, collective problem solving, and action, to improve instruction and student learning across California, especially for the state’s most underserved children. An initiative of the American Institutes for Research (AIR), the Collaborative brings its practitioners and other members into the state and local policy arenas to identify problems of practice and policy, enact solutions to those problems, and implement the solutions effectively. The Collaborative’s 38 members include superintendents from nine of the state’s districts (Fresno, Garden Grove, Long Beach, Los Angeles, Oakland, Sacramento, San Francisco, San Jose, and Sanger); key state policy makers (including the current president of the State Board of Education and representatives from the California Department of Education), prominent researchers with expertise in both district- and state-level policy and reform, and support providers, advocates and foundation leaders working to improve education opportunities and outcomes in the state. The Collaborative’s two main goals have remained consistent since its inception nine years ago: building capacity to improve policy and practice; and influencing state and local action.
Campaign for College Opportunity:
Founded in 2003 by an alliance of prominent organizations including the California Business Roundtable, the Mexican American Legal Defense and Educational Fund, and the Community College League of California, the Campaign for College Opportunity is a nonprofit organization committed to ensuring that the next generation of California students has the chance to attend college and succeed in achieving some level of postsecondary education. The Campaign was founded on the belief that independent pressure from a broad
coalition of stakeholders and widespread media attention on policymakers and our higher education systems is necessary to press for successful policy solutions that meet workforce needs and ensure college opportunity for the growing diverse young adult population in our state. The Campaign focuses on improving student access to and success in California’s public higher education institutions by raising public awareness, building a strong and diverse coalition of supporters, and engaging in public policy and systems change.
Council for a Strong America:
The Council for a Strong America is the parent organization of three sibling organizations, all working toward the common goal of education reform and increased investments in children and families in California and at the national level. The Council’s “unexpected messengers” for education reform – California’s law enforcement leaders, business leaders, and retired admirals and generals – bring new voices to the conversation, helping stakeholders and the public understand the changes that are critical for the state’s young people to succeed in college, career, and civic life. Fight Crime: Invest in Kids is led by more than 400 California police chiefs, sheriffs, district attorneys, and crime survivors who know high quality education is the best way to help young people succeed in life and improve public safety. ReadyNation (formerly America’s Edge) mobilizes more than 100 California business leaders to advocate for education reform for a skilled 21st century workforce, vibrant economy, and employment growth. Mission: Readiness’ retired admirals and generals argue that education reform increases national security by preparing children to succeed in life – whatever career path they choose.
…
Excerpted from http://rockpa.org/about-us/cepf---current-grantees-aug2014#CalCollab
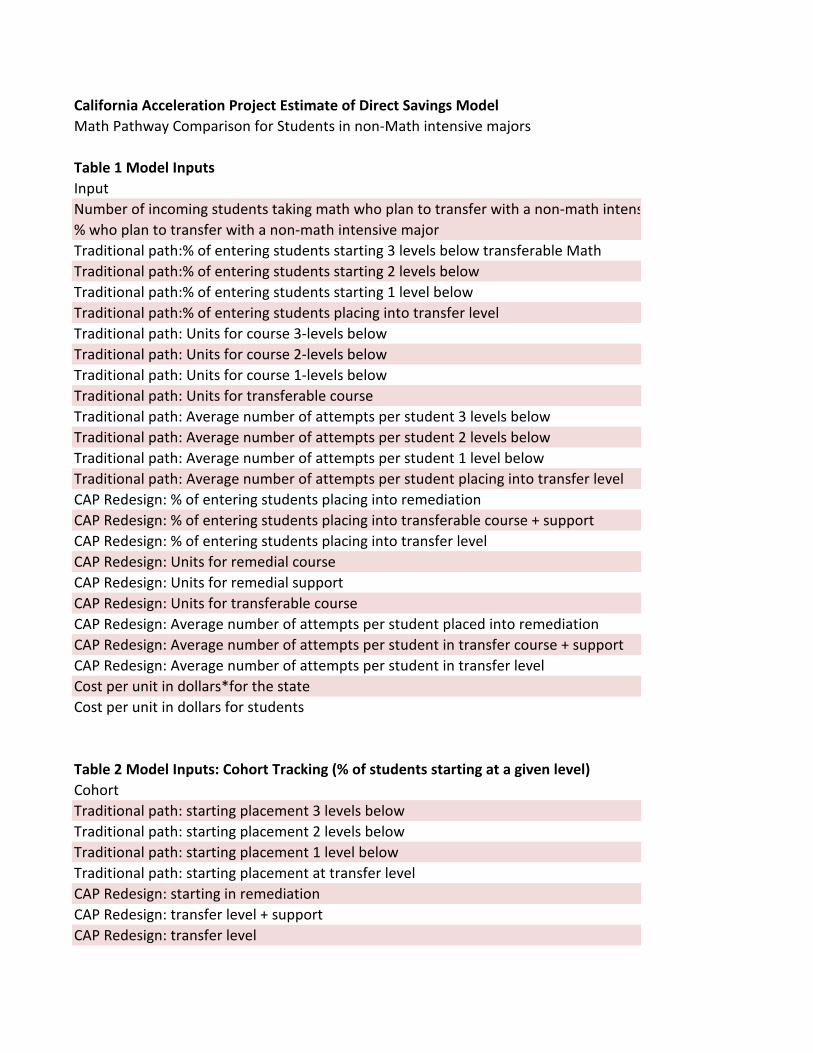
California Acceleration Project Estimate of Direct Savings ModelMath Pathway Comparison for Students in non-Math intensive majors
Table 1 Model Inputs InputNumber of incoming students taking math who plan to transfer with a non-math intens % who plan to transfer with a non-math intensive majorTraditional path:% of entering students starting 3 levels below transferable MathTraditional path:% of entering students starting 2 levels below Traditional path:% of entering students starting 1 level belowTraditional path:% of entering students placing into transfer levelTraditional path: Units for course 3-levels belowTraditional path: Units for course 2-levels belowTraditional path: Units for course 1-levels belowTraditional path: Units for transferable courseTraditional path: Average number of attempts per student 3 levels belowTraditional path: Average number of attempts per student 2 levels belowTraditional path: Average number of attempts per student 1 level belowTraditional path: Average number of attempts per student placing into transfer levelCAP Redesign: % of entering students placing into remediationCAP Redesign: % of entering students placing into transferable course + supportCAP Redesign: % of entering students placing into transfer levelCAP Redesign: Units for remedial courseCAP Redesign: Units for remedial supportCAP Redesign: Units for transferable courseCAP Redesign: Average number of attempts per student placed into remediationCAP Redesign: Average number of attempts per student in transfer course + supportCAP Redesign: Average number of attempts per student in transfer levelCost per unit in dollars*for the stateCost per unit in dollars for students
Table 2 Model Inputs: Cohort Tracking (% of students starting at a given level)Cohort Traditional path: starting placement 3 levels belowTraditional path: starting placement 2 levels belowTraditional path: starting placement 1 level belowTraditional path: starting placement at transfer levelCAP Redesign: starting in remediationCAP Redesign: transfer level + supportCAP Redesign: transfer level
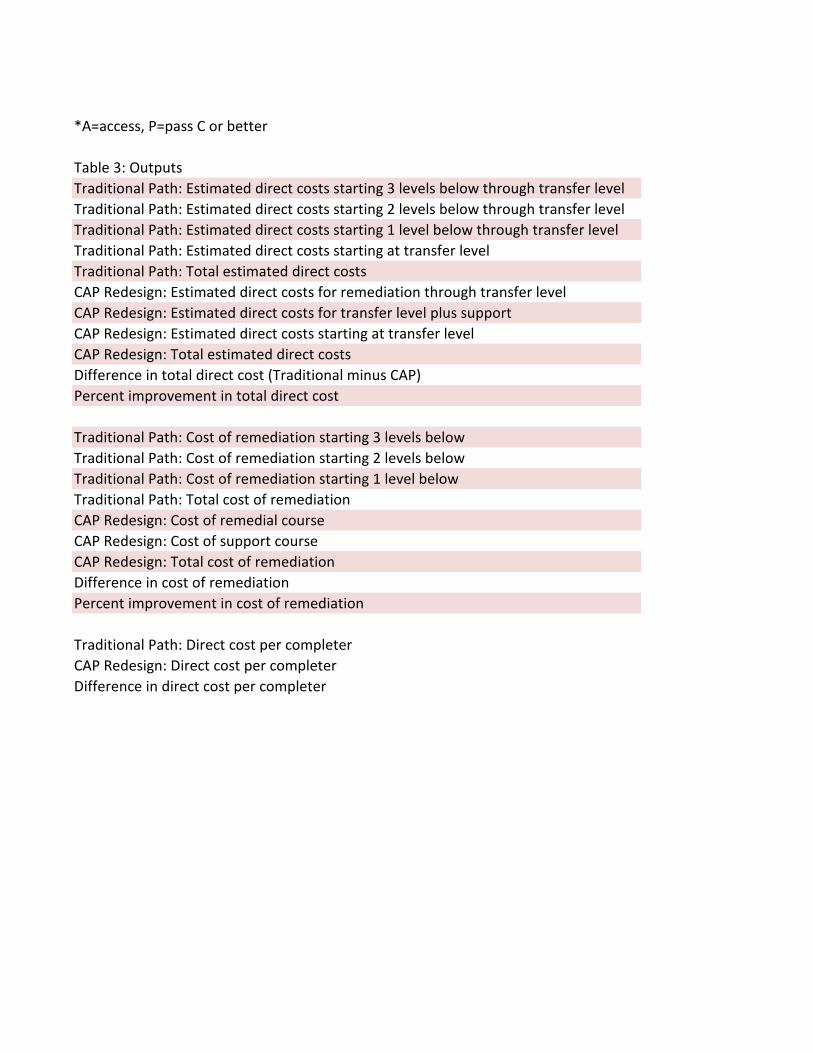
*A=access, P=pass C or better
Table 3: Outputs Traditional Path: Estimated direct costs starting 3 levels below through transfer levelTraditional Path: Estimated direct costs starting 2 levels below through transfer levelTraditional Path: Estimated direct costs starting 1 level below through transfer levelTraditional Path: Estimated direct costs starting at transfer levelTraditional Path: Total estimated direct costs CAP Redesign: Estimated direct costs for remediation through transfer levelCAP Redesign: Estimated direct costs for transfer level plus supportCAP Redesign: Estimated direct costs starting at transfer levelCAP Redesign: Total estimated direct costsDifference in total direct cost (Traditional minus CAP)Percent improvement in total direct cost
Traditional Path: Cost of remediation starting 3 levels belowTraditional Path: Cost of remediation starting 2 levels belowTraditional Path: Cost of remediation starting 1 level belowTraditional Path: Total cost of remediationCAP Redesign: Cost of remedial courseCAP Redesign: Cost of support courseCAP Redesign: Total cost of remediationDifference in cost of remediationPercent improvement in cost of remediation
Traditional Path: Direct cost per completerCAP Redesign: Direct cost per completerDifference in direct cost per completer
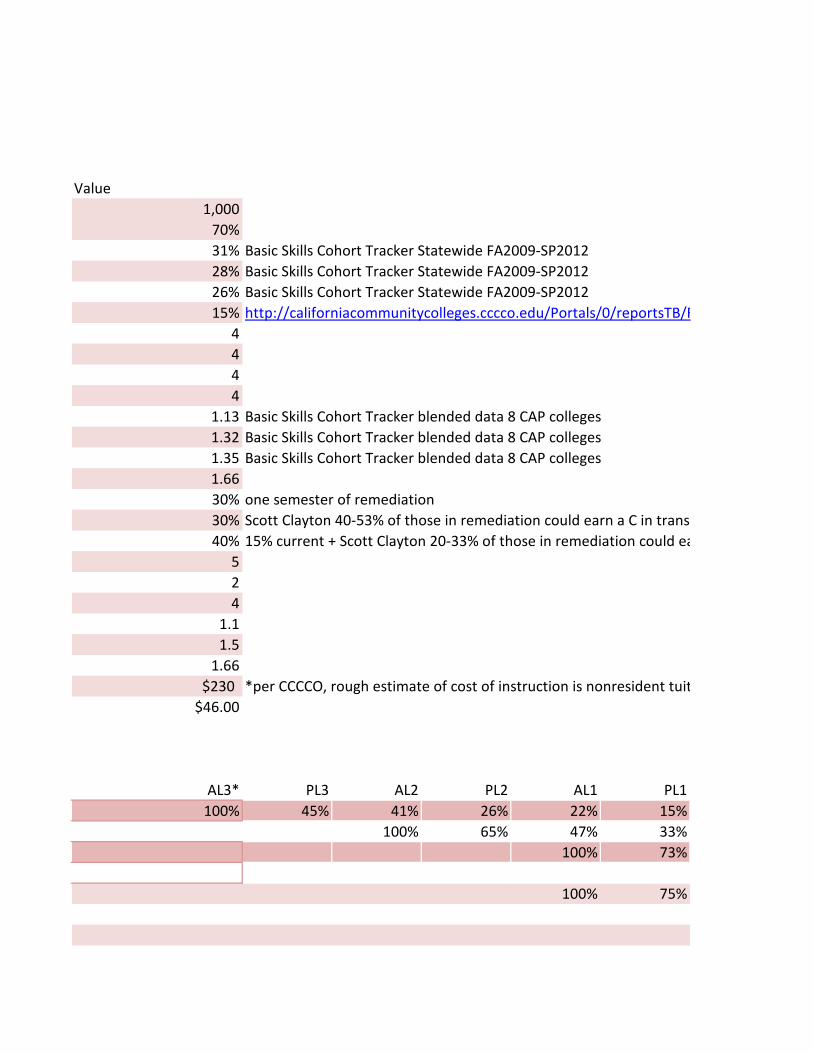
Value1,000
70%31% Basic Skills Cohort Tracker Statewide FA2009-SP201228% Basic Skills Cohort Tracker Statewide FA2009-SP201226% Basic Skills Cohort Tracker Statewide FA2009-SP201215% http://californiacommunitycolleges.cccco.edu/Portals/0/reportsTB/R
4444
1.13 Basic Skills Cohort Tracker blended data 8 CAP colleges1.32 Basic Skills Cohort Tracker blended data 8 CAP colleges1.35 Basic Skills Cohort Tracker blended data 8 CAP colleges1.6630% one semester of remediation30% Scott Clayton 40-53% of those in remediation could earn a C in transf 40% 15% current + Scott Clayton 20-33% of those in remediation could ea
524
1.11.5
1.66$230 *per CCCCO, rough estimate of cost of instruction is nonresident tuit
$46.00
AL3* PL3 AL2 PL2 AL1 PL1100% 45% 41% 26% 22% 15%
100% 65% 47% 33%100% 73%
100% 75%
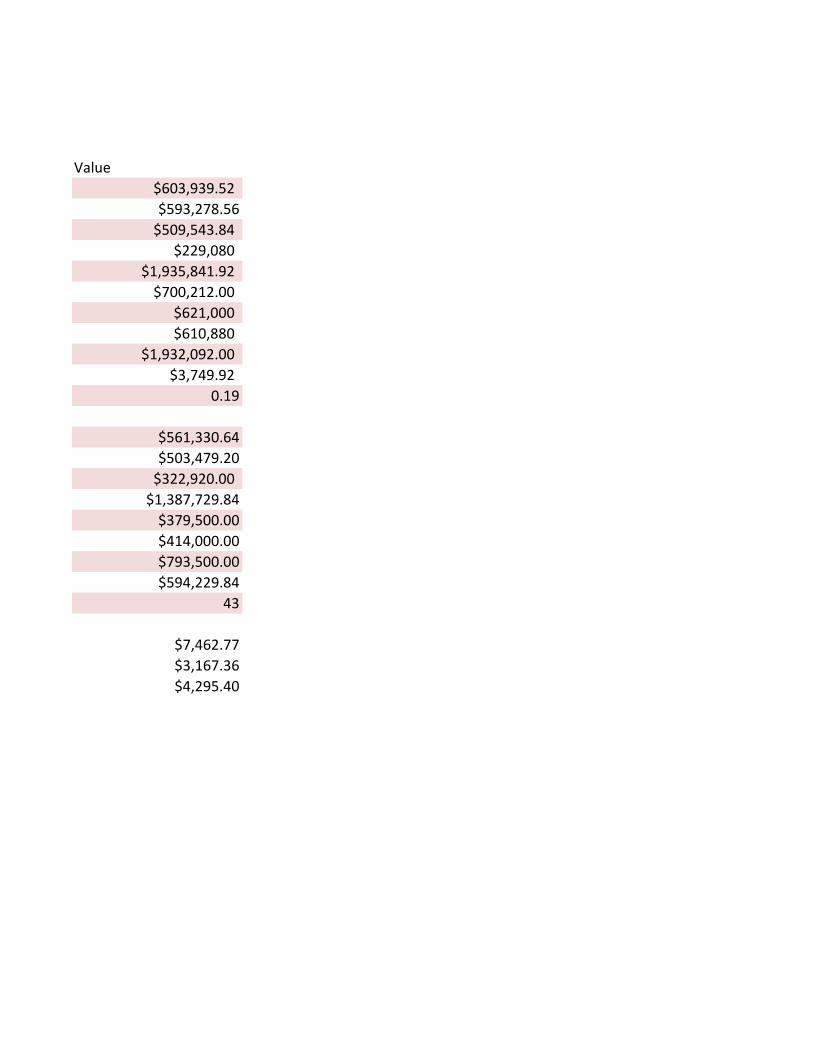
Value$603,939.52$593,278.56
$509,543.84$229,080
$1,935,841.92$700,212.00
$621,000$610,880
$1,932,092.00$3,749.92
0.19
$561,330.64$503,479.20
$322,920.00$1,387,729.84
$379,500.00$414,000.00$793,500.00$594,229.84
43
$7,462.77$3,167.36$4,295.40
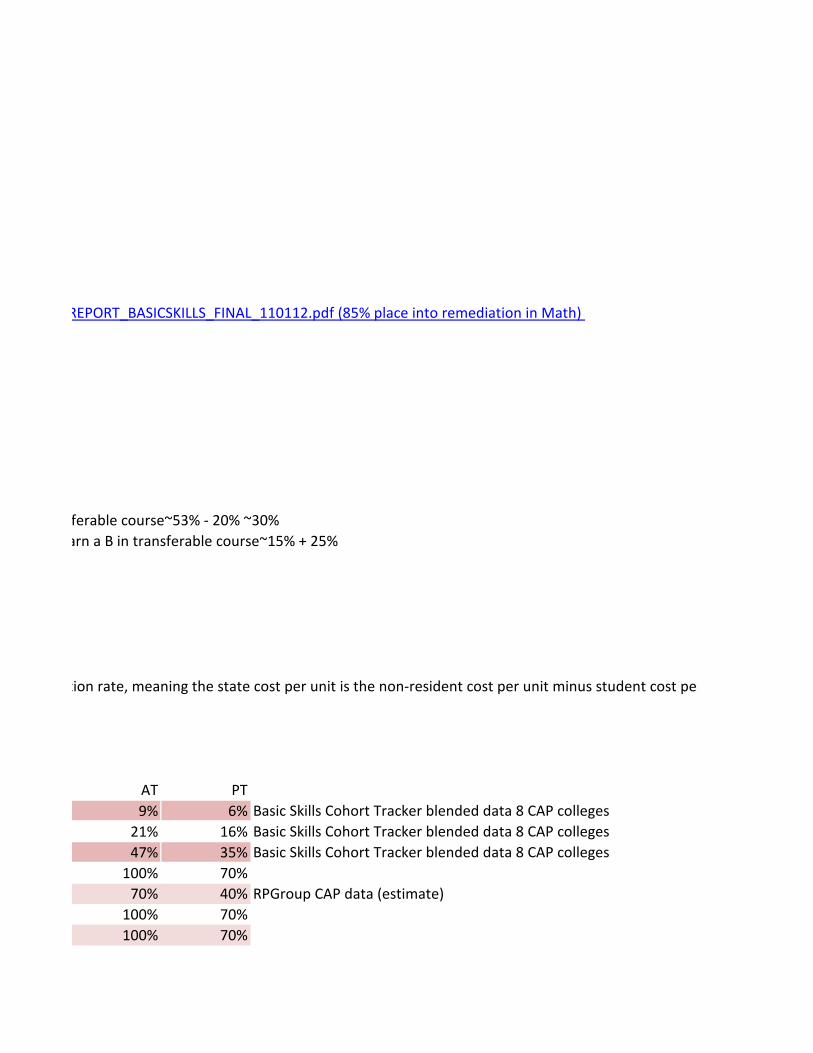
REPORT_BASICSKILLS_FINAL_110112.pdf (85% place into remediation in Math)
ferable course~53% - 20% ~30% arn a B in transferable course~15% + 25%
tion rate, meaning the state cost per unit is the non-resident cost per unit minus student cost per
AT PT9% 6% Basic Skills Cohort Tracker blended data 8 CAP colleges
21% 16% Basic Skills Cohort Tracker blended data 8 CAP colleges47% 35% Basic Skills Cohort Tracker blended data 8 CAP colleges
100% 70%70% 40% RPGroup CAP data (estimate)
100% 70%100% 70%


r unit


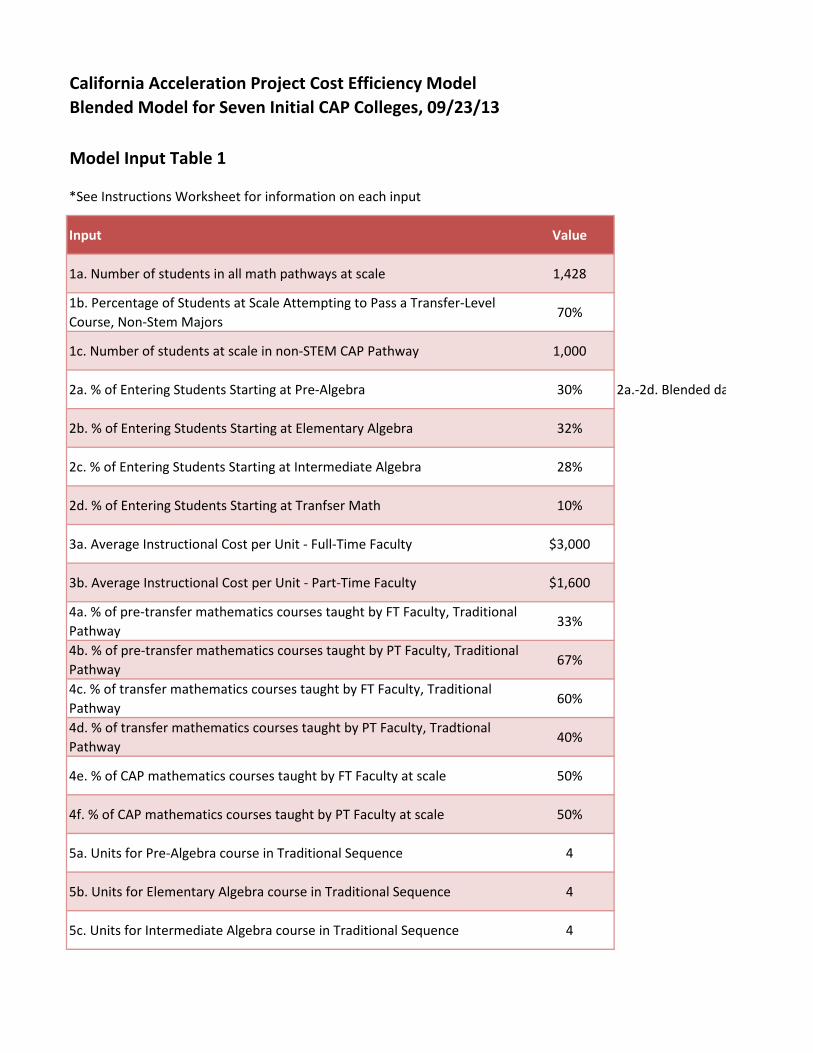
California Acceleration Project Cost Efficiency ModelBlended Model for Seven Initial CAP Colleges, 09/23/13
Model Input Table 1
*See Instructions Worksheet for information on each input
Input Value
1a. Number of students in all math pathways at scale 1,428
1b. Percentage of Students at Scale Attempting to Pass a Transfer-Level Course, Non-Stem Majors
70%
1c. Number of students at scale in non-STEM CAP Pathway 1,000
2a. % of Entering Students Starting at Pre-Algebra 30% 2a.-2d. Blended da
2b. % of Entering Students Starting at Elementary Algebra 32%
2c. % of Entering Students Starting at Intermediate Algebra 28%
2d. % of Entering Students Starting at Tranfser Math 10%
3a. Average Instructional Cost per Unit - Full-Time Faculty $3,000
3b. Average Instructional Cost per Unit - Part-Time Faculty $1,600
4a. % of pre-transfer mathematics courses taught by FT Faculty, Traditional Pathway
33%
4b. % of pre-transfer mathematics courses taught by PT Faculty, Traditional Pathway
67%
4c. % of transfer mathematics courses taught by FT Faculty, Traditional Pathway
60%
4d. % of transfer mathematics courses taught by PT Faculty, Tradtional Pathway
40%
4e. % of CAP mathematics courses taught by FT Faculty at scale 50%
4f. % of CAP mathematics courses taught by PT Faculty at scale 50%
5a. Units for Pre-Algebra course in Traditional Sequence 4
5b. Units for Elementary Algebra course in Traditional Sequence 4
5c. Units for Intermediate Algebra course in Traditional Sequence 4
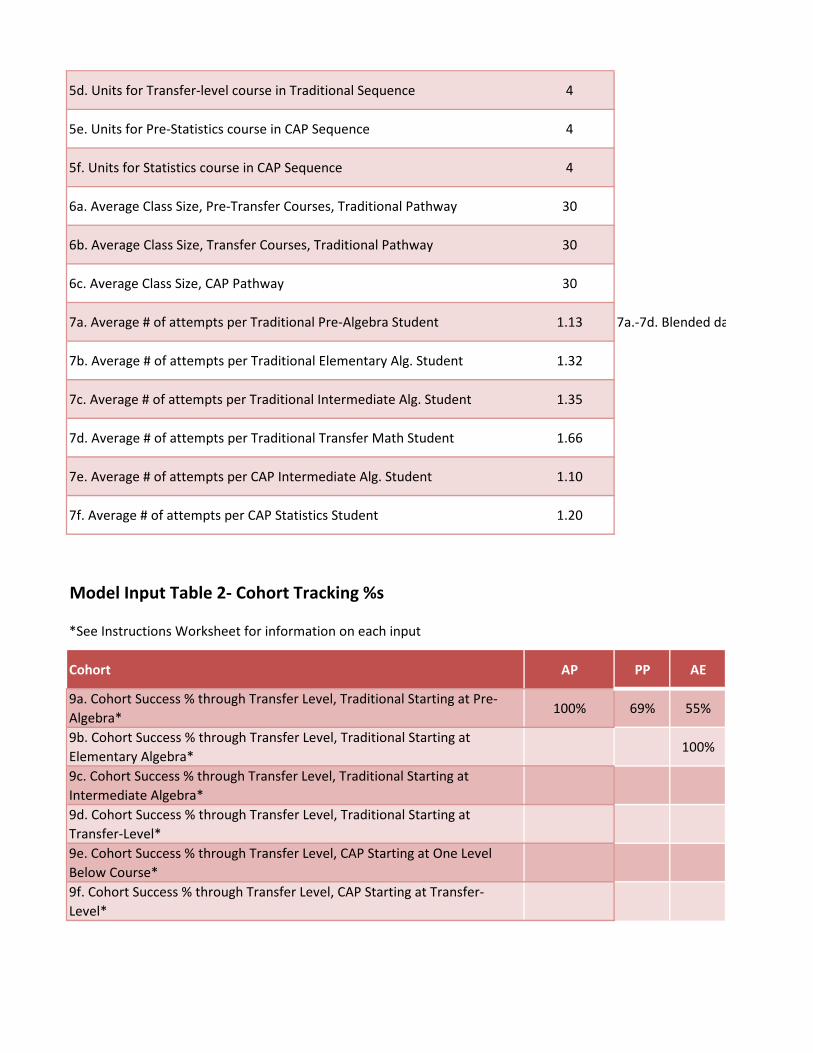
5d. Units for Transfer-level course in Traditional Sequence 4
5e. Units for Pre-Statistics course in CAP Sequence 4
5f. Units for Statistics course in CAP Sequence 4
6a. Average Class Size, Pre-Transfer Courses, Traditional Pathway 30
6b. Average Class Size, Transfer Courses, Traditional Pathway 30
6c. Average Class Size, CAP Pathway 30
7a. Average # of attempts per Traditional Pre-Algebra Student 1.13 7a.-7d. Blended da
7b. Average # of attempts per Traditional Elementary Alg. Student 1.32
7c. Average # of attempts per Traditional Intermediate Alg. Student 1.35
7d. Average # of attempts per Traditional Transfer Math Student 1.66
7e. Average # of attempts per CAP Intermediate Alg. Student 1.10
7f. Average # of attempts per CAP Statistics Student 1.20
Model Input Table 2- Cohort Tracking %s
*See Instructions Worksheet for information on each input
Cohort AP PP AE
9a. Cohort Success % through Transfer Level, Traditional Starting at Pre-Algebra*
100% 69% 55%
9b. Cohort Success % through Transfer Level, Traditional Starting at Elementary Algebra*
100%
9c. Cohort Success % through Transfer Level, Traditional Starting at Intermediate Algebra*9d. Cohort Success % through Transfer Level, Traditional Starting at Transfer-Level*9e. Cohort Success % through Transfer Level, CAP Starting at One Level Below Course*9f. Cohort Success % through Transfer Level, CAP Starting at Transfer-Level*

ata 7 CAP colleges
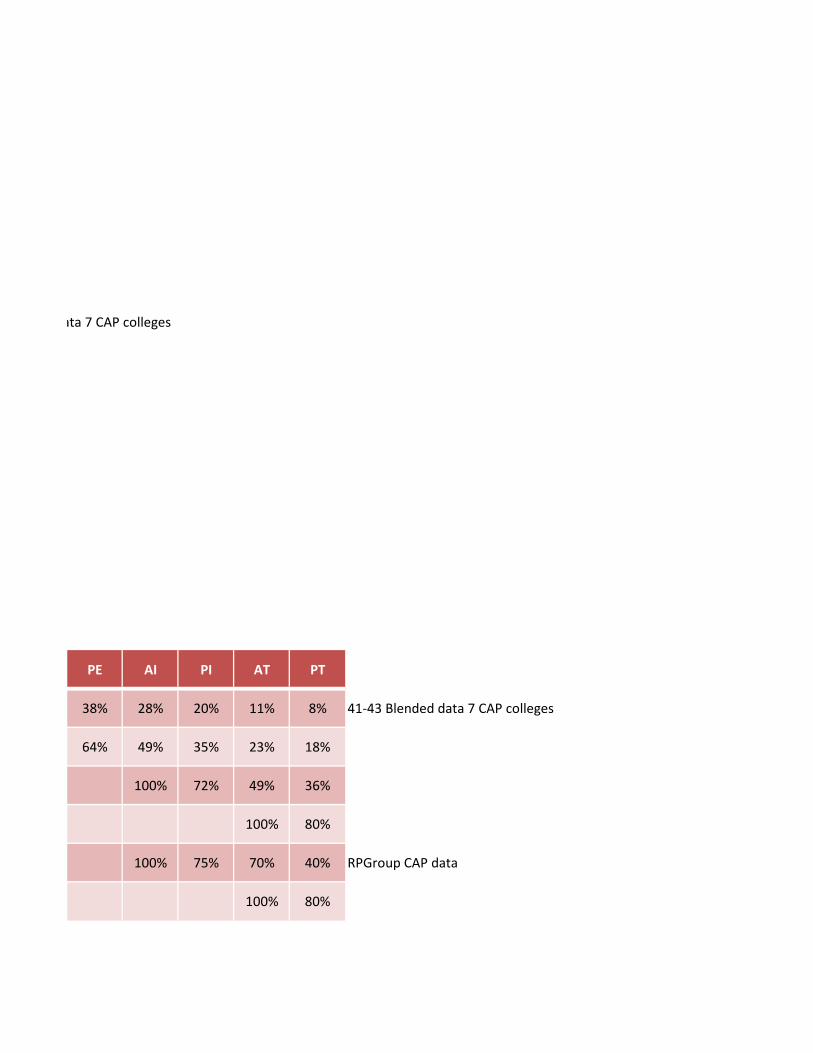
ata 7 CAP colleges
PE AI PI AT PT
38% 28% 20% 11% 8% 41-43 Blended data 7 CAP colleges
64% 49% 35% 23% 18%
100% 72% 49% 36%
100% 80%
100% 75% 70% 40% RPGroup CAP data
100% 80%
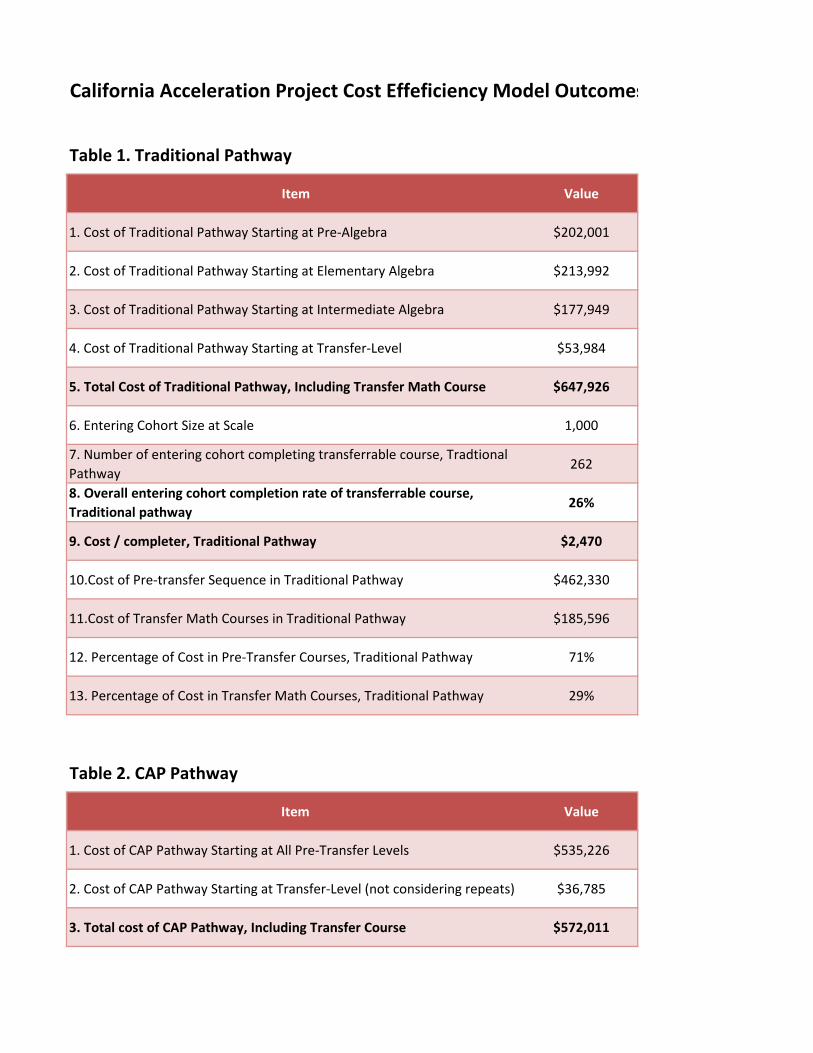
California Acceleration Project Cost Effeficiency Model Outcomes
Table 1. Traditional Pathway
Item Value
1. Cost of Traditional Pathway Starting at Pre-Algebra $202,001
2. Cost of Traditional Pathway Starting at Elementary Algebra $213,992
3. Cost of Traditional Pathway Starting at Intermediate Algebra $177,949
4. Cost of Traditional Pathway Starting at Transfer-Level $53,984
5. Total Cost of Traditional Pathway, Including Transfer Math Course $647,926
6. Entering Cohort Size at Scale 1,000
7. Number of entering cohort completing transferrable course, Tradtional Pathway
262
8. Overall entering cohort completion rate of transferrable course, Traditional pathway
26%
9. Cost / completer, Traditional Pathway $2,470
10.Cost of Pre-transfer Sequence in Traditional Pathway $462,330
11.Cost of Transfer Math Courses in Traditional Pathway $185,596
12. Percentage of Cost in Pre-Transfer Courses, Traditional Pathway 71%
13. Percentage of Cost in Transfer Math Courses, Traditional Pathway 29%
Table 2. CAP Pathway
Item Value
1. Cost of CAP Pathway Starting at All Pre-Transfer Levels $535,226
2. Cost of CAP Pathway Starting at Transfer-Level (not considering repeats) $36,785
3. Total cost of CAP Pathway, Including Transfer Course $572,011
4. Entering Cohort Size at Scale (from above) 1,000
5. Number of entering cohort completing transferrable course, CAP Pathway
440
6. Overall entering cohort completion rate of transferrable course, CAP pathway
44%
7. Cost / completer, CAP Pathway $1,301
8. Cost of Pre-transfer Sequence in CAP Pathway $303,479
9. Cost of Transfer Math Courses in CAP Pathway $268,533
10. Percentage of Cost in Pre-Transfer Courses, Traditional Pathway 53%
11. Percentage of Cost in Transfer Math Courses, Traditional Pathway 47%
Table 3. Summary of Key Findings
Outcome Traditional
1. Blended Entering Cohort Completion Rate of Transfer-Level Math Course 26%
2. Total cost of Pathway, Including Transfer Course $647,926
3. Cost of Pre-Transfer Math Courses in Pathway $462,330
4. Cost per Completer of Transfer-Level Math Course $2,470
5. Percentage of Cost in Pre-Transfer Math Courses 71%
Table 4. Savings to StudentsNote: Savings to Students assumes that CAP saves students full semesters by accelerating them through dev ed more quickly.
Item Value
1. Semesters to Degree for Traditional Students 9.0
2. Semesters to Degree for CAP Students 7.0
3. Semesters Saved for CAP Students 2.0
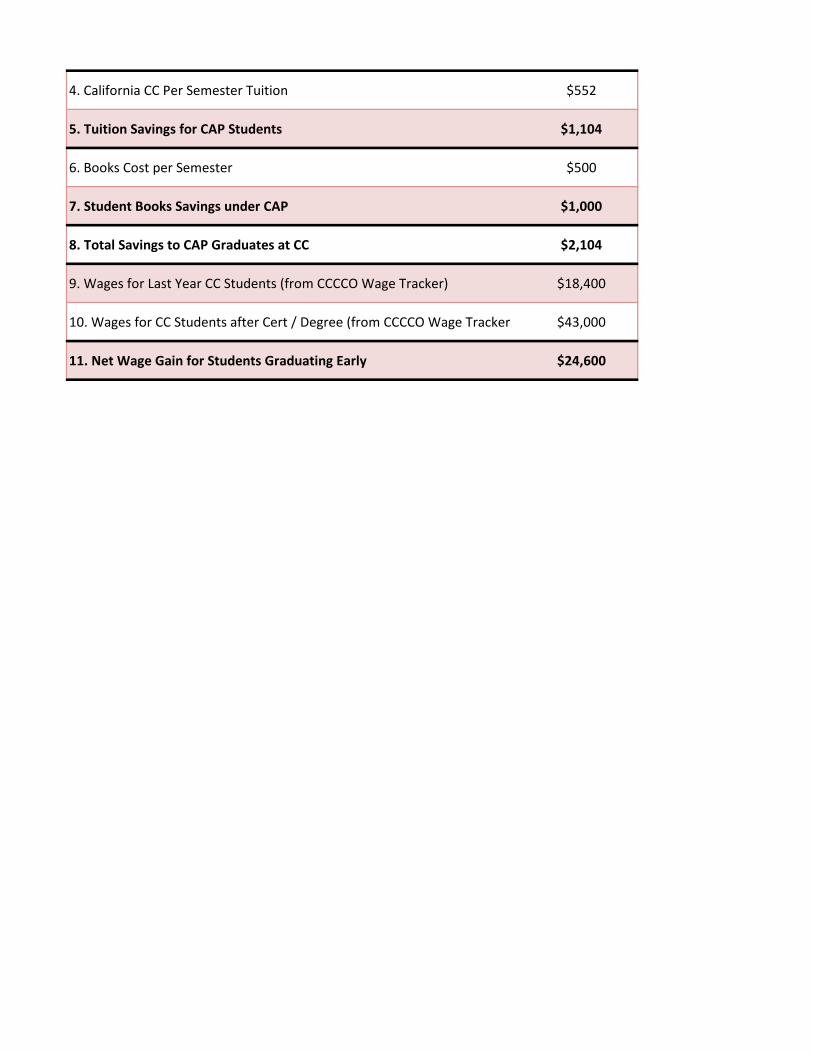
4. California CC Per Semester Tuition $552
5. Tuition Savings for CAP Students $1,104
6. Books Cost per Semester $500
7. Student Books Savings under CAP $1,000
8. Total Savings to CAP Graduates at CC $2,104
9. Wages for Last Year CC Students (from CCCCO Wage Tracker) $18,400
10. Wages for CC Students after Cert / Degree (from CCCCO Wage Tracker $43,000
11. Net Wage Gain for Students Graduating Early $24,600

s
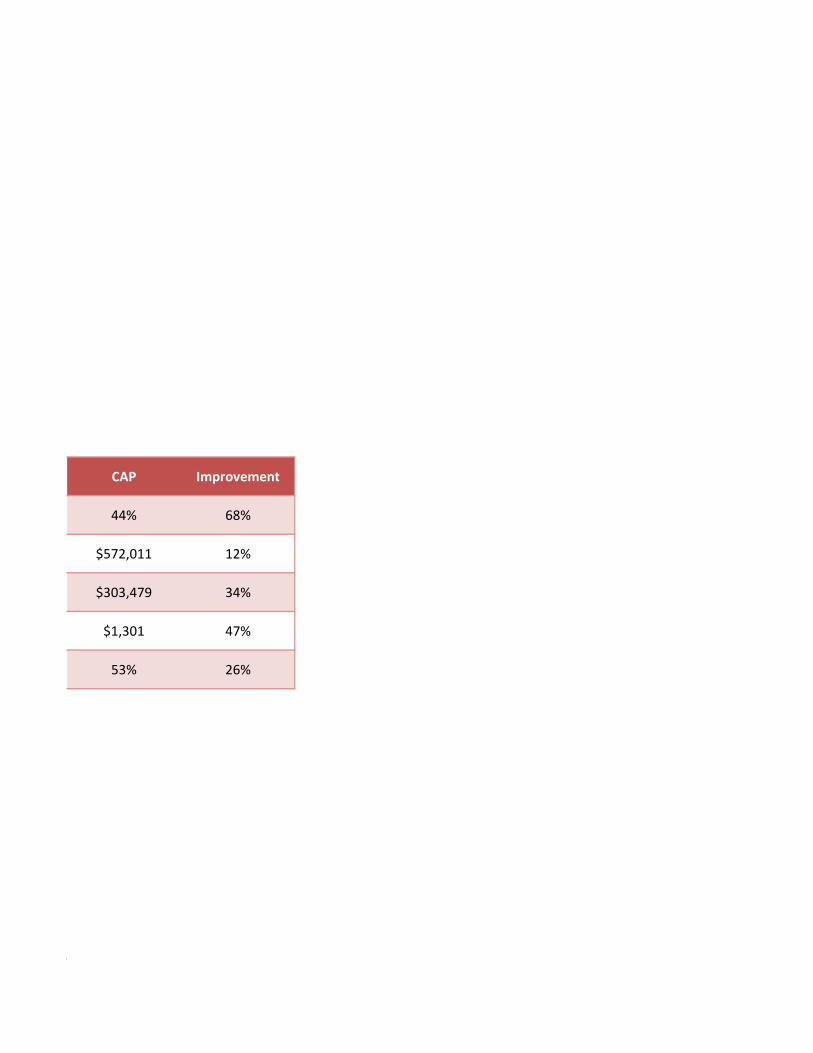
CAP Improvement
44% 68%
$572,011 12%
$303,479 34%
$1,301 47%
53% 26%
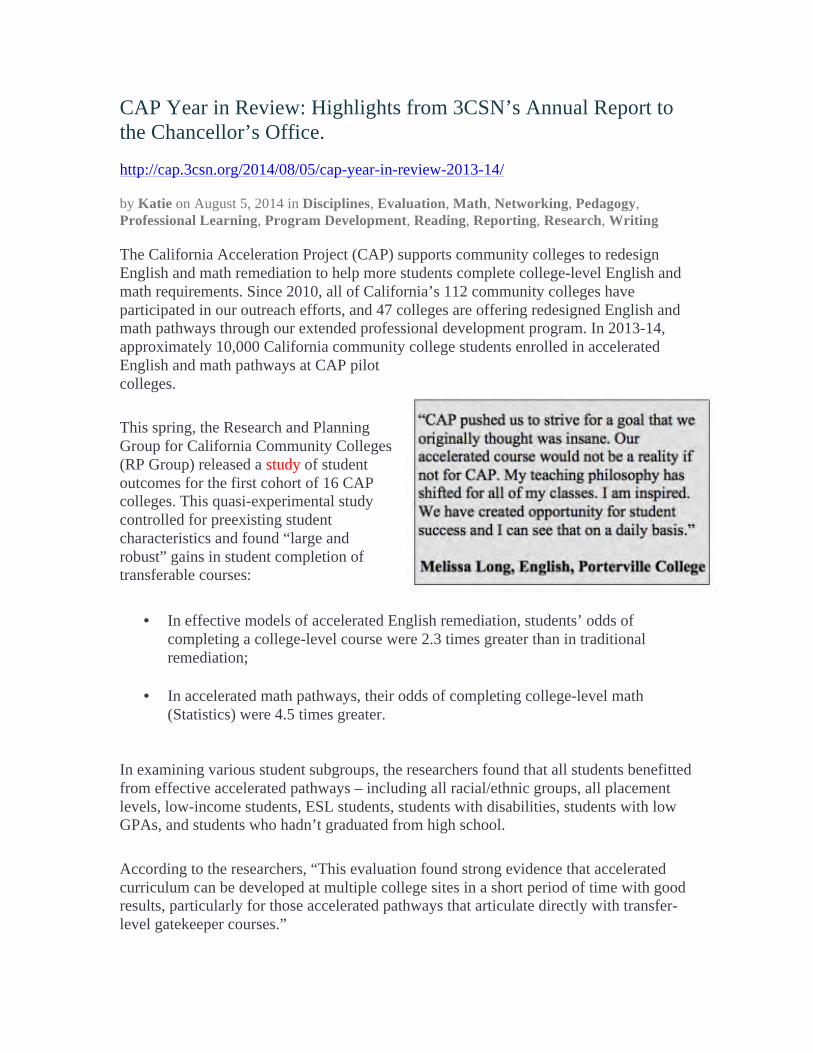
CAP Year in Review: Highlights from 3CSN’s Annual Report to the Chancellor’s Office.
http://cap.3csn.org/2014/08/05/cap-year-in-review-2013-14/
by Katie on August 5, 2014 in Disciplines, Evaluation, Math, Networking, Pedagogy, Professional Learning, Program Development, Reading, Reporting, Research, Writing The California Acceleration Project (CAP) supports community colleges to redesign English and math remediation to help more students complete college-level English and math requirements. Since 2010, all of California’s 112 community colleges have participated in our outreach efforts, and 47 colleges are offering redesigned English and math pathways through our extended professional development program. In 2013-14, approximately 10,000 California community college students enrolled in accelerated English and math pathways at CAP pilot colleges.
This spring, the Research and Planning Group for California Community Colleges (RP Group) released a study of student outcomes for the first cohort of 16 CAP colleges. This quasi-experimental study controlled for preexisting student characteristics and found “large and robust” gains in student completion of transferable courses:
• In effective models of accelerated English remediation, students’ odds of completing a college-level course were 2.3 times greater than in traditional remediation;
• In accelerated math pathways, their odds of completing college-level math (Statistics) were 4.5 times greater.
In examining various student subgroups, the researchers found that all students benefitted from effective accelerated pathways – including all racial/ethnic groups, all placement levels, low-income students, ESL students, students with disabilities, students with low GPAs, and students who hadn’t graduated from high school.
According to the researchers, “This evaluation found strong evidence that accelerated curriculum can be developed at multiple college sites in a short period of time with good results, particularly for those accelerated pathways that articulate directly with transfer-level gatekeeper courses.”
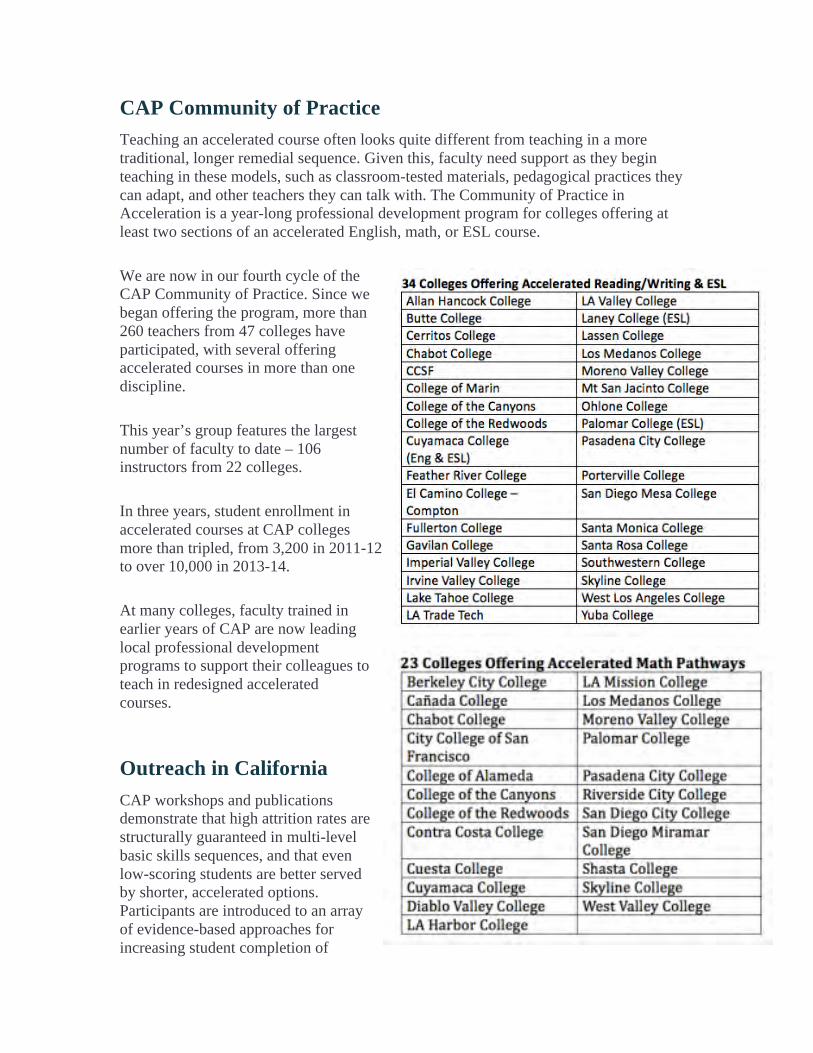
CAP Community of Practice Teaching an accelerated course often looks quite different from teaching in a more traditional, longer remedial sequence. Given this, faculty need support as they begin teaching in these models, such as classroom-tested materials, pedagogical practices they can adapt, and other teachers they can talk with. The Community of Practice in Acceleration is a year-long professional development program for colleges offering at least two sections of an accelerated English, math, or ESL course.
We are now in our fourth cycle of the CAP Community of Practice. Since we began offering the program, more than 260 teachers from 47 colleges have participated, with several offering accelerated courses in more than one discipline.
This year’s group features the largest number of faculty to date – 106 instructors from 22 colleges.
In three years, student enrollment in accelerated courses at CAP colleges more than tripled, from 3,200 in 2011-12 to over 10,000 in 2013-14.
At many colleges, faculty trained in earlier years of CAP are now leading local professional development programs to support their colleagues to teach in redesigned accelerated courses.
Outreach in California CAP workshops and publications demonstrate that high attrition rates are structurally guaranteed in multi-level basic skills sequences, and that even low-scoring students are better served by shorter, accelerated options. Participants are introduced to an array of evidence-based approaches for increasing student completion of
transferable English and math requirements, including placement policy changes, compressed courses, and redesigned pathways.
CAP workshops are rated highly by participants. At the spring 2014 regional workshop at West Los Angeles College, 94% of evaluations rated the event “Excellent” or “Good.” At the spring 2014 workshop at Chabot College, 100% of evaluations rated the event “Excellent” or “Good.”
CAP leaders gave an average of 2 presentations per month in California during the 2013-14 academic year, including:
• The Strengthening Student Success Conference
• USC Center for Urban Education: The Institute for Equity, Effectiveness, and Excellence at Hispanic-Serving Institutions
• One-Day Acceleration Workshops in the Bay Area, Los Angeles, and Central Valley regions
• Three events for community college trustees and presidents hosted by the Community College League of California
• CMC3 Math Conference • Two briefings for policy makers in Sacramento • American Association of Hispanics in Higher Education, Student Success
Institute • Statewide meeting of articulation officers for community colleges, UC, and CSU • Math remediation summit hosted by 20 Million Minds Foundation
National Outreach The work of the California Acceleration Project has been spotlighted by several national organizations focused on increasing college completion, including Complete College America, the Education Commission of the States, Achieving the Dream, and the Community College Research Center. Through ongoing partnerships with these organizations, CAP leaders have addressed education and policy leaders from more than 40 states to date. They have also led statewide remediation reform workshops in 14 states. This year’s national outreach included:
• Washington DC Policy Briefing: “Transforming Remediation to Improve Post-Secondary Attainment”
• National Webinar: “Transforming Remediation: Understanding the Research,
Policy, and Practice” • National Webinar hosted by Education First • Achieving the Dream Annual Conference • A Convening of 10 States: Countdown to 2015 – Developmental Strategies to
Address Readiness in the Common Core Era • American Association of Community Colleges: CAP Co-Founder Myra Snell
honored as one of four finalists for the national faculty innovation award • 6th Annual National Conference on Acceleration in Developmental Education • Convenings of community colleges in Minnesota, Florida, Washington, Colorado,
Oregon, West Virginia, and Pennsylvania
Research and Publications In 2013-14, a number of publications and research studies focused on the California Acceleration Project and its participating colleges, including
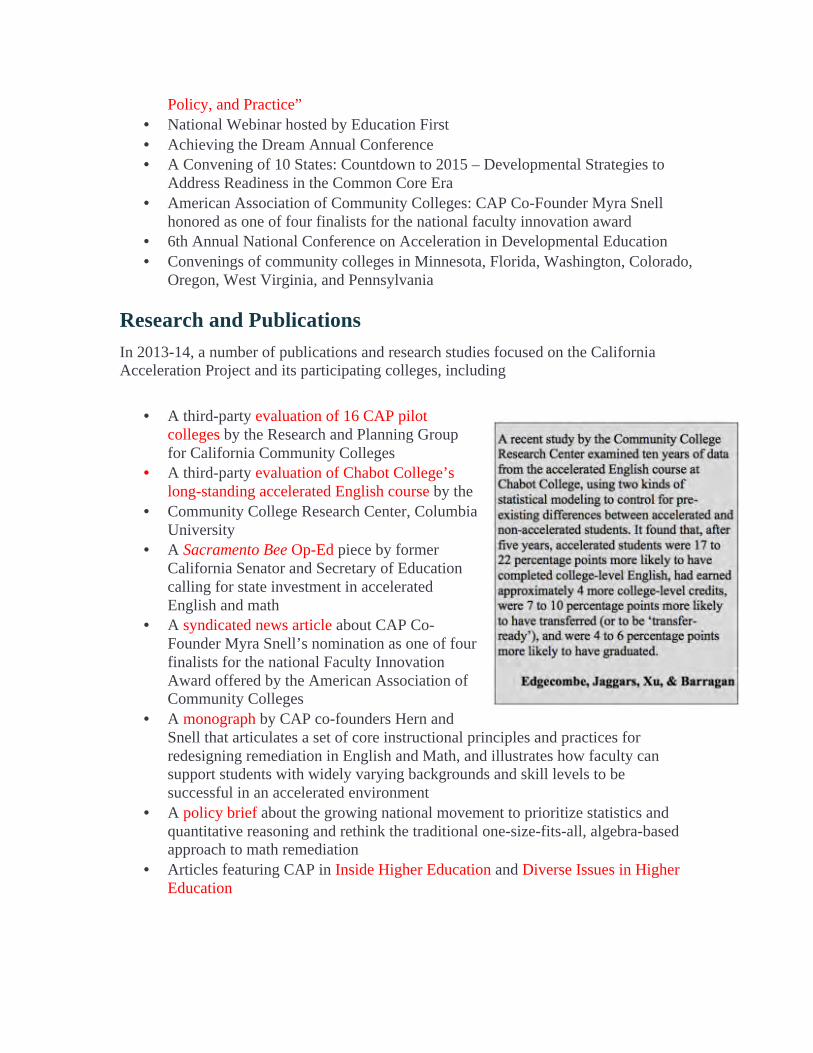
• A third-party evaluation of 16 CAP pilot colleges by the Research and Planning Group for California Community Colleges
• A third-party evaluation of Chabot College’s long-standing accelerated English course by the
• Community College Research Center, Columbia University
• A Sacramento Bee Op-Ed piece by former California Senator and Secretary of Education calling for state investment in accelerated English and math
• A syndicated news article about CAP Co-Founder Myra Snell’s nomination as one of four finalists for the national Faculty Innovation Award offered by the American Association of Community Colleges
• A monograph by CAP co-founders Hern and Snell that articulates a set of core instructional principles and practices for redesigning remediation in English and Math, and illustrates how faculty can support students with widely varying backgrounds and skill levels to be successful in an accelerated environment
• A policy brief about the growing national movement to prioritize statistics and quantitative reasoning and rethink the traditional one-size-fits-all, algebra-based approach to math remediation
• Articles featuring CAP in Inside Higher Education and Diverse Issues in Higher Education
BaselineMath Transfer level Success rate Trad remediation Completion rate Accel remediationBCC 0.32 0.76 0.61 0.32 0.07COC 0.23 0.78 0.66 0.4 0.11LMC 0.19 0.8 0.77 0.27 0.04Skyline 0.23 0.7 0.73 0.34 0.04
0.23 0.695 0.055EnglishCOC 0.23 0.86 0.64 0.53 0.13IVC 0.17 0.86 0.59 0.31 0.24LMC 0.19 0.85 0.78 0.4 0.03Skyline 0.23 0.82 0.47 0.49 0.3
0.21 0.615 0.185
2015-2016Math Transfer level Success rate Trad remediation Completion rate Accel remediationBCC 0.32 0.76 0.544 0.32 0.136COC 0.23 0.78 0.616 0.4 0.154LMC 0.19 0.8 0.648 0.27 0.162Skyline 0.23 0.7 0.616 0.34 0.154
0.23 0.616 0.154EnglishCOC 0.23 0.86 0.616 0.53 0.154IVC 0.17 0.86 0.59 0.31 0.24LMC 0.19 0.85 0.648 0.4 0.162Skyline 0.23 0.82 0.47 0.49 0.3
0.21 0.603 0.201
2016-2017Math Transfer level Success rate Trad remediation Completion rate Accel remediationBCC 0.4 0.76 0.45 0.32 0.15COC 0.4 0.78 0.45 0.4 0.15LMC 0.4 0.8 0.45 0.27 0.15Skyline 0.4 0.7 0.45 0.34 0.15
EnglishCOC 0.5 0.86 0.3 0.53 0.2IVC 0.5 0.86 0.26 0.31 0.24LMC 0.5 0.85 0.3 0.4 0.2Skyline 0.5 0.82 0.2 0.49 0.3
2017-2018Math Transfer level Success rate Trad remediation Completion rate Accel remediationBCC 0.4 0.76 0.35 0.32 0.15COC 0.4 0.78 0.35 0.4 0.15LMC 0.4 0.8 0.35 0.27 0.15Skyline 0.4 0.7 0.35 0.34 0.15
EnglishCOC 0.5 0.86 0.2 0.53 0.2IVC 0.5 0.86 0.16 0.31 0.24LMC 0.5 0.85 0.2 0.4 0.2Skyline 0.5 0.82 0.1 0.49 0.3
2018-2019Math Transfer level Success rate Trad remediation Completion rate Accel remediationBCC 0.4 0.76 0.25 0.32 0.15COC 0.4 0.78 0.25 0.4 0.15LMC 0.4 0.8 0.25 0.27 0.15Skyline 0.4 0.7 0.25 0.34 0.15
EnglishCOC 0.5 0.86 0.1 0.53 0.2IVC 0.5 0.86 0.06 0.31 0.24LMC 0.5 0.85 0.1 0.4 0.2Skyline 0.5 0.82 0 0.49 0.3
Completion rate Co-requisite Success rate Overall completion Achievement Gap0.55 0 0 0.48 2.20.46 0 0 0.49 30.65 0 0 0.39 1.70.46 0 0 0.43 1.5
0.455
0.61 0 0 0.62 1.60.67 0 0 0.49 1.40.53 0 0 0.49 1.40.53 0 0 0.58 1.2
0.535
Completion rate Co-requisite Success rate Overall completion Achievement Gap0.55 0 0 0.49 2.20.46 0 0 0.5 2.90.65 0 0 0.43 1.70.46 0 0 0.44 1.5
0.465
0.61 0 0 0.62 1.60.67 0 0 0.49 1.40.53 0 0 0.51 1.40.53 0 0 0.58 1.2
0.545
Completion rate Co-requisite Success rate Overall completion Achievement Gap0.55 0 0 0.53 1.80.46 0 0 0.56 2.50.65 0 0 0.54 1.40.46 0 0 0.5 1.2
0.535
0.61 0 0 0.71 1.30.67 0 0 0.67 1.20.53 0 0 0.65 1.20.53 0 0 0.67 1
0.67
Completion rate Co-requisite Success rate Overall Completion Achievement Gap0.55 0.1 0.76 0.57 1.70.46 0.1 0.78 0.6 2.30.65 0.1 0.8 0.59 1.30.46 0.1 0.7 0.54 1.2
0.58
0.61 0.1 0.86 0.74 1.20.67 0.1 0.86 0.73 1.10.53 0.1 0.85 0.7 1.10.53 0.1 0.82 0.7 1
0.715
Completion rate Co-requisite Success rate Overall completion Achievement Gap0.55 0.2 0.76 0.62 1.60.46 0.2 0.78 0.64 2.20.65 0.2 0.8 0.65 1.20.46 0.2 0.7 0.57 1.1
0.63
0.61 0.2 0.86 0.78 1.20.67 0.2 0.86 0.78 10.53 0.2 0.85 0.74 10.53 0.2 0.82 0.73 1
0.76
B: % assessing in transfer level; ScoreCard: 2007-2008 completion prepared cohort divided by C: Success rate transfer level course; Basic Skills Cohort Tracker (Fall 2012 tracked through Fa D: % in traditional remediation; ScoreCard: 2007-2008 completion remedial cohort divided by E: Completion rate of transferable course for those starting in remediation; ScoreCard: 2007- F: % in accelerated remediation; ScoreCard: 2007-2008 completion remedial cohort divided b G: Completion rate of transferable course for those starting in accelerated remediation; Basic H: % placed into transfer level with concurrent co-requisite supportI: Success rate in transfer level course (I=C)J: % completing transferable course in one yearK: ratio of completion rate for Whites to completion rate for lowest performing group that co
2015-2016: Increase accelerated remediation to accommodate 20% of those in remediation
K: Achievement gap decreases by 2% from baseline. This estimate is based on the narrowing o
2016-2017: Changes to placement policies with downsizing of traditional remediation
K: Acheivement gap decreases an additional 15% from baseline. This estimate is based on the
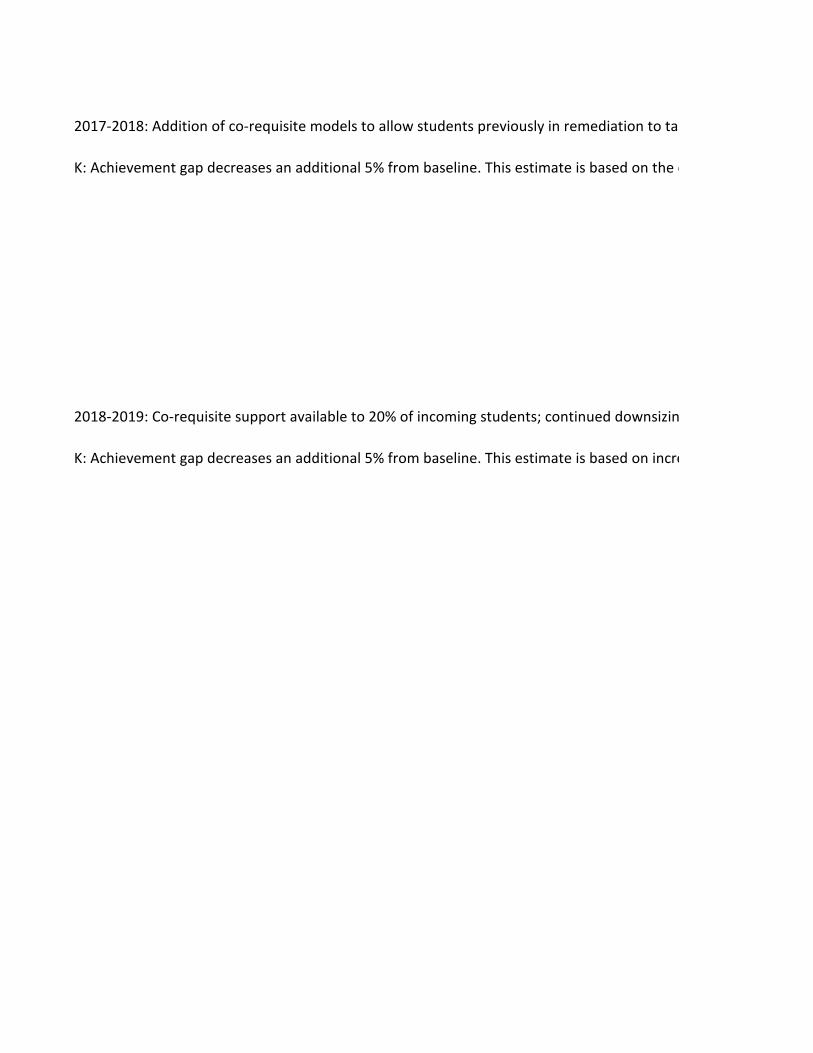
2017-2018: Addition of co-requisite models to allow students previously in remediation to ta
K: Achievement gap decreases an additional 5% from baseline. This estimate is based on the d
2018-2019: Co-requisite support available to 20% of incoming students; continued downsizin
K: Achievement gap decreases an additional 5% from baseline. This estimate is based on incre
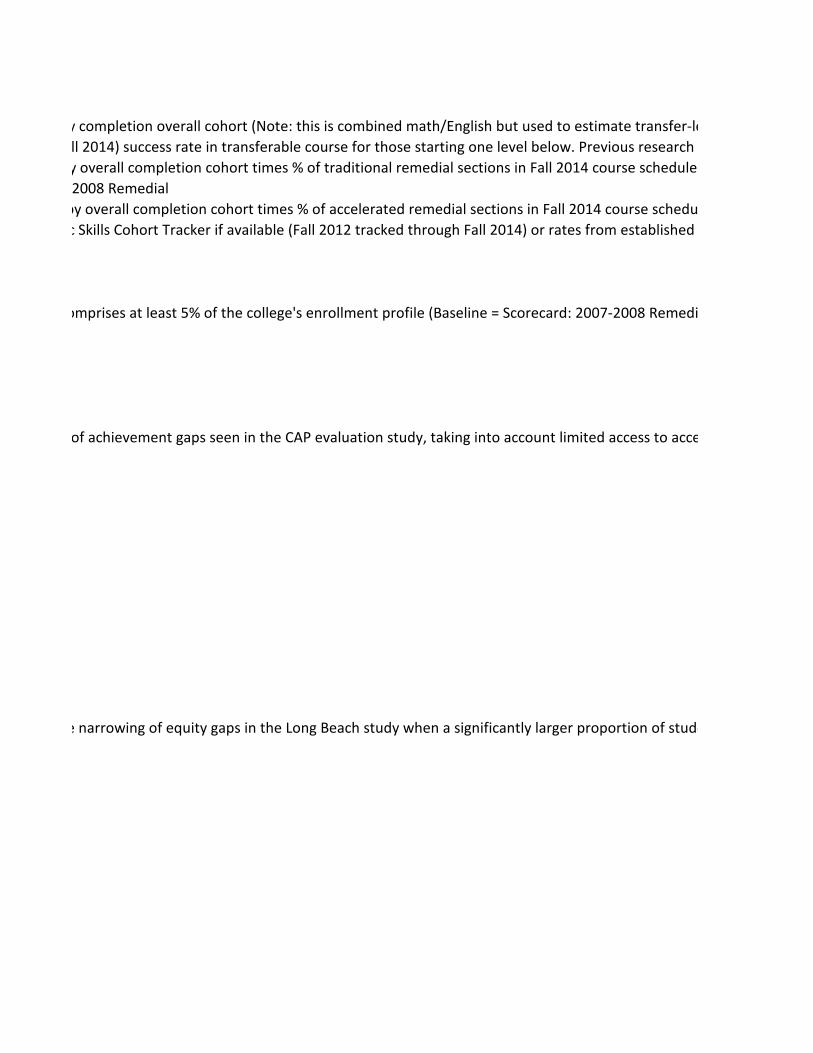
y completion overall cohort (Note: this is combined math/English but used to estimate transfer-le ll 2014) success rate in transferable course for those starting one level below. Previous research a y overall completion cohort times % of traditional remedial sections in Fall 2014 course schedule 2008 Remedial by overall completion cohort times % of accelerated remedial sections in Fall 2014 course schedu c Skills Cohort Tracker if available (Fall 2012 tracked through Fall 2014) or rates from established
omprises at least 5% of the college's enrollment profile (Baseline = Scorecard: 2007-2008 Remedi
of achievement gaps seen in the CAP evaluation study, taking into account limited access to acce
e narrowing of equity gaps in the Long Beach study when a significantly larger proportion of stude
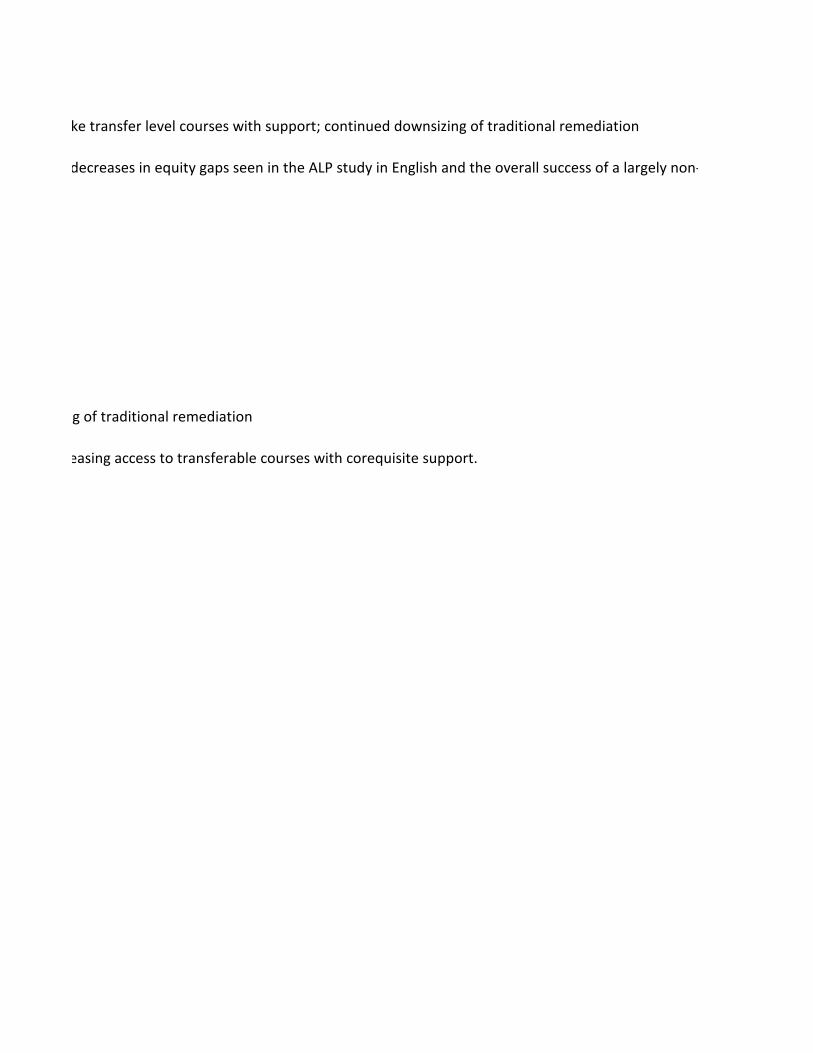
ke transfer level courses with support; continued downsizing of traditional remediation
decreases in equity gaps seen in the ALP study in English and the overall success of a largely non-
g of traditional remediation
easing access to transferable courses with corequisite support.

evel placement into each discipline) at Chabot and LMC suggests that this is a good estimate for the success rate in the transferable c
le programs at Chabot College for English (376/710=53%) and College of the Canyons for math (95/
al)
elerated remediation.
ents are placed into transferable courses.

-White sample in the CUNY experiment in math, taking into account limited access to corequisite

course for those who assess directly in (repeats included)
/208=46%)

e support.