Embed Size (px)
Citation preview
Studies of Charge Transport Processes
in Dye-Sensitized Solar Cells
by
Kristofer Fredin

ii

iii
Abstract Fredin, K. 2007. “Studies of Charge Transport Processes in Dye-Sensitized Solar Cells” Doctoral Thesis, Kungliga Tekniska Högskolan, Skolan för Kemivetenskap, Institutionen för Kemi Dye-sensitized solar cells (DSCs) have attained considerable attention during the last decade because of the potential of becoming a low cost alternative to silicon based solar cells. Although efficiencies exceeding 10% in full sunlight have been presented, major improvements of the system are however limited. Electron transport is one of the processes in the cell and is of major importance for the overall performance. It is further a complex process because the transport medium is a mesoporous film and the pores are completely filled by an electrolyte with high ionic strength, resulting in electron-ion interactions. Therefore, present models describing electron transport include simplifications, which limit the practical use, in terms of improving the DSC, because the included model parameters usually have an effective nature. This thesis focuses in particular on the influence of the mesoporous film on electron transport and also on the influence of electron-ion interactions. In order to model diffusion, which is assumed to be the transport process for electrons in the DSC, Brownian motion simulations were performed and spatial restrictions, representing the influence of the mesoporous film, were introduced by using representative models for the structure. The simulations revealed that the diffusion coefficient is approximately half the value for electrons and ions in mesoporous systems. To study the influence of ions, a simulation model was constructed in where electric fields were calculated with respect to the net charge densities, resulting from the different charge carrier distributions. The simulations showed that electron transport is highly dependent on the nature of the ions, supporting an ambipolar diffusion transport model. Experimentally, it was found that the transport process is dependent on the wavelength of the incident light; we found that the extracted current was composed of two components for green light illumination, one fast and one slow. The slow component showed similar trends as the normal current. Also we found that the transport coefficient scaled linearly with film thickness for a fixed current, which questions diffusion as transport process. Other experiments, investigating various effects in the DSC, such as the effect of different cations in the electrolyte, are also presented. Keywords: solar cell, mesoporous, dye-sensitized, model, simulation, electron transport, trap distribution TRITA-CHE-Report 2007-12 ISSN 1654-1081 ISBN 978-91-7178-602-9

iv
List of papers This summary is based on the following papers, which will be referred to in the text by their Roman numerals. I. “Brownian dynamics simulations of electrons and ions in
mesoporous films” K. Fredin, J. Nissfolk & A. Hagfeldt Sol. Energy Mat. Sol. Cells 86 (2005) 283-297 II. “Studies of coupled charge transport in dye-sensitized solar cells
using a numerical simulation tool” K. Fredin, S. Rühle, C. Grasso and A. Hagfeldt Sol. Energy Mat. Sol. Cells 90 (2006) 1915-1927 III. “Recombination and transport processes in dye-sensitized solar
cells investigated under working conditions” J. Nissfolk, K. Fredin, A. Hagfeldt & G. Boschloo J. Phys. Chem. B 110 (2006) 17715-17718 correction, J. Phys. Chem. B 110 (2006) 22950 IV. “The Influence of Cations on Charge Accumulation in Dye-
Sensitized Solar Cells” K. Fredin, J. Nissfolk, G. Boschloo & A. Hagfeldt submitted to J. Electroanal. Chem. V. “On the Influence of Anions in Ionic-Liquid Electrolytes for
Monolithic Dye-Sensitized Solar Cells” K. Fredin, M. Gorlov, G. Boschloo, H. Pettersson, A. Hagfeldt & L. Kloo submitted to the J. Phys. Chem. C VI. “Influence of TiO2 Film Thickness and Illumination Wavelength
on Electron Transport in Dye-Sensitized Solar Cells” K. Fredin, L. Häggman, A. Hagfeldt & G. Boschloo manuscript

v
Comments on my own contribution I carry the main responsibility for papers I, II & IV, i.e., I had the main responsibility for the simulations, experiments, data analysis and manuscripts. In paper III, I took part of the discussion. In paper V, I had responsibility for the electron transport and recombination measurements and I participated in the manuscript preparation. In paper VI, I had responsibility for the electron transport measurements and in the manuscript preparation.

vi
Abbreviations and symbols DSC dye-sensitized solar cell IPCC international panel on climate change EU European union AM air mass VB valence band CB conduction band Eg bandgap enery Eph photon energy h Planck constant ν photon frequency c speed of light λ wavelength
−e electron concentration −CBe concentration of conduction band electrons −TRAPe concentration of trapped electrons +VBh concentration of valence band holes
σ conductivity or conductivity exponent μe electron mobility q elementary charge EF Fermi level nEF quasi Fermi level r hydrodynamic radius or cell radius n ionic charge or number of electrons F Faraday constant ci concentration kB Boltzmann constant T absolute temperature Uredox redox potential U0’ redox formal potential CH capacitance associated to Helmholtz layer C capacitance term WE working electrode CE counter electrode

vii
EE electrolyte/electrode TCO transparent conducting oxide P porosity D0 dye D* excited dye D+ oxidized dye Deff effective electron diffusion coefficient Damb ambipolar diffusion coefficient Dbulk bulk diffusion coefficient Dp diffusion coefficient for holes J current V voltage OC open-circuit SC short-circuit JSC short-circuit current VOC open-circuit voltage Pout output power Pmax maximum power Pin power of incident light A area η power conversion efficiency or viscosity ηabs absorption efficiency ηinj injection efficiency ηcoll collection efficiency ff fill factor IPCE incident photon to current conversion efficiency IV current-voltage VD voltage decay VQ voltage-charge TOF time of flight SSQM small square wave modulations tTOF time for current maximum d film thickness τe electron lifetime τtr transport time coefficient

viii
τrec recombination time coefficient τfast transport time coefficient for fast component τslow transport time coefficient for slow component ΔV magnitude of voltage modulation ΔJ magnitude of current modulation ΔJfast magnitude of fast current modulation ΔJslow magnitude of slow current modulation φ photon flux E electric field α extinction coefficient
ix
Contents 1. Introduction.................................................................................... 1 1.1. The need for renewable energy....................................... 1 1.2. Solar cells........................................................................ 3 1.3. The dye-sensitized solar cell........................................... 4 1.4. The aim with this summary............................................. 5 2. Photoelectrochemistry, an overview.............................................. 7 2.1. The semiconductor.......................................................... 7 2.2. The electrolyte.................................................................10 2.3. The semiconductor/electrolyte junction.......................... 11 3. Design and working principles of the DSC....................................14 4. Experimental techniques................................................................ 19 4.1. IV and IPCE.................................................................... 19
4.2. Time of flight (TOF)....................................................... 23 4.3. Voltage decay (VD)........................................................ 24 4.4. Voltage-charge (VQ)...................................................... 26
4.5. Small square-wave modulations (SSWM)...................... 28 5. Charge transport in dye-sensitized solar cells................................ 31 5.1. Traps............................................................................... 32 5.2. Diffusion/ambipolar diffusion........................................ 34
5.3. Modelling diffusion in mesoporous films....................... 35 5.4. Modelling the influence of ions on electron transport.... 38 6. Concluding remarks....................................................................... 42 7. Sammanfattning på svenska .......................................................... 43 8. Acknowledgements........................................................................ 48 9. References...................................................................................... 49 .


1
1. Introduction This summary introduces general aspects of the need for renewable energy and solar cells. It focuses on a particular solar cell technology, namely dye-sensitized solar cells (DSCs). It is written for an audience with a graduate background in chemistry and physics but without any deeper knowledge of solar cells. The summary is constructed as follows: First, the evolution of the DSC concept and the background to this thesis are presented. The relevant electrochemistry is then reviewed, and the working principles of the DSC are described. I next provide an overview of the experimental techniques encountered when researching DSC devices and of typical DSC responses. Thereafter, charge transport in DSCs is examined in greater detail together with modelling studies describing this process. Finally, after some concluding remarks, the science involved is described in more accessible terms in Swedish. The thesis also includes the associated papers, which are attached last.
1.1. The need for renewable energy
At the beginning of February, 2007, the Intergovernmental Panel on Climate Change (IPCC) presented a report1 concluding that global concentrations of carbon dioxide, methane and nitrous oxide have increased markedly as a result of human activities since 1750. The report states that the increase in carbon dioxide, the most important greenhouse gas, is primarily due to fossil fuel use. As for the increases in methane and nitrous oxide levels, however, the report states that these are primarily due to agriculture. The report further indicates that the increased concentrations of carbon dioxide, methane, and nitrous oxide have increased the average global temperature, a phenomenon known as “global warming”. Averaged over time, the rate of temperature increase has doubled over the last 50 years (0.13 ºC per decade) compared to that of the last 100 years, and in total, the average global temperature has increased by 0.76 ºC since the beginning of the twentieth century. The last years rank amongst the warmest on record, the last 12 years
2
accounting for the 11 warmest years in the instrumental record of global surface temperatures (since 1850). The report finally predicts that the average global temperature will increase between 0.6 and 4.0 ºC in the coming 100 years, depending on model parameters such as world population growth, primary energy source, and economic growth.1 The consequences of global warming in the twentieth century include an increased melting of snow and ice in the Arctic and Antarctic regions, and average Arctic temperatures have increased almost twice the global rate. Observations since 1961 also indicate that average ocean temperatures have increased to depths of at least 3000 m, causing the sea level to increase due to thermal expansion. The combined effects have increased the average sea level at a rate of 1.8 mm per year between 1961 and 2003, or 3.1 mm per year when calculated between 1993 and 2003.1 So far, the consequences of global warming can be viewed as relatively mild, but given continuous fossil fuel use and increasing world population, the average global temperature will most likely increase further. In the long-term, this can influence the climate zones and disturb well-established ecological systems. Eventually, if the temperature continues to increase, this will influence our everyday lives, since it changes the conditions of, for example, agriculture and fishing. Even though researchers long have indicated that fossil fuel use is related to global warming,2 the IPCC report is of particular importance since it is directly targets policymakers and politicians. A recent scheme, based on the IPCC report, to handle global warming was initiated by the EU at the beginning of March 2007.3 At that time, the EU decided that carbon dioxide emissions should decrease by 20% and that 20% of the energy produced in EU should originate from renewable energy sources, such as wind, water, biomass, and solar, no later than 2020. Considering that the amount of energy produced by renewable means in the EU today accounts for 6.5% of total energy production, the initiative indeed represents a leap forward towards a sustainable future.

3
1.2. Solar cells
The discovery of solar cells is usually credited to A. E. Becquerel, who discovered in the 1830s that a platinum or silver chloride electrode in contact with an electrolyte generated a voltage under illumination.4 Although the photoelectric effect was later explained by Einstein in 1905, it required an additional 36 years for the first solid state semiconductor p-n junction cell to be described in 1941 by Russel Ohl of Bell laboratories.5,6 The first silicon solar cell was thereafter developed by Chapin et al., also from Bell laboratories, in 1954.7 The cell, using silicon as its raw material, initially yielded an efficiency of 6%, which was rapidly increased to 10%.8 For many years, the main application of the technology was in space vehicle power supplies; the cost remained high, and the technology did not gain any significant public attention as an alternative energy source. Attention grew, however, in the 1970s, when oil prices rose as a consequence of the October war and ensuing troubles in the Middle-East. In the 1980s and 1990s, alternative energy sources such as wind, water, biomass and solar became more or less synonymous with renewable energy sources, largely because of the concerns connected with pollution and global warming prompted, for example, by the signing of the Kyoto Protocol.9 Today, renewable energy sources, including photovoltaic solar energy, are a hot topic, largely due to the IPCC report; it is interesting to note, however, that an earlier study done by Shell in 199710 predicted that renewable energy sources would increasingly and significantly contribute to overall energy production over the coming 60 years. The potential of using the sun as a primary energy source is enormous. It has been calculated that covering 0.1% of the earth’s surface area with solar cells of 10% efficiency, corresponding to 1% of desert areas or 20% of the area of buildings and roads, would provide for global electricity consumption.11 However, despite rapid growth in the use of solar cells in recent years,8 they today contribute 0.4% of annual world energy production together with geothermal, wind, and water.12
4
1.3. The dye-sensitized solar cell
More than 99% of the solar cells produced in 2001 were based on silicon in its crystalline and amorphous forms.8 Recently, however, other designs, such as thin film and multijunction solar cells, have displayed high efficiencies13 and can therefore be expected to take increasing market shares in coming years. Considering that the commercial application of solar cells is relatively recent, and that different solar cells technologies will likely continue to coexist due to their different markets, the field is, from a long-term perspective, open to new innovations. In the 1970s, studies of photoelectrochemical cells (PECs) by Fujishima and Honda found that titanium dioxide (TiO2) could split water with a small bias voltage when exposed to light.14 However, due to the large bandgap for TiO2, it only absorbs light in the ultraviolet region, implying that the conversion efficiency, when using the sun as the light source is low. To increase the efficiency, alternative metal oxides with more appropriate bandgaps were explored. Despite the rather acceptable efficiencies recorded with, for example, GaAs, photocorrosion degradation remained an unsolved problem; for this reason, interest in PEC solar cells declined in the 1980s.11,15 Pioneering research into dye-sensitizing semiconductor electrodes was done in the late 1960s by Tributsch and Gerisher.16-19 They found that dye molecules adsorbed on the surface of a wide bandgap semiconductor extended the absorption range of the system into the visible region. However, the absorption yield was still low, because flat electrodes were used and increasing the number of dye layers was not an option, since only a monolayer of dye molecules was photoactive. In 1985, Desilvestro et al., presented a rough-surfaced dye-sensitized electrode with an improved efficiency due to the increased amount of dye adsorbed on the increased surface area.20 By using a mesoporous electrode, the amount of adsorbed dye was increased even further and combined with an electrolyte containing the effective iodide/triiodide redox couple, a dye-sensitized solar cell (DSC) yielding almost 7% in
5
energy conversion efficiency was presented in 1991 by Brian O’Regan and Michael Grätzel.21 Today, record efficiencies above 11% have been presented22,23 at an illumination intensity of 1000 Wm-2, and the device displays promising stability data.24-26 It has been questioned, however, whether accelerated stability accurately represents the long-term performance27 and degradation of, for example the dye, has been indicated.28,29 However, the DSC is still relatively new, and could indeed become a possible low-cost competitor to Si-based solar cells, offering potentially high efficiencies. Especially given the increased attention to renewable energy sources, research into DSCs as complements to or replacements of conventional solar cells is important. 1.4. The aim with this summary
The word “meso” (i.e. middle, intermediate), used frequently in this work, refers to length scales of the order of ten to a few hundred nanometers (1 nm=10-9 m), and the term “mesoporous” is associated with average pore diameters between 2 and 50 nm. An example of a mesoporous structure is the working electrode of a DSC, which typically comprises many interconnected particles with individual sizes in the meso region. Furthermore, the size of this mesoporous structure is too large to allow the functioning of the DSC to be described using quantum mechanical methods and too small to obey the rigid theoretical framework that characterizes solids. This is the main reason why theories applying to ordinary p-n junction solar cells cannot be applied to DSCs. In the ensuing sections, theoretical and experimental aspects of the DSC will be presented, and the focus will eventually converge on the electron transport process. Electron transport is crucial in DSC research, because a fast and efficient transport mechanism limits the time an electron is subject to recombination (electron losses), and is hence related to cell

6
efficiency. The electron transport process in the DSC is complex to describe, because the transport medium is a mesoporous structure containing a number of apparently randomly interconnected nanoparticles. To improve our understanding of electron transport in the DSC, this summary focuses specifically on three aspects expected to influence the electron transport properties; these are • The influence of the mesoporous structure • The influence of interactions between electrons and ions • The influence of the spatial localization of electrons

7
2. Photoelectrochemistry, an overview This section contains an overview of the physics and chemistry of semiconductors and electrolytes, and of the junctions formed when they come into contact with each other. Even though this section focuses on bulk materials, the basic ideas can also be applied to mesoporous systems, for example, in DSC research. For more detailed descriptions, I suggest further reading in Bard and Faulkner, Memming, and Sze.30-32
2.1. The semiconductor
Solid materials can be categorized as conductors, insulators, or semiconductors, depending on their ability to transport electrical current. As the name suggests, a conductor carries electrical current well, whereas an insulator cannot carry a current at all. Between these extremes is the semiconductor, the ability of which to transport an electrical current depends on doping and other conditions. When a solid material forms, several atomic orbitals combine to form molecular orbitals, with a spacing between the discrete energy levels that decreases with increasing number of atoms. When the number of atoms is large enough, the discrete energy levels are usually described in terms of continuous energy bands. Some bands are filled, some are empty, and some are partly filled with electrons; depending on the overlap between individual bands, different conducting properties and hence material types can be distinguished. A metal has either a partly filled band or two overlapping bands, one of which is filled and the other empty, so electrons can move relatively freely. For semiconductors and insulators, however, there is a gap, i.e. a bandgap (Eg) between the energetically highest filled energy band, i.e., the valence band (VB), and the energetically lowest empty energy band, i.e., the conduction band (CB). If Eg is less than ~4.0 eV the material is a semiconductor, and if it is above ~4.0 eV, the material is an insulator. TiO2, usually the material of choice for DSCs, has a bandgap of 3.0 or

8
3.2 eV, depending on the crystal structure, i.e., rutile or anatase, respectively. Under normal circumstances, the CB is empty and the VB is filled, so a semiconductor cannot transport an electrical current. However, electrons can become excited from the VB to the CB by stimulating the semiconductor sample with light, provided the photon energy, Eph, matches or exceeds Eg. The photon energy can be calculated from the photon frequency, ν, and the Planck constant, h, or alternately from the speed of light, c, and the wavelength, λ, as in Eq. 1.
λ
ν hchE ph == (1)
From Eq. 1, one can calculate that wavelengths below 420 nm, i.e., in the ultraviolet region, are required to excite TiO2 electrons, which explains why TiO2 alone would be a poor solar light absorber. Physically, excitation implies that the concentration of conduction band electrons, −
CBe , increases together with the concentration of holes (electron vacancies) in the valence band, +
VBh . Charge transport comprises the electrons being transported in the CB, but it is also possible that an electrical current can arise in the VB due to the motion of the holes. In DSCs, the analogue to holes are the static oxidized dye molecules and the oxidized form in the redox couple. Therefore, only electrons in the CB play a role for transport in the TiO2. The conductivity, σ, of a semiconductor is directly related to −
CBe and +VBh via Eq. 2, where q is the elementary charge and μe and μh are the
mobilities of electrons and holes, respectively.
( )+− += VBhCBe heq μμσ (2) From Eq. 2, it can be determined that the conductivity of a semiconductor is low due to a normally low −
CBe . The conductivity can, however, be improved by introducing into the material atoms with
9
fewer or more valence electrons. This process is known as doping, and a doping fraction of 1/106 atoms can be sufficient to increase the conductivity significantly. In an undoped material, the Fermi level, EF, is approximately in the middle of the bandgap, which means that the probability of finding an electron at that energy is ½. By doping the material, the concentration of −
CBe or +VBh increases, shifting EF upwards
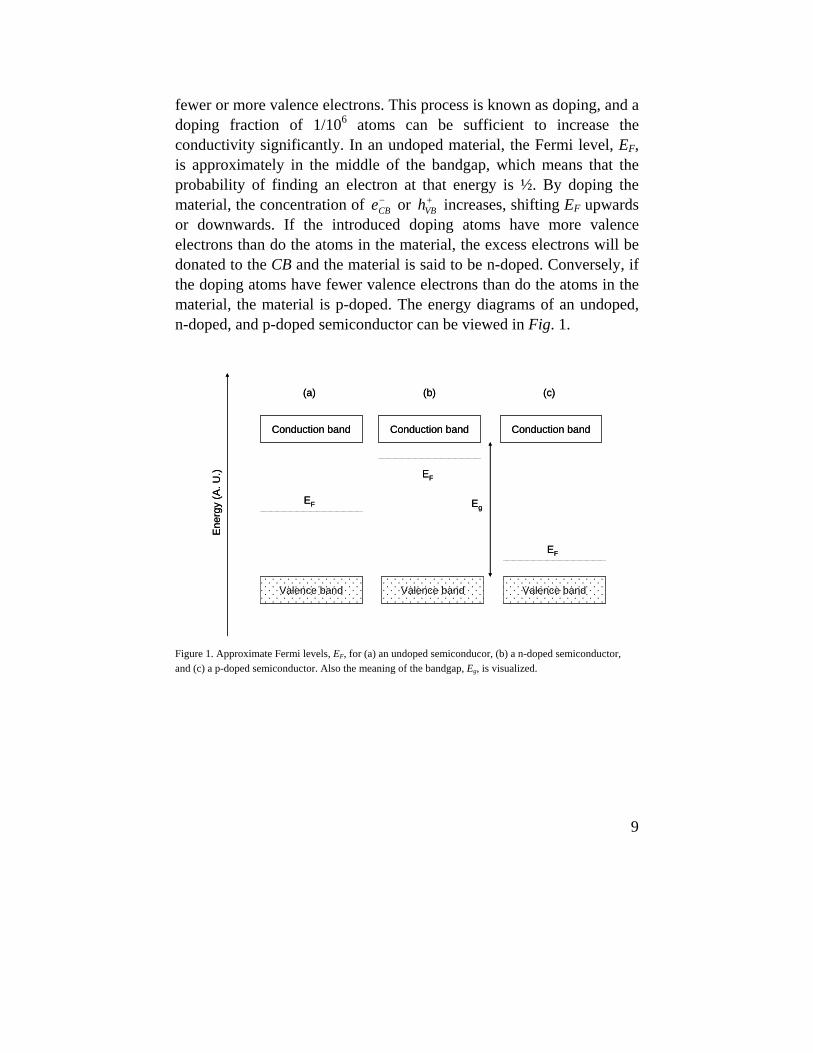
or downwards. If the introduced doping atoms have more valence electrons than do the atoms in the material, the excess electrons will be donated to the CB and the material is said to be n-doped. Conversely, if the doping atoms have fewer valence electrons than do the atoms in the material, the material is p-doped. The energy diagrams of an undoped, n-doped, and p-doped semiconductor can be viewed in Fig. 1.
Figure 1. Approximate Fermi levels, EF, for (a) an undoped semiconducor, (b) a n-doped semiconductor, and (c) a p-doped semiconductor. Also the meaning of the bandgap, Eg, is visualized.
Ene
rgy
(A. U
.)
Valence band Valence bandValence band
Conduction band Conduction band Conduction band
(a) (b) (c)
EF
EF
EF
Eg
Ene
rgy
(A. U
.)
Valence band Valence bandValence band
Conduction band Conduction band Conduction band
(a) (b) (c)
EF
EF
EF
Eg
10
2.2. The electrolyte
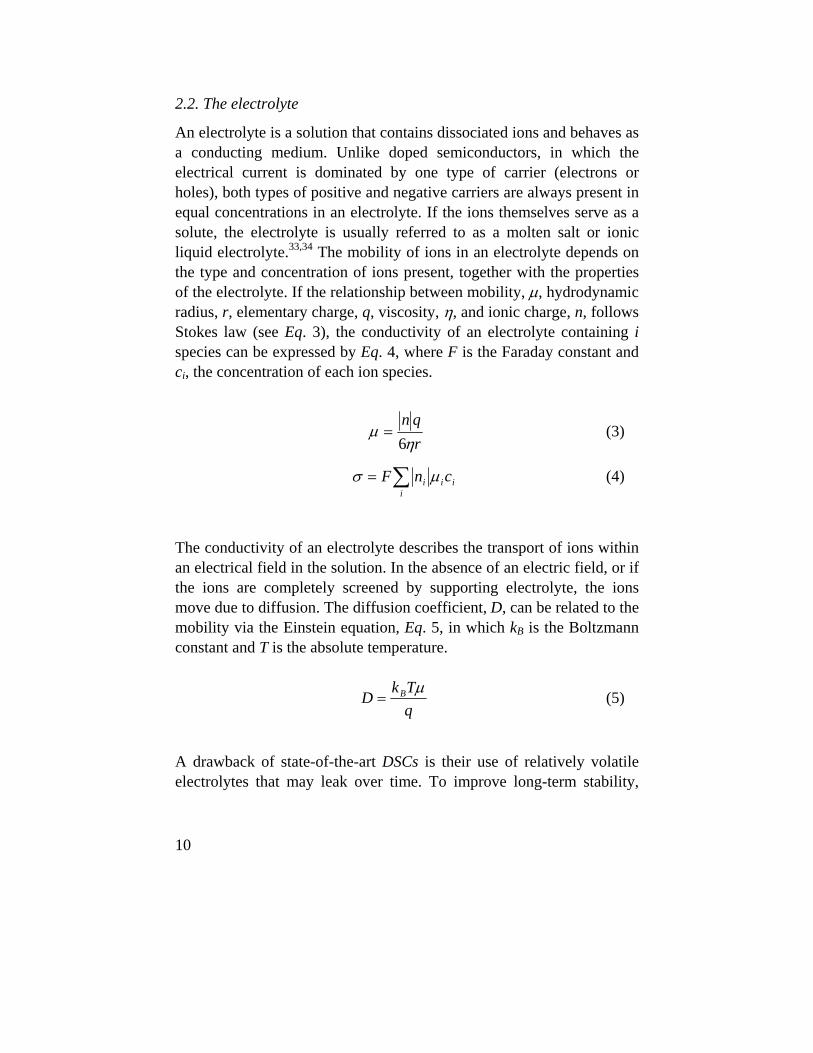
An electrolyte is a solution that contains dissociated ions and behaves as a conducting medium. Unlike doped semiconductors, in which the electrical current is dominated by one type of carrier (electrons or holes), both types of positive and negative carriers are always present in equal concentrations in an electrolyte. If the ions themselves serve as a solute, the electrolyte is usually referred to as a molten salt or ionic liquid electrolyte.33,34 The mobility of ions in an electrolyte depends on the type and concentration of ions present, together with the properties of the electrolyte. If the relationship between mobility, μ, hydrodynamic radius, r, elementary charge, q, viscosity, η, and ionic charge, n, follows Stokes law (see Eq. 3), the conductivity of an electrolyte containing i species can be expressed by Eq. 4, where F is the Faraday constant and ci, the concentration of each ion species.
rqnη
μ6
= (3)
∑=i
iii cnF μσ (4)
The conductivity of an electrolyte describes the transport of ions within an electrical field in the solution. In the absence of an electric field, or if the ions are completely screened by supporting electrolyte, the ions move due to diffusion. The diffusion coefficient, D, can be related to the mobility via the Einstein equation, Eq. 5, in which kB is the Boltzmann constant and T is the absolute temperature.
qTk
D B μ= (5)
A drawback of state-of-the-art DSCs is their use of relatively volatile electrolytes that may leak over time. To improve long-term stability,

11
experiments have been performed using ionic liquid electrolytes, which have a low vapor pressure, in DSCs.34,35 In paper V, we studied the effect of various anions in otherwise identical ionic liquid electrolytes for DSCs; for example, we found that the transport of triiodide ions displayed a non-Stokesian behavior, i.e., the relationship between mobility and viscosity did not follow Eq. 3. In a redox electrolyte, in which the I-/I3
- redox couple is commonly used in DSCs, electrical current is transported via the reduced, Red, and oxidized form, Ox, of the molecules. The potential of a redox couple, Uredox, can be measured against a reference electrode and calculated using the Nernst equation, Eq. 6, where '0U is the formal potential, cox and cred the concentrations of oxidized and reduced forms, respectively, and n the number of electrons transferred in the redox reaction.
red
oxBredox c
cnTk
UU ln'0 += (6)
2.3. The semiconductor/electrolyte junction
When a semiconductor is brought into contact with an electrolyte, electrons will flow through the junction until equilibrium is reached. If EF is larger than Uredox, electrons will flow from the semiconductor to the electrolyte until EF=Uredox. This transfer of electrons implies that the regions nearest the junction will have charge densities that differ from their individual bulk values. For the described situation, the region in which −
CBe is lower than the bulk value is referred to as the depletion layer. Alternately, if Uredox is greater than EF, electrons will flow from the electrolyte and electrons will be accumulated in the semiconductor, forming an accumulation layer. Both depletion and accumulation layers affect the band structures of the CB and the VB, but in different directions, a phenomenon known as band bending. A graphic presentation of band bending for a n-type semiconductor in contact with an electrolyte can be viewed in Fig. 2, see next page.

12
Figure 2. The band structures of a n-doped semiconductor before (a) and after (b) contact with an electrolyte. In the electrolyte, a double layer is formed near the semiconductor/electrolyte interface. The inner layer, better known as the Helmholtz layer, consists of ions adsorbed on the surface, whereas the outer layer is the more diffuse Gouy-Chapman layer. Usually, the capacitance of an electrolyte with high ionic strength is approximated by the capacitance of the Helmholtz layer, CH. Whenever depletion or accumulation layers exist, an electric field is present across the junction. This feature provides a foundation for conventional p-n junction solar cells, since it allows for efficient charge separation. The simplified working principle of such solar cells is that incident photons generate electrons and holes near the junction; these drift away from each other in opposite directions, allowing for efficient charge collection at the respective contacts.
The existence of band bending, and of the ensuing influence of electrical fields on electron transport in DSCs, has been questioned because of the small size of the semiconductor particles36-38 and because of electrostatic shielding by the electrolyte (to be discussed later). Since
Ener
gy (A
. U.)
(a) (b)
CB
VB
CB
VB
EF
Uredox EF Uredox
Ene
rgy
(A. U
.)
Ener
gy (A
. U.)
(a) (b)
CB
VB
CB
VB
EF
Uredox EF Uredox
Ene
rgy
(A. U
.)
Ener
gy (A
. U.)
(a) (b)
CB
VB
CB
VB
EF
Uredox EF Uredox
Ene
rgy
(A. U
.)

13
the width of the depletion layer is typically a few hundred nm, it was noticed that such layers cannot be formed in the nanoparticles constituting the mesoporous film, since a typical particle has a radius of only 10-50 nm. Therefore, instead of drift or migration, the driving force in conventional p-n junction solar cells, it was suggested that the driving force was diffusion.39-41

14
3. Design and working principles of the DSC The DSC is composed of two electrodes, the working electrode (WE) and a counter electrode (CE). The working electrode consists of a dye-sensitized mesoporous film attached to a conducting substrate. The conducting substrate is usually a glass plate coated with a thin layer of a transparent conducting oxide, such as fluorine doped tin oxide (F:SnO2) or indium tin oxide (ITO), and will be abbreviated “TCO-layer”. The counter electrode is also composed of a conducting substrate, but with an additional catalytic amount of platinum (Pt) to decrease the charge transfer resistance. DSCs based on flexible plastics have also been produced,42 and offer great promise because of their potential ease of integration into various devices and structures; currently, however, glass is mostly used. The void between the electrodes is filled with an electrolyte, usually containing the I-/I3
- redox couple. The outermost layer of TiO2 particles, nearest the CE, is abbreviated “EE” for electrolyte/electrode, and the distance between the EE and CE is typically 20-50 μm. A graphic representation of the composition can be viewed in Fig. 3.
Figure 3. The composition of a dye-sensitized solar cell.
WE
CEsubstrateTCOplatinum
TCOsubstrate
dye-sensitizedmesoporousfilm
EE P
electrolyte
WE
CEsubstrateTCOplatinum
TCOsubstrate
dye-sensitizedmesoporousfilm
EE P
electrolyte

15
The mesoporous film is created by sintering or pressing43 assemblies of semiconductor nanoparticles on the conducting glass substrate. TiO2 is usually used, but alternate oxides, such as ZnO44 and SnO2,45 have also been tested. The film thickness, d, is typically 5-30 μm, and due to the mesoporous structure, the internal area is of the order of 102-104 times larger than the cell area.46 The porosity, P, of the mesoporous film, which is defined as the volume fraction not occupied by semiconductor particles, is typically 50-70%.46 Due to the large bandgap of TiO2 (Eg=3.0-3.2 eV), it only absorbs light in the UV-region of the solar emission spectrum. To increase its light harvesting efficiency, the mesoporous film is sensitized by immersing the WE in a dye solution for some time, typically overnight. The procedure ultimately results in the adsorption of a monolayer of dye molecules onto the TiO2 surface. Today, the most widely used dyes are based on inorganic ruthenium compounds, such as N71947 and black dye48. Organic dyes, such as D549 and D149,50 have also displayed efficient light harvesting properties, and are promising due to their short synthesis routes. The chemical structures of D5 and N719 can be viewed in Fig. 4.
N
SCOOH
NC
Figure 4. To the left, 3-(5-(4-(diphenylamino)styryl)thiophen-2-yl)-2-cyanoacrylic acid (D5) and to the right bis(tetrabutylammonium)cis-bis(thiocyanato)bis(2,2’-bipyridine-4-carboxylic acid, 4’-carboxylate)ruthenium(II) (N719).
TBA+
N
N
HOOC
OOC N
N
COO
COOH
N
C
S
N
C
S
RuTBA+
TBA+
N
N
HOOC
OOC N
N
COO
COOH
N
C
S
N
C
S
RuTBA+

16
The electrolyte contains a redox couple, counterions, additives, and solvent. Even though other alternatives, such as complexes containing cobalt,51 have been tested, the efficiency of the I-/I3
- redox couple remains unmatched. Typical concentrations of I- and I3
- in DSCs are 0.5-1.0 M and 50-100 mM, respectively. To improve the efficiency, additives such as 4-tert-butylpyridine (4TBP), 1-methylbenzimidazole, and guanidinium thiocyanate are frequently included in the electrolyte. It has been found that the function of 4TBP increases the open-circuit voltage and the electron lifetime.52 In essence, the DSC works because the device succeeds in transforming photonic energy into electrical energy through extracting the photogenerated carriers to an outer circuit. The internal processes directly related to the efficiency of the device can be summarized as generation (a), transport (b), and recombination (c), and are presented schematically in Fig. 5.
Figure 5. Processes in the DSC directly related to cell efficiency. In (a), a photon is absorbed by the dye molecule and thereafter, an electron is injected into the TiO2 particle. The oxidized dye molecule is reduced by the redox couple. (b) represents the electron being transported in the mesoporous film and (c) represents the recombination to electron acceptors in the electrolyte. Also to the bottom right is the electron transfer process from the counter electrode to the electrolyte.
I-/I3-
I-/I3-
I-/I3-
(a)
(b)(c)
N
S
COOH
NC
I-/I3-
I-/I3-
I-/I3-
(a)
(b)(c)
N
S
COOH
NC
N
S
COOH
NC

17
In Fig. 5, the generation process (a) refers to the mechanisms involved in transforming photons into electrons. For efficient absorption, it is important that the spectral properties of the dye molecules, D0, are well-matched to the emission spectrum of the light source, e.g., the sun. For efficient electron injection, it is also important that the energy levels of the acceptor states in the TiO2 overlap those of the excited state, D*, for the dye molecules. When the electrons have been injected into the TiO2, the resulting oxidized dye molecules, D+, are rapidly reduced to D0 via the redox couple. Within the mesoporous TiO2 film, the electrons are localized either in the conduction band or in trap states, below the conduction band.53-57 Due to the absence of a built-in electrical field, the electron transport (b in Fig. 5) in the conduction band is assumed to be due to diffusion.40 The electron transport, however, cannot be described by a single electron diffusion coefficient, De, alone but is also dependent on the trapping/detrapping dynamics,53,58-61 interactions with ions,62-65 and the morphology of the mesoporous film.66-68 For the trapping/detrapping dynamics, it is a general rule that a higher electron concentration, i.e., a higher quasi-Fermi level1, nEF, decreases the transit time, because less energy is required to transfer electrons from the traps to the conduction band. There will be electrostatic interactions between electrons in the mesoporous film and ions in the electrolyte that fills the pores, forming charge-neutral couples whose ambipolar diffusion coefficient, Damb, is dependent on electron concentration, ion concentration, and their respective diffusion coefficients. There will also be a dependence of the electron transport on the morphology of the mesoporous film, where a lesser contact between the respective nanoparticles increases the transit time. Additionally, the average coordination number, i.e., the average number of connected particles, has an influence. When the electrons have reached the back contact, they are quantitatively collected as an external current, J. In an ideal system, one injected electron results in one extracted electron, but in reality, electrons recombine (c in Fig. 5) with electron accepting species, predominantly in the electrolyte, decreasing the efficiency of 1 Concept used to described the excess carrier distribution under illumination.

18
the device. One rapid electron scavenger is iodine, I2,69 which is present in the device due to the equilibrium between triiodide, I3
-, and iodide, I-, ( −
3I −+ II 2 ). An alternate electron acceptor is D+, but at normal concentrations of I- and I3
- in combination to a suitable dye, this recombination route can be neglected, due to the fast reduction of the oxidized dye. To conclude this section, the overall conversion efficiency of the DSC is dependent on the dynamics between a number of processes. Although attempts have been made to correlate them, no complete model of the DSC exists today that does not include simplifications. This will be further discussed in section 5.
19
4. Experimental techniques A wide range of experimental techniques are available with which to analyze various properties of the DSC. A complete description of these techniques is, however, beyond the scope of this text, so only a summary of those, directly relevant to the coming discussion, will be presented.
4.1. IV and IPCE
The DSC generates a current, J, and a voltage, V, when it is illuminated and connected to an outer circuit. If the resistance of the outer circuit is zero, the cell is short-circuited (SC) and the current reaches a maximum value, JSC, while the voltage is zero. Conversely, if the resistance of the outer circuit is infinite, the cell is open-circuited (OC) and the voltage reaches a maximum value, VOC, while the current is zero. The output power of a DSC, Pout, equals the product of J and V as expressed in Eq. 7.
JVPout = (7)
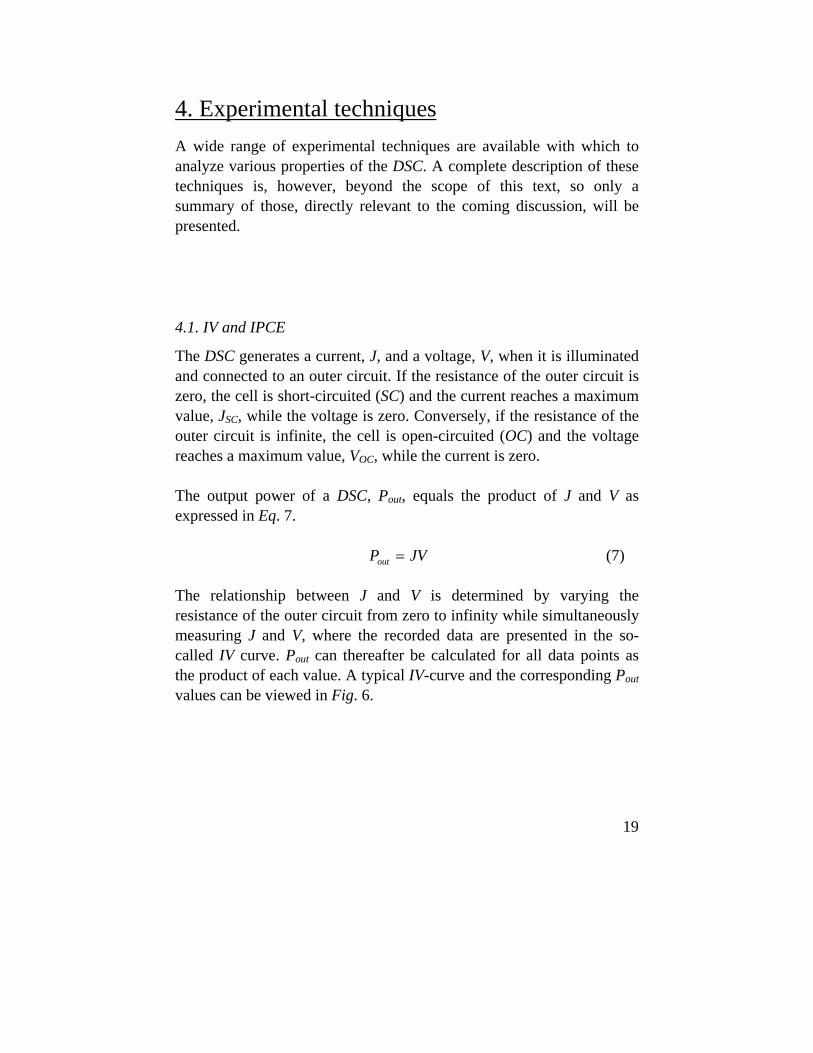
The relationship between J and V is determined by varying the resistance of the outer circuit from zero to infinity while simultaneously measuring J and V, where the recorded data are presented in the so-called IV curve. Pout can thereafter be calculated for all data points as the product of each value. A typical IV-curve and the corresponding Pout values can be viewed in Fig. 6.
20
0,0 0,1 0,2 0,3 0,4 0,5 0,6 0,7 0,80
2
4
6
8
0
1
2
3
I (m
A c
m-2)
V (V)
P (m
W c
m-2)
Figure 6. The current-voltage characteristics (left) and corresponding power (right) for a DSC at 1.0 sun.
In the figure, J is fairly constant for V values below 0.4 V, implying that Pout increases linearly with V. Thereafter, J decreases slowly and Pout reaches a maximum value, Pmax, from which it decreases more rapidly with J towards zero. Pmax is commonly reported as the output power of the commercial device. However, Pmax is not a suitable parameter with which to describe the power conversion efficiency, since J, and hence Pmax, increases with cell area, A. Also, both J and V are dependent on the incident light intensity, I0. Instead, the efficiency is described by the unitless power conversion efficiency, η, the value of which equals the quotient of Pmax and Pin (see Eq. 8), Pin being the power of the incident light.
in
out
PP
=η (8)
Another parameter, directly related to cell efficiency, is the fill factor, ff. The fill factor expresses the efficiency of the device compared to that of an ideal cell where the output power equals the product of JSC and VOC,

21
as expressed in Eq. 9. DSCs with high power conversion efficiencies, η, are usually characterized by high fill factors (ff>0.75).
OCSCVJ
Pff max= (9)
The power of the incident light, Pin, can be calculated from the emission spectrum of the light source. A standardized solar spectrum, AM 1.5, corresponding to an incident power of 1000 Wm-2 (=1.0 sun), is used to characterize solar cells. This spectrum corresponds approximately to a sunny mid-day in Stockholm, Sweden. “AM” is the abbreviation for air mass, so AM 1.5 implies that the light has to travel 1.5 times farther than direct incidence would before reaching ground level. The spectral distribution of the solar AM 1.5 emission spectrum can be viewed in Fig. 7.
500 1000 1500 20000,00E+000
1,00E+018
2,00E+018
3,00E+018
4,00E+018
5,00E+018
Pho
ton
flux
(s-1 n
m-1)
λ (nm)
Figure 7. Photon flux with respect to wavelength for the Solar AM 1.5 emission spectrum.
In the figure, it can be seen that a major fraction of the emitted photons have wavelengths greater than 400 nm, i.e., above the UV-region;

22
therefore, as described earlier, using TiO2 as a light absorbing material would yield low power conversion efficiencies. Obviously, the sun does not always shine, and on cloudy days, Pin can decrease to roughly 0.1 sun outdoors, while indoors, using light sources such as lamps and diffuse light from windows, Pin can drop to only a few watts per square meter (∼0.001 sun). Considering that η, for a specific DSC, is highly dependent on Pin, it is clear that efficient DSCs must be designed with respect to these conditions. Depending of the dye molecule and its spectral properties when attached to the TiO2, the incident photon to current conversion efficiency (IPCE), varies with respect to wavelength. Generally, the IPCE can be expressed as the product of the absorption, injection, and collection efficiencies, according to Eq. 10. collinjabsIPCE ηηη= (10)
The IPCE spectra of two DSCs, sensitized with the N719 and D5 dyes, respectively, can be viewed in Fig. 8.
400 500 600 700 8000,0
0,2
0,4
0,6
0,8
1,0
IPC
E
λ (nm)
Figure 8. IPCE spectra for DSCs with D5 (straight line) and N719 (dashed line). Film thickness is 10 μm for
the cell with D5 and 16 μm for the cell with N719.

23
Experimentally, as done in Fig. 8, IPCE is calculated by relating JSC with Pin, while the cell is continuously illuminated with monochromatic light, as expressed in Eq. 11.
) ()(
) (12402
2
−
−
=cmWPnmcmAJ
IPCEin
SC
λ (11)
4.2. Time of flight (TOF)
Time of flight (TOF),63 is a method for measuring the electron transit time through the mesoporous film under SC. The technique works as follows: First, a short laser pulse is used to generate electrons near the EE interface. To correctly relate the transit time to an effective diffusion coefficient, it is important that the electron generation depth is shallow, i.e., most electrons are generated in a narrow region near the EE interface. Thereafter, JSC is monitored as a function of time and follows a peak function. If the electron transport is described as a diffusion process, the relationship between the effective electron diffusion coefficient, Deff, film thickness, d, and the time when the current has a maximum value, tTOF, is according to Eq. 12.
TOF
eff tdD
6
2
= (12)
While analyzing the current responses obtained from TOF experiments, Solbrand et al. found that tTOF decreased with increased light intensity, thus yielding a faster diffusion according to Eq. 12.70,71 They also found that tTOF was dependent on the composition of the electrolyte, where an increased ionic conductivity appeared to increase the electron diffusion coefficient. The explanations were ascribed to a trap-filling effect for
24
the light intensity dependence and an ionic coupled transport for the conductivity; these features will be discussed further in section 5. Because electron transport in DSCs changes non-linearly with light intensity, large-modulation perturbations, such as TOF, result in a complex response that may be difficult to interpret. 4.3. Voltage decay (VD)
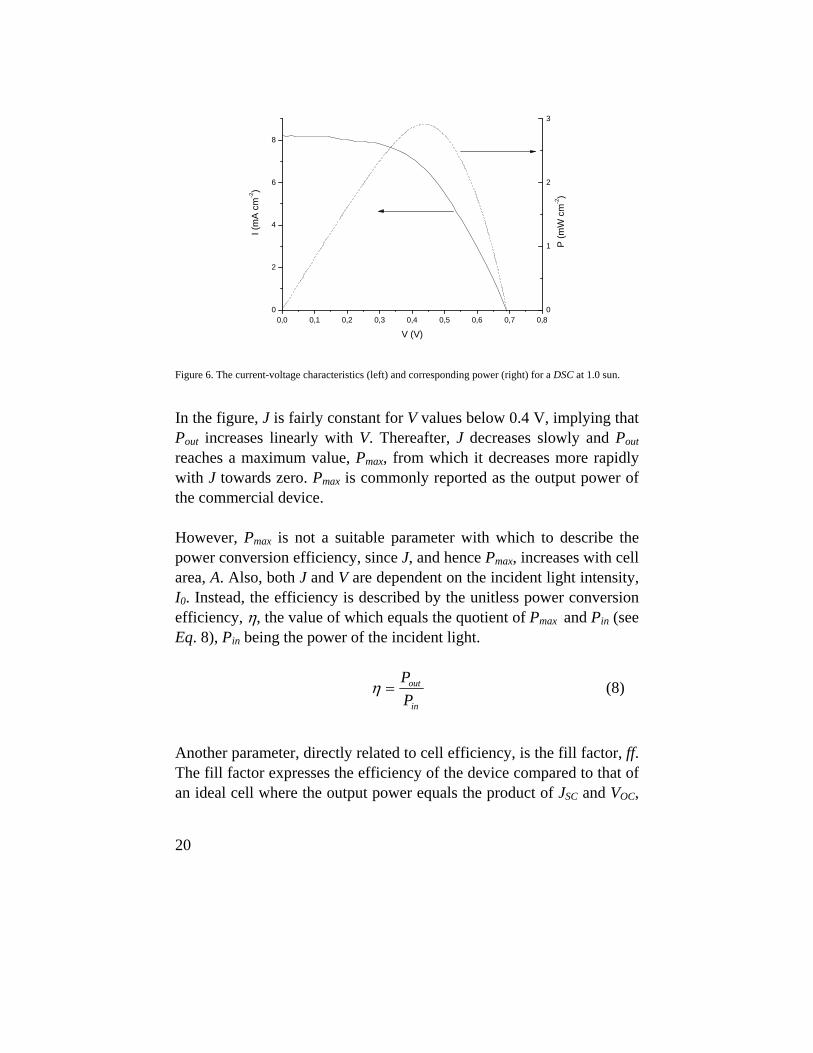
Voltage decay (VD) is a well-known method for studying electron recombination processes in DSCs. The cell is illuminated under OC conditions until VOC is constant. Then, the light is turned off and the VOC is measured with respect to time. Since the extracted current is zero, a decrease in VOC can only be attributed to recombination, i.e., electrons transferred to acceptor molecules in the electrolyte or oxidized dye molecules. Due to the fast regeneration rate of oxidized dye molecules, the influence of the latter route is, however, normally limited. An example of voltage decay results can be viewed in Fig. 9.
0,0 0,5 1,0 1,5 2,0 2,5 3,00,1
0,2
0,3
0,4
0,5
0,6
0,7
VO
C (V
)
t(s)
Figure 9. Open-circuit voltage, VOC, with respect to elapsed time, t, in the dark.

25
The available recombination pathways are via the conduction band, surface states, and via the TCO layer on the back contact.72 It has been determined that recombination via the TCO contact may contribute significantly to the overall recombination current at lower voltages (<0.3 V), but by covering the TCO layer with a blocking layer, that pathway becomes less significant.73,74 The dominant recombination route at higher voltages is still under debate, however, though evidence has been presented supporting both recombination via surface states72 and via the TiO2 conduction band75. Electron lifetimes (τe) in the TiO2, i.e., the average time it takes for an electron to be recombined, can be determined from a voltage decay experiment using Eq. 13.76 The lifetimes determined in this way correspond to effective lifetimes of the conduction band electrons, as they are in quasi-static equilibrium with trapped electrons. The corresponding lifetime, calculated according to Eq. 13 for the data presented in Fig. 9, can be viewed in Fig. 10.
1−
⎟⎠⎞
⎜⎝⎛−=
dtdV
qTk OCB
eτ (13)
0,1 0,2 0,3 0,4 0,5 0,6 0,7
0,0
0,1
0,2
0,3
0,4
0,5
0,6
τ e (s)
VOC (V)
Figure 10. Electron lifetime, τe, with respect to open-circuit voltage, VOC, calculated from Fig. 9 and Eq. 13.

26
Directly comparing various DSCs by using Eq. 13 to calculate their electron lifetimes can, however, be misleading. This is because the recombination route may be via the conduction band, surface states or a mixture of these in addition to the not yet completely understood recombination mechanism. Also, directly comparing various DSCs using Eq. 13 requires that the relationships between VOC and the accumulated charge at OC, QOC, be the same for the compared cells. The effect of different relationships between VOC and QOC, in terms of interpreting the electron lifetime, was briefly investigated in paper IV. Using Eq. 13, we found that the lifetimes were apparently longer for DSCs containing cations with larger radii. However, when the lifetime was calculated with respect to QOC, which requires some modifications of Eq. 13, we found that the lifetimes were equal for DSCs containing either Na+, K+, or Cs+ but followed a different pattern for the DSCs containing Li+. Quantitative values obtained from voltage decays analysis should therefore be carefully examined before being accepted.
4.4. Voltage-Charge (VQ)
The trap distribution is one of the most important features of the DSC, because the concentration of electrons occupied in traps, −
TRAPe , is directly connected to the concentration of conduction band electrons,
−CBe . Normally, most electrons in the mesoporous film are localized in
traps, so the trap distribution function can be estimated by measuring the total charge accumulated in the TiO2.77 Experimentally, the cell is illuminated at OC until VOC is constant. Then, the cell is switched to short-circuit and the illumination is simultaneously turned off. The output current is integrated and eventually reaches QOC. An alternate method, especially efficient to obtain low voltages, is to allow the voltage to decrease due to recombination in the dark before the cell is short-circuited and the current integrated.78

27
To achieve the correct relationship between VOC and QOC, both methods require that the time for charge extraction is long enough to extract all electrons in the film. For the alternate method, it is also important that the electron reorganization time within the mesoporous film is short; otherwise, the displayed VOC value does not resemble the quasi Fermi level, nEF, in the mesoporous film. The trap distribution is usually described as a tail of states below the conduction band and usually, the charge accumulated in the traps is expressed by an exponential function.55,62,77,79,80 To account for the charge accumulated at the TCO/electrolyte interface at the back contact, a linear term, VOCCSC , is also included in the overall VOCQOC relationship; see Eq. 14. ( ) SCOCBOCOCOC CVTkqVQQ += /exp)0( β (14)
In Eq. 14, QOC(0) is the charge at zero voltage, β is related to the width of the trap distribution, and CSC is the capacitance of the space charge region associated with the TCO. Measurements made using electric impedance spectroscopy have indicated that CSC is of the order of 10-5 F cm-2,81,82 and by comparison between fitted values of QOC(0) and β, it has been concluded that most of the electrons are localized in traps, i.e., originate from the exponential term in Eq. 14, under normal working conditions (V>0.5 V).83 In paper IV, we present evidence that including an additional linear fitting term in Eq. 14, CVOC (see Eq. 15), significantly improves the fit and influences the physical interpretation of the trap distribution. An example is given in Fig. 11, where a measured set of data points is fitted by a single exponential and Eq. 15, where C is the additional capacitance term.
( ) )(/exp)0( SCOCBOCOCOC CCVTkqVQQ ++= β (15)

28
0,20 0,25 0,30 0,35 0,40 0,45 0,50 0,55 0,600
20
40
60
80
100
120
140
160
180
Q (μ
C c
m-2)
VOC (V)
Figure 11. Measured QOC-VOC data (squares) fitted with a single exponential function (dashed line) and an exponential function containing an additional linear term (straight line).
In Fig. 11, it is evident that the linear relationship between VOC and QOC at lower voltages cannot be satisfactorily modeled by Eq. 14, where CSC is zero or low, ~10-5 F cm-2. This indicates the presence of an additional capacitance, labeled C in Eq. 15, which therefore, intuitively, should be associated with the TiO2. The origin of this larger capacitance remains unclear, and further study is required to elucidate the prerequisites for inclusion. From the conclusions of paper IV, however, it is clear that an adequate fitting model is necessary for interpreting the trap distribution correctly.
4.5. Small square-wave modulations (SSWM)
Electron transport and recombination can be studied by measuring the current and voltage responses when the illumination intensity is modulated under SC or OC conditions, respectively. Using small square-wave modulations (SSWM), the magnitude of modulation is typically 1% of the incident light intensity; due to the small magnitude,

29
the response can be related to the steady-state condition of the system, in contrast, for example, to TOF. To obtain information about transport and recombination, the current and voltage responses are fitted to first order exponential functions as expressed in Eqs. 16 and 17, respectively. The constants JSC,0 and VOC,0 represent VOC and JSC in the absence of modulations, ΔJ and ΔV the modulation magnitudes, and τtr and τrec the time coefficients of transport and recombination, respectively. ( )trSCSC tJJJ τ/exp0, −Δ+= (16)
( )recOCOC tVVV τ/exp0, −Δ+= (17)
In paper VI, we studied the electron transport properties in DSCs with different film thicknesses, d. Also, to investigate the influence of light penetration depth, red (λ =640 nm) and green (λ=530 nm) light were used to generate electrons. While using red light, the current responses were perfectly fitted using Eq. 16. While illuminating the samples with green light, however, the current responses were poorly fitted using Eq. 16, indicating dispersion in the transport process.55,80 Therefore, to improve the fit and study this dispersive behavior, an additional exponential was included in Eq. 16, resulting in Eq. 18. ( ) ( )slowslowfastfastSCSC tJtJJJ ττ /exp/exp 10, −Δ+−Δ+= (18)
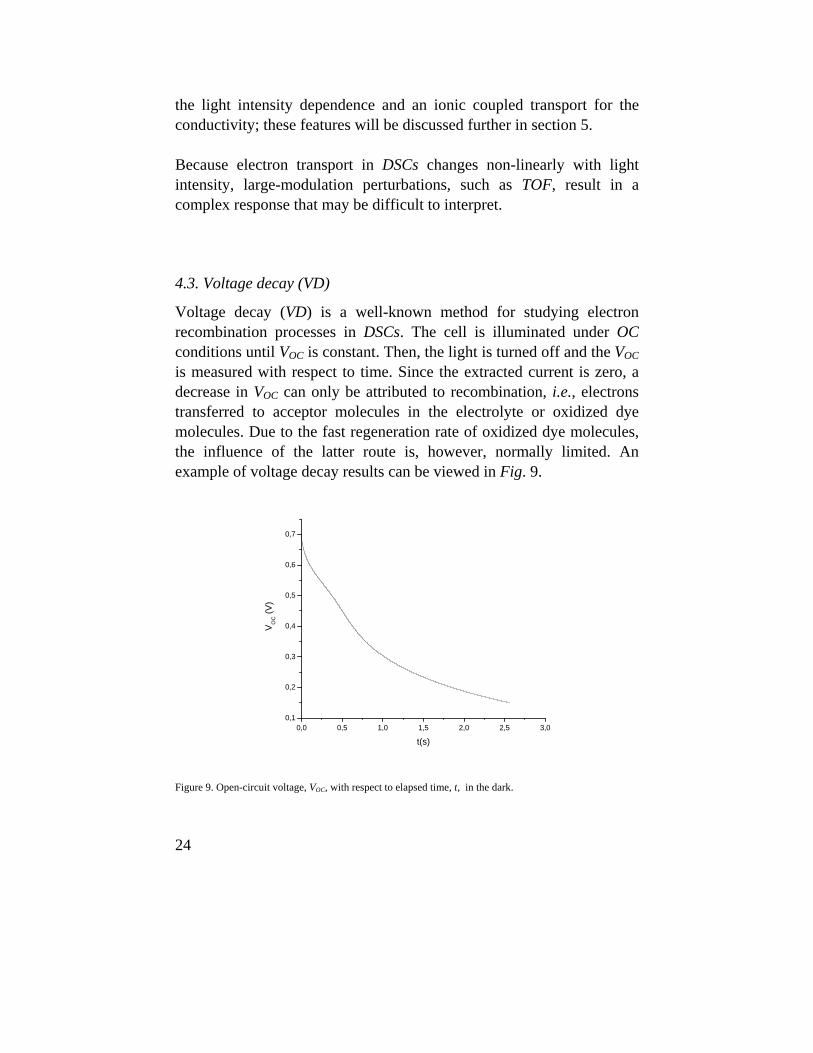
Using Eq. 18, the fit improved significantly and we could distinguish a fast and a slow component, which explains the indexes used in Eq. 18. Further, from the respective pre-exponential values, we could estimate the current fraction delivered by the fast component to the extracted current, JSC,0. These can be viewed with respect to φ, for three film thicknesses, in Fig. 12.
30
0,00E+000 2,00E+016 4,00E+016 6,00E+016 8,00E+016
0,4
0,5
0,6
0,7
0,8
J fast/J
SC,0
φ (s-1 cm-2)
Figure 12. Ratio of current delivered by the fast component and short-circuit current, Jfast/JSC,0, as function of
photon flux, φ, for three film thicknesses. Squares is 6 μm, circles 16 μm and triangles 24 μm.
It can be seen in the figure that the current fraction delivered by the fast component exceeds 40% for the studied samples. Also, it can be noted that the fraction is fairly constant for the thicker films over the studied photon flux range, indicating a linear relationship between the fast current and photon flux. A more detailed study (see paper VI) demonstrated that the slow component showed the same trends as the response obtained while using red light; the currents displayed the same τ versus J and τ versus d relationships where the latter were calculated for a fixed J. For the fast current, τ was constant over the studied d-range for a fixed J. Neither the constant value of τ for the fast component or the linear relationship between τ and d for the other currents were expected; for diffusion as electron transport process, a linear relationship between τ and d2 is expected.
31
5. Charge transport in dye-sensitized solar cells Since the experimental breakthrough in the 1990s, improvements of the DSC have, to a large extent, been due to empirical methods,84 and today, devices with an overall power conversion efficiency above 10% have been presented. Although the functioning of the DSC is fairly well understood, the DSC research community still lacks the rigid theoretical framework that characterizes traditional p-n junction solar cells. The major reason for this is that the DSC concept is of recent provenance, less than 20 years, compared to over 50 years for silicon solar cells. Also, the strong financial support for silicon solar cells designed for power supply in space increased the development rate of the technology. From a modelling perspective, the DSC is a challenge. This is essentially because of its mesoporous structure, which separates the charges but still allows interactions and charge transfer processes. Due to the large number of species of varying concentrations, combined with the incompletely understood dynamics between the respective processes, a complete DSC model with predictive power is still remote. The difficulty of coupling the mechanisms at a detailed level to large scale, measurable parameters, can be referred to as a scaling, or bridging, problem, in which the accuracy of a model is dependent on the number and type of simplifications included. An almost classic example in the case of DSCs is that of approximating the whole cell to an effective medium, which implies that the influence of the mesoporous structure is implicitly included in the model parameters. Although this approach has proven efficient, i.e., the performance of DSCs under working conditions has been simulated,64,85 the results can not be applied directly in developing more efficient solar cells; this is because the model parameters are effective and not, for example, material specific.

32
One approach to improving the theoretically based models of the DSC is to improve the bridging quality. This implies that the dynamics between various processes at a specific level of detail should be so well understood that they can be expressed by analytic expressions; these can in turn be used in more complete models to reduce their complexity. The focus of this summary is electron transport; in the following parts of this section, this and related issues will be covered in more detail. Investigating electron transport is rather tricky, because the actual transport mechanism, which occurs at an atomic scale, must be interpreted experimentally using large scale parameters such as current, charge, and voltage. Therefore, it should be emphasized that this work does not aim to present a complete description of the DSC, but to attempt, together with the models presented by other groups,40,67,68,80,85-
87 to tackle the bridging problem.
5.1. Traps
The concept of traps, i.e., energy states below the conduction band, was introduced to explain the illumination intensity dependence of electron transport.53,58,59,88 Despite the fact that energy states below the conduction band have been found experimentally,89 the physical analogue of the exponential trap distribution in Eqs. 14 and 15 still remains under investigation. However, from the improved fit produced by including a linear term in Eq. 15 to model the VOCQOC relationship, it is plausible to assume that different kinds of trap states co-exist in the DSC. It has been suggested by many research groups that electron transport occurs predominantly in the conduction band, whereas most electrons reside in trap states. At first sight, this might seem to limit the performance of the DSC, but it has been estimated from the electron diffusion length, L, that the electron collection efficiency remains fairly constant over a broad illumination intensity range.90 The electron
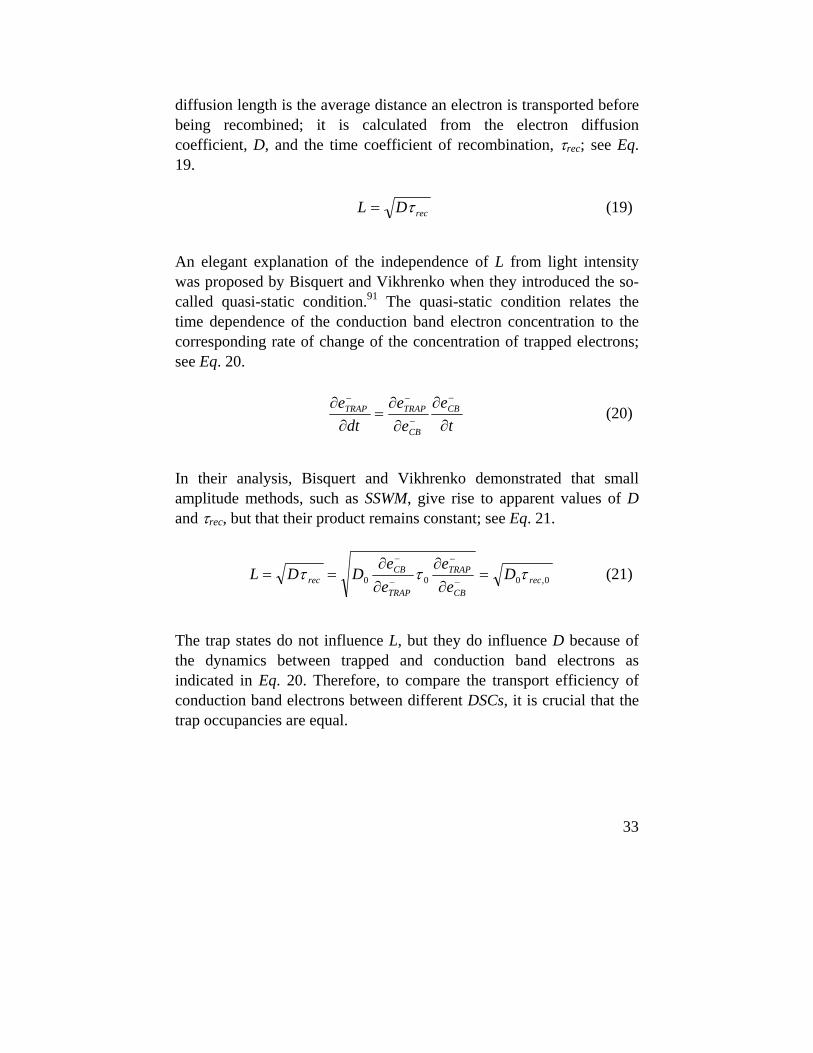
33
diffusion length is the average distance an electron is transported before being recombined; it is calculated from the electron diffusion coefficient, D, and the time coefficient of recombination, τrec; see Eq. 19. recDL τ= (19)
An elegant explanation of the independence of L from light intensity was proposed by Bisquert and Vikhrenko when they introduced the so-called quasi-static condition.91 The quasi-static condition relates the time dependence of the conduction band electron concentration to the corresponding rate of change of the concentration of trapped electrons; see Eq. 20.
t
ee
edt
e CB
CB
TRAPTRAP
∂∂
∂∂
=∂
∂ −
−
−−
(20)
In their analysis, Bisquert and Vikhrenko demonstrated that small amplitude methods, such as SSWM, give rise to apparent values of D and τrec, but that their product remains constant; see Eq. 21.
0,000 recCB
TRAP
TRAP
CBrec D
ee
ee
DDL τττ =∂∂
∂∂
== −
−
−
−
(21)
The trap states do not influence L, but they do influence D because of the dynamics between trapped and conduction band electrons as indicated in Eq. 20. Therefore, to compare the transport efficiency of conduction band electrons between different DSCs, it is crucial that the trap occupancies are equal.
34
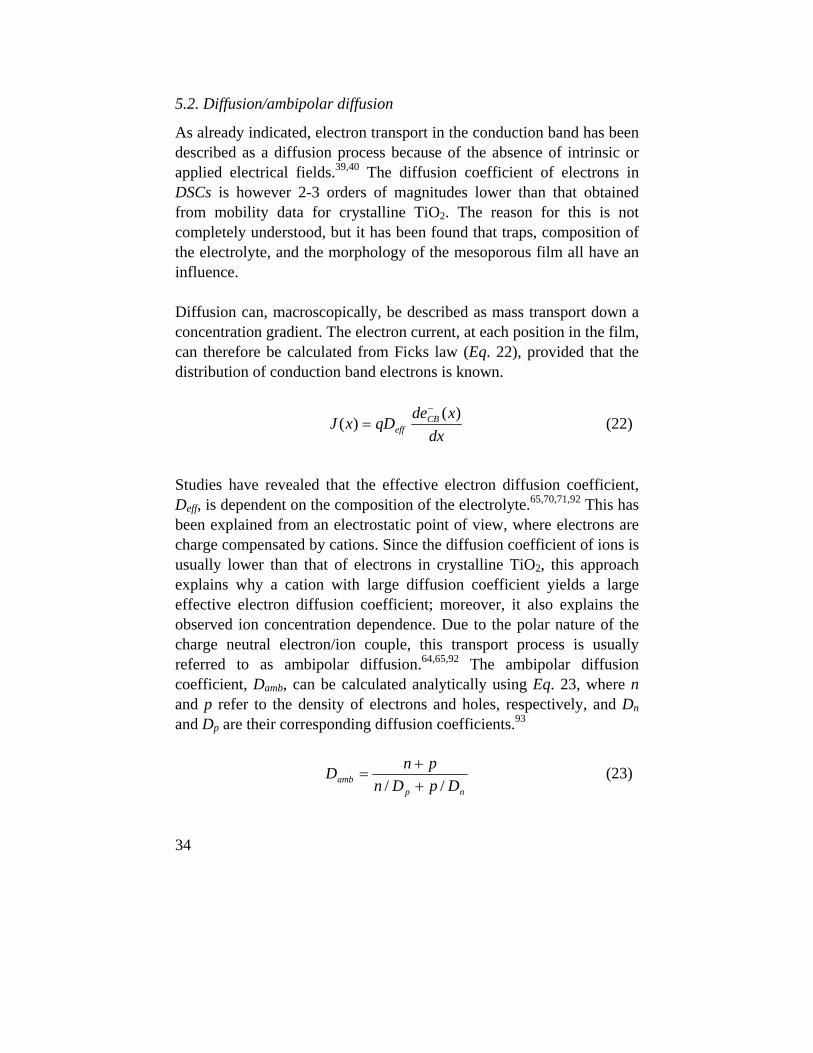
5.2. Diffusion/ambipolar diffusion
As already indicated, electron transport in the conduction band has been described as a diffusion process because of the absence of intrinsic or applied electrical fields.39,40 The diffusion coefficient of electrons in DSCs is however 2-3 orders of magnitudes lower than that obtained from mobility data for crystalline TiO2. The reason for this is not completely understood, but it has been found that traps, composition of the electrolyte, and the morphology of the mesoporous film all have an influence. Diffusion can, macroscopically, be described as mass transport down a concentration gradient. The electron current, at each position in the film, can therefore be calculated from Ficks law (Eq. 22), provided that the distribution of conduction band electrons is known.
dx
xdeqDxJ CB
eff)(
)(−
= (22)
Studies have revealed that the effective electron diffusion coefficient, Deff, is dependent on the composition of the electrolyte.65,70,71,92 This has been explained from an electrostatic point of view, where electrons are charge compensated by cations. Since the diffusion coefficient of ions is usually lower than that of electrons in crystalline TiO2, this approach explains why a cation with large diffusion coefficient yields a large effective electron diffusion coefficient; moreover, it also explains the observed ion concentration dependence. Due to the polar nature of the charge neutral electron/ion couple, this transport process is usually referred to as ambipolar diffusion.64,65,92 The ambipolar diffusion coefficient, Damb, can be calculated analytically using Eq. 23, where n and p refer to the density of electrons and holes, respectively, and Dn and Dp are their corresponding diffusion coefficients.93
np
amb DpDnpnD
// ++
= (23)

35
The theory was initially adopted for solid state devices, therefore n and p in Eq. 23, but can also explain the influence of the electrolyte on electron transport in DSCs. However may the electron process be more complicated for DSCs because of the more complex influence of electrostatic interactions in a mesoporous film. Therefore, to avoid confusion, the electron diffusion coefficient will in ensuing sections still be presented as effective, even though it is of an ambipolar nature.
5.3. Modelling diffusion in mesoporous films
It has been determined that the morphology of the mesoporous film has an impact on the effective electron diffusion coefficient. For example, Deff of rutile TiO2 (rod-like particles) is approximately one order of magnitude smaller than that of anatase TiO2 (spherical particles).94 Porosity, P, and particle size66 have also been observed to have an influence. To study the influence of the film morphology on electron diffusion, Benkstein et al. simulated electron transport in a random structure of interconnected spherical particles; they found that Deff scales with P in the form σ
ceff PPD −∝ , where Pc is the percolation threshold, i.e., where transport becomes impossible, and σ is a conductivity exponent.46 Their simulations also revealed that the number of visited particles increased 10-fold when P increased from 50% to 75%, which corresponds to a 10-fold decrease in Deff. This could to some extent be explained by the increased fraction of dead-ends, i.e., terminating particles, which increased from less than 1% for P=50% to 31% for P=75%. It was also found that the average nanoparticle coordination number was 4.2 for P=50%.46 Intuitively, the overlap between two neighboring particles, i.e., the necking, should also influence the transport time if the electron transport occurs within the particles and the transport mechanism behaves randomly. This, and the corresponding influence on ion diffusion, was studied in detail in paper I, where we created a simulation model in which the transport on a fine scale was described

36
by Brownian motion and the mesoporous structure was modeled as a repetitive network of interconnected particles. Brownian motion relates spontaneous movements on a fine scale with an effective diffusion coefficient via Eqs. 24-26 where )(0 ir
→
is the initial position vector, )(ir
→
is the present position vector, )(ir→
Δ is the displacement vector, t is the total simulated time and
→
A is a real number, drawn from a Gaussian distribution of width tDbulkΔ2 where Δt is the timestep.
)(6)(2
0 itDrir eff=−→→
(24)
)()()(1 iririr nn
→→
+
→
Δ+= (25)
→→
=Δ Air )( (26)
If Brownian motion is to be simulated in a homogenous medium, Deff, calculated from Eq. 24, would equal Dbulk, but by introducing spatial restrictions, Deff becomes less than the bulk value. The mesoporous film, which causes the restrictions, was modelled using unit cells, which describes the spatial arrangement of particles, and the complete film was thereafter modelled using periodic boundary conditions. As unit-cells, we used the 6-coordinated simple cubic, and the 4-coordinated diamond structure (see Fig. 13 next page). From the previous estimate of the average nanoparticle coordination number made by Benkstein et al., we expected the 4-coordinated unit cell to best resemble the mesoporous film.

37
Figure 13. 6-coordinated unit cell (left) and 4-coordinated diamond structure (right).
The porosity was controlled by the necking between neighboring nanoparticles; since the mesoporous film was modelled by unit cells, this could be described by simple analytical expressions. The simulations yielded the quotient Deff/Dbulk for electrons and ions as a function of porosity and for the 4-coordinated structure; the results can be viewed in Fig. 14. Figure 14. The quotient between Deff/Dbulk as a function of porosity for electrons (straight line) and ions (dashed line).
0,1 0,2 0,3 0,4 0,5 0,6 0,7
0,2
0,3
0,4
0,5
0,6
0,7
0,8
0,9
Def
f/Dbu
lk
Porosity

38
From Fig. 14, it can be estimated that Deff is roughly half the bulk value for both electrons and ions at a porosity of 50%. Although this indeed represents a lowering of the effective diffusion coefficient, it indicates that the spatial restrictions do not fully explain the relatively slow electron transport in DSCs. 5.4. Modelling the influence of ions on electron transport
To study the influence of charge compensated charge transport in DSCs, we developed a simulation tool, SLICE (see paper II), in which the electron and ion transport processes were described by two components, diffusion and drift. Whereas diffusion describes the spontaneous movements of species, the macroscopic properties of which follow Fick’s law (Eq. 22), the drift component was introduced to study the influence of electric fields caused by unbalanced charge carrier distributions. The aim of the simulation tool was to determine to what extent an ambipolar diffusion transport mechanism could be expected in DSCs, and to study the requirements for such coupled transport. Ultimately, this kind of simulation should be performed using Brownian dynamics to describe the transport, to which an additional vector is added to the pure stochastic parameter,
→
A , in Eq. 26 to account for the influence of electric fields. Since the requirements of such simulations exceeded the scope of our research, we used a simpler approach. The structure of the mesoporous film was modeled as a 3-dimensional effective medium of infinite area. The cell was divided into regions, in which electron and ionic transport were allowed in the mesoporous region, but only ionic transport was allowed in the electrolyte region. The film thickness, d, was further divided into a number of slices. To qualitatively compare the simulation results with presented experimental results, we decided to simulate time of flight (TOF) measurements. For such simulations, the time was also divided into timesteps.
39
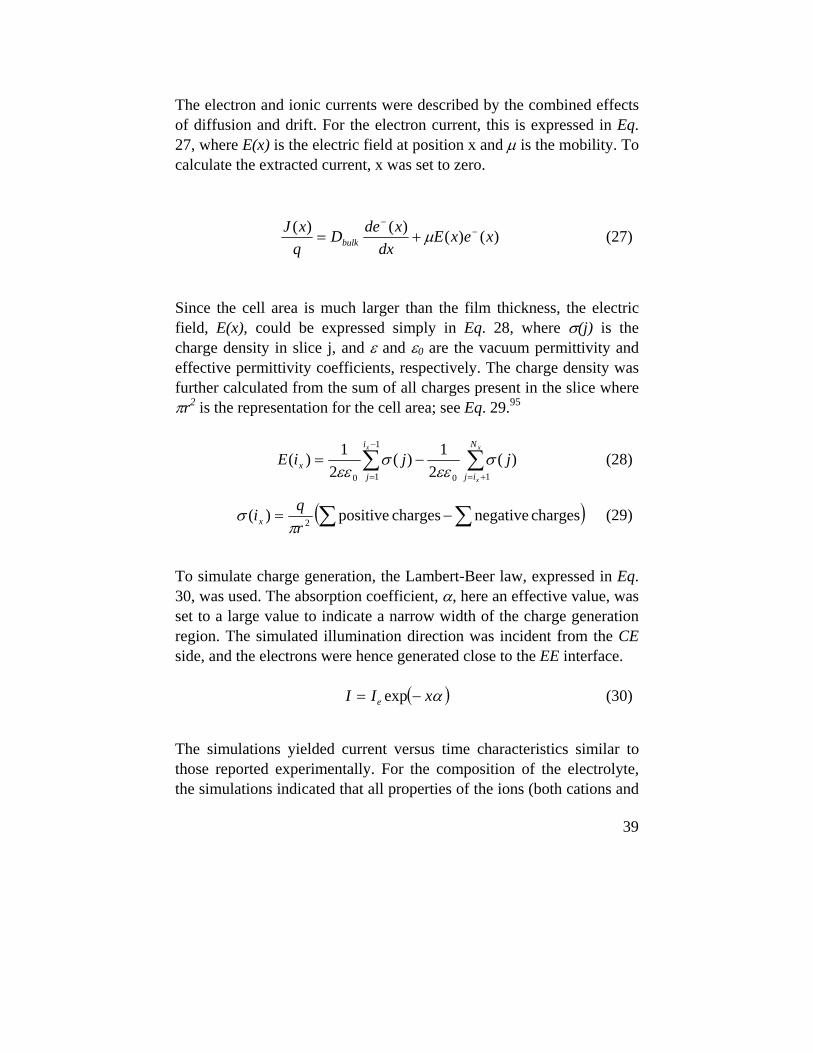
The electron and ionic currents were described by the combined effects of diffusion and drift. For the electron current, this is expressed in Eq. 27, where E(x) is the electric field at position x and μ is the mobility. To calculate the extracted current, x was set to zero.
)()()()( xexEdx
xdeDqxJ
bulk−
−
+= μ (27)
Since the cell area is much larger than the film thickness, the electric field, E(x), could be expressed simply in Eq. 28, where σ(j) is the charge density in slice j, and ε and ε0 are the vacuum permittivity and effective permittivity coefficients, respectively. The charge density was further calculated from the sum of all charges present in the slice where πr2 is the representation for the cell area; see Eq. 29.95
∑ ∑−
= +=
−=1
1 100
)(2
1)(2
1)(x x
x
i
j
N
ijx jjiE σ
εεσ
εε (28)
( )∑∑ −= charges negativecharges positive)( 2rqix π
σ (29)
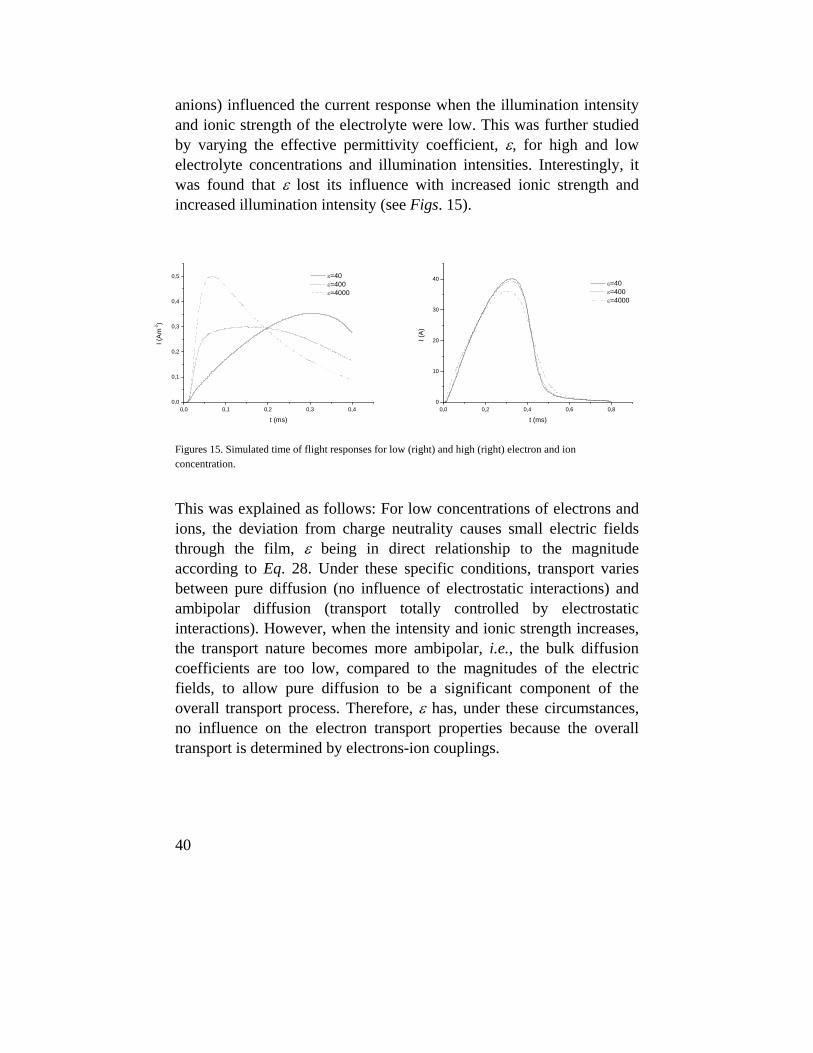
To simulate charge generation, the Lambert-Beer law, expressed in Eq. 30, was used. The absorption coefficient, α, here an effective value, was set to a large value to indicate a narrow width of the charge generation region. The simulated illumination direction was incident from the CE side, and the electrons were hence generated close to the EE interface. ( )αxII e −= exp (30)
The simulations yielded current versus time characteristics similar to those reported experimentally. For the composition of the electrolyte, the simulations indicated that all properties of the ions (both cations and
40
0,0 0,2 0,4 0,6 0,80
10
20
30
40
I (A)
t (ms)
ε=40 ε=400 ε=4000
0,0 0,1 0,2 0,3 0,40,0
0,1
0,2
0,3
0,4
0,5
I (A
m-2)
t (ms)
ε=40 ε=400 ε=4000
anions) influenced the current response when the illumination intensity and ionic strength of the electrolyte were low. This was further studied by varying the effective permittivity coefficient, ε, for high and low electrolyte concentrations and illumination intensities. Interestingly, it was found that ε lost its influence with increased ionic strength and increased illumination intensity (see Figs. 15).
Figures 15. Simulated time of flight responses for low (right) and high (right) electron and ion concentration.
This was explained as follows: For low concentrations of electrons and ions, the deviation from charge neutrality causes small electric fields through the film, ε being in direct relationship to the magnitude according to Eq. 28. Under these specific conditions, transport varies between pure diffusion (no influence of electrostatic interactions) and ambipolar diffusion (transport totally controlled by electrostatic interactions). However, when the intensity and ionic strength increases, the transport nature becomes more ambipolar, i.e., the bulk diffusion coefficients are too low, compared to the magnitudes of the electric fields, to allow pure diffusion to be a significant component of the overall transport process. Therefore, ε has, under these circumstances, no influence on the electron transport properties because the overall transport is determined by electrons-ion couplings.

41
When comparing the results obtained from the SLICE simulations with those obtained experimentally, they support the ambipolar diffusion theory, since the ionic strength is normally large for electrolytes used in DSCs. Moreover, the simulation results explain why the electron diffusion coefficients, when calculated from TOF experiments, are roughly equal in both TiO2 and ZnO,70,71 despite the fact that ε is lower for ZnO. The SLICE model fails, however, to explain the faster transport associated with high light intensities and therefore indirectly supports a trapping/detrapping mechanism as well.

42
6. Concluding remarks Today, solar cells are too expensive to be seriously considered as primary candidates for energy production. However, due to the increased attention being paid to global warming and the limited supply of fossil fuels, they have a promising future. To decrease the cost, efforts have been taken to commercialize cheaper solar cells, such as CIGS and CdTe, which are based on thin-film technologies. An interesting alternative to these cells is dye-sensitized solar cells, with an efficiency exceeding 10%. Even though DSCs had an experimental breakthrough in the early 1990s, major improvements, in terms of efficiency, have been limited. This is not because effort has not been made but because the complexity of the device far exceeds that of traditional solar cell technologies. Despite the fact that electron transport and recombination in mesoporous film have been investigated, the exact mechanisms are still subjects of debate. To increase our understanding of the limitations of electron transport, two simulation models have been presented in this summary and are more completely described in papers I and II. The simulation models are designed for studying the influence of the morphology on the mesoporous film and the influence of electron-ion interactions on electron transport. They cannot, however, be directly applied as complete DSC models, because of the difficulty in interpreting the results obtained while using effective parameters. For the purposes of comparison with simulation results and to increase our understanding of the processes operating the DSCs, various experiments have also been carried out (see paper III-VI). The research underlying this thesis has helped to improve our fundamental understanding of electron transport and interpretation of the trap distribution in DSCs. To further develop these devices, considerable effort must be devoted to both experimental and theoretical work. In view of the increased attention being paid to renewable energy, I am sure this effort will be forthcoming.

43
7. Sammanfattning på svenska I februari i år meddelade IPCC (Intergovernmental Panel on Climate Change) att halterna av växthusgaser har ökat markant sedan 1750-talet. I rapporten slås det också fast att ökningen av koldioxid, som är den främsta växthusgasen, är direkt relaterad till människans användning av fossila bränslen. Beroende på tillväxtmodell prognostiseras det vidare att den globala medeltemperaturökningen kommer att ligga mellan 0.6 och 4.0 ºC de kommande hundra åren. Innebörden i detta är att jordens klimatzoner kan komma att rubbas vilket kan ge oerhörda konsekvenser för de etablerade ekologiska systemen. Mer regionalt kan förändringarna i djur- och växtliv komma att påverka de traditionella förutsättningarna för exempelvis jordbruk och fiske vilket kan innebära stora förändringar i livsmedelskedjan. Följderna av förändringarna kan alltså komma att påverka livsvillkoren för oss, våra barn, och barnbarn på många sätt. Lyckosamt nog ligger detta scenario en liten bit in i framtiden och det går att ändra på prognosen via lyckade, internationella, mastodontinsatser. I dagsläget ligger klimatfrågorna högt upp på prioritetslistorna, både inom EU och mer internationellt och redan i mars i år beslöt EU att utsläppen av koldioxid ska minska med 20%, senast år 2020. Dessutom beslöt man att 20% av energin som produceras inom EU ska komma från förnyelsebra energikällor som sol, vind, biomassa och vatten vilket kan jämföras med dagens 6.5%. Den här avhandlingen fokuserar på användningen av solen som energikälla där energin kan tas tillvara via solceller. Att solljus kan omvandlas till elektrisk energi är ingen ny upptäckt utan har rötter i 1830-talet då Becquerel observerade att två elektroder i en saltlösning genererade en spänning under belysning. Efter några få landvinningar i slutet av 1800-talet, och efter att Einstein förklarat den fotoelektriska effekten 1905, fick solceller slutligen sitt genombrott på 1950-talet, efter det att forskningen om halvledare hade gått avsevärt framåt under andra världskriget. I och med att användningsområdena vid den tiden

44
uteslutande var väldigt specifika, som exempelvis rymdforskning, så dröjde det dock ytterligare runt 20 år innan solceller slog igenom kommersiellt under 1970-talet. Dagens kommersiella solceller bygger till stor del på den teknik som utvecklades redan på 1950-talet vilket, väldigt förenklat, innebär att två tunna skivor av ett halvledarmaterial, exempelvis kisel, sätts samman och kopplas till en yttre krets. Dessa solceller är relativt effektiva, med en verkningsgrad mellan 15 och 20%, men kan på inget sätt konkurrera som primär energikälla eftersom renheten på materialen, och därmed priset, är väldigt högt. Utvecklingen på området har dock inte stått stilla och en ny typ av solceller, tunnfilmssolcellen, har visat sig både effektiv och betydligt billigare att framställa. En annan typ av solceller, vars konstruktion och funktion skiljer sig drastiskt från de tidigare exemplen, är den färgämnessensiterade solcellen (DSC). Den färgämnessensiterade solcellen bygger på en rad viktiga upptäckter som gjordes under 1980 och 1990-talen, inom områden porösa elektroder och färgämnessensitering, och utgör fokus för den här avhandligen. Än så länge har DSC inte slagit igenom kommersiellt, vilket till stor del beror på att konceptet fortfarande är relativt nytt, men eftersom dess potential ligger i billig framställning med bibehållen hög effektivitet är forskning inom området i dagsläget mycket aktuellt. Den aktiva elektroden i den färgämnessensiterade solcellen består av en mesoporös film fastsatt på ett ledande substrat, vanligtvis glas. Den mesoporösa filmen består oftast av en mängd små titandioxidpartiklar1 (TiO2), vars individuella storlek är väldigt liten, mellan 10-50 nm (1nm=10-9 m). För att öka ledningsförmågan är filmen behandlad med värme, vilket gör att partiklarna smälts samman i kontaktytorna. Då tjockleken på en typisk film ligger mellan 5 och 30 μm (1 μm=10-6 m) så kan den totala arean inuti filmen vara mer än tusenfaldigt större än arean på elektroden. Eftersom TiO2 absorberar ljus dåligt, endast i den ultravioletta delen av solspektrat, så är elektroden sensiterad med hjälp av ett färgämne, vilket innebär att ett monolager, dvs. ett molekyllager, 1 Titandioxid är ett vanligt ämne som finns i bl. a. tandkräm, hudkräm och vit färg.

45
av färgämnet sitter fast på den porösa TiO2 ytan. Med tanke på att den interna arean är stor gör denna procedur att elektroden som helhet absorberar ljus utomordentligt bra. För att cellen ska vara komplett är den även försedd med en motelektrod, och för att den ska vara regenerativ är den dessutom fylld med en elektrolyt, vilket enkelt beskrivet är en elektriskt ledande vätska. En schematisk bild över sammansättningen och funktionen, vilken beskrivs i kommande stycke, kan ses i figuren nedan. Funktionen, dvs. omvandlingen av ljusenergi till elektrisk energi, bygger på att färgämnesmolekylerna absorberar ljuset och när detta sker övergår en del av ljusenergin till färgämnet (A i figuren ovan). Denna överskottsenergi födelas dock inte jämt över färgämnesmolekylen utan lokaliseras till en specifik elektron, valenselektronen. Ökningen i energi hos valenselektronen gör att den lyfts till en högre energinivå och kan därmed interagera med titandioxiden till vilken den överförs (B) och lämnar en positivt laddad, s.k. oxiderad, färgämnesmolekyl. Allt detta
I-/I3-
I-/I3-
I-/I3-
(A)
(C)(F)
N
S
COOH
NC
(B)
(D)
3I- I3-+2e-
(E)
I-/I3-
I-/I3-
I-/I3-
(A)
(C)(F)
N
S
COOH
NC
N
S
COOH
NC
(B)
(D)
3I- I3-+2e-
(E)
46
går oerhört fort, och en typisk tidsskala för elektronöverföringen är i femtosekunder (1 fs=10-15 s). När elektronen väl har kommit in i titandioxiden så transporteras den mot bakkontakten (C) där den extraheras och generar en elektrisk ström (D). För att systemet ska vara regenerativt så finns det i elektrolyten två olika jonslag, vanligtsvis jodid (I-) och trijodid (I3
-) där den enes (I-) uppgift är att neutralisera det oxiderade färgämnet och den andres (I3
-) att ta upp elektroner vid motelektroden. Eftersom dessa jonslag interagerar, rör sig, tar upp elektroner från motelektroden och överför elektroner sinsemellan (E) så kommer dessa aldrig att förbrukas utan regenereras vilket gör att solcellen som helhet kan generera ström under en, teoretiskt sett, obegränsad tid. Idealt sett så ger alltså varje absorberad foton en extraherad elektron, men reellt sett så förbrukas en del av elektronerna under transporten då de reagerar med oxiderade färgämnesmolekyler eller, vanligast, trijodid i elektrolyten (F). Effektiviteten för solcellen som helhet är alltså beroende på kopplingen mellan processerna (A)-(F). I det här arbetet har jag fokuserat på elektrontransporten, vilken är en viktig process då en snabb elektrontransport minskar riskerna för att elektronen ska rekombinera (förloras) under transporten vilket sker om en elektron inuti titandioxiden reagerar med en I3
--molekyl utan att ha hunnit extraheras. Den stora svårigheten i att förstå elektrontransporten ligger i den komplexa växelverkan som uppstår då mängder av elektroner och joner interagerar och ytterligare en faktor som försvårar förståelsen är att växelverkan sker i en mesoporös struktur. Under arbetets gång har jag studerat hur strukturen på den porösa elektroden inverkar på transporttiden, d.v.s. tiden från injektion till extrahering. Slutsatsen från den studien är att den mesoporösa strukturen ökar transporttiden med en faktor ~2, jämfört med ett solitt material. Jag har också studerat hur interaktionen mellan elektroner och joner inverkar på elektrontransporten och kommit fram till att transporten kan beskrivas av en ambipolär diffusionsmodell. Det innebär att elektroner och joner rör sig så att det genererade elektriska fältet blir ett minimum, vilket betyder att transporttiden är beroende på elektronkoncentration, jonslag och jonkoncentration.

47
Essensen av de senaste fem årens forskningarbete är en ökad förståelse av strukturens betydelse samt en större insikt i den komplexa växelverkan som sker mellan elektroner och joner. För att öka förståelsen av systemet som helhet krävs dock ytterligare forskning och efter den senaste tidens politiska uppvaknande när det gäller förnyelsebar energi så är jag övertygad om att så också blir fallet.

48
8. Acknowledgements The research effort behind this thesis is not a one-man’s work. Therefore, I would like to acknowledge those people who had, in one way or another, contributed specially to its creation. In alphabetical order, I would like to thank: Anders Hagfeldt Catelijne Grasso Christer Elvingsson Gerrit Boschloo Jarl Nissfolk Leif Häggman Mikhail Gorlov Sven Rühle Tannia Marinado Tomas Edvinsson
49
9. References
(1) Alley, R.; Berntsen, T.; Bindoff, N. L.; Chen, Z.; Chidthaisong, A.; Friedlingstein, P.; Gregory, J.; Hegerl, G.; Heimann, M.; Hewitson, B.; Hoskins, B.; Joos, F.; Jouzel, J.; Kattsov, V.; Lohmann, U.; Manning, M.; Matsumo, T.; Molina, M.; Nicholls, N.; Overpeck, J.; Qin, D.; Raga, G.; Ramaswamy, V.; Ren, J.; Rusticucci, M.; Solomon, S.; Somerville, R.; Stocker, T. F.; Stott, P.; Stouffer, R. J.; Whetton, P.; Wood, R. A.; Wratt, D. Climate change 2007: The physical science basis; IPCC, Ed., 2007.
(2) Oreskes, N. Science 2004, 306, 1686. (3) Gabriel, S.; Lutgen, B.; Chakarov, B.; Bursik, M.; Hedegaard,
C.; Machnig, M.; Randver, R.; Roche, D.; Kalogiannis, S.; Ruiz, N.; Burguette, J. A.; Olin, N.; Pecararo Scanio, A.; Fotion, F.; Puhitis, G.; Kundrotas, A.; Lux, L.; Persanyi, M.; Pullicino, G.; van Geel, P.; Pröll, P.; Szyszko, J.; Nunes Correia, F.; Barba, S.; Podobnik, J.; Izak, J.; Wallin, S.; Carlgren, A.; Miliband, D.; Pearson, I.; Dimas, S. Press Release 2785th Council Meeting Environment; Union, C. o. t. E., Ed., 2007.
(4) Becquerel, A. E. Comt. Rend. Acad. Sci. 1839, 9, 561. (5) Ohl, R. S. Light-sensitive electric device; Bell, Ed. US, 1941;
Vol. 2402622. (6) Ohl, R. S. Light-sensitive device including silicon; Bell, Ed. US,
1941; Vol. 2443542. (7) Chapin, D. M.; Fuller, C. S.; Pearson, G. L. J. Appl. Phys. 1954,
25, 676. (8) Goetzberger, A.; Hebling, C.; Schock, H. W. Mat. Sci. Eng.
2003, 40, 1. (9) UN “Kyoto protocol to the united nations framework convention
on climate change,” UN, 1998. (10) Shell “Shell renewable energy information brochure,” 1997. (11) Grätzel, M. Nature 2001, 414, 338. (12) IEA “Key world energy statistics,” 2006. (13) Green, M.; Emery, K.; King, D. L.; Igari, S.; Warta, W. Prog.
Photovolt: Res. Appl. 2003, 11, 347. (14) Fujishima, A.; Honda, K. Nature 1972, 238, 37.

50
(15) Solbrand, A. Charge Transport in Nanostructured Metal Oxide Thin Film Electrodes, Uppsala, 1998.
(16) Tributsch, H. Ber. Bunsenges. Phys. Chem 1969, 73, 582. (17) Gerischer, H.; Willig, F. Top. Curr. Chem 1976, 61, 31. (18) Gerischer, H. Photochem. Photobiol. 1972, 16, 243. (19) Gerischer, H.; Tributsch, H. Ber. Bunsenges. Phys. Chem 1968,
72, 437. (20) Desilvestro, J.; Graetzel, M.; Kavan, L.; Moser, J.; Augustynski,
J. J. Am. Chem. Soc 1985, 107, 2988. (21) O'Regan, B.; Graetzel, M. Nature 1991, 353, 737. (22) Chiba, Y.; Islam, A.; Watanabe, Y.; Komiya, R.; Koide, N.;
Han, L. Jpn. J. Appl. Phys. 2006, 45, 638. (23) Kroon, J. M.; Bakker, N. J.; Smit, H. J. P.; Liska, P.; Thampi, K.
R.; Grätzel, M.; Hinsch, A.; Hore, S.; Durrant, J. R.; Palomares, E.; Pettersson, H.; Gruszecki, T.; Walter, J.; Skupien, K.; Tulloch, G. “New concepts and materials for world-class dye sensitized solar cells”; 19th EU PVSEC, 2004, Paris.
(24) Hinsch, A.; Kroon, J. M.; Kern, R.; Uhlendorf, I.; Holzbock, J.; Meyer, A.; Ferber, J. Prog. Photovolt. Res. Appl. 2001, 9, 425.
(25) Kroon, J. M.; Hinsch, A.; van Roosmalen, J. A. M.; van der Burg, N. P. G.; Bakker, N. J.; Kinderman, R.; Sommeling, P. M.; Späth, M.; Kern, R.; Sastrawan, R.; Ferber, J.; Schubert, M.; Hasenhindl, G.; Schill, C.; Lorenz, M.; Stangl, R.; Baumgärtner, S.; Peter, C.; Meyer, A.; Meyer, T.; Uhlendorf, I.; Holzbock, J.; Niepmann, R. “Long term stability of dye-sensitised solar cells for large area power applications,” 2001.
(26) Wang, P.; Zakeeruddin, S. M.; Moser, J. E.; Nazeeruddin, K.; Sekiguchi, T.; Grätzel, M. Nat. Mat. 2003, 2, 402.
(27) Figgemeier, E.; Hagfeldt, A. Int. J. Photoenergy 2004, 6, 127. (28) Greijer Agrell, H.; Lindgren, J.; Hagfeldt, A. Sol. Energy 2003,
75, 169. (29) Nour-Mohhamadi, F.; Nguyen, S. D.; Boschloo, G.; Hagfeldt,
A.; Lund, T. J. Phys. Chem. B 2005, 109, 22413. (30) Bard, A. J.; Faulkner, L. R. Electrochemical Methods,
Fundamentals and Applications; John Wiley & Sons, Inc., 1980. (31) Memming, R. Semiconductor Electrochemistry; Wiley-Vch,
2001.

51
(32) Sze, S. M. Physics of Semiconductor Devices; John Wiley & Sons: New York, 1981.
(33) Zistler, M.; Wachter, P.; Wassersheid, P.; Gerhard, D.; Hinsch, A.; Sastrawan, R.; Gores, H. J. Electrochim. Acta 2006, 52, 161.
(34) Paulsson, H.; Berglund, M.; Svantesson, E.; Hagfeldt, A.; Kloo, L. Sol. Energy Mater. Sol. Cells 2004, 82, 345.
(35) Wang, P.; Zakeeruddin, S. M.; Humphry-Baker, R.; Grätzel, M. Chem. Mater. 2004, 16, 2694.
(36) Hagfeldt, A.; Grätzel, M. Acc. Chem. Res. 2000, 33, 269. (37) Schlichthörl, G.; Huang, S. Y.; Sprague, J.; Frank, A. J. J. Phys.
Chem. B 1997, 101, 8139. (38) Goossens, A. J. Electrochem. Soc 1996, 143, L131. (39) Hodes, G.; Howell, I. D. J.; Peter, L. M. J. Electrochem. Soc.
1992, 139, 3136. (40) Södergren, S.; Hagfeldt, A.; Olsson, J.; Lindquist, S. E. J. Phys.
Chem. B 1994, 98, 5552. (41) Hagfeldt, A.; Bjoerksten, U.; Lindquist, S. E. Sol. Energy Mater.
Sol. Cells 1992, 27, 293. (42) Lindström, H.; Holmberg, A.; Magnusson, E.; Lindquist, S.-E.;
Malmqvist, L.; Hagfeldt, A. Nano Lett. 2001, 1, 97. (43) Lindström, H.; Magnusson, E.; Holmberg, A.; Södergren, S.;
Lindquist, S.-E.; Hagfeldt, A. Sol. Energy Mat. Sol. Cells 2002, 73, 91.
(44) Keis, K.; Magnusson, E.; Lindström, H.; Lindquist, S.-E.; Hagfeldt, A. Sol. Energy Mat. Sol. Cells 2002, 73, 51.
(45) Bergeron, B. V.; Marton, A.; Oskam, G.; Meyer, G. J. J. Phys. Chem. B 2005, 109, 937.
(46) Benkstein, K. D.; Kopidakis, N.; van de Lagemaat, J.; Frank, A. J. J. Phys. Chem. B 2003, 107, 7759.
(47) Nazeeruddin, M. K.; Humphry-Baker, R.; Liska, P.; Grätzel, M. J. Phys. Chem. B 2003, 107, 8981.
(48) Aiga, F.; Tsada, T. J. Molec. Str. 2003, 658, 25. (49) Hagberg, D. P.; Edvinsson, T.; Marinado, T.; Boschloo, G.;
Hagfeldt, A.; Sun, L. Chem. Comm. 2006, 2245. (50) Ito, S.; Zakeeruddin, S. M.; Humphry-Baker, R.; Liska, P.;
Charvet, R.; Comte, P.; Nazeeruddin, M. K.; Pechy, P.; Takata, M.; Miura, H.; Uchida, M.; Grätzel, M. Adv. Mater. 2006, 18, 1202.
52
(51) Nakade, S.; Makimoto, Y.; Kubo, W.; Kitamura, T.; Wada, Y.; Yanagida, S. J. Phys. Chem. B 2005, 109, 3488.
(52) Boschloo, G.; Häggman, L.; Hagfeldt, A. J. Phys. Chem. B 2006, 110, 13144.
(53) de Jongh, P. E.; Vanmaekelbergh, D. Phys. Rev. Lett 1996, 77, 3427.
(54) Frank, A. J.; Kopidakis, N.; van de Lagemaat, J. Coord. Chem. Rev. 2004, 248, 1165.
(55) van de Lagemaat, J.; Frank, A. J. J. Phys. Chem. B 2001, 105, 11194.
(56) Kopidakis, N.; Neale, N. R.; Zhu, K.; van de Lagemaat, J.; Frank, A. J. Appl. Phys. Lett. 2005, 87, 202106.
(57) Schwarzburg, K.; Willig, F. Appl. Phys. Lett. 1991, 58, 2520. (58) Dloczik, L.; Ileperuma, O.; Lauermann, I.; Peter, L. M.;
Ponomarev, E. A.; Redmond, G.; Shaw, N. J.; Uhlendorf, I. J. Phys. Chem. B 1997, 101, 10281.
(59) Schlichthörl, G.; Park, N. G.; Frank, A. J. J. Phys. Chem. B 1999, 103, 782.
(60) Vanmaekelbergh, D.; de Jongh, P. E. Phys. Rev. B 2000, 61, 4699.
(61) van de Lagemaat, J.; Park, N. G.; Frank, A. J. J. Phys. Chem. B 2000, 104, 2044.
(62) Kopidakis, N.; Schiff, E. A.; Park, N. G.; van de Lagemaat, J.; Frank, A. J. J. Phys. Chem. B 2000, 104, 3930.
(63) Solbrand, A.; Lindström, H.; Rensmo, H.; Hagfeldt, A.; Lindquist, S. E.; Södergren, S. J. Phys. Chem. B 1997, 101, 2514.
(64) Nistér, D.; Keis, K.; Lindquist, S.-E.; Hagfeldt, A. Sol. Energy Mat. Sol. Cells 2002, 73, 411.
(65) Nakade, S.; Kambe, S.; Matsuda, M.; Saito, Y.; Kitamura, T.; Wada, Y.; Yanagida, S. Physica E. 2002, 14, 210.
(66) Nakade, S.; Saito, Y.; Kubo, W.; Kitamura, T.; Wada, Y.; Yanagida, S. J. Phys Chem. B 2003, 107, 8607.
(67) Cass, M. J.; Walker, A. B.; Martinez, D.; Peter, L. M. J. Phys. Chem. B 2005, 109, 5100.
(68) Cass, M. J.; Qiu, F. L.; Walker, A. B.; Fisher, A. C.; Peter, L. M. J. Phys. Chem. B 2003, 107, 113.

53
(69) Green, A. N. M.; Chandler, R. E.; Haque, S. A.; Nelson, J.; Durrant, J. R. J. Phys. Chem. B 2005, 109, 142.
(70) Solbrand, A.; Henningsson, A.; Södergren, S.; Lindström, H.; Hagfeldt, A.; Lindquist., S.-E. J. Phys. Chem. B 1999, 103, 1078.
(71) Solbrand, A.; Keis, K.; Södergren, S.; Lindström, H.; Lindquist, S.-E.; Hagfeldt, A. Sol. Energy Mater. Sol. Cells 2000, 60, 181.
(72) Zhu, K.; Kopidakis, N.; Neale, N. R.; van de Lagemaat, J.; Frank, A. J. J. Phys. Chem. B 2006, 110, 25174.
(73) Cameron, P. J.; Peter, L. M. J. Phys. Chem. B 2005, 109, 7392. (74) Cameron, P. J.; Peter, L. M.; Hore, S. J. Phys. Chem. B 2005,
109, 930. (75) Salvador, P.; Gonzalez Hidalgo, M.; Zaban, A.; Bisquert, J. J.
Phys. Chem. B 2005, 109, 15915. (76) Zaban, A.; Greenshtein, M.; Bisquert, J. Chem. Phys. Chem.
2003, 4, 859. (77) Bailes, M.; Cameron, P. J.; Lobato, K.; Peter, L. M. J. Phys.
Chem. B 2005, 109, 15429. (78) Duffy, N. W.; Peter, L. M.; Rajapakse, R. M. G.; Wijayantha, K.
G. U. Electrochem. Comm. 2000, 2, 658. (79) van de Lagemaat, J.; Frank, A. J. J. Phys. Chem. B 2000, 104,
4292. (80) Nelson, J. Phys. Rev. B 1999, 59, 15374. (81) Cameron, P. J.; Peter, L. M. J. Phys. Chem. B 2003, 107, 14394. (82) Fredin, K. Unpublished results. (83) Fredin, K. Unpublished results. (84) Tributsch, H. Coord. Chem. Rev 2004, 248, 1511. (85) Ferber, J.; Stangl, R.; Luther, J. Sol. Energy Mat. Sol. Cells
1998, 53, 29. (86) Ferber, J.; Luther, J. J. Phys. Chem. B 2001, 105, 4895. (87) Nelson, J.; Chandler, R. Coord. Chem. Rev 2004, 248, 1181. (88) Kambili, A.; Walker, A. B.; Qiu, F. L.; Fisher, A. C.; Savin, A.
D.; Peter, L. M. Physica E 2002, 14, 203. (89) Westermark, K.; Henningsson, A.; Rensmo, H.; Sodergren, S.;
Siegbahn, H.; Hagfeldt, A. Chem. Phys. 2002, 285, 157. (90) Peter, L. M.; Wijayantha, K. G. U. Electrochem. Comm. 1999, 1,
576. (91) Bisquert, J.; Vikhrenko, V. J. Phys. Chem. B 2004, 108, 2313.

54
(92) Nakade, S.; Kambe, S.; Kitamura, T.; Wada, Y.; Yanagida, S. J. Phys. Chem. B 2001, 105, 9150.
(93) van Roosebroeck, W. Phys. Rev. 1953, 91, 282. (94) Park, N. G.; van de Lagemaat, J.; Frank, A. J. J. Phys. Chem. B
2000, 104, 8989. (95) Young, H. D.; Freedman, R. A. University Physics; Addison-
Wesley publishing company, inc, 1996.