Embed Size (px)
Citation preview
Studies of New Multiferroics
by
Ruth Agnes McKinnon
Thesis
Submitted to the University of Warwick
for the degree of
Masters of Science (by research)
Department of Physics
September 2011

i
Contents Acknowledgments iii
Declaration iv
Abstract 1
Chapter 1 Introduction 3
1.1 Multiferroics 4
1.2 RFe2O4 7
1.3 Orthorhombic RMnO3 16
Chapter 2 Experimental Methods 23
2.1 Sample Preparation 23
2.2 Single Crystal Growth: Floating Zone Technique 24
2.3 Powder x-ray Diffraction 25
2.4 Laue x-ray Diffraction 26
2.5 Magnetisation 26
2.6 Physical Properties Measurements System (PPMS) 27
2.6.1 Thermal Response 28
2.6.2 Electrical Response 28
(i) Dielectric Constant 29
(ii) Polarisation 31
Chapter 3 Multiferroic Properties of LuFe2O4 34
3.1 Sample Preparation and Crystal Growth 35
3.2 Powder x-ray Diffraction 38
3.3 Magnetic Properties 42
(i) Polycrystalline Sample 42

ii
(ii) CO2/CO=3 Single Crystal 43
(iii) CO2/CO=5 Single Crystal 45
3.4 Dielectric Properties 48
(i) Polycrystalline Sample 49
(ii) CO2/CO=3 Single Crystal 50
(iii) CO2/CO=5 Single Crystal 52
3.5 Polarisation 58
(i) Polycrystalline Sample 59
(ii) CO2/CO=3 Single Crystal 59
(iii) CO2/CO=5 Single Crystal 60
3.6 Discussion 62
3.7 Conclusion 74
3.8 Further Work 75
Chapter 4 Multiferroic Properties of Gd0.9Lu0.1MnO3 77
4.1 Powder x-ray Diffraction 78
4.2 Magnetic Properties 79
4.3 Heat Capacity 81
4.4 Dielectric Properties 81
(i) Zero Field 82
(ii) H//a 82
(iii) H//b 83
(iv) H//c 83
4.5 Polarisation 85
(i) Zero Field 86
(ii) H//a 86
(iii) H//b 86
(iv) H//c 87
4.6 Discussion 89
4.7 Conclusion 98
4.8 Further Work 98
References 100

iii
Acknowledgments I would like to thank Geetha Balakrishnan, my supervisor, for all the help she has given
me throughout my M.Sc. My thanks also go to Martin Lees for his guidance with the
laboratory measurements and the work completed on the Gd0.9Lu0.1MnO3 single crystal.
I would also like to thank Tom Orton, Oleg Petrenko, Dean Keeble, Ravi Singh and Don
McK.Paul as well as all the members of the Superconductivity and Magnetism group at
the University of Warwick for their advice and assistance thought this past year.

iv
Declaration The work presented in this thesis was carried out by me, except where explicitly stated.
All of the work took place between October 2010 and September 2011 and was carried
out at the Department of Physics at the University of Warwick. The experimental data
presented in Chapter 4 was collected from a Gd0.9Lu0.1MnO3 single crystal previously
grown and oriented by Da-qian Liao at the University of Warwick. All Rietveld
refinements of the powder x-ray diffraction data were performed under the guidance of
Dean Keeble.
1
Abstract Research into multiferroicity has increased dramatically in recent years. A number of
new rare-earth oxides have been shown to exhibit a coupling between magnetism and
ferroelectricity. Following this area of research, the project investigates the
multiferroic properties of LuFe2O4 and Gd0.9Lu0.1MnO3 in single crystal form.
Multiferroic LuFe2O4 is a charge ordered ferroelectric which shows a coupling between
magnetisation and electric polarisation near room temperature. In order to investigate
how sample preparation and crystal growth environment affect final stoichiometry in
LuFe2O4, two single crystals of the rare-earth oxide were grown using the floating zone
method. Single crystals of different oxygen stoichiometry were prepared by altering the
ratio of the CO2/CO gas atmosphere used during single crystal growth. The magnetic
and electric properties of the oriented single crystals and polycrystalline sample were
investigated by measuring the magnetisation, dielectric constant and polarisation in
zero and applied magnetic fields. A paramagnetic to ferrimagnetic ordering of the Fe
moments along the c-axis was observed below 250K in both single crystals and the
polycrystalline sample. The presence of this transition in the polarisation data confirms
the multiferroic nature of the LuFe2O4-δ samples. A magnetostructural transition was
also observed below 200K in the polycrystalline sample and the single crystal grown in
the CO2/CO=5 gas atmosphere. The absence of this transition for the single crystal
grown in the CO2/CO=3 gas atmosphere is an indication of poor oxygen stoichiometry
within this crystal. A ferroelectric state was observed in the polycrystalline and single
crystal samples below 280K. The temperature of ferroelectric transition observed for
the LuFe2O4-δ samples is lower than the ferroelectric 2D to 3D charge ordering
temperature reported in the literature.
Doping at the rare-earth site of the orthorhombic manganites is an effective method for
tuning the average Mn-O-Mn bond angle. By adjusting the distortion of the MnO6 lattice
a multiferroic ground state can be induced in a series with a non-multiferroic parent
compound. The effect of Lu-doping on the magnetic and electric properties of GdMnO3
has been investigated. Heat capacity, magnetisation, dielectric constant and

2
polarisation data have been collected from an oriented single crystal of Gd0.9Lu0.1MnO3.
Due to the close proximity of Gd0.9Lu0.1MnO3 to multiferroic TbMnO3 in the spin
ordering phase diagram a series of features below the incommensurate (IC)
antiferromagnetic (AF) ordering temperature, not present in GdMnO3, have been
observed in the zero and applied magnetic field experimental data. The absence of a
canted A-type AF state below this transition, normally present for the parent
compound, and the persistence of a ferroelectric state in magnetic fields applied along
the a and b-axis allow for the suggestion of a new magnetically ordered ferroelectric
state, influenced by the ordering of the Gd moments, to occur in Gd0.9Lu0.1MnO3 .

3
Chapter 1
Introduction
The intrinsic coupling between magnetic interactions and the motion of electric
charges, two phenomena though to be independent of each other because of their
seemingly different origins, was first postulated by James Clerk Maxwell in 1865. The
search for materials in which magnetism and ferroelectricity coexist is driven by the
prospect of controlling charges by applied magnetic fields and spins by applied voltages
[1]. Exploitation of the coupling between these primary order parameters may lead to
the development of new multifunctional storage components for microelectronics [2].
The ferroelectric component of many of these materials is already in use in many
modern electric devices such as filtering devices and high-performance insulators [3].
In recent years, a number of new rare-earth oxides have been shown to exhibit this
type of coupling. Following this area of research, the project investigates the properties
of some of these materials in single crystal form.

4
1.1 Multiferroics
A material that exhibits two or more primary ferroic properties such as
ferromagnetism, ferroelectricity, ferroelasticity or ferrotoroidicity is described as a
multiferroic. This definition was originally proposed by Schmid in an effort to
characterise materials and the effects that allow the formation of switchable domains
[4, 5]. All of the primary ferroics described form small regions of order, known as
domains, within the material. Domains of different orientation are separated by domain
walls. Application of an appropriate field, such as a magnetic field on a magnetic
material, can cause the domains to align [6]. The term multiferroic is more commonly
associated with magnetic ferroelectrics, examples of which are investigated within this
thesis.
The ability to combine magnetic and ferroelectic properties within one material and the
potential functionality that can be achieved has resulted in much of the early work on
multiferroics being concentrated within magnetic ferroelectrics [7]. Combining these
two properties has, however, proven to be difficult. Normally, these two order
parameters are mutually exclusive; yet a number of materials have simultaneously
presented magnetic and ferroelectric properties. Coupling of the parameters within the
multiferroic system tends to be weak. The microscopic mechanisms of magnetism and
ferroelectricity are very different from each other therefore do not strongly interfere
[1].
The exclusivity between magnetism and ferroelectricity and the microscopic conditions
required for the coupling of these different degrees of freedom can be explained using
the symmetry requirements shown in Fig 1.1. The magnetic moment within a
ferromagnet, depicted as a charge tracing an orbit, is unchanged under spatial
inversion, however, the direction of the orbit and therefore the magnetic moment
changes under time inversion. The opposite is true for a ferroelectic. Considering a
ferroelectric material as a positive point charge lying asymmetrically in a crystal unit
cell, spatial inversion reverses the polarisation while time inversion has no effect. A
multiferroic shows no spatial or time invariance [8].

5
A problem when trying to create a new multiferroic material is that multiferroics do
not follow one specific theory [9]. The microscopic nature of magnetic ordering is well
understood and generally follows the same principles as all insulating magnetic
materials [7]. A material will possess a magnetic moment if it contains transition metal
or rare earth ions with partially filled d or f electron shells. Ions with full shells are non-
magnetic as the spins of the electrons add to zero so do not participate in the magnetic
ordering. Long-range magnetic ordering within the material occurs as a result of
exchange interactions (virtual hopping of electrons) between the partially filled d shells
of different ions [1]. The type of ordering (i.e. ferromagnetic, antiferromagnetic) is
dependent on the form of the exchange [6]. The theory of ferroelectricity on the other
hand is not as well defined; a number of different mechanisms and types of
ferroelectric order exist, many of which are not all fully understood [7]. Most
ferroelectrics are transition metal oxides containing transition metal ions with empty d
electron shells. Traditionally, these materials become ferroelectric when the positively
charged metal ions form covalent bonds with neighbouring negatively charged oxygen
ions through the virtual hopping of electrons from the filled oxygen shells to the empty
d shells. An electric polarisation is then induced within these materials as a result of a
relative diplacment of cations and anions within the periodic crystal. Although
magnetism and ferroelectricity share the same mechanism of electron exchange it is the
contrast of empty and partially filled d or f electron shells that make the properties
mutually exclusive [1]. Consequently, nearly every multiferroic material has to be
studied in its own right. The theories defining the mechanisms within one multiferroic
can ultimately be very different from the next [9].
Fig. 1.1: The time-reversal and spatial-inversion symmetry in (a) Ferromagnets, (b)
Ferroelectrics and (c) Multiferroics.[8]
6
Coupling between magnetic and electric degrees of freedom is not a new phenomenon.
The induction of magnetisation by an electric field or of polarisation by a magnetic field
has long been studied under the name ‘magnetoelectric effect’ [7]. The linear
magnetoelectric coupling term α linking the magnetic and electric degrees of freedom
is shown in the relation for the free energy of a material in an electric and/or a
magnetic field,[10]
F(E, H) = F0-PisEi – Mi
sHi - ½ε0εijEiEj - ½μ0μijHiHj – αijEiHj
- ½βijkEiHjHk - ½γijkHiEjEk - … (Eq. 1.1).
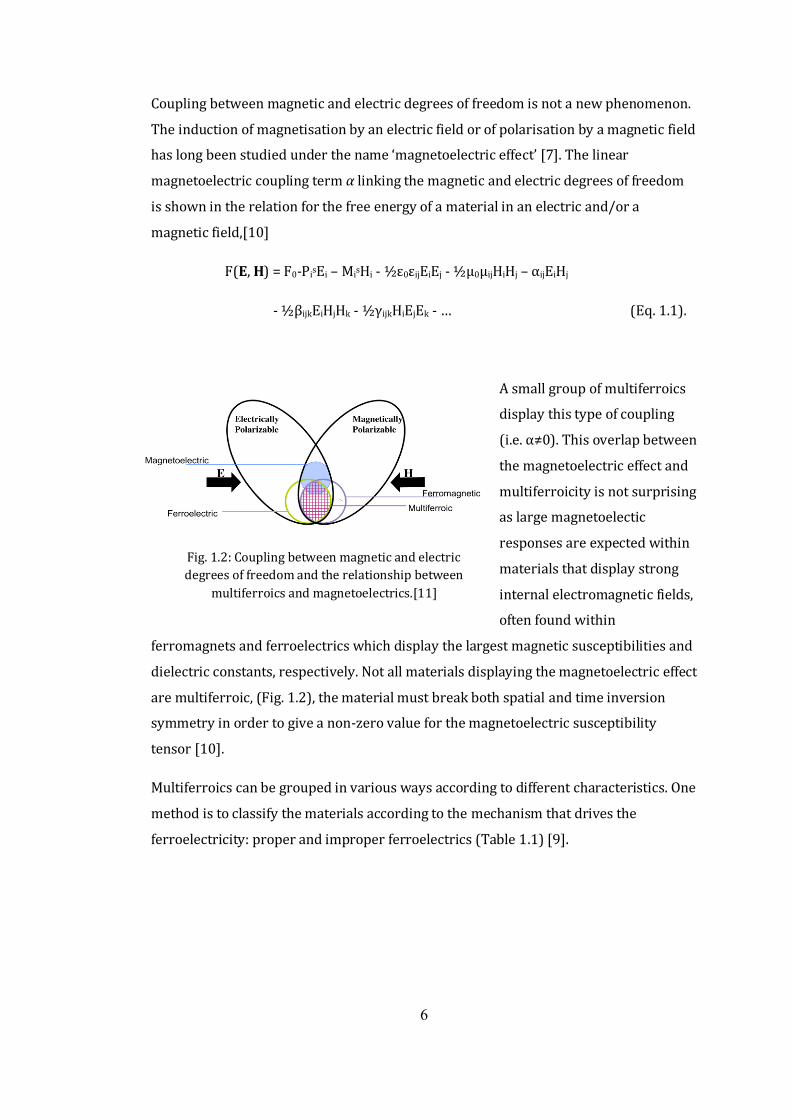
A small group of multiferroics
display this type of coupling
(i.e. α≠0). This overlap between
the magnetoelectric effect and
multiferroicity is not surprising
as large magnetoelectic
responses are expected within
materials that display strong
internal electromagnetic fields,
often found within
ferromagnets and ferroelectrics which display the largest magnetic susceptibilities and
dielectric constants, respectively. Not all materials displaying the magnetoelectric effect
are multiferroic, (Fig. 1.2), the material must break both spatial and time inversion
symmetry in order to give a non-zero value for the magnetoelectric susceptibility
tensor [10].
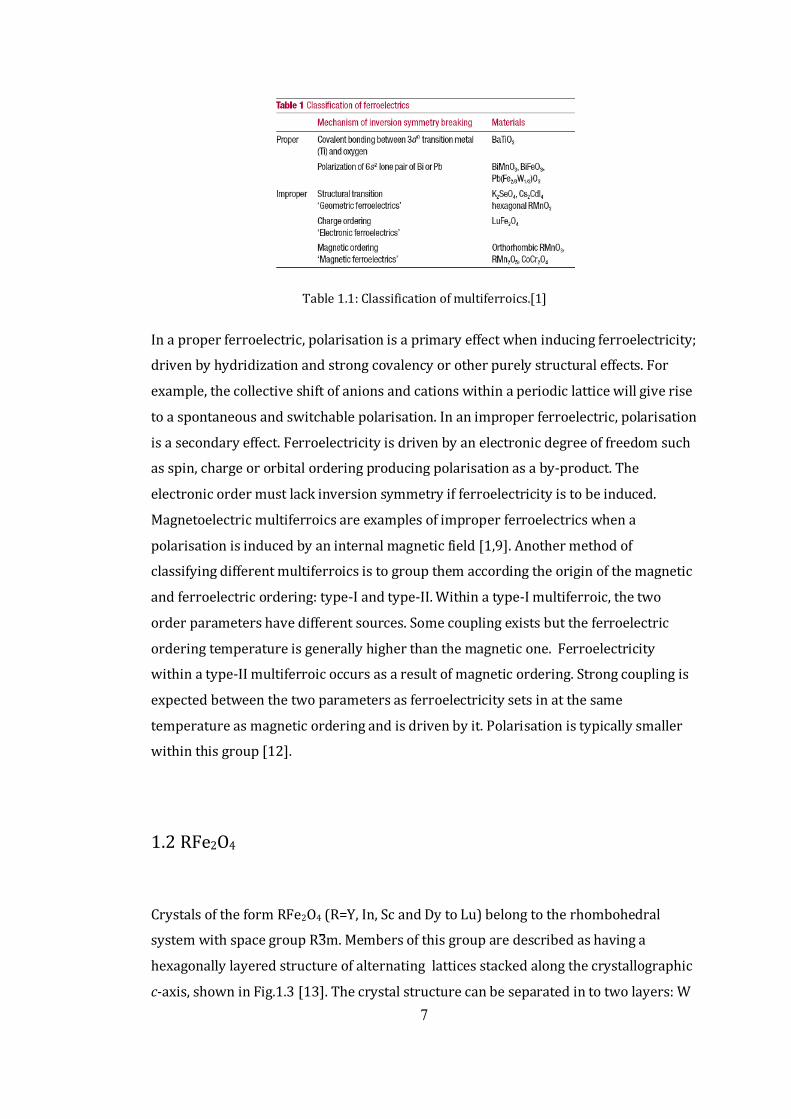
Multiferroics can be grouped in various ways according to different characteristics. One
method is to classify the materials according to the mechanism that drives the
ferroelectricity: proper and improper ferroelectrics (Table 1.1) [9].
Fig. 1.2: Coupling between magnetic and electric
degrees of freedom and the relationship between
multiferroics and magnetoelectrics.[11]
7
In a proper ferroelectric, polarisation is a primary effect when inducing ferroelectricity;
driven by hydridization and strong covalency or other purely structural effects. For
example, the collective shift of anions and cations within a periodic lattice will give rise
to a spontaneous and switchable polarisation. In an improper ferroelectric, polarisation
is a secondary effect. Ferroelectricity is driven by an electronic degree of freedom such
as spin, charge or orbital ordering producing polarisation as a by-product. The
electronic order must lack inversion symmetry if ferroelectricity is to be induced.
Magnetoelectric multiferroics are examples of improper ferroelectrics when a
polarisation is induced by an internal magnetic field [1,9]. Another method of
classifying different multiferroics is to group them according the origin of the magnetic
and ferroelectric ordering: type-I and type-II. Within a type-I multiferroic, the two
order parameters have different sources. Some coupling exists but the ferroelectric
ordering temperature is generally higher than the magnetic one. Ferroelectricity
within a type-II multiferroic occurs as a result of magnetic ordering. Strong coupling is
expected between the two parameters as ferroelectricity sets in at the same
temperature as magnetic ordering and is driven by it. Polarisation is typically smaller
within this group [12].
1.2 RFe2O4
Crystals of the form RFe2O4 (R=Y, In, Sc and Dy to Lu) belong to the rhombohedral
system with space group R3m. Members of this group are described as having a
hexagonally layered structure of alternating lattices stacked along the crystallographic
c-axis, shown in Fig.1.3 [13]. The crystal structure can be separated in to two layers: W
Table 1.1: Classification of multiferroics.[1]
8
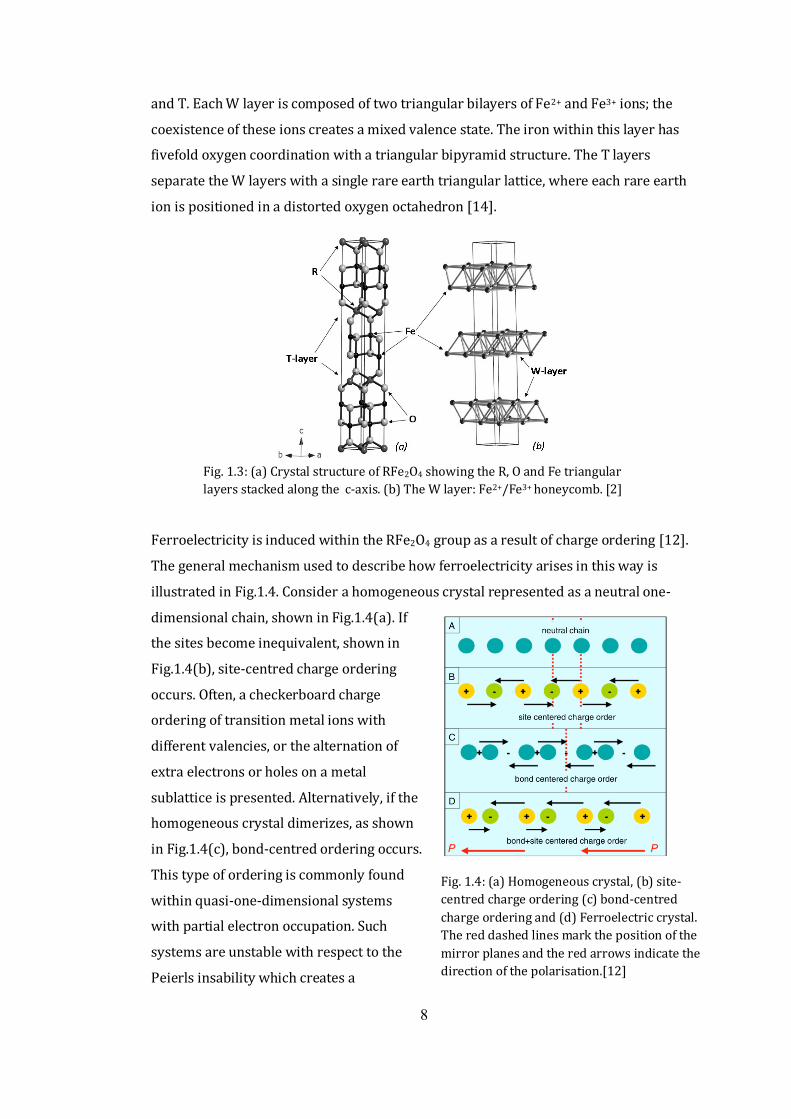
and T. Each W layer is composed of two triangular bilayers of Fe2+ and Fe3+ ions; the
coexistence of these ions creates a mixed valence state. The iron within this layer has
fivefold oxygen coordination with a triangular bipyramid structure. The T layers
separate the W layers with a single rare earth triangular lattice, where each rare earth
ion is positioned in a distorted oxygen octahedron [14].
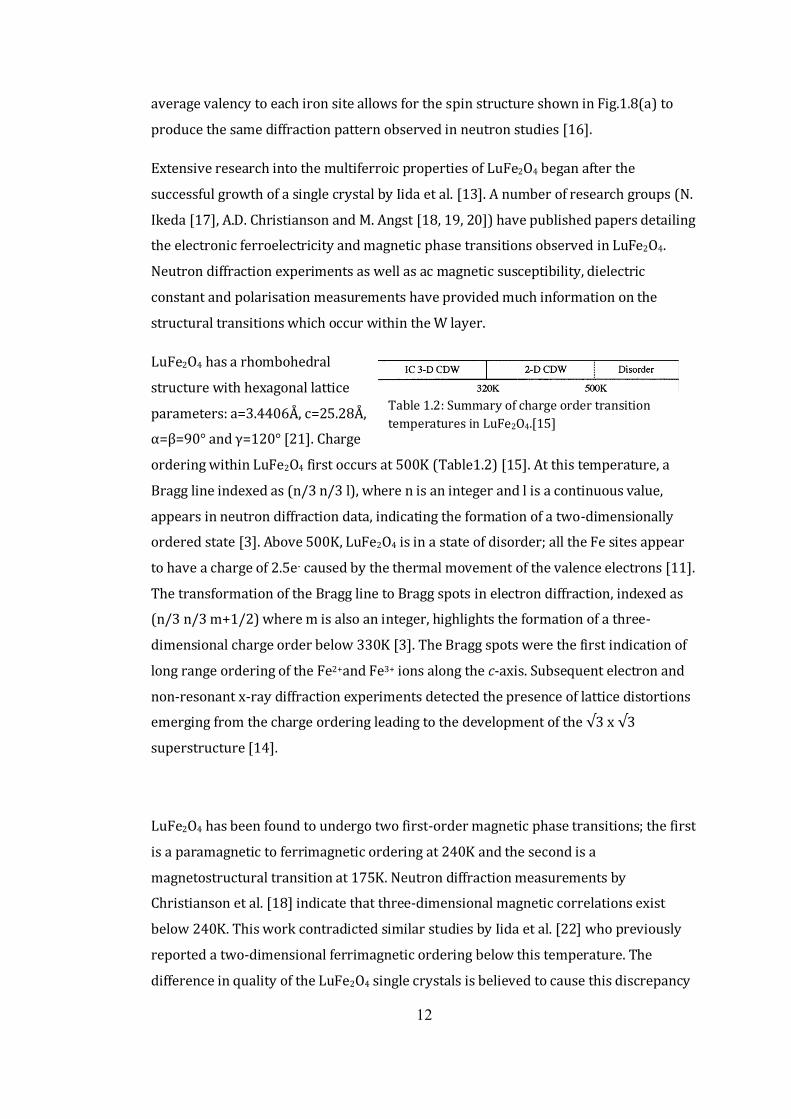
Ferroelectricity is induced within the RFe2O4 group as a result of charge ordering [12].
The general mechanism used to describe how ferroelectricity arises in this way is
illustrated in Fig.1.4. Consider a homogeneous crystal represented as a neutral one-
dimensional chain, shown in Fig.1.4(a). If
the sites become inequivalent, shown in
Fig.1.4(b), site-centred charge ordering
occurs. Often, a checkerboard charge
ordering of transition metal ions with
different valencies, or the alternation of
extra electrons or holes on a metal
sublattice is presented. Alternatively, if the
homogeneous crystal dimerizes, as shown
in Fig.1.4(c), bond-centred ordering occurs.
This type of ordering is commonly found
within quasi-one-dimensional systems
with partial electron occupation. Such
systems are unstable with respect to the
Peierls insability which creates a
Fig. 1.3: (a) Crystal structure of RFe2O4 showing the R, O and Fe triangular
layers stacked along the c-axis. (b) The W layer: Fe2+/Fe3+ honeycomb. [2]
Fig. 1.4: (a) Homogeneous crystal, (b) site-
centred charge ordering (c) bond-centred
charge ordering and (d) Ferroelectric crystal.
The red dashed lines mark the position of the
mirror planes and the red arrows indicate the
direction of the polarisation.[12]

9
spontaneous dimerization of the atoms known as a Peierls distortion. Within these
systems the sites remain equivalent but the dimerization creates an alternate series of
strong and weak bonds, the stronger bond having higher electron density. Site- and
bond-centred ordering are both centrosymmetric therefore do not break spatial
inversion symmetry. No net dipole moment forms within the two systems, which is
made explicit by the presence of mirror planes. Ferroelectricity can only arise when
both types of charge order occur simultaneously. Inversion symmetry is broken in this
case and each molecule, shown in Fig.1.4(d), develops a net polarisation [7, 12].
Traditionally, charge order induced ferroelectricity arises from the ionic displacement
of anions and cations within the crystal lattice, typically observed in multiferroics such
as BaTiO3 [12]. This type of charge ordering does not occur in RFe2O4. Ferroelectricity
within the mixed valence RFe2O4 is associated with electron correlations between the
iron ions. Charge ordering within the Fe lattice arises from the repulsive property of
electrons acting on a frustrated geometry rather than the displacement of ions [3].
RFe2O4 is classified as an improper ferroelectric and a type-I multiferroic [1, 12].
The layered structure in RFe2O4 gives
the system a two-dimensional
character. The spin or charge
coupling of irons within the a-b
plane is stronger than along the c-
axis which brings about an
anisotropic ordering of the spin and charge. The charge ordering in RFe2O4 originates
from a charge frustration within the W layer [14]. The usual checkerboard Fe2+/Fe3+ is
not favourable within this system as a result of the frustrated nature of the triangular
iron lattice [12]. Frustration arises when it is not
possible to satisfy all the interactions in a system
to find a ground state [6]. A two-dimensional
hexagonal lattice showing spin and charge
frustration is illustrated in Fig.1.5. Arrangement
of an equal number of Fe2+and Fe3+ leads to
frustration of the common nearest-neighbour site
Fig. 1.5: (a) spin frustration and (b) charge frustration
on a two-dimensional hexagonal lattice.[15]
Fig. 1.6: Honeycomb lattice
showing Fe2+rich and Fe3+ rich
bilayers.[16]

10
of a Fe2+-Fe3+ pair. This frustration means that the ground state of the system tends to
be degenerate, represented by the grey site in Fig.1.5(b) [15]. It is not possible to create
a single unique ground state within these frustrated systems, however, by having a
variety of similar low energy states the instability of a non-minimization of energy can
be reduced [6]. Since the energy of the ground state is completely degenerate, the spin
ordering process is also affected as there is no preference of↑ or ↓ spin at the common
nearest-neighbour site in an antiferromagnetic system, shown in Fig.1.5(a)[15]. A
polar charged state is stabilized by dividing the bilayers, in each W layer, into a Fe2+and
Fe3+ rich layer. The rare Fe3+and Fe2+ ions in each bilayer are located at the centre of the
Fe2+and Fe3+ honeycombs (Fig.1.6) [16]. The charge ordered unit cell is depicted in
Fig.1.7, this supercell is called a √3 x √3 structure [3].
RFe2O4 materials show a strong uniaxial magnetic anisotropy with the easy axis along
the c-axis. The ferrimagnetic ordering of the Fe2+and Fe3+ ions originates from the
fivefold oxygen coordination with the Fe lattice [14]. The Fe2+ ions within the system
have a large orbital moment and align ferromagnetically with each other. The Fe3+ ions
have a negligible orbital moment. The overall spin alignment of the Fe triangular lattice
is determined by the competition between Fe2+-Fe3+ double exchange and Fe3+-Fe3+
superexchange interactions [16]. Double exchange interactions favour ferromagnetic
order whereas superexchange favours antiferromagnetic order [6]. Consequently, a 1:2
ferrimagnetic spin order, where one Fe3+spin is parallel and the other two spins are
antiparallel to the ferromagnetic Fe2+ spin, is expected. Two possible spin structures
result from these spin alignments: the parallel Fe3+ spin can either be in the Fe3+ rich
plane or in the Fe2+rich plan, illustrated in Fig.1.8 (a) and (b), respectively. X-ray
magnetic circular dichroism (XMCD) experimental and theoretical spectra have shown
to match well in the case of the parallel Fe3+ spin in the Fe3+ rich layer. Mössbauer
Fig. 1.7: Chemical unit cell and √3 x √3
superlattice cell marked by solid and dotted
lines, respectively. Arrows indicate the direction
of the polarisation P and wave vector Q showing
the charge wave.[3]

11
studies have also concluded that three distinguishable Fe3+ sites exist, one of which has
an antiparallel spin alignment in the Fe3+ layer [16]. This spin structure can be
explained by superexchange interactions between the Fe3+-Fe3+ ions. Superexchange is
defined as an indirect exchange interaction between non-neighbouring magnetic ions
which is mediated by a non-magnetic ion positioned between the two magnetic ions
[6]. In this example, oxygen is the mediating ion. Superexchange is favoured when there
is a large overlap between Fe3+ and O orbitals. Consequently, the strength of the
exchange is dependent upon the angle of the Fe3+-0-Fe3+ bond. The Fe3+ ions in separate
bilayers form a bonding angle of 97° to each other whereas Fe3+ ions in the same Fe3+
rich layer bond at an angle of 118°. The optimum bonding angle for superexchange is
180°, this is when the O 2p-orbitals and the Fe 3d-orbitals overlap head-on.
Superexchange between the interlayer Fe3+ is weak as there is poor overlap of the
orbitals where minimum overlap occurs at 90°. On the other hand, the bonding angle
between the Fe3+ ions in the same bilayer is closer to the optimum value,
superexchange is therefore dominant in this magnetic coupling and so the
neighbouring Fe3+ ions align antiparallel [16].
The RFe2O4 structure has an equal number of Fe2+and Fe3+ ions which gives the iron W
layer a nominal valence of +2.5. Applying the average valency to each Fe ion, the
Fe2+and Fe3+ ions behave as negative and positive charges. The weight centre of the
Fe2+and Fe3+ ions do not coincide in the unit cell of the superstructure, consequently the
ordering of positive and negative charges indicates the presence of a local electric
dipole within the W layer [14]. This indicated the possibility of ferroelectricity
originating from the electron density modulation without a dipole of a cation and anion
pair [3]. The charge frustration caused by the Fe ions acting as polar charges have
already been shown in Fig.1.5(b): the black and white sites are of opposite charge,
forming an attractive bond; the grey site is frustrated as it cannot form a similarly
attractive bond with both of its nearest neighbours (the black and white sites) [15]. As
well as indicating the presence of a polarisation within the W layer, application of the
Fig. 1.8: Parallel Fe3+ spin in (a) Fe3+ rich bilayer and (b) Fe2+ rich bilayer.[16]
12
average valency to each iron site allows for the spin structure shown in Fig.1.8(a) to
produce the same diffraction pattern observed in neutron studies [16].
Extensive research into the multiferroic properties of LuFe2O4 began after the
successful growth of a single crystal by Iida et al. [13]. A number of research groups (N.
Ikeda [17], A.D. Christianson and M. Angst [18, 19, 20]) have published papers detailing
the electronic ferroelectricity and magnetic phase transitions observed in LuFe2O4.
Neutron diffraction experiments as well as ac magnetic susceptibility, dielectric
constant and polarisation measurements have provided much information on the
structural transitions which occur within the W layer.
LuFe2O4 has a rhombohedral
structure with hexagonal lattice
parameters: a=3.4406Å, c=25.28Å,
α=β=90° and γ=120° [21]. Charge
ordering within LuFe2O4 first occurs at 500K (Table1.2) [15]. At this temperature, a
Bragg line indexed as (n/3 n/3 l), where n is an integer and l is a continuous value,
appears in neutron diffraction data, indicating the formation of a two-dimensionally
ordered state [3]. Above 500K, LuFe2O4 is in a state of disorder; all the Fe sites appear
to have a charge of 2.5e- caused by the thermal movement of the valence electrons [11].
The transformation of the Bragg line to Bragg spots in electron diffraction, indexed as
(n/3 n/3 m+1/2) where m is also an integer, highlights the formation of a three-
dimensional charge order below 330K [3]. The Bragg spots were the first indication of
long range ordering of the Fe2+and Fe3+ ions along the c-axis. Subsequent electron and
non-resonant x-ray diffraction experiments detected the presence of lattice distortions
emerging from the charge ordering leading to the development of the √3 x √3
superstructure [14].
LuFe2O4 has been found to undergo two first-order magnetic phase transitions; the first
is a paramagnetic to ferrimagnetic ordering at 240K and the second is a
magnetostructural transition at 175K. Neutron diffraction measurements by
Christianson et al. [18] indicate that three-dimensional magnetic correlations exist
below 240K. This work contradicted similar studies by Iida et al. [22] who previously
reported a two-dimensional ferrimagnetic ordering below this temperature. The
difference in quality of the LuFe2O4 single crystals is believed to cause this discrepancy
Table 1.2: Summary of charge order transition
temperatures in LuFe2O4.[15]

13
as strong sample dependent behaviour has been observed in other members of RFe2O4.
For example, YFe2O4 exhibits three-dimensional magnetic order in stoichiometric
samples and two-dimensional order in oxygen deficient ones [18]. The transition at
175K, first observed by Christianson et al. also coincides with a structural transition.
Related systems, such as YFe2O4, have shown a transition with a structural component
at similar temperatures [23]. Christianson et al. associated this transition to the
formation of stacking faults at low temperature along the c-axis. The three-dimensional
correlations in LuFe2O4 are sensitive to disruptions along the c-axis as the
superexchange path between Fe-O bilayers consists of two mediating O ions [18].
Published results for the polarisation of
LuFe2O4 along the c-axis show two main
features: one at the three-dimensional
charge ordering temperature and the other
at the ferrimagnetic transition temperature
[17]. The polarisation deceases at these
transitions, (Fig.1.11). As previously
discussed, charge order ferroelectrics
exibit a spontaneous electric
polarisation when electrons are
transferred from anions to cations
during the formation of a covalent bond. Ferroelectricity within LuFe2O4 does not arise
from the displacement of anions and cations, consequently the polarisation has a very
different nature from the typical displacement-type ferroelectrics. The charge
frustration in LuFe2O4 creates a charge modulation within the Fe lattice which allows
the polarisation to be considered as the density modulation of electrons on an average
Fe2.5+ cation. In this case, the cation does not have an associated anion [14]. A common
feature of ferroelectrics is the switching of polarisation with external electric field. In
LuFe2O4 the motion of ferroelectric domain boundaries causing this switching is
believed to result from the collective motion of the electrons on the cation. This
hopping of electrons between the Fe2+and Fe3+ ions at the domain boundaries can also
be used to explain the large low-frequency dielectric dispersion within LuFe2O4. The
movement of electrons from Fe2+to Fe3+ can be controlled by the application of an
electric field, the frequency of the electron fluctuation coincides with the characteristic
Fig. 1.11: Temperature dependence of electric
polarisation along the c-axis of LuFe2O4 single
crystal.[17]

14
time of the dielectric dispersion observed in the high temperature region [14]. The
dielectric constant results for LuFe2O4 along the c-axis show the same features as the
polarisation data: one at 330K and the other at 240K, this similarity shows the direct
relation between dielectric constant and polarisability of the system [17]. The dielectric
constant measured by Ikeda et al. perpendicular and parallel to the c-axis is shown in
Fig.1.12.
The features at the ferrimagnetic ordering temperature are thought to be caused by a
direct coupling between the charge arrangement and the spin interactions of the iron
ions through the superexchange mechanism. The unit cell of the electric polarisation is
also the unit cell of the ferrimagnetic polarisation. This coupling demonstrates the
multiferroic nature of LuFe2O4 [3, 14].
A collection of low temperature magnetic transitions exhibiting cluster glass
characteristics have recently been observed. The glassy behaviour is attributed to the
collective freezing of spins at a well-defined temperature. Cluster glasses results when
the spins freeze to form large, ordered magnetic domains which dominate the magnetic
behaviour [6]. The collective freezing of nanoscale pancakelike ferrimagnetic domains
below 80K was first reported by Wu et al. [24]. D.c. magnetisation and a.c. susceptibility
measurements conducted by Wang et al. [25] and Phan et al. [26] show the LuFe2O4
system entering a glassy state below 225K. In addition to the glass transition at 225K,
Phan et al. have reported a change in the cluster glass phase below 170K and the
formation of a kinetically arrested glass state below 55K. A phase diagram of the
magnetic transitions observed in LuFe2O4 has been proposed by Phan et al. The
Fig. 1.12: Temperature dependence of dielectric constant measured (a) parallel
and (b) perpendicular to the c-axis of LuFe2O4 single crystal.[17]
15
structural transition that occurs at 170K affects the size and distribution of the
ferrimagnetic clusters formed at 225K, a new configuration of ferrimagnetic clusters
are created altering the spin dynamics of the LuFe2O4 system.
In order to fully investigate the anisotropic properties of this system, high quality single
crystals are required. Few papers have reported the full details of the gas environment
used to grow single crystals of LuFe2O4. The floating zone method is the most common
method of growth, however, single crystals of LuFe2O4 have also been grown by the
travelling solvent floating zone method [25]. The single crystal grown by Iida et al. [13]
used a gas mixture of CO2 and H2 in the heating stages of powder preparation followed
by a CO2/CO=2.5 atmosphere during single crystal growth. The 2D ferrimagnetic
ordering observed in this crystal was reported by Iida et al. [22] in a later paper. The
stoichiometry of this crystal was criticised by subsequent papers after the discovery of
a second magnetic transition and a 3D charge ordering within LuFe2O4 [18]. The oxygen
stoichiometry within LuFe2O4 can be controlled during growth by oxygen partial
pressure tuned using a CO2/CO mixture. Christianson et al. [18] have grown a number
of single crystals using this method. A CO2/CO ratio close to 2.7 was reported to
produce the ideal stoichiometry. The ability to control oxygen stoichiometry with the
growth atmosphere has recently been studied by Michiuchi et al. [27]. A series of single
crystals of varying oxygen content were grown in gas mixtures of CO2/CO=2, 4, 5, 6, 7
and 8. The method used to prepare the LuFe2O4 powders has not been specified.
Michiuchi et al. report that the single crystal grown in the CO2/CO=6 atmosphere has
the closest to ideal stoichiometry. Polycrystalline samples of LuFe2O4 are typically
sintered in either CO2/H2 or CO2/CO gas mixtures. A single crystal showing magnetic
properties indicative of stoichiometric LuFe2O4 has been grown by Kim et al. [28] from
powders sintered in a CO2/CO atmosphere. Single crystal growth papers, in general,
give very little information about this stage.
Despite the large volume of literature available for LuFe2O4 there is a general absence
of magnetisation, dielectric constant and polarisation data on single crystals along the
a, b and c-axes in zero and applied magnetic fields.
16
1.3 Orthorhombic RMnO3
Multiferroic behaviour within the orthorhombic manganites was first reported by
Kimura et al. [29] in 2003. A gigantic magnetoelectric and magnetocapacitance effect
attributed to the switching of the electric polarisation induced by magnetic fields was
initially reported in TbMnO3. The discovery of spin driven ferroelectricity within this
group has sparked a surge in research into understanding the fundamental mechanism
of multiferroic behaviour and the development of new multiferroic materials [30].
The heavy rare-earth orthorhombic manganite RMnO3 series, where R=La-Dy, are
described as having a distorted perovskite structure [31]. LaMnO3 has a nearly ideal
ABO3 structure with a perovskite tolerance factor close to unity. In this simple
structure, each Mn3+ ion is surrounded by six O2- ions forming a MnO6 octahedra. The
replacement of La with rare-earths of a smaller ionic radii leads to a successive increase
of the orthorhombic distortion, accompanied by a decrease of the Mn-O-Mn bond
angles and an increase of the buckling and tilting angles of the MnO6 octahedra in a
GdFeO3-type distortion [32].
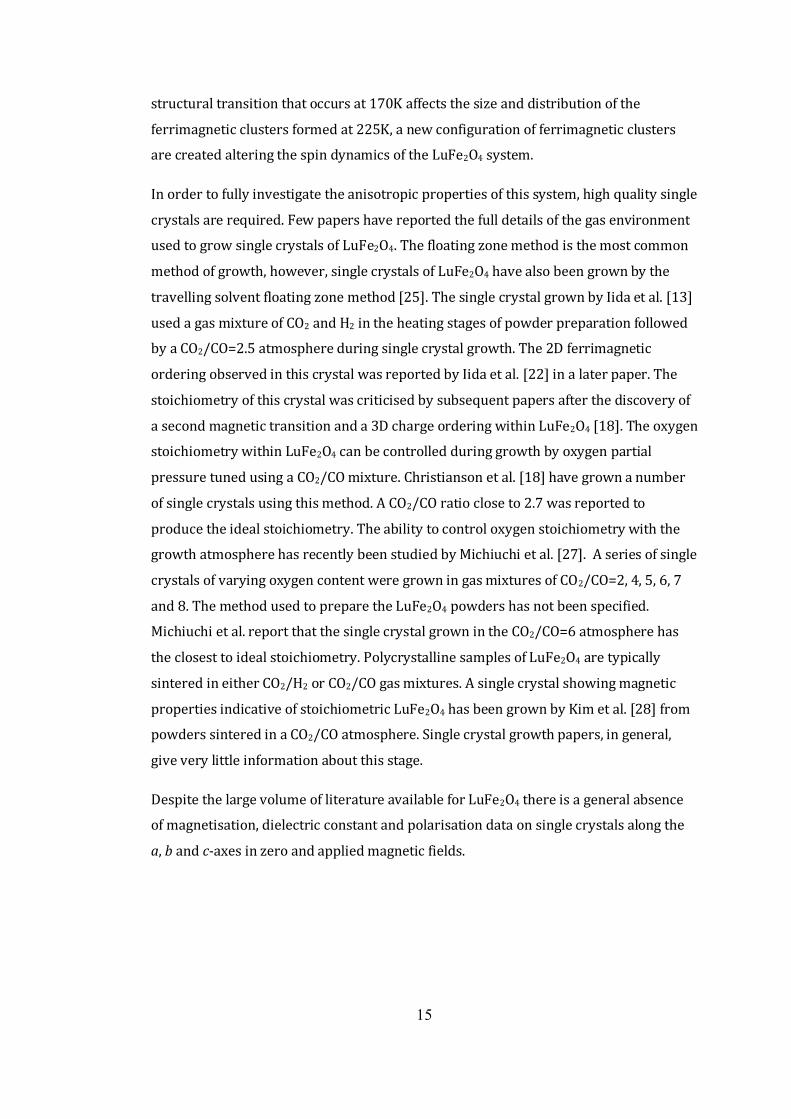
The RMnO3 series exhibit a Jahn-Teller
(JT) type orbital order at temperatures
well above 700K [31]. The orbital order
is achieved by a JT distortion of the
crystal lattice, illustrated in Fig.1.14.
The octahedral MnO6 structure is
distorted by splitting the Mn3+ electron
energy levels to achieve a lowering of
the overall energy of the system. Mn3+
can be described as a JT ion. The
number of unpaired electrons within
the system is important. For example,
Mn4+ has one more electron than
Mn3+ but is not a JT ion as there is no net lowering of the electronic energy by a
Fig. 1.14: Jahn-Teller distortion of an Mn3+ octahedral
complex. Splitting of the singly occupied eg level lowers
the overall energy of the system.[6]

17
distortion [6]. The electron distribution within a JT type orbital order is point
symmetric and carries no electric dipole moment. Consequently, any ferroelectricity
within RMnO3 cannot be directly due to this superimposed orbital order. The electric
polarisation must originate from another form of charge ordering [32]. Ferroelectricity
within RMnO3 is therefore regarded as a second order effect [30]. RMnO3 is classified as
an improper ferroelectric and a type-II multiferroic [1, 12].
The magnetic phase diagrams for RMnO3 as a function of in-plane Mn-O-Mn bond angle
and rare earth ionic radius are shown in Fig. 1.15 (a) and (b), respectively. The rare-
earth manganites with larger ionic radii, R=La-Sm, exhibit only one magnetic transition
after the disordered-to-ordered magnetic phase. A paramagnetic to A-type
antiferromagnetic (AF) ordering occurs above 50K. At this temperature, an anisotropic
superexchange interaction occurs [31]. The JT type ordering of the Mn3+ orbitals results
in a ferromagnetic spin ordering along the a-b plane and an AF ordering along the c-
axis [1]. The transition temperature decreases as the radius of the rare-earth decreases.
Smaller rare-earths at the R-site cause a decrease the Mn-O-Mn bond angle which
increases the tilting of the MnO6 octahedra, weakening the A-type AF ordering [32].
The rare-earth manganites with the smallest ionic radii, R=Tb and Dy, do not show an
A-type AF ordering in zero magnetic field. TbMnO3 and DyMnO3 show a paramagnetic
to incommensurate (IC) AF transition around 40K followed by a long wavelength
nearly locked-in AF transition below 28K [31, 33]. The IC and locked-in AF states have a
sinusoidal and spiral spin-density wave ordering, respectively [1]. The spin states are
Fig. 1.15: The orbital and spin ordering temperatures of RMnO3 as a function of (a) in-plane
Mn-O-Mn bond angle[31] and (b) rare earth ionic radius[33].
(a) (b)

18
depicted in Fig.1.16. A ferroelectric state is induced within both manganites at the lock-
in temperature. The magnetoelectric phase diagrams proposed by Kimura et al. [33] for
TbMnO3 and DyMnO3 in different magnetic field are show in Fig.1.17 (i) and (ii),
respectively. In zero and weak fields, both manganites have an electric polarisation
along the c-axis. A polarisation flop from the c- to a-axis occurs for high magnetic fields.
Ferroelectricity in TbMnO3 vanishes when high magnetic field are applied along the c-
axis. The system then undergoes a transition from the IC state to an A-type AF state.
Fig. 1.16: Incommensurate (a) sinusoidal and (b) spiral magnetic ordering.[10]
(a)
(b)
Fig. 1.17: The magnetic phase diagram of (i)TbMnO3, (ii) DyMnO3 and (iii)GdMnO3 as a
function of magnetic field. External fields applied parallel to the (a) a, (b) b and (c) c -axes.[33]
(i) (ii) (iii)

19
ErMnO3 and GdMnO3 are positioned at the boundary of a number of different magnetic
phase transitions [31]. Both manganites show a paramagnetic to IC AF transition,
followed by an IC to A-type AF ordering. GdMnO3 is also in close proximity to the IC AF-
lock-in AF transition which occurs in TbMnO3 and DyMnO3. When a magnetic field is
applied along the b-axis, GdMnO3 enters a ferroelectric state with an electric
polarisation along the c-axis. An A-type AF to locked-in AF transition occurs at this
temperature. The magnetoelectric phase diagram proposed by Kimura et al. for
GdMnO3 is shown in Fig.1.17(iii).
The change in magnetic structure from an A-type ordering to an IC state within the
RMnO3 series occurs as a result of the structural distortions created by the decrease of
ionic radii at the rare-earth site [34]. The buckling and tilting of the MnO6 octahedra
shortens the distance between the O(2) and O(4) sites, shown in Fig.1.18. This
shortening enhances the weak superexchange interactions along Mn- O(2)-O(4)-Mn
exchange path between next-nearest-neighbour Mn sites. The distortion, along with the
staggered JT orbital order creates inequivalent Mn sites within the a-b plane. The
interaction between the Mn(1) and Mn(3) sites (positioned along the b axis) is stronger
than that between the Mn(2)-Mn(4) sites (positioned along the a-axis). An AF exchange
is induced along the b-axis weakening the effective ferromagnetic a-b axes interactions
in the A-type AF structure. The simple ordering becomes frustrated and a complex spin
state ensues [31]. Frustration, in its basic sense, induces spatial variations in the
magnetisation and is often IC with the period of the crystal lattice [1]. When the next-
nearest-neighbour AF exchange becomes comparable in strength to the nearest-
neighbour ferromagnetic exchange, in the case of Er, Gd, Tb and Dy, a longitudinally
modulated sinusoidal structure is stabilized within the system. TbMnO3 and DyMnO3
experience a locking-in of the AF ordering below 28K forming a magnetically
transverse spiral state. This state is accompanied by the onset of ferroelectricity [1].
Fig. 1.18: A distorted MnO6 octahedral
lattice showing the position of the Mn (1),
(2), (3) and (4) and O(1), (2), (3) and (4)
sites.[31]

20
The on-set of ferroelectricity is connected to the change of the magnetic structure from
a collinear sinusoidal modulation to a non-collinear spiral modulation [32]. Non-
collinear spin ordering is favoured by Dzyaloshinskii-Moriya (DM) interactions
(Fig.1.19) [1]. The exchange interaction occurs between the excited and ground states
of neighbouring Mn3+ ions. The excited state is not connected to the ground state
through a mediating ion, in the case of superexchange, but through a spin-orbital
interaction. DM interactions often provide a small canting of the magnetic spins in an
AF structure, resulting in weak ferromagnetism [6]. In TbMnO3 and DyMnO3, DM
interactions push the negative O2- ions in one
direction perpendicular to the spin chain formed by
positive Mn3+ ions staggering the orbital order. The
symmetry of the spiral state therefore allows for an
electric polarisation, which has a sign coupled to the
direction of spin rotation. The spiral state breaks
time inversion symmetry by inverting the direction
of spin rotation when the sign of all the coordinates
are reversed [1]. A multiferroic state can therefore
be achieved within some rare-earth manganites.
Ferroelectric order can be induced or suppressed within the rare-earth manganites
positioned near different magnetic phase boundaries. External magnetic fields applied
along different crystallographic axes appear to move the position of the boundaries
(Fig.1.17) [33]. In the case of TbMnO3, a magnetic field applied along the c-axis
suppresses the ferroelectric state by expanding the A-type AF phase region and shifting
the boundary between the A-type AF ordering and the locked-in AF ordering to the
right. DyMnO3 is positioned far from this boundary, yet a very large field (H>14T)
applied along the c-axis suppresses the ferroelectric state by inducing an A-type AF
phase. In the case of GdMnO3, weak fields applied along the b-axis have induced a
ferroelectric state by suppressing the A-type AF phase. A very large magnetic field
along this axis may shift the A-type AF- IC AF and A-type AF-lock-in AF boundaries to
the left resulting in GdMnO3 having a similar magnetic phase diagram to TbMnO3 [33].
Doping at the rare-earth site can modify the multiferroic properties of the heavy rare-
earth manganites. The average radius of the rare-earth site and the parameters related
to the Mn-O-Mn bond angle can be continuously adjusted with dopant content
Fig. 1.19: Dzyaloshinskii-Moriya
interaction mechanism. The sift in
oxygen, x, from the r12 unit vector
describes the degree of inversion
symmetry breaking at the oxygen
site.[1]

21
permitting a gradual control of magnetic
and electric ground states [35]. A
multiferroic state can be generated within
manganites that have previously shown no
ferroelectricity through substitution at the
R-site. Doping at the R-site with smaller ions
increases the Mn-O-Mn bond angle.
Manganites that are positioned near the
spiral magnetic phase boundaries have been
found to enter this phase when doped with
smaller ions. For example, a ferroelectric
state can be induced within EuMnO3 when it is doped with Y. GdMnO3 has also been
found to enter a ferroelectric state in zero magnetic field when doped with Y. The
doping level required to induce ferroelectricity within EuMnO3 is higher than that
needed for GdMnO3. Ivanov et al. [35] report a transition from the IC phase to the
locked-in AF ferroelectric state when x≥0.3 for
Eu1-xYxMnO3 and y≥0.05 for Gd1-yYyMnO3.A PhD
thesis reporting the effect of doping with Y at
the rare-earth site of SmMnO3 and GdMnO3 has
recently been completed by D. O’Flynn in the
Superconductivity and Magnetism Group at the
University of Warwick [10]. The work carried
out by O’Flynn was originally motivated by the
discovery of a multiferroic state within R1-
xYxMnO3 (R=Eu, Gd) by groups such as Ivanov et
al. [35]. SmMnO3, in its pure form, is a
paraelectric which exhibits a commensurate A-
type antiferromagnetic order below 58K
(Fig.1.15) [31]. A significant change in the
magnetic properties of SmMnO3 and the onset of
an electric polarisation along the c-axis were
observed by O’Flynn when the parent compound
was doped with Y. A multiferroic state was
found to exist for Sm1-xYxMnO3 (x=0.4, 0.5). The
phase diagram proposed by O’Flynn for Sm1-
Fig. 1.21: H-T phase diagram for
Sm0.5Y0.5MnO3.[10, 36]
Fig. 1.20: Magnetoelectric phase diagram
for Sm1-xYxMnO3 as a function of Y
concentrated.[10]
22
xYxMnO3 compounds as a function of Y concentration is shown in Fig.1.20. Another
phase diagram showing the magnetic field dependence of Sm0.5Y0.5MnO3 is shown in
Fig.1.21. In zero magnetic field, O’Flynn observed the electric properties of Sm1-
xYxMnO3 (x=0.4, 0.5) to be very similar to that of TbMnO3; in both cases the direction of
the polarisation is observed along the c-axis. The magnetic field dependence, however,
is markedly different. Both Sm0.5Y0.5MnO3 and TbMnO3 exhibit a flop from the c-axis to
the a-axis in an applied magnetic field. The flop in the polarisation occurs when the
field is applied along to the b-axis in TbMnO3 or along the c-axis in Sm0.5Y0.5MnO3.
O’Flynn linked the magnetoelectric coupling observed within Sm0.6Y0.4MnO3 and
Sm0.5Y0.5MnO3 to the alterations in the local structure of the MnO6 octahedra, in
particular the Mn-O-Mn bond angle, induced by a decrease in the rare-earth site volume
[10, 36].
The effect of Y doping at the rare-earth site in GdMnO3 was also investigated by O’Flynn
[10]. Preliminary measurements on polycrystalline samples of Gd1-xYxMnO3
demonstrated a magnetoelectric coupling in x=0.1-0.4. A Mn-O-Mn bond angle close to
that of TbMnO3 was also found in Gd0.8Y0.2MnO3. Further work on the Gd1-xYxMnO3
series is currently being carried out at the University of Warwick. O’Flynn’s findings
have further motivated the study of the new Gd1-xLuxMnO3 series within the
Superconductivity and Magnetism group at Warwick.

23
Chapter 2
Experimental Methods
The experimental techniques used during sample preparation, single crystal growth and
characterisation are described in this chapter. Laboratory measurements used to
investigate the magnetic and electric responses of the samples are also detailed here. All
measurements were carried out in the Department of Physics at the University of
Warwick.
2.1 Sample Preparation
Polycrystalline samples were prepared by solid-state reaction from high purity powders.
Stoichiometric ratios of the powdered oxides were mixed and finely ground before
furnace heating. The high purity powder mixtures were heated in a gas atmosphere a
total of three times. The period of each heating varied between 12 and 24 hours at
temperatures up to 1200-1250°C. The loose powder mixtures were heated twice before
being compacted into waterproof balloons and compressed isostatically in water at high
pressure (>150kg cm-2) to form rods for single crystal growth. The power mixtures, in
the form of rods, were then heated for a third and final time.

24
2.2 Single Crystal Growth: Floating Zone Technique
Single crystals were grown by the
floating zone method. This method
requires two rods: a seed and a feed
rod, for single crystal growth. Single
crystals are grown in two and four
mirror floating zone furnace,
illustrated in Fig.2.1, by
crystallization of the molten
material on cooling. The feed rod is
suspended above the seed rod
inside a sealed quartz tube. Platinum
wire, which is inert and has a high
melting point, is used to suspend the
feed rod. The wire allows the feed rod to adjust its position freely above the seed rod,
which is fixed to the lower shaft. A molten zone is created between the feed and the seed
rods by slowly melting the tips of the rods using heat from two/four halogen bulbs
brought to a focus between two/four elliptical mirrors. The stability of the zone can be
controlled manually by adjusting the power of the bulbs and vertical positions of the
rods. The zone is suspended between the rods by the surface tension of the material. The
rods are rotated in opposite directions in order to help homogenise both the
temperature and the composition of the zone. Material at the base of the molten zone
slowly cools onto the seed rod as the focus of the mirrors is moved upwards along the
feed rod. The rate at which the mirrors are moved depends on the particular compound.
Different gas atmospheres of pressures of up to 10 bars can be used for the crystal
growth.
LuFe2O4-δ and Gd0.9Lu0.1MnO3 single crystals were grown at the University of Warwick
using the Crystal Sysytems Inc. F-ZT-10000-H-IV-VPS four mirror furnace and the Canon
Machinery SC1MDD-11020 two mirror furnace, respectively. Crystal boules of up to
55mm in length and 5mm in diameter were grown using the floating zone method. The
floating zone technique is best suited for the crystal growth of oxides and is particularly
suited for the oxides used in the present study.
Fig. 2.1: Annotated schematic of a two-mirror floating zone furnace.

25
2.3 Powder X-ray diffraction
The phase formation and impurity levels of the synthesised samples were examined
using powder X-ray diffraction. This process was performed at various stages
throughout the sample preparation. The diffraction patterns were compared with
published results to check for any possible impurity compounds and compounds with
different stoichiometric ratios of the primary elements. The patterns were also checked
for any phase changes that may have occurred at the different stages.
For powder x-ray diffraction, a beam of x-rays, of wavelength λ, are incident on the
surface of the crystalline material at an incident angle θ, depicted in Fig. 2.2. The x-rays
are scattered by the sample according to Bragg’s law
nλ=2dsinθ (Eq. 2.1)
where n is an integer and d is the distance between the crystal planes. When there is
coherent scattering from the crystalline planes the Bragg condition is satisfied and a
Bragg peak appears in the diffraction pattern.
Two different X-ray diffractometers were used to record the patterns presented in this
thesis: a Philips PW1720 X-ray generator, which uses Cu Kα radiation (λ~1.54Å); and a
Panalytical X’Pert Pro multipurpose X-ray diffraction system, with monochromated Cu
Kα1 radiation.
Fig. 2.2: Schematic of the Bragg condition showing scattering of X-rays by atoms in a crystalline solid.[6]
d
dsinθ
θ

26
2.4 Laue X-ray diffraction
The quality of the single crystals and the orientation of their crystallographic axes were
determined using Laue x-ray diffraction.
A crystal is placed within the diffractometer on a stationary triple-axis goniometer. A
‘white’ beam of x-rays are incident upon the crystal from the centre of a scintillator
screen. The wide range of wavelengths in the incident beam allows the Bragg condition
for each lattice plane to be satisfied by a different wavelength. The x-rays are then
backscattered onto the screen, as depicted in Fig.2.3, where the image is recorded by a
charge-coupled device, controlled by Image Pro Express software. The patterns obtained
from the crystal are compared with those simulated from the crystal space group and
lattice parameters of the material, using OrientExpress software. The crystal can be
repositioned, to match the simulated pattern, using the goniometer which enables the
precise rotation and translation of the crystal along three orthogonal axes.
Once the crystals are orientated, they are cut along the plane normal to the required axis
using a low speed diamond saw.
2.5 Magnetisation
A Superconducting QUantum Interference Device (SQUID) magnetometer was used to
measure the magnetic response of the samples at different temperatures and in
different fields. The magnetometer comprises a SQUID attached to pick-up coils which
sits inside a superconducting magnet. The sample is positioned within the pick-up coils
Fig. 2.3: Laue diffraction showing backscattering of X-rays from sample onto detector screen.[10]

27
of the SQUID at the end of a non-magnetic sample
rod, shown in Fig.2.4. The sample is held in
alignment with GE (General Electric) varnish which
is used to fix the sample to a non-magnetic tufnol
holder. The magnetic response of the sample is
determined by the SQUID magnetometer which
measures the current generated in the pick-up
coils as the sample is moved through the coils in a
series of 32 steps. Movement of the sample
through the pick-up coils induces a current
proportional to the sample magnetisation; a
magnetic moment value in electromagnetic units
is fitted to the measured signal. Zero field-cooled (ZFC) and field-cooled (FC) data was
collected while warming for both polycrystalline and oriented single crystals samples. For
ZFC measurements the sample is cooled in zero field before a magnetic field is applied.
For FC measurements, the sample is cooled in the applied field.
The SQUID magnetometer used to collect the data for this thesis is a Quantum Design
MPMS-5S. This system has a temperature range of 1.8-400K and a magnetic field range
of up to ±50kOe.
2.6 Physical Properties Measurements System (PPMS)
The thermal and electrical responses of the samples at different temperatures and in a
range of magnetic fields were measured using the PPMS. Heat capacity, dielectric
constant and polarisation measurements were conducted using this system. The heat
capacity measurement uses a different PPMS insert from the dielectric constant and
polarisation measurements consequently sample preparation is different for the thermal
and electrical measurements. The PPMS used to collect the data has a temperature range
of 1.8-400K and a magnetic field range of up to ±90kOe.
Fig. 2.4: Schematic of sample positioned within the pick-up coils of a SQUID magnetometer.[10]

28
2.6.1 Thermal Response
The thermal response of the sample was determined by measuring the heat capacity as
a function of temperature. In order to avoid the effects of a thermal gradient and
improve the accuracy of the measurement, the sample is required to be relatively thin
(<1mm thick) and have a large surface area, ideally the same size as the 3x3mm2
platform the sample is mounted on for the measurement. Apiezon N- grease is used to
attach the sample to the platform, ensuring good thermal contact between the platform
and the sample. A heater and thermometer are also attached to the platform which is
suspended by wires from the middle of a ‘puck’, depicted in Fig.2.5. The wires connect
the heater and thermocouple to the puck while isolating the platform from the effect of
thermal contact with the outside system. By measuring the relaxation time of the sample
after heating, the heat capacity at a particular temperature can be determined. The
platform is heated at a constant rate until the system has reached a percentage increase
of the set point (typically 5%). The heating power is then removed and the sample and
platform cool exponentially back to the set
temperature. In order to determine the heat
capacity of the sample alone, contributions from
the platform and grease are subtracted from the
relaxation time by way of an addenda
measurement. The addenda is the heat capacity
of the platform and grease measured over the
same temperature range required for the
sample measurement. Heat capacity is a
bulk measurement therefore samples can be
either polycrystalline or single crystal for
zero magnetic field measurements.
2.6.2 Electrical Response
The electrical response of the sample was determined by measuring the dielectric
constant and polarisation. Both of these measurements require the sample to be cut into
orientated thin plates with their widest faces perpendicular to one of the a, b and c-axes.
In order to reduce noise in the measurements the samples must be thin (<1mm thick)
and have a relatively large surface area (>5mm2). Electrical contacts are made by
Fig. 2.5: Sample mounted on a PPMS sample ‘puck’ insert.[10]
Sample
Platform
Puck

29
attaching silver wire to the two parallel flat faces of the samples with silver paste (Du
Pont 4929N conductor paste). These faces are sputtered with gold in order to provide
good electrical contact between the wire and the sample. The samples are positioned
within the sample space of the superconducting magnet at the end of a PPMS insert
designed especially for these types of measurements, shown in Fig.2.6.
(i) Dielectric Constant
A material is referred to as a dielectric if it can be electrically polarised upon the
application of an electric field.
Solder
Sample Silver wire
Electrode
Tufnol holder
Fig. 2.6: PPMS insert used for electric response measurements, (a) schematic diagram and (b) image. The arrow marks the point where the sample is attached to the holder.[10]
Fig. 2.7: Holder with sample mounted on a tufnol ‘seat’ used to orientate the sample in a magnetic field.

30
The dielectric constant of a sample can be determined by measuring the capacitance of
the material as a function of temperature. The capacitance, C, is related to the dielectric
constant, εr, by the parallel plate capacitor expression
C= ε0 εrA/d (Eq. 2.2)
where ε0 is the permittivity of free space (8.854x10⁻¹² Fm-1), A is the area of the parallel
electrodes and d is the distance between the electrodes. This expression requires the
dielectric material, of known dimensions, to be inserted between two electrodes in the
parallel plate arrangement illustrated in Fig.2.8 The contacts made with the parallel faces
of the sample act as the electrodes; the area of the electrodes is therefore the same as the
area of the sample face and the distance between the electrodes is equal to the sample
thickness. The capacitance of the sample was measured using an Agilent 4294A
impedance analyser connected to the PPMS sample insert.
Dielectric constant data was collected for polycrystalline samples and for electric fields
applied along the a, b and c-axes of single crystals. The effect of applying external
magnetic fields of up to 90kOe along the individual crystallographic axes was also
measured. Samples were initially field cooled: cooled down through the transitions of
interest in a magnetic field. The capacitance as a function of temperature was then
measured during heating at sweeping rates of 1 or 2K/min, depending on the material.
In order to determine the dependence of the dielectric constant on the frequency of the
electric field, the capacitance was recorded for 5, 10, 20, 30 and 40kHz fields using a
LabVIEW programme.
The system was tested by measuring the dielectric constant of the well-known
ferroelectric BaTiO3. BaTiO3 is characterised by a large temperature dependent dielectric
constant. The capacitance of a single crystal of BaTiO3 was measured during heating and
cooling in zero magnetic field and compared with published data [37]. The results are
shown in Fig.2.9. Features related to changes in the lattice structure were observed at
the appropriate temperatures and the dielectric constant was found to be of the correct
Fig. 2.8: Parallel plate capacitor arrangement showing electrodes separated by a (a) vacuum and (b) a dielectric.[10]

31
100 150 200 250 3000
500
1000
1500
2000
2500
3000
3500
Cooling
Heating
Die
lect
ric
Co
nst
ant
Temperature(K)
order of magnitude. This test calibration was necessary as the dielectric constant for
LuFe2O4-δ was very large at high temperature.
(ii) Polarisation
The spontaneous polarisation induced within a material as it enters the ferroelectric
state can be estimated from an observed pyroelectric current. By integrating the
recorded pyroelectric current, I, with respect to time according to the expression
P=∫(I/A) dt (Eq. 2.3)
where A is the area of the parallel electrodes, the polarisation as a function of
temperature can be determined.
The samples were initially cooled from a temperature above the ferroelectric transition
to a low temperature value. During cooling, the samples were poled in electric fields of
150 and 1000 V/mm, depending on the material. Before each measurement the high
voltage was removed and the electrodes of the sample capacitor were short circuited
through a bleed resistor for 30-60 minutes. Any surface charge built up during the
application of the electric field was dissipated through the resistor allowing for a zero-
charge state to be maintained. The pyroelectric current was measured during the heating
Fig. 2.9: Dielectric constant as a function of temperature for single crystal BaTiO3 in zero magnetic field. Measured at 10kHz during cooling and heating.

32
using a Keithley 6517A electrometer. The data was recorded as a function of temperature
and time using a LabVIEW programme. The magnitude of the polarisation expected for
the materials studied in this thesis are much smaller than those of standard
ferroelectrics. The electrometer used to measure the pyroelectric current must have a
very high sensitivity as changes in the signal as small as 0.1pA=10-13A need to be
detected.
The pyroelectric curves typically show a sharp anomaly at the ferroelectric transition
temperature followed by a flattening of the signal above this temperature. Before
integration, the pyroelectric current was corrected for background noise by making the
current equal to zero above the transition temperature. This ensures that zero
polarisation is calculated for the non-ferroelectric phase. The procedure used to obtain
the polarisation from the pyroelectric current is outline in Fig.2.10.

33
0 200 400 600 800 1000 1200 1400 1600 1800
0
50
100
150
200
250
Py
roe
lect
ric
curr
en
t(p
A)
Time(s)
0 200 400 600 800 1000 1200 1400 1600 1800
0
50
100
150
200
Py
roe
lect
ric
curr
en
t(p
A)
Time(s)
0 200 400 600 800 1000 1200 1400 1600 1800
0
5000
10000
15000
20000
I d
t(p
C)
Time(s)
0 10 20 30 40 50 60
0
200
400
600
800
1000
1200
1400
Po
lari
sati
on
(C
/m
2)
Temperature(K)
Fig. 2.10: Converting proelectric current into polarisation: (a) the recorded pyroelectric current as a function of time, (b) the pyroelectric current corrected for background current plotted with the time axis reversed, (c) the pyroelectric current integrated with respect to time and (d) the integrated current divided by the sample area, plotted as a function of temperature. The results were on a Gd0.9Lu0.1MnO3 single crystal in a 90kOe magnetic field applied parallel to the b-axis.
(a)
(b)
(c)
(d)

34
Chapter 3
Multiferroic Properties of LuFe2O4
Multiferroic LuFe2O4 is a charge ordered ferroelectric which shows a coupling between
magnetisation and electric polarisation near room temperature [3]. The potential
applications of the giant magnetodielectric response observed within this material have
resulted in an increase in research within this area [2]. LuFe2O4 is a well studied
multiferroic compound; however, there are several properties that remain unreported
in the literature. Magnetisation, dielectric constant and polarisation measurements have
not been along the a and b-axes. Only one set of polarisation data has been reported for
LuFe2O4, no other group have so far been able to reproduce this result. Finally, no
magnetic and electric responses have been recorded in applied magnetic fields greater
than 1kOe.
In this chapter, the effect of crystal growth environment on final crystal stoichiometry in
LuFe2O4 is investigated. Two single crystals of the rare-earth oxide have been grown
using the floating zone method. By altering the atmosphere in which they were grown,
single crystals of different oxygen stoichiometry have been prepared. Powder x-ray
diffraction and Laue x-ray diffraction have been used to determine the composition and
quality of the samples. The multiferroic properties have also been investigated by
measuring the magnetisation, dielectric constant and polarisation along the a, b and c
crystallographic axes.

35
3.1 Sample Preparation and Crystal Growth
Polycrystalline powders of LuFe2O4-δ were synthesised from stoichiometric quantities of
Lu2O3 and Fe2O3 (99.99%). In total, three batches of LuFe2O4-δ powder were prepared.
Approximately 15g of material was produced from each batch. The procedure used for
heating the powders is given in Table 3.1. After the second heating the powders were
compressed into rods, as described in Section 2.1. The purpose of the third heating was
to strengthen the rods in preparation for crystal growth. The same sequence of gas
atmosphere, CO2/CO=5, Ar then CO2/CO=5, was used to prepare each batch. The only
variation between batches was the period of the final sintering: the batch A was heated
for 12 h whereas batches B and C were heated for 24 h. Single crystals of LuFe2O4-δ were
grown using the floating zone method, as described in Section 2.2. In order to form
single crystals of LuFe2O4-δ, a slow growth of ~ 1 mm/h was used. Crystals were grown in
two different CO2/CO atmospheres: CO2/CO=3 and CO2/CO=5.
Sintering Stage (Temperature, Time and Gas Atmosphere)
Powder Batch 1st 2nd 3rd(Rod) Single Crystal Growth Atmosphere
A 1200°C, 12h,
CO2/CO=5
1200°C, 24h,
Ar
1250°C, 12h,
CO2/CO=5
CO2/CO=3
B 1200°C, 12h,
CO2/CO=5
1200°C, 24h,
Ar
1250°C, 24h,
CO2/CO=5
CO2/CO=3
C 1200°C, 12h,
CO2/CO=5
1200°C, 24h,
Ar
1250°C, 24h,
CO2/CO=5
CO2/CO=5
Single crystal growth is very challenging. It is preferable if the seed rod is itself a single
crystal. In order to form a large single crystal it is important that the material moving out
of the molten zone picks up a strong orientation in which to crystallize; if the seed is well
oriented the growing crystal will follow this orientation. In the first floating zone growth
a polycrystalline seed rod was used. The density of the feed rod presented an issue
during the first growth and only a small boule, ~15mm, of single crystal was grown. The
crystal obtained from this growth was used as the seed rod for subsequent growths.
In order to resolve the issue of rod density and ensure the stability of the molten zone
two changes were made to the crystal growth procedure. The polycrystalline feed rods
were sintered for twice as long and a fast zone was then run through the rod using the
Table 3.1: Synthesis process for LuFe2O4-δ.

36
floating-zone furnace at a rate of ~10-15mm/h prior to the single crystal growth. This is
too fast to form single crystals, the purpose of the run was to strengthen the feed rod for
the slow single crystal growth. The atmosphere used for the quick run was the same as
the atmosphere used for the successive single crystal growth.
Using this adjusted growth procedure, two LuFe2O4-δ single crystals have been
successfully grown, the first in an atmosphere of CO2/CO=3 and the second in an
atmosphere of CO2/CO=5.
The single crystal boule grown
in the CO2/CO=3 atmosphere
was ~55mm in length and 5mm
in diameter. A single crystal
boule of ~50mm in length and
5mm in diameter was grown in
an atmosphere of CO2/CO=5.
Pictures of the boules are
shown in Fig.3.1. Both boules
formed flat facets during
cooling. The facets formed in
the crystal grown using the
CO2/CO=3 atmosphere were
irregular and small. In contrast,
the crystal grown in the
CO2/CO=5 atmosphere formed two large parallel facets along opposite sides of the boule,
forcing the crystal to take on an oblong cross section for ~30mm of the growth.
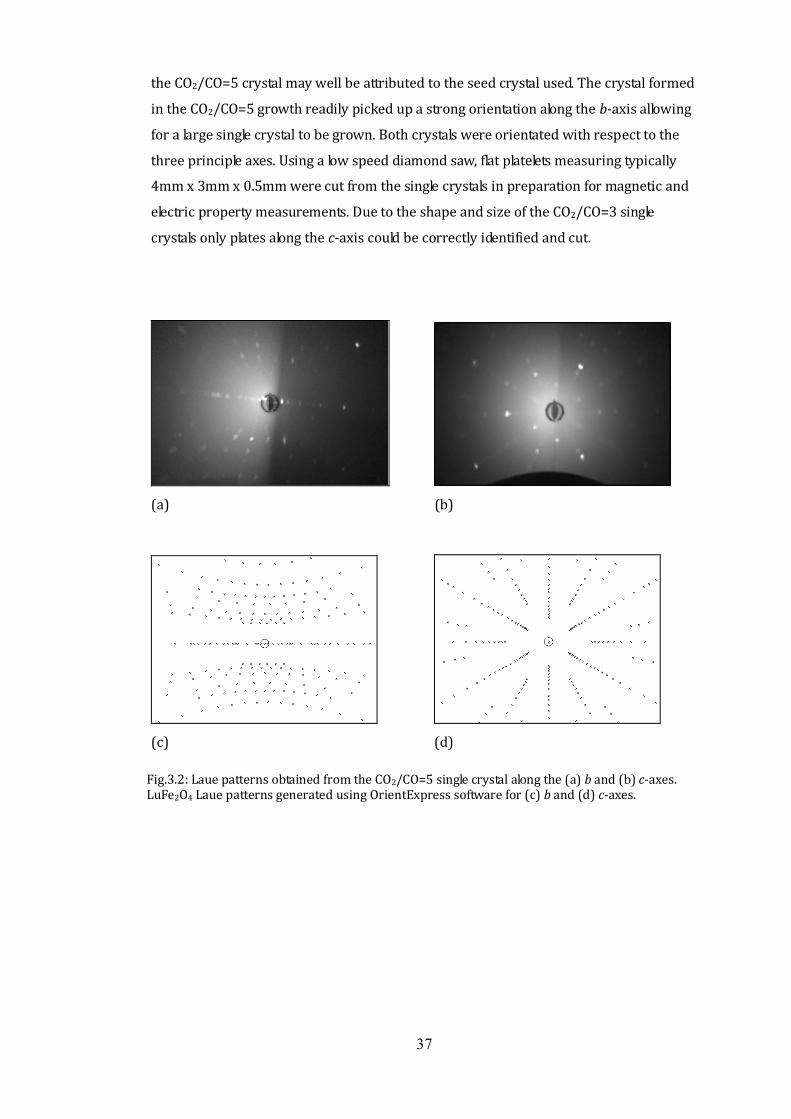
The quality of the single crystals and the orientation of their crystallographic axes were
determined using Laue x-ray diffraction. The patterns obtained from the crystals, shown
in Fig.3.2, were compared with those simulated by OrientExpress software from the
crystal space group and lattice parameters of LuFe2O4. From the Laue patterns and the
consistency of the plate like facets formed on the outside of the crystal it was apparent
that the quality of the CO2/CO=5 single crystal was far superior to that of the CO2/CO=3
crystal. The CO2/CO=5 boule was one single crystal grain for most of its length whereas
the CO2/CO=3 boule was found to be made up of many smaller single crystal volumes.
Both crystals had the growth axis along the crystallographic b-axis. The high quality of
Fig.3.1: Single crystal boules (a) CO2/CO=3, (b) CO2/CO=5. Red arrows mark the facets formed during cooling.
37
the CO2/CO=5 crystal may well be attributed to the seed crystal used. The crystal formed
in the CO2/CO=5 growth readily picked up a strong orientation along the b-axis allowing
for a large single crystal to be grown. Both crystals were orientated with respect to the
three principle axes. Using a low speed diamond saw, flat platelets measuring typically
4mm x 3mm x 0.5mm were cut from the single crystals in preparation for magnetic and
electric property measurements. Due to the shape and size of the CO2/CO=3 single
crystals only plates along the c-axis could be correctly identified and cut.
(a) (b)
(c) (d)
Fig.3.2: Laue patterns obtained from the CO2/CO=5 single crystal along the (a) b and (b) c-axes. LuFe2O4 Laue patterns generated using OrientExpress software for (c) b and (d) c-axes.

38
3.2 Powder X-ray Diffraction
In order to check the phase formation and impurity levels of the synthesised LuFe2O4-δ
samples, powder x-ray diffraction patterns were taken at various stages throughout the
crystal growth process. Preliminary measurements were taken during the sintering
stage using a Philips PW1720 x-ray generator, with 0.05° increments and a counting
time of 2s/step. More detailed diffraction data was collected at the end of the crystal
growth process using a Panalytical X'Pert Pro multipurpose x-ray diffraction system.
The preliminary x-ray diffraction patterns taken at the end of the sintering stage, prior
to crystal growth, are shown in Fig. 3.3. At this stage all three powders were prepared in
the same way and heated in the same gas environments, the only difference being the
period of the final sintering, as described in Section 3.1.
The diffraction patterns were initially matched with the LuFe2O4 data published by Iida
et al. for their oxygen deficient LuFe2O4 single crystal. A comparison was also made with
the Lu2O3 and Fe2O3 patterns, the starting compounds, to check for incomplete synthesis.
The diffraction patterns were then compared with data available in the database for
oxygen deficient compounds such as LuFe2O3.95 and with compounds with different
stoichiometric ratios of Lu, Fe and O such as LuFeO3 and Lu2Fe3O7. The diffraction
patterns were also checked for impurity compounds such as Fe3O4. Only the high
intensity peaks of possible impurity compounds are expected to be present in the
diffraction patterns as the percentage of impurity is expected to be low.
A number of impurity peaks have been identified in the diffraction pattern of powder
batch A. The pattern matched well with the expected pattern of LuFe2O4, however, many
of these peaks are split into doublets especially the high intensity reflections. The Lu2O3,
Fe2O3 and Fe3O4 high intensity peaks do not appear to closely match any of the impurity
peaks. Many of the low angle reflections can be associated with the diffraction peaks
published for LuFeO3 and Lu2Fe3O7 compounds. LuFeO3 and Lu2Fe3O7 impurities also
account for a number of the secondary/split peaks. The intensity of these impurity
peaks are relatively high, ~30%, compared to the maximum peak associated with a
LuFe2O4 reflection.
The x-ray diffraction pattern obtained from the powder batch B fits very closely with the
LuFe2O4 data. The number of peaks present in this pattern is much less than the number
recorded for the batch A; the peaks are not split into doublets as before and there are

39
very few impurity peaks. The intensity of any impurity peaks present in the scan is very
low, 8%. Some very small low angle peaks indicate the presence of a Lu2Fe3O7 impurity. A
very narrow peak present at 23.7° may be associated with a LuFeO3 impurity, however,
this peak may simply be noise as it is of very low intensity and no other peaks matching
the LuFeO3 pattern can be clearly identified.
Batch C has a similar x-ray diffraction pattern as batch B. The scan in general is much
noisier than batches A and B. Background noise often results in samples with a large
grain size, obtained as a result of sintering at high temperatures. Unlike batches A and B,
no low angle LuFeO3 or Lu2Fe3O7 impurity peaks are observed. The sample was definitely
of a higher purity at this stage of the synthesis.
It is not possible to accurately determine the oxygen content of the LuFe2O4-δ powders
using powder x-ray diffraction. The LuFe2O4 and LuFe2O3.95 diffraction patterns are
almost identical, the only credible difference being a small shift in the position of the
reflections. The diffraction data published by Iida et al. [13] has been taken from a non-
stoichiometric LuFe2O4 single crystal, however, the exact oxygen deficiency has not been
disclosed.
Using the Philips PW1720 x-ray generator a second powder x-ray diffraction scan was
taken from the batch A. A section of the feed rod that had passed through the molten
zone was cut and finely ground into a powder. The resulting diffraction pattern, shown
in Fig.3.4, has fewer impurity peaks than the pattern obtained from the same powder at
the end of the sintering stage. The Lu2Fe3O7 impurity peaks are no longer observed.
The high resolution x-ray diffraction patterns of the powdered CO2/CO=3 and CO2/CO=5
single crystals, recorded using the Panalytical X'Pert Pro multipurpose x-ray diffraction
system, are shown in Fig.3.5. Both single crystals have very similar x-ray patterns to the
published LuFe2O4 data from the database. No LuFe2O4, Lu2Fe3O7 or any other impurity
peaks are present in the scan. The peaks are not split like the polycrystalline data and
very little background noise has been recorded making the patterns much clearer and
the peaks better defined. Both of the single crystal patterns show high intensity peaks at
c-axis reflections indicating that a high proportion of the crystallite planes are oriented
along the c-axis. A Rietveld refinement of the x-ray powder diffraction data was
conducted for each crystal. The hexagonal lattice parameters estimated from the data are
shown in Table 3.2.

40
CO2/CO=3 Single Crystal CO2/CO=5 Single Crystal
a(Å) 3.44520(5) 3.44255(7)
b(Å) 3.44520(5) 3.44255(7)
c(Å) 25.29401(39) 25.28104(52)
20 40 60 80
0
200
400
600
800
1000
1200
Inte
nsi
ty
2
Batch A
Batch B
Batch C
Table 3.2: Lattice parameters for CO2/C0=3 and CO2/CO=5 LuFe204-δ from refined powder x-ray diffraction data.
Fig. 3.3: Powder x-ray diffraction patterns for polycrystalline LuFe2O4-δ.
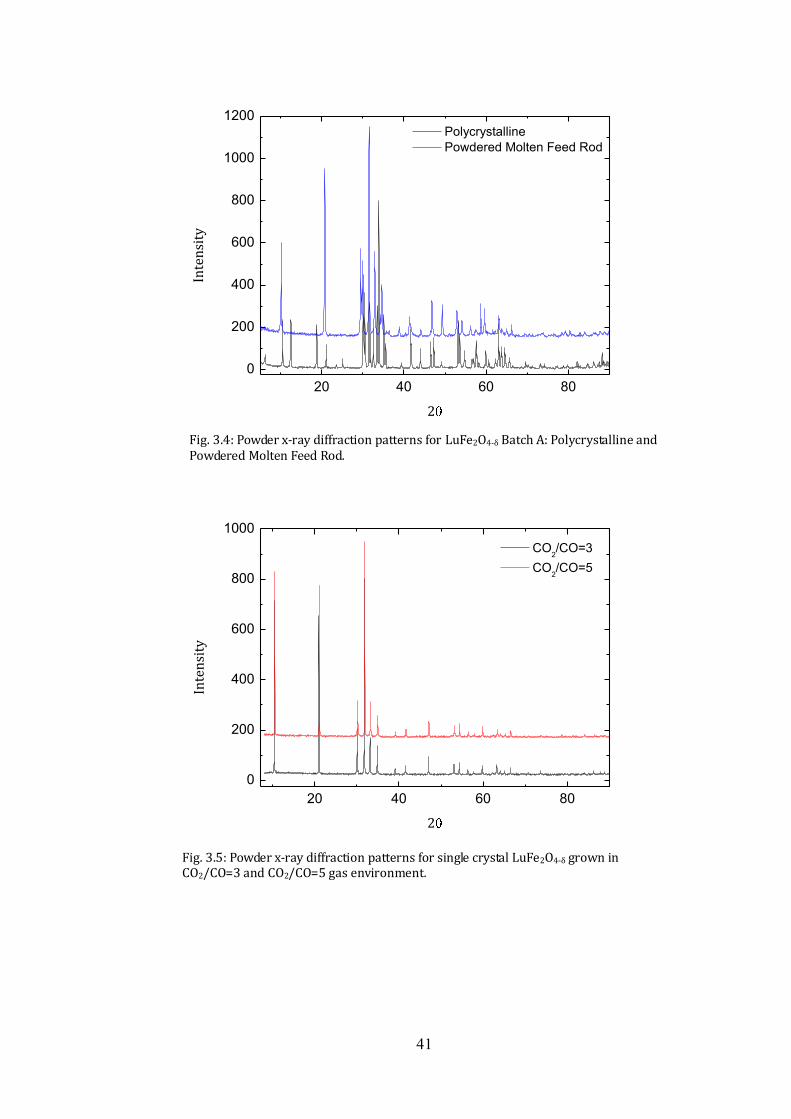
41
20 40 60 80
0
200
400
600
800
1000
1200
Inte
nsi
ty
2
Polycrystalline
Powdered Molten Feed Rod
20 40 60 80
0
200
400
600
800
1000
Inte
nsi
ty
2
CO2/CO=3
CO2/CO=5
Fig. 3.5: Powder x-ray diffraction patterns for single crystal LuFe2O4-δ grown in CO2/CO=3 and CO2/CO=5 gas environment.
Fig. 3.4: Powder x-ray diffraction patterns for LuFe2O4-δ Batch A: Polycrystalline and Powdered Molten Feed Rod.

42
3.3 Magnetic Properties
The SQUID, described in Section 2.5, was used to measure the magnetic response of the
samples at different temperatures and in different fields. The magnetisation as a function
of temperature was measured during heating from 2K to 300K at a sweep rate of
3K/min in magnetic fields ranging from 1 to 50kOe. Zero field-cooled (ZFC) and field-
cooled (FC) data was collected for both the polycrystalline and oriented single crystal
samples. The magnetisation was plotted in units of emu/g, allowing a comparison to be
made with the data reported by Kim et al. [28].
(i) Polycrystalline Samples
The temperature dependence of the ZFC and FC magnetisation for polycrystalline
LuFe2O4-δ is shown in Fig.3.6. In a relatively low external field of 1kOe, the magnetisation
increases markedly below 260K. The ZFC magnetisation reaches a peak value of
~1.3emu/g at 241K. Below this temperature the ZFC and FC magnetisations separate. A
plateau is observed in the ZFC data between 190 and 225K. The FC data undergoes a
notable change in gradient at a similar temperature. At low temperatures, the ZFC
magnetisation decreases to close to zero whereas the FC magnetisation continues to
increase reaching a maximum value of ~4.8emu/g below 50K. The features in the ZFC
magnetisation are stretched out over a larger temperature range when fields greater
than 1kOe are applied across the polycrystalline sample. The features become less
defined and merge together in high magnetic fields, for example the peak and the plateau
in the ZFC data can no longer be defined resulting in a single broad feature. The
maximum values of the magnetisations reached also increases with increasing magnetic
field. For example, in a 50kOe field the ZFC magnetisation reaches a maximum value of
~18.5emu/g at 116K and the FC magnetisation reaches a low temperature maximum of
~24 emu/g.
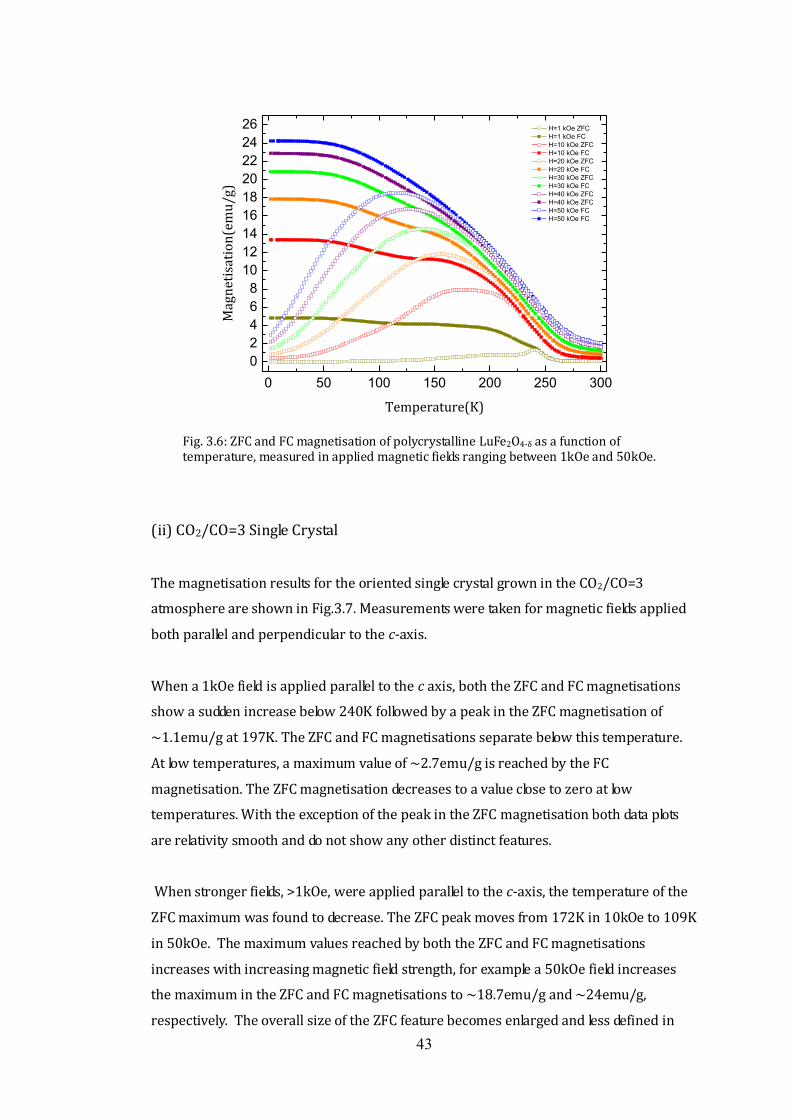
43
0 50 100 150 200 250 300
0
2
4
6
8
10
12
14
16
18
20
22
24
26
Mag
net
isat
ion
(em
u/g
)
Temperature(K)
H=1 kOe ZFC
H=1 kOe FC
H=10 kOe ZFC
H=10 kOe FC
H=20 kOe ZFC
H=20 kOe FC
H=30 kOe ZFC
H=30 kOe FC
H=40 kOe ZFC
H=40 kOe ZFC
H=50 kOe FC
H=50 kOe FC
(ii) CO2/CO=3 Single Crystal
The magnetisation results for the oriented single crystal grown in the CO2/CO=3
atmosphere are shown in Fig.3.7. Measurements were taken for magnetic fields applied
both parallel and perpendicular to the c-axis.
When a 1kOe field is applied parallel to the c axis, both the ZFC and FC magnetisations
show a sudden increase below 240K followed by a peak in the ZFC magnetisation of
~1.1emu/g at 197K. The ZFC and FC magnetisations separate below this temperature.
At low temperatures, a maximum value of ~2.7emu/g is reached by the FC
magnetisation. The ZFC magnetisation decreases to a value close to zero at low
temperatures. With the exception of the peak in the ZFC magnetisation both data plots
are relativity smooth and do not show any other distinct features.
When stronger fields, >1kOe, were applied parallel to the c-axis, the temperature of the
ZFC maximum was found to decrease. The ZFC peak moves from 172K in 10kOe to 109K
in 50kOe. The maximum values reached by both the ZFC and FC magnetisations
increases with increasing magnetic field strength, for example a 50kOe field increases
the maximum in the ZFC and FC magnetisations to ~18.7emu/g and ~24emu/g,
respectively. The overall size of the ZFC feature becomes enlarged and less defined in
Fig. 3.6: ZFC and FC magnetisation of polycrystalline LuFe2O4-δ as a function of temperature, measured in applied magnetic fields ranging between 1kOe and 50kOe.

44
high fields.
The magnetisation reached by both the ZFC and FC runs when magnetic fields are
applied perpendicular to the c-axis are much smaller than those reached when fields are
applied parallel to the c-axis. A peak of ~0.06emu/g is observed at 204K when a 1kOe
filed is applied across the sample. The maximum reached by the FC magnetisation is less
than ~0.1emu/g. The high and low temperature ZFC magnetisations are the same as
those achieved at the temperature extremes when the field is applied parallel to the c-
axis. The maximum values reached by both the ZFC and FC magnetisations increase
with increasing magnetic field. The temperature of the ZFC peak continues to decrease
with increasing field strength, however, the change in temperature is much less than
when the field is applied parallel to the c-axis. For example, in a 10kOe field a ZFC
maximum of ~0.55emu/g occurs at 196K which then reaches a value of ~2.6emu/g at
178K in a 50kOe field.

45
0 50 100 150 200 250 3000.0
0.5
1.0
1.5
2.0
2.5
3.0
3.5
Mag
net
isat
ion
(em
u/g
)
Temperature(K)
H= 1 kOe ZFC
H= 1 kOe FC
H= 10 kOe ZFC
H= 10 kOe FC
H= 20 kOe ZFC
H= 20 kOe FC
H= 30 kOe ZFC
H= 30 kOe FC
H= 40 kOe ZFC
H= 40 kOe FC
H= 50 kOe ZFC
H= 50 kOe FC
(a) H c
0 50 100 150 200 250 300
0
2
4
6
8
10
12
14
16
18
20
22
24
26
Mag
net
isat
ion
(em
u/g
)
Temperature(K)
H= 1 kOe ZFC
H= 1 kOe FC
H= 10 kOe ZFC
H= 10 kOe FC
H= 20 kOe ZFC
H= 20 kOe FC
H= 30 kOe ZFC
H= 30 kOe FC
H= 40 kOe ZFC
H= 40 kOe FC
H= 50 kOe ZFC
H= 50 kOe FC
(b) H//c
(iii) CO2/CO=5 Single Crystal
The temperature dependence of the ZFC and FC magnetisation data collected from the
LuFe2O4-δ single crystal grown in the CO2/CO=5 atmosphere are shown in Fig.3.8.
Magnetic fields were applied along each of the a, b and c crystallographic axes.
Fig. 3.7: Temperature dependence of the ZFC and FC magnetisation for single crystal LuFe2O4-δ grown in a CO2/CO=3 gas environment. Measurements taken in magnetic fields applied (a) perpendicular and (b) parallel to the c-axis.

46
Both the ZFC and FC data show a sharp increase in the magnetisation below 250K for a
1kOe magnetic field applied parallel to the c-axis. The ZFC magnetisation reaches a
maximum of ~4emu/g at 220K. The magnetisation decreases steadily below this
temperature approaching zero at low temperatures, <50K. The ZFC magnetisation
shows a step-like feature between 150K and 200K. The FC magnetisation exhibits a
number of low temperature features, spread over a large temperature range. A
maximum value of ~6emu/g is reached in the FC magnetisation below 50K. When fields
greater than 1kOe are applied parallel to the c-axis the features in both the ZFC and FC
magnetisations become enlarged and diffuse. A maximum value of ~25emu/g is reached
by the ZFC magnetisation at 89K in a field of 50kOe. In this example, the FC
magnetisation reaches a low temperature value of ~29emu/g.
When a 1kOe field is applied parallel to the a-axis, the ZFC and FC magnetisations show
a sudden rise below 250K. A peak of ~0.095emu/g occurs in the ZFC magnetisation at
234K. The FC magnetisation does not reach as high a value at this temperature; instead a
regional maximum of ~0.09emu/g is observed. At lower temperatures the FC
magnetisation shows a broad feature between 150K and 225K; below 50K a maximum
value of ~0.095emu/g is reached. The ZFC magnetisation also exhibits a feature within
the 150-225K temperature range. The ZFC magnetisation continues to decrease below
this temperature region reaching a low temperature value of ~0.04emu/g. As the
strength of the applied magnetic field is increased, the value of both the ZFC and FC
magnetisations is increased. The features observed in both the ZFC and FC data become
broader and the temperature of the peak in the ZFC curve decreases with increasing
field. For example, a peak of ~0.6emu/g occurs at 221K in a 10kOe field and a larger
peak of ~2.83emu/g is observed at 178K in a 50kOe field. In fields greater than 1kOe,
the ZFC and FC magnetisation curves separate close to the maximum of the ZFC curve,
the FC curves then rise to higher magnetisations and a regional maximum is reached
within the 150-200K temperature range. This regional maximum becomes the global
maximum in fields greater than 20kOe.
The ZFC and FC magnetisations reached when a 1kOe field is applied along the b-axis
are larger than those achieved when the same field is applied parallel to the a-axis. Both
the ZFC and FC magnetisations show a notable rise below 250K where the ZFC curve
reaches a maximum at 229K. At this same temperature the ZFC and FC curves separate,
the FC magnetisation does not reach as high a value as the ZFC curve, ~0.26emu/g and
~0.29emu/g respectively. The FC magnetisation continues to rise reaching a low
temperature maximum of 0.34emu/g. The ZFC magnetisation decreases from the

47
maximum to a value of ~0.06emu/g below 50K. The secondary features observed when
fields are applied along the a-axis are not as definitive in this case. Slight changes in the
gradient of the curves do exist within the same temperature range, however, they are
not as well defined. These features become more apparent as the field strength is
increased. The ZFC and FC magnetisations separate above the peak in the ZFC curve,
below this temperature the ZFC exhibits a step-like feature between 150K and 200K
followed by a decrease in magnetisation value below this temperature range. The FC
magnetisation reaches a regional maximum within this same temperature range. This
feature becomes more defined as the field is increased, reaching magnetisations close to
the global maximum in high fields. The overall magnitudes of the ZFC and FC
magnetisations increase while the temperature of the ZFC maximum decreases with
increasing field strength. For example, the temperature of the ZFC maximum occurs at
218K in a 10kOe field and at 187K in a 40kOe field.
0 50 100 150 200 250 3000.0
0.5
1.0
1.5
2.0
2.5
3.0
3.5
Mag
net
isat
ion
(em
u/g
)
Temperature(K)
H= 1 kOe ZFC
H= 1 kOe FC
H= 10 kOe ZFC
H= 10 kOe FC
H= 20 kOe ZFC
H= 20 kOe FC
H= 30 kOe ZFC
H= 30 kOe FC
H= 40 kOe ZFC
H= 40 kOe FC
H= 50 kOe ZFC
H= 50 kOe FC
(a) H//a

48
0 50 100 150 200 250 3000.0
0.5
1.0
1.5
2.0
2.5
3.0
3.5
4.0
4.5
Mag
net
isat
ion
(em
u/g
)
Temperature(K)
H= 1 kOe ZFC
H= 1 kOe FC
H= 10 kOe ZFC
H= 10 kOe FC
H= 20 kOe ZFC
H= 20 kOe FC
H= 30 kOe ZFC
H= 30 kOe FC
H= 40 kOe ZFC
H= 40 kOe FC
(b) H//b
0 50 100 150 200 250 300
0
2
4
6
8
10
12
14
16
18
20
22
24
26
28
30
Mag
net
isat
ion
(em
u/g
)
Temperature(K)
H= 1 kOe ZFC
H= 1 kOe FC
H= 10 kOe ZFC
H= 10 kOe FC
H= 20 kOe ZFC
H= 20 kOe FC
H= 30 kOe ZFC
H= 30 kOe FC
H= 40 kOe ZFC
H= 40 kOe FC
H= 50 kOe ZFC
H= 50 kOe FC
(c) H//c
3.4 Dielectric Properties The dielectric response of the polycrystalline and single crystal LuFe2O4-δ samples was
investigated. Dielectric constant versus temperature data was collected for each sample
as detailed in Section 2.6.2(i). Thin plates were cut from the single crystal samples such
that electric fields could be applied along the crystallographic axes. The plates were
Fig. 3.8: Magnetisation as a function of temperature for single crystal LuFe2O4-δ grown in a CO2/CO=5 gas environment. ZFC and FC measurements taken in magnetic fields applied along the (a) a, (b) b and (c) c-axis.

49
prepared for measurement as described in Section 2.6.2. Magnetic fields ranging up to
90kOe were applied along each of crystal axes.
Each sample was cooled in a magnetic field from 325K to 150K at a rate of 3K/min. The
capacitance as a function of temperature was then measured during heating to 325K at a
sweeping rate of 2K/min. The dielectric constant of each sample was calculated for 10,
20 and 30kHz measurements.
(i) Polycrystalline Sample
A strong frequency dependence was observed in the dielectric response of the
polycrystalline sample. Fig.3.9 shows a large dispersion in the dielectric constant
between low frequency measurements where the 10kHz measurements exhibits the
highest dielectric constant. A number of features were observed in the zero magnetic
field dielectric response. From the 20kHz data, the dielectric constant starts to rise to
values of the order 103-104 above 190K. This steady rise is followed by a sudden increase
in dielectric constant at 260K which reaches a peak of ~9x10⁴ at 274K. The dielectric
constant then decreases to a local minimum at 280K. Above this temperature, the
dielectric constant increases sharply reaching very high values.
Magnetic fields of 1, 10, 30 and 90kOe were applied across the sample. The dielectric
constant of the sample, shown in Fig.3.10, was found to increase when magnetic field
were applied. A large dispersion in the magnetic response of the dielectric constant was
observed between 260K and 300K. Both the temperature at which the peak was
observed and the height of the peak increased with increasing field strength, for
example, in a 90kOe field a peak of ~1.2x10⁵ was recorded at 278K.

50
180 200 220 240 260 280 300 3200
50000
100000
150000
200000
Die
lect
ric
Co
nst
ant
Temperature(K)
10kHz
20kHz
30kHz
180 200 220 240 260 280 300 3200
20000
40000
60000
80000
100000
120000
Die
lect
ric
Co
nst
ant
Temperature(K)
H=0Oe
H=1kOe
H=10kOe
H=30kOe
H=90kOe
(ii) CO2/CO=3 Single Crystal
Only one orientated thin plate could be cut from the CO2/CO=3 single crystal. The plate
Fig. 3.10: Temperature dependence of the dielectric constant for polycrystalline LuFe2O4-δ. Measurement made at 20kHz in applied magnetic fields of up to 90kOe.
Fig. 3.9: Dielectric constant versus temperature for polycrystalline LuFe2O4-δ in zero magnetic field. Measurements made at 10, 20 and 30KHz show strong frequency dependence.

51
was cut along the a-b plane, allowing for the electric field to be applied parallel to the c-
axis. Magnetic fields were applied both parallel and perpendicular to the c-axis. The
dielectric response of the crystal is shown in Fig.3.11.
A large dispersion in the dielectric constant is observed for the low frequency
measurements. The 20kHz measurements shows a steady rise in the dielectric constant
above 220K followed by a sudden increase around 274K. At room temperature, the
dielectric constant shoots off to very high values. Within this high temperature region,
the resistance of the sample is very low; consequently, the sample becomes conducting
and can no longer be considered as a dielectric. At low temperatures, the dielectric
constant is of the order of 101-102; this value increases close to 5x10⁴ at 274K. The very
large values are believed to be an effect of the low resistance of the sample. Magnetic
fields of 1, 10 and 30kOe were applied parallel to the c-axis. As the field strength is
increased, the dielectric constant of the sample decreases. Below 274K, the dielectric
responses are very close in value, at 274K the zero field response diverges from the in-
field measurements. The magnetic field raises the temperature of the feature, for
example the dielectric response of the 1kOe field shows a sudden rise at 275K whereas
the 30kOe response does not increase in value until 277K. A similar dielectric response
was observed when 10 and 30kOe fields were applied perpendicular to the c-axis.

52
200 220 240 260 280 3000
20000
40000
60000
80000
100000
Die
lect
ric
Co
nst
ant
Temperature(K)
H=0Oe
H=10kOe
H=30kOe
(a) E//c, H c
200 220 240 260 280 3000
20000
40000
60000
80000
100000
Die
lect
ric
Co
nst
ant
Temperature(K)
H=0Oe
H=1kOe
H=10kOe
H=30kOe
(b) E//c, H//c
(iii) CO2/CO=5 Single Crystal
The dielectric response along each of the a, b and c crystallographic axes was examined.
Three thin plates were cut from the CO2/CO=5 single crystal. Each plate was oriented
such that a magnetic field could be applied parallel to each principal axes. The dielectric
Fig. 3.11: Dielectric Constant as a function of temperature for single crystal LuFe2O4-δ grown in a CO2/CO=3 gas environment. Measurement made at 20kHz along the c-axis in magnetic fields applied (a) perpendicular and (b) parallel to the c-axis. Insets show a magnified view of the feature between 270 and 280K.
270 275 280 285
40000
50000
60000
70000
80000
Die
lect
ric
Co
nst
ant
Temperature(K)
265 270 275 280
40000
50000
60000
70000
Die
lect
ric
Co
nst
ant
Temperature(K)

53
response of the crystal along the a, b and c-axes are shown in Fig. 3.12, 3.13 and 3.14,
respectively.
The zero magnetic field response along the a-axis is very similar to that of the
polycrystalline sample. The dielectric constant increases to values in the order of 103-104
above 180K. Between 180K and 240K a shallow step-like feature is observed. A notable
change in gradient of the dielectric response at 245K leads to a peak in the data at 270K.
The dielectric constant then decreases from ~6.5x10⁴ to ~5.5x10⁴ at 280K. Above room
temperature, the dielectric constant continues to rise reaching very high values. A range
of magnetic fields were applied along the a, b and c-axes. Below 240K, the dielectric
response for fields applied along the a and b-axes show a decrease in dielectric constant
with increasing field strength. Between 240K and 250K, the order of the responses
change such that a higher dielectric constant is reached by a stronger field. Above 270K
there is a large dispersion between the responses, the temperature and value of the peak
both increase with increasing field strength. Magnetic fields applied along the c-axes
were found, in general, to increase the value of the dielectric constant. Fields applied
along either of the a, b and c-axes induce a similar change in temperature and dielectric
constant of the high temperature features.
180 200 220 240 260 280 300 3200
20000
40000
60000
80000
100000
Die
lect
ric
Co
nst
ant
Temperature(K)
H=0kOe
H=1kOe
H=10kOe
H=30kOe
(a) E//a, H//a

54
180 200 220 240 260 280 300 3200
20000
40000
60000
80000
100000
Die
lect
ric
Co
nst
ant
Temperature(K)
H=0Oe
H=1kOe
H=10kOe
H=30kOe
(b) E//a, H//b
180 200 220 240 260 280 300 3200
20000
40000
60000
80000
100000
Die
lect
ric
Co
nst
ant
Temperature(K)
H=1kOe
H=30kOe
H=90kOe
(c) E//a, H//c
Along the b-axis, the single crystal exhibits a low temperature dielectric response similar
to that of the a-axis in zero magnetic field. The first notable increase in the dielectric
constant occurs at 190K. Above this temperature a shallow step-like feature is observed.
This feature is followed by a steeper rise in the dielectric constant at 250K. A local
maximum of ~4x10⁵ is recorded at 270K. The response then shows an abrupt rise in the
dielectric constant at 276K. Above this temperature the dielectric constant shoots off to
Fig. 3.12: Dielectric response measured along the a-axis as a function of temperature for single crystal LuFe2O4-δ grown in a CO2/CO=5 gas environment. Measurement made at 20kHz in magnetic fields applied along the (a) a, (b) b and (c) c-axis.

55
very high values. The sample recorded a very low resistance at room temperature.
Magnetic fields of 10kOe and 90kOe were applied parallel to the a-axis. The dielectric
responses in field are very similar to the zero field measurement at low temperatures.
Above 250K, the gradient of the dielectric constant becomes dependent on the strength
of the applied field; a higher dielectric constant is reached in a higher magnetic field. The
temperature of the local maximum also increases with increasing field strength; the
90kOe response reaches ~5x10⁵ at 279K. An almost identical response was observed
when magnetic fields were applied parallel to the c-axis. The dispersion of the responses
above 250K appears to be greater when magnetic fields are applied parallel to the c-axis.
The increase in the local maximum from the zero field value when a 10kOe field was
applied parallel to the c-axis was found to produce a response almost twice as large as
when the field was applied along the a-axis. The dielectric response of the sample when
magnetic fields were applied parallel the b-axis was also investigated. The dielectric
constant is much lower in this case. Both the zero field and in-field measurements show
shallow step-like features between 190 and 250K followed by a dispersion of the
responses above 250K. The dielectric constant does not shoot off abruptly beyond the
local maximum at 260K, instead it continues to rise with a much lower gradient. Both
the value and temperature of this feature increase with increasing field strength. A
second smaller feature at a slightly higher temperature is also observed when fields are
applied parallel to the b-axis.
180 200 220 240 260 280 300 3200
200000
400000
600000
800000
Die
lect
ric
Co
nst
ant
Temperature(K)
H=0Oe
H=30kOe
H=90kOe
(a) E//b, H//a

56
180 200 220 240 260 280 300 3200
100000
200000
300000
400000
Die
lect
ric
Co
nst
ant
Temperature(K)
H=0Oe
H=1kOe
H=10kOe
H=30kOe
(b) E//b, H//b
140 160 180 200 220 240 260 280 300 320 3400
200000
400000
600000
800000
Die
lect
ric
Co
nst
ant
Temperature(K)
H=0Oe
H=10kOe(c) E//b, H//c
The dielectric response of the single crystal along the c-axis shows an increase in the
dielectric constant above 240K in zero magnetic field. The dielectric constant continues to
rise reaching a value of ~4.5x10⁴ at 275K. Above this temperature, a small step-like
feature is observed followed by an increase in the gradient of the curve. The
temperature at which this feature occurs is dependant on the strength of the magnetic
field. In general, both the temperature and value of the feature increases as the field
Fig. 3.13: Dielectric constant measured along the b-axis of the LuFe2O4-δ single crystal grown in a CO2/CO=5 gas environment. Measurement made at 20kHz in magnetic fields applied along the
(a) a, (b) b and (c) c-axis.

57
increases. For example, when a 1kOe field is applied parallel to the c-axis, the feature
rises to ~5x10⁴ at 277K. The dielectric responses are typically very close in value. It is
only within the temperature range 270-285K that the curves diverge and the effect of
magnetic field strength on the dielectric response can be seen. The clearest response is
observed when magnetic fields are applied parallel to the c-axis.
All of the dielectric responses along each of the crystallographic axes exhibited a strong
frequency dependence.
200 220 240 260 280 3000
20000
40000
60000
80000
100000
Die
lect
ric
Co
nst
ant
Temperature(K)
H=0Oe
H=10kOe
H=90kOe
(a) E//c, H//a
200 220 240 260 280 3000
20000
40000
60000
80000
100000
Die
lect
ric
Co
nst
ant
Temperature(K)
H=0Oe
H=1kOe
H=10kOe
H=30kOe
H=90kOe
(b) E//c, H//b
265 270 275 280 285
40000
50000
60000
70000
Die
lect
ric
Co
nst
ant
Temperature(K)
275 280 285
50000
60000
70000
80000
Die
lect
ric
Co
nst
ant
Temperature(K)

58
200 220 240 260 280 3000
20000
40000
60000
80000
100000
Die
lect
ric
Co
nst
ant
Temperature(K)
H=0Oe
H=1kOe
H=10kOe
H=30kOe
(c) E//c, H//c
3.5 Polarisation
By measuring the pyroelectric current, the electric polarisation and thus the ferroelectric
properties of the polycrystalline and single crystal LuFe2O4-δ samples were investigated.
Data was collected from the same samples used to measure the dielectric constant. The
experimental method used to determine the polarisation is described in Section 2.6.2(ii).
Using the PPMS, magnetic fields of up to 30kOe were always applied parallel to the c-axis
of the single crystal samples.
In preparation for the measurement, the samples were initially poled in an electric field.
Using the same electrical contacts made for the dielectric constant measurements, a
voltage of +1kVmm-1 was applied across the sample before cooling. The sample was then
cooled in a magnetic field from 320K to 200K at a rate of 3K/min. The applied voltage
was then removed and the sample was connected to a bleed resistor for between 30 and
60 minutes in order to expel any surface charge built up from application of the electric
field. The pyroelectric current as a function of time was then measured as the sample
was heated to 320K at a sweeping rate of 2K/min.
Fig. 3.14: Temperature dependence of the dielectric constant measured along the c-axis of the LuFe2O4-δ single crystal grown in a CO2/CO=5 gas environment. Measurement made at 20kHz in magnetic fields applied along the (a) a, (b) b and (c) c-axis. Insets show a
magnified view of the feature between 270 and 280K.
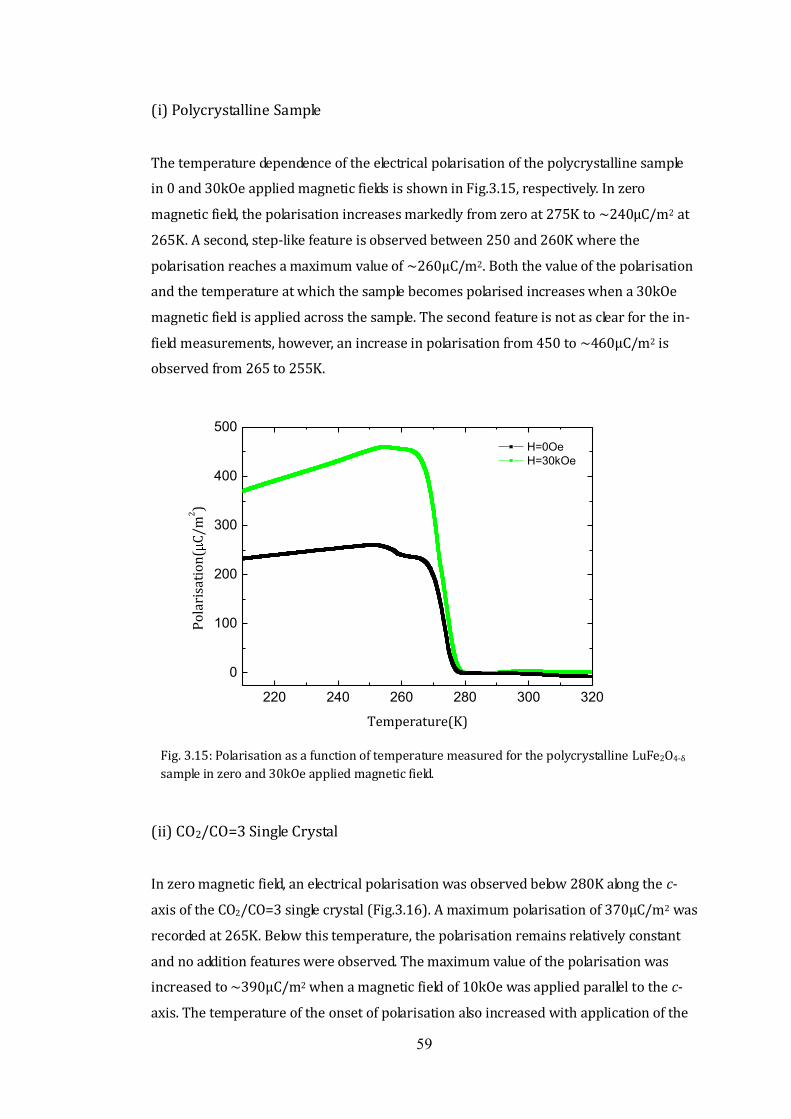
59
(i) Polycrystalline Sample
The temperature dependence of the electrical polarisation of the polycrystalline sample
in 0 and 30kOe applied magnetic fields is shown in Fig.3.15, respectively. In zero
magnetic field, the polarisation increases markedly from zero at 275K to ~240μC/m2 at
265K. A second, step-like feature is observed between 250 and 260K where the
polarisation reaches a maximum value of ~260μC/m2. Both the value of the polarisation
and the temperature at which the sample becomes polarised increases when a 30kOe
magnetic field is applied across the sample. The second feature is not as clear for the in-
field measurements, however, an increase in polarisation from 450 to ~460μC/m2 is
observed from 265 to 255K.
220 240 260 280 300 320
0
100
200
300
400
500
Po
lari
sati
on
(C
/m2)
Temperature(K)
H=0Oe
H=30kOe
(ii) CO2/CO=3 Single Crystal
In zero magnetic field, an electrical polarisation was observed below 280K along the c-
axis of the CO2/CO=3 single crystal (Fig.3.16). A maximum polarisation of 370μC/m2 was
recorded at 265K. Below this temperature, the polarisation remains relatively constant
and no addition features were observed. The maximum value of the polarisation was
increased to ~390μC/m2 when a magnetic field of 10kOe was applied parallel to the c-
axis. The temperature of the onset of polarisation also increased with application of the
Fig. 3.15: Polarisation as a function of temperature measured for the polycrystalline LuFe2O4-δ
sample in zero and 30kOe applied magnetic field.

60
220 240 260 280 300 320
0
100
200
300
400
Po
lari
sati
on
(C
/m2)
Temperature(K)
H=0Oe
H=10kOeE//c, H//c
magnetic field.
(iii) CO2/CO=5 Single Crystal
The anisotropic behaviour of the polarisation along the a, b, and c-axes (E//a, b and c)
was investigated for the CO2/CO=5 single crystal, the results are shown in Fig.3.17. The
zero magnetic field polarisation data along the a-axis shows a sharp rise at 282K. The
polarisation reaches a value of ~55μC/m2 at 270K and continues to rise steadily below
this temperature. A slight change in the gradient is observed around 240K, this
secondary feature is similar to the feature observed in the polycrystalline sample. The
polarisation data collected along the b-axis in zero magnetic field also shows two features.
An initial rise in the polarisation from zero to ~340 μC/m2 between 278 and 265K is
accompanied by a second feature between 240 and 245K which reaches a maximum
polarisation of ~365μC/m2. Only one feature is observed in the c-axis polarisation data.
At 280K the sample becomes polarised and a maximum value of 220μC/m2 is recorded
at 270K. Below 270K, the polarisation remains relatively constant.
When magnetic fields of either 10 or 30kOe were applied parallel to the c-axis of the
CO2/CO=5 single crystal, the features observed in the polarisation along each
crystallographic axes were found to increase in both value and temperature. For
Fig. 3.16: Polarisation measured along the c-axis of the LuFe2O4-δ single crystal grown in a CO2/CO=3 gas environment. Measurements made in zero and 10kOe magnetic fields applied
along the c-axis.

61
example, the first feature observed in the polarisation along the a-axis increases in
temperature to 285K. Similarly, the second feature in the b-axis polarisation reaches an
increased maximum of ~380μC/m2 at 245K. The largest change in polarisation is
recorded along the c-axis. A magnetic field of 10kOe increases the temperature of the
feature from ~280μC/m2 to 285K and increases the maximum polarisation recorded at
270K to ~900μC/m2.
220 240 260 280 300 320
0
20
40
60
80
Po
lari
sati
on
(C
/m2)
Temperature(K)
H=0Oe
H=30kOe
(a) E//a, H//c
220 240 260 280 300 320
0
100
200
300
400
Po
lari
sati
on
(C
/m2)
Temperature(K)
H=0Oe
H=10kOe
(b) E//b, H//c
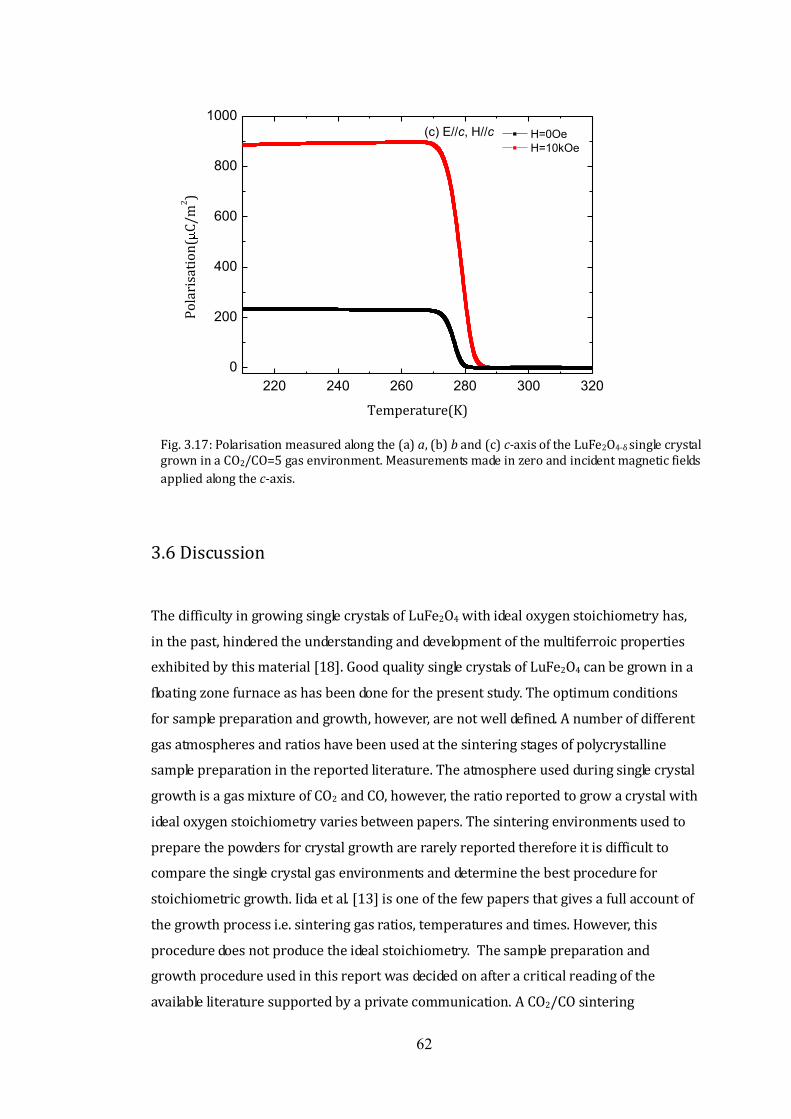
62
220 240 260 280 300 320
0
200
400
600
800
1000
Po
lari
sati
on
(C
/m2)
Temperature(K)
H=0Oe
H=10kOe
(c) E//c, H//c
3.6 Discussion
The difficulty in growing single crystals of LuFe2O4 with ideal oxygen stoichiometry has,
in the past, hindered the understanding and development of the multiferroic properties
exhibited by this material [18]. Good quality single crystals of LuFe2O4 can be grown in a
floating zone furnace as has been done for the present study. The optimum conditions
for sample preparation and growth, however, are not well defined. A number of different
gas atmospheres and ratios have been used at the sintering stages of polycrystalline
sample preparation in the reported literature. The atmosphere used during single crystal
growth is a gas mixture of CO2 and CO, however, the ratio reported to grow a crystal with
ideal oxygen stoichiometry varies between papers. The sintering environments used to
prepare the powders for crystal growth are rarely reported therefore it is difficult to
compare the single crystal gas environments and determine the best procedure for
stoichiometric growth. Iida et al. [13] is one of the few papers that gives a full account of
the growth process i.e. sintering gas ratios, temperatures and times. However, this
procedure does not produce the ideal stoichiometry. The sample preparation and
growth procedure used in this report was decided on after a critical reading of the
available literature supported by a private communication. A CO2/CO sintering
Fig. 3.17: Polarisation measured along the (a) a, (b) b and (c) c-axis of the LuFe2O4-δ single crystal grown in a CO2/CO=5 gas environment. Measurements made in zero and incident magnetic fields
applied along the c-axis.

63
atmosphere rather than a CO2/H2 atmosphere was advised to produce the ideal
stoichiometry.
In order to determine whether the prepared polycrystalline and single crystal samples
have the ideal oxygen stoichiometry, powder x-ray diffraction and magnetisation
measurements were taken and compared with published results. The multiferroic
properties were also investigated by measuring the dielectric constant and polarisation
of the samples, as described in the previous sections.
In order to analyse the results and interpret the features in the data, reference has been
made to published LuFe2O4 data. Ideally additional measurements should be carried out
to accurately determine the spin and charge structures that occur within the samples.
Future experiments are discussed in the future work section.
(i) Polycrystalline
The magnetisation data collected from the polycrystalline sample in an applied field of
1kOe (Fig.3.6), shows LuFe2O4-δ to undergo two magnetic phase transitions. The upturn
of magnetisation around 260K indicates the appearance of a ferrimagnetic order
between the Fe ions. The peak in the ZFC data marks the transition from paramagnetic
to ferrimagnetic ordering within the Fe spin system. At this same temperature the ZFC
and FC magnetisations separate as a result of the growth of magnetic domains along the
direction of field cooling. The plateau observed in the ZFC data is believed to result from
a modulation of Fe magnetic structure. This magnetostructural transition may account
for the change in gradient observed in the FC data. Secondary features were also
observed in the FC magnetisation, these features may be the result of spin glasses
forming within the Fe lattice [24-26].
A number of papers have presented low field data on the ZFC and FC magnetisations in
polycrystalline LuFe2O4 [38-41]. In particular, Yoshii et al. [41] have measured the
magnetisation in an applied field of 1kOe. In Yoshii et al.’s paper, the ferrimagnetic
ordering of the Fe spins appears around 250K . This feature is followed by a broad
maximum in both the ZFC and FC data between 180 and 200K. Yoshii et al. have
attributed this feature to a change in the structure of the magnetic ordering of the Fe
lattice. The magnetostructural features observed by Yoshii et al. are more defined than
the features measured as part of this thesis, maxima are observed in the ZFC data
instead of plateaus and the FC feature reaches a global maximum instead of broad

64
change in gradient. This difference may be linked to the different LuFe2O4
stoichiometries, discussed later.
The magnetisation in applied fields greater than 1kOe has not been published for
polycrystalline LuFe2O4. The results for the polycrystalline sample, presented as part of
the present work, show the temperature at which the ferrimagnetic domains first
appear to increase with increasing field strength (Fig.3.6). As discussed in Section
3.3(a), the features merge together in high magnetic fields. Both the temperature of the
ZFC maxima and the temperature at which the FC data changes gradient decrease with
increasing field strength. The low temperature features associated with the formation of
spin glasses within the Fe spin system become less defined in high fields.
The magnetic transitions observed in the magnetisation are also present in the dielectric
response of the polycrystalline sample. The correlated results are shown in Fig.3.18. The
initial rise in dielectric constant occurs at the same temperature as the
magnetostructural transition in the magnetisation. This is followed by a further increase
in dielectric constant around 260K which coincides with the demise of the ferrimagnetic
ordering with increasing temperature. The dielectric response of polycrystalline LuFe2O4
has previously been investigated by both Subramanian et al. [2] and Yoshii et al. [41].
The dielectric response in zero magnetic field presented by Subramanian et al. shows a
similar rise in dielectric constant around 200K followed by a change in gradient above
250K. The origins of the features observed by Subramanian et al. have not been
discussed in their paper. The dielectric response measured by Yoshii et al. shows a single
rise in dielectric constant around 200K, no features were observed between 250 and
260K. In this thesis, a peak not observed in the magnetisation data, has been recorded in
the dielectric response of the polycrystalline sample at 275K. A paper by Park et al. [39]
shows a similar peak in the dielectric constant at this temperature. The dielectric
responses recorded for this thesis, in general, have a very similar profile to Park et al’s
published data. Park et al. have associated the feature at ~280K with the ferroelectric
transition. Charge ordering within the Fe lattice is expected to change from 2D to 3D as
the temperature is decreased below 330K [3]. The dielectric frequency dispersion below
330K is dependent on the motion of the ferroelectric domain boundary. The feature
observed by Park et al. moves to higher temperatures as the frequency of the ac current
is increased. A similar dielectric dispersion was observed for the polycrystalline sample
in this thesis (Fig.3.9). Park et al. also observed a monotonous increase in the dielectric
constant closely related to the conductivity when LuFe2O4 enters the 2D charge ordered
state. The dielectric constant for the polycrystalline sample in the present work shows a

65
similar response above 280K.
The magnetodielectric response of the polycrystalline sample was also investigated for
this thesis (Fig.3.10). Contrary to results published by Subramanian et al. [2] the
dielectric constant was found to increase upon application of a magnetic field. Below the
magnetic ordering temperature the dielectric constant appears to be independent of the
magnetic field. Dispersion amongst the responses only appears at temperatures above
this transition. All the dielectric responses converge above 290K and continue to
increase in the monotonous fashion expected of the 2D charge ordered state [39].
LuFe2O4 is ferroelectric within the 3D charge ordered state [3]; a polarisation is therefore
expected to be induced at this transition. A polarisation was measured for the
polycrystalline sample below 275K (Fig.3.15). This upturn in the polarisation coincides
with the peak in the dielectric constant data, shown in Fig.3.18. The paramagnetic to
ferrimagnetic ordering of the Fe spins is also observed as a step-like rise in the
polarisation. The coexistence of these two features is indicative of a multiferroic. Park et
al. [39] have measured the pyroelectric coefficient of their sample. The response
measured by Park et al. contains two pronounced peaks: one at 250K and another at
340K. These peaks are associated with the spin and charge ordering of the Fe ions
within the W layer. The peak at the magnetic ordering temperature in Park et al’s
pyroelectric coefficient data is much stronger than the peak representing the 2D to 3D
charge ordering. In Park et al.’s results, the charge ordering appears to occur at the same
temperature as the dip in the dielectric constant and not at the peak observed at ~280K.
The temperature of the ferroelectric transition, measured in this work, was found to
increase when a magnetic field was applied across the polycrystalline sample. The peak
in the dielectric constant was found to increase to a similar temperature (Fig.3.18).
(ii) Single Crystal
A Rietveld refinement of the X-ray powder diffraction data collected from the single
crystals provided an estimate of the lattice constant for each crystal (Table 3.2). The
refined lattice constants for the crystal grown in CO2/CO=5 gas environment match the
lattice constant reported by [21]. The lattice constant estimated for the CO2/CO=3 single
crystal are larger than those estimated for the CO2/CO=5 single crystal.
The magnetisations of the CO2/CO=3 and CO2/CO=5 single crystals, measured for this

66
thesis, were found to be greatest when magnetic field were applied parallel to the c-axis
(Fig. 3.7, 3.8). A magnetic anisotropy along the c-axis is expected as the Fe spins lie
parallel to the c-axis inducing a ferrimagnetic moment along this direction [28]. The
magnetisation, in general, was found to be greater for the CO2/CO=5 crystal (Fig.3.8).
The magnetic anisotropy within single crystal LuFe2O4 has previously been investigated
by Kim et al. [28]. The temperature dependence of the ZFC and FC magnetisations
reported by Kim et al. for magnetic field applied parallel and perpendicular to the c-axis
are very similar to the response for the CO2/CO=5 single crystal measured in this thesis.
In an applied field of 1kOe, the magnetisation along the a, b and c-axes of the CO2/CO=5
crystal show two magnetic phase transitions. The rise in the magnetisation around 250K
marks the appearance of ferrimagnetic ordering within the Fe spins system and the
peaks in the ZFC data along the a, b and c axes denotes the temperature of the
paramagnetic to ferrimagnetic transition. The peaks are then followed by a plateau in
the ZFC data and a broad maximum in the FC data. These features indicate the presence
of a magnetostructural transition within the Fe lattice. The feature in the FC data is more
pronounced in the CO2/CO=5 single crystal than in the polycrystalline sample previously
reported. The 1kOe magnetisations show a discrepancy between the ZFC and FC curves
along all three axes of the CO2/CO=5 single crystal. The peak in the ZFC data does not
align with the FC data. A similar observation has been made by Park et al. [39]. They have
attributed this discrepancy to the existence of short-range magnetic clusters above the
ferrimagnetic ordering temperature.
Only one magnetic transition is observed for the CO2/CO=3 single crystal grown in this
study (Fig.3.7). A rise in magnetisation is recorded around 250K when a field of 1kOe is
applied across the sample. The Fe spins order ferrimagnetically at 197 and 204K for
fields applied parallel and perpendicular to the c-axes, respectively.
The magnetic behaviour of LuFe2O4 is qualitatively similar to YFe2O4 [18]. A previous
investigation into the effect of oxygen concentration in YFe2O4 showed that
stoichiometric samples are characterised by much sharper magnetic transitions [42].
This observation lead Christianson et al. [18] to take the sharpness of observed
transitions as an indication of ideal oxygen stoichiometry within their LuFe2O4 single
crystal samples. In this thesis, the CO2/CO=5 crystal is expected to have a stoichiometry
closer to the ideal than the CO2/CO=3 single crystal. The stoichiometric study conducted
by Michiuchi et al. [27] concluded that the crystal grown in the CO2/CO=6 environment
developed the most complete charge ordering with largest coherence length, properties
indicative of ideal stoichiometry. The FC magnetisation reported by Michiuchi et al. for

67
their CO2/CO=6 crystal shows a well defined feature at 200K, a feature absent in the
other crystals reported in their paper.
The dielectric responses of the CO2/CO=3 and CO2/CO=5 single crystals measured along
the c-axis in this thesis do not show features at the paramagnetic-ferrimagnetic ordering
temperature or the magnetostructural transition (Fig.3.19, 3.22). The dielectric
responses in zero magnetic field typically show an initial rise in dielectric constant
between 220 and 230K, followed by an increase in gradient around 280K. The dielectric
constant continues to rise monotonously above this temperature. This feature is
accompanied by the development of a polarisation below 280K. Ikeda et al. [17] have also
measured the dielectric constant and polarisation along the c-axis of a LuFe2O4 single
crystal. The low temperature dielectric response measured by Ikeda et al. has a similar
profile to the CO2/CO=3 and CO2/CO=5 single crystals measured in the present work.
Ikeda et al.’s results, however, show a small dip in the 10kHz measurement at 280K
followed by steady rise to a step-like jump at 330K. The polarisation, measured by Ikeda
et al., was shown to accompany this room temperature feature. These observations lead
Ikeda et al. to propose a 2D to 3D charge ordering temperature of 330K. The magnetic
ordering of the Fe spins was also observed as an increase in polarisation at 250K. No
room temperature (330K) features were observed in either of the dielectric constant or
polarisation measurements taken from the CO2/CO=3 or CO2/CO=5 single crystals grown
for this thesis. The dielectric response of the CO2/CO=3 crystal along the c-axis shows a
decrease in dielectric constant at 275K upon application of a magnetic field. A similar
observation was made by Subramanian et al. [2] for polycrystalline LuFe2O4.
Subramanian et al. related this decrease to the decrease in polarisability of the system.
Fluctuating dipoles are frozen on cooling through the ferroelectric transition,
polarisability is consequently lost and the dielectric constant decreases. The system is
expected to become polarised upon application of a magnetic field as a result of the Fe3+
ions being more strongly attracted to the field than the Fe2+ ions. The system becomes
more polarised therefore loosing polarisability [2]. In the present work, the
magnetodielectric response along the c-axis of the CO2/CO=5 crystal is not as clearly
distributed. Magnetic fields applied along the c-axis appear to increase the dielectric
constant at 270K. A change in gradient of the responses between 275 and 280K result in
the lower fields having a higher dielectric constant than the high field measurements.
In this thesis, the dielectric responses along the a and b-axes of the CO2/C0=5 single
crystal have a similar profile to the polycrystalline sample reported in Section 3.4(a). The
initial rise in the dielectric constant measured along the a and b-axes of the CO2/C0=5

68
single crystal occurs at the same temperature as the magnetostructural feature in the
magnetisation data, shown in Fig.3.20, 3.21. As the temperature is increased, the crest of
a broad step-like feature in the dielectric constant coincides with the peak in the ZFC
magnetisation. The upturn in magnetisation between 250 and 260K is also observed as a
feature in the dielectric response and polarisation. Both of these features are related to
the onset of ferrimagnetic ordering of the Fe spins and demonstrate the multiferroic
behaviour indicative of LuFe2O4. The dielectric response measured along the a-axis
shows a well defined peak at 270K, in zero magnetic field. A ferroelectric transition is
observed in the polarisation measurements along the a-axis at this temperature. Above
280K the dielectric constant increases monotonously and the system enters a
paraelectric state. The dielectric response along the b-axis also exhibits a ferroelectric
transition around 270K, however, it appears as a cusp rather than a well defined peak.
The dielectric constant then shoots off to very high values as it approaches 280K. Ikeda
et al. have also measured the dielectric constant perpendicular to the c-axis. At low
temperatures, the dielectric constant measured by Ikeda et al. [17] (Fig.1.12) appears to
be independent of the temperature; it is only above 150K that the dielectric constant
begins to rise. A step-like feature similar to that observed in this study for the CO2/CO=5
single crystal occurs around the magnetic ordering transitions. The dielectric constant
reported by Ikeda et al. reaches a plateau then continues to rise again around 350K
marking the 3D to 2D charge order transition. The basic profile of the Ikeda et al’s
dielectric constant data is the same as the a and b-axes results obtain for this thesis,
however, on closer inspection the features associated with magnetic transitions are at
very different temperatures.
The magnetodielectric responses along the a-axis of the CO2/C0=5 single crystal,
measured for this study, clearly show that, independent of the direction of the applied
field, a larger magnetic field induces a larger dielectric constant between 250 and 290K.
Below 250K, the ordering of the responses appears to be dependent on the orientation of
the field. For example, below 250K the dielectric constant decreases with increasing field
strength along the b-axis whereas increasing magnetic strength along the c-axis
increases the value of the response. Magnetic field applied along the a-axis reduce the
dielectric constant below the zero field value, however, at this lower value the responses
are generally larger for the stronger magnetic fields. Above 290K, all the responses
converge. A similar pattern was observed for the b-axis of the CO2/C0=5 single crystal. A
pattern can be observed in the ordering of the dielectric responses along the a and b-axis
with respect to field strength. Below 250K, the dielectric response induced along the a-
axis when fields are applied along the b-axis has the same form as the response

69
measured along the b-axis when fields are applied along the a-axis. Similarly, magnetic
fields applied along the c-axis induce the same pattern along the a and b-axis. A pairing
can also be made between responses that are measured along the same axis as the
applied field.
Two different plate thicknesses were used to measure the dielectric constant along the b-
axis of the CO2/CO=5 single crystal. The thickest plate was used when measuring the
response of magnetic fields applied along the b-axis (Fig.3.13(b)). The cusp-like feature
associated with the ferroelectric transition is lower in both temperature and value in this
case. A second feature emerges and rises to higher temperatures as the magnetic field
strength increases. Polarisation measurements were not taken for the thicker plate as
the poling voltage required was beyond the limits of the power supply. The polarisation
results for the thinner sample show the existence of a ferroelectric state below 280K
which shows an increase in polarisation around 250K. These features suggest a 2D to
3D charge ordering of the Fe ions around 280K followed by a ferrimagnetic ordering of
the spins below 250K.
The room temperature resistance of the b-axis plate was found to be much lower than
the a and c-axis plates. Consequently, the conductivity along this axis is expected to be
much higher. This may explain the large difference in dielectric constant values between
the oriented plates and with other published results in general. The effect of conductivity
on the dielectric constant has previously been noted in YCrO3. Serrao et al. [43] have
associated a monotonous increase in dielectric constant above the ferroelectric
transition with the dc conduction of the sample. At high temperatures, Serrao et al.
recorded a large dc leakage current for low frequency measurements. The dissipation
factors at room temperature were also recorded as being much higher in thin films than
the bulk samples [38]. Current leakage may account for the different dielectric constants
recorded for the thick and thin CO2/CO=5 b-axis plates prepared as part of this thesis.
Sample conductivity also needs to be considered for polarisation measurements. When
estimating the polarisation from the pyroelectric current data, Ikeda et al. [17] have
assumed that the polarisation is zero above 350K to avoid any errors caused by the
increase of electrical conductivity. The change in polarisation recorded at 330K by Ikeda
et al. is much larger than the change recorded at 240K (Fig.1.11). The magnitudes of the
pyroelectric coefficient peaks recorded by Park et al. [39] imply the opposite is true.
Sample conductivity may be responsible for this discrepancy. Alternatively, the peak
observed by Park et al. at 340K is a consequence of increased conductivity and is not a
true representation of the polarisation of the system as no peak is observed in their

70
dielectric constant data at this temperature.
In this thesis, the dielectric constant and polarisation were initially recorded up to
temperatures of 360K. No further features were observed in the dielectric response
above 290K; the dielectric constant continued to increase reaching extremely high
values. In the case of the polarisation, the pyroelectric current signal became
increasingly noisy at high temperatures and no further features could be defined. The
high conductivity of the samples at room temperature may distort or hide the true
position of the 2D to 3D charge ordering transition. This may explain the difference in
the results reported in this thesis and those published by other research groups.
160 180 200 220 240 260 280 300 320
0.0
0.5
1.0
1.5
2.0
2.5
3.0
3.5
4.0
Mag
net
isat
ion
(em
u/g
)
Temperatuer(K)
ZFC
FC
(c) H=1kOe
0
20000
40000
60000
80000
100000
Die
lect
ric
Co
nst
ant
(b)
0
50
100
150
200
250
300
Po
lari
sati
on
(mC
/m2
)
H=0Oe(a)
0
20000
40000
60000
80000
100000
120000
Die
lect
ric
Co
nst
ant
(b)
0
100
200
300
400
500
Po
lari
sati
on
(C
/m2)
H//c=30kOe(a)
160 180 200 220 240 260 280 300 320
0.0
2.5
5.0
7.5
10.0
12.5
15.0
Mag
net
isat
ion
(em
u/g
)
Temperature(K)
ZFC
FC
(c)
Fig. 3.18: (a) Polarisation and (b) dielectric constant and (c) ZFC and FC magnetisation of polycrystalline LuFe2O4-δ in (i) 0, 1kOe and (ii) 30kOe magnetic fields.

71
160 180 200 220 240 260 280 300 320
0.00
0.25
0.50
0.75
1.00
1.25
1.50
1.75
Mag
net
isat
ion
(em
u/g
)
Temperature(K)
ZFC
FC
H=1kOe(c)
0
10000
20000
30000
40000
50000
60000
70000
Die
lect
ric
Co
nst
ant
(b)
0
50
100
150
200
250
300
350
400
Po
lari
sati
on
(C
/m2)
H=0Oe(a)
160 180 200 220 240 260 280 300 320
0
1
2
3
4
5
6
7
8
Mag
net
isat
ion
(em
u/g
)
Temperature(K)
ZFC
FC
(c)
0
10000
20000
30000
40000
50000
60000
70000
80000
Die
lect
ric
Co
nst
ant
(b)
0
50
100
150
200
250
300
350
400
450
Po
lari
sati
on
(C
/m2)
H//c=1kOe(a)
Fig. 3.19: (a) Polarisation and (b) dielectric constant and (c) ZFC and FC magnetisation measured along the c-axis of the CO2/CO=3 LuFe2O4-δ single crystal in (i) 0, 1kOe and
(ii)10kOe magnetic fields applied along the c-axis.
E//c, H//c
E//c, H//c

72
160 180 200 220 240 260 280 300 3200.00
0.01
0.02
0.03
0.04
0.05
0.06
0.07
0.08
0.09
0.10
Mag
net
isat
ion
(em
u/g
)
Temperature(K)
ZFC
FC
H=1kOe(c)
0
10000
20000
30000
40000
50000
60000
70000
80000
Die
lect
ric
Co
nst
ant
(b)
0
10
20
30
40
50
60
Po
lari
sati
on
(C
/m2)
H=0Oe(a)
160 180 200 220 240 260 280 300 3200.0
0.2
0.4
0.6
0.8
1.0
1.2
1.4
1.6
1.8
2.0
Mag
net
isat
ion
(em
u/g
)
Temperature(K)
ZFC
FC
(c)
0
10000
20000
30000
40000
50000
60000
70000
80000
Die
lect
ric
Co
nst
ant
(b)
0
10
20
30
40
50
60
70
80
90
100
Po
lari
sati
on
(C
/m2)
H//c=30kOe
(a)
Fig. 3.20: (a) Polarisation and (b) dielectric constant and (c) ZFC and FC magnetisation measured along the a-axis of the CO2/CO=5 LuFe2O4-δ single crystal in (i) 0, 1kOe and
(ii)30kOe magnetic fields applied along the c-axis.
E//a, H//c
E//a, H//c

73
160 180 200 220 240 260 280 300 3200.00
0.05
0.10
0.15
0.20
0.25
0.30
Mag
net
isat
ion
(em
u/g
)
Temperature(K)
ZFC
FC
H=1kOe(c)
0
200000
400000
600000
800000
1000000
Die
lect
ric
Co
nst
ant
(b)
0
50
100
150
200
250
300
350
400
Po
lari
sati
on
(C
/m2)
H=0Oe(a)
0
50
100
150
200
250
300
350
400
Po
lari
sati
on
(C
/m2)
H//c=30kOe(a)
160 180 200 220 240 260 280 300 3200.0
0.2
0.4
0.6
0.8
1.0
1.2
1.4
1.6
Mag
net
isat
ion
(em
u/g
)
Temperature(K)
ZFC
FC
(c)
0
100000
200000
300000
400000
500000
600000
700000
800000
Die
lect
ric
Co
nst
ant
(b)
Fig. 3.21: (a) Polarisation and (b) dielectric constant and (c) ZFC and FC magnetisation measured along the b-axis of the CO2/CO=5 LuFe2O4-δ single crystal in (i) 0, 1kOe and
(ii)10kOe magnetic fields applied along the c-axis.
E//b, H//c
E//b, H//c

74
0
50
100
150
200
250
Po
lari
sati
on
(C
/m2)
H=0Oe(a)
160 180 200 220 240 260 280 300 320
0
1
2
3
4
5
Mag
net
isat
ion
(em
u/g
)
Temperature(K)
ZFC
FC
H=1kOe(c)
0
20000
40000
60000
80000
100000
Die
lect
ric
Co
nst
ant
(b)
0
20000
40000
60000
80000
100000
Die
lect
ric
Co
nst
ant
(b)
160 180 200 220 240 260 280 300 3200
2
4
6
8
10
12
14
Mag
net
isat
ion
(em
u/g
)
Temperature(K)
ZFC
FC
(c)
0
100
200
300
400
500
600
700
800
900
1000
Po
lari
sati
on
(C
/m2)
H//c=10kOe(a)
4.7 Conclusion
A study investigating the multiferroic properties of polycrystalline and single crystal
LuFe2O4-δ has been presented.
Two single crystals of LuFe2O4-δ were successfully grown at the University of Warwick
using the floating zone method. By altering the atmosphere in which they were grown,
single crystals of different stoichiometry have been prepared. Crystals were grown in two
different CO2/CO gas atmospheres: CO2/CO=3 and CO2/CO=5. Powder X-ray diffraction
data collected from the single crystals showed single phase formation. Refinement of this
data allowed for an estimate of the lattice parameters to be obtained. Laue X-ray
diffraction was used to accurately orientate the single crystals for experimentation.
A magnetic anisotropy along the c-axis was demonstrated in both of the LuFe2O4-δ single
crystals. The ferrimagnetic ordering of the Fe moments along the c-axis was typically
Fig. 3.22: (a) Polarisation and (b) dielectric constant and (c) ZFC and FC magnetisation measured along the c-axis of the CO2/CO=5 LuFe2O4-δ single crystal in (i) 0, 1kOe and
(ii)10kOe magnetic fields applied along the c-axis.
E//c, H//c
E//c, H//c

75
observed below 250K. A magnetostructural transition was also observed below 200K in
the magnetisation data collected from the polycrystalline sample and the single crystal
grown in the CO2/CO=5 gas atmosphere. The absence of this feature in the data collected
from the single crystal grown in the CO2/CO=3 gas atmosphere is an indication of poor
oxygen stoichiometry within this crystal. The ferrimagnetic ordering and
magnetostructural transitions were also present in the dielectric constant and
polarisation data collected from the samples, thereby confirming the multiferroic nature
of LuFe2O4.
A ferroelectric state was observed in the polycrystalline and single crystal samples below
280K. The polarisation data presented in this thesis demonstrate very clearly the onset
of the ferroelectric order. This is the only unambiguous data, presented after the initial
data reported by Ikeda et al. [17], that has ever been reproduced in the literature.
LuFe2O4 is reported in the literature to enter a ferroelectric 3D charge ordered state
below 330K. The disagreement with the literature may be caused by the high
conductivity expected due the very low resistance of the samples at room temperature.
Current leakage may distort the polarisation and account for the very high dielectric
constant measured in the samples at room temperature. Further work should confirm if
conductivity is an issue with these samples. The exact oxygen content of these samples
has still to be confirmed, which may explain any discrepancies with the published data.
4.8 Further Work
The exact oxygen stoichiometry of the two LuFe2O4-δ single crystals was originally going
to be determined by thermogravimetric analysis(TGA). This technique uses information
from the mass of oxygen lost when LuFe2O4-δ decomposes into Lu2O3 and Fe. The
combination of the high temperature and the H2 in the H2:Ar reducing atmosphere
required for TGA of this material [25] was found to damage the sensor, consequently
stoichiometric analysis of the crystals could not be completed in time for this thesis.
Alternatively, neutron powder diffraction can be used to accurately determine the
oxygen occupancies in the crystal structure. The oxygen content of the single crystals will
be estimated using this technique in due course using the GEM Express service at ISIS.
Pieces of single crystals grown as part of this work have been given to a number of other
research groups. The chemistry department at the University of Warwick is currently
investigating the high temperature phase changes which occur in LuFe2O4 when heated

76
in an oxygen rich atmosphere. A group at the University of Boston, MA, will be carrying
out optical spectroscopy experiments on the crystals and Prof. Jianqi Li at the Institute of
Physics, Chinese Academy of Science is using electron microscopy to investigate the
LuFe2O4-δ charge ordering.
A paper on the single crystal growth of LuFe2O4-δ and the experimental investigation
made as part of this thesis is currently in production.

77
Chapter 4
Multiferroic Properties of Gd0.9Lu0.1MnO3
The coexistence of ferroelectricity and magnetism within the orthorhombic perovskite
manganites RMnO3 was first discovered in TbMnO3 [29]. The magnetic and electric
properties within this series have been found to depend strongly on the magnitude of
the Mn-O-Mn bonding angle [33]. By tuning the MnO6 structure through changes in the
rare-earth ionic radius, the series transforms from non-magnetoelectric to
magnetoelectric with decreasing ionic radii [44]. The ability to control this structural
parameter and therefore the multiferroic properties within this series has created
much interest in these materials.
This chapter builds on work from a PhD thesis investigating rare-earth manganite
materials of the form RMnO3 and R1-xYxMnO3, where R is a rare earth element, which
has recently been completed by D. O’Flynn in the Superconductivity and Magnetism
Group at the University of Warwick [10, 36]. In particular, the discovery by O’Flynn of a
new group of multiferroic compounds of the form Sm1-xYxMnO3 (x=0.4, 0.5), discussed
in Section 1.3, has motivated research at Warwick into the effect of doping at the rare-
earth site of other members of the orthorhombic series which lie near the multiferroic
boundary. Studies into the multiferroic properties of single crystals of Gd1-xYxMnO3 and
Gd1-xLuxMnO3 are ongoing within the department.
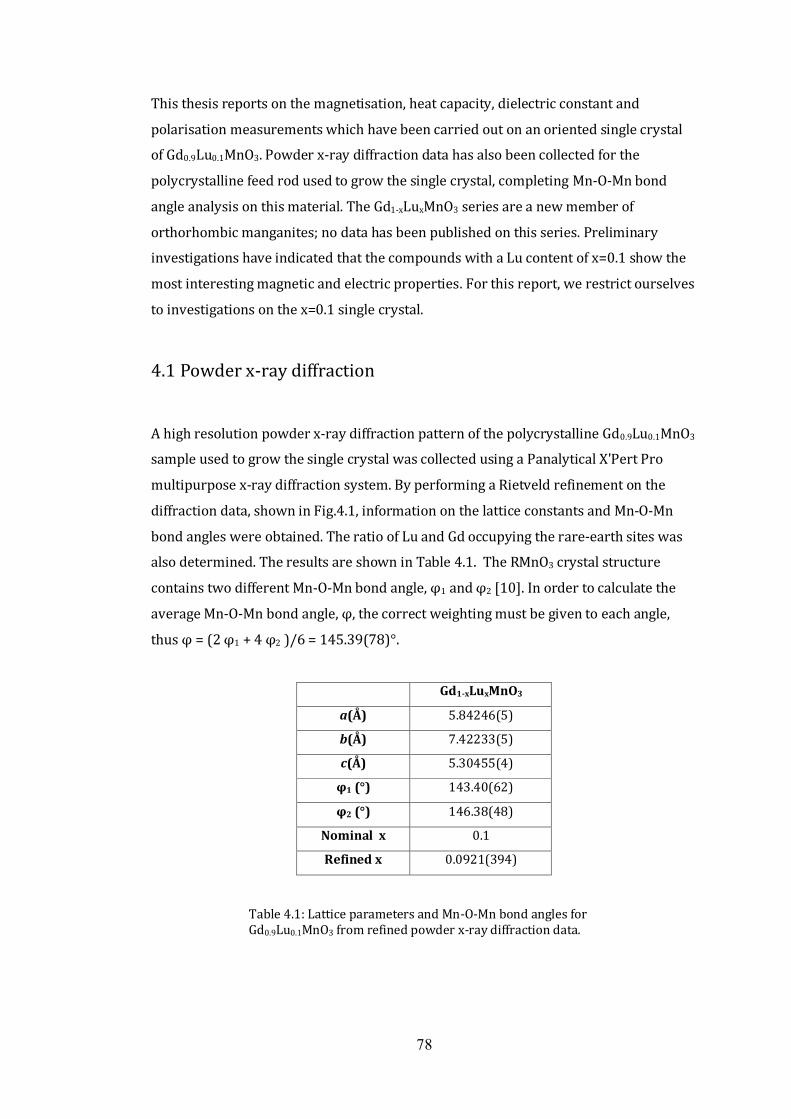
78
This thesis reports on the magnetisation, heat capacity, dielectric constant and
polarisation measurements which have been carried out on an oriented single crystal
of Gd0.9Lu0.1MnO3. Powder x-ray diffraction data has also been collected for the
polycrystalline feed rod used to grow the single crystal, completing Mn-O-Mn bond
angle analysis on this material. The Gd1-xLuxMnO3 series are a new member of
orthorhombic manganites; no data has been published on this series. Preliminary
investigations have indicated that the compounds with a Lu content of x=0.1 show the
most interesting magnetic and electric properties. For this report, we restrict ourselves
to investigations on the x=0.1 single crystal.
4.1 Powder x-ray diffraction
A high resolution powder x-ray diffraction pattern of the polycrystalline Gd0.9Lu0.1MnO3
sample used to grow the single crystal was collected using a Panalytical X'Pert Pro
multipurpose x-ray diffraction system. By performing a Rietveld refinement on the
diffraction data, shown in Fig.4.1, information on the lattice constants and Mn-O-Mn
bond angles were obtained. The ratio of Lu and Gd occupying the rare-earth sites was
also determined. The results are shown in Table 4.1. The RMnO3 crystal structure
contains two different Mn-O-Mn bond angle, φ1 and φ2 [10]. In order to calculate the
average Mn-O-Mn bond angle, φ, the correct weighting must be given to each angle,
thus φ = (2 φ1 + 4 φ2 )/6 = 145.39(78)°.
Gd1-xLuxMnO3
a(Å) 5.84246(5)
b(Å) 7.42233(5)
c(Å) 5.30455(4)
φ1 (°) 143.40(62)
φ2 (°) 146.38(48)
Nominal x 0.1
Refined x 0.0921(394)
Table 4.1: Lattice parameters and Mn-O-Mn bond angles for Gd0.9Lu0.1MnO3 from refined powder x-ray diffraction data.

79
20 30 40 50 60 70 80 900
200
400
600
800
1000
Inte
nsi
ty
2
4.2 Magnetic Properties
In order to understand the magnetic response of the Gd0.9Lu0.1MnO3 single crystal, the
magnetisation as a function of temperature was measured along the crystallographic a
and b-axes. Field cooled measurements ranging from 1 to 50kOe were carried out using
the SQUID, described in Section 2.5. Magnetisation data was collected during heating
from 2K to 60K at a sweeping rate of 1K/min. The magnetic response along the a and b-
axes, shown in Fig.4.2, are very similar, both show a gradual increase in magnetisation
with decreasing temperature. No sudden jumps are observed. The data shows a
systematic increase in magnetisation with increasing magnetic field along both
orientations.
Fig.4.1: Powder X-ray diffraction pattern for polycrystalline Gd0.9Lu0.1MnO3.
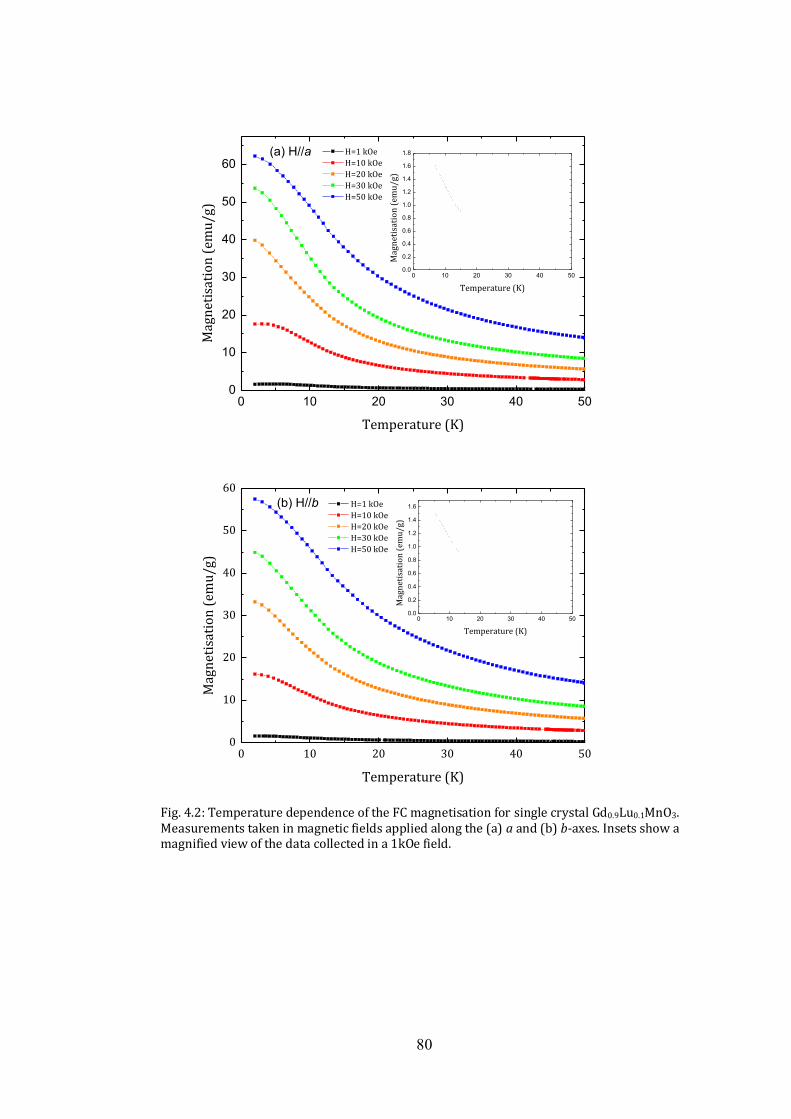
80
0 10 20 30 40 500
10
20
30
40
50
60
Mag
net
isat
ion
(em
u/g
)
Temperature (K)
H=1 kOe
H=10 kOe
H=20 kOe
H=30 kOe
H=50 kOe
(a) H//a
0 10 20 30 40 500
10
20
30
40
50
60
Mag
net
isat
ion
(em
u/g
)
Temperature (K)
H=1 kOe
H=10 kOe
H=20 kOe
H=30 kOe
H=50 kOe
(b) H//b
Fig. 4.2: Temperature dependence of the FC magnetisation for single crystal Gd0.9Lu0.1MnO3. Measurements taken in magnetic fields applied along the (a) a and (b) b-axes. Insets show a magnified view of the data collected in a 1kOe field.
0 10 20 30 40 500.0
0.2
0.4
0.6
0.8
1.0
1.2
1.4
1.6
1.8
Mag
net
isat
ion
(em
u/g
)
Temperature (K)
0 10 20 30 40 500.0
0.2
0.4
0.6
0.8
1.0
1.2
1.4
1.6
Mag
net
isat
ion
(em
u/g
)
Temperature (K)
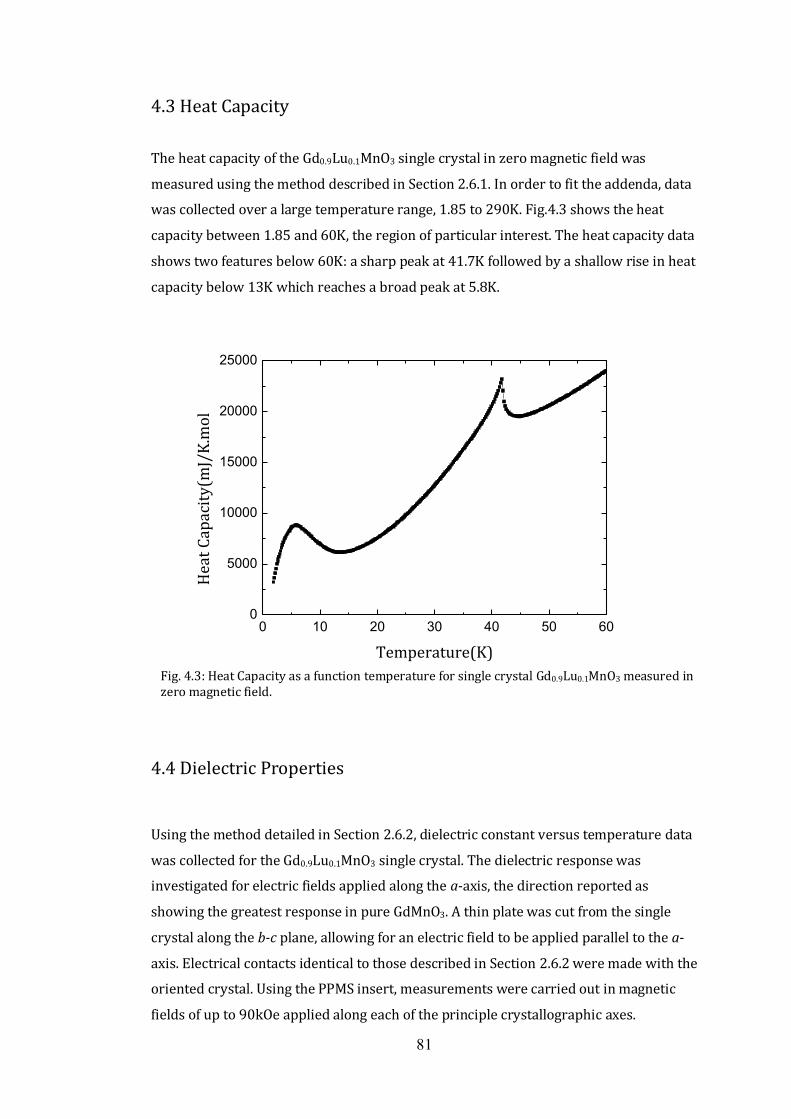
81
4.3 Heat Capacity
The heat capacity of the Gd0.9Lu0.1MnO3 single crystal in zero magnetic field was
measured using the method described in Section 2.6.1. In order to fit the addenda, data
was collected over a large temperature range, 1.85 to 290K. Fig.4.3 shows the heat
capacity between 1.85 and 60K, the region of particular interest. The heat capacity data
shows two features below 60K: a sharp peak at 41.7K followed by a shallow rise in heat
capacity below 13K which reaches a broad peak at 5.8K.
0 10 20 30 40 50 600
5000
10000
15000
20000
25000
Hea
t C
apac
ity
(mJ/
K.m
ol
Temperature(K)
4.4 Dielectric Properties
Using the method detailed in Section 2.6.2, dielectric constant versus temperature data
was collected for the Gd0.9Lu0.1MnO3 single crystal. The dielectric response was
investigated for electric fields applied along the a-axis, the direction reported as
showing the greatest response in pure GdMnO3. A thin plate was cut from the single
crystal along the b-c plane, allowing for an electric field to be applied parallel to the a-
axis. Electrical contacts identical to those described in Section 2.6.2 were made with the
oriented crystal. Using the PPMS insert, measurements were carried out in magnetic
fields of up to 90kOe applied along each of the principle crystallographic axes.
Fig. 4.3: Heat Capacity as a function temperature for single crystal Gd0.9Lu0.1MnO3 measured in zero magnetic field.

82
The sample was cooled in a magnetic field from 60K to 10K at a rate of 5K/min then
further cooled at a rate of 2K/min down to 2K. The capacitance as a function of
temperature was then measured from 2K to 60K at a sweeping rate of 1K/min. The
dielectric constant of the sample was calculated for the 10kHz measurements. The
magnetodielectric response along the a-axis is shown in Fig.4.4.
(i) Zero field
In zero magnetic field, the dielectric constant data for Gd0.9Lu0.1MnO3 shows two
features: a step-like jump below 10K followed by a peak in the response at ~16K. The
dielectric constant has an initial value of ~27 at 2K which rises to ~33 at the first
feature then reaches a maximum value of ~62 at the second feature. Above 16K, the
value of the dielectric constant exponentially decreases to a constant value of ~24 at
43K.
(ii) H//a
Magnetic fields of 10, 30, 50 and 90kOe were applied parallel to the a-axis, the data is
shown in Fig.4.4(a). The dielectric response of the 10kOe field is almost identical to the
zero field measurement; the features occur at a similar temperature and value to those
described for the zero field data. However, subtle differences do exist between the two
results. A small reduction in the maximum value of the dielectric constant occurs when
the 10kOe field is applied along the a-axis. Also, the step-like feature observed in the
10kOe response is not as sharp as the feature present in the zero field data. This feature
disappears for fields greater than 10kOe. Only one feature is present in the dielectric
response when 30, 50 and 90kOe magnetic fields are applied. The higher magnetic
fields reduce the maximum value of the dielectric constant, lowering it to ~57, ~37 and
~33 for 30, 50 and 90kOe fields, respectively. The temperature at which the feature
occurs is also dependent on the strength of the magnetic field. Initially, the feature
moves to lower temperatures, ~14K in a 30kOe field. The feature then shifts to higher
temperatures in larger magnetic fields, ~17K and ~20K for 50 and 90kOe fields,
respectively. The general shape of the feature also changes with increasing magnetic
field. The feature in the 30kOe response is broader than that observed in the zero and
10kOe field data. This is in stark contrast to the features in the 50 and 90kOe responses

83
which are much sharper. All of the dielectric responses reach a constant value of ~24 at
43K.
(iii) H//b
The largest dielectric constants were observed when magnetic fields were applied
parallel to the b-axis. Measurements were taken for 10, 30, 50, 70 and 90kOe fields, the
results are shown in Fig.4.4(b). The 10kOe dielectric response exhibits the two features
observed in the zero field data. The gradient of the step-like jump is shallower in this
case and only reaches a dielectric constant value of ~31. The dielectric constant of the
second feature, however, is slightly higher than the value reached in zero field. This
trend continues with increasing magnetic field: the maximum value of the dielectric
constant steadily increases reaching a value of ~73 in a 90kOe field. The stronger
magnetic fields also shift this feature to higher temperatures: the feature positioned at
~16K in zero field occurs at ~22K in a 90kOe field. The step-like jump is not present in
the 30-90kOe responses, however, a small feature is observed in the 90kOe response at
~4K. All of the dielectric responses converge to a constant value at ~43K.
(iv) H//c
The dielectric response, shown in Fig.4.4(c) was measured when 10, 20, 30, 50 and
90kOe magnetic fields were applied parallel to the c-axis. At 2K, the zero and 10kOe
responses have a dielectric constant value of ~27. This value is lowered as the magnetic
field is increased. The 20kOe response has an initial dielectric constant of ~24 and the
30-90kOe responses have an initial value of ~22. Both features observed in the zero
field data are present in the high field dielectric responses. As the magnetic field is
increased, the step-like jump, which disappears for fields greater than 10kOe along the
a and b-axes, becomes less defined. The dielectric constant of this feature decreases
from ~33, in zero field, to ~27 in a 90kOe field. The temperature of the feature
increases with strengthening field, reaching ~13K in a 90kOe field. The peak in the
response, the second feature, follows a similar pattern to the step-like jump: as the field
is increased, the dielectric constant decreases and the peak moves to higher
temperatures. A large change in dielectric constant occurs when the field applied along
the c-axis is increased to 20kOe: the feature shrinks from a dielectric constant value of
~61, in a 10kOe field, to ~42. This change in dielectric constant is not as large for
higher fields. Application of a 90kOe field produces a different response than lower
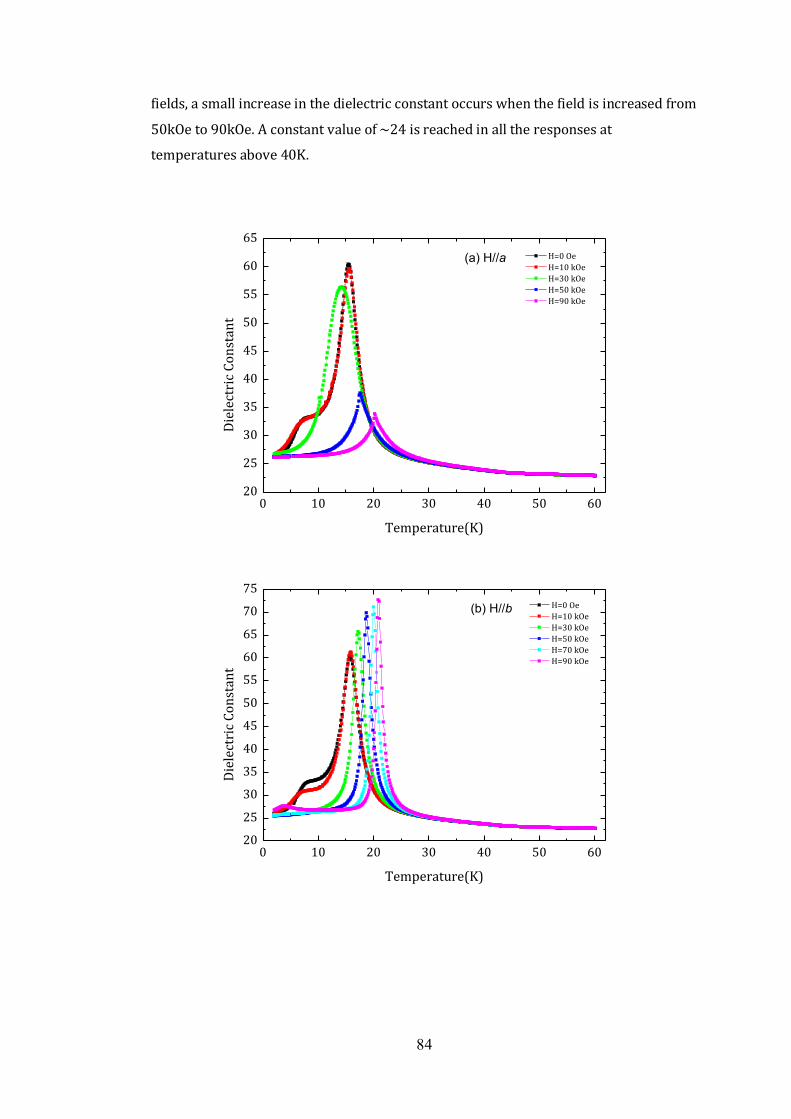
84
fields, a small increase in the dielectric constant occurs when the field is increased from
50kOe to 90kOe. A constant value of ~24 is reached in all the responses at
temperatures above 40K.
0 10 20 30 40 50 6020
25
30
35
40
45
50
55
60
65
D
iele
ctri
c C
on
stan
t
Temperature(K)
H=0 Oe
H=10 kOe
H=30 kOe
H=50 kOe
H=90 kOe
(a) H//a
0 10 20 30 40 50 6020
25
30
35
40
45
50
55
60
65
70
75
Die
lect
ric
Co
nst
ant
Temperature(K)
H=0 Oe
H=10 kOe
H=30 kOe
H=50 kOe
H=70 kOe
H=90 kOe
(b) H//b

85
0 10 20 30 40 50 6020
25
30
35
40
45
50
55
60
65
Die
lect
ric
Co
nst
ant
Temperature(K)
H=0 Oe
H=10 kOe
H=20 kOe
H=30 kOe
H=50 kOe
H=90 kOe
(c) H//c
4.5 Polarisation
The ferroelectric properties of the Gd0.9Lu0.1MnO3 single crystal were investigated by
measuring the change in the electric polarisation of the crystal with temperature. The
polarisation along the crystallographic a-axis was calculated from the pyroelectric
current of the sample measured as a function of time. Data was collected from the same
oriented sample used to measure the dielectric constant. The experimental method
used to determine the polarisation is described in Section 2.6.2(ii). Using the PPMS,
magnetic fields of up to 90kOe were applied along each of the a, b and c-axes, enabling a
full study of the anisotropic behaviour of the polarisation along the a-axis.
Using the same electrical contacts made for the dielectric constant measurements, a
voltage of +220Vmm-1 was applied across the sample before cooling, poling the crystal
in an electric field. The sample was then cooled in a magnetic field from 60K to 5K at a
rate of 3K/min. At 5K, the applied voltage was removed. In order to expel any surface
charge built up from application of the electric field, the sample was left connected to a
bleed resistor for 15 minutes. The pyroelectric current as a function of time was then
measured as the sample was heated to 60K at a sweeping rate of 2K/min. The resulting
electrical polarisation is shown in Fig.4.5.
Fig. 4.4: Dielectric response measured along the a-axis as a function of temperature for single crystal
Gd0.9Lu0.1MnO3. Measured at 10kHz in magnetic fields applied along the (a) a, (b) b and (c) c-axis.

86
(i) Zero field
A small spontaneous polarisation is observed along the crystallographic a-axis in zero
magnetic field. Gd0.9Lu0.1MnO3 enters a ferroelectric state below 16K. At ~12K, the state
reaches a maximum polarisation of ~200μC/m2. The shape of the feature indicates that
this state may disappear below 5K. Above 16K, the polarisation falls to zero and
Gd0.9Lu0.1MnO3 enters a paraelectric state.
(ii) H//a
The ferroelectric response of Gd0.9Lu0.1MnO3 was measured when 10, 30, 50 and 90kOe
magnetic fields were applied parallel to the a-axis, the results are shown in Fig.4.5(a). A
polarisation, similar to that observed in zero-field, occurs in a 10kOe field: a
ferroelectric state is induced below 16K and a maximum polarisation of ~245μC/m2 is
recorded at ~12K. A small spontaneous polarisation also occurs in higher magnetic
fields, however, the maximum value of the polarisation decreases with increasing field
strength, i.e. P=~130μC/m2 in a 30kOe field and ~55μC/m2 in a 90kOe field. From the
polarisation data in a 30kOe field, Gd0.9Lu0.1MnO3 is paraelectric above 15K. In general,
the temperature at which Gd0.9Lu0.1MnO3 enters the ferroelectric state increases with
increasing magnetic field. The temperature of the transition from a paraelectric to a
ferroelectric state increases from ~18K to above 20K when the field is increased from
50 to 90kOe. As with the zero field response, the polarisation appears to fall close to
zero below 5K for all of the field measurements.
(iii) H//b
The largest ferroelectric response was recorded when magnetic fields are applied
parallel to the b-axis, shown in Fig.4.5(b). Gd0.9Lu0.1MnO3 is strongly ferroelectric in
magnetic fields of 20kOe and above. At 5K, a polarisation of over 800μC/m2 is recorded
in a 20kOe field. The polarisation increases with increasing magnetic field reaching a
value of ~1250μC/m2 for a 90kOe field. A spontaneous polarisation of ~400μC/m2 is
also observed in a 10kOe field, however, the ferroelectric state is suppressed below 5K.
The temperature of the ferroelectric state is highly dependant on field. A steady
increase of the paraelectric-ferroelectric transition temperature is observed as the field

87
is increased from 0 to 90kOe. Strong fields induce a ferroelectric response within
Gd0.9Lu0.1MnO3 at temperatures above 20K.
(iv) H//c
Magnetic fields of 10, 20, 30, 50 and 90kOe were applied parallel to the c-axis. The
results for fields applied along this direction are shown in Fig.4.5(c). The spontaneous
polarisation recorded in zero field is enhanced when a 10kOe field is applied, reaching
a maximum value of ~300μC/m2. Higher fields suppress the value of the polarisation.
The ferroelectric state in Gd0.9Lu0.1MnO3 vanishes when the field reaches a magnitude
of 30kOe. A very small feature is observed in the polarisation when a field of 50kOe is
applied, this feature becomes more pronounced as the field is increased reaching a
maximum value of ~40μC/m2 for a 90kOe field. The temperature of the ferroelectric
state in the 10, 20 and 30kOe fields is very similar to the zero field response, only the
90kOe field moves the transition to a noticeably higher temperature, ~18K.
0 10 20 30 40 50 60
0
50
100
150
200
250
Po
lari
sati
on
(C
/m2
)
Temperature(K)
H=0 Oe
H=10 kOe
H=30 kOe
H=50 kOe
H=90 kOe
(a) H//a

88
0 10 20 30 40 50 60
0
200
400
600
800
1000
1200
1400
Po
lari
sati
on
(C
/m2)
Temperature(K)
H=0 Oe
H=10 kOe
H=20 kOe
H=30 kOe
H=50 kOe
H=70 kOe
H=90 kOe
(b) H//b
0 10 20 30 40 50 60
0
50
100
150
200
250
300
Po
lari
sati
on
(C
/m2)
Temperature(K)
H=0 Oe
H=10 kOe
H=20 kOe
H=30 kOe
H=50 kOe
H=90 kOe
(c) H//c
Fig. 4.5: Polarisation measured along the a-axis as a function of temperature for single crystal Gd0.9Lu0.1MnO3. Measured at 10kHz in magnetic fields applied along the (a) a, (b) b
and (c) c-axis.
(a)

89
4.5 Discussion
In order to understand the effect of Lu-doping at the rare-earth site of GdMnO3, the
results published by Kimura et al. [33], Hemberger et al. [34, 32], Feyerherm et al. [45]
and Noda et al. [46] for pure and Tb-doped GdMnO3 as well as Y-doped EuMnO3 are
initially summarised. The experimental results obtained as part of this work are then
compared with the published data.
(i) GdMnO3
Using the magnetoelectric phase diagram proposed by Kimura et al. [33], the spin and
charge ordering states observed in GdMnO3 are summarised.
Ordering of the Mn moments, TMn, from a paramagnetic to an incommensurate (IC)
antiferromagnetic (AF) state is found to occur at ~43K within GdMnO3. The dielectric
constant data published by Kimura et al. shows a change in the gradient at this
temperature. Below TMn, the Mn moments develop a sinusoidal magnetic spin structure
which propagates along the b-axis. Any FM components that exist within the Mn
structure are macroscopically averaged out. Consequently, a net magnetic polarisation
of the Gd sites cannot be induced by the sinusoidal structure of the Mn spins. The Gd
sublattice therefore remains paramagnetically ordered below TMn. The magnetisation
data for GdMnO3 do not show an anomaly at TMn when magnetic fields are applied both
parallel and perpendicular to the c-axis. Heat capacity measurements of GdMnO3,
conducted by Hemberger et al. [34], show a well defined feature, largely independent of
external magnetic field, close to 40K. These observations confirm the onset of an IC AF
spin structure with zero net FM moment. No features are observed in the polarisation
data at this temperature as GdMnO3 is paraelectric within this sinusoidally ordered
state.
Decreasing the temperature from TMn, the dielectric constant of GdMnO3 begins to
increase with a steep rise towards a maximum at ~23K. The magnetoelectric phase
diagram, reported by Kimura et al. [33], shows GdMnO3 to enter a canted AF state at
this temperature. Hemberger et al. [34] also describe the Mn moments as entering a
canted A-type AF phase with a small FM component oriented along the c-axis. This spin
canting results in the antiferromagnetic alignment of the Gd moments with the internal
field of the Mn moments. As the FM component of the Gd spins is stronger than the FM

90
component of the Mn spins, the Gd moments are directed parallel to the external
magnetic field. Below 23K, the dielectric constant drops to lower values. As the
temperature is lowered, a further anomaly is observed below 10K. The dielectric
constant exhibits a step-like increase towards lower temperatures showing two
features at ~8 and ~5K. These features coincide with the weak spontaneous electric
polarisation observed along the a-axis. Kimura et al. have attributed this spontaneous
ferroelectric state to a minor long-wavelength nearly-lock-in AF phase. The
polarisation which developed at 8K becomes suppressed below 5K. Using ac-
susceptibility data, Kimura et al. recorded a Gd moment ordering temperature, TGd, of
~5.1K. At TGd, the Gd sublattice sets up an additional canted antiferromagnetic (Gd-Gd)
ordering with a ferromagnetic (FM) component antiparallel to the FM moment of the
canted Mn spins. The canted Mn and Gd structures are AF coupled. This long-range
ordering of the Gd moments appears to suppress the ferroelectric state. Below TGd ,
GdMnO3 becomes paraelectric and renters the canted AF sate.
Application of an external magnetic field along the a, b and c-axes alters both the
position and shape of the features in the dielectric response and the polarisation along
the a-axis. In general, the temperature of the IC AF - A-type AF transition increases with
increasing field strength, of which, the most prominent dependence occurs when H is
parallel to the c-axis. The dielectric constant develops a secondary step-like feature
between the IC AF and canted AF states when a field is applied along the c-axis. This
feature is accompanied by a small anomaly in the polarisation data which is suppressed
at the canted AF ordering temperature. Below 10K, the final anomaly in the dielectric
constant vanishes when magnetic fields are applied along either the a or c-axes. When a
field is applied along the b-axis, the feature marking the onset of the electric
polarisation remain, however, it is suppressed and shifted to higher temperatures as H
is increased. The small feature which occurs at ~5K in zero field measurements
appears to vanish when the magnetic field is applied. Hemberger et al. [34] observed a
reduction in the canting angle of the Gd spins when external fields of 10kOe and above
were applied. The Gd ordered state becomes suppressed as the full Gd moment aligns
along the direction of the external magnetic field. From the polarisation data, the
ferroelectric state is no longer spontaneous and persists below 2K. Both the
ferroelectric transition temperature and the maximum value of the polarisation
increase with increasing magnetic field. The magnetoelectric phase diagram proposed
by Kimura et al. [33] suggests a ferroelectric phase with a polarisation along the a-axis
induced by a magnetic field along the b-axis (Fig.1.17).

91
A later paper by Feyerherm et al. [45] suggests a slightly different origin for the
ferroelectric state in pure GdMnO3. X-ray resonant magnetic scattering has been used
to build a picture of the ferroelectric phase in pure GdMnO3. Feyerherm et al. confirm
the antiferromagnetic ordering of the nearest neighbour Gd spins along the c-axis in
zero field previously suggested by Hemberger et al. [34]. They also confirm that this
ordering becomes ferromagnetic when an external magnetic field greater than 10kOe is
applied along the b-axis. The zero field low temperature transitions reported by Kimura
et al. [33] around the Gd ordering temperature have also been observed. In contrast
with Kimura et al, Feyerherm et al. have assigned the upper transition, at ~8K, to the
long-range ordering of the Gd moments and the lower transition, at T*=~5K, to a
modification of the magnetically ordered Gd structure. In this case, the Gd ordering
coincides with the spontaneous ferroelectric state. Ferroelectricity in GdMnO3 is
assumed to have the same origin as TbMnO3 where the spiral ordering of the Mn
moments, not the Gd moments, induces the ferroelectric state. Feyerherm et al.,
however, suggest that a specific field modified Gd moment arrangement is also related
to the occurrence of ferroelectricity in GdMnO3. A significant interplay between the Gd
and Mn ordering at low temperatures has previously been reported by Hemberger et al.
From these observations Feyerherm et al. have suggested a brief cycloidal ordering of
the Mn moment between TGd and T*. Below T* the ordering is believed to become
unstable and so disappears. The change in Gd ordering that occurs when an external
magnetic field is applied along the b-axis may stabilize this cycloidal ordering of the Mn
moments leading to the observed ferroelectricity in GdMnO3. The ordering of the Mn
moments are still directly responsible for the electric polarisation but the Gd moments
are important in stabilizing the ferroelectric state in GdMnO3.
(i) Gd1-xTbxMnO3
The effect of doping at the rare earth site on the ferroelectric phase of GdMnO3 has been
investigated by Noda et al. [46]. The polarisation and dielectric properties of
Gd1-xTbxMnO3 single crystals were investigated as a means to clarify the crossover
between the two distinct GdMnO3 and TbMnO3 phase diagrams. The publication drew a
different conclusion to Kimura et al. [33] on the origin of the ferroelectric state in pure
GdMnO3. Doping levels of x=0, 0.1, 0.3, 0.4, 0.5 and 1 where achieved and a
compositional phase boundary between GdMnO3 and TbMnO3 was found to exist
around a doping level of 0.3<x<0.4. A similar phase boundary was achieved within

92
Gd0.9Tb0.1MnO3 when external magnetic fields of 30-40kOe where applied along the b-
axis. Noda et al. observed the procession of two different ferroelectric states, FE1 and
FE2, within Gd1-xTbxMnO3. An electric polarisation along the a-axis was detected for
both the x=0 and 0.3 crystals in zero field. The ferroelectric state in pure GdMnO3, FE1,
is believed to originate from the magnetic ordering of the Gd moments whereas the
ferroelectric state in Gd0.7Tb0.3MnO3 is attributed to the spiral ordering of the Mn spins
found in TbMnO3. Noda et al. found that the ferroelectric state in pure GdMnO3
disappeared if the crystal was not cooled to temperatures below 6K, the Gd ordering
temperature. No such dependence was found for Gd0.7Tb0.3MnO3.
Investigation into the field-effect for Gd0.9Tb0.1MnO3 saw the re-emergence of the FE1
state when a field above 20kOe was applied along the b-axis. The transition
temperature for this state, in zero field, is thought to occur at a very low temperature.
Application of a magnetic field is believed to shift this transition to higher, attainable,
temperatures. FE2, a ferroelectric state similar to that observed in Gd0.7Lu0.3MnO3 is
also induced within Gd0.9Tb0.1MnO3 for fields above 40kOe. The polarisation
measurements show two successive phase transitions: an abrupt jump around the
sinusoidal AF-spiral AF transition temperature, found in TbMnO3 which corresponds to
the FE2 phase followed by a gradual increase around 15K corresponding to the FE1
phase. From their observations, Noda et al. [46] suggest a coexistence of both FE1 and
FE2 states for Gd0.9Tb0.1MnO3 in a magnetic field. The complex nature of the phase
changes in Gd0.9Tb0.1MnO3 expel the belief of a simple systematic change from GdMnO3
to TbMnO3 character.
(iii) Eu1-xYxMnO3
Hemberger et al. [32], in a more recent paper, have investigated the effect of doping
with non-magnetic Y on the ferroelectric properties of EuMnO3. They found that for low
doping concentrations, x<0.15, Eu1-xYxMnO3 exhibits the same magnetoelectric ordering
as pure EuMnO3. For high concentrations, x≥3, Eu1-xYxMnO3 has a phase diagram similar
to TbMnO3 where the Mn moments show a sinusoidal AF-spiral AF transition between
20 and 30K, depending on the doping level. The orientation of the polarisation changes
from GdMnO3-like (a-axis) to TbMnO3-like (c-axis) with increasing x [33]. A
concentration of x~0.2 was expected to reproduce the properties of pure GdMnO3,
however, Eu0.8Y0.2MnO3 was found to have both a weak ferromagnetic moment and a
relatively large polarisation, ~500μC/m2, in zero magnetic field. Hemberger et al.
93
concluded that Eu0.8Y0.2MnO3 enters a spiral AF state at ~30K followed by a possible
canted spiral AF state at ~22K which combines both of the observed finite spontaneous
magnetic moment and ferroelectricity. The development of this new magnetic phase
lead Hemberger et al. to suggest that the role of the magnetic rare earth is restricted to
the distortion of the magnetic structure connected with the magnetic A-site ordering at
low temperature. The modulation of the magnetic structure related to the onset of
ferroelectricity is only realized by the Mn sublattice. Hemberger et al. also point out the
importance of disorder effects caused by the doping. This disorder may influence the
properties of Eu0.8Y0.2MnO3.
(iv) Gd1-xLuxMnO3 – Present Study
Lu3+ has a smaller ionic radius than Gd3+, 0.861Å and 1.04Å respectively. Doping with
Lu decrease the R site volume of GdMnO3 altering its properties. The Rietveld
refinement preformed on the polycrystalline Gd0.9Lu0.1MnO3 sample estimated an
average Mn-O-Mn bond angle, φ, of 145.39(78)°. The average Mn-O-Mn bond angle of
the Gd0.9Lu0.1MnO3 single crystal was previously estimated by Liao et al. [47] using
single crystal x-ray diffraction data. An average Mn-O-Mn bond angle of 145.16(1)° was
estimated for the crystal. This is smaller than the Mn-O-Mn bond angle in GdMnO3,
φ=145.60(9)°[47].
Initially, the phase transitions observed by Kimura et al. [33] in GdMnO3 were thought
to be the same for Gd0.9Lu0.1MnO3. From the heat capacity data reported in this thesis, a
Mn moment ordering temperature similar to that observed in GdMnO3 was recorded
for Gd0.9Lu0.1MnO3. However, the features in the dielectric constant reported by Kimura
et al. for pure GdMnO3 and those observed in this thesis for Gd0.9Lu0.1MnO3 become
dissimilar below the IC ordering temperature. The paraelectric canted state expected of
GdMnO3 is not present in the magnetisation or dielectric constant data presented here
for Gd0.9Lu0.1MnO3. The reduced Mn-O-Mn bond angle positions Lu-doped GdMnO3
closer to TbMnO3 (φ=145.26(4)°) in the magnetoelectric phase diagram (Fig.1.17,
Introduction). Gd0.9Lu0.1MnO3 is therefore expected to exhibit multiferroic properties
similar to that of TbMnO3. The correlation between the features in the heat capacity,
dielectric constant and polarisation in zero magnetic field and the magnetisation in a
1kOe field are summarised in Fig.4.6.

94
Low level doping with Lu is believed to produce a crossover between the GdMnO3 and
TbMnO3 states. Although Tb has a larger ionic radius than Lu, a Mn-O-Mn bond angle
similar to Gd0.9Lu0.1MnO3 can be achieved within Gd1-xTbxMnO3, a comparison can
therefore be made between the two doped compounds. The dielectric response and
polarisation results reported by Noda et al. [46] for Gd0.9Tb0.1MnO3 along the a-axis
when a magnetic field of 40kOe is applied along the b-axis, are similar to that measured
in Gd0.9Lu0.1MnO3. This similarity may suggest the existence of two separate
ferroelectric states in Gd0.9Lu0.1MnO3 similar to the FE1 and FE2 states proposed by
Noda et al. for Gd1-xTbxMnO3.
An explanation similar to that suggested by Feyerherm et al. [45] for the onset of
ferroelectricity within GdMnO3 may also be applied to Gd0.9Lu0.1MnO3. As discussed in
Section 4.5, Gd0.9Lu0.1MnO3 enters a spontaneous ferroelectric state at ~ 16K which
decreases below ~12K in zero-field. The dielectric constant shows a plateau in the data
at this temperature followed by a continuous decrease in the dielectric value below
~7K. In addition, heat capacity measurements for Gd0.9Lu0.1MnO3 show a minimum in
the data around 13K followed by a broad peak at ~6K. Using Feyerherm et al.’s theory
the following scenario is suggested for Gd0.9Lu0.1MnO3: at ~16K, the Mn moments in
Gd0.9Lu0.1MnO3 develop a spiral magnetic spin structure similar to TbMnO3. Below
~12K, the spin structure of the Mn moments changes as a result of the long-range
ordering of the rare earth ion. In pure GdMnO3, long range ordering of the Gd moments
occurs around 8K. The Gd moments interact with the Mn moments changing the
magnetic ordering of Mn moments from a spiral spin structure to cycloidal spin
structure. This cycloidal ordering is both time and spatially invariant allowing for the
ferroelectric state to persist. Below 7K the Gd magnetic structure is altered, the
cycloidal ordering becomes unstable and the ferroelectric state disappears.
A similar explanation can be applied for magnetic fields applied along the c-axis. The
dielectric constant results show the same features observed in the zero field
measurement. In particular, the 90kOe measurements show Gd0.9Lu0.1MnO3 to enter a
brief ferroelectric phase at ~18K. The Mn moments are believed to form a spiral spin
structure at this temperature which evolves into a cycloidal ordering at ~16K, the
ordering temperature of the Gd moments. A sharp decrease in the dielectric constant at
~13K is accompanied by the loss of polarisation. The change in magnetic structure of
the Gd moments at this temperature weakens the cycloidal ordering and therefore
extinguishes the ferroelectric state.

95
The low temperature feature assigned to the destabilisation of the cyclodial Mn
ordering is not observed when magnetic fields greater than 20kOe are applied along
the b-axis. The dielectric constant data shows a peak at the spiral ordering temperature
of the Mn moments followed by a feature similar to that observed at ~12K in the zero-
field measurement. The corresponding polarisation data also shows a change in shape
at this temperature. A specific field modified ordering of the Gd moments is believed to
occur at this temperature which is accompanied by a cycloidal ordering of the Mn
moments. The field dependant Gd ordering stabilises the ferroelectric state allowing it
to persist below the 7K.
When magnetic fields are applied along the a-axis, the low temperature feature
observed in zero field disappears. As the field is increased, the dielectric constant takes
a similar form to the b-axis magnetic field measurements. Although the polarisation is
small it does not appear to fall to zero as is the case when magnetic fields are applied
along the c-axis. The polarisation reaches a maximum at the Gd ordering temperature
where the spiral Mn order changes to a cycloid. The field-induced Gd ordering appears
to stabilise the cycloidal ordering, however, it is much weaker than the cycloidal
ordering induced as a result of magnetic fields applied along the b-axis. This weakening
of the ferroelectric Mn ordering may explain the slight decrease in polarisation below
the spiral-cyclodial transition temperature.
The magnetoelectric phase transitions proposed for Gd0.9Lu0.1MnO3 are based on the
conclusions of both Noda et al. [46] and Feyerherm et al. [45]. Both papers cite the
importance of the long range ordering of the Gd moments on the ferroelectric state in
GdMnO3, however, they are in dispute of the exact origin of the state. Noda et al.
associate the state with the ordering of the Gd moments whereas Feyerherm et al.
suggest an ordering of the Mn moments influenced by the Gd ordering. Feyerherm et
al’s suggestion is more in keeping with theoretical results and the ferroelectric states
observed in other orthorhombic rare earth manganites. As demonstrated by
Hemberger et al. [34] GdMnO3, like DyMnO3, shows a magnetic coupling between the
rare earth and Mn ions at low temperatures. Structural distortions caused by
interference between the rare earth and Mn ions have also been observed within the
series. It is important to point out that unlike Tb, Lu is non magnetic, consequently, the
effect of R-site volume on the multiferroic phase of GdMnO3 can be observed without
influence from an additional magnetic moment caused by doping with a magnetic rare-

96
earth ion. The effect of magnetic ordering of the Tb moments on the multiferroic
properties of lightly doped GdMnO3 has not been discussed by Noda et al. Doping with
magnetic Tb will have a different effect on the Gd ordering than non-magnetic Lu. In
order to draw similar conclusions as Noda et al., Gd0.9Lu0.1MnO3 must be compared with
another non-magnetically doped member of the orthorhombic manganite series.
The influence of the ordering of the Gd moments on the ferroelectric state in
Gd0.9Lu0.1MnO3, should be reconsidered in light of Hemberger et al.’s [32] observation in
Y doped EuMnO3. As previously explained, doping with non-magnetic Lu allows for a
systematic variation of the ionic radii and the Mn-O-Mn angle without the additional
influence of a magnetic rare-earth moment. The long-range ordering of the rare earth
ions are expected to be unaltered by a non-magnetic dopant. The Gd ordering
temperature in Gd0.9Lu0.1MnO3 should therefore be similar to that of pure GdMnO3. The
features observed at 12K, initially thought to be the Gd ordering temperature, may
result from a change in the magnetic structure of the Mn system caused purely by a
change in the R-site volume and uninfluenced by any rare-earth ordering. The Mn
moments may then acquire a new ferroelectric type ordering, not observed in pure
GdMnO3, below this temperature. No features are observed in the magnetisation
therefore the canted spiral AF state observed for Eu0.8Y0.2MnO3 is not expected to occur
in Gd0.9Lu0.1MnO3. The feature around 6K may result from the ordering of the Gd
moments. The heat capacity results show a broad peak at this temperature similar to
that observed by Hemberger et al. [34] for pure GdMnO3. The magnetisation results for
Gd0.9Lu0.1MnO3 show a cusp like feature at this temperature in low fields. The Gd lattice
is expected to induce an additional AF ordering at the Gd ordering temperature in low
fields.
A number of different theories can be deduced from the results obtained from the
Gd0.9Lu0.1MnO3 single crystal. This report only covers a small number of possible
experiments needed to determine an accurate magnetoelectric phase diagram.

97
0 10 20 30 40 50 600
5000
10000
15000
20000
25000
Hea
t C
apac
ity
(mJ/
K.m
ol)
Temperature(K)
0.0
0.2
0.4
0.6
0.8
1.0
1.2
1.4
1.6
1.8
Mag
net
isat
ion
(em
u/g
)
H//a=1kOe
20
25
30
35
40
45
50
55
60
Die
lect
ric
Co
nst
ant
(d)
(c)
(b)
0
50
100
150
200 H=0Oe
Po
lari
sati
on
(C
/m2)
(a)
Fig. 4.6: (a) Polarisation and (b) dielectric constant measured along the a-axis of single crystal Gd0.9Lu0.1MnO3 in zero magnetic field. (c) FC magnetisation in a 1kOe magnetic field applied along the a-axis and (d) heat capacity measured in zero applied field.
E//c
E//c
98
4.6 Conclusion
A study investigating the magnetic and electric properties of an oriented single crystal
of Gd0.9Lu0.1MnO3 has been presented.
Doping with Lu at the rare-earth site of orthorhombic GdMnO3 (φ=145.60(9)°) has
been found to alter the properties of the parent compound. A Mn-O-Mn bond angle of
145.16(1)° was previously estimated by Liao et al. for the Gd0.9Lu0.1MnO3 single crystal.
The reduced Mn-O-Mn bond angle positions the Lu-doped GdMnO3 closer to
multiferroic TbMnO3 (φ=145.26(4)°) in the spin ordering phase diagram. The close
proximity to the spiral magnetic ordering/ferroelectric state observed in TbMnO3 has
created a number of unique features in the experimental results of the Gd0.9Lu0.1MnO3
single crystal.
Ordering of the Mn moments attributed to a transition from a paramagnetic to
sinusoidal incommensurate antiferromagnetic state is observed in the heat capacity of
single crystal Gd0.9Lu0.1MnO3 at 41.7K. The single crystal is found to enter a
spontaneous ferroelectric state below 16K along the crystallographic a-axis. A feature
in the dielectric constant indicative of a spiral AF ordering of the Mn moments is also
observed at this temperature. A ferroelectric state is present in all the polarisation data
collected for magnetic fields applied along each of the a, b and c-axes. The multiferroic
state previously observed in GdMnO3 along the a-axis when magnetic fields are applied
along the b-axis is enhanced in the lightly doped crystal. The absence of a canted A-type
AF state in the magnetisation, normally present for the parent compound, and the
persistence of a ferroelectric state in the polarisation data allow for the suggestion of a
new magnetically ordered ferroelectric state, influenced by the ordering of the Gd
moments, to occur within Gd0.9Lu0.1MnO3 .
4.7 Further Work
In order to analyse the results and interpret the features in the data, reference has been
made to published pure and Tb-doped GdMnO3 and Y-doped EuMnO3 data. Ideally
additional measurements such as neutron diffraction and x-ray resonant scattering
should be carried out to accurately determine the magnetic spin structures that occur
in the single crystal. X-ray resonant scattering would be the preferred technique as Gd

99
is a highly absorbing nucleus for neutrons. In order to complete the magnetoelectric
phase diagram, dielectric constant and polarisation measurements should be carried
out along the b and c-axes in zero and applied magnetic fields. Heat capacity
measurements in magnetic fields applied along each of the crystallographic axes should
also be carried out in order to complete thermal analysis of the crystal.
The work completed as part of this thesis will supplement a larger paper on the
structural, magnetic and dielectric properties of polycrystalline and single crystal Gd1-
xLuxMnO3 (x≤0.2) currently in preparation.

100
References
[1] S.-W. Cheong and M. Mostovoy, Nature Materials 6, p13-20 (2007).
[2] M.A. Subramanian, T. He, J. Chen, N.S. Rogado, T.G. Calvarese and A.W. Sleight, Adv.
Mater. 18, 1737-1739 (2006).
[3] N. Ikeda, H. Ohsumi, K. Ishii, T. Inami, K. Kakurai, Y. Murakami, K. Yoshii, S. Mori, T.
Horibe and H. Kitô, Nature 436, 25(2005).
[4] M. Fiebig, J. Phys. D: Appl. Phys. 38, R123-152 (2005).
[5] H. Schmid, Multiferroic Magnetoelectrics, Ferroelectrics 162, 317.
[6] S. Blundell, Magnetism in Condensed Matter, Oxford Master Series in Condensed
Matter Physics.
[7] D.I. Khomskii, Journal of Magnetism and Magnetic Materials 306, p1-8 (2006).
[8] W. Eerenstein, N.D. Mathur and J.F. Scott, Nature 442, p759-765 (2006).
[9] S. Picozzi and C. Ederer, J. Phys.: Condens. Matter 21, 303201 (2009).
[10] D. O’Flynn, Ph.D. thesis, University of Warwick (2010).
[11] H.Lewtas, Ph.D. thesis, University of Oxford (2010).
[12] J. van der Brink and D.I. Khomskii, J.Phys.: Condens. Matter 20, 434217 (2008).
[13] J. Iida, S. Takekawa and N. Kimizuka, Journal of Crystal Growth 102, p398-400
(1990).

101
[14] N. Ikeda, J. Phys.: Condens. Matter 20, 434218 (2008).
[15] Y. Yamada, K. Kitsuda, S. Nohdo and N. Ikeda, Phys. Rev. B 62, 18 (2000).
[16] K.-T. Ko, H.-J. Noh, J.-Y. Kim, B.-G. Park, J.-H. Park, A. Tanaka, S.B. Kim, C. L. Zhang
and S.-W. Cheong, Phys. Rev. Lett. 103, 207202 (2009).
[17] N. Ikeda, K. Kohn, N. Myouga, E. Takahashi, H. Kitôh and S. Takekawa, J. Phys. Soc.
Jpn. 69, 5 p1526-1532 (2000).
[18] A.D. Christianson, M.D. Lumsden, M. Angst, Z. Yamani, W. Tian, R. Jin, E.A. Payzant,
S.E. Nagler, B.C. Sales and D. Mandrus, Phys. Rev. Letts. 100, 107601 (2008).
[19] M. Angst, R.P. Hermann, A.D. Christianson, C. Lee, M.-H. Whangbo, J.-W. Kim, P.J.
Ryan, S.E. Nagler, W. Tian, R. Jin, B.C. Sales and D. Mandrus, Phys. Rev. Lett. 101,
227601 (2008).
[20] X.S. Xu, M. Angst, T.V. Brinzari, R.P. Hermann, J.L. Musfeldt, A.D. Christianson,
D.Mandrus, B.C. Sales, S. McGill, J.-W. Kim and Z. Islam, Phys. Rev. Lett. 101, 227602
(2008).
[21] M. Isobe, N. Kimizuka, J. Iida and S.Takekawa, Acta Cryst. C 46, 1917-1919 (1990).
[22] J. Iida, M. Tanaka, Y. Nakagawa, S. Funahashi, N. Kimizuke and S. Takekawa, J. Phys.
Soc. Jpn. 62,5, 1723-1735 (1993).
[23] S. Funahashi, J. Akimitsu, K. Siratori, N. Kimizuka, M. Tanaka and H. Fujishita, J.
Phys. Soc. Jpn. 53, 2688-2696 (1984).
[24] W. Wu, V. Kiryukhin, H.-J. Noh, K.-T. Ko, J.-H. Park, W. Ratcliff II, P.A. Sharma,
N.Harrison, Y.J. Choi, Y. Horibe, S. Lee, S. Park, H.T. Yi, C.L. Zhang and S.-W. Cheong, Phys.
Rev. Lett. 101, 137203 (2008).
[25] F. Wang, J. Kim, Y.-J. Kim and G.D. Gu, Phys. Rev. B 80, 024419 (2009).

102
[26] M.H. Phan, N.A. Frey, M. Angst, J. de Groot, B.C. Sales, D.G. Mandrus and H. Srikanth,
Solid State Communications 150, p341-345 (2010).
[27] T. Michiuchi, Y. Yokota, T. Komatsu, H. Hayakawa, T. Kuroda, D. Maeda, Y. Matsuo,
S. Mori, K. Yoshii, N. Hanasaki, T. Kambe and N. Ikeda, Ferroelectrics 378, p175-180
(2009).
[28] J. Kim, S.B. Kim, C. U. Jung and B.W. Lee, IEEE Transactions on Magnetics 45,6
(2009).
[29] T. Kimura, T. Goto, H. Shintani, K. Ishizaka, T. Arima and Y. Tokura, Nature 426, 55
(2003).
[30] S. Ishihara, J. Phys. Soc. Jpn 79, 1 (2010).
[31] T. Kimura, S. Ishihara, H. Shintani, T. Arima, K.T. Takahashi, K. Ishizaka, and Y.
Tokura, Phys. Rev. B 68, 060403 (2003).
[32] J. Hemberger, F. Schrettle, A. Pimenov, P. Lunkenheimer, V. Yu. Ivanov, A.A.
Mukhin, A.M. Balbashov and A. Loidl, Phys. Rev. B 75, 035118 (2007).
[33] T. Kimura, G. Lawes, T. Goto, Y. Tokura and A.P. Ramirez, Phys. Rev. B 71, 224425
(2005).
[34] J. Hemberger, S. Lobina, H.-A. Krug von Nidda, N. Tristan, V. Yu. Ivanov, A.A.
Mukhin, A.M. Balbashov and A. Loidl, Phys. Rev. B 70, 024414 (2004).
[35] V. Yu. Ivanov, A.A. Mukhin, V.D. Travkin, A.S. Prokhorov, Yu. F. Popov, A.M.
Kadomtseva, G.P. Vorob’ev, K.I. Kamilov and A.M. Balbashov, Phys. Stat. Sol. B 243, 1,
107-111 (2006).
[36] D. O’Flynn, C.V. Tomy, M.R. Lees, A. Daoud-Aladine and G. Balakrishnan, Phys. Rev.
B 83, 174426 (2011).
[37] V.K. Wadhawam, Introduction to Ferroic Materials, Gordon and Breach Science
Publishers, p.10.

103
[38] Y. Zhang, H.X. Yang, Y.Q. Guo, C. Ma, H.F. Tian, J.L. Luo and J.Q. Li, Phys. Rev. B 76,
184105 (2007).
[39] J.Y. Park, J.H. Park, Y.K. Jeong and H.M. Jang, Appl. Phys. Lett. 91, 152903 (2007).
[40] S. Taran, C.C. Chou, J.L. Her, C.P. Sun, C.C. Lin, C.L. Chan, C.L. Huang and H.D. Yang, J.
Phys.: Conference Series 150, 042205 (2009).
[41] K. Yoshii, N. Ikeda, Y. Matsuo, Y. Horibe and S. Mori, Phys. Rev. B 76, 024423
(2007).
[42] M. Inazumi et al., J. Phys. Soc. Jpn. 50, 438 (1981).
[43] C.R. Serrao, A.K. Kunda, S.B. Krupanidhi, U.V. Waghmare and C.N.R. Rao, Phys. Rev.
B 72, 220101 (2005).
[44] W.S. Ferreira, J. Agostinho Moreira, A. Almeida, M.R. Chaves, J.P. Araújo, J.B.
Oliveira, J.M. Machado Da Silva, M.A, Sá, T.M. Mendonça, P. Simeão Carvalho, J.Kreisel,
J.L. Ribeiro, L.G. Vieira, P.B. Tavares and S. Mendonça, Phys. Rev. B 79, 054303 (2009).
[45] R. Fayerherm, E. Dudzik, A.U.B. Wolter, S. Valencia, O. Prokhnenko, A. Maljuk, S.
Landsgesell, N. Aliouane, L. Bouchenoire, S. Brown and D.N. Argyriou, Phys. Rev. B 79,
134426 (2009).
[46] K. Noda, S. Nakamura and H. Kuwahara, IEEE Transactions on Magnetics 41, 10
(2005).
[47] D. Liao, M.R. Lees, D.M. Paul, D.S. Keeble and G. Balakrishnan, (in preparation to be
published).