Embed Size (px)
Citation preview
STUDIES OF THE EFFECT OF NICOTINE ON COLOR VISION IN COLOR
DEFICIENT HUMANS
by
WARREN GWYNN
MICHAEL S. LOOP, COMMITTEE CHAIR
ADAM GORDON
TIMOTHY W. KRAFT
A THESIS
Submitted to the graduate faculty of The University of Alabama at Birmingham,
in partial fulfillment of the requirements for the degree of
Master of Science
BIRMINGHAM, ALABAMA
2014

Copyright by
Warren Gwynn
2014

iii
STUDIES OF THE EFFECT OF NICOTINE ON COLOR VISION IN COLOR
DEFICIENT HUMANS
WARREN GWYNN
VISION SCIENCE
ABSTRACT
Previous research showed that oral nicotine use in non-smoking color normal in-
dividuals significantly improved color discrimination scores on the F-M 100 and both
white and red increment thresholds of the Red Test. Our research sought to determine if
similar results could be found when oral nicotine was administered to color deficient in-
dividuals.
Ten color deficient individuals were first screened with both the HRR and Nagel
Anomaloscope. Next, the F-M 100 and Red Test were performed before and after chew-
ing nicotine gum (four mg). Subjects were introduced to testing procedures in one visit; a
second visit, at least 24 hours later, involved nicotine administration with baseline values
and data through 30 minutes of use.
While color normal individuals significantly improved on both the F-M 100 and
the Red Test with most improvement on the red portion, color deficient individuals sig-
nificantly improved equally on both white and red portions of the Red Test but showed
no reliable improvement on the F-M 100. Baseline color discrimination and age were
considered in explaining who might benefit most from nicotine gum but neither showed
any correlation. The effect of nicotine gum on Red Test values showed the greatest im-
provements in the first 10 minutes with gradual improvement the last 20 minutes.
It is possible that color normal individuals gained advantage on the F-M 100 after
nicotine gum use because their wavelength opponent systems showed greater improve-
iv
ment than their non-wavelength opponent systems; this is speculated to increase color
saturation. Color deficient individuals gained no advantage on the F-M 100 because both
wavelength opponent and non-wavelength opponent systems increased equally resulting
in no change in color saturation. Therefore, nicotine gum use may not be an effective
treatment for the color deficient.
Keywords: F-M 100, Red Test, nicotine, color deficiency
v
TABLE OF CONTENTS
Page
ABSTRACT ....................................................................................................................... iii
LIST OF FIGURES ........................................................................................................... vi
INTRODUCTION ...............................................................................................................1
METHODS ..........................................................................................................................3
Subjects ........................................................................................................................3
Testing..........................................................................................................................4
Procedure .....................................................................................................................7
RESULTS ............................................................................................................................8
DISCUSSION ....................................................................................................................19
F-M 100 .....................................................................................................................19
Red Test – White Light ..............................................................................................20
Red Test – Red Light .................................................................................................21
Explanations ...............................................................................................................21
LIST OF REFERENCES ...................................................................................................24
APPENDIX: IRB APPROVAL FORM.............................................................................26
vi
LIST OF FIGURES
Figure Page
1 Red Test conversion of pulse width modulation (%) to cd/m2
with accompanying best fit line. ..............................................................................6
2 Pre and 30 minute post gum FM-100 values ...........................................................9
3 White portion of the Red Test ................................................................................10
4 Red portion of the Red Test ...................................................................................10
5 White light thresholds as a function of time ..........................................................12
6 Red light thresholds as a function of time .............................................................12
7 Change in white luminosity thresholds compared to pre gum TES.......................13
8 Change in red luminosity thresholds compared to pre gum TES ..........................14
9 Change in TES compared to pre gum TES ............................................................14
10 Change in white luminosity thresholds as a function of age .................................15
11 Change in red luminosity thresholds as a function of age .....................................15
12 Change in TES as a function of age .......................................................................16
13 FM-100 practice effect ...........................................................................................16
14 Red Test (white portion) practice effect ................................................................17
15 Red Test (red portion) practice effect ....................................................................18
1
INTRODUCTION
Smoking has long been known for its association with diseases such as vascular
disease, cancer, chronic obstructive lung disease and peptic ulcer disease. Due to nico-
tine’s link with cigarette smoking, it too has been association with these conditions. Nic-
otine is the major factor behind cigarette addiction but its assumed role in disease devel-
opment is unclear. In fact, there is a general lack of evidence linking nicotine, per se,
with these diseases caused by cigarette smoking. Nicotine is only speculated to play a
secondary role in the development of these diseases, while the tobacco smoke is likely
the primary culprit (Benowitz, 1986). The strongest case in arguing nicotine as a produc-
er of systemic disease is through its associating with vascular disease because of its well-
known effects of increasing blood pressure and heart rate (Benowitz et al, 1988).
With all the negativity surrounding nicotine, its therapeutic properties can be
overlooked. Benowitz (1996) explained many of these therapeutic properties. The main
role of nicotine as a medication is through nicotine replacement therapy in which nicotine
chewing gum and patches replace cigarette smoking to help ease addiction. Nicotine also
has a possible role in treating ulcerative colitis, Alzheimer’s disease, Parkinson’s disease,
Tourette’s syndrome, sleep apnea, and attention deficit disorder (Benowitz, 1996). Nico-
tine has also been shown to enhance certain visual processes. Warwick and Eysenck
(1963) showed that critical flicker frequency (CFF) threshold was increased after nicotine
use. Most recently, while smoking a pack of cigarettes a day has been shown to cause

2
color vision defects (Bimler and Kirkland, 2004; Erb et al, 1999), Naser et al. (2011)
showed nicotine, in isolation (four mg gum), given to non-smokers improved color-vision
discrimination (F-M 100) and threshold detection (Red Test).
This research is a continuation of the Naser et al. (2011) study that showed nico-
tine improves color-vision discrimination and threshold detection. Our research used
similar methods but instead of using color normal individuals, we administered nicotine
to congenital color deficient subjects. Supporting this research is the idea that nicotinic
acetylcholine receptors (nAChRs) are found throughout the nervous system including
parts that involve the processing of visual stimuli such as the retina (Liu et al, 2009), lat-
eral geniculate nucleus (LGN), superior colliculus (SC) (Gotti et al, 2005), and visual
cortex (V1) (Schröder et al, 1989). These nAChRs are activated by nicotine and could be
the explanation as to why nicotine in isolate (not through smoking) affects color-vision.

3
METHODS
Subjects
Ten color deficient individuals, of several types, were recruited for this study: six
deuteranomalous, one protanomalous, and three protanopes. These subjects signed con-
sent forms approved by the IRB that outlined the purpose of the study beforehand. Sub-
jects were required to have had a comprehensive eye exam within the last year to rule out
any ocular diseases or disorders. The H.R.R. test was used to confirm color deficiencies.
Subjects were limited to those color deficient individuals that did not smoke,
preferably those that had never smoked. Subjects were not accepted if they were current
nicotine users of any kind, including nicotine gum or smokeless tobacco. In keeping with
the Naser et al. exclusion criterion, those not allowed to participate included individuals
with a history of high blood pressure, abnormal heart rhythm, heart palpitation/murmurs,
history of strokes, arteriosclerosis, diabetes, asthma, dental work that would prevent the
subject from chewing gum, stomach ulcers, overactive thyroid, history of seizures, eye
disease, temporomandibular joint disorders, or blood vessel problems. Certain medica-
tion also prevented participation because of a possible interaction with nicotine gum in-
cluding the following: asthma medication, insulin, opioids, Inderal, or bronchodilators.

4
Testing
Two tests were used to assess nicotine use on color vision disorders: the FM-100
and Red Test.
FM-100: This test uses 85 colored caps (four trays) that vary across the color
spectrum but differ only slightly in hue from one cap to the next (Farnsworth, 1943).
These caps are placed at random in front of the subjects while being illuminated with a
Macbeth lamp just like the H.R.R. test. The preferred illumination for this test is 25 foot
candles to simulate an average daylight condition; the Macbeth lamp is a standard meth-
od to provide this level of light and color balance (Farnsworth, 1957). A fixed cap in
each tray is the starting point and the subjects are asked to place the remaining caps in
order so that similar hues are next to each other in the trays.
It has been shown that there may be improvements between the first and second
test scores of the F-M 100, but this improvement diminishes on further retests. One study
showed a 30% improvement on the second test and little improvement on the third
(Farnsworth, 1957). Naser et al. (2011) also found no significant improvement after the
second F-M 100 test (but see Hardy et al, 1994; Breton et al, 1988). To avoid this effect
in the main experiment, subjects were given a trial run before later tests were done. In
all, subjects were asked to perform the F-M 100 three times, once to familiarize them-
selves with the test, once before the administration of nicotine and once afterwards.
Red Test: The Red Test was used to measure changes in color vision detection
threshold. The Red Test (York & Loop, 2008) measures increment threshold of both
white and red light. It uses a 30.5 cm x 30.5 cm x 45.7 cm wooden box in which a piece
of translucent white plastic is used as one side and is lit from within the box to create a
5
white background of 9750K (x=.289, y=.277) by multiple light-emitting diodes (LEDs)
to a luminance of 150 cd/m2. Inside the box is a white (7750K) LED that uses the addi-
tion of either an empty slide or red filter to project a circular stimuli (2.5 cm/ 2.5° at 57
cm) onto the square plastic screen (27 cm/ 27° at 57 cm). In using the empty slide, a
white stimulus of 6917K (x=.302, y=.318) is created. This spot of light is changed to a
red stimulus (x=.715, y=.286) by placing a Wratten No. 26 filter (dominate wavelength:
620.6 nm, excitation purity: 100%) in front of the LED.
Subjects placed their chins into a chin rest 57 cm from the viewing screen and
controlled the intensity of the light source through a potentiometer which adjusted the
pulse width of a 1000 Hz square wave flicker. The subject was asked to increase the in-
tensity of the light to the point where it was barely visible (method-of-adjustment). Once
the value had been recorded, the intensity is turned down below threshold and the subject
performed the test again. The values given by the pulse width modulation controller
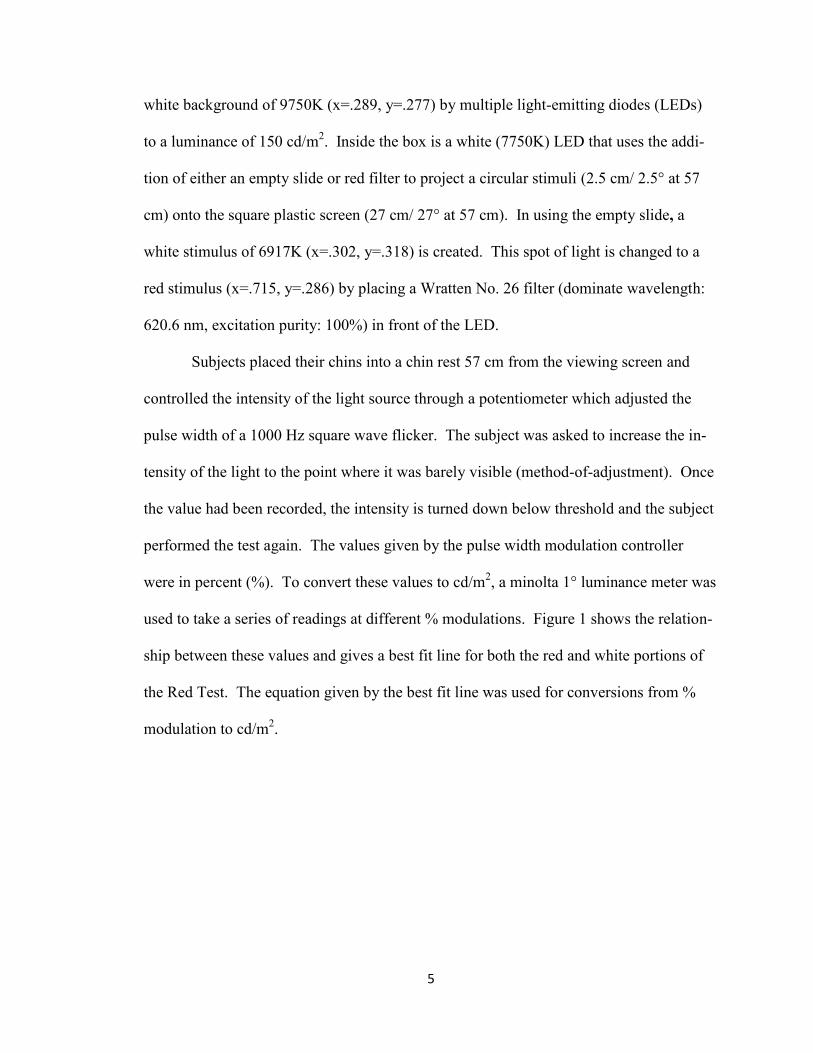
were in percent (%). To convert these values to cd/m2, a minolta 1° luminance meter was
used to take a series of readings at different % modulations. Figure 1 shows the relation-
ship between these values and gives a best fit line for both the red and white portions of
the Red Test. The equation given by the best fit line was used for conversions from %
modulation to cd/m2.
6
Figure 1. Red Test conversion of pulse width modulation (%) to cd/m2 with accompany-
ing best fit line. Note the large R2 values of both the red and white portions of the Red
Test.
One complete Red Test included testing both the white and red light five times
each. There were a total of five complete Red Tests perform, once following the famil-
iarization with the FM-100, once before nicotine administration and three after nicotine
administration. The Red Test has proven to be an effective way to clearly differentiate
between color deficient and color normal individuals (York et al, 2008). In our study, it
was used to determine if nicotine restores any amount of the loss of sensitivity to long
wavelength light found in those with color vision anomalies.
y = 0.0997x + 0.1498
R² = 0.9992
y = 0.7612x + 0.7281
R² = 0.9998
0
10
20
30
40
50
60
70
80
90
0 20 40 60 80 100 120
Cd
/m^2
Pulse width modulation (%)
Red (cd/m^2)
White (cd/m^2)
Linear (Red (cd/m^2))
Linear (White (cd/m^2))
7
Procedure
The entire experiment required each subject to participate in two visits. The first
visit consisted of preliminary items in preparation for the main experiment in the second
visit. First, to confirm a color deficiency, a screening was done using an H.R.R. test. Af-
terwards, we began the informed consent process and checked eligibility through a medi-
cal history. During this visit subjects took the F-M 100 test and Red Test to familiarize
themselves with the procedure. Five Nagel Anomaloscope settings were also taken to
differentiate between dichromats and anomalous trichromats.
The second visit began with baseline measurements of the F-M 100 and the Red
Test. After taking these tests, patients were administered nicotine in the form of chewing
gum. While chewing the gum, the subjects performed the Red Test at the 10, 20 and 30
minute marks (for a total of five Red Tests including the preliminary test). At 30 minutes
the gum was thrown away and the F-M 100 assessment was done again (for a total of
three F-M 100 tests including the preliminary testing). A four mg dose of nicotine gum
was used because Naser et al. (2011) found four mg to produce a larger effect than two
mg. Testing with both the F-M 100 and Red Test was done binocularly in a darkened
room without a time limit.

8
RESULTS
F-M 100 results were quantified as total error scores (TES) which can vary from 0
to a very large number (~1,000). Scoring was assisted by F-M 100 scoring software cre-
ated by Gretagmacbeth, LLC. All p-values were determined using non-parametric statis-
tical test due to differing population, or types of color deficiencies, between subjects.
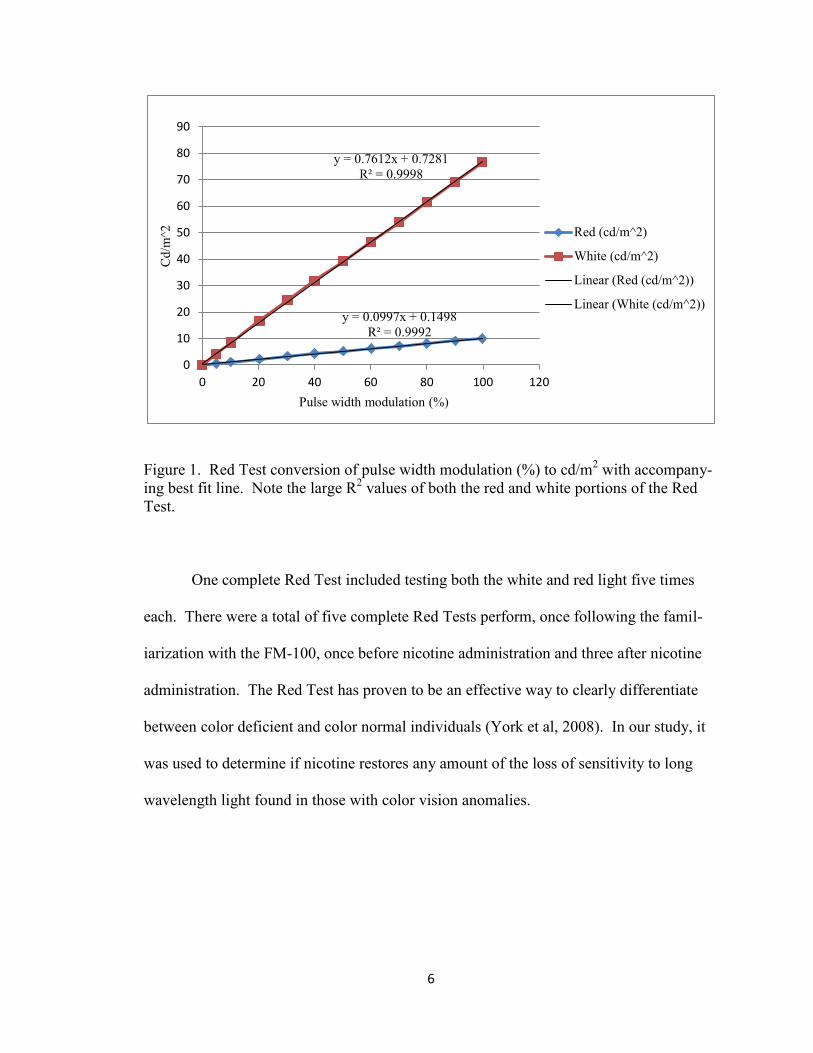
The second session pre gum and 30 minutes post gum F-M 100 values were
measured and compared by individual (see Figure 2). Of the 10 subjects, 7 improved on
their F-M 100 scores while 3 scored worse. Also included in Figure 2 is the average TES
of subjects without color deficiencies based on age as determined by Kinnear and
Sahraie. (2002).
9
Figure 2. Pre and 30 minute post gum F-M 100 values. Note that a lower TES means
better color discrimination.
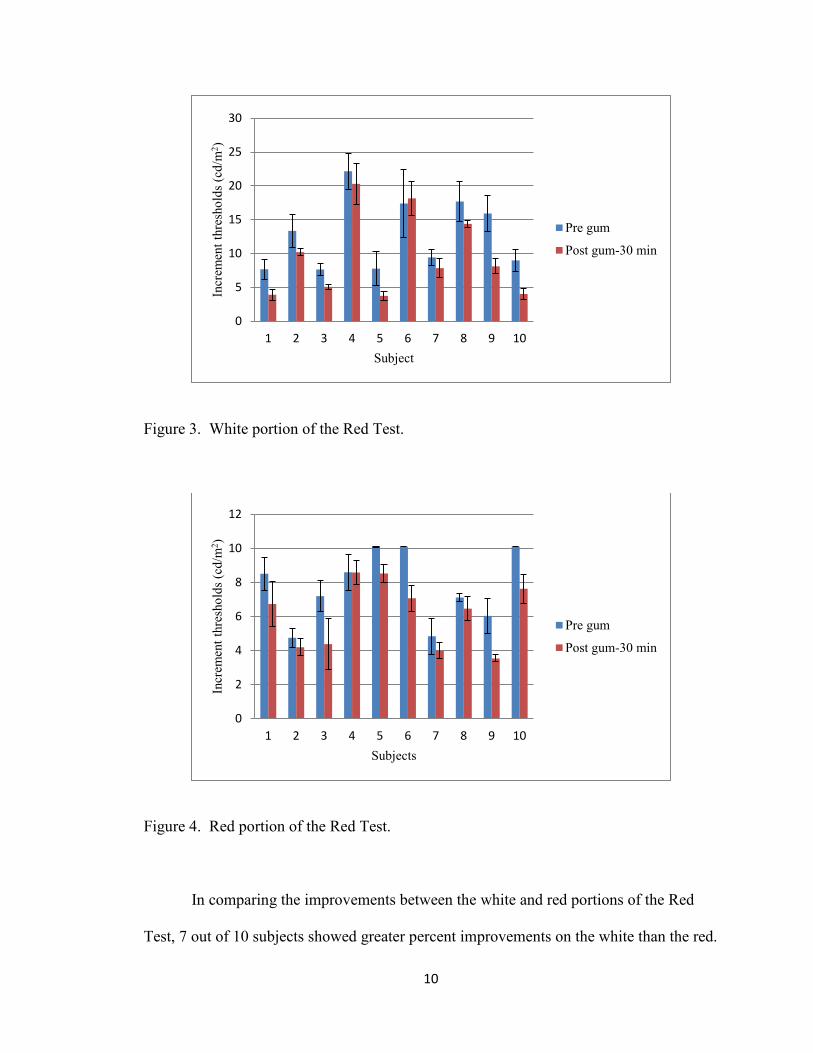
The pre gum and 30 minute post gum threshold values for the Red Test were av-
eraged and compared. In the white portion of the Red Test 9 out of 10 subjects showed
lower (better) thresholds to white light after nicotine use (see Figure 3). All 10 subjects
showed better threshold averages in the red portion (see Figure 4).
0
20
40
60
80
100
120
140
160
180
200
1 2 3 4 5 6 7 8 9 10
To
tal
Err
or
Sco
re (
TE
S)
Subjects
Pre gum
Post gum (30 min)
Age based
average TES
in normals
10
Figure 3. White portion of the Red Test.
Figure 4. Red portion of the Red Test.
In comparing the improvements between the white and red portions of the Red
Test, 7 out of 10 subjects showed greater percent improvements on the white than the red.
0
5
10
15
20
25
30
1 2 3 4 5 6 7 8 9 10
Incr
emen
t th
resh
old
s (c
d/m
2)
Subject
Pre gum
Post gum-30 min
0
2
4
6
8
10
12
1 2 3 4 5 6 7 8 9 10
Incr
emen
t th
resh
old
s (c
d/m
2)
Subjects
Pre gum
Post gum-30 min

11
There was 9% greater improvement in white thresholds; using a Wilcoxon’s signed-rank
test (Bradley, 1968), the differences between the two were not significant with p>.05. In
the white portion, the three protanope subjects had significantly larger percent improve-
ments than the anomalous trichromats (p<.05) with a Wilcoxon’s rank-sum test (Bradley,
1968). In contrast, significantly larger improvements were not seen on the red portion
between the protanopes and anomalous trichromats.
The effect of nicotine, 0 min vs. 30 min, upon both F-M 100 and Red Test scores
was evaluated with Wilcoxon’s signed-rank test (Bradley, 1968). The experiment found
that color deficient individuals reliably improved their sensitivity to white light (p<.005)
and red light (p<.005) after 30 minutes of chewing nicotine gum. On average there was
an improvement on the F-M 100 but this improvement was not significant (p>.05).
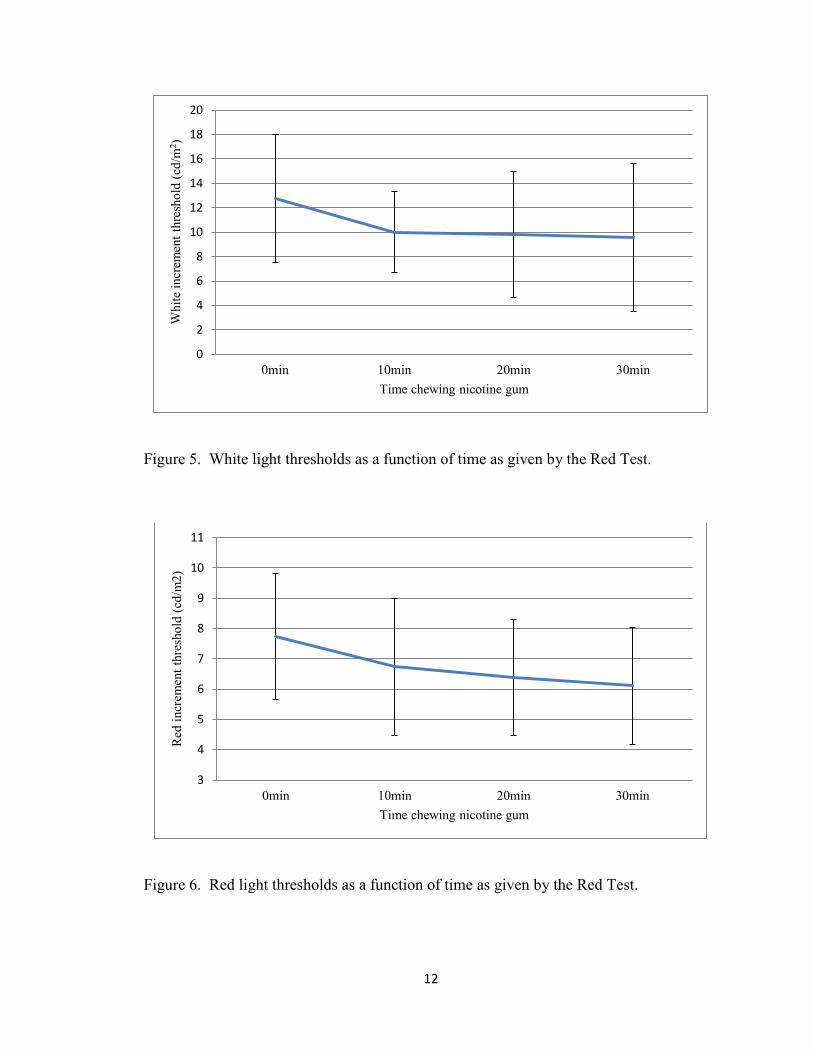
The average thresholds of the Red Test were plotted against the time the nicotine
gum was chewed to visualize the trends of decreasing thresholds. These trends can be
seen in Figure 5 for the white portion and Figure 6 for the red portion. These graphs
show that with both the white and red light, the large majority of improvement in thresh-
old occurs within the first 10 minutes with a continued gradual improvement over the
next 20 minutes. To check the reliability of this observed trend, a Friedman’s multi-
sample test (Bradley, 1968) was performed with data at different times (e.g. 0, 10, 20, 30
min). Both the white and red portions of the Red Test showed reliability with p<.01.
12
Figure 5. White light thresholds as a function of time as given by the Red Test.
Figure 6. Red light thresholds as a function of time as given by the Red Test.
0
2
4
6
8
10
12
14
16
18
20
0min 10min 20min 30min
Whit
e in
crem
ent
thre
sho
ld (
cd/m
2)
Time chewing nicotine gum
3
4
5
6
7
8
9
10
11
0min 10min 20min 30min
Red
incr
emen
t th
resh
old
(cd
/m2
)
Time chewing nicotine gum
13
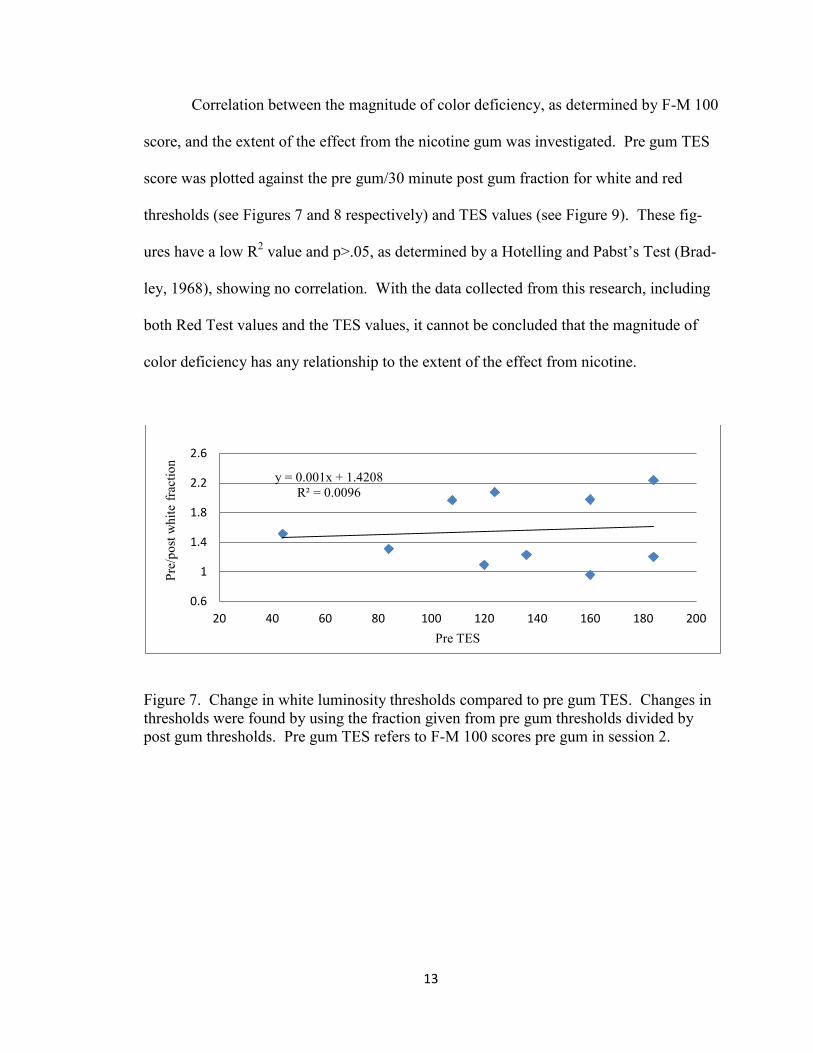
Correlation between the magnitude of color deficiency, as determined by F-M 100
score, and the extent of the effect from the nicotine gum was investigated. Pre gum TES
score was plotted against the pre gum/30 minute post gum fraction for white and red
thresholds (see Figures 7 and 8 respectively) and TES values (see Figure 9). These fig-
ures have a low R2 value and p>.05, as determined by a Hotelling and Pabst’s Test (Brad-
ley, 1968), showing no correlation. With the data collected from this research, including
both Red Test values and the TES values, it cannot be concluded that the magnitude of
color deficiency has any relationship to the extent of the effect from nicotine.
Figure 7. Change in white luminosity thresholds compared to pre gum TES. Changes in
thresholds were found by using the fraction given from pre gum thresholds divided by
post gum thresholds. Pre gum TES refers to F-M 100 scores pre gum in session 2.
y = 0.001x + 1.4208
R² = 0.0096
0.6
1
1.4
1.8
2.2
2.6
20 40 60 80 100 120 140 160 180 200
Pre
/po
st w
hit
e fr
acti
on
Pre TES

14
Figure 8. Change in red luminosity thresholds compared to pre gum TES. Changes in
thresholds were found by using the fraction given from pre gum thresholds divided by
post gum thresholds. Pre gum TES refers to F-M 100 scores pre gum in session 2.
Figure 9. Change in TES compared to pre gum TES. Change in TES were found by us-
ing the fraction given from pre gum TES divided by post gum TES. Pre gum TES refers
to F-M 100 scores pre gum in session 2.
Age of subject was also considered in explaining the extent of the nicotine effect.
Age was plotted against the pre gum/30 minute post gum fraction for white and red
threshold (see Figures 10 and 11 respectively) and TES values (see Figure 12). These
y = -0.0016x + 1.5152
R² = 0.0989
1
1.2
1.4
1.6
1.8
20 40 60 80 100 120 140 160 180 200
Pre
/po
st r
ed f
ract
ion
Pre TES
y = 0.0018x + 0.9123
R² = 0.0686
0.6
0.8
1
1.2
1.4
1.6
1.8
20 40 60 80 100 120 140 160 180 200
Pre
/po
st T
ES
fra
ctio
n
Pre TES

15
figures have a low R2 value and p>.05, as determined by a Hotelling and Pabst’s Test
(Bradley, 1968), showing age and the varying effects of nicotine are uncorrelated.
Figure 10. Change in white luminosity thresholds as a function of age.
Figure 11. Change in red luminosity thresholds as a function of age.
y = -0.0031x + 1.6608
R² = 0.0088
0.5
1
1.5
2
2.5
20 25 30 35 40 45 50 55 60
Pre
/po
st w
hit
e fr
acti
on
Age
y = 0.0064x + 1.0804
R² = 0.152
0.8
1
1.2
1.4
1.6
1.8
20 25 30 35 40 45 50 55 60
Pre
/po
st r
ed f
ract
ion
Age

16
Figure 12. Change in TES as a function of age.
Farnsworth (1957) and Naser et al. (2011) showed that there is a practice effect
with the F-M 100. This research showed a 12% improvement between the session 1 and
session 2 pre-gum F-M 100 scores (see Figure 13). A Wilcoxon’s signed-rank test (Brad-
ley, 1968) showed this small effect was not statistically reliable with p>.05.
Figure 13. F-M 100 practice effect.
y = 0.0024x + 1.0583
R² = 0.0128
0.6
0.8
1
1.2
1.4
1.6
1.8
20 25 30 35 40 45 50 55 60
Pre
/po
st T
ES
fra
ctio
n
Age
0
20
40
60
80
100
120
140
160
180
200
session 1 session 2 pre
Mea
n T
ES

17
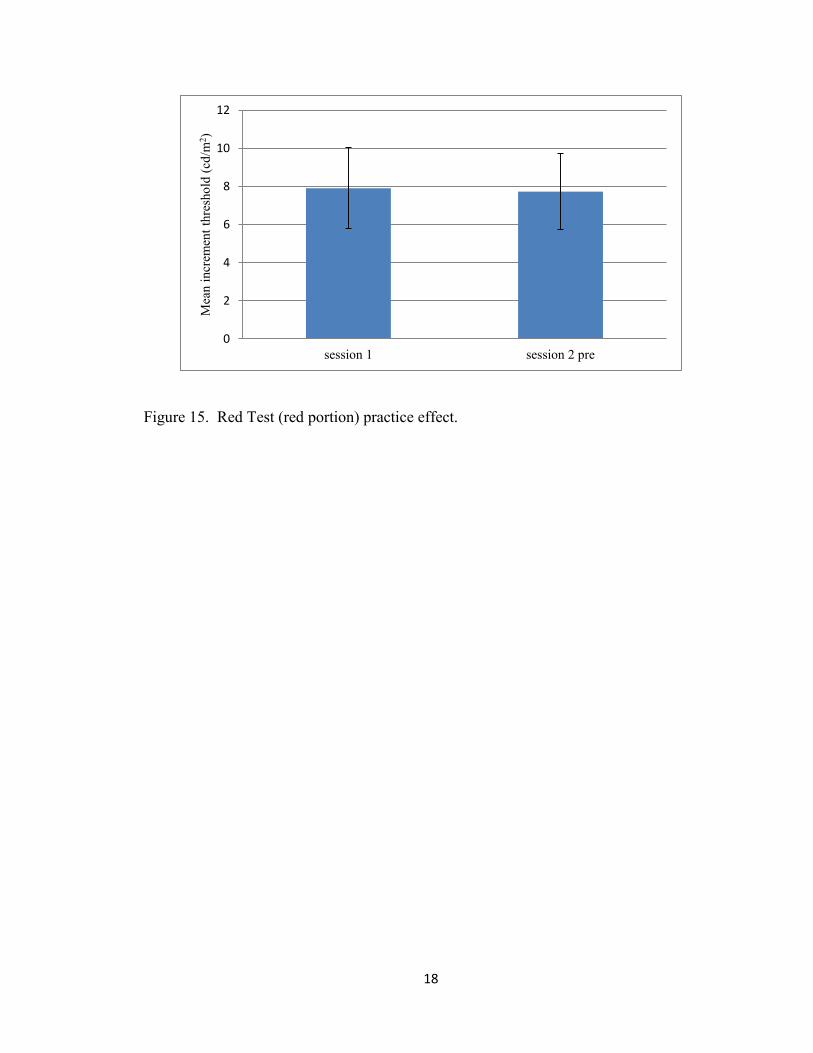
A practice effect for the Red Test showed mixed results. The white thresholds
worsened 0.5% while the red thresholds improved by 2% between the first and second
sessions (see Figures 14 and 15 respectively). A Wilcoxon’s signed-rank test showed
both effects were not statistically reliable with p>.05.
Figure 14. Red Test (white portion) practice effect.
0
2
4
6
8
10
12
14
16
18
20
session 1 session 2 pre
Mea
n i
ncr
emen
t th
resh
old
(cd
/m2)
18
Figure 15. Red Test (red portion) practice effect.
0
2
4
6
8
10
12
session 1 session 2 pre
Mea
n i
ncr
emen
t th
resh
old
(cd
/m2)

19
DISCUSSION
Naser et al (2011) found that in color-normal humans, four mg of nicotine gum
significantly improved TES on the F-M 100 and improved both white and red light
thresholds on the Red Test. We performed a similar experiment to test if the same results
would be seen in those that need more help. In total, 10 color deficient subjects were re-
cruited ranging in type including: 6 deuteranomalous, 1 protanomalous, and 3 protanopes.
F-M 100
Our outcome differs from that seen in Naser et al (2011). Statistical analysis
showed that our outcome on the F-M 100 was not significant, in comparison with Naser
et al (2011), where it showed color-normal individuals significantly improved their TES
after 30 minutes of chewing nicotine gum. Our results were mixed with 7 out of 10 sub-
jects improving their TES. Further investigation showed little explanation as to the vary-
ing effects of nicotine on the F-M 100 scores. We thought it was possible that the effect
of the gum would vary depending on the age of the subject, but this was not the case (see
Figure 12). We also investigated if the effect varied depending directly with the subject’s
baseline color discrimination as scored on the F-M 100. This also proved not to be the
case (see Figure 9).
When comparing the subjects TES to the age based average TES, as determined
by Kinnear et al. (2002), it is counterintuitive that subject three had a TES below the av-
20
erage score for color-normal individuals at the same age. Interestingly enough, as noted
by Farnsworth (1957), some color defectives show better color discrimination than nor-
mals. The F-M 100 scores by subject three underscores that the F-M 100 test is a test of
color discrimination and is not designed to test for color defectiveness, although it is used
to indicate a type of color deficiency, which, in general, goes along with an abnormally
high TES.
Red Test – White Light
In agreement with research done by Naser et al. (2011), our study also showed
that four mg of nicotine significantly improved the threshold for white light. It is inter-
esting to note that the three protanopes had the greatest percentage improvements in
white light thresholds (p<.05). It is also interesting that these protanopes had 3 of the 4
best white thresholds for the pre-gum reading and the 3 best 30 minute post-gum white
readings. It is difficult to conclude if this effect was due to their dichromatic state or if
it’s due specifically to their loss of red receptors (i.e. protanopia) because no data was
collected from deuteranopes. Further research that includes subjects from each of the
four subtypes of red-green color deficiency is needed to be able to make any conclusions
about this effect.
Even with 1 of the 10 subjects showing a minor increase in white light thresholds,
the average percentage decrease in thresholds were 9% greater for the white light than the
red but did not show reliability (p>.05). This differs from results found by Naser et al.
(2011) with color-normal individuals, who noted threshold detection improved signifi-
cantly more with the red stimulus than the white.
21
Red Test – Red Light
All subjects decreased their red light thresholds after four mg nicotine gum use.
These decreases were significant, much like those found in Naser et al. (2011) for color-
normals. It is known that colored light is detected at lower thresholds than white light by
normals (King-Smith, 1975). Data from each of our subjects showed better red sensitivi-
ty than white except for the protanope subjects, which had a greater sensitivity to white
light than red. This may also be the case for protanomalous individuals but we were una-
ble to collect sufficient data from this pool of color deficient subjects to make any con-
clusions.
Explanations
Nicotinic acetylcholine receptors are found throughout the nervous system includ-
ing multiple areas that process visual stimuli. A possible general explanation as to the
effect of nicotine on color perception is its effect at any one or several of these locations.
In both color normal and color defectives, nicotine affects both the color (wave-
length opponent) and luminance (non-wavelength opponent) systems. The Red Test in-
tentionally uses a light wavelength that accentuates sensitivity differences between these
two systems in both color-defectives and color normal individuals. Naser et al. (2011)
chose the Red Test for this reason in an attempt to monitor nicotine’s effect on one sys-
tem in relative isolation from the other. In keeping with the procedure performed by
Naser et al. (2011) we also used the Red Test, but it is important to note that those large
differences between the wavelength opponent and non-wavelength opponent systems can
be greatly reduced in those with a red-green color deficiency (Schwartz,1994).

22
Naser at al. (2011) found that threshold detection improved more for the red stim-
ulus than the white. They speculated that the wavelength opponent process was more
sensitive to the nicotine than the non-wavelength opponent process due to its greater ef-
fect on the red light. In our experiment, we found that there was no reliable difference
between the effects of nicotine on the white and red increments of the Red Test; 30.2%
improvement for white and 21.6% for red. One difference between our experiment and
that done by Naser et al. (2011) is that the chromaticity coordinates of the white back-
ground was somewhat different; x=0.289, y=0.277 vs. x=0.301, y=0.338 respectively.
It is interesting to find that color-deficient individuals gained greater sensitivity to
both white and red light but failed to show reliable improvement on the F-M 100 test. De
Valois et al. (1977) proposed that the saturation of a color is determined by response
magnitude differences between the wavelength opponent and non-wavelength opponent
systems. We speculate that since both systems were improved by equivalent amounts in
color deficient individuals, the saturation of color remained constant and the color-
deficient gained no advantage when performing the F-M 100 test. In comparison with
Naser et al. (2011), threshold for red improved reliably more than threshold for white in
color normal individuals, possibly creating a greater saturation of color and an advantage
on the F-M 100 test. Therefore, in color defectives, chewing nicotine gum is not a reliable
treatment in improvement color discrimination in the color deficient individuals, despite
the fact it improves sensitivity to both red and white increments.
We provide two possible explanations as to how the wavelength opponent and
non-wavelength opponent system became more sensitive by equal amounts. First, it is
possible that while both systems increased in sensitive, the color processing pathway re-

23
mained more sensitive than the luminance pathway in a proportion similar to pre- nico-
tine gum values. Second, it’s possible that the color-deficient individual’s luminance sys-
tem has greater sensitivity than the color processing system (this is reversed compared to
the color-normal individual) and both systems equally increase in sensitivity with the lu-
minance system remaining most sensitive. This possibility is compatible with the fact
that color-deficient people, compared to color normal, are insensitive to both middle and
long wavelength increments (Schwartz, 1994). At the intensities these color-deficient
people do detect, unlike color normal, they may not see the middle and long wavelength
increments as colored (Loop et al, 2003).

24
LIST OF REFERENCES
Benowitz NL. Clinical pharmacology of nicotine. Annu Rev Med. 1986; 37:21-32.
Benowitz NL. Pharmacology of nicotine: addiction and therapeutics. Annu Rev Phar-
macol Toxicol. 1996; 36:597-613.
Benowitz NL, Porchet H, Sheiner L, Jacob P. Nicotine absorption and cardiovascular ef-
fects with smokeless tobacco use: Comparison with cigarettes and nicotine gum.
Clin Pharmacol Ther. 1988; 44(1):23-8.
Bimler D, Kirkland J. Multidimensional scaling of D15 caps: color-vision among tobacco
smokers? Vis Neurosci. 2004; 21(3):445-8.
Bradley JV. Distribution-free Statistical Tests. Englewood Cliffs, NJ: Prentice-Hall,
1968.
Breton ME, Fletcher DE, Krupin T. Influence of serial practice on Farnsworth-Munsell
100-hue scores: the learning effect. Appl Opt. 1988; 27(6):1038-44.
De Valois RL, Abramov I, Jacobs GH. Analysis of Response Patterns of LGN Cells. J
Opt Soc Amer. 1996; 56(7):966-77.
Erb C, Nicaeus T, Adler M, Isensee J, Zrenner E, Thiel HJ. Colour vision disturbances in
chronic smokers. Graefes Arch Clin Exp Ophthalmol. 1999; 237(5):377-80.
Farnsworth D. The Farnsworth-Munsell 100-Hue and Dichotomous Test for Color Vi-
sion. J Opt Soc Amer. 1943; 33:568-578.
Farnsworth, D. The Farnsworth-Munsell 100-hue test for the examination of color dis-
crimination: Manual; Munsel Color: Macbeth, Division of Kollmorgen Instru-
ments Corp. 1957.
Gotti C, Maretti M, Zanardi A, Gaimarri A, Champtiaux N, Changeux JP, et al. Hetero-
geneity and selective targeting of neuronal nicotinic acetylcholine receptor (nA-
ChR) subtypes expressed on retinal afferents of the superior colliculus and later
geniculate nucleus: identification of a new native nAChR subtype al-
pha3beta2(alpha5 or beta3) enriched in retinocollicular afferents. Mol Pharmacol.
2005; 68(4):1162-71.
25
Hardy KJ, Craven B, Foster DH, Scarpello JHB. Extent and duration of practice effects
on performance with the Farnsworth-Munsell 100-Hue test. Ophthal Physiol Opt.
1994; 14:306-309.
King-Smith PE. Visual detection analysed in terms of luminance and chromatic signals.
Nature. 1975; 255:69-70.
Kinnear PR, Sahraie A. New Farnsworth-Munsell 100 hue test norms of normal observ-
ers for each year of age 5-22 and for age decades 30-70. Br J Ophthalmol. 2002;
86:1408-11.
Liu J, McGlinn AM, Fernandes A, Milam AH, Strang CE, Margot AE, et al. Nicotinic
Acetylcholine Receptor Subunits in Rhesus Monkey Retina. Invest Ophthalmol
Vis Sci. 2009; 50(3):1408-15.
Loop MS, Shows JF, Mangel SC, Kuyk TK. Colour thresholds in dichromats and nor-
mals. Vision Res. 2003; 43:983-92.
Naser NT, Loop MS, Than T, Varghese S, Hatmann EE. Color vision: effects of nicotine
gum in non-smoker. Investigative Ophthalmology and Vision Science, Suppl.
2011; 52:4902
Schröder H, Zilles K, Maelicke A, Hajós F. Immunohisto- and cytochemical localization
of coritcal nicotinic cholinoceptors in rat and man. Brain Res. 1989; 502(2):287-
95.
Schwartz SH. Spectral Sensitivity of Dichromats: Role of Postreceptoral Processes. Vi-
sion Res. 1994; 34(22):2983-990.
Warwick KM, Eysenck HJ. The Effect of Smoking on the CFF Threshold. Life Scienc-
es. 1963; 4:291-225.
York YC, Loop MS. Red light increment threshold as a measure of deficient color vi-
sion. Optom Vis Sci. 2008; 85(2):106-11.

26
APPENDIX
IRB APPROVAL FORM


![· Ë) / Nicotinell Cool Mint 2mg Chewing Gum ('h Ë) / Nicotinell Cool Mint 4mg Chewing Gum N] ' nicotine 2mgÉÿ4mg 1] Gum Base, Calcium Carbonate, Sorbitol Powder, Xylitol Crystals,](https://img.pdfslide.net/doc/110x75/5e52ebe97e2be07548677a77/-nicotinell-cool-mint-2mg-chewing-gum-h-nicotinell-cool-mint-4mg-chewing.jpg)