Embed Size (px)
Citation preview

STUDIES ON ASSESSMENT OF VULNERABILITY TO DROUGHT
ByDr Rakesh Kumar
Scientist F & Head Surface water Hydrology DivisionNATIONAL INSTITUTE OF HYDROLOGY, ROORKEE-247667, INDIA
HYDROLOGIC EXTREMES: Two opposite faces of same coin
FLOODS DROUGHTS
excess water that causes damage
deficit of water that causes scarcity in sustaining usual activities and life
Circumstances when there is

Flood
Low Flow
High Flow
Drought
Day Months Years Time Unit
Truncation Level
Mean or
Median
HYDROLOGIC EVENTS

Drought differs from other natural hazards
• Slow-onset, creeping phenomenon (earlywarning systems, impact assessment,response)
• Absence of universal definition (leads toconfusion and inaction)
• Severity is described through multipleindicators and indices
• Impacts are non-structural and spread overlarge areas
• RESULTS: Slow scientific advancementof drought early-warning, forewarning,vulnerability and preparedness systems

Critical issues in drought mitigation
We are lacking in• Data networks and Data sharing• Early warning system and preparedness• Drought forecasting• Drought monitoring tools• Integrated drought/climate/water supply
monitoring• Impact assessment methodologies• Reactive to proactive response systems

Drought Prone
AridSemiaridSub-humidHumid

Drought vulnerability scenario in India
120 million ha
185 districts in southern and western India
1173 development blocks
28 drought years in India, during 20th Century
Seasonal rainfall deficits cause droughts andoften lead to migration of people and livestock

Occurrence, population affected and damage from droughts in India 1900-2002 (Source: Samra, 2004. Working Paper No 84, IWMI)
Date State, region or district Population Affected (#)
Loss/ Deaths(Rs.)
July 2002 13 states 300 million 41000 millionMay 2001 4 states -- 20 deathsNov. 2000 5 districts in Chattisgarh -- --April 2000 6 states 90 million 26500 millionMarch 1996 Rajasthan - -March 1993 8 states 1.2 million --July 1987 Orissa -- 110 deaths1987 6 States + 4 UT 300 million 300 deathsApril/1983 3 states 100 million --1973 Central India 100 million 2500 million1972 Central India 100 million 2500 millionAug. 1964 Mysore 166 million --1964 Rajasthan, Central India 0.5 million --1942 Kolkata, Bengal region - 15 lakh deaths1900 Bengal - 13 lakh deaths

Drought management scenario in India
Rainfall Monitoring
Estimation of Losses
Crop Weather Watch Group
1. IMD2. Revenue Department
Revenue Tahsil, mandal, district District collector monitors
the district
Drought watch at state levelState Relief Commissioner
MoA, Govt. of IndiaIMD, CWC, ICAR, MoP, Ec & St.
and others
Declaration
Verification by Central Team Relief & Rehabilitation
Responsibility of State Govt.

Response to Drought in India
• Efforts have been largely on recoveryfrom drought rather than proactivemitigation
• Strategies may be characterized asad hoc, short-term and superficial:knee-Jerk reaction
• Response is too little, too late
RISK OF DROUGHTDrought risk involves two major components
( Physiographic & social factors)(natural event)
Climatology Population growth and shiftsUrbanizationTechnologySoils and land use practicesEnvironmental degradationWater use trendsGovernment policiesAwareness

OBJECTIVES
• Strengthening R & D• Identify and characterize the drought indicative
parameters -- meteorology, hydrology,agriculture and social in realizing drought andpreparedness
• Prepare drought vulnerability scenario underdifferent conditions at macro and micro levels(watershed or district / mandal / villages)
• Capacity building in understanding / realizingthe preparedness and vulnerability

INPUT DATA• Temporal satellite images of IRS, NOAA &
INSAT• Long term precipitation data (50-100 years)• Stream flow data• Ground water levels• Cropping system, crop coverage area, yield,
and soil characteristics • Human and cattle population and other water
demanding activities, etc.

APPROACH • Indicators of onset of drought
– Prevalent (meteorological, hydrological, agricultural and social) conditions
– Reported / experienced drought events
• Analysis and identification of pattern and critical parameters
• Monitoring of present day conditions• Evaluation of threshold of critical parameters• Deriving a drought susceptibility map and ground
reality• Assessing runoff storages and possibilities of
enhancing runoff conservation• Preparing geographically referenced systems for
regional information base

Plan of Work
TimeSeries
EventEvaluation
StoragePotential
Agril., humanCattle &
Industry, etc
Differentrainfall
scenario
Reservoirpond
spread
Cropped area
vegetation
Rainfall Runoff Demand Assessment
Deficit Computation
SatelliteData
Analysis
Instrumentation Monitoring
Data Collection
Technology Transfer
Characterization of drought susceptibility(Defining various Groups) Threshold for various indicators

Lanth Sub-Basinin Bolangir, Orissa
Sonar Sub-Basinin Damoh/Sagar M.P.
Sarala Sagar Sub-Basinin Mahboobnagar, A.P.
Manar Sub-Basinin Nanded,Maharashtra
Don Sub-Basinin Bijapur, Karnataka
Location of Study Sub-basins in different states

Sl. No.
Name of sub-basin selected
for study
Name of major river system
Geographical location
(Districts/States)
Catchment area
(Sq Km.)
Mean AnnualRainfall (mm)
1 Sonar sub-basin
Ken River (A tributary of
River Yamuna)
Damoh/Sagar districts in
M.P.
6550.0 1186.0(Dry sub-humid)
2 Don sub-basin Krishna River Bijapur in Karnataka and Sangli district
in M.S.
2486.0 643.0(Semi arid)
3 Lanth sub-basin
Tel River (a tributary of
River Mahanadi)
Bolangir in Orissa
1562.0 1443.0(Sub-
humid)4 Manar sub-
basinGodavari Nanded and
Latur districts in
Maharashtra
2423.0 896.0(Dry Sub-
humid)
5 Pedda Vagu up to Sarala Sagar Dam
site
Krishna River Mahaboobnagarin A.P.
1225.0 674.0(Semi arid)
Particulars of sub-basins selected for the study
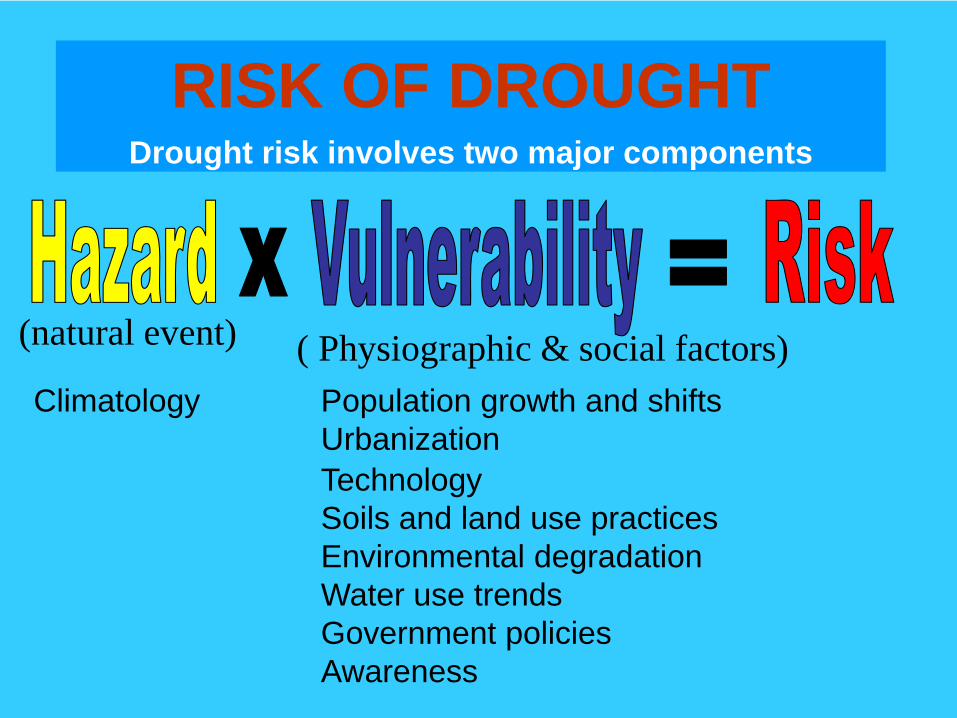
2006 & 2007, Meteorological-DROUGHT PREVAILED
2006 & 2007, Meteorological-DROUGHT PREVAILED
2006 & 2007, Meteorological-DROUGHT PREVAILED
Status of drought at different sites during 2006 & 2007
Sl No.
Name of the site
2006 2007
1 Bijapur Near Normal Near Normal
2 Bolangir Near Normal Near Normal
3 Nanded Near Normal Near Normal
4 Damoh Drought prevailed
Drought prevailed
5 Mahboob-nagar
Drought prevailed
Drought prevailed

EP and Pa variation in IndiaWestern Rajasthan (Very low rainfall)
Pa = 100 - 450 mm Ep = 2000 - 2500 mm
North eastern regionPa = 6400 mm Ep = 1000 -1200
Central IndiaPa = 800- 1550 mm Ep = 1500 - 2000 mm
South India (Low Rainfall)Pa = 450- 700 mm Ep = 1600 - 2000 mm

Relationship of av. Drought Frequency with the Ep/Pa ratio(sub-humid, semi-arid and Arid)
Wet Dry

Relationship-Pae/PET & SPIPlot of Annual Percentage Departures of
Rainfall from mean Vs Pae/PET
y = 3.0048Ln(x) + 0.8755R2 = 0.9841
-2.5-2
-1.5-1
-0.50
0.51
1.52
2.5
0.000 0.200 0.400 0.600 0.800 1.000 1.200 1.400 1.600
Pae/PET
SPI i
ndex
y = 3.5383x - 2.9014R2 = 0.9242
-2-1.5
-1-0.5
00.5
11.5
22.5
0.000 0.200 0.400 0.600 0.800 1.000 1.200 1.400 1.600
Pae/PET
EDI i
ndex
y = 126.38x - 99.995R2 = 0.9882
-100
-50
0
50
100
150
0.000 0.200 0.400 0.600 0.800 1.000 1.200 1.400 1.600 1.800Pae/PET
%D
evia
tion
At Y = -25% deviation ---- Pae/PETratio is 0.6.
Relationship-Pae/PET & % Dev.Plot of Annual %Dep Vs Pae/PET
Where X is Pae/PET and Y is SPIat X=0.6, the value of SPI = -0.66.However, in original SPI classification, SPI upto -0.99 represents normal condition.
Relationship-Pae/PET & EDI Plot of Annual EDI Values Vs Pae/PET
At X = 0.6, the EDI i.e. Y= -0.75, close tothe original classification value of EDIWhere, X is Pae/PET, and Y is EDI
Revised Index value w.r.t. IMD criteria
X=Pae/PET
aY=% Rainfalldeviation
bY= SPIindex
cY= EDI index
DroughtType
0.60 to 0.50 -24% to-37%
-0.66 to-1.20
-0.75 to–1.11
Mild
0.50 to 0.40 -37% to-43%
-1.20 to1.87
- -1.11 to–1.47
Moderate
0.40 to 0.35 -43% to-59%
-1.87 to2.28
- -1.47 to–1.65
Severe
Below 0.35 -60% andbelow
-2.28 andbelow
Below -1.65 Extreme

Comparison of Drought Indices Revised Index value w.r.t. IMD criteria
X=Pae/PET
aY=% Rainfalldeviation
bY= SPIindex
cY= EDIindex
DroughtType
0.60 to 0.50 -24% to -37% -0.66 to -1.20 -0.75 to –1.11 Mild
0.50 to 0.40 -37% to -43% -1.20 to -1.87 -1.11 to –1.47 Moderate
0.40 to 0.35 -43% to -59% -1.87 to -2.28 -1.47 to –1.65 Severe
Below 0.35 -60% and below -2.28 and below Below -1.65 Extreme
Original Classification of SPI & EDI S.N. SPI-index value Classification of
Drought EDI-index value Classification of
Drought
1 -0.99 to 0.99 Near normal -0.7 to - 0.99 Mild drought
2 -1.0 to -1.49 Moderate -1 to -1.49 Moderate
3 -1.5 to -1.99 Severe -1.5 to -1.99 Severe
4 -2.0 or less Extreme - 2 or less Extreme

ASSESSING VULNERABILITY TO DROUGHT1. Static factor of vulnerability (Physiographic factors: w.r.t. space )
• Topographic factors (General Slope and drainage etc.) • Soil (Soil water holding capacity)• climatic components (Precipitation & ET),
2. Semi-static factors of vulnerability (w.r.t. space and long-term temporal variability)
• Irrigation support • Status of surface water storage availability• Status Ground water availability• Population density (Population concentration, industrial/ commercial activities)• Land use• Regional cropping system• Region-specific activities (like cattle farming/wildlife preservation etc)
3. Variable factors of vulnerability (w.r.t. space and time)• Rainfall (monthly/seasonal/annual)• Stream flow• Storages (if any)_______________________________________________________________________
--- Classification and spatial representation of drought vulnerability usinggeographic processing techniques
--- Evaluation of weight of the factors that contribute to drought risk / vulnerability.

Assessing vulnerability to Drought (Weighing Scheme)
Vulnerability factor Vulnerability Drought Vulnerability class’s score (weight)
Reach location LowerMiddleUpper
234
Probabilities of seasonal crop moisture deficiency(%)
Less than 30 (low)30-50 (Moderate)50-70 (high)More than 70 (very high)
2345
Soil root zone water holding capacity (mm)
More than 200150-200100-150Less than 100 (low)
1234
Land use types ForestlandGrasslandCropland/habitationWater bodies/swamp/wetland
025-20
Irrigation Support (canal) Complete irrigationTank/Lift irrigationUnirrigated
-20 35
Population concentration Less than averageNear averageMore than average
245
Status of Groundwater SafeSemi criticalCriticalOver exploitation
0245
Status of surface water storages in tanks, lakes etc.w.r.t. domestic/cattle and other drinking water demand
DeficitModerately deficitSurplus
234

Integrated drought vulnerability Index (DVI) (Proposed)
DVI = Drought Vulnerability IndexN = Number of indicators under considerationwi = Weights of drought vulnerability indicators , (where, i= 1,2,……N)k = Upper limit of vulnerability weights (Say, range = 0-k , where, k is highest value of Wi )
kNDVI wi∑=
Sl. No Values of DVI Vulnerability Class
1 0 - 0.2 Least vulnerable
2 0.2 – 0.4 Mild vulnerable
3 0.4 – 0.6 Moderately vulnerable
4 0.6 – 0.8 severely vulnerable
5 >0.8 Critically vulnerable
Classification of DVI

Integration of physiographic factors
Integration
Grid Size---100 m x 100m

Integration with rainfall departure
+

Integrated vulnerability to drought (October-2007)
4.58304.640Critical
67.894516.48
0Severe
26.761779.88
0Moderate
0.7851.590Least
% AreaArea(k
m2)Vulnerability
Class
4.58304.640Critical
67.894516.48
0Severe
26.761779.88
0Moderate
0.7851.590Least
% AreaArea(k
m2)Vulnerability
Class
Feb. 200

Nodal Unit(Decision Making)
Scientific Community Stake Holders Water Managers
(site units)
Drought Partnership
Data- historical- real time (monitoring)
Tools-forecasting-predictions
Drought Watch System
Drought Management
Components of Integrated Drought Management System (Proposed)

Drought PartnershipsPurpose: to improve the coordination of drought related activities in India.
• Partnership would act as a platform to initiate and discuss scientific inputs with multidisciplinary experts and it would insure exchange of information.
• Develop regional real time monitoring system to identify progression and critical areas vulnerable to drought. based on precipitation, river flows and groundwater data
• Identify gaps in knowledge and coordinate research activities.• Develop analytical tools for estimating drought severity, extent and
frequency.• Support harmonization of methods for drought analysis.• Share experiences in drought planning and management.• Establish best practice guidelines for drought monitoring, forecasting,
prediction and mitigation to support operational drought management.• Improve mobility of operational and research staff.• Develop links with international programmes and national drought
activities inside & outside India .• To carry out specific research projects, e.g. estimation event frequency
from non-stationary data, impact or climate change on drought and medium-range drought forecasting.
• Develop and implement training activities.• Communicate with stakeholders and the public

Summary of Project activities• Field investigations, historical data/ information collection, processing
and analysis etc. of hydro-meteorological data.
• Analysis of occurrence of dry spells, seasonal, and annual rainfalldeparture
• Application of Departure analysis, SPI, EDI and Decile Index for monthly,seasonal and annual time scale.
• Establishing of revised Index values for SPI and EDI in reference to ourfield conditions.
• Interim report- prepared & submitted
• Remote Sensing and GIS data processing, analysis and NDVI estimation.
• Formulation of vulnerability assessment criteria using combinations ofstatic (physical) and variable factor.
• Proposed an index for integrated assessment of vulnerability to drought
• Formulating guidelines to facilitate development of droughtearly warning systems, preparedness plans for vulnerabilityreduction and Mitigation
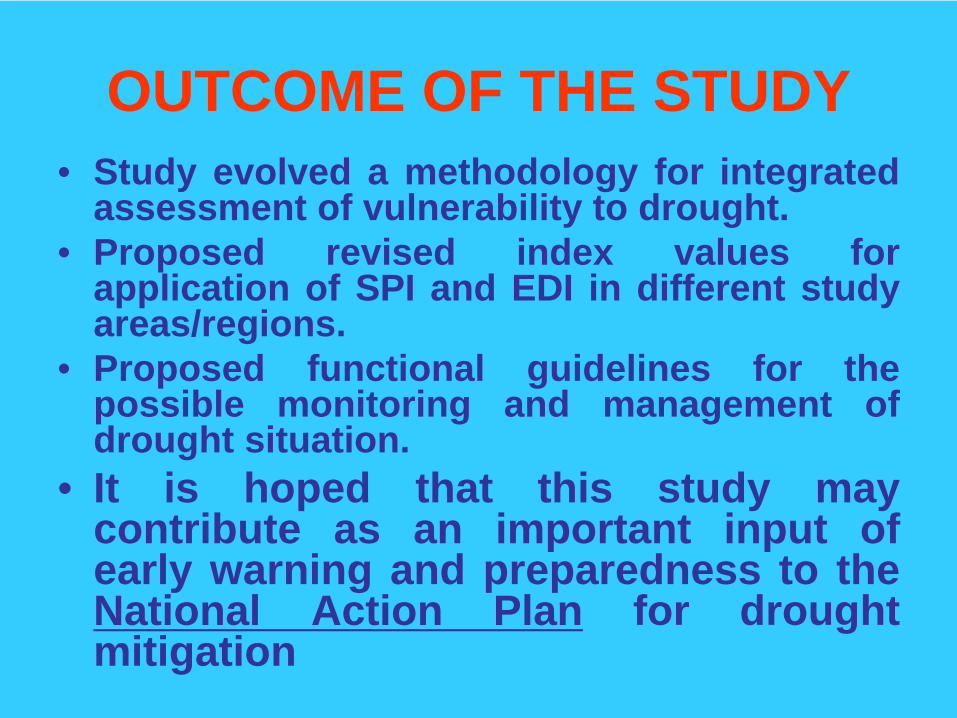
OUTCOME OF THE STUDY• Study evolved a methodology for integrated
assessment of vulnerability to drought.• Proposed revised index values for
application of SPI and EDI in different studyareas/regions.
• Proposed functional guidelines for thepossible monitoring and management ofdrought situation.
• It is hoped that this study maycontribute as an important input ofearly warning and preparedness to theNational Action Plan for droughtmitigation

Thank You