Embed Size (px)
Citation preview
STUDIES ON DEVELOPMENT AND
CHARACTERIZATION OF POLYPROPYLENE BASED BIOCOMPOSITES
A THESIS
Submitted by
N.JAYA CHITRA
Under the guidance of
Dr. R.VASANTHAKUMARI
In partial fulfillment for the award of the degree of
DOCTOR OF PHILOSOPHY In
POLYMER TECHNOLOGY
B.S.ABDUR RAHMAN UNIVERSITY (B.S. ABDUR RAHMAN INSTITUTE OF SCIENCE & TECHNOLOGY)
(Estd. u/s 3 of the UGC Act. 1956) www.bsauniv.ac.in
March 2015
ii
BONAFIDE CERTIFICATE
Certified that this thesis report STUDIES ON DEVELOPMENT AND
CHARACTERIZATIONOF POLYPROPYLENE BASED BIOCOMPOSITES
is the bonafide work of Mrs.N.Jaya Chitra (RRN: 0982202) who carried out
the thesis under my supervision. Certified further, that to the best of my
knowledge the work reported herein does not form part of any other thesis
report or dissertation on the basis of which a degree or award was conferred
on an earlier occasion on this or any other candidate.
SIGNATURE Dr.R.VASANTHAKUMARI SUPERVISOR Head, Polymer Nanotechnology Centre B.S.Abdur Rahman University Vandalur, Chennai-600 048
SIGNATURE Dr.S.S.M.ABDUL MAJEED
HEAD OF THE DEPARTMENT Professor & Head
Department of Polymer Engineering B.S.Abdur Rahman University
Vandalur, Chennai-600 048
iii
ACKNOWLEDGEMENT
First and foremost I would like to thank God Almighty for blessing me
with such a great opportunity to do this research.
I sincerely express my gratitude to Mr.Alhaj Abdul Qadir A.Rahman Buhari, Chairman, Board of management, Dr.J.A.K. Tareen, Vice
Chancellor, Dr.V.M.Periasamy, Pro-Vice Chancellor and Dr.V.Murugesan, Registrar, B.S.Abdur Rahman University providing an
opportunity to carry out my research work.
I extend deep sense of gratitude to my Research Supervisor
Dr.R.Vasanthakumari, Head, Polymer Nano Technology Centre, for
valuable guidance and support throughout the research. Her vision and
encouragement motivated me to work and achieve goals.
I express my sincere thanks to Dr.S.S.M.Abdul Majeed, Head,
Department of Polymer Engineering for suggesting the area of research and
also rendering his immense support and valuable guidance for completing
the research work.
I wish to express remarkable gratitude and indebtedness to
Dr.M.Alagar, Professor of Chemistry, Department of Chemical Engineering,
Anna University, for his guidance and parental care during my research
writing.
I record my sincere thanks to my doctoral committee member
Dr.Y.Lakshminarayana, Professor(Rtd), CLRI, Dr.Syed Amanulla,
Technical Officer, CIPET Chennai, Dr.D.Eswaramoorthy, Professor,
department of chemistry, for their valuable suggestions.
iv
I extend my heartiest gratitude to Dr.A.U.Santhos Kumar, Senior
Research Fellow, CIPET, Chennai for his continuous support during the
research. I sincerely thank Dr.A.K. Mohanthy, CIPET, Bhuvaneswar,
Orissa for permitting to do a part of my research work in LARPM and also to
Reliance Industries and Dove(Bhimrajka) Chemicals for providing the
polymer materials required to carry the research.
I express my thanks to Mrs.R.Gayathri, Scientific Assistant for her
help and valuable support during the course of research. Further I would also
like to thank all the faculty members, research scholars and non-teaching
staff members for their support and encouragement.
My deepest gratitude and thanks to my husband Mr.L.Karun Kumar
for helping, supporting and doing the needful during the course of research
by accompanying me for conferences and sample testing in LARPM. I
extend my thanks to my beloved children L.K.Siddhesh Kumar and
L.K.Shrinidhi for their unlimited patience and immense adjustment
throughout my career.
My heartfelt gratitude to my parents Mr.P.Natarajan, Mrs.N.pushpa an
brother Mr.N.Vijay for their continuous advice, encouragements and support
throughout my education.
N.JAYA CHITRA
v
ABSTRACT
During the recent years, polymeric composite materials are being
used in variety of applications due to their high strength and stiffness, light
weight and high corrosion resistance. Most of products made by companies
are from non-biodegradable fibers, where the problem of disposal arises
after the end use, this raised the attention of people for the use of natural,
sustainable, biodegradable and renewable resources. The use of various
natural reinforcing fibers in thermoplastics with the fibers such as hemp, jute,
flax, sisal, and kapok had gained acceptance in commodity plastics and
applications of these materials during the past decade has been reported in
literature. However, still various fibers and particulate fillers need to be
explored and amongst the thermoplastic materials used, polypropylene is an
outstanding commercially available thermoplastic material with wide range of
applications.
The aim of the present work is to develop polypropylene (PP)
composites, using renewable bioresources. Four different types of
reinforcements were chosen for the present study i.e., corn husk, seaweed,
banana fiber and spent coffee ground. Corn husk and sea weed were used
as such without any modification, whereas banana fiber and spent coffee
grounds were modifies with sodium hydroxide and coupling agent
respectively. Two different grades of new generation coupling agents namely
Amplify GR 216 and Exxelor PO 2010 were used with spent coffee grounds
reinforced polypropylene composites. The prepared composite samples were
characterized with different techniques to ascertain their utility for wide range
of applications.
vi
Incorporation of corn husk and sea weeds (both red and brown)
without any modification into polypropylene matrix leads to decrease in the
tensile strength, but modulus shows a significant increase with increase in
reinforcing filler content. Water absorption increases with increase in the
immersion time. Morphological study using SEM shows poor compatibility
both for corn husk and sea weed/polypropylene composites. Therefore the
developed corn and seaweed based polypropylene composites can be used
for low end applications like boards and household utensils, where strength
is not considered and for high temperature applications where conventional
polypropylene is used.
Mechanical properties of both untreated and treated banana fiber
composites were found to increase with filler content. The impact strength for
untreated banana fiber composites remained high compared to neat
polypropylene; Hardness of neat PP is retained for treated banana fiber
composites, thereby reflecting the resistance of treated fiber to deformation.
Absence of cavities and fiber pull out confirms the interfacial bonding
between the fiber and PP matrix. Therefore, these composites can be used
for high performance application in automotive where conventional
polypropylene is used. Mechanical properties of coffee grounds composites
remained comparable with that of polypropylene, but impact strength was
found to be more pronounced.
An attempt has been made to study the biodegradability of the coffee
and banana composite as per ASTM D5338. The SEM images indicate the
extent of biodegradation for spent coffee grounds/polypropylene after
40days, 60days and 90days. Data obtained from biodegradation study
shows that15%-20% degradation in case of spent coffee grounds/
polypropylene composites and 8%-10% in case of banana fiber/
polypropylene composites. Few bush and novelty components are prepared
by injection moulding from these composites.
vii
TABLE OF CONTENTS
CHAPTER NO. TITLE PAGE NO.
ABSTRACT LIST OF TABLES LIST OF FIGURES LIST OF SYMBOLS AND ABBREVIATIONS
v xiv xvii xxi
1. INTRODUCTION 1
1.1 OVERVIEW OF POLYMER COMPOSITES
1
1.2 CLASSIFICATION OF COMPOSITES 2
1.3 FACTORS AFFECTING PROPERTIES OF POLYMER COMPOSITES
5
1.3.1 Interfacial adhesion 5
1.3.2 Shape and orientation of dispersed phase
5
1.3.3 Properties of Matrix Polymers 6
1.4 POLYPROPYLENE 7
1.5 APPLICATIONS OF POLYMER COMPOSITES
9
1.6 RECENT ADVANCEMETNTS IN POLYMER COMPOSITES
10
1.7 INTERPHASE CHARACTERISATION 14
1.7.1 Micromechanical techniques 14
1.7.2 Spectroscopic Analysis 14
1.7.3 Microscopic techniques 14
1.7.4 Thermodynamic methods 14
1.8 CHALLENGES AND OPPORTUNITIES 15
2. LITERATURE SURVEY 16
2.1 NATURAL FIBERS 16
2.2 CONSTITUENTS OF NATURAL FIBERS 17
viii
CHAPTER NO. TITLE PAGE NO.
2.3 REVIEW OF NATURAL FIBER COMPOSITES
18
2.4 REVIEW OFCOMPATIBILITY IMPROVEMENT STUDIES ON NATURAL FIBER COMPOSITES
22
2.5 REVIEW OF HYGROSCOPICITY OF NATURAL FIBER COMPOSITES
26
2.6 SURVEY ON BIODEGRADATION IN POLYMER COMPOSITES
28
2.7 OUTCOME OF LITERATURE SURVEY 31
2.8 SCOPE AND OBJECTIVES OF THE PRESENT RESEARCH WORK
31
3. EXPERIMENTAL METHODS 35
3.1 MATERIALS, CHEMICALS AND REAGENTS
36
3.1.1 Preparation of biocomposites 36
3.1.2 Biodegradation testing 37
3.2 PREPARATION OF REINFORCING FILLERS
38
3.3 DETERMINATION OF COMPOSITION OF FILLERS
40
3.3.1 Moisture 40
3.3.2 Total ash 41
3.3.3 Fat 41
3.3.4 Crude fiber 41
3.3.5 Protein 42
3.3.6 Carbohydrate 43
3.4 PREPARATION OF BIOFILLER REINFORCED POLYPROPYLENE COMPOSITES
43
3.4.1 Corn husk composites 44
3.4.2 Sea weed composites 45
ix
CHAPTER NO. TITLE PAGE NO.
3.4.2.1Brown sea weed composites
45
3.4.2.2Red sea weed composites
45
3.4.3 Banana fiber composites 46
3.4.4 Spent coffee ground composites 47
3.5 CHARACTERISATION TECHNIQUES 51
3.5.1 Sample Preparation 51
3.5.2 Conditioning 52
3.5.3 Mechanical properties and water absorption
52
3.5.4 Thermal properties 54
3.5.5 Morphological properties 54
3.5.6 Determination of aerobic Biodegradation of plastic materials in soil
55
4. POLYPROPYLENE CORN HUSK BIOCOMPOSITES
59
4.1 INTRODUCTION 59
4.1.1 Composition of corn husk 60
4.1.2 FT-IR spectral studies 61
4.2 MECHANICAL PROPERTIES 63
4.2.1 Tensile properties of P1CH composites 63
4.2.2 Water absorption in P1CH composites
67
4.2.2.1Tensile properties of water absorbed P1CH composites
69
4.3 THERMAL PROPERTIES 70
4.3.1 Thermogravimetric analysis 70
4.3.2 Differential thermal analysis 72
4.4 MORPHOLOGICAL PROPERTIES 73
x
CHAPTER NO. TITLE PAGE NO.
4.4.1 Scanning electron microscopy 73
4.5 SUMMARY 74
5. POLYPROPYLENE SEA WEED BIOCOMPOSITES
76
5.1 INTRODUCTION 76
5.1.1 Composition of sea weed 77
5.1.2 FT-IR spectral studies 77
5.2 MECHANICAL PROPERTIES 79
5.2.1 Tensile properties of P1BSW and P1RSW composites
79
5.2.2 Water Absorption in P1BSW composites
83
5.2.2.1Tensile properties of water absorbed P1BSW Composites
85
5.3 THERMAL PROPERTIES 87
5.3.1 Thermo gravimetric analysis 87
5.3.2 Differential thermal analysis 88
5.4 MORPHOLOGICAL PROPERTIES 89
5.4.1 Scanning electron microscopy 89
5.5 SUMMARY 90
6. POLYPROPYLENE BANANA FIBER BIOCOMPOSITES
91
6.1 INTRODUCTION 91
6.1.1 Composition of banana fiber 92
6.1.2 FT-IR spectral studies 93
6.2 MECHANICAL PROPERTIES 96
6.2.1 Tensile Properties 97
6.2.2 Impact Strength 99
6.2.3 Hardness 100
6.2.4Water Absorption in P1BF composites
101
xi
CHAPTER NO. TITLE PAGE NO.
6.2.4.1 Tensile properties of waterabsorbed P1BFcomposites
103
6.3 THERMAL PROPERTIES 105
6.3.1 Thermogravimetric analysis 105
6.3.2 Differential thermal analysis 106
6.3.3 Differential scanning calorimetry 107
6.4 MORPHOLOGICAL PROPERTIES 109
6.4.1 Scanning electron microscopy 109
6.5 SUMMARY 111
7. POLYPROPYLENE SPENT COFFEE GROUNDSBIOCOMPOSITES
113
7.1 INTRODUCTION 113
7.1.1 Composition of Spent Coffee Grounds
114
7.1.2 FT-IR spectral studies 114
7.2 MECHANICAL PROPERTIES 118
7.2.1 Constant filler composites 118
7.2.1.1 Tensile Properties 121
7.2.1.2 Impact Strength 121
7.2.1.3 Hardness 122
7.2.2 Varying filler composites 124
7.2.2.1 Tensile properties 124
7.2.2.2 Impact Strength 127
7.2.2.3 Hardness 127
7.2.3 Water absorption in P2CG composites
127
7.2.3.1 Tensile properties of water absorbed P2CG composites
129
xii
CHAPTER NO. TITLE PAGE NO.
7.3 THERMAL PROPERTIES 131
7.3.1 Thermogravimetric analysis 131
7.3.2 Differential Scanning Calorimetry 133
7.4 MORPHOLOGICAL PROPERTIES 135
7.4.1 Scanning electron microscopy 135
7.5 SUMMARY 137
8. BIODEGRADATION STUDIES 139
8.1 SCOPE FOR DETERMINING AEROBIC BIODEGRADATION OF PLASTIC MATERIALS IN SOIL– ASTM D5338
139
8.2 MORPHOLOGICAL STUDIES BASED ONAEROBICBIO - DEGRADATION OF COFFEE GROUNDS/ PP COMPOSITES IN SOIL – ASTM D5338
139
8.3 PERCENTAGE OF BIODEGRADTION-ASTM D5338
142
8.4 SUMMARY 144
9. CONCLUSIONS 145
REFERENCES 149
LIST OF PUBLICATIONS 165
TECHNICAL BIOGRAPHY 170
xiii
LIST OF TABLES
Table No. Title Page No.
2.1 Vehicle manufacturers and use of natural fiber composites
20
3.1 Chemical contituents of filler chosen for the present work
40
3.2 Types of PP used for the preparation of natural fillers reinforced polypropylene composites
44
3.3 Composition of polypropylene- corn husk Composites
45
3.4 Composition of polypropylene/ Brown sea weed composites
45
3.5 Composition of polypropylene/ Red sea weed composites
46
3.6 Composition of polypropylene- Untreated Banana fiber composites
47
3.7 Composition of polypropylene- Treated Banana fiber composites
47
3.8 Composition of P1CG composites with varying percentage of MAPP (A)
50
3.9 Composition of P2CG composites with varying percentage of MAPP (A)
50
3.10 Composition of P2CG(A) composites with varying percentage of filler
51
3.11 Composition of P2CG(E) composites with varying percentage of filler
51
4.1 Composition of corn husk 60
4.2 Functional groups and their corresponding spectral frequency of neat corn husk, PP, P1CH composites
62
4.3 Tensile properties of polypropylene and P1CH composites
63
xiv
Table No. Title Page No.
4.4 Water absorption of neat polypropylene and P1CH composites at different time intervals
67
4.5 Tensile properties of dry and water absorbed neat PP and P1CH composites
69
4.6 Decomposition temperature of neat PP and P1CH composites
71
4.7 DTA of PP and P1CH composites 73
5.1 Composition of Brown and Red seaweeds 77
5.2 Functional groups and their corresponding stretching frequencies of neat seaweed, neat PP and P1SW
78
5.3 Tensile properties of P1BSW Composites 79
5.4 Tensile properties of P1RSW Composites 89
5.5 Water absorption of neat PP and P1SW composites at different time intervals
83
5.6 Comparison of tensile properties of polypropylene with dry and water absorbed PP/sea weed composites
85
5.7 Degradation temperatures of polypropylene and polypropylene sea weed composite
87
5.8 DTA of neat PP and P1SW composites 89
6.1 Composition of banana fiber 93
6.2 Functional groups and their corresponding stretching frequencies of neat PP, neat BF and P1BF
94
6.3 Mechanical properties of PP and P1UBF composites
96
6.4 Mechanical properties of PP and P1TBF composites
97
6.5 Water absorption of neat polypropylene and P1BF composites at different time intervals
101
xv
Table No. Title Page No.
6.6 Tensile properties of dry and water absorbed neat PP and P1BF composites
103
6.7 Degradation temperatures of neat BF, TBF, Neat PP and P1BF composites
105
6.8 DSC data for P1BF composites 108
7.1 Composition of spent coffee grounds 114
7.2 Functional groups of neat PP, neat CG and P1CG
116
7.3 Variation of tensile strength for constant filler (20%) and varying MAPP (A) P1CG composites
118
7.4 Variation of tensile strength for constant filler (20%) and varying MAPP (A) P2CG composites
120
7.5 Variation of tensile strength for varying filler (10%, 20%, 30%) and Constant (1%) MAPP (E) composites
124
7.6 Variation of tensile strength for varying filler (10%, 20%, 30%) and Constant (1%) MAPP (A) composites
124
7.7 Water absorption of neat polypropylene and P2CG composites at different time intervals
128
7.8 Tensile properties of dry and water absorbed neat PP and P2CG composites
129
7.9 Comparison of thermal degradation of neat PP, neat CG, homo-polymer P2CG 30% (E), homo-polymer P2CG (A), co-polymer P2CG (A)
132
7.10 DSC data for P2CG composites 133
xvi
LIST OF FIGURES
Figure No. Title Page No. 1.1 Types of Reinforcement 3 1.2 Classification of Natural fiber composites 4 1.3 Schematic model of interphase 5 1.4 Tacticity in polypropylene 8 1.5 Percentage use of natural fibers in automotive
industry 11
1.6 Pathway showing conversion from biomass to building blocks of polymers
13
2.1 Structural representations of Cellulose (A), Hemicellulose (B), Pectin (C) and Lignin (D)
17
2.2 Relative merits of Natural Fiber and Glass Fiber composites
20
2.3 Tentative reaction between Maleic anhydride and Natural rubber during processing
22
2.4 Manufacture of Straw Medium Density Fiber board
25
2.5 Polymeric biodegradation under aerobic and anaerobic condition
28
3.1 Corn husk powder and sea weed powder 38 3.2 Conversion of banana fruit stem to fiber 39 3.3 Treating banana fiber with sodium hydroxide 39 3.4 Converting spent coffee grounds into coffee
cakes and to coffee grounds 40
3.5 Twin screw extruder and extruded strands 43 3.6 Scanning electron microscopy 55 3.7 Aerobic biodegradation of the composites under
laboratory conditions 55
3.8 Determination of aerobic biodegradation of bio-composites under controlled composting condition
56
3.9 Graph showing percentage of biodegradation of the composites
58
xvii
Figure No. Title Page No. 4.1 Corn husk thrown as waste 59 4.2 FTIR spectra of corn husk, PP and P1CH
composites 61
4.3 The effect of filler on the tensile strength of P1CH composites
65
4.4 Effect of filler on the elongation at break of P1CH composites
66
4.5 Effect of filler on the tensile modulus of P1CH composites
67
4.6 Water absorption of neat PP (P1) and P1CH composites
68
4.7 Comparison of tensile strength of dry and water absorbed PP and P1CH composites
69
4.8 Comparison of tensile modulus of dry and water absorbed PP and P1CH composites
70
4.9 TGA curves of PP, P1CH (20%), P1CH (30%) composites
71
4.10 DTA curves of PP, P1CH (20%), P1CH (30%) composites
72
4.11 SEM images of corn husk 73 4.12 SEM images of P1CHcomposites 74 5.1 Brown seaweed and Red seaweed 76 5.2 FTIR spectra of seaweed, PP and P1SW
Composite 78
5.3 Tensile strength of P1BSW and P1RSW composites
81
5.4 Elongation at break of P1BSW and P1RSW composites
82
5.5 Elongation modulus of P1BSW and P1RSW composites
83
5.6 Comparison of water absorption of neat PP and P1BSW composite at different time intervals
84
5.7 Comparison of tensile strength of dry and water absorbed PP and P1BSW composites
86
5.8 Comparison of tensile modulus of dry and water absorbed PP and P1BSW composites
86
5.9 TGA of PP, P1BSW and P1RSW Composites 87
xviii
Figure No. Title Page No. 5.10 DTA of PP, P1BSW, P1RSW composites 88 5.11 SEM micrographs of (a) P1BSW (30%),
(b) P1RSW (30 %) composites 89
6.1 Banana Cultivation in India 91 6.2 FTIR spectra of neat polypropylene, neat BF
and P1BF composites 92
6.3 FTIR spectra of untreated banana fiber composite
95
6.4 FTIR spectra of treated banana fiber composite 96 6.5 Tensile strength of P1BF composites 97 6.6 Tensile modulus of P1BF composites 98 6.7 Impact strength of P1BF composites 99 6.8 Hardness of P1BF composites 101 6.9 Comparison of water absorption of neat
polypropylene and untreated P1UBF composites at different time intervals
102
6.10 Tensile strength of dry and wet P1BF composites
104
6.11 Tensile modulus of dry and wet P1BF composites
104
6.12 Comparison of TGA of neat PP, P1UBF, P1TBF composites
106
6.13 Comparison of DTA of neat PP, P1UBF, P1TBF composites
107
6.14 DSC showing glass transition temperature for P1UBF and P1TBF composites
108
6.15 DSC heating and cooling curve P1UBF and P1TBF composites
109
6.16 SEM images for P1UBF composites 110 6.17 SEM images for P1TBF composites 111 7.1 Coffee cultivation in south India 113 7.2 FTIR spectra of Neat PP, Neat CG and P1CG
composite 115
7.3 P1CG composite with MAPP (E) coupling agent 115 7.4 P1CG composite with MAPP(A) coupling agent 115
xix
Figure No. Title Page No. 7.5 Tensile strength of P1CG and P2CG
composites with varying % of MAPP (A) coupling agent.
119
7.6 Tensile modulus of P1CG and P2CG composites with varying % of MAPP (A) coupling agent
120
7.7 Impact strength of P1CG and P2CG composites with varying % of MAPP (A) coupling agent
122
7.8 Hardness of P1CG and P2CG composites with varying % of MAPP (A) coupling agent
123
7.9 Variation of tensile strength for coupling agent Exxelor and Amplify in P2CG composites
125
7.10 Variation of tensile modulus for coupling agent Exxelor and Amplify in polypropylene coffee grounds composites with varying filler percentage
126
7.11 Comparison of water absorption of neat polypropylene and untreated P2CG composites at different time intervals
128
7.12 Tensile strength of dry and wet P2CG composites
130
7.13 Tensile Modulus of dry and wet P2CG composites
130
7.14 TGA of coffee grounds composites 131 7.15 DTA of coffee grounds composites 132 7.16 DSC showing Tg for P2CG (A) and P2CG(E)
composites 134
7.17 DSC heating and cooling curve 134 7.18 SEM imageof polypropylene coffee grounds
composites a) P2CG 20 (A0), b) P2CG 20 (A1), c) P2CG 20 (E0) and d ) P2CG20 (E1)
136
8.1 SEM images of coffee grounds 140 8.2 SEM image of P1CG Composite (10%) 140 8.3 SEM image of biodegraded P1CG (10%)(40
days) 141
8.4 SEM image of biodegraded P1CG (10%) (60 days)
141
xx
Figure No. Title Page No. 8.5 SEM image of biodegraded P1CG (10%) (90
days) 142
8.6 The percentage of biodegradation of P1CG composite
143
8.7 The percentage of biodegradation of P1BF composite
143
8.8 FT-IR spectra of spent coffee ground composite before biodegradation
144
8.9 FT-IR spectra of spent coffee ground composite after biodegradation
144
9.1 Moulded banana fiber composites and spent coffee ground composites
147
LIST OF SCHEMES
Scheme No. Title Page No.
Scheme 1 Coupling mechanism of natural fiber/ Maleated PP composites
48
xxi
LIST OF SYMBOLS AND ABBREVIATIONS
SYMBOLS
°C - degree centigrade
g - gram
J - joule
K - kelvin
L - load at break
mg - milligram
ml - millilitre
MPa - mega pascal
T - temperature
Tg - glass transition temperature
Tf - crystallization temperature
Tm - melting temperature
Tan - loss tangent
µm - micro meter
P - difference in load
- density
xxii
ABBREVIATIONS
ASTM - American Society for Testing Materials
A - Amplify GR 216
AFM - Atomic force microscopy
BF - Banana fiber
BSW - Brown sea weed
CS - Corn starch
CH - Corn Husk
DTA - Differential Thermal Analysis
DSC - Differential Scanning Calorimetry
E - Exxelor Po 1020
EOC - Ethylene 1-Octene Copolymer
EFBF - Empty Fruit Bunch Fiber
FRP - Fiber Reinforced Plastic
HDPE - High Density Poly Ethylene
LDPE - Low Density Poly Ethylene
MAPP - Maleic anhydride grafted polypropylene
MFI - Melt Flow Index
MFR - Melt Flow Rate
MA - Maleic Anhydride
MNR - Maleated Natural Rubber
NR - Natural Rubber
PVOH - Poly Vinyl Alcohol
PE - Polyethylene
PP - Polypropylene
xxiii
PLA - Poly Lactic Acid
PVOH - Poly Vinyl Alcohol
PEG - Poly Ethylene Glycol
PBS - Poly Butylene Succinate
P1CH - Polypropylene (co-polymer) Corn Husk composites
P1SW - Polypropylene (co-polymer) Sea Weed composites
P1BSW - Polypropylene (co-polymer) Brown SeaWeed composite
P1RSW - Polypropylene (co-polymer) Red SeaWeed composites
P1BF - Polypropylene (co-polymer) Banana Fiber composites
P1UBF - Polypropylene (co-polymer) Untreated Banana Fiber composites
P1TBF - Polypropylene (co-polymer) Treated Banana Fiber composites
P1CG - Polypropylene (co-polymer) Spent Coffee Grounds composites
P2CG - Polypropylene (homo -polymer) Spent Coffee Grounds composites
RSW - Red Sea Weed
SW - Sea Weed
SEM - Scanning Electron Microscopy
SMDF - Straw Medium Density Fiber
SF/PP - polypropylene/ Sisal fiber composite
TBF - Treated Banana Fiber
TGA - Thermo Gravimetric Analysis
UTM - Universal Testing Machine
UBF - Untreated Banana Fiber
WF - Wood Fiber
1
CHAPTER 1
INTRODUCTION
1.1 OVERVIEW OF POLYMER COMPOSITES
During the recent years, polymeric composite materials are being
used in variety of applications such as automotive, sporting goods, marine,
electrical, industrial, construction, household applications etc. Polymeric
composites have high strength and stiffness, light weight and high corrosion
resistance. Most of the composites available in the market today are
produced with high durability ensuring high product life. Unfortunately, in
order to make these products efficient, manufacturers have traditionally used
non-biodegradable fibers, made from non-renewable resources [1-4].
The use of various natural reinforcing fillers and fibers in
thermoplastics with the fibers such as hemp, jute, flax, sisal, banana, kapok,
corn husk had gained acceptance in commodity plastics and applications of
these materials during the past decade had been reported in the literature
[5-12].The advantage of composite materials compared to that of
conventional materials is mainly due to their higher specific strength,
stiffness and fatigue characteristics, which enables structural designs to be
more versatile. These composite materials are synthetic or naturally
occurring materials made from two or more constituents materials with
significantly different physical or chemical properties which remain separate
and distinct at macroscopic and microscopic scale within the finished
structure. These are materials that comprise strong load carrying material
known as reinforcement which are embedded in weaker bulk material known
as matrix. Reinforcement provides strength and rigidity, helping to support
structural load. The matrix or binder (organic or inorganic) maintains the
position and orientation of the reinforcement. The reinforcement may be
particles, platelets or fibers and are usually added to improve mechanical
property such as stiffness, strength and toughness of the matrix material.
2
Long fibers that are oriented in the direction of loading offer efficient load
transfer than short fibers. [13-15]
1.2 CLASSIFICATION OF COMPOSITES
There are two classification systems of composite materials.
composite materials based on matrix material.
composite materials based on reinforcing material structure.
On the basis of matrix phase, composites can be classified into
metal matrix composites (MMCs), ceramic matrix composites
(CMCs), and polymer matrix composites (PMCs). [16]
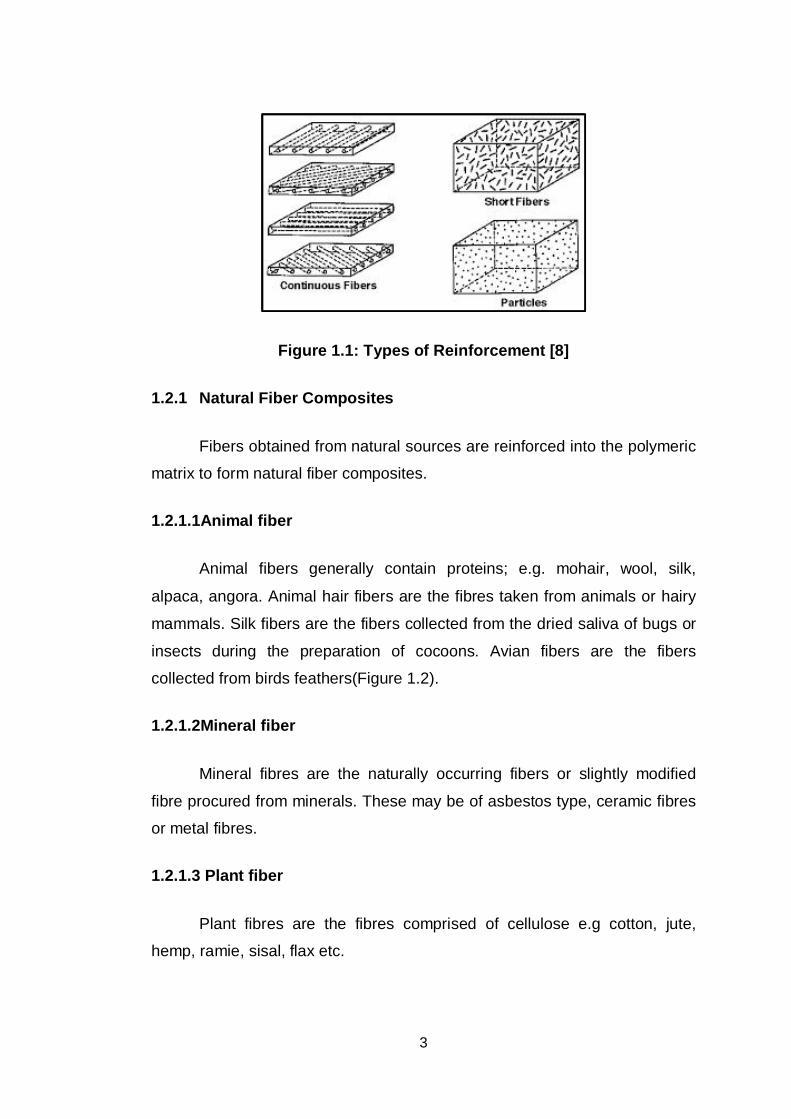
The classifications according to types of reinforcement are
particulate composites (composed of particles) (Figure 1.1),
fibrous composites (composed of fibers) and laminate
composites (composed of laminates).
Fibrous composites can be further subdivided on the basis of
natural/biofiber or synthetic fiber. Biofiber encompassing
composites are referred as bio-fiber composites. They can be
again divided on the basis of matrix, ie., non-biodegradable
matrix and biodegradable matrix [17]. Bio-based composites
made from natural/biofiber and biodegradable polymers are
referred to as green composites. These can be further
subdivided as hybrid composites and textile composites.
Hybrid composites comprise of a combination of two or more
types of fibers.[18]
3
Figure 1.1: Types of Reinforcement [8]
1.2.1 Natural Fiber Composites
Fibers obtained from natural sources are reinforced into the polymeric
matrix to form natural fiber composites.
1.2.1.1Animal fiber
Animal fibers generally contain proteins; e.g. mohair, wool, silk,
alpaca, angora. Animal hair fibers are the fibres taken from animals or hairy
mammals. Silk fibers are the fibers collected from the dried saliva of bugs or
insects during the preparation of cocoons. Avian fibers are the fibers
collected from birds feathers(Figure 1.2).
1.2.1.2Mineral fiber
Mineral fibres are the naturally occurring fibers or slightly modified
fibre procured from minerals. These may be of asbestos type, ceramic fibres
or metal fibres.
1.2.1.3 Plant fiber
Plant fibres are the fibres comprised of cellulose e.g cotton, jute,
hemp, ramie, sisal, flax etc.
4
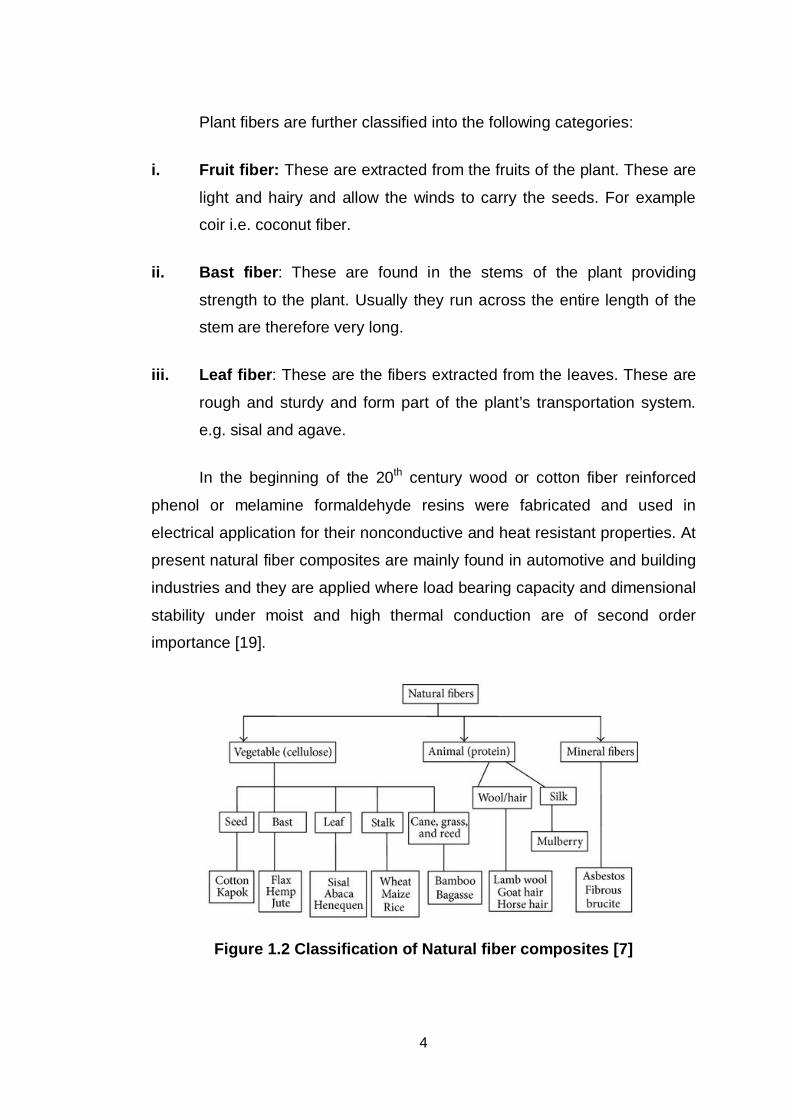
Plant fibers are further classified into the following categories:
i. Fruit fiber: These are extracted from the fruits of the plant. These are
light and hairy and allow the winds to carry the seeds. For example
coir i.e. coconut fiber.
ii. Bast fiber: These are found in the stems of the plant providing
strength to the plant. Usually they run across the entire length of the
stem are therefore very long.
iii. Leaf fiber: These are the fibers extracted from the leaves. These are
rough and sturdy and form part of the plant’s transportation system.
e.g. sisal and agave.
In the beginning of the 20th century wood or cotton fiber reinforced
phenol or melamine formaldehyde resins were fabricated and used in
electrical application for their nonconductive and heat resistant properties. At
present natural fiber composites are mainly found in automotive and building
industries and they are applied where load bearing capacity and dimensional
stability under moist and high thermal conduction are of second order
importance [19].
Figure 1.2 Classification of Natural fiber composites [7]
5
1.3 FACTORS AFFECTING PROPERTIES OF POLYMER COMPOSITES
1.3.1 Interfacial Adhesion
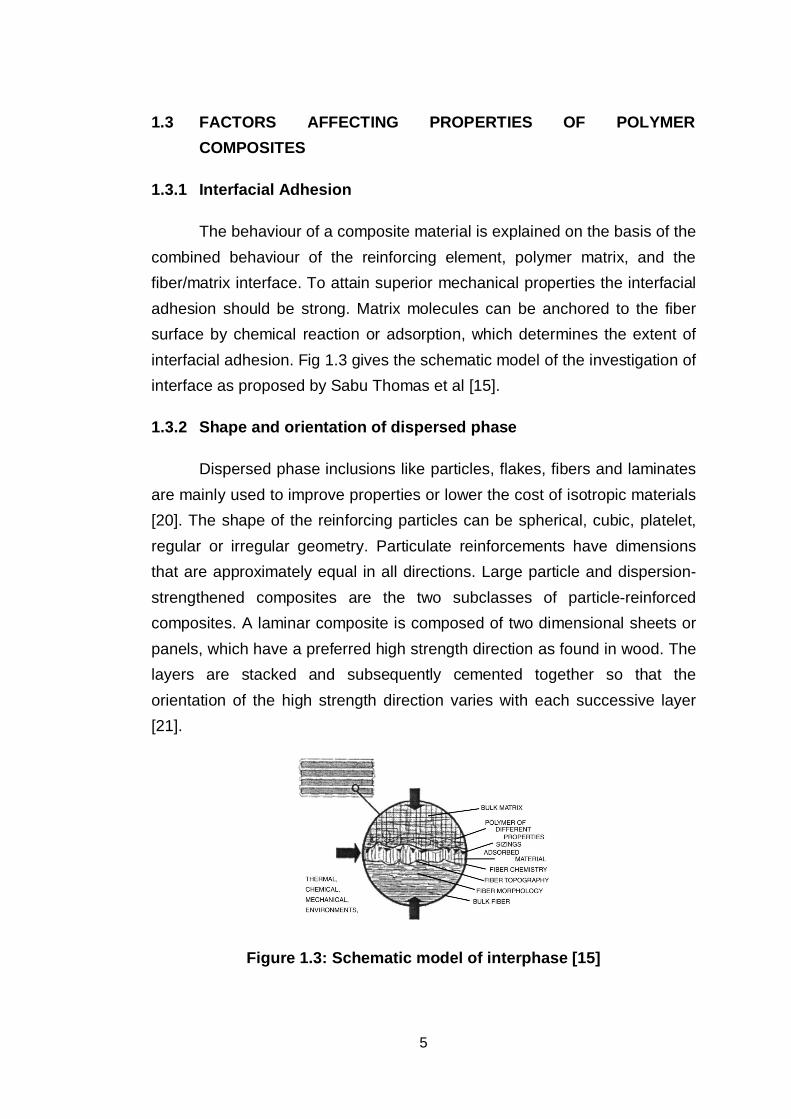
The behaviour of a composite material is explained on the basis of the combined behaviour of the reinforcing element, polymer matrix, and the fiber/matrix interface. To attain superior mechanical properties the interfacial adhesion should be strong. Matrix molecules can be anchored to the fiber surface by chemical reaction or adsorption, which determines the extent of interfacial adhesion. Fig 1.3 gives the schematic model of the investigation of interface as proposed by Sabu Thomas et al [15].
1.3.2 Shape and orientation of dispersed phase
Dispersed phase inclusions like particles, flakes, fibers and laminates are mainly used to improve properties or lower the cost of isotropic materials [20]. The shape of the reinforcing particles can be spherical, cubic, platelet, regular or irregular geometry. Particulate reinforcements have dimensions that are approximately equal in all directions. Large particle and dispersion-strengthened composites are the two subclasses of particle-reinforced composites. A laminar composite is composed of two dimensional sheets or panels, which have a preferred high strength direction as found in wood. The layers are stacked and subsequently cemented together so that the orientation of the high strength direction varies with each successive layer [21].
Figure 1.3: Schematic model of interphase [15]
6
1.3.3 Properties of the Matrix Polymers
Properties of different polymers will determine the application to which
it is appropriate. The main advantages of polymers as matrix are low cost,
easy processability, good chemical resistance, and low specific gravity. On
the other hand, low strength, low modulus, and low operating temperatures
limit their use [22-25]. Varieties of polymers used as matrix for composites
are thermoplastic polymers, thermosetting polymers, elastomers, and their
blends.
1.3.3.1Thermoplastic resin
Thermoplastic material melts to a liquid when heated and freezes to a
brittle, very glassy state when cooled sufficiently. The bonding can be easily
broken by the combined action of thermal activation and applied stress,
enabling the material to flow at elevated temperature. Example:
polyethylene, polypropylene, polyethylene terephthalate, polyether ether
ketone, polystyrene, polycarbonate, polyvinylchloride etc.
1.3.3.2 Thermosetting resin
Thermosets have cross-linked or network structures with covalent
bonds with all molecules. They do not soften but decompose on heating.
Once solidified by cross-linking process they cannot be reshaped because
thermosets once hardened or cross-linked, they will decompose rather than
melting. It has the property of undergoing a chemical reaction by the action
of heat, catalyst, UV light etc. to become relatively insoluble and infusible
substance. Due to this they are generally stronger and also suited for high
temperature applications. Examples are epoxies, polyesters, phenolic resins,
urea, melamine, silicone, and polyimides.
7
1.3.3.3 Elastomer
An elastomer is a polymer with the property of viscoelasticity,
generally having notably low Young’s modulus and high yield strain
compared with other materials. The term, which is derived from elastic
polymer, is often used interchangeably with the term rubber, although the
latter is preferred when referring to vulcanizates. Each of the monomers that
link to form the polymer is usually made of carbon, hydrogen, oxygen, and
silicon. Elastomers are amorphous polymers existing above their glass
transition temperature, so that considerable segmental motion is possible. At
ambient temperatures, rubbers are relatively soft and deformable; their
primary uses are for seals, adhesives, and moulded flexible parts. Natural
rubber, synthetic polyisoprene, polybutadiene, chloroprene rubber, butyl
rubber, ethylene propylene rubber, epichlorohydrin rubber, silicone rubber,
fluoro elastomers, thermoplastic elastomers, polysulfide rubber, and so on
are some of the examples of elastomers.
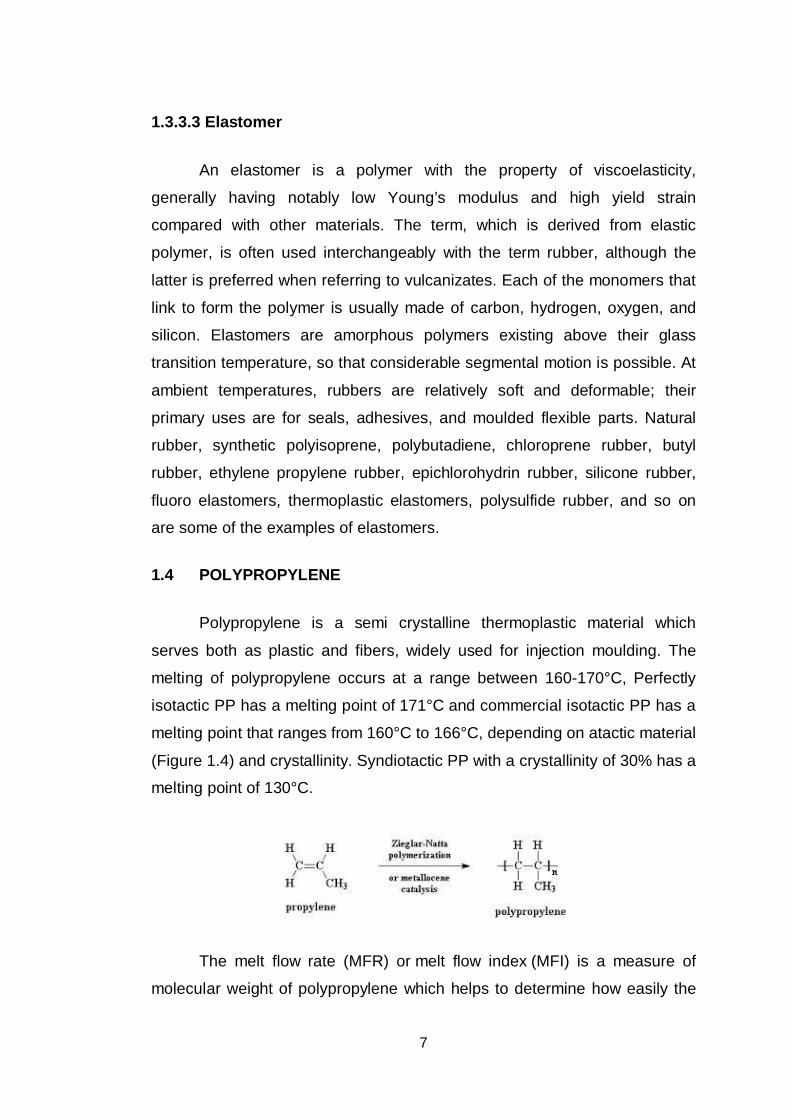
1.4 POLYPROPYLENE
Polypropylene is a semi crystalline thermoplastic material which
serves both as plastic and fibers, widely used for injection moulding. The
melting of polypropylene occurs at a range between 160-170°C, Perfectly
isotactic PP has a melting point of 171°C and commercial isotactic PP has a
melting point that ranges from 160°C to 166°C, depending on atactic material
(Figure 1.4) and crystallinity. Syndiotactic PP with a crystallinity of 30% has a
melting point of 130°C.
The melt flow rate (MFR) or melt flow index (MFI) is a measure of
molecular weight of polypropylene which helps to determine how easily the
8
molten raw material will flow during processing. Polypropylene with higher
MFR will fill the plastic mould more easily during the injection or blow-
moulding production process.
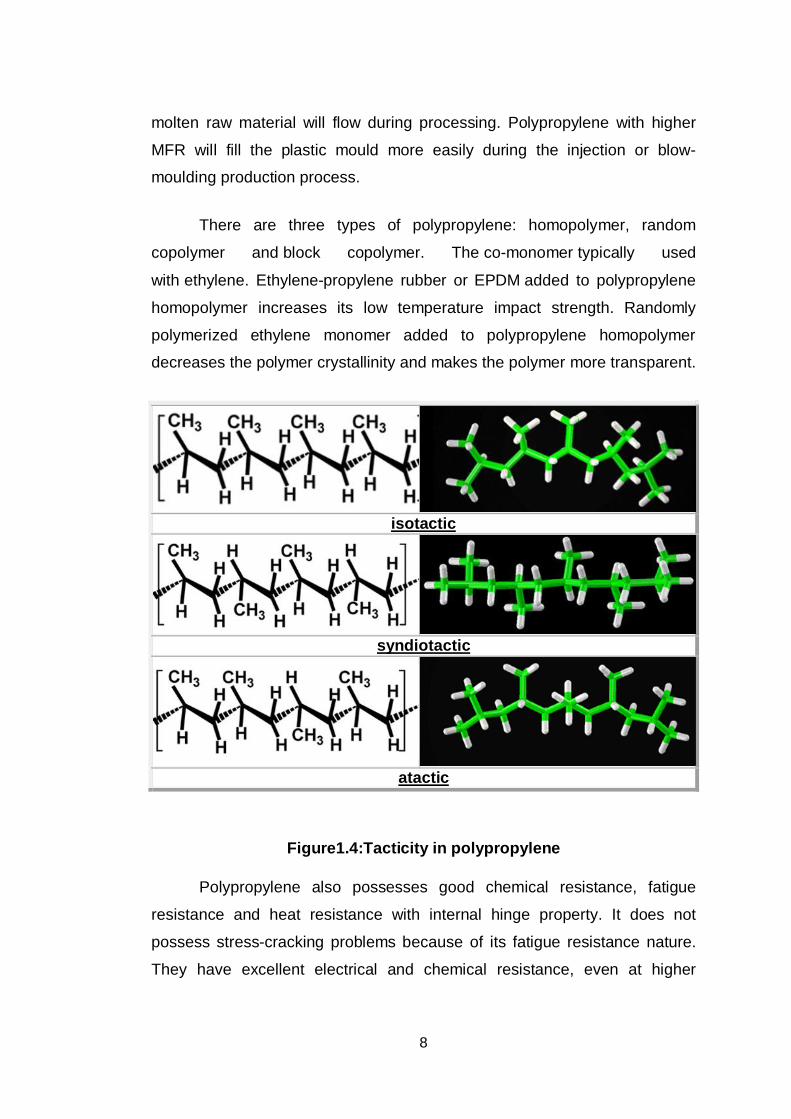
There are three types of polypropylene: homopolymer, random
copolymer and block copolymer. The co-monomer typically used
with ethylene. Ethylene-propylene rubber or EPDM added to polypropylene
homopolymer increases its low temperature impact strength. Randomly
polymerized ethylene monomer added to polypropylene homopolymer
decreases the polymer crystallinity and makes the polymer more transparent.
isotactic
syndiotactic
atactic
Figure1.4:Tacticity in polypropylene
Polypropylene also possesses good chemical resistance, fatigue
resistance and heat resistance with internal hinge property. It does not
possess stress-cracking problems because of its fatigue resistance nature.
They have excellent electrical and chemical resistance, even at higher
9
temperature. Even though it is similar to polyethylene, it has better
mechanical, chemical and thermal properties than polyethylene.
Polypropylene (PP), also known as poly propene, used in a wide variety of
applications including packaging, textiles (e.g. ropes, thermal underwear and
carpets), stationery, plastic parts and reusable containers of various types,
laboratory equipment, loudspeakers, automotive components and polymer
banknotes. It is also used to make industrial moulds, rugged currency,
carpets etc.
1.5 APPLICATIONS OF POLYMER COMPOSITES
Aerospace structures: The military aircraft industry has mainly
attempted the use of polymer composites. In commercial airlines,
the use of composites is gradually increasing. Space shuttle and
satellite systems use graphite/ epoxy for many structural parts [27],
[66][67].
Marine: Boat bodies, canoes, kayaks, and so on.
Automotive: Body panels, leaf springs, drive shaft, bumpers,
doors, racing carbodies, and so on.
Sports goods: Golf clubs, skis, fishing rods, tennis rackets and so
on.
Bulletproof vests and other armor parts.
Chemical storage tanks, pressure vessels, piping, pump body,
valves and so on.
Biomedical applications: Medical implants, orthopedic devices
and X-ray tables.
10
Bridges made of polymer composite materials are gaining wide
acceptance due to their lower weight, corrosion resistance and
longer life cycle.
1.6 RECENT ADVANCES IN POLYMER COMPOSITES
Recent works on FRP composites include the following:
Fiber reinforced polymer(FRP) composites are used in almost
every type of advanced engineering structure, with their usage
ranging from aircraft, helicopters and spacecraft through to boats,
ships and offshore platforms and to automobiles, sports goods,
chemical processing equipment and civil infrastructure such as
bridges and buildings. The usage of FRP composites continues to
grow at an impressive rate as these materials are used more in
their existing markets and become established in relatively new
markets such as biomedical devices and civil structures. A key
factor driving the increased applications of composites over the
recent years is the development of new advanced forms of FRP
materials. This includes developments in high performance resin
systems and new styles of reinforcement, such as carbon nano
tubes and nano particles [27].
Natural Fiber Composites: Glass, carbon, Kevlar, and boron
fibers are being used as reinforcing materials in fiber-reinforced
plastics, which have been widely accepted as materials for
structural and non-structural applications [28].However, these
materials are resistant to biodegradation and can pose
environmental problems. Natural fibers from plants such as jute,
bamboo, coir, sisal, and pineapple are known to have very high
strength and hence can be utilized for many load-bearing
applications. These fibers have special advantage in comparison
to synthetic fibers in that they are abundantly available from a
11
renewable resource and are biodegradable. But all natural fibers
are hydrophilic in nature and have high moisture content, which
leads to poor interface between fiber and hydrophobic matrix.
Several treatment methods are employed to improve the interface
in natural fiber composites [29].
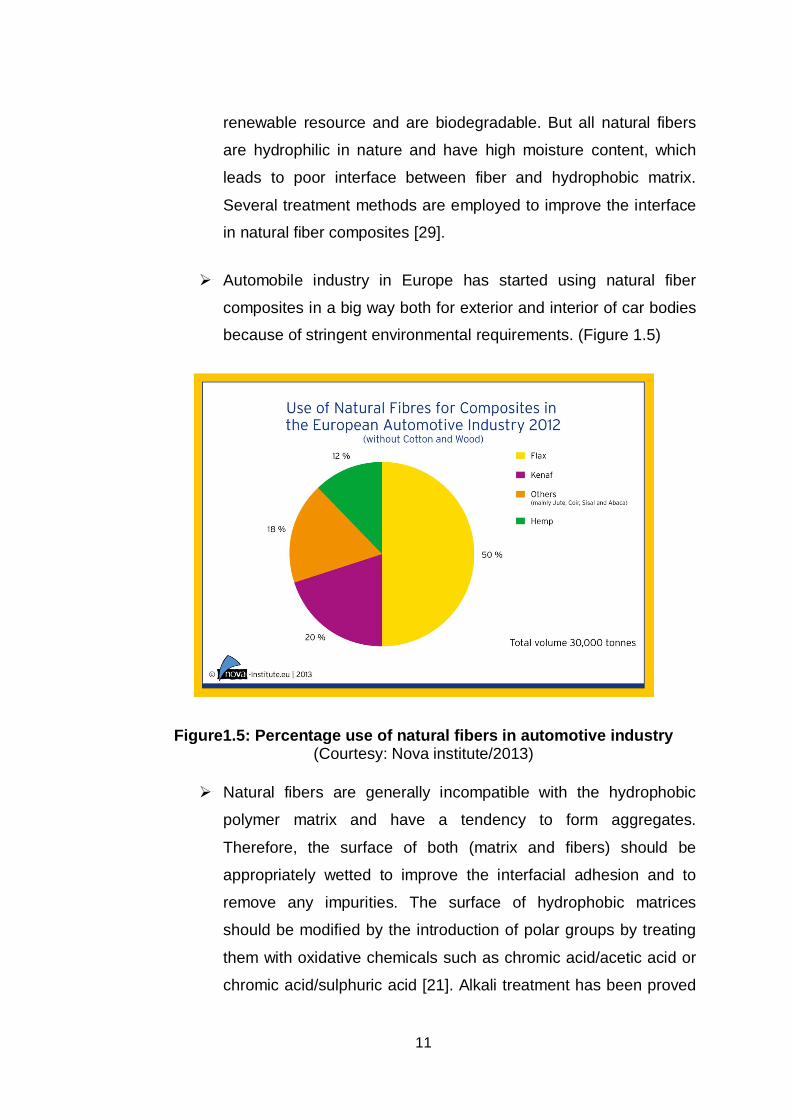
Automobile industry in Europe has started using natural fiber
composites in a big way both for exterior and interior of car bodies
because of stringent environmental requirements. (Figure 1.5)
Figure1.5: Percentage use of natural fibers in automotive industry (Courtesy: Nova institute/2013)
Natural fibers are generally incompatible with the hydrophobic
polymer matrix and have a tendency to form aggregates.
Therefore, the surface of both (matrix and fibers) should be
appropriately wetted to improve the interfacial adhesion and to
remove any impurities. The surface of hydrophobic matrices
should be modified by the introduction of polar groups by treating
them with oxidative chemicals such as chromic acid/acetic acid or
chromic acid/sulphuric acid [21]. Alkali treatment has been proved
12
to be an effective method for fiber modification from as early as
1935. It has been reported that on treatment with alkali, some of
the wax components at the fiber surface are saponified and
thereby removed from the fiber surface. Increased fiber/matrix
adhesion as a result of improved surface area and increase in
availability of the hydroxyl groups have also been reported as a
result of alkali treatment. Compared to unmodified composites, all
chemically modified fiber composites show higher tensile
properties and lower water uptake. As chemical treatment reduces
hydrophobicity of the fiber, it favours the strong interfacial
adhesion between fiber and PP matrix. Tensile properties
decrease with water uptake and time of immersion. Compared to
other natural fibers, banana and sisal have good mechanical
properties. In general, the strength of a fiber increases with
increasing cellulose content and decreasing spiral angle with
respect to the fiber axis.
Green Composites Research efforts are progressing in
developing a new class of fully biodegradable green composites
by combining fibers with biodegradable resins. The major
attractions about green composites are that they are eco-friendly
fully degradable and sustainable, that is, they are truly green in
every way. Green composites may be used effectively in many
applications such as mass-produced consumer products with short
life cycles or products intended for one time or short time use
before disposal. The important biodegradable matrices are
polyamides, polyvinyl alcohol, polyvinyl acetate, polyglycolic acid,
and polylactic acid, which are synthetic as well as polysaccharides,
starch, chitin, cellulose, proteins, collagens/gelatin, lignin, and so
on, which are natural [25].
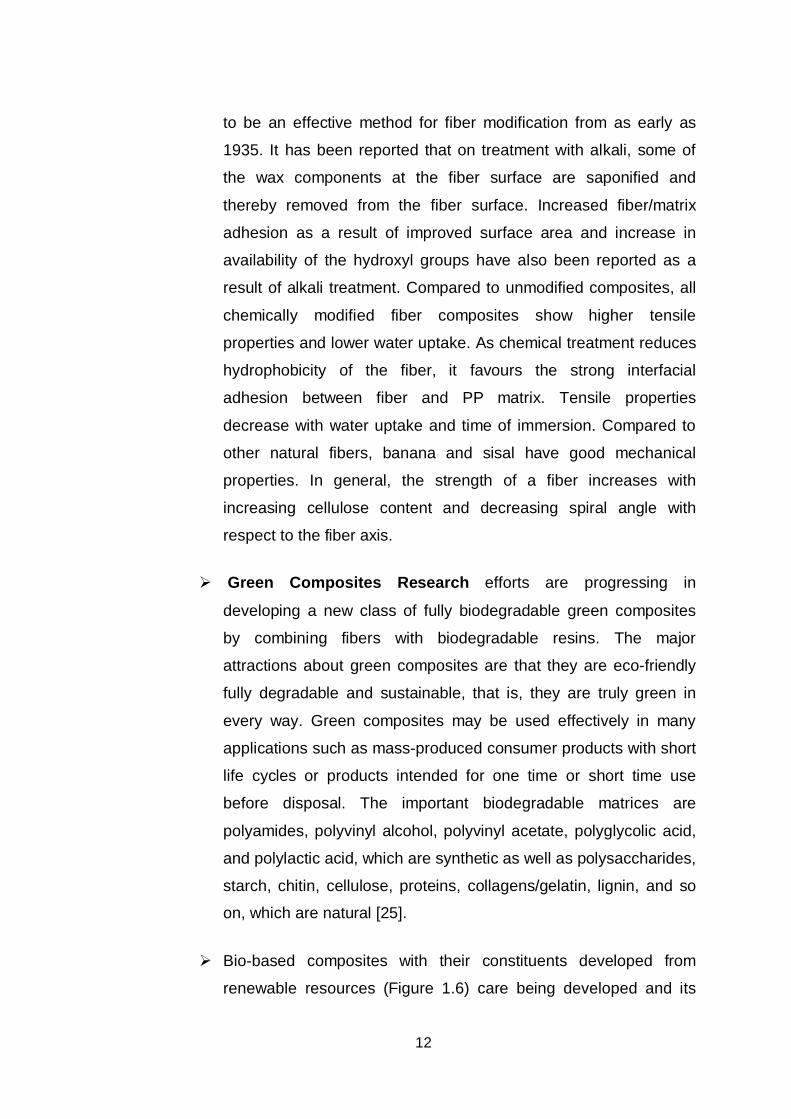
Bio-based composites with their constituents developed from
renewable resources (Figure 1.6) care being developed and its
13
application has extended to almost all fields. Natural fiber
composites can be used as a substitute for timber and for a
number of other applications. It can be moulded into sheets,
boards, gratings, pallets, frames, structural sections, and many
other shapes. They can be used as a substitute for wood, metal,
ormasonry for partitions, false ceiling, facades, barricades, fences,
railings, flooring, roofing, wall tiles, and so on [30]. It can also be
used in prefabricated housing, cubicles, kiosks, awnings, and
sheds/shelters.
Figure 1.6: Pathway showing conversion from biomass to building blocks of polymers
[Courtesy: Markets and Trends of Bio-based Products-nova-Institute]
14
1.7 INTERFACE CHARACTERIZATION
The characterization of interface gives relevant information on
interactions exists between fiber and matrix. The mechanical properties of
fiber-reinforced composites are dependent upon the stability of interfacial
region. Thus, the characterization of interface is of great importance. The
various methods that are available for characterization of the interface are as
follows.
1.7.1 Micromechanical Techniques
The extent of fiber/matrix interface bonding can be tested by different
micromechanical tests such as fiber pull-out, micro-debond test, micro
indentation test, and fiber fragmentation test.
1.7.2 Spectroscopic Analysis
Electron microscopy for chemical analysis/X-ray photoelectron
spectroscopy, mass spectroscopy, X-ray diffraction studies, electron-induced
vibration spectroscopy, and photo acoustic spectroscopy are successful in
polymer surface and interfacial characterization.
1.7.3 Microscopic Techniques
Microscopic studies such as optical microscopy, scanning electron
microscopy, transmission electron microscopy, and atomic force microscopy
can be used to study the morphological changes on the surface and can
predict the strength of mechanical bonding at the interface. The adhesive
strength of fiber to matrices can be determined by predicting the strength of
mechanical bonding at the interface.
1.7.4 Thermodynamic Methods
The frequently used thermodynamic methods for characterization in
reinforced polymers are wettability study, inverse gas chromatography
15
measurement, zeta potential measurement, and so on. Contact angle
measurements have been used to characterize the thermodynamic work of
adhesion between solids and liquids and surface of solids.
1.8 CHALLENGES AND OPPORTUNITIES
In the context of eco-friendly materials, recyclability of the
composites is one of the major problems. Recyclability of the
composites will lead to the cost-effective products at the same time
this is the remedy for the increased amount of waste materials.
Green composites can replace all hazardous and waste-producing
counterparts [15].
Life cycle analysis should be done for all newly synthesized
materials and thus the biodegradability can be measured. This will
help to select eco-friendly and acceptable materials.
Microfibrillar composites, their properties and applications created
a lot of interest in research because of their special properties and
applications.
Composite materials having long-term durability for continuous
purposes are desirable and cost-effective.
Since the interface has a significant role in property enhancement,
new characterization techniques for interface will bring new
opportunities.
Online monitoring of morphology of composites during processing
is another area, which requires the attention of researchers.
16
CHAPTER 2
LITERATURE SURVEY
2.1 NATURAL FIBERS
The history of natural fiber reinforced polymer composites can be
traced back to the advent of synthetic polymers in the early twentieth
century. In 1850s, shellac was compounded with wood flour. Research on
natural fiber composites has existed since the early 19th century but has not
received much attention until late in the 1980’s.During 1920s, 1930s and
early 1940s, a good deal of research was carried out on natural fiber
reinforced composites. Caldwell and Clay carried out their research work on
natural fiber reinforced composites for lighter materials to be used in aircraft
primary structures [31].
Composites, primarily glass but including natural reinforced
composites are found in countless consumer products like boats, skis,
agricultural machinery and cars [32-34]. A major goal of natural fiber
composites is to alleviate the need to use expensive glass fiber, which has a
relatively high density and is dependent on non-renewable sources [32, 34].
Recently, car manufacturers have been interested in incorporating
natural fiber composites into both interior and exterior parts. This serves a
two-fold goal of the companies that is to lower the overall weight of the
vehicle thus increasing fuel efficiency and to increase the sustainability of
their manufacturing process [32]. Many companies such as Mercedes Benz,
Toyota and DaimlerChrysler have already accomplished this and are looking
to expand the uses of natural fiber composites.
17
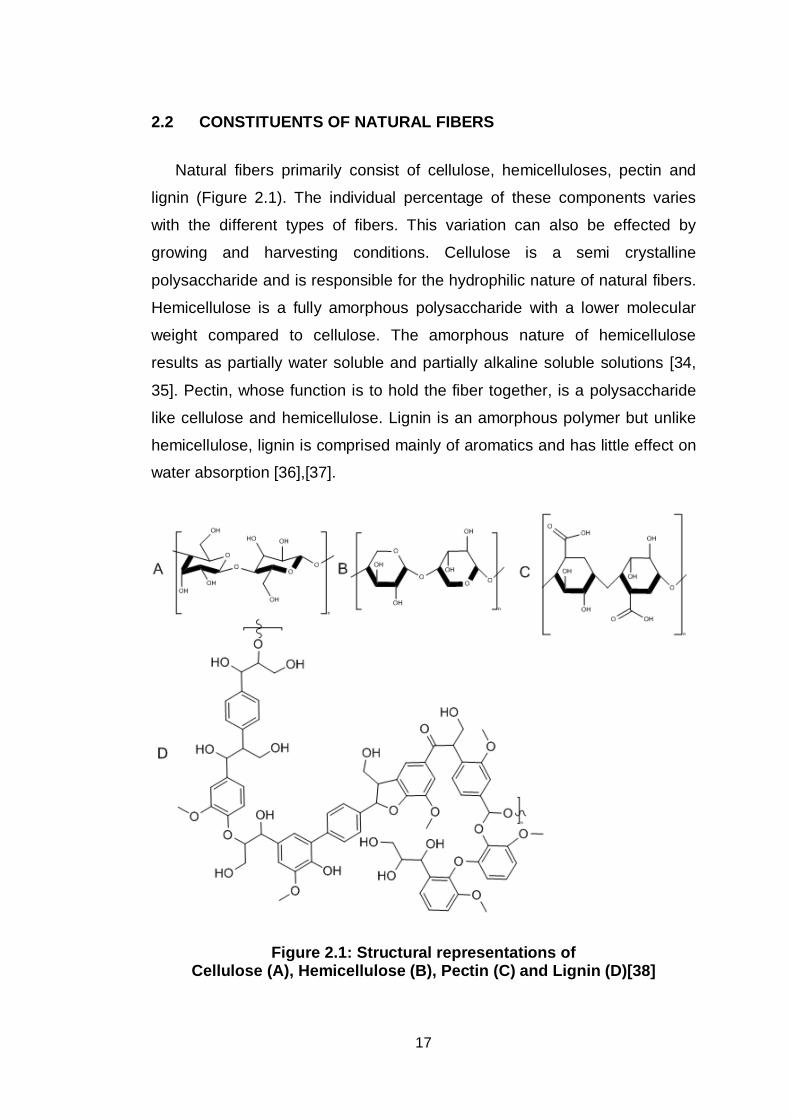
2.2 CONSTITUENTS OF NATURAL FIBERS
Natural fibers primarily consist of cellulose, hemicelluloses, pectin and
lignin (Figure 2.1). The individual percentage of these components varies
with the different types of fibers. This variation can also be effected by
growing and harvesting conditions. Cellulose is a semi crystalline
polysaccharide and is responsible for the hydrophilic nature of natural fibers.
Hemicellulose is a fully amorphous polysaccharide with a lower molecular
weight compared to cellulose. The amorphous nature of hemicellulose
results as partially water soluble and partially alkaline soluble solutions [34,
35]. Pectin, whose function is to hold the fiber together, is a polysaccharide
like cellulose and hemicellulose. Lignin is an amorphous polymer but unlike
hemicellulose, lignin is comprised mainly of aromatics and has little effect on
water absorption [36],[37].
Figure 2.1: Structural representations of Cellulose (A), Hemicellulose (B), Pectin (C) and Lignin (D)[38]
18
Cellulose, the most widespread organic molecule on Earth, is the
major component of plant cell walls. Plants produce approximately 50
kilograms of cellulose daily for each person on Earth. It is a linear polymer
made up of 10,000 to 15,000 glucose molecules bonded with glycosidic
linkages, which is made with entirely of glucose. Cellulose molecules contain
many polar hydroxyl groups, which allow them to interact with adjacent
molecules to form fibers. These fibers are structurally strong and resistant to
chemical attack, Therefore wood products are widely used in construction
and production of paper [39].The various chemical constituents of specific
natural fibers also vary considerably [40-45].
2.3 REVIEW OF NATURAL FIBER COMPOSITES
Han-Seung Yang; Douglas J. Gardner [46] have used Nano-sized
cellulose fillers (cellulose nanofiber [CNF], microfibrillated cellulose [MFC])
and a micron-sized cellulose filler microcrystalline cellulose [MCC]) as fillers
in polypropylene (PP) composites. They manufactured Cellulose-filled PP
composite samples and examined morphological properties of fracture
surfaces at different filler loading levels after mechanical testing. Scanning
electron microscopy analysis results showed polymer stretching as the major
component causing plastic deformation in fracture surfaces of CNF- and
MCC-filled composites, whereas analysis of MFC-filled composites exhibited
brittle deformation. They found considerable agglomeration beyond 6 wt%
filler loading, and composites sustained considerable tensile and flexural
strength up to 10 wt% filler loading, whereas tensile and flexural strength of
MCC-filled composites were found to decrease continuously.
Chandramohan, D. and J. Bharanichandar [47] made their effort to
utilize the advantages offered by renewable resources for the development
of composite materials based on polymer and particles of natural fibers for
conservation of natural resources. In their research, natural fibers like Sisal
(Agave sisalana), Banana (Musa sepientum) and Roselle (Hibiscus
sabdariffa), Sisal and banana (hybrid), Roselle and banana (hybrid) and
19
Roselle and sisal (hybrid) are tried with bio epoxy resin using molding
method. In their paper the optimum mixing of fiber and resin was achieved by
using Taguchi method, and they have worked on tensile and hardness of
Sisal and banana (hybrid), Roselle and banana (hybrid) and Roselle and
sisal (hybrid) composite at dry and wet conditions.
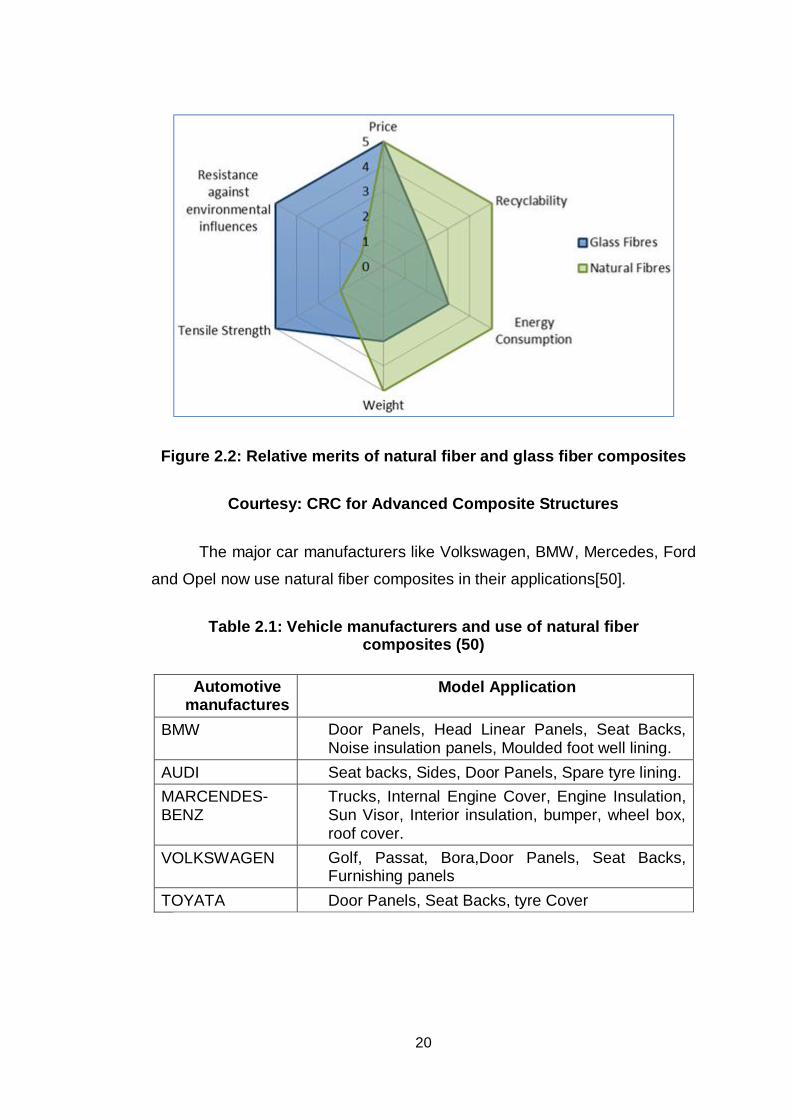
Lawrence T. Drzal, A. K. Mohantyand M. Misra [48] reviewed
Natural/Bio-fiber composites as emerging viable alternative to glass fiber
reinforced composites especially in automotive application(Table 2.1). The
combination of bio-fibers like Kenaf, Hemp, Flax, Jute, Henequen, Pineapple
leaf fiber and Sisal with polymer matrices from both non-renewable and
renewable resources was tried to produce composite materials that are
competitive with synthetic composites with special emphasis on biofiber-
matrix interface and novel processing methods [Figure 2.2].
Natural fiber reinforced polypropylene (PP) composites have attained
commercial attraction in automotive industries because synthetic fiber – PP
or polyester composites are not eco-friendly due to the petro-based source
as well as non-biodegradable nature of the polymer matrix which will solve
many environmental issues. They had also stated that the main advantage of
using renewable materials is that the global CO2 balance is kept at a stable
level.
An article by Ing. Eva Akova [49] explains the recent developments
on natural fiber reinforced polymer composites and experiments on polyester
composites with hop fibers. He prepared two sets of composites one with
20gram and other with 45gram hop fibers and both were tested for their
mechanical properties. He had concluded that both the samples produced
similar properties with required industrial applications.
20
Figure 2.2: Relative merits of natural fiber and glass fiber composites
Courtesy: CRC for Advanced Composite Structures
The major car manufacturers like Volkswagen, BMW, Mercedes, Ford
and Opel now use natural fiber composites in their applications[50].
Table 2.1: Vehicle manufacturers and use of natural fiber composites (50)
Automotive manufactures
Model Application
BMW Door Panels, Head Linear Panels, Seat Backs, Noise insulation panels, Moulded foot well lining.
AUDI Seat backs, Sides, Door Panels, Spare tyre lining. MARCENDES-BENZ
Trucks, Internal Engine Cover, Engine Insulation, Sun Visor, Interior insulation, bumper, wheel box, roof cover.
VOLKSWAGEN Golf, Passat, Bora,Door Panels, Seat Backs, Furnishing panels
TOYATA Door Panels, Seat Backs, tyre Cover
21
An experimental study has been conducted by Punyapriya Mishra & S. K. Acharya [51] to determine the abrasive wear behaviour of bagasse
fiber reinforced epoxy composite in different directions, namely parallel
orientation (PO), anti-parallel orientation (APO) and normal orientation (NO)
by using a two body abrasion wear tester. Three different types of abrasives
wear behaviour have been observed in the composites in three orientations
and they found to follow the following trends: WNO < WAPO < WPO, where
WNO, WAPO and WPO are the wear in normal, anti-parallel and parallel
directions of fibres orientation, respectively. SEM results of wear tested
samples show that in PO type samples the abrasion takes place due to
microploughing, where as in APO and NO type samples wearing process
may be due to micro cutting of the samples. They evaluated the relationship
of wear anisotropy with load and grit size. They further suggested that the
method can be further extended to hybrid composite structures.
Khairiah Haji Badri et al [52] incorporated different sizes of EFB
(empty fruit bunch) fibers of oil palm in poly urethane matrix and compared
the properties of the composites with that of control foam. They found that
compressive strength increased by 11.1%, 11.6% and 29.1% for the 45-
56 m, 100-160 m and 200-315 m fibre size, respectively. The 45-56 m
fibre size at 5.5% fibre loading showed the maximum compression strength
and modulus. Micrographs of the cellular structure of the EFB-filled
polyurethane foam showed that the presence of the fibrous EFB of size 200-
315 m torn the cellular structure, whereas the powder form of EFB filled
structures of the cellular network enhanced the strength of the cells’ wall.
The overall increase in the compression stress and modulus for the refined
EFB-filled composites shows the ability of the filler either in fibre or powder
form to impart greater stiffness to the composites. They also suggested that
ligno cellulosic materials with high moisture absorption and low microbial
resistance lead to limitation in properties that need to be considered and
corrected.
22
2.4 REVIEW OF COMPATIBILITY IMPROVEMENT STUDIES ON NATURAL FIBER COMPOSITES
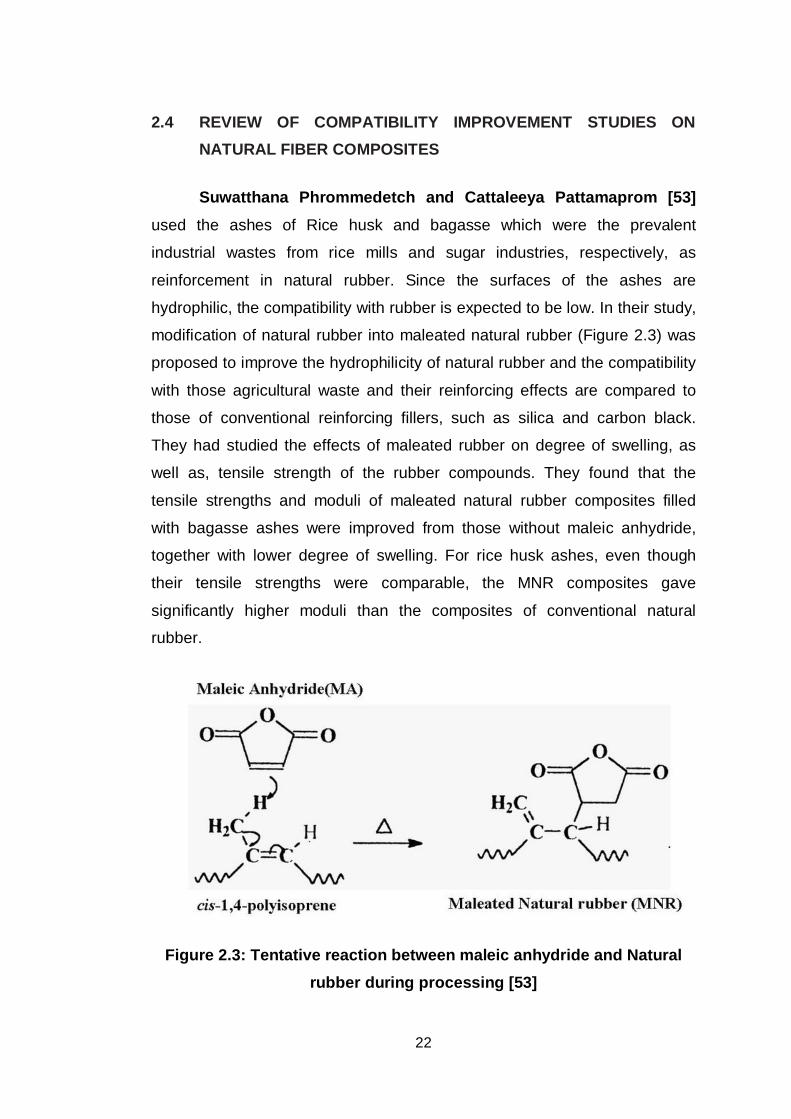
Suwatthana Phrommedetch and Cattaleeya Pattamaprom [53]
used the ashes of Rice husk and bagasse which were the prevalent
industrial wastes from rice mills and sugar industries, respectively, as
reinforcement in natural rubber. Since the surfaces of the ashes are
hydrophilic, the compatibility with rubber is expected to be low. In their study,
modification of natural rubber into maleated natural rubber (Figure 2.3) was
proposed to improve the hydrophilicity of natural rubber and the compatibility
with those agricultural waste and their reinforcing effects are compared to
those of conventional reinforcing fillers, such as silica and carbon black.
They had studied the effects of maleated rubber on degree of swelling, as
well as, tensile strength of the rubber compounds. They found that the
tensile strengths and moduli of maleated natural rubber composites filled
with bagasse ashes were improved from those without maleic anhydride,
together with lower degree of swelling. For rice husk ashes, even though
their tensile strengths were comparable, the MNR composites gave
significantly higher moduli than the composites of conventional natural
rubber.
Figure 2.3: Tentative reaction between maleic anhydride and Natural rubber during processing [53]
23
The results showed that the moduli of maleated composites using rice
husk ashes and bagasse ashes as fillers were improved from the
conventional composites. Nevertheless, the fact that MNR compounds still
exhibited a long delayed onset of vulcanization compared to that of natural
rubber, should be further improved.
M. Khalid et al [54] used maleic anhydride grafted polypropylene,
MAPP(GR-205) as a coupling agent for the PP-cellulose (derived from oil
palm empty fruit bunch fiber) and PP-oil palm empty fruit bunch fiber (EFBF)
biocomposites. They prepared different sets of biocomposites by blending
PP-cellulose and PP-EFBF at a fixed ratio of 70(wt%)/30(wt%) using
brabender mixer at 180°C. MAPP was added at varying concentrations (2wt
%, 3wt%, 5wt%, and 7wt%) during the blending. The effect of MAPP
concentration on the mechanical properties such as tensile, flexural and
impact strengths of both the biocomposites was studied. They found that 30
wt % filler (cellulose and EFBF) loading with 2wt% MAPP concentration gave
the best results for the EFBF biocomposites. On the other hand there were
no significant changes observed in the PPcellulose biocomposites properties
on addition of MAPP. They also had stated that PP-cellulose biocomposite
did not show significant changes in the mechanical properties indicating that
the MAPP works well with the lingo cellulosic fibers. With the increase in the
concentration of MAPP in the PP matrix above 2wt% there is a substantial
decrease in mechanical strength. They had also suggested that further
testing should be done at still lower concentration of MAPP. They had
concluded that, MAPP modified EFB fiber and PP matrix can be moulded
into a value added and cost effective bio composite materials.
Doaa I. Osman et al [55] used kraft pulpas, a mechanical property
modifier for the insulating oil–based polymer composites. They prepared an
insulating oil which was blended with low density polymers [polyethylene
(PE) and polypropylene (PP)] and Kraft pulp with different concentrations to
24
manufacture composites. They determined the electrical properties (dielectric
constant, energy loss and power factor) and mechanical properties
(hardness and tear factor) for each blend. The addition of polymer
(polyethylene and polypropylene) to the composite improves the electrical
properties and hardness of the composites.
MohdShahril Ezuan Mustapa [56] had reported about the effects of
coupling agent and impact modifier on the mechanical properties of
polypropylene rice husk composites. They used both Ethylene 1-octene
copolymers (EOC) and maleic anhydride grafted polypropylene (MAPP) as
the impact modifier and coupling agent respectively. These compounds were
melt blended using twin screw extruder and then injection moulded into
standard test samples. They observed improvement of 35% in flexural
strength with the addition of 4wt% of MAPP into the composites with 30wt%
rice husk.
In many of the studies PP, Cellulosic fibers and MAPP pellets or
powders are added in situ into twin-screw extruder and compounded at
200 C [61]. There is no conclusive or direct evidence of ester links between
fibers and maleated polypropylene. There is no strong reason to assume that
the anhydride groups on maleated polypropylene may have played a role on
the strength of the properties of composites.
Muhammad Yasina et al [57] have produced medium and high
density fiber boards from rice wheat straw fillers, binders like amino and
phenol formaldehyde resins and adhesives such as poly isocyanate. This
study will help in efficient utilization of wheat and rice straw as an alternate
resource for the industrial manufacture of particleboards and fibe rboards.
They had suggested that further research is required to make progress in
utilization of wider range of lingo cellulosic raw materials for composites and
in technologies of their economic manufacturing to eliminate the question of
availability of feedstock. Such research should particularly concentrate on
methods to improve the surface activation of refined ligno-cellulosic material
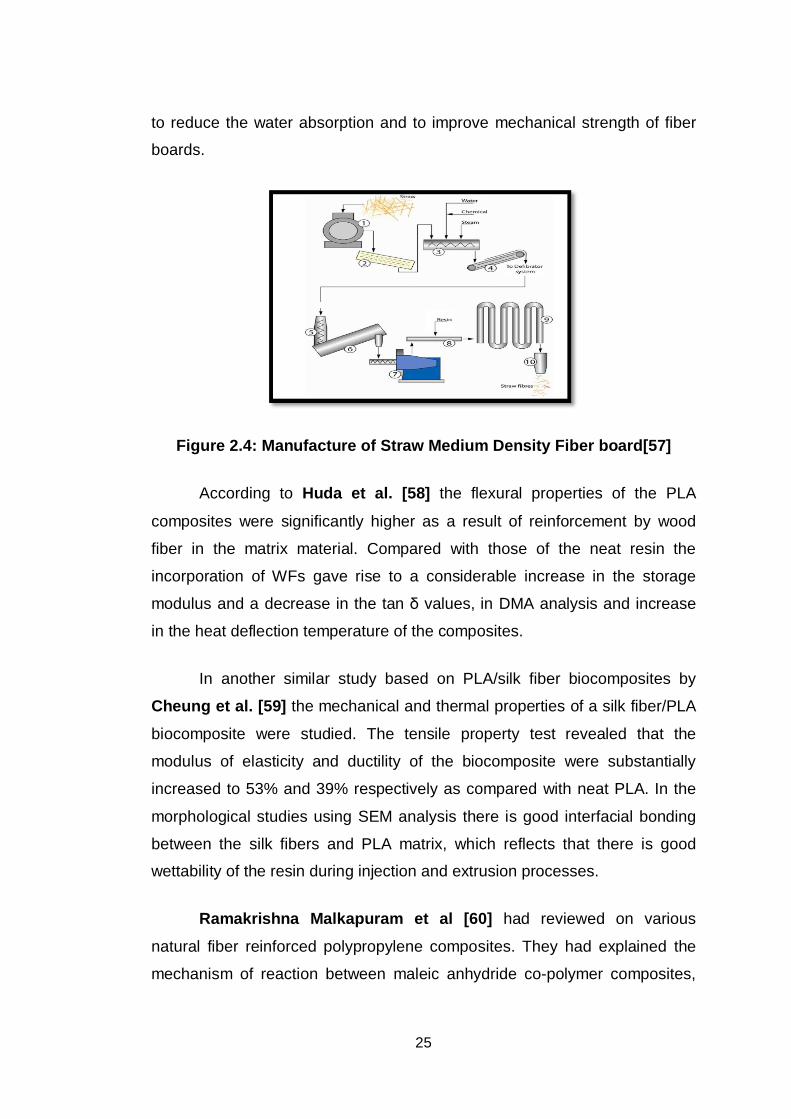
25
to reduce the water absorption and to improve mechanical strength of fiber
boards.
Figure 2.4: Manufacture of Straw Medium Density Fiber board[57]
According to Huda et al. [58] the flexural properties of the PLA
composites were significantly higher as a result of reinforcement by wood
fiber in the matrix material. Compared with those of the neat resin the
incorporation of WFs gave rise to a considerable increase in the storage
modulus and a decrease in the tan values, in DMA analysis and increase
in the heat deflection temperature of the composites.
In another similar study based on PLA/silk fiber biocomposites by
Cheung et al. [59] the mechanical and thermal properties of a silk fiber/PLA
biocomposite were studied. The tensile property test revealed that the
modulus of elasticity and ductility of the biocomposite were substantially
increased to 53% and 39% respectively as compared with neat PLA. In the
morphological studies using SEM analysis there is good interfacial bonding
between the silk fibers and PLA matrix, which reflects that there is good
wettability of the resin during injection and extrusion processes.
Ramakrishna Malkapuram et al [60] had reviewed on various
natural fiber reinforced polypropylene composites. They had explained the
mechanism of reaction between maleic anhydride co-polymer composites,
26
which inturn can be divided into two steps; first step is the activation of
copolymer by heating, preceded by the esterification of cellulose, leading to
better wettability and interfacial bonding.
Suarez et al. [61] studied the mechanical and morphological
behaviour of composites prepared from PP with MAPP and saw dust coated up to 22.4wt% MAPP. The tensile properties of composites with up to 10% MAPP have not improved. This was attributed to the poor filler/matrix
adhesion. The addition of MAPP content to the PP composites produced better adhesion of saw dust to PP matrix and an increase in the tensile strength. SEM was performed to analyse the tensile fracture surfaces and
the interfacial fiber/matrix adhesion.
2.5 REVIEW OF HYGROSCOPICITY OF NATURAL FIBER COMPOSITES
All the cellulose derivatives are hydrophilic in nature; hence all the natural fibers absorb moisture. Usually moisture content in natural fibers
varies between 5wt%-15wt%. Reinforcement of these natural fibers into the polymer matrix will decrease the mechanical strength and lead to the variation in dimensional stability. Therefore before incorporating these fibers
as reinforcement they should be properly processed, dried and stored at the optimum temperature condition.
Sisal and coconut coir reinforced epoxy composites were subjected to
water immersion tests and the effects of water absorption on their mechanical properties were studied by Girisha et al [62].The percentage of
moisture uptake increased as the fiber volume fraction increased because of the high cellulose content of the fiber. The tensile and flexural properties of natural fiber reinforced epoxy composite specimens were found to decrease
with increase in percentage moisture uptake. Moisture induced degradation of composite samples was observed at elevated temperature. The water absorption pattern of these composites at room temperature was found to
follow Fickian behavior, whereas the water absorption properties at higher temperature did not follow Fick’s law.
27
Pradeep Upadhyaya et al [63] studied the effect of water absorption on mechanical properties of hybrid fiber reinforced polypropylene composites. These hybrid filler (wood flour and wheat husk)-polypropylene composites specimens containing 30% and 40% fiber weight were prepared by melt blending process. Water absorption tests were conducted by immersion of specimens in distilled water at room temperature for different time durations (24h, 48h, 72h, 96h, 120h, 144h, 168h, 192h). The tensile, flexural and impact properties were investigated before and after water absorption.
To determine the moisture pickup of aspen fiber/polypropylene composites Roger M. Rowell [64] and his co-workers made several different levels of aspen fiber (30% to 60% by weight) polypropylene composites both with and without the addition of a coupling agent (maleic anhydride grafted polypropylene, MAPP). These composites were tested using short and long term water soaking, boiling water, cyclic liquid water and oven drying, and under various relative humidity conditions. It was observed that as the level of fiber increases, the rate and extent of thickness swelling and moisture sorption increased as compared to pure polypropylene. But the presence of MAPP decreased the extent of swelling and moisture pick up. This may be due to the increase in compatibilization resulting from more contact between hydrophilic fiber and hydrophobic plastic. Further, they reported that moisture absorption in fiber-thermoplastic composites leads to dimensional instability and biological attack.
A similar study with polypropylene/sisal fiber (SF) composites using a pre-coating technique was conducted by C.P.L Chow et al [65]. In their research work the composite specimens were subjected to hot water immersion treatment at 90°C for different durations. The effects of the immersion treatment on the tensile and impact fracture characteristics were investigated. The apparent weight gain and weight loss curves were drawn. It was found that both the tensile modulus and tensile strength of the SF/PP composites decreased continuously with increasing water immersion time. On the contrary, the Izod impact strength increased initially with immersion treatment. After reaching the maximum impact strength, it was found to
28
decrease with further increase in immersion time. These contradictory behaviours between the tensile and impact properties were explained by the plasticization of the SF/PP interface and the swelling of the reinforcing sisal fibers.
2.6 SURVEY ON BIODEGRADATION IN POLYMERIC COMPOSITES
Synthetic polymers play a vital role in day to day activity and also in
many branches of industry especially in packaging industry. But, they have an undesirable influence on the environment and cause problems with waste management. Thus, there is a need to substitute such polymers with
polymers which can be degraded easily. Therefore, there is an increasing interest for developing biodegradable polymeric materials and composites.
Biodegradable materials degrade into biomass, carbon dioxide and methane. In the case of synthetic polymers, microbial utilization of its carbon backbone as a carbon source is required [68].
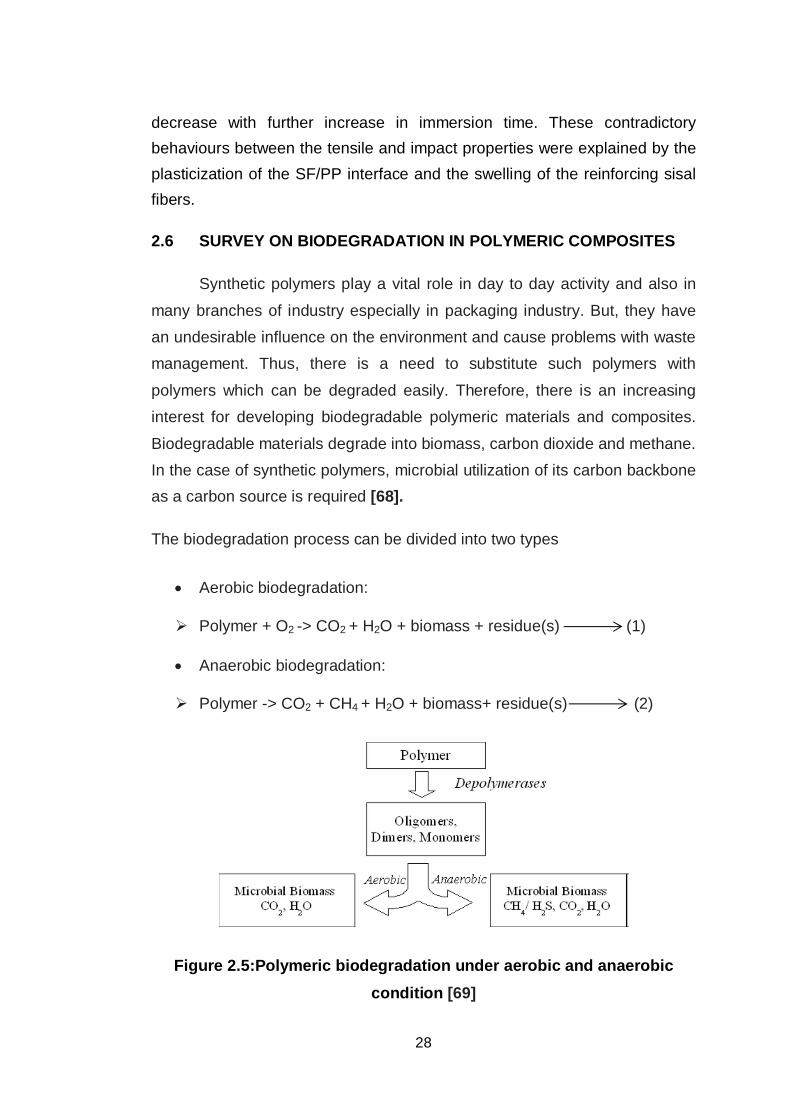
The biodegradation process can be divided into two types
Aerobic biodegradation:
Polymer + O2 -> CO2 + H2O + biomass + residue(s) (1)
Anaerobic biodegradation:
Polymer -> CO2 + CH4 + H2O + biomass+ residue(s) (2)
Figure 2.5:Polymeric biodegradation under aerobic and anaerobic condition [69]
29
Behjat et al [70] had studied the biodegradation on several blends of
cellulose derived from bast part of kenaf(Hibiscus cannabinus ) plant, with
different thermoplastics like low density polyethylene (LDPE) and high density polyethylene (HDPE), prepared by a melt blending machine. It was observed that biodegradability of the bio-composites made up using PEG
was superior to those of the bio-composites fabricated without PEG, due to the improved wetting of the plasticizer in the matrix polymer. The results
were also supported by the scanning electron microscopy (SEM). It had been suggested that the successful biodegradability test can be continued with more percentage of cellulose and PEG; however, it may weaken the mechanical properties of the composites.
Starch grafted polyethylene (PE), was successfully synthesized by graft copolymerization method using benzoyl peroxide as the radical initiator by Inderjeet Kauret al [71] and its biodegradation studies were carried out
by soil burial test. Microanalysis of the soil containing the samples was carried out after a specified number of days. An increase in the colonies of microorganisms with increasing number of days was observed. Effect of
degradation of the grafted samples buried in soil and urea enriched soil on the growth of plants was studied and it was found that the plants grow normally in the soil containing the grafted material. Specification was made
that the synthesis of starch grafted polyethylene will be beneficial in making best use of polyethylene without the risk of environmental pollution as clear from the consistent growth of plants.
Polyvinyl alcohol / corn starch blend films were prepared using the solution casting method by N. A. Azahari, N. Othman and H. Ismail [71]and the biodegradability of the films was investigated based on
enzymatic absorbency in water and acidic solution as well as by burial in soil and compost. The tensile properties were also examined. Film structure was characterised by scanning electron microscopy. Compared to film without
corn starch, the films containing corn starch were found to be more highly biodegradable by enzymes as well as in soil and compost. However, the results from the tensile and elongation at break tests showed that strength
30
decreased as the corn starch content increased. The morphology study revealed the distribution of corn starch in the polyvinyl alcohol.
Hee-Soo Kimet al [73] carried out experiments on the
biodegradability of bio-flour filled biodegradable poly (butylene succinate) (PBS) bio-composites in natural and compost soil. The percentage weight loss and the reduction in mechanical properties of PBS and the bio-
composites in the compost soil burial test were significantly greater than those in the natural soil burial test. The biodegradability was enhanced with increasing bio-flour content.
Sanjay K. Nayak et al [74] studied the degradation and flammability
behaviour of PP/banana(BF) and glass fiber based composites. Further, BFPP composites exhibited higher degradation tendency as compared to the virgin polymer as well as the hybrid composites. Extent of biodegradation in
the irradiated samples showed increased weight loss in the BFPP samples thus revealing effective interfacial adhesion upon hybridization with glass fibers.
Kh. Mumtahenah Siddiquee et al [75] focussed their study towards
the fabrication of jute polymer composites, biodegradation and the investigation of an optimum method of biodegradation. Polyethylene and Polypropylene were reinforced with 5wt%, 10wt% and 15wt% of fiber.
Degradation behaviour of composites was studied in terms of percentage weight loss.
It was found that degradation rate follows the sequence of:
Compost>Weather > Soil burial
Compost show better degradation rate because of following reasons
- Microorganism accelerates the degradation process.
- Controlled environment.
- Temperature
31
2.7 OUTCOME OF LITERATURE SURVEY
Most of the research works on natural fiber composites have been
carried out with thermosetting plastics because of easy processing methods
and few with thermoplastics [8, 15]. Further polyolefin, especially
polyethylene and polypropylene are produced in larger quantities in India
and utilised for packaging applications leading to the generation of more
consumer waste. Therefore thermoplastic polyolefin, especially
polypropylene (PP) was chosen as a matrix material in the present work.
With respect to the reinforcement material only few works have been
reported on corn husk and sea weeds as reinforcing filler with PP, and hence
this was chosen as a reinforcing material in the present study and the effect
of these fillers on various properties of polypropylene composites are also
studied.
Literature reported with respect to banana fiber are mostly based on
the stem fiber, which can be extracted easily but the banana fruit trunk part
was thrown away after harvesting the riped banana fruits. In the present
study the fibers derived from the fruit trunk part was used as another source
of reinforcing material for the polypropylene composite. Further, there is a
large gap in the findings with respect to coffee grounds residue as reinforcing
filler, which was also chosen for the present study.
2.8 SCOPE AND OBJECTIVES OF THE PRESENT RESEARCH WORK
Utilization of biodegradable agricultural waste such as corn husk, sea weeds, banana fiber and spent coffee ground in the development of composites.
Choice of polypropylene as the matrix material for preparation of the composites because of its huge commercial availability.
To evaluate and report the efficient processing methods and their relationship with varying percentages of filler as reinforcement.
32
To study the characteristics of polypropylene composites in terms
of various physical parameters essential for their acceptance as marketable products.
To study the effect of reinforcing fillers on the biodegradation of polypropylene composites.
Scientific objectives
To find out the percentage composition of moisture, ash, fat,
protein and carbohydrate content present in the reinforcing fillers by chemical testing methods.
To determine the different functional groups present in the reinforcing fillers used for reinforcement, by using FTIR analysis.
To develop polypropylene composites with varying weight
percentages of reinforcing fillers using extruder and mould them into standard test specimens.
To determine and evaluate the mechanical, thermal and morphological characteristics of the composites developed.
To study the moisture resistance of the composites by water absorption test.
To carry out biodegradation behaviour of the composites by
aerobic standard composting conditions as per ASTM D 5338 method.
The present work is divided into nine chapters including introductory
chapter (Chapter 1), survey of literature (Chapter 2), chapter explaining
experimental theme of the work (Chapter 3), results and discussion with
respect to four different fillers (Chapter 4,5,6 and 7), biodegradation study
(Chapter 8) and conclusions (Chapter 9) as per the prescribed format.
Chapter 1 gives a brief introduction about polymer composites and
their classification, properties, applications, advantages and disadvantages
33
and its problems after end use. It also discusses about raise in attention
towards natural fiber composites which had gained importance as commodity
plastic and recent advancements in polymer composites and their new
challenges and opportunities.
Chapter 2 presents a detailed literature of natural fiber composites, its
hydrophilic nature, innovative modifications required to improve their
compatibility of natural fiber with polymer matrices. Subsequently, outcome
of literature survey, the scope and objectives of the present work are also
discussed.
Chapter 3 gives the materials and methods for the determination of
composition of fillers, development of composites and characterization
techniques such as physiochemical methods FT-IR, water absorption,
thermal properties (DSC and TGA), mechanical properties (tensile strength,
modulus, percentage elongation at break, impact strength and hardness)
and morphological properties.
Chapter 4 discusses the development and characterisation of corn
husk polypropylene composite by varying the weight percentages (10wt%,
20wt% and 30wt%) of corn husk into the PP matrix. This was done to find out
the effect of reinforcing filler content on the bio-composites in the absence of
compatibilizer (or) coupling agent. The tensile properties are found to be
decreased when compared to that of neat polypropylene due to the weak
interfacial bonding between the matrix and the fiber. The thermal, water
absorption and morphological structure of polypropylene/corn husk
composites are analysed using TGA, DTA and SEM analysis. A comparative
aspect of reinforcement into polymer matrix and composition of filler is
explained based on the results obtained from FT-IR analysis.
Chapter 5 presents the development of seaweed polypropylene
composite by varying the weight percentages (10wt%, 20wt% and 30wt%) of
reinforcing filler into the PP matrix. Two different non edible seaweeds (red
and brown seaweed) were utilized in the present study. Comparative aspect
34
of reinforcing filler content was explained using mechanical, thermal and
morphological properties. Functional group present in the seaweed
composite and that of neat polypropylene were compared using FT-IR
analysis.
Chapter 6 deals with the development of untreated and treated
banana fruit stem fiber composites. The chapter presents the effect of
chemical treatment on the developed bio-composites. The bio-composites
were characterized and tested for FT-IR, DSC, TGA, tensile strength, impact
strength, hardness, and water absorption analysis with reference to neat
polypropylene matrix. The homogeneous dispersion of reinforcement in
polypropylene was studied through SEM analysis.
Chapter 7 illustrates the development of new type of particulate bio-
composite with spent coffee grounds residue. Compounding of the matrix
with filler and compatibilizer (MAPP) was carried out in two steps, one with
constant reinforcing filler and varying compatibilizer to optimize the
percentage of compatibilizer and the other with varying reinforcing filler
percentage, to find the effect of filler content on the bio-composites.
Mechanical, thermal, morphological of both the composites have been
analysed and enumerated. Effect of compatibilizer on the interface has been
evaluated and discussed. Morphological studies have been reported and
discussed.
Chapter 8 enlightens the influence of coffee ground filler and banana
fiber on the biodegradation of polypropylene composites through soil burial
method. Further ASTM D (5338-98) was adopted to study the aerobic
biodegradation under controlled compost conditioning method for both
banana fiber and coffee grounds composite (30wt%). The results were
reported graphically with reference to the positive standard (Cellulose). SEM
analysis reveals the extent of biodegradation.
Chapter 9 presents the comparative summary and conclusions of all
the preceding Chapters.
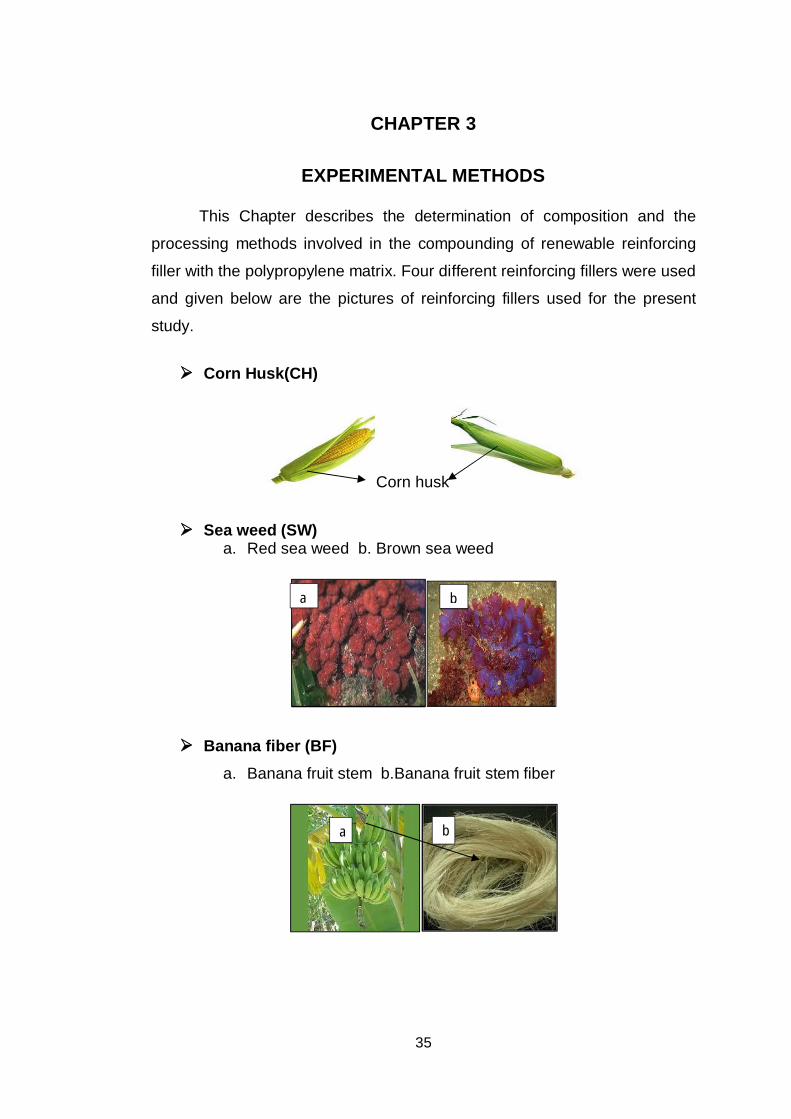
35
CHAPTER 3
EXPERIMENTAL METHODS
This Chapter describes the determination of composition and the
processing methods involved in the compounding of renewable reinforcing
filler with the polypropylene matrix. Four different reinforcing fillers were used
and given below are the pictures of reinforcing fillers used for the present
study.
Corn Husk(CH)
Corn husk
Sea weed (SW) a. Red sea weed b. Brown sea weed
Banana fiber (BF) a. Banana fruit stem b.Banana fruit stem fiber
b a
b a
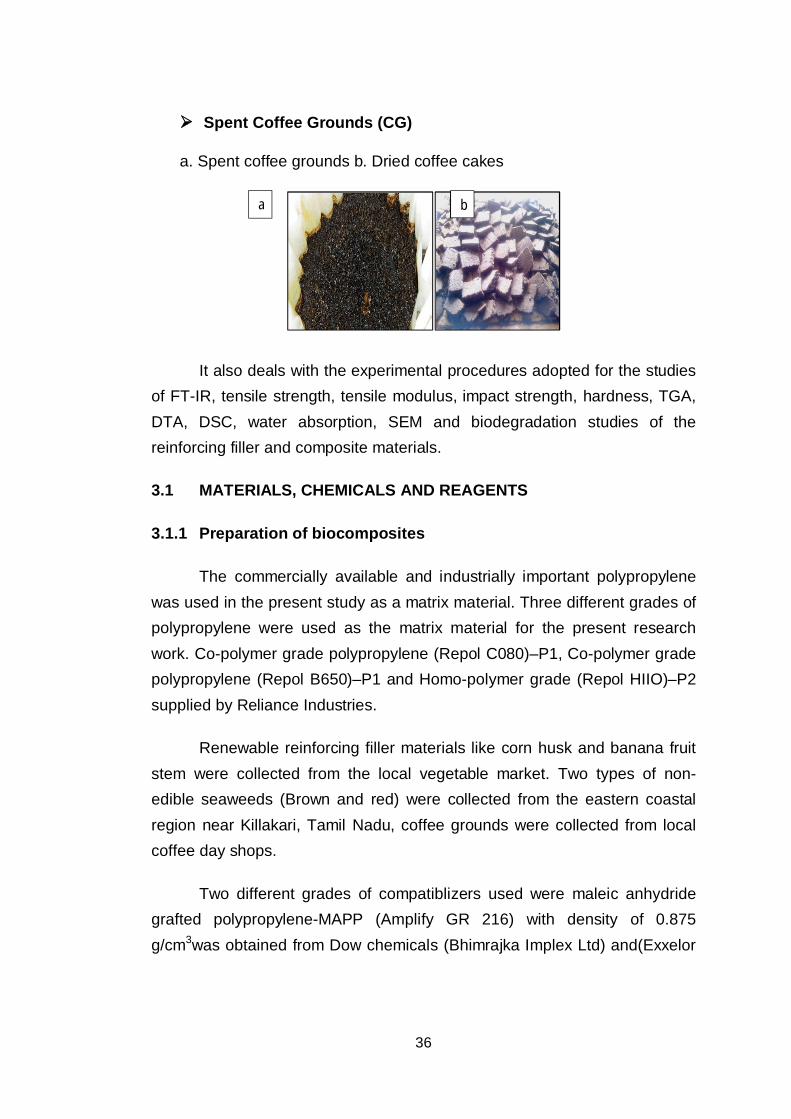
36
Spent Coffee Grounds (CG)
a. Spent coffee grounds b. Dried coffee cakes
It also deals with the experimental procedures adopted for the studies of FT-IR, tensile strength, tensile modulus, impact strength, hardness, TGA, DTA, DSC, water absorption, SEM and biodegradation studies of the reinforcing filler and composite materials.
3.1 MATERIALS, CHEMICALS AND REAGENTS
3.1.1 Preparation of biocomposites
The commercially available and industrially important polypropylene was used in the present study as a matrix material. Three different grades of polypropylene were used as the matrix material for the present research work. Co-polymer grade polypropylene (Repol C080)–P1, Co-polymer grade polypropylene (Repol B650)–P1 and Homo-polymer grade (Repol HIIO)–P2 supplied by Reliance Industries.
Renewable reinforcing filler materials like corn husk and banana fruit stem were collected from the local vegetable market. Two types of non-edible seaweeds (Brown and red) were collected from the eastern coastal region near Killakari, Tamil Nadu, coffee grounds were collected from local coffee day shops.
Two different grades of compatiblizers used were maleic anhydride grafted polypropylene-MAPP (Amplify GR 216) with density of 0.875 g/cm3was obtained from Dow chemicals (Bhimrajka Implex Ltd) and(Exxelor
a b
37
PO1020) with density of 0.9 g/cm3 was supplied by Exxon Mobile India Private Limited.
Sulphuric acid, sodium hydroxide, anhydrous sodium sulphate, copper
sulphate and toluene of analytical grade were supplied by Sigma Aldrich,
ethyl alcohol and petroleum ether were supplied by R.R. scientific chemicals,
Chennai.
3.1.2 Biodegradation Testing (ASTMD5338)
Composting Apparatus
A series of atleast twelve composting vessels (one test substance, one
blank, one positive and one negative control, all in three replicates) of2L of
volume were used.
Water Bath, used to maintain the temperature of the composting
vessels at 58°C.
Pressurized-Air System, to provide CO2-free, water saturated air
to each of the composting vessels.
Carbon dioxide-trapping apparatus for each composting vessel
Three 5000-ml bottles fitted with gas sparging and containing KOH
as carbon-dioxide scrubbing solution.
Flexible Tubing, non-permeable to carbon dioxide.
Stoppers, equipped with gas-sampling parts.
Analytical balance, to weigh test specimen.
100-ml burette, HCl(0.05 N), pH meter, analytical equipment for
measuring dry solids (at 105°C), volatile solids (at 550°C), volatile
fatty acids by aqueous-injection chromatography, total Kjeldahl
nitrogen and carbon concentrations.
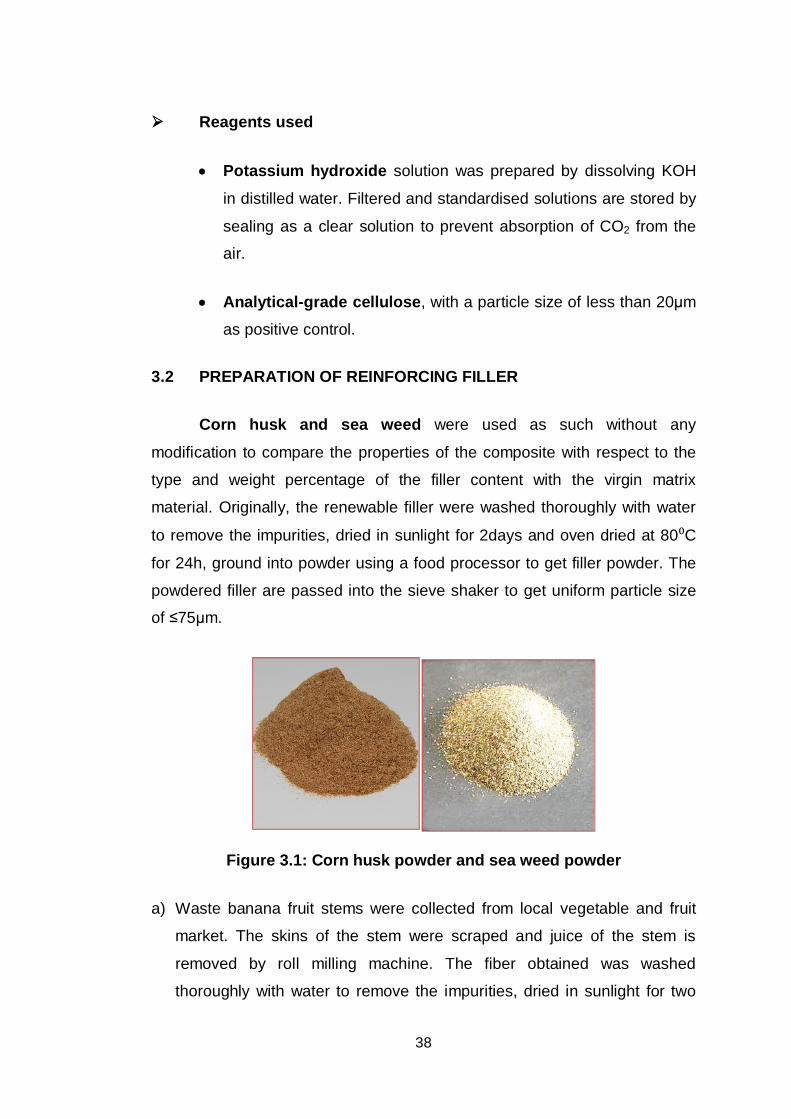
38
Reagents used
Potassium hydroxide solution was prepared by dissolving KOH
in distilled water. Filtered and standardised solutions are stored by
sealing as a clear solution to prevent absorption of CO2 from the
air.
Analytical-grade cellulose, with a particle size of less than 20 m
as positive control.
3.2 PREPARATION OF REINFORCING FILLER
Corn husk and sea weed were used as such without any
modification to compare the properties of the composite with respect to the
type and weight percentage of the filler content with the virgin matrix
material. Originally, the renewable filler were washed thoroughly with water
to remove the impurities, dried in sunlight for 2days and oven dried at 80 C
for 24h, ground into powder using a food processor to get filler powder. The
powdered filler are passed into the sieve shaker to get uniform particle size
of 75 m.
Figure 3.1: Corn husk powder and sea weed powder
a) Waste banana fruit stems were collected from local vegetable and fruit
market. The skins of the stem were scraped and juice of the stem is
removed by roll milling machine. The fiber obtained was washed
thoroughly with water to remove the impurities, dried in sunlight for two
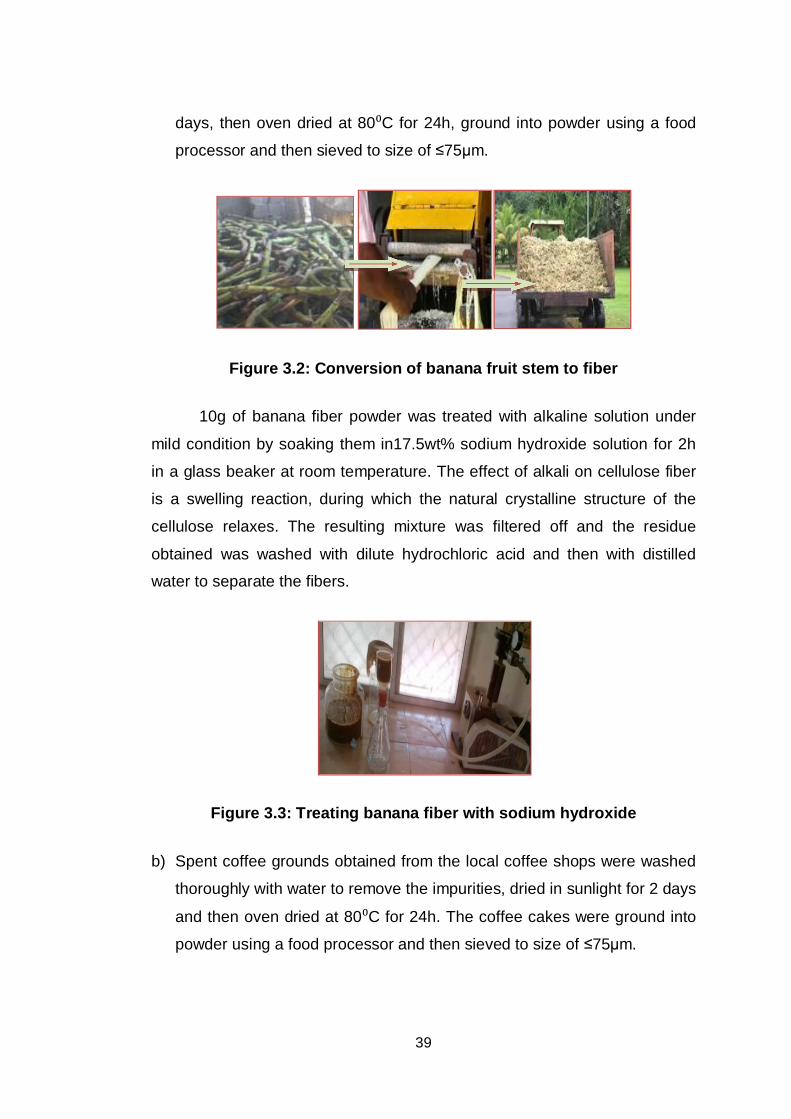
39
days, then oven dried at 80 C for 24h, ground into powder using a food
processor and then sieved to size of 75 m.
Figure 3.2: Conversion of banana fruit stem to fiber
10g of banana fiber powder was treated with alkaline solution under
mild condition by soaking them in17.5wt% sodium hydroxide solution for 2h
in a glass beaker at room temperature. The effect of alkali on cellulose fiber
is a swelling reaction, during which the natural crystalline structure of the
cellulose relaxes. The resulting mixture was filtered off and the residue
obtained was washed with dilute hydrochloric acid and then with distilled
water to separate the fibers.
Figure 3.3: Treating banana fiber with sodium hydroxide
b) Spent coffee grounds obtained from the local coffee shops were washed
thoroughly with water to remove the impurities, dried in sunlight for 2 days
and then oven dried at 80 C for 24h. The coffee cakes were ground into
powder using a food processor and then sieved to size of 75 m.
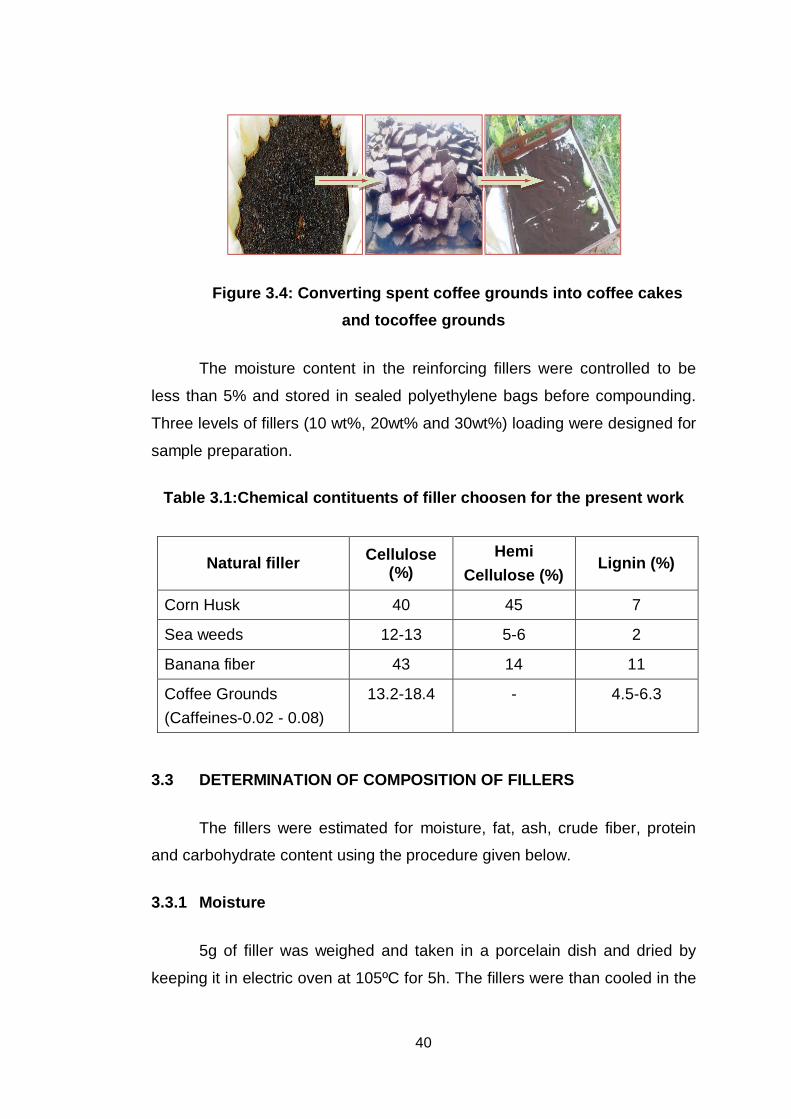
40
Figure 3.4: Converting spent coffee grounds into coffee cakes and tocoffee grounds
The moisture content in the reinforcing fillers were controlled to be
less than 5% and stored in sealed polyethylene bags before compounding.
Three levels of fillers (10 wt%, 20wt% and 30wt%) loading were designed for
sample preparation.
Table 3.1:Chemical contituents of filler choosen for the present work
Natural filler Cellulose (%)
Hemi Cellulose (%)
Lignin (%)
Corn Husk 40 45 7
Sea weeds 12-13 5-6 2
Banana fiber 43 14 11
Coffee Grounds (Caffeines-0.02 - 0.08)
13.2-18.4 - 4.5-6.3
3.3 DETERMINATION OF COMPOSITION OF FILLERS
The fillers were estimated for moisture, fat, ash, crude fiber, protein
and carbohydrate content using the procedure given below.
3.3.1 Moisture
5g of filler was weighed and taken in a porcelain dish and dried by
keeping it in electric oven at 105ºC for 5h. The fillers were than cooled in the
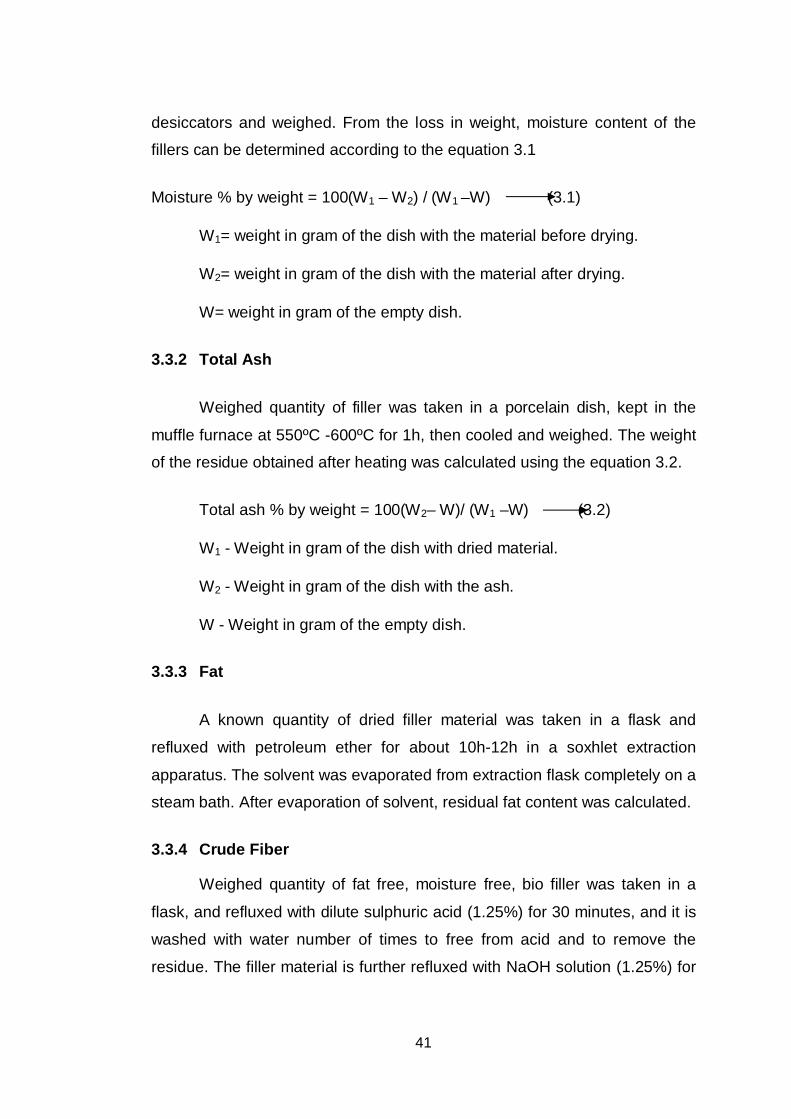
41
desiccators and weighed. From the loss in weight, moisture content of the
fillers can be determined according to the equation 3.1
Moisture % by weight = 100(W1 – W2) / (W1 –W) (3.1)
W1= weight in gram of the dish with the material before drying.
W2= weight in gram of the dish with the material after drying.
W= weight in gram of the empty dish.
3.3.2 Total Ash
Weighed quantity of filler was taken in a porcelain dish, kept in the
muffle furnace at 550ºC -600ºC for 1h, then cooled and weighed. The weight
of the residue obtained after heating was calculated using the equation 3.2.
Total ash % by weight = 100(W2– W)/ (W1 –W) (3.2)
W1 - Weight in gram of the dish with dried material.
W2 - Weight in gram of the dish with the ash.
W - Weight in gram of the empty dish.
3.3.3 Fat
A known quantity of dried filler material was taken in a flask and
refluxed with petroleum ether for about 10h-12h in a soxhlet extraction
apparatus. The solvent was evaporated from extraction flask completely on a
steam bath. After evaporation of solvent, residual fat content was calculated.
3.3.4 Crude Fiber
Weighed quantity of fat free, moisture free, bio filler was taken in a
flask, and refluxed with dilute sulphuric acid (1.25%) for 30 minutes, and it is
washed with water number of times to free from acid and to remove the
residue. The filler material is further refluxed with NaOH solution (1.25%) for
42
30 minutes then washed with water and ethyl alcohol and dried in an air
oven. It is kept in the muffle furnace at 600ºC till all the organic matter is
burnt. Weight loss gives the crude fiber content.
Crude fiber = 10,000(W1 –W2)/ W(100 – M) (3.3)
W- Weight of the filler
W2- Loss in the muffle furnace
W1- Weight of the crucible residue with material
M - Moisture, percent by weight, in the material.
3.3.5 Protein
In a round bottomed flask, 0.25gm of material, 10gm of anhydrous
sodium sulphate, 0.2gm-0.3gm copper sulphate and 20ml of concentrated
sulphuric acid are added and heated for 30min. Protein present in it will be
converted into ammonia with the acid present. The excess acid was then
titrated against standard sodium hydroxide with few drops of methyl red
indicator.
Total protein % by weight = 875(B-A)N / W(100-N) (3.4)
Where,
B - Volume in ml of the standard NaOH solution used to neutralize
the acid in the blank determination
A - Volume in ml of the standard NaOH solution used toneutralize
excess of acid in the test with the material.
N - Normality of the standard NaOH solution
W - Weight in gram of the material taken for the test.
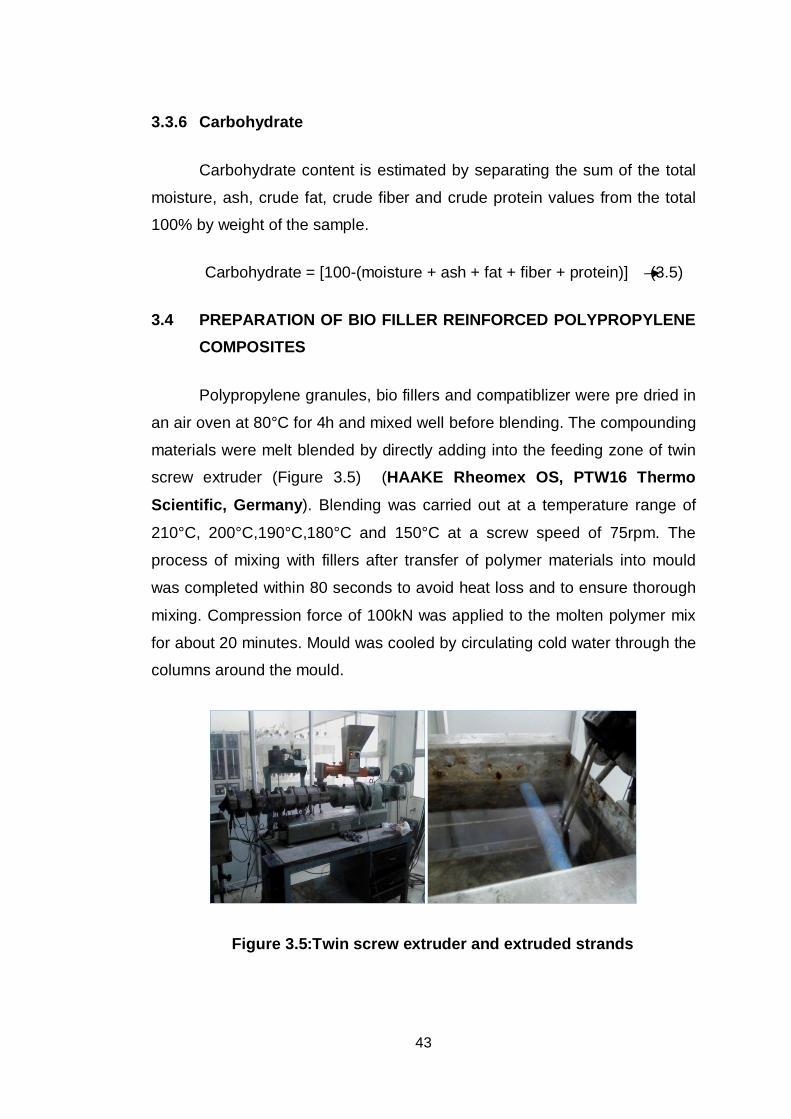
43
3.3.6 Carbohydrate
Carbohydrate content is estimated by separating the sum of the total
moisture, ash, crude fat, crude fiber and crude protein values from the total
100% by weight of the sample.
Carbohydrate = [100-(moisture + ash + fat + fiber + protein)] (3.5)
3.4 PREPARATION OF BIO FILLER REINFORCED POLYPROPYLENE COMPOSITES
Polypropylene granules, bio fillers and compatiblizer were pre dried in
an air oven at 80°C for 4h and mixed well before blending. The compounding
materials were melt blended by directly adding into the feeding zone of twin
screw extruder (Figure 3.5) (HAAKE Rheomex OS, PTW16 Thermo
Scientific, Germany). Blending was carried out at a temperature range of
210°C, 200°C,190°C,180°C and 150°C at a screw speed of 75rpm. The
process of mixing with fillers after transfer of polymer materials into mould
was completed within 80 seconds to avoid heat loss and to ensure thorough
mixing. Compression force of 100kN was applied to the molten polymer mix
for about 20 minutes. Mould was cooled by circulating cold water through the
columns around the mould.
Figure 3.5:Twin screw extruder and extruded strands
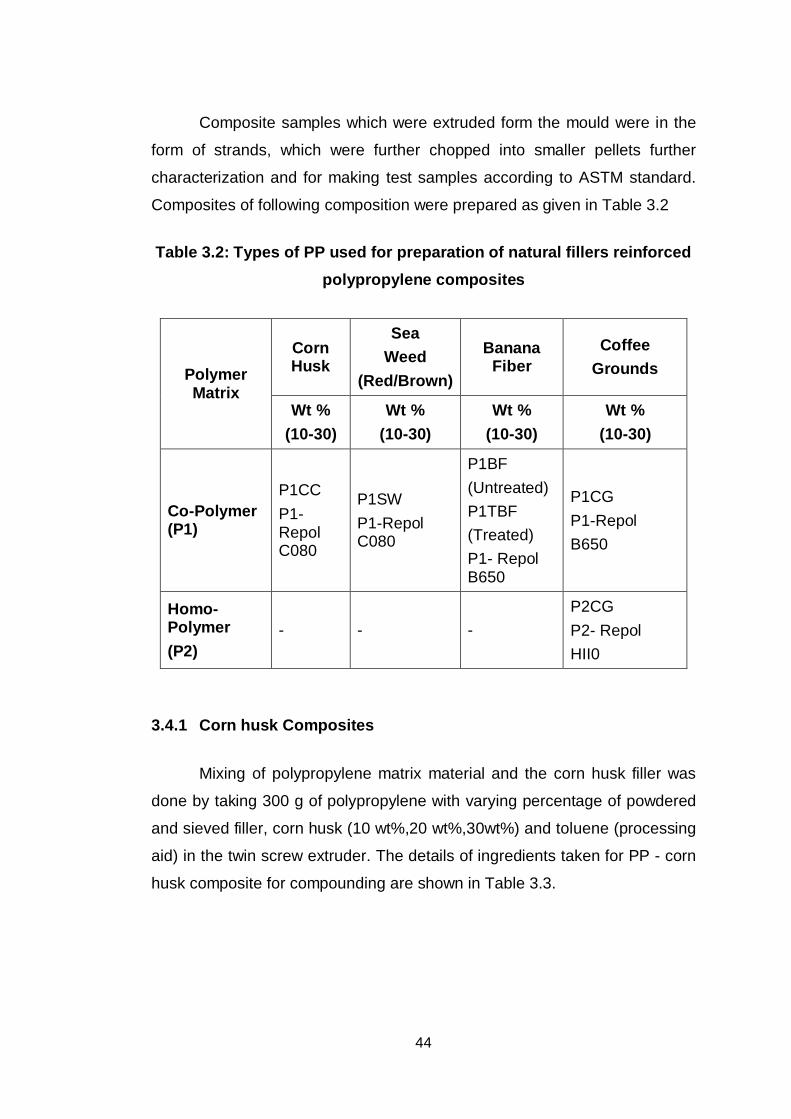
44
Composite samples which were extruded form the mould were in the
form of strands, which were further chopped into smaller pellets further
characterization and for making test samples according to ASTM standard.
Composites of following composition were prepared as given in Table 3.2
Table 3.2: Types of PP used for preparation of natural fillers reinforced polypropylene composites
Polymer Matrix
Corn Husk
Sea Weed
(Red/Brown)
Banana Fiber
Coffee Grounds
Wt % (10-30)
Wt % (10-30)
Wt % (10-30)
Wt % (10-30)
Co-Polymer (P1)
P1CC P1-Repol C080
P1SW P1-Repol C080
P1BF (Untreated) P1TBF (Treated) P1- Repol B650
P1CG P1-Repol B650
Homo-Polymer (P2)
- - - P2CG P2- Repol HII0
3.4.1 Corn husk Composites
Mixing of polypropylene matrix material and the corn husk filler was
done by taking 300 g of polypropylene with varying percentage of powdered
and sieved filler, corn husk (10 wt%,20 wt%,30wt%) and toluene (processing
aid) in the twin screw extruder. The details of ingredients taken for PP - corn
husk composite for compounding are shown in Table 3.3.
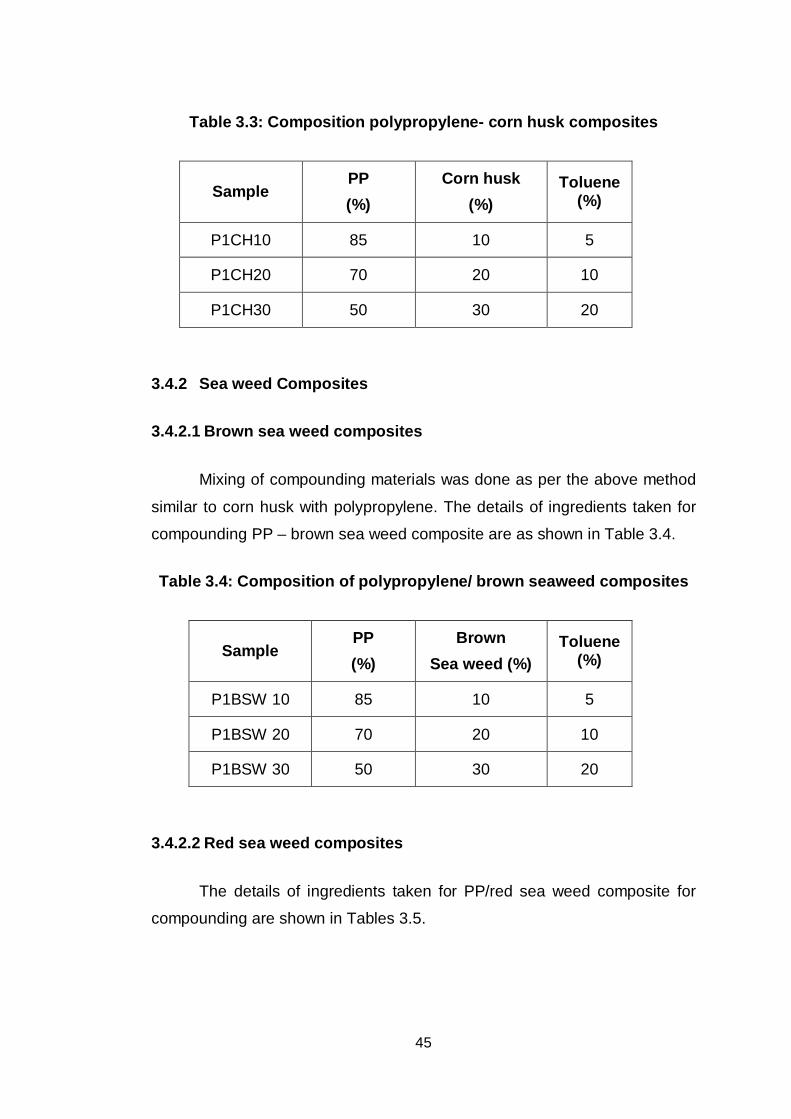
45
Table 3.3: Composition polypropylene- corn husk composites
Sample PP (%)
Corn husk (%)
Toluene (%)
P1CH10 85 10 5
P1CH20 70 20 10
P1CH30 50 30 20
3.4.2 Sea weed Composites
3.4.2.1 Brown sea weed composites
Mixing of compounding materials was done as per the above method
similar to corn husk with polypropylene. The details of ingredients taken for
compounding PP – brown sea weed composite are as shown in Table 3.4.
Table 3.4: Composition of polypropylene/ brown seaweed composites
Sample PP (%)
Brown Sea weed (%)
Toluene (%)
P1BSW 10 85 10 5
P1BSW 20 70 20 10
P1BSW 30 50 30 20
3.4.2.2 Red sea weed composites
The details of ingredients taken for PP/red sea weed composite for
compounding are shown in Tables 3.5.
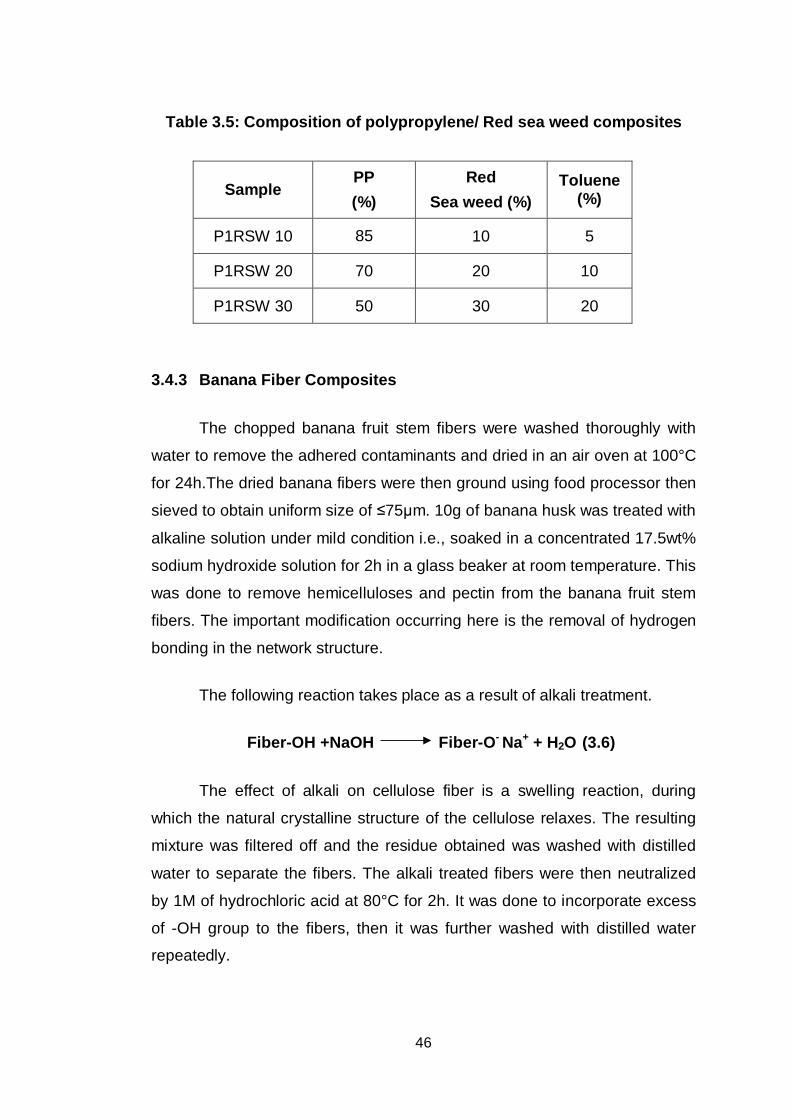
46
Table 3.5: Composition of polypropylene/ Red sea weed composites
Sample PP (%)
Red Sea weed (%)
Toluene (%)
P1RSW 10 85 10 5
P1RSW 20 70 20 10
P1RSW 30 50 30 20
3.4.3 Banana Fiber Composites
The chopped banana fruit stem fibers were washed thoroughly with
water to remove the adhered contaminants and dried in an air oven at 100°C
for 24h.The dried banana fibers were then ground using food processor then
sieved to obtain uniform size of 75 m. 10g of banana husk was treated with
alkaline solution under mild condition i.e., soaked in a concentrated 17.5wt%
sodium hydroxide solution for 2h in a glass beaker at room temperature. This
was done to remove hemicelluloses and pectin from the banana fruit stem
fibers. The important modification occurring here is the removal of hydrogen
bonding in the network structure.
The following reaction takes place as a result of alkali treatment.
Fiber-OH +NaOH Fiber-O- Na+ + H2O (3.6)
The effect of alkali on cellulose fiber is a swelling reaction, during
which the natural crystalline structure of the cellulose relaxes. The resulting
mixture was filtered off and the residue obtained was washed with distilled
water to separate the fibers. The alkali treated fibers were then neutralized
by 1M of hydrochloric acid at 80°C for 2h. It was done to incorporate excess
of -OH group to the fibers, then it was further washed with distilled water
repeatedly.
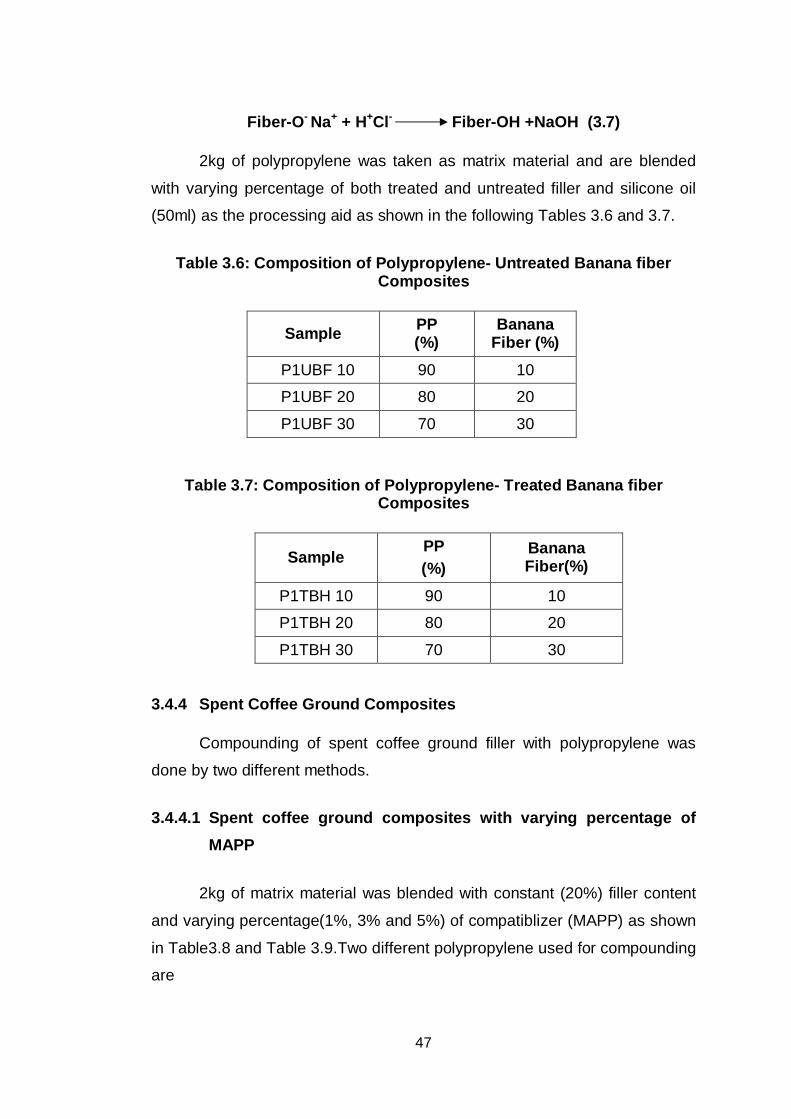
47
Fiber-O- Na+ + H+Cl- Fiber-OH +NaOH (3.7)
2kg of polypropylene was taken as matrix material and are blended
with varying percentage of both treated and untreated filler and silicone oil
(50ml) as the processing aid as shown in the following Tables 3.6 and 3.7.
Table 3.6: Composition of Polypropylene- Untreated Banana fiber Composites
Sample PP (%)
Banana Fiber (%)
P1UBF 10 90 10
P1UBF 20 80 20
P1UBF 30 70 30
Table 3.7: Composition of Polypropylene- Treated Banana fiber Composites
Sample PP (%)
Banana Fiber(%)
P1TBH 10 90 10
P1TBH 20 80 20
P1TBH 30 70 30
3.4.4 Spent Coffee Ground Composites
Compounding of spent coffee ground filler with polypropylene was
done by two different methods.
3.4.4.1 Spent coffee ground composites with varying percentage of MAPP
2kg of matrix material was blended with constant (20%) filler content
and varying percentage(1%, 3% and 5%) of compatiblizer (MAPP) as shown
in Table3.8 and Table 3.9.Two different polypropylene used for compounding
are
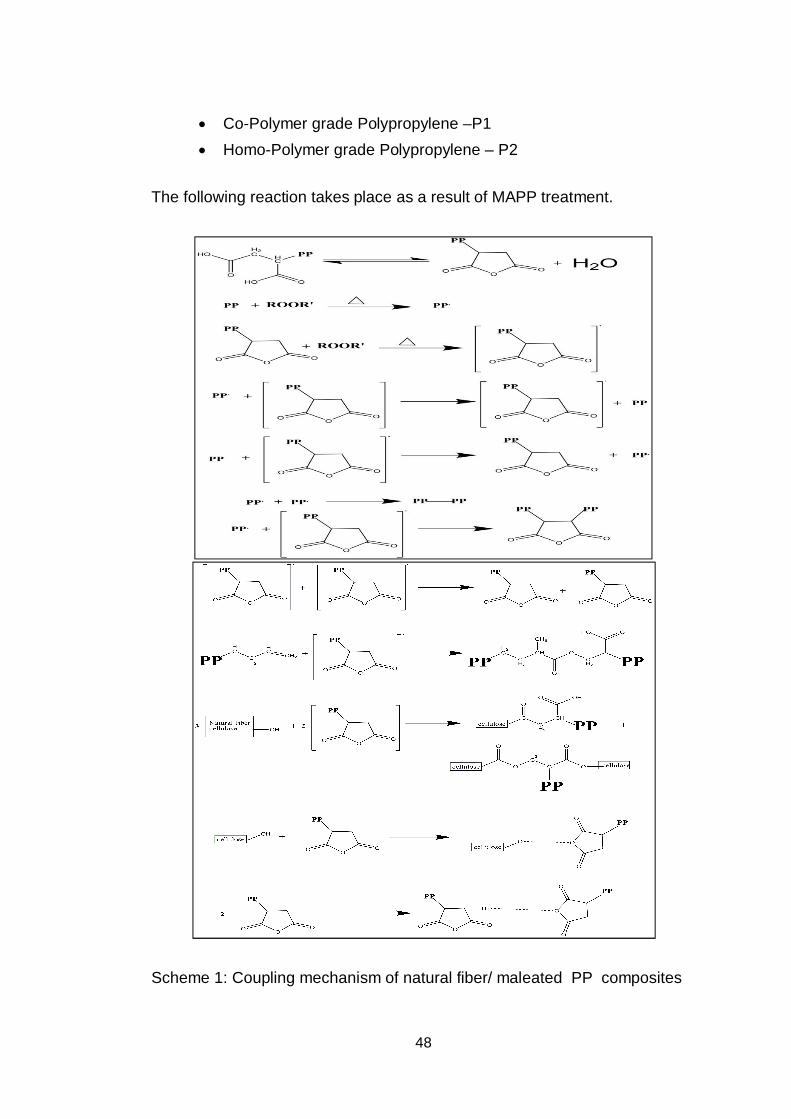
48
Co-Polymer grade Polypropylene –P1 Homo-Polymer grade Polypropylene – P2
The following reaction takes place as a result of MAPP treatment.
Scheme 1: Coupling mechanism of natural fiber/ maleated PP composites
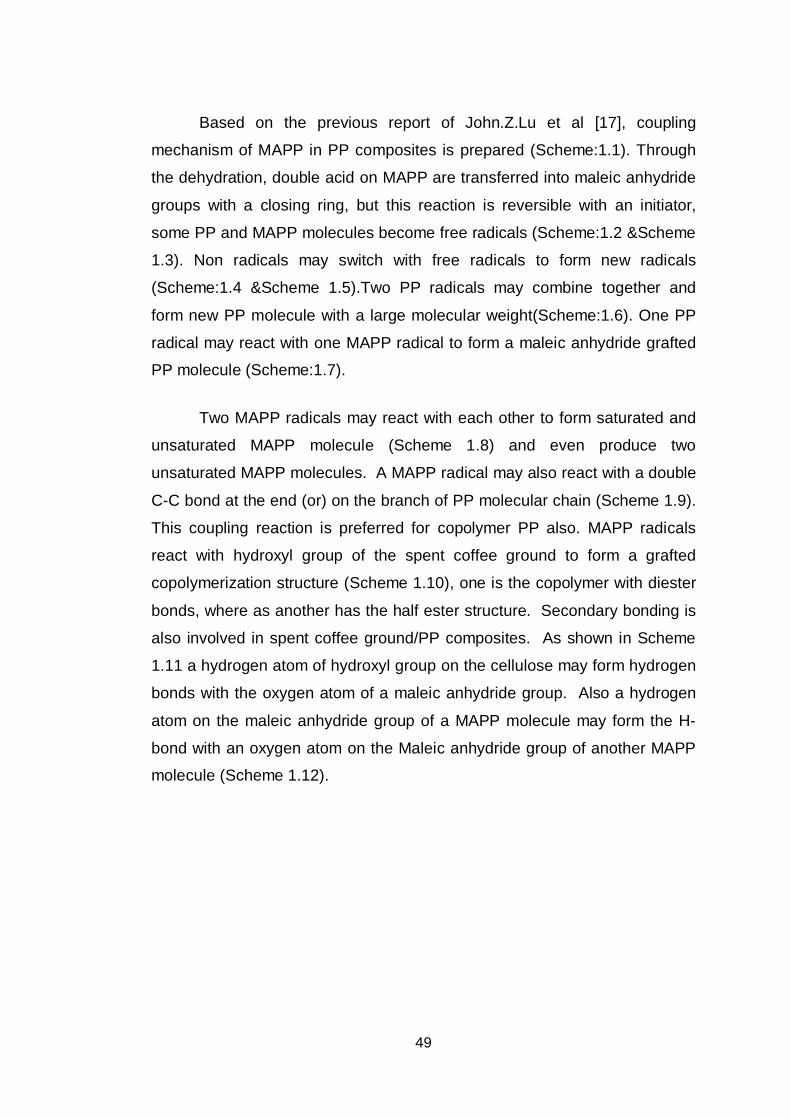
49
Based on the previous report of John.Z.Lu et al [17], coupling
mechanism of MAPP in PP composites is prepared (Scheme:1.1). Through
the dehydration, double acid on MAPP are transferred into maleic anhydride
groups with a closing ring, but this reaction is reversible with an initiator,
some PP and MAPP molecules become free radicals (Scheme:1.2 &Scheme
1.3). Non radicals may switch with free radicals to form new radicals
(Scheme:1.4 &Scheme 1.5).Two PP radicals may combine together and
form new PP molecule with a large molecular weight(Scheme:1.6). One PP
radical may react with one MAPP radical to form a maleic anhydride grafted
PP molecule (Scheme:1.7).
Two MAPP radicals may react with each other to form saturated and
unsaturated MAPP molecule (Scheme 1.8) and even produce two
unsaturated MAPP molecules. A MAPP radical may also react with a double
C-C bond at the end (or) on the branch of PP molecular chain (Scheme 1.9).
This coupling reaction is preferred for copolymer PP also. MAPP radicals
react with hydroxyl group of the spent coffee ground to form a grafted
copolymerization structure (Scheme 1.10), one is the copolymer with diester
bonds, where as another has the half ester structure. Secondary bonding is
also involved in spent coffee ground/PP composites. As shown in Scheme
1.11 a hydrogen atom of hydroxyl group on the cellulose may form hydrogen
bonds with the oxygen atom of a maleic anhydride group. Also a hydrogen
atom on the maleic anhydride group of a MAPP molecule may form the H-
bond with an oxygen atom on the Maleic anhydride group of another MAPP
molecule (Scheme 1.12).
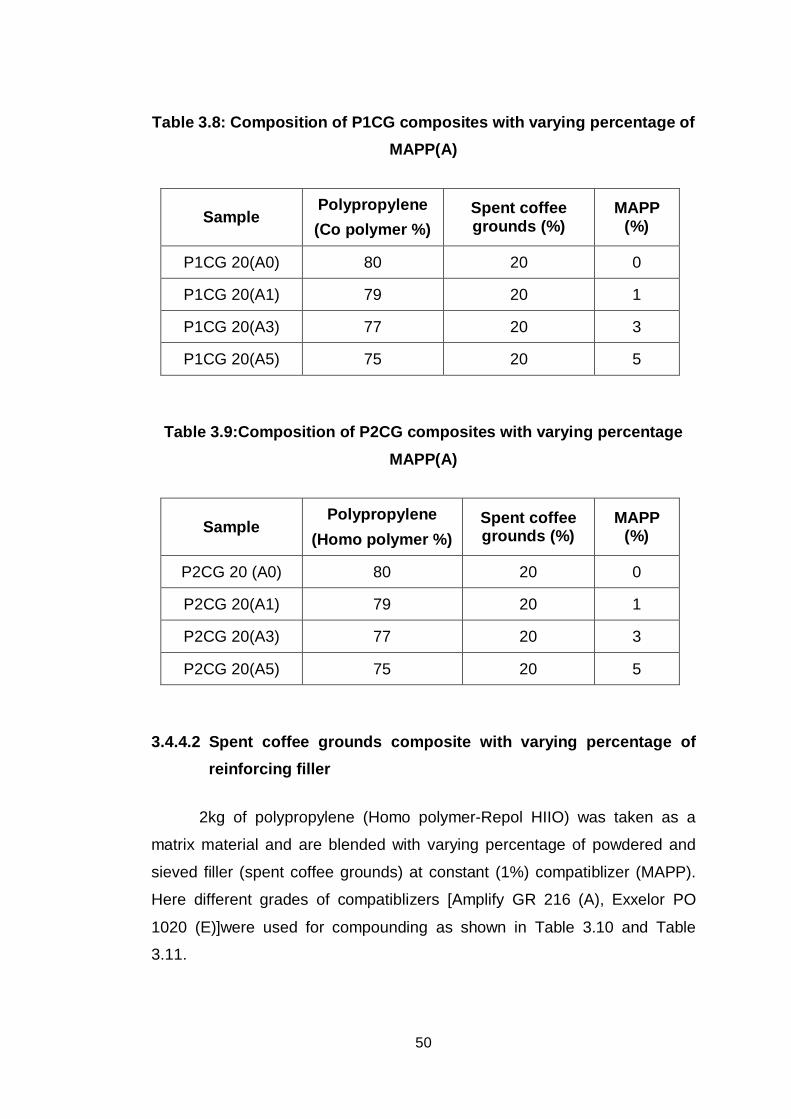
50
Table 3.8: Composition of P1CG composites with varying percentage of MAPP(A)
Sample Polypropylene (Co polymer %)
Spent coffee grounds (%)
MAPP (%)
P1CG 20(A0) 80 20 0
P1CG 20(A1) 79 20 1
P1CG 20(A3) 77 20 3
P1CG 20(A5) 75 20 5
Table 3.9:Composition of P2CG composites with varying percentage MAPP(A)
Sample Polypropylene
(Homo polymer %) Spent coffee grounds (%)
MAPP (%)
P2CG 20 (A0) 80 20 0
P2CG 20(A1) 79 20 1
P2CG 20(A3) 77 20 3
P2CG 20(A5) 75 20 5
3.4.4.2 Spent coffee grounds composite with varying percentage of reinforcing filler
2kg of polypropylene (Homo polymer-Repol HIIO) was taken as a
matrix material and are blended with varying percentage of powdered and
sieved filler (spent coffee grounds) at constant (1%) compatiblizer (MAPP).
Here different grades of compatiblizers [Amplify GR 216 (A), Exxelor PO
1020 (E)]were used for compounding as shown in Table 3.10 and Table
3.11.
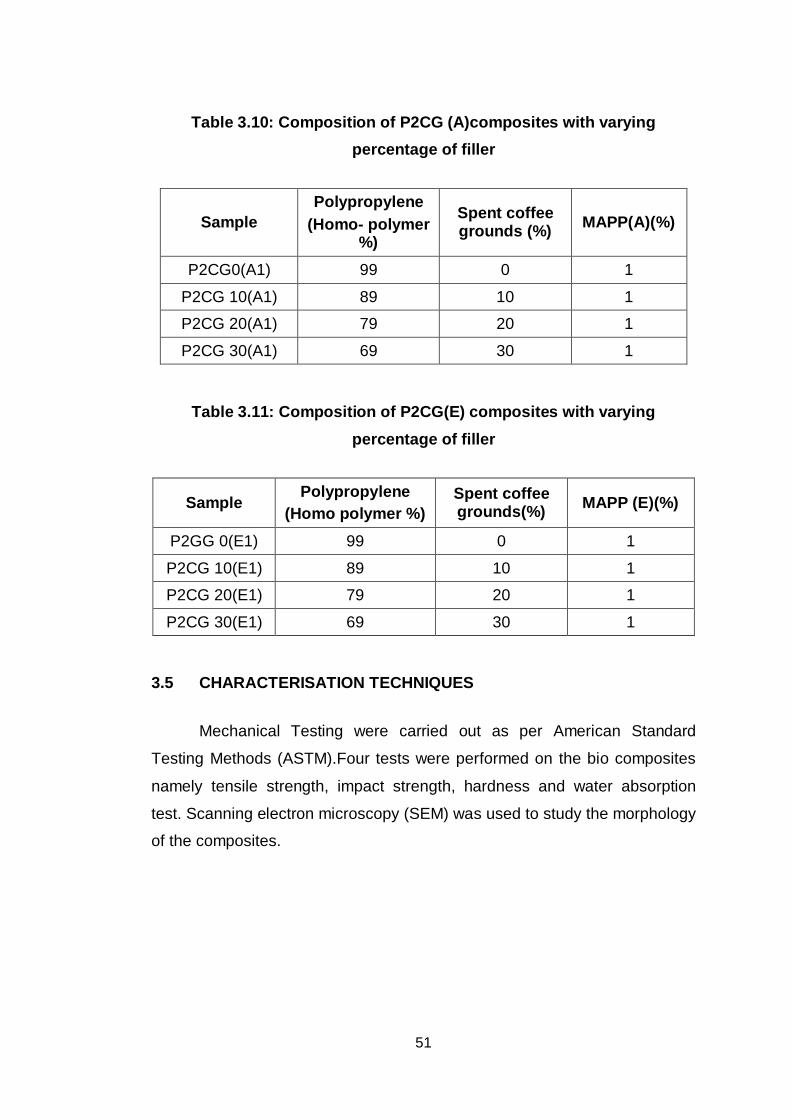
51
Table 3.10: Composition of P2CG (A)composites with varying percentage of filler
Sample Polypropylene
(Homo- polymer %)
Spent coffee grounds (%) MAPP(A)(%)
P2CG0(A1) 99 0 1
P2CG 10(A1) 89 10 1
P2CG 20(A1) 79 20 1
P2CG 30(A1) 69 30 1
Table 3.11: Composition of P2CG(E) composites with varying percentage of filler
Sample Polypropylene
(Homo polymer %) Spent coffee grounds(%) MAPP (E)(%)
P2GG 0(E1) 99 0 1
P2CG 10(E1) 89 10 1
P2CG 20(E1) 79 20 1
P2CG 30(E1) 69 30 1
3.5 CHARACTERISATION TECHNIQUES
Mechanical Testing were carried out as per American Standard
Testing Methods (ASTM).Four tests were performed on the bio composites
namely tensile strength, impact strength, hardness and water absorption
test. Scanning electron microscopy (SEM) was used to study the morphology
of the composites.
52
3.5.1 Sample Preparation
Allthe composite samples used for testing mechanical properties were
machined into shape by grinding machine according to the ASTMstandards
and the cut edges were made smooth using sand paper to have a control on
the specimen dimension.
3.5.2 Conditioning
The test specimens were conditioned at 23±2°C and 50±5% relative
humidity for 40h prior to the testing.
3.5.3 Mechanical Properties
3.5.3.1 Tensile Properties
Tensile strength is a measurement of the ability of a material to
withstand forces that tend to pull it apart and to what extent the material
stretches before breaking. Tensile modulus, an indication of the relative
stiffness of a material, can be determined from a stress-strain diagram.
Tensile properties were studied as per ASTM-D 3039 using Instron testing
machine (Model 6025 UK), at 10 mm/minute cross-head speed, using
specimen with a width of 25 mm, length of 200mm and thickness of 3mm.A
distance of 115mm is kept in between the grips. Five specimens were tested
for each sample.
TENSILE STRENGTH
Tensile strength or tenacity is the stress at the breaking point of the
test specimen. Tensile strength is obtained from the experimental data using
equation (3.8)
Tensile strength = Load at break / Original cross-sectional area
= L / b×D --------------- (3.8)
Where L = the load applied in N,
53
b = the width in mm and
D =the thickness in mm.
TENSILE MODULUS
Tensile modulus is given by equation (3.9)
Tensile Modulus = Tensile stress/Tensile strain
= Difference in load (N)/Difference in extension (mm)
= P/ ------------------ (3.9)
3.5.3.2 Impact Strength
The unnotched Izod impact strength of each sample was tested as per
ASTM D 256-88.All the samples were tested as unnotched so that they
would be more sensitive to the transition between ductility and brittleness.
Specimens, having thickness 3.2 mm with 10mm cross-section and 64 mm
long were clamped in the base of the pendulum testing machine so that they
were cantilevered upward. The pendulum was released and the force
consumed in breaking the sample was calculated.
3.5.3.3 Hardness
Hardness of the composite material was measured using durometer-
type D as per ASTM D2240 specimen with 3mm thickness. The surface of
the specimen was flat over sufficient area to permit pressure foot to contact
the specimen over an area having 6mm radius for the indenter point. The
specimen was placed on a hard horizontal surface. The durometer was held
in a position in the point of indenter atleast 12 mm from any edge of the
specimen. The durometer had a pointed indenter projecting below the base
of the pressure foot. The indenter was pressed into the plastic specimen, so
that the base rests on the plastic materials surface and the amount of
54
indentation was registered directly on the dial indicator. Hardness was
determined at five different positions on the specimen at least 6mm apart
and arithmetic mean was taken.
3.5.3.4 Water absorption Properties
Water absorption property was determined by swelling the samples in
distilled water for 48h at 30°C.The sample dimension was 10×10×3 mmThe
percentage of water absorbed by the specimen is calculated using equation
(3.7).
% of water absorption= (W2-W1) × 100/W1 -------------- (3.7)
Where, W1is the initial weight of the sample and W2 is the weight of
the sample after immersion in water for different time intervals(2h,24h168h
and 480h) at 30°C.
3.5.4 Thermal Properties
3.5.4.1 Thermo Gravimetic Analysis (TGA)
Analyses were performed on a Netzsch STA 409 thermogravimetric
analyzer. The instrument was calibrated with calcium oxalate and aluminium
supplied by Netzsch. The samples (about 50mg) were heated from ambient
temperature to 800 °C under a continuous flow of nitrogen or air (60 ml/min),
at 10°C/min. The thermal degradation temperature was taken as the
midpoint temperature at which 50% weight loss occurred.
3.5.4.2 DIFFERENTIAL SCANNING CALORIMERY (DSC)
The DSC was performed on a Netzsch DSC-200 differential scanning
calorimeter. The instrument was calibrated with indium supplied by Netzsch.
Measurements were performed under a continuous flow of nitrogen (60
ml/min).All samples (about 10mg in weight) were heated from ambient to
400°C and the thermograms were recorded at a heating rate of 10 °C/min.
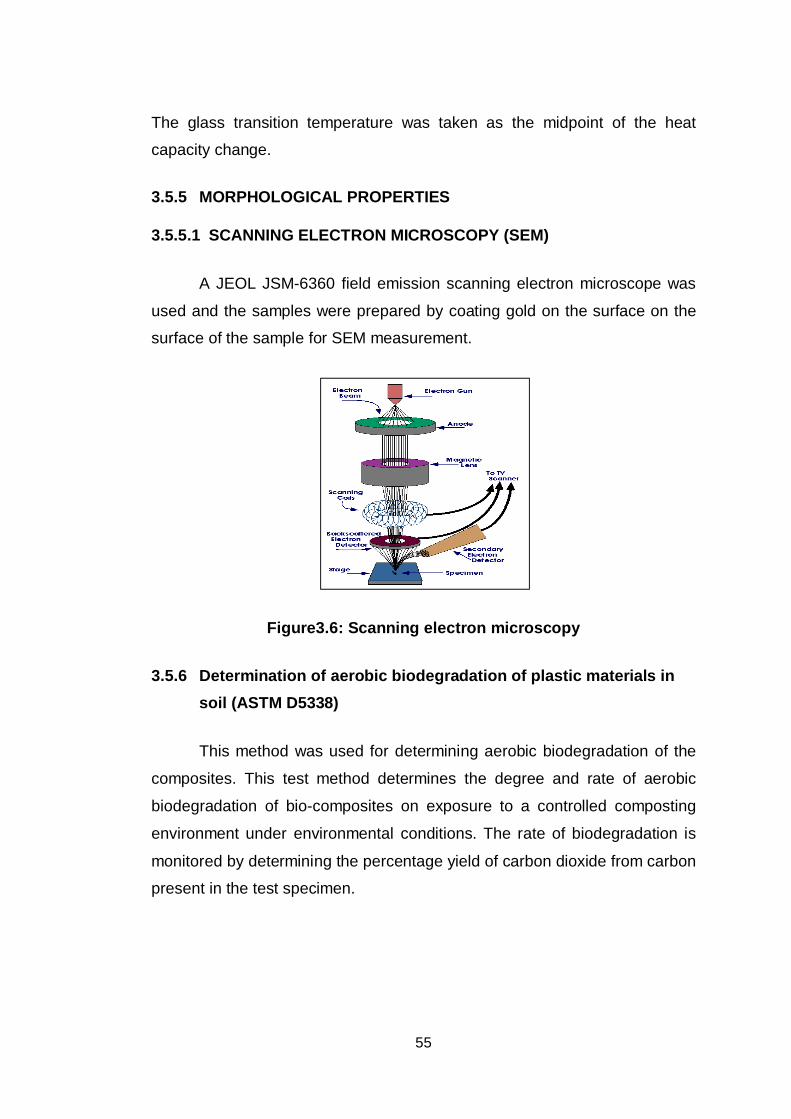
55
The glass transition temperature was taken as the midpoint of the heat
capacity change.
3.5.5 MORPHOLOGICAL PROPERTIES
3.5.5.1 SCANNING ELECTRON MICROSCOPY (SEM)
A JEOL JSM-6360 field emission scanning electron microscope was
used and the samples were prepared by coating gold on the surface on the
surface of the sample for SEM measurement.
Figure3.6: Scanning electron microscopy
3.5.6 Determination of aerobic biodegradation of plastic materials in soil (ASTM D5338)
This method was used for determining aerobic biodegradation of the
composites. This test method determines the degree and rate of aerobic
biodegradation of bio-composites on exposure to a controlled composting
environment under environmental conditions. The rate of biodegradation is
monitored by determining the percentage yield of carbon dioxide from carbon
present in the test specimen.
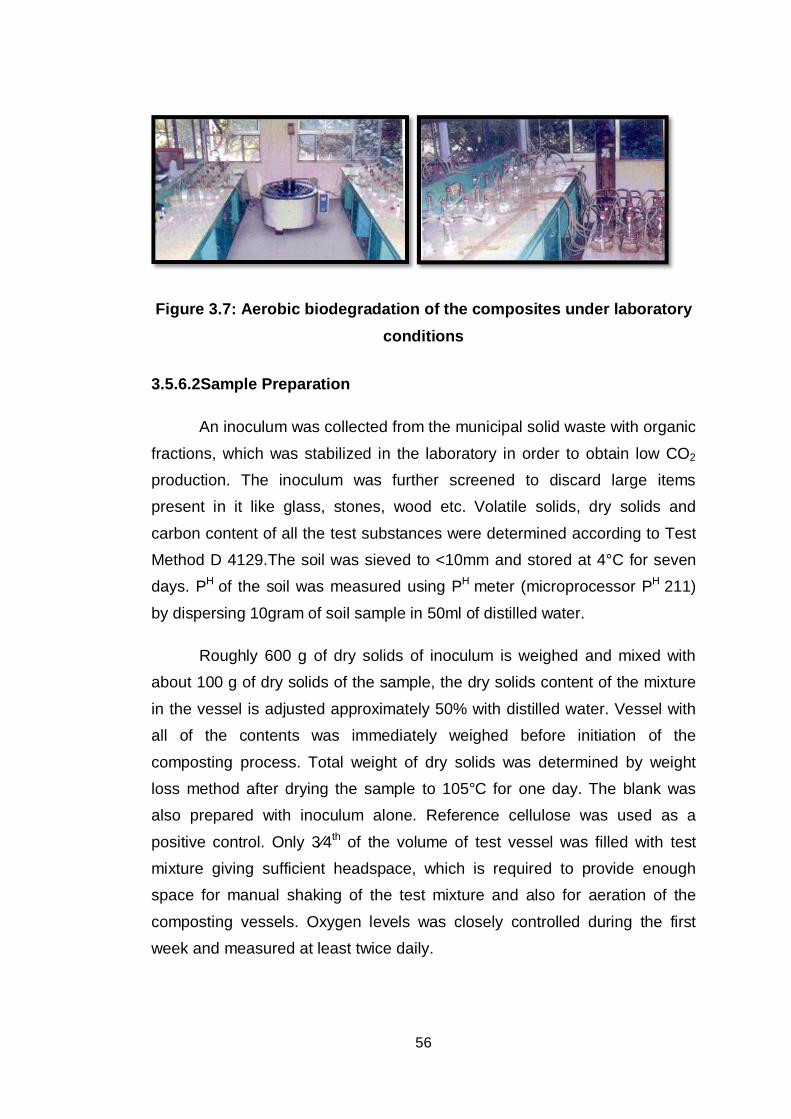
56
Figure 3.7: Aerobic biodegradation of the composites under laboratory conditions
3.5.6.2Sample Preparation
An inoculum was collected from the municipal solid waste with organic
fractions, which was stabilized in the laboratory in order to obtain low CO2
production. The inoculum was further screened to discard large items present in it like glass, stones, wood etc. Volatile solids, dry solids and
carbon content of all the test substances were determined according to Test Method D 4129.The soil was sieved to <10mm and stored at 4°C for seven days. PH of the soil was measured using PH meter (microprocessor PH 211)
by dispersing 10gram of soil sample in 50ml of distilled water.
Roughly 600 g of dry solids of inoculum is weighed and mixed with about 100 g of dry solids of the sample, the dry solids content of the mixture
in the vessel is adjusted approximately 50% with distilled water. Vessel with all of the contents was immediately weighed before initiation of the
composting process. Total weight of dry solids was determined by weight loss method after drying the sample to 105°C for one day. The blank was also prepared with inoculum alone. Reference cellulose was used as a
positive control. Only 3 4th of the volume of test vessel was filled with test mixture giving sufficient headspace, which is required to provide enough space for manual shaking of the test mixture and also for aeration of the
composting vessels. Oxygen levels was closely controlled during the first week and measured at least twice daily.
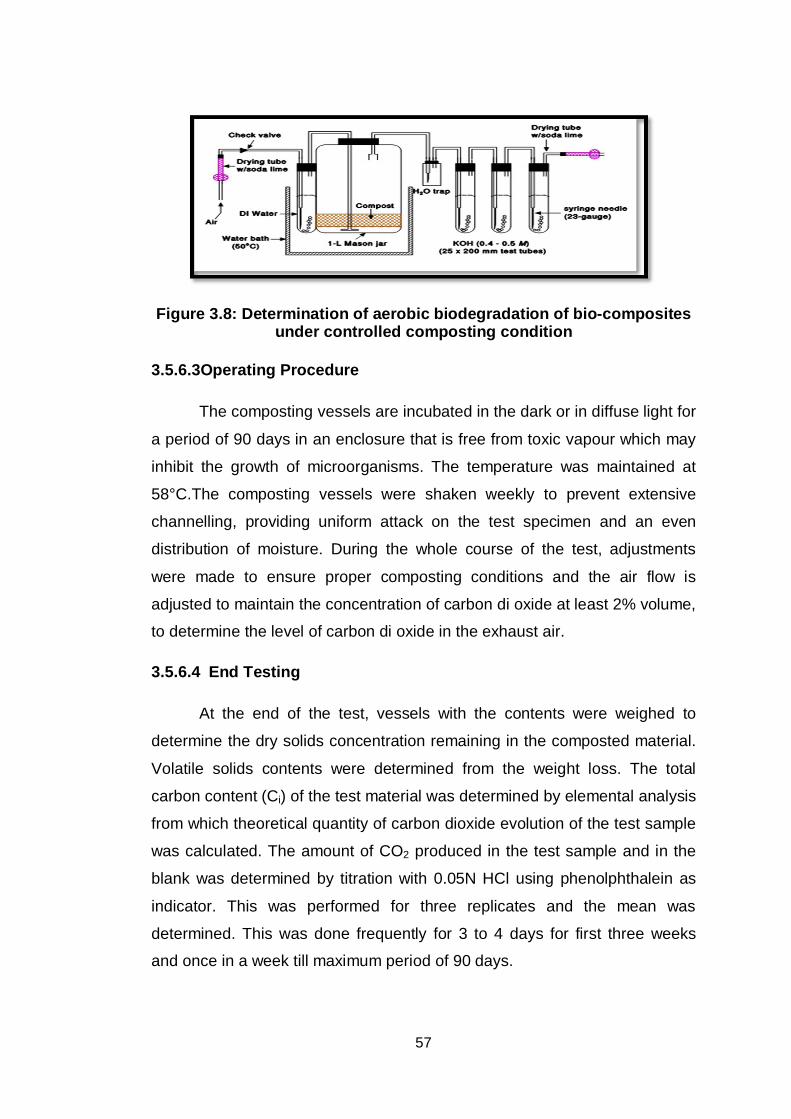
57
Figure 3.8: Determination of aerobic biodegradation of bio-composites under controlled composting condition
3.5.6.3Operating Procedure
The composting vessels are incubated in the dark or in diffuse light for
a period of 90 days in an enclosure that is free from toxic vapour which may
inhibit the growth of microorganisms. The temperature was maintained at
58°C.The composting vessels were shaken weekly to prevent extensive
channelling, providing uniform attack on the test specimen and an even
distribution of moisture. During the whole course of the test, adjustments
were made to ensure proper composting conditions and the air flow is
adjusted to maintain the concentration of carbon di oxide at least 2% volume,
to determine the level of carbon di oxide in the exhaust air.
3.5.6.4 End Testing
At the end of the test, vessels with the contents were weighed to
determine the dry solids concentration remaining in the composted material.
Volatile solids contents were determined from the weight loss. The total
carbon content (Ci) of the test material was determined by elemental analysis
from which theoretical quantity of carbon dioxide evolution of the test sample
was calculated. The amount of CO2 produced in the test sample and in the
blank was determined by titration with 0.05N HCl using phenolphthalein as
indicator. This was performed for three replicates and the mean was
determined. This was done frequently for 3 to 4 days for first three weeks
and once in a week till maximum period of 90 days.
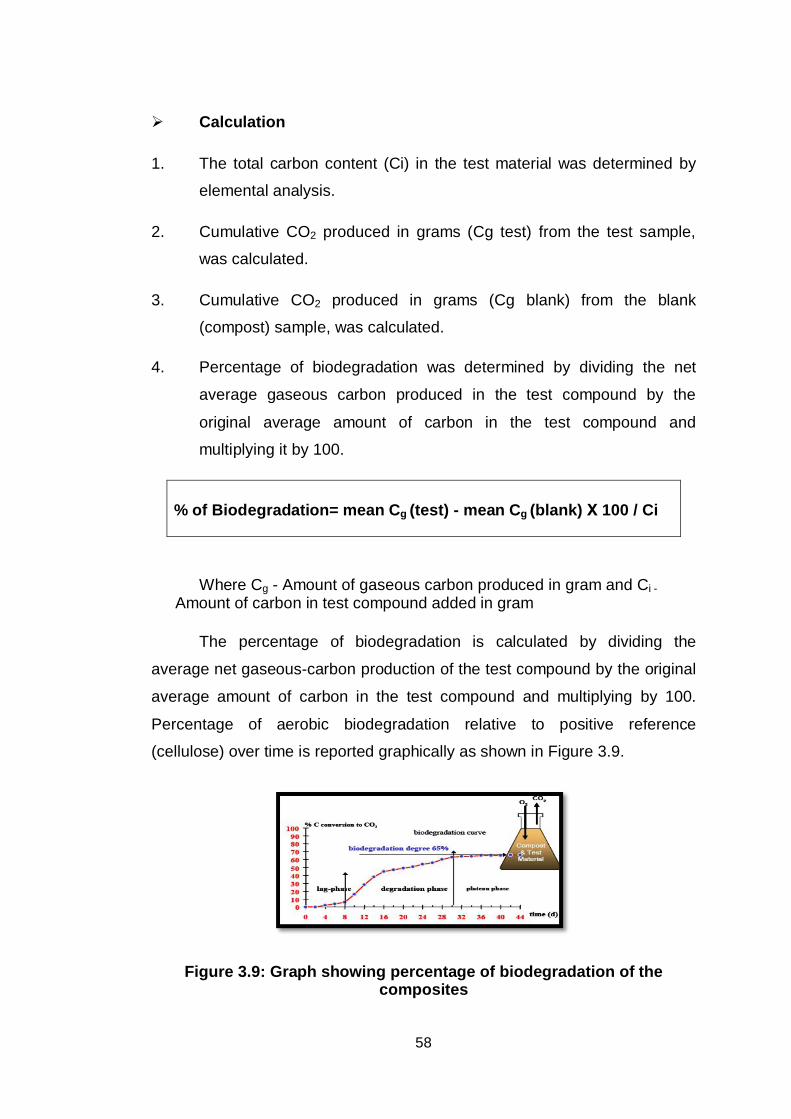
58
Calculation
1. The total carbon content (Ci) in the test material was determined by
elemental analysis.
2. Cumulative CO2 produced in grams (Cg test) from the test sample,
was calculated.
3. Cumulative CO2 produced in grams (Cg blank) from the blank
(compost) sample, was calculated.
4. Percentage of biodegradation was determined by dividing the net
average gaseous carbon produced in the test compound by the
original average amount of carbon in the test compound and
multiplying it by 100.
% of Biodegradation= mean Cg (test) - mean Cg (blank) 100 / Ci
Where Cg - Amount of gaseous carbon produced in gram and Ci - Amount of carbon in test compound added in gram
The percentage of biodegradation is calculated by dividing the
average net gaseous-carbon production of the test compound by the original
average amount of carbon in the test compound and multiplying by 100.
Percentage of aerobic biodegradation relative to positive reference
(cellulose) over time is reported graphically as shown in Figure 3.9.
Figure 3.9: Graph showing percentage of biodegradation of the composites
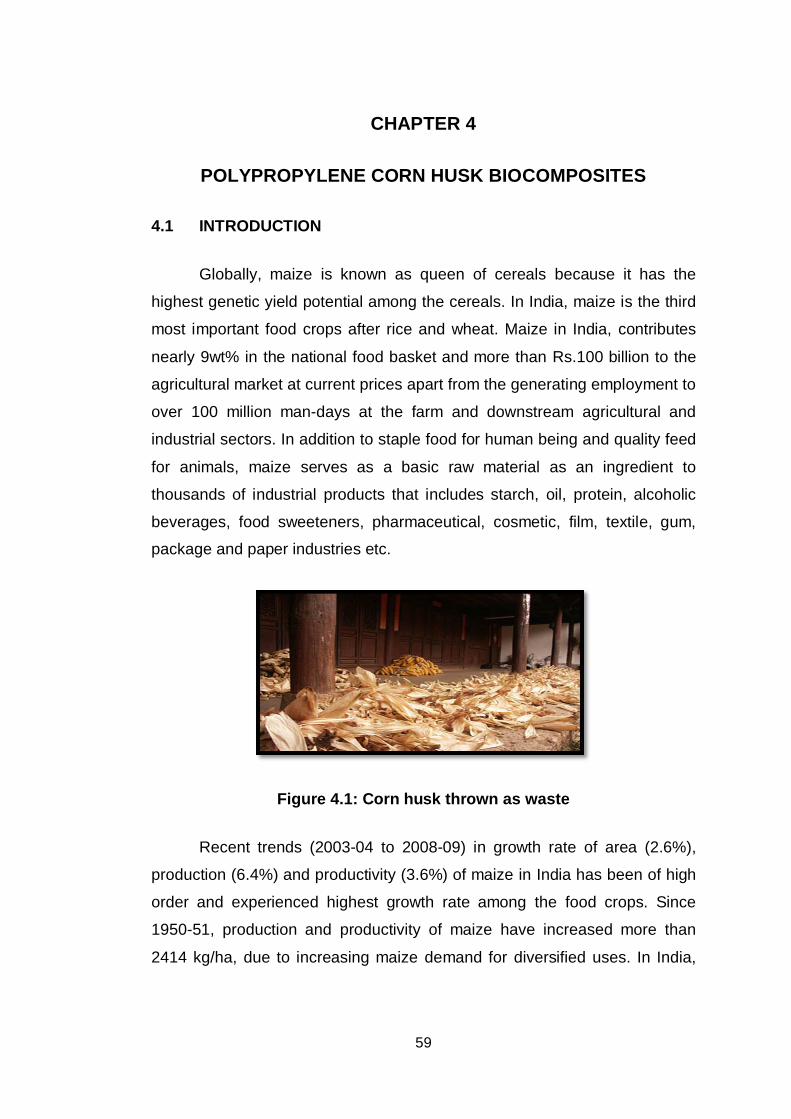
59
CHAPTER 4
POLYPROPYLENE CORN HUSK BIOCOMPOSITES
4.1 INTRODUCTION
Globally, maize is known as queen of cereals because it has the
highest genetic yield potential among the cereals. In India, maize is the third
most important food crops after rice and wheat. Maize in India, contributes
nearly 9wt% in the national food basket and more than Rs.100 billion to the
agricultural market at current prices apart from the generating employment to
over 100 million man-days at the farm and downstream agricultural and
industrial sectors. In addition to staple food for human being and quality feed
for animals, maize serves as a basic raw material as an ingredient to
thousands of industrial products that includes starch, oil, protein, alcoholic
beverages, food sweeteners, pharmaceutical, cosmetic, film, textile, gum,
package and paper industries etc.
Figure 4.1: Corn husk thrown as waste
Recent trends (2003-04 to 2008-09) in growth rate of area (2.6%),
production (6.4%) and productivity (3.6%) of maize in India has been of high
order and experienced highest growth rate among the food crops. Since
1950-51, production and productivity of maize have increased more than
2414 kg/ha, due to increasing maize demand for diversified uses. In India,
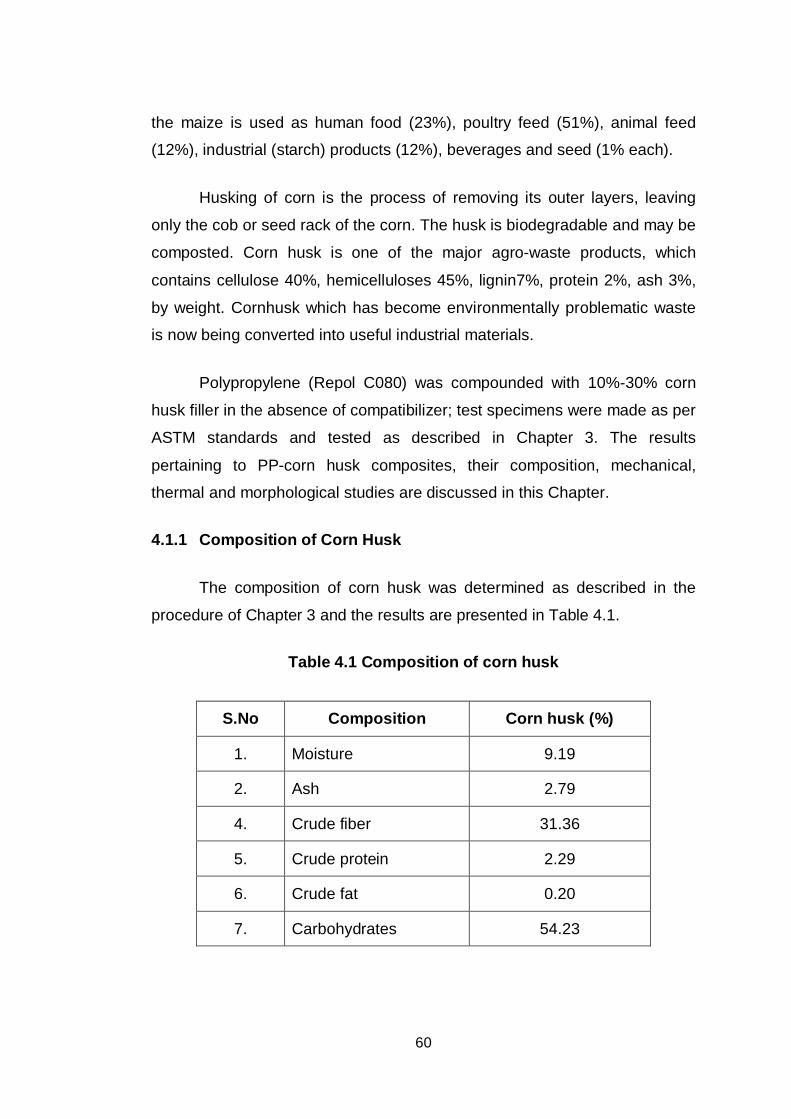
60
the maize is used as human food (23%), poultry feed (51%), animal feed
(12%), industrial (starch) products (12%), beverages and seed (1% each).
Husking of corn is the process of removing its outer layers, leaving
only the cob or seed rack of the corn. The husk is biodegradable and may be
composted. Corn husk is one of the major agro-waste products, which
contains cellulose 40%, hemicelluloses 45%, lignin7%, protein 2%, ash 3%,
by weight. Cornhusk which has become environmentally problematic waste
is now being converted into useful industrial materials.
Polypropylene (Repol C080) was compounded with 10%-30% corn
husk filler in the absence of compatibilizer; test specimens were made as per
ASTM standards and tested as described in Chapter 3. The results
pertaining to PP-corn husk composites, their composition, mechanical,
thermal and morphological studies are discussed in this Chapter.
4.1.1 Composition of Corn Husk
The composition of corn husk was determined as described in the
procedure of Chapter 3 and the results are presented in Table 4.1.
Table 4.1 Composition of corn husk
S.No Composition Corn husk (%)
1. Moisture 9.19
2. Ash 2.79
4. Crude fiber 31.36
5. Crude protein 2.29
6. Crude fat 0.20
7. Carbohydrates 54.23
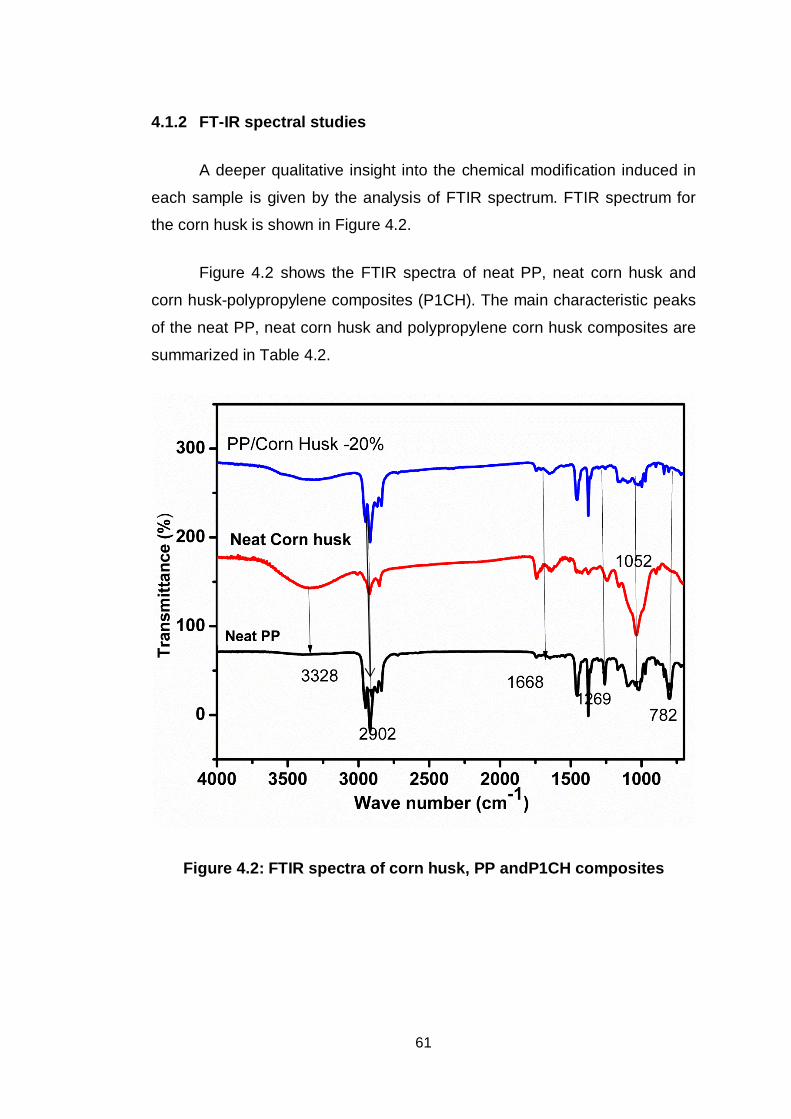
61
4.1.2 FT-IR spectral studies
A deeper qualitative insight into the chemical modification induced in
each sample is given by the analysis of FTIR spectrum. FTIR spectrum for
the corn husk is shown in Figure 4.2.
Figure 4.2 shows the FTIR spectra of neat PP, neat corn husk and
corn husk-polypropylene composites (P1CH). The main characteristic peaks
of the neat PP, neat corn husk and polypropylene corn husk composites are
summarized in Table 4.2.
Figure 4.2: FTIR spectra of corn husk, PP andP1CH composites
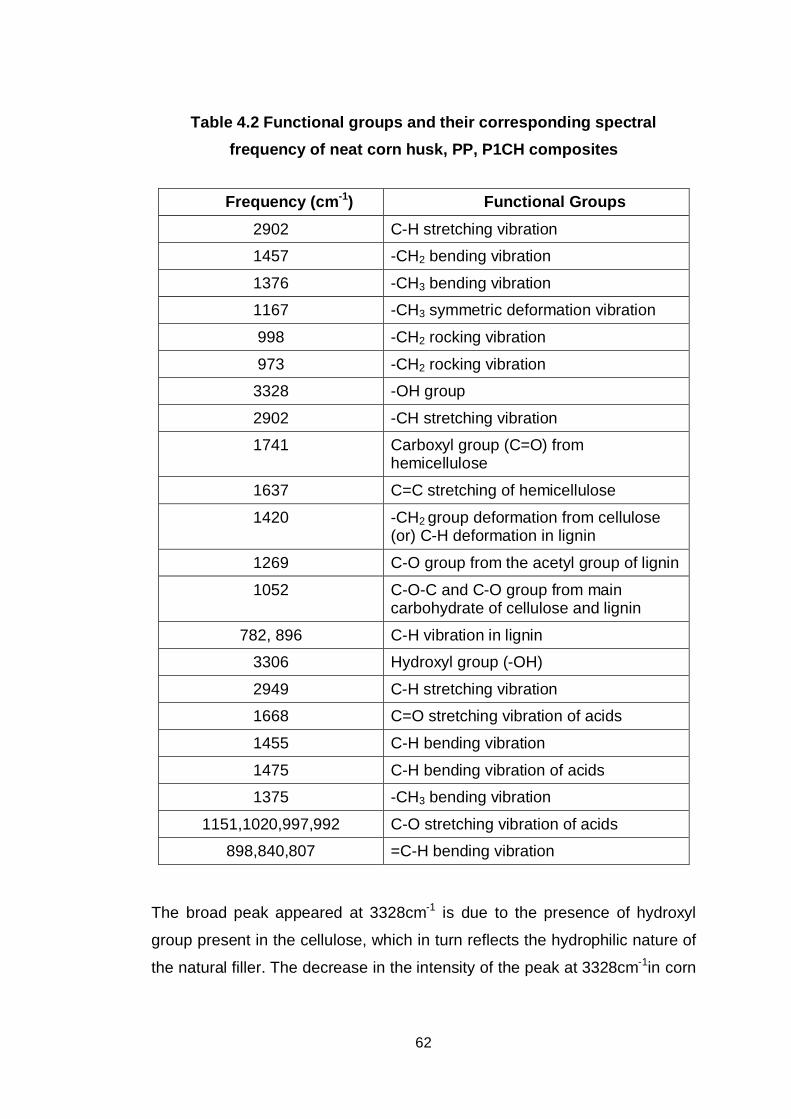
62
Table 4.2 Functional groups and their corresponding spectral frequency of neat corn husk, PP, P1CH composites
Frequency (cm-1) Functional Groups 2902 C-H stretching vibration
1457 -CH2 bending vibration
1376 -CH3 bending vibration
1167 -CH3 symmetric deformation vibration
998 -CH2 rocking vibration
973 -CH2 rocking vibration
3328 -OH group
2902 -CH stretching vibration
1741 Carboxyl group (C=O) from hemicellulose
1637 C=C stretching of hemicellulose
1420 -CH2 group deformation from cellulose (or) C-H deformation in lignin
1269 C-O group from the acetyl group of lignin
1052 C-O-C and C-O group from main carbohydrate of cellulose and lignin
782, 896 C-H vibration in lignin
3306 Hydroxyl group (-OH)
2949 C-H stretching vibration
1668 C=O stretching vibration of acids
1455 C-H bending vibration
1475 C-H bending vibration of acids
1375 -CH3 bending vibration
1151,1020,997,992 C-O stretching vibration of acids
898,840,807 =C-H bending vibration
The broad peak appeared at 3328cm-1 is due to the presence of hydroxyl
group present in the cellulose, which in turn reflects the hydrophilic nature of
the natural filler. The decrease in the intensity of the peak at 3328cm-1in corn
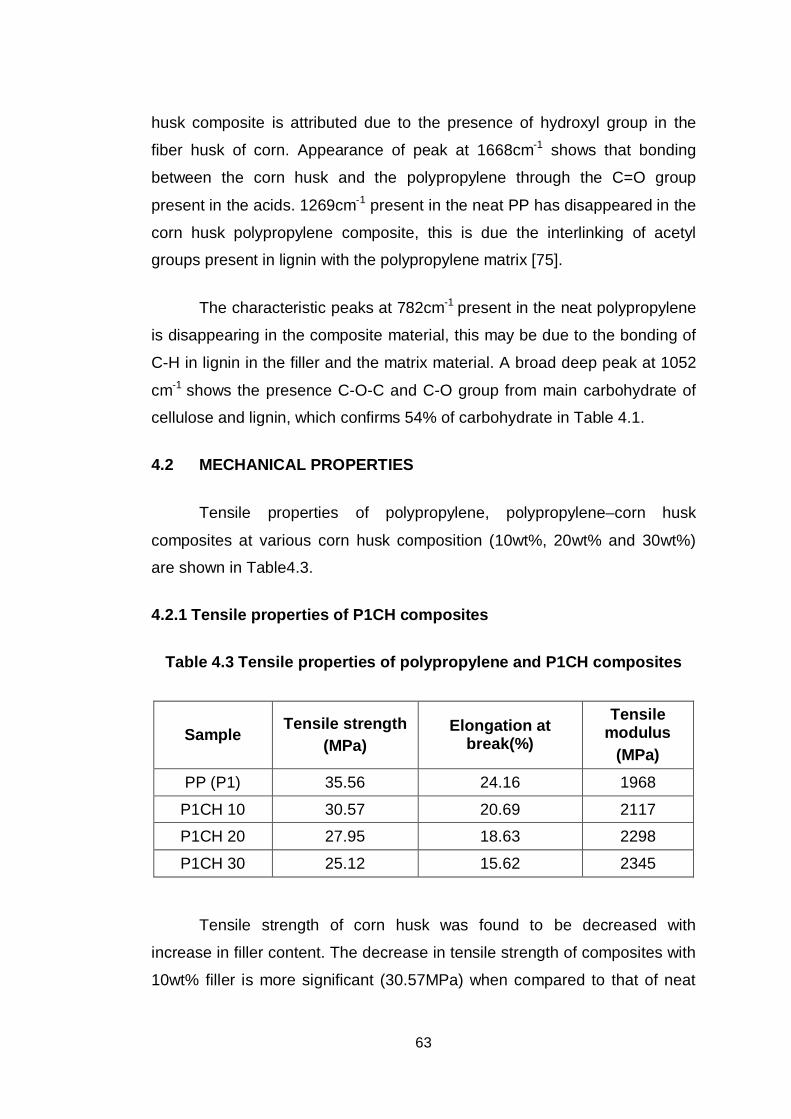
63
husk composite is attributed due to the presence of hydroxyl group in the
fiber husk of corn. Appearance of peak at 1668cm-1 shows that bonding
between the corn husk and the polypropylene through the C=O group
present in the acids. 1269cm-1 present in the neat PP has disappeared in the
corn husk polypropylene composite, this is due the interlinking of acetyl
groups present in lignin with the polypropylene matrix [75].
The characteristic peaks at 782cm-1 present in the neat polypropylene
is disappearing in the composite material, this may be due to the bonding of
C-H in lignin in the filler and the matrix material. A broad deep peak at 1052
cm-1 shows the presence C-O-C and C-O group from main carbohydrate of
cellulose and lignin, which confirms 54% of carbohydrate in Table 4.1.
4.2 MECHANICAL PROPERTIES
Tensile properties of polypropylene, polypropylene–corn husk
composites at various corn husk composition (10wt%, 20wt% and 30wt%)
are shown in Table4.3.
4.2.1 Tensile properties of P1CH composites
Table 4.3 Tensile properties of polypropylene and P1CH composites
Sample Tensile strength
(MPa) Elongation at
break(%)
Tensile modulus
(MPa) PP (P1) 35.56 24.16 1968
P1CH 10 30.57 20.69 2117
P1CH 20 27.95 18.63 2298
P1CH 30 25.12 15.62 2345
Tensile strength of corn husk was found to be decreased with
increase in filler content. The decrease in tensile strength of composites with
10wt% filler is more significant (30.57MPa) when compared to that of neat
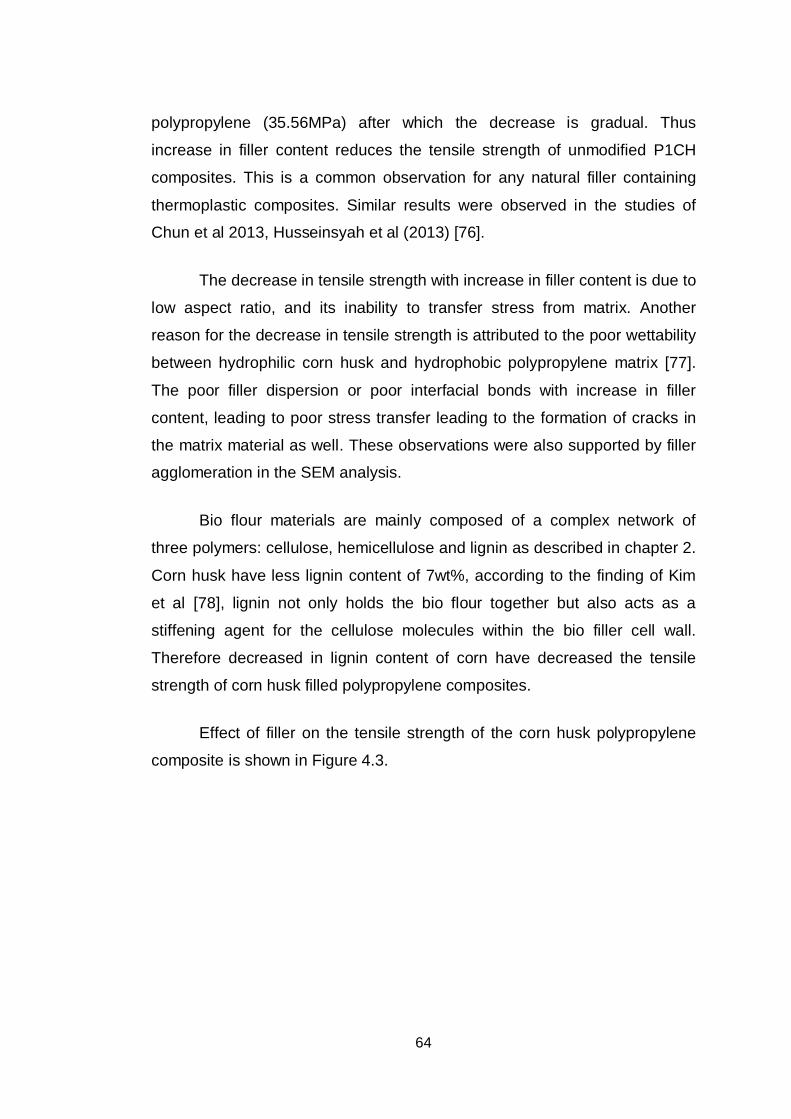
64
polypropylene (35.56MPa) after which the decrease is gradual. Thus
increase in filler content reduces the tensile strength of unmodified P1CH
composites. This is a common observation for any natural filler containing
thermoplastic composites. Similar results were observed in the studies of
Chun et al 2013, Husseinsyah et al (2013) [76].
The decrease in tensile strength with increase in filler content is due to
low aspect ratio, and its inability to transfer stress from matrix. Another
reason for the decrease in tensile strength is attributed to the poor wettability
between hydrophilic corn husk and hydrophobic polypropylene matrix [77].
The poor filler dispersion or poor interfacial bonds with increase in filler
content, leading to poor stress transfer leading to the formation of cracks in
the matrix material as well. These observations were also supported by filler
agglomeration in the SEM analysis.
Bio flour materials are mainly composed of a complex network of
three polymers: cellulose, hemicellulose and lignin as described in chapter 2.
Corn husk have less lignin content of 7wt%, according to the finding of Kim
et al [78], lignin not only holds the bio flour together but also acts as a
stiffening agent for the cellulose molecules within the bio filler cell wall.
Therefore decreased in lignin content of corn have decreased the tensile
strength of corn husk filled polypropylene composites.
Effect of filler on the tensile strength of the corn husk polypropylene
composite is shown in Figure 4.3.
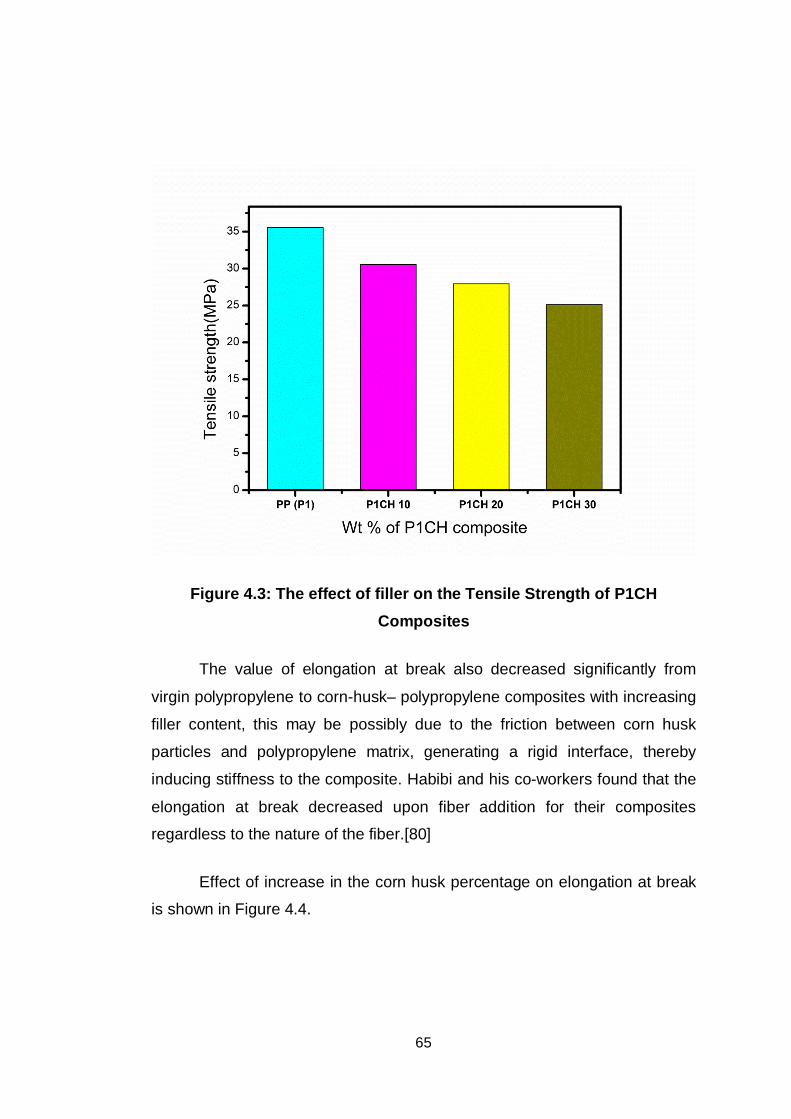
65
Figure 4.3: The effect of filler on the Tensile Strength of P1CH Composites
The value of elongation at break also decreased significantly from
virgin polypropylene to corn-husk– polypropylene composites with increasing
filler content, this may be possibly due to the friction between corn husk
particles and polypropylene matrix, generating a rigid interface, thereby
inducing stiffness to the composite. Habibi and his co-workers found that the
elongation at break decreased upon fiber addition for their composites
regardless to the nature of the fiber.[80]
Effect of increase in the corn husk percentage on elongation at break
is shown in Figure 4.4.

66
Figure 4.4: Effect of filler on the Elongation at Break of P1CHcomposites
Figure 4.5 shows the effect of filler content on the tensile modulus of
polypropylene corn husk composites. It can be seen that the elongation
modulus of the polypropylene corn husk composites increased with increase
of filler content, showing that the ability of corn husk to impart greater
stiffness to the polypropylene composites. This can be understood from the
fact that any filler which has higher stiffness than the matrix can increase the
modulus of the composites which is reciprocal to elongation at break. With
the increase in the filler content, the possibility of filler-matrix interaction
increased which leads to an increase in the efficiency of stress transfer from
the matrix to the filler.
The increase in corn husk content eventually increases the modulus
of elasticity of polypropylene corn husk composites.
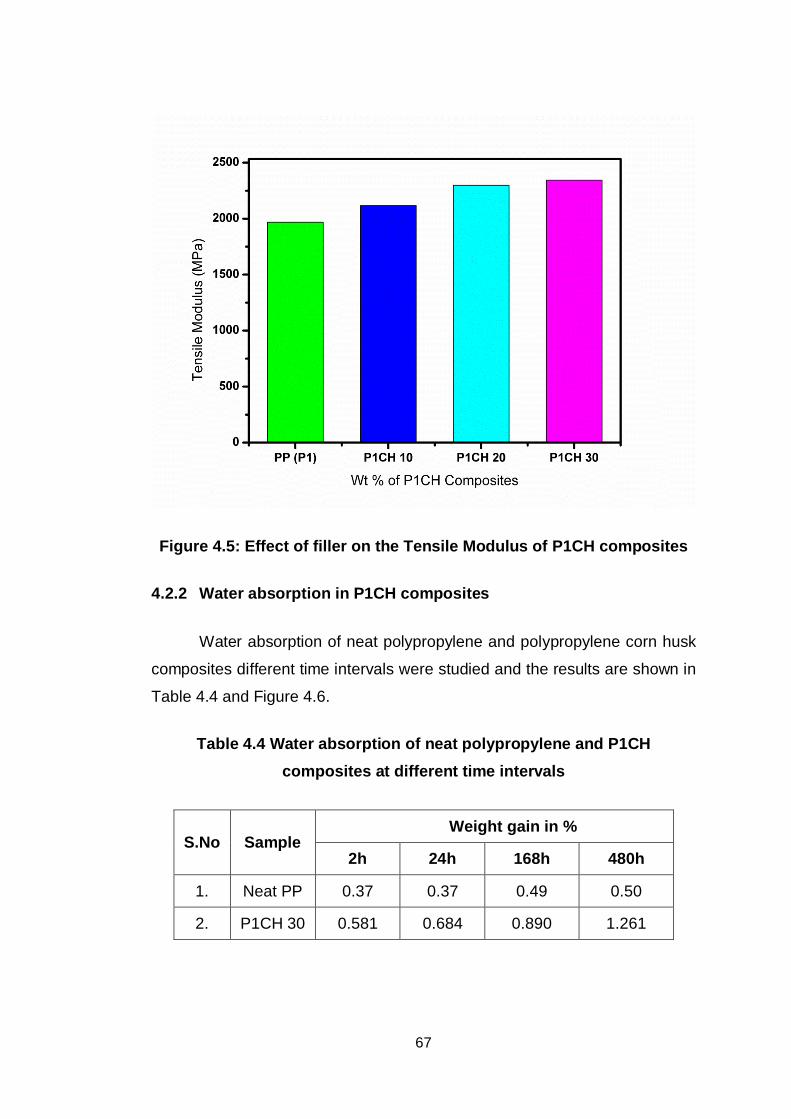
67
Figure 4.5: Effect of filler on the Tensile Modulus of P1CH composites
4.2.2 Water absorption in P1CH composites
Water absorption of neat polypropylene and polypropylene corn husk
composites different time intervals were studied and the results are shown in
Table 4.4 and Figure 4.6.
Table 4.4 Water absorption of neat polypropylene and P1CH composites at different time intervals
S.No Sample Weight gain in %
2h 24h 168h 480h
1. Neat PP 0.37 0.37 0.49 0.50
2. P1CH 30 0.581 0.684 0.890 1.261
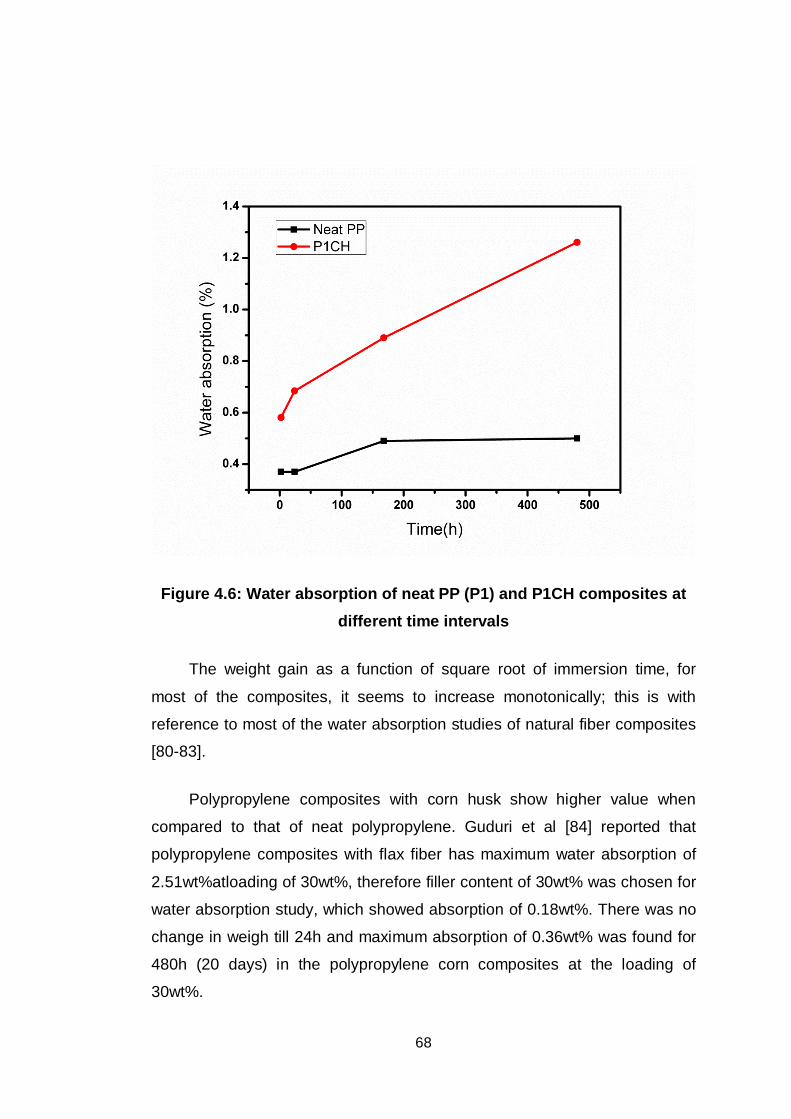
68
Figure 4.6: Water absorption of neat PP (P1) and P1CH composites at different time intervals
The weight gain as a function of square root of immersion time, for
most of the composites, it seems to increase monotonically; this is with
reference to most of the water absorption studies of natural fiber composites
[80-83].
Polypropylene composites with corn husk show higher value when
compared to that of neat polypropylene. Guduri et al [84] reported that
polypropylene composites with flax fiber has maximum water absorption of
2.51wt%atloading of 30wt%, therefore filler content of 30wt% was chosen for
water absorption study, which showed absorption of 0.18wt%. There was no
change in weigh till 24h and maximum absorption of 0.36wt% was found for
480h (20 days) in the polypropylene corn composites at the loading of
30wt%.
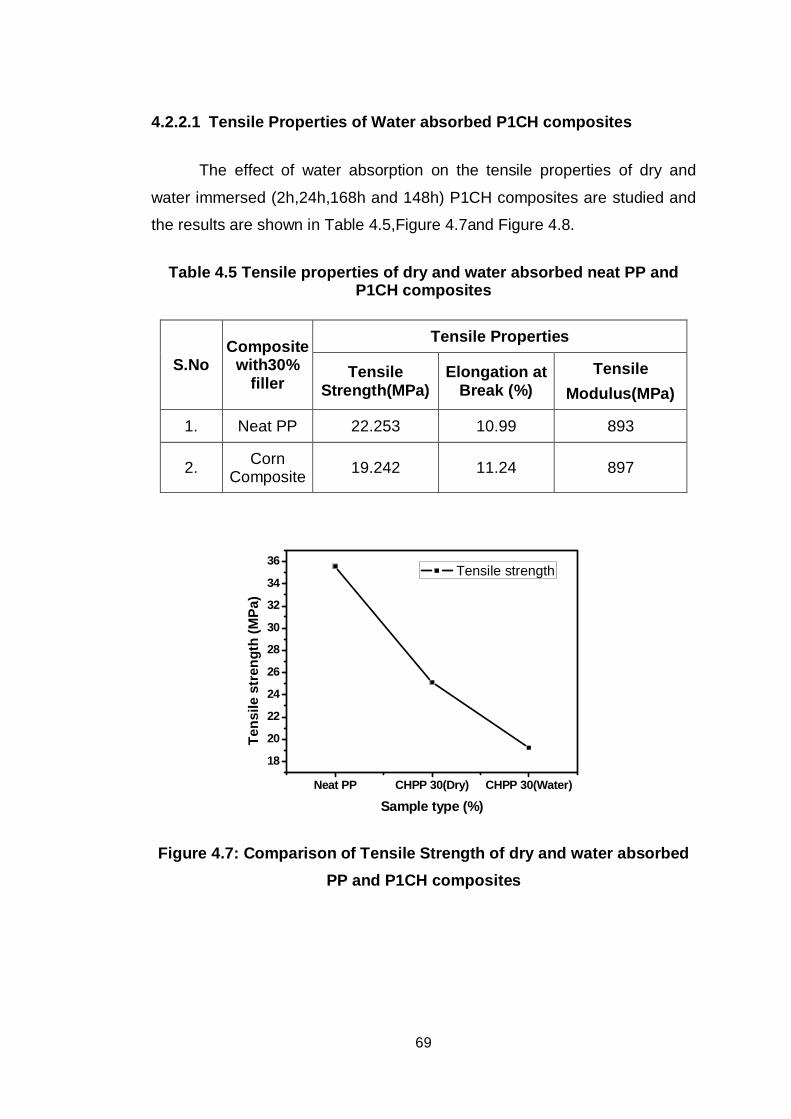
69
4.2.2.1 Tensile Properties of Water absorbed P1CH composites
The effect of water absorption on the tensile properties of dry and
water immersed (2h,24h,168h and 148h) P1CH composites are studied and
the results are shown in Table 4.5,Figure 4.7and Figure 4.8.
Table 4.5 Tensile properties of dry and water absorbed neat PP and P1CH composites
S.No Composite
with30% filler
Tensile Properties
Tensile Strength(MPa)
Elongation at Break (%)
Tensile Modulus(MPa)
1. Neat PP 22.253 10.99 893
2. Corn Composite 19.242 11.24 897
Neat PP CHPP 30(Dry) CHPP 30(Water)
18
20
22
24
26
28
30
32
34
36
Tens
ile s
tren
gth
(MPa
)
Sample type (%)
Tensile strength
Figure 4.7: Comparison of Tensile Strength of dry and water absorbed PP and P1CH composites
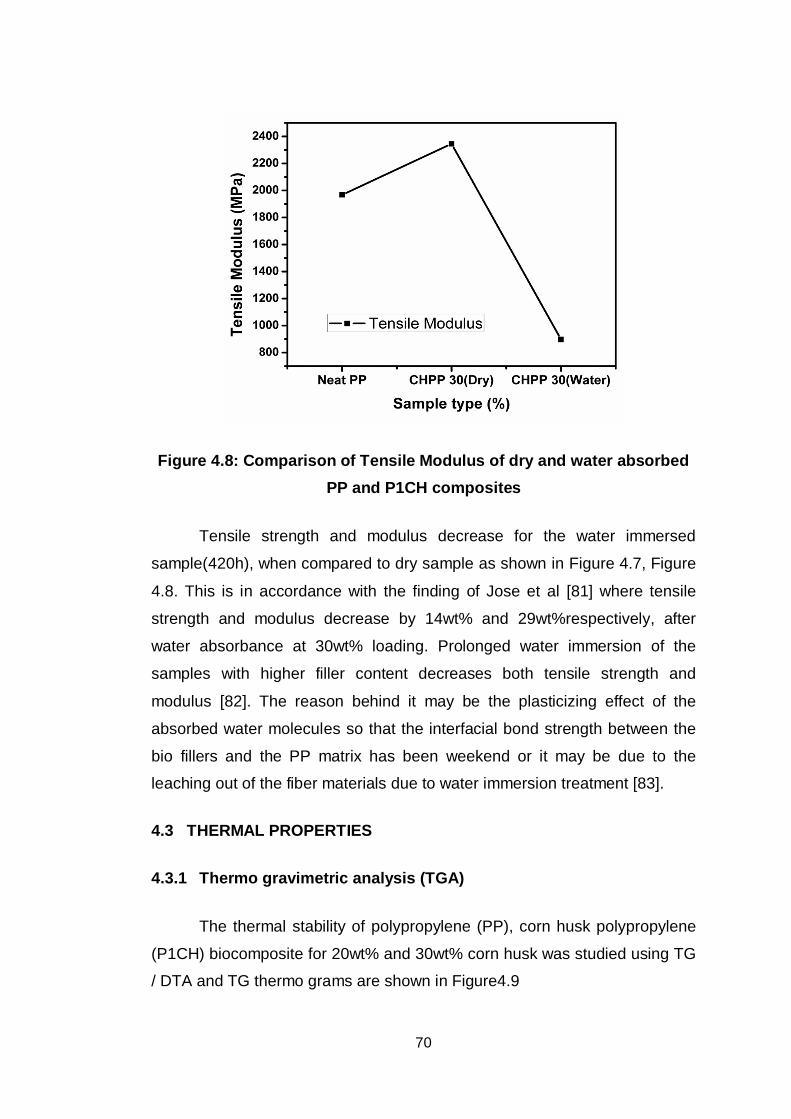
70
Figure 4.8: Comparison of Tensile Modulus of dry and water absorbed PP and P1CH composites
Tensile strength and modulus decrease for the water immersed
sample(420h), when compared to dry sample as shown in Figure 4.7, Figure
4.8. This is in accordance with the finding of Jose et al [81] where tensile
strength and modulus decrease by 14wt% and 29wt%respectively, after
water absorbance at 30wt% loading. Prolonged water immersion of the
samples with higher filler content decreases both tensile strength and
modulus [82]. The reason behind it may be the plasticizing effect of the
absorbed water molecules so that the interfacial bond strength between the
bio fillers and the PP matrix has been weekend or it may be due to the
leaching out of the fiber materials due to water immersion treatment [83].
4.3 THERMAL PROPERTIES
4.3.1 Thermo gravimetric analysis (TGA)
The thermal stability of polypropylene (PP), corn husk polypropylene
(P1CH) biocomposite for 20wt% and 30wt% corn husk was studied using TG
/ DTA and TG thermo grams are shown in Figure4.9
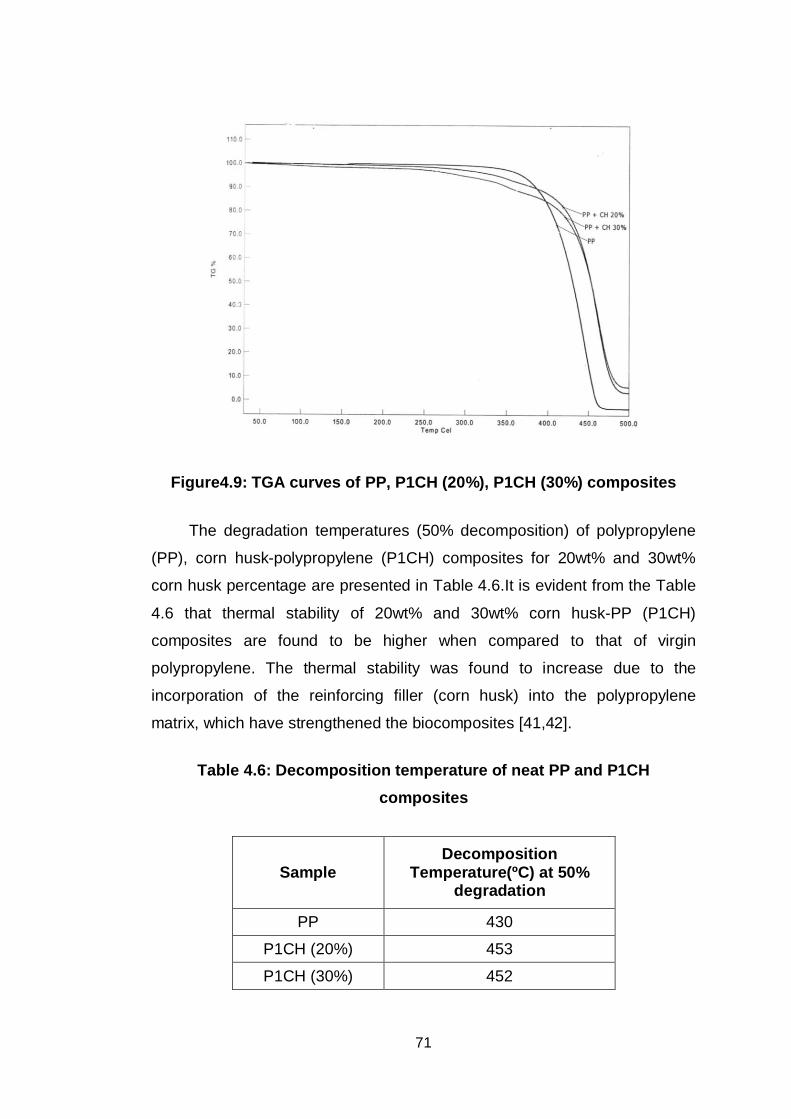
71
Figure4.9: TGA curves of PP, P1CH (20%), P1CH (30%) composites
The degradation temperatures (50% decomposition) of polypropylene
(PP), corn husk-polypropylene (P1CH) composites for 20wt% and 30wt%
corn husk percentage are presented in Table 4.6.It is evident from the Table
4.6 that thermal stability of 20wt% and 30wt% corn husk-PP (P1CH)
composites are found to be higher when compared to that of virgin
polypropylene. The thermal stability was found to increase due to the
incorporation of the reinforcing filler (corn husk) into the polypropylene
matrix, which have strengthened the biocomposites [41,42].
Table 4.6: Decomposition temperature of neat PP and P1CH composites
Sample Decomposition
Temperature(ºC) at 50% degradation
PP 430
P1CH (20%) 453
P1CH (30%) 452
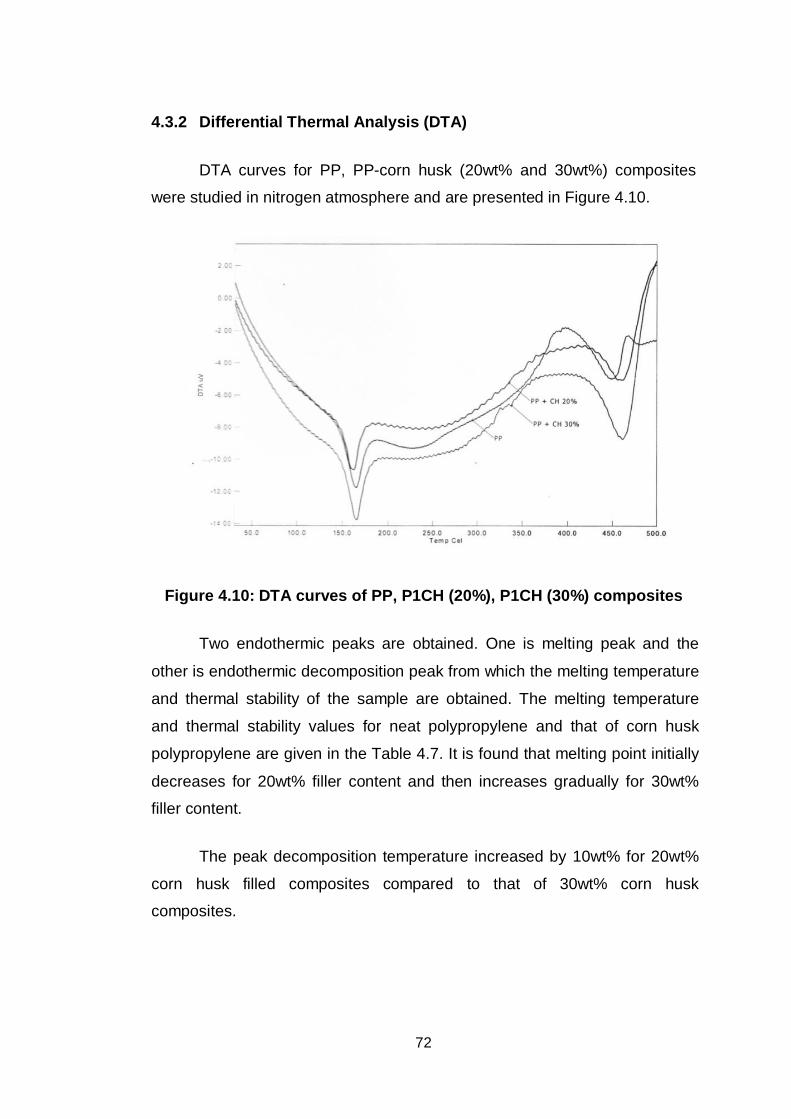
72
4.3.2 Differential Thermal Analysis (DTA)
DTA curves for PP, PP-corn husk (20wt% and 30wt%) composites
were studied in nitrogen atmosphere and are presented in Figure 4.10.
Figure 4.10: DTA curves of PP, P1CH (20%), P1CH (30%) composites
Two endothermic peaks are obtained. One is melting peak and the
other is endothermic decomposition peak from which the melting temperature
and thermal stability of the sample are obtained. The melting temperature
and thermal stability values for neat polypropylene and that of corn husk
polypropylene are given in the Table 4.7. It is found that melting point initially
decreases for 20wt% filler content and then increases gradually for 30wt%
filler content.
The peak decomposition temperature increased by 10wt% for 20wt%
corn husk filled composites compared to that of 30wt% corn husk
composites.
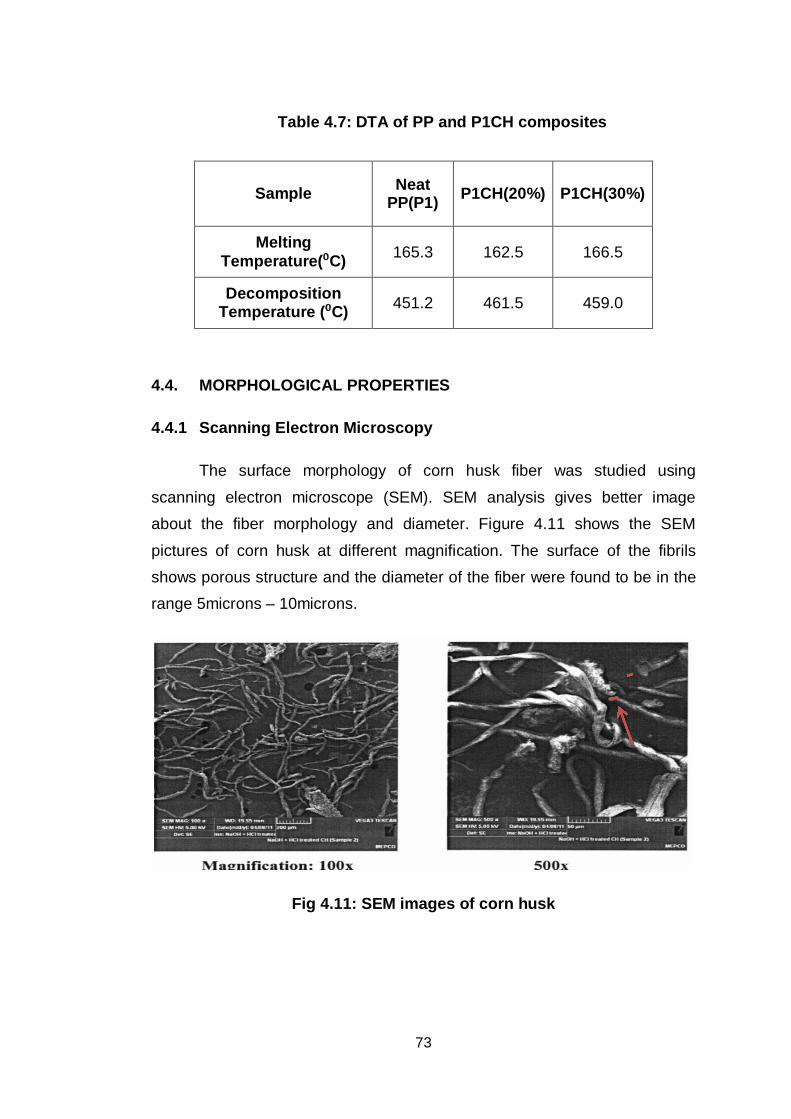
73
Table 4.7: DTA of PP and P1CH composites
Sample Neat PP(P1) P1CH(20%) P1CH(30%)
Melting Temperature( C) 165.3 162.5 166.5
Decomposition Temperature ( C) 451.2 461.5 459.0
4.4. MORPHOLOGICAL PROPERTIES
4.4.1 Scanning Electron Microscopy
The surface morphology of corn husk fiber was studied using
scanning electron microscope (SEM). SEM analysis gives better image about the fiber morphology and diameter. Figure 4.11 shows the SEM
pictures of corn husk at different magnification. The surface of the fibrils shows porous structure and the diameter of the fiber were found to be in the range 5microns – 10microns.
Fig 4.11: SEM images of corn husk
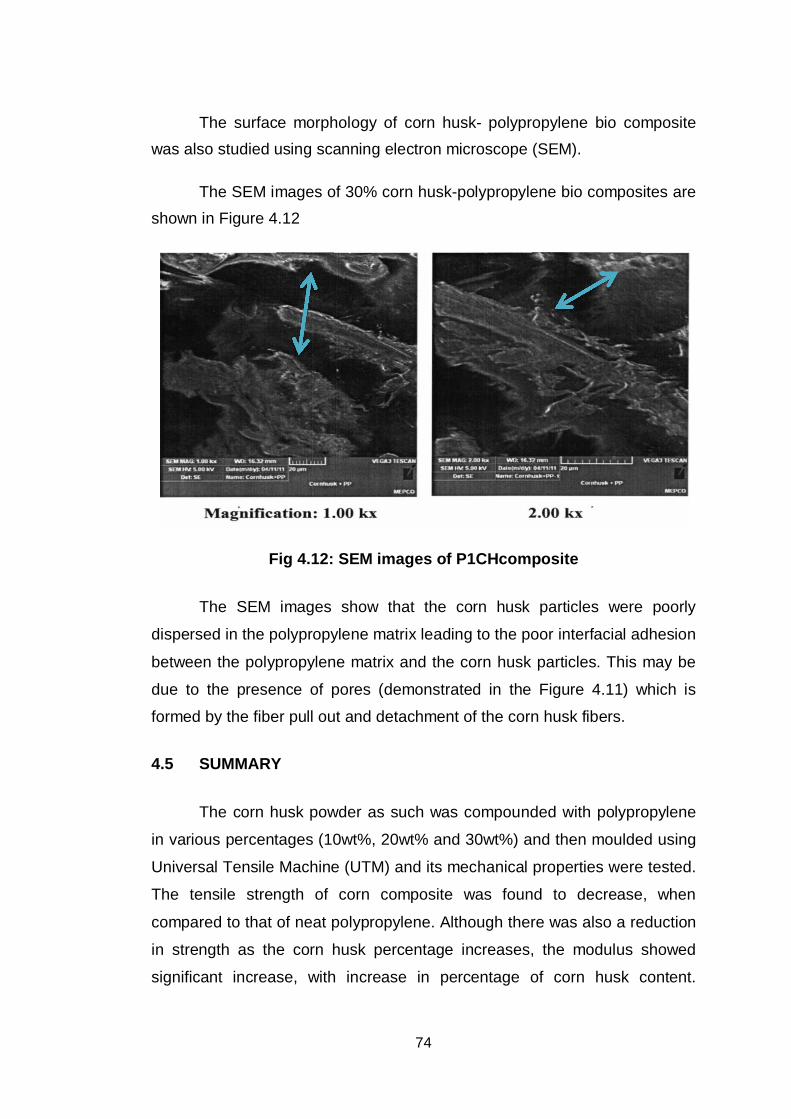
74
The surface morphology of corn husk- polypropylene bio composite was also studied using scanning electron microscope (SEM).
The SEM images of 30% corn husk-polypropylene bio composites are shown in Figure 4.12
Fig 4.12: SEM images of P1CHcomposite
The SEM images show that the corn husk particles were poorly
dispersed in the polypropylene matrix leading to the poor interfacial adhesion
between the polypropylene matrix and the corn husk particles. This may be
due to the presence of pores (demonstrated in the Figure 4.11) which is
formed by the fiber pull out and detachment of the corn husk fibers.
4.5 SUMMARY
The corn husk powder as such was compounded with polypropylene
in various percentages (10wt%, 20wt% and 30wt%) and then moulded using
Universal Tensile Machine (UTM) and its mechanical properties were tested.
The tensile strength of corn composite was found to decrease, when
compared to that of neat polypropylene. Although there was also a reduction
in strength as the corn husk percentage increases, the modulus showed
significant increase, with increase in percentage of corn husk content.
75
Fourier transform infrared (FTIR) spectroscopic analysis confirms the
presence of cellulose present in the corn husk. The thermal stability was
characterized using thermo gravimetric analysis (TGA).The thermal stability
was also found to be high for the biocomposites, when compared to neat
polypropylene. The melting temperature and thermal degradation
temperature were examined using differential thermal analysis (DTA). The
melting temperature and the thermal stability were found to be higher in
composites (30wt%), when compared to neat polypropylene. The
morphology of the biocomposites was characterized using Scanning Electron
Microscope (SEM), from which inferior compatibility between polypropylene
and corn husk powder was observed. Hence, this biocomposites can be
used in low end applications, where strength is not considered to that extent
such as in boards, baskets, household utensils, etc.
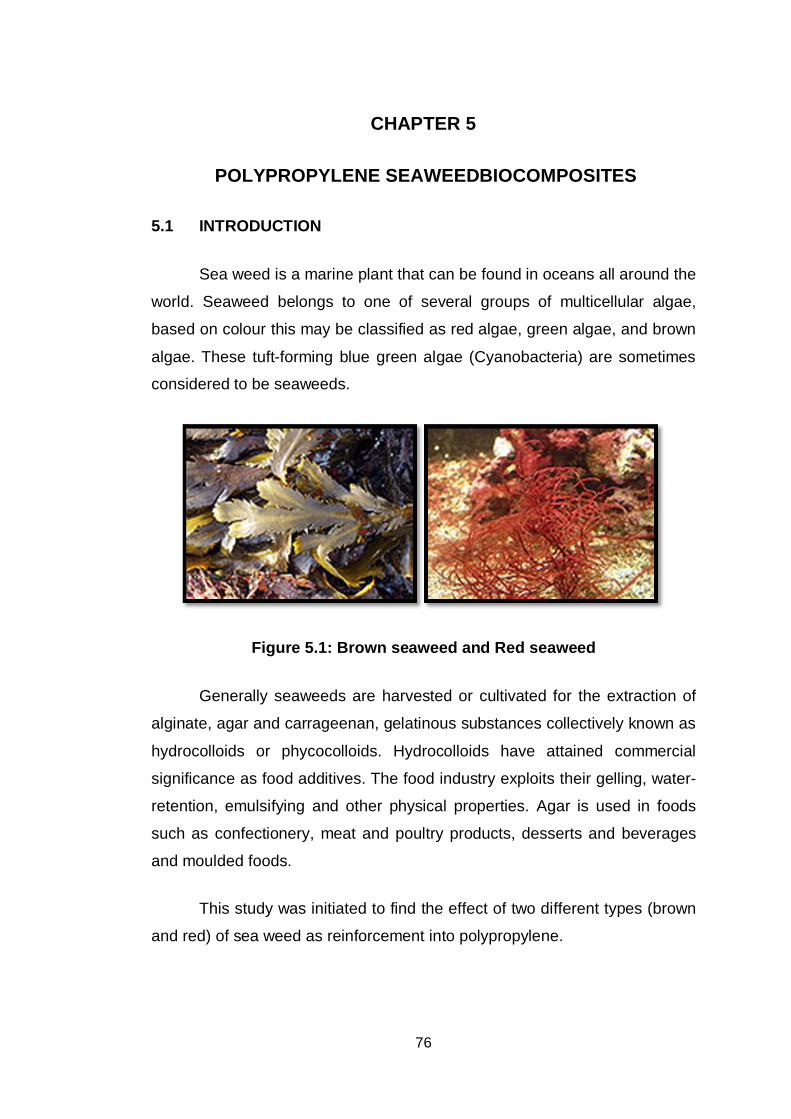
76
CHAPTER 5
POLYPROPYLENE SEAWEEDBIOCOMPOSITES
5.1 INTRODUCTION
Sea weed is a marine plant that can be found in oceans all around the
world. Seaweed belongs to one of several groups of multicellular algae,
based on colour this may be classified as red algae, green algae, and brown
algae. These tuft-forming blue green algae (Cyanobacteria) are sometimes
considered to be seaweeds.
Figure 5.1: Brown seaweed and Red seaweed
Generally seaweeds are harvested or cultivated for the extraction of
alginate, agar and carrageenan, gelatinous substances collectively known as
hydrocolloids or phycocolloids. Hydrocolloids have attained commercial
significance as food additives. The food industry exploits their gelling, water-
retention, emulsifying and other physical properties. Agar is used in foods
such as confectionery, meat and poultry products, desserts and beverages
and moulded foods.
This study was initiated to find the effect of two different types (brown
and red) of sea weed as reinforcement into polypropylene.
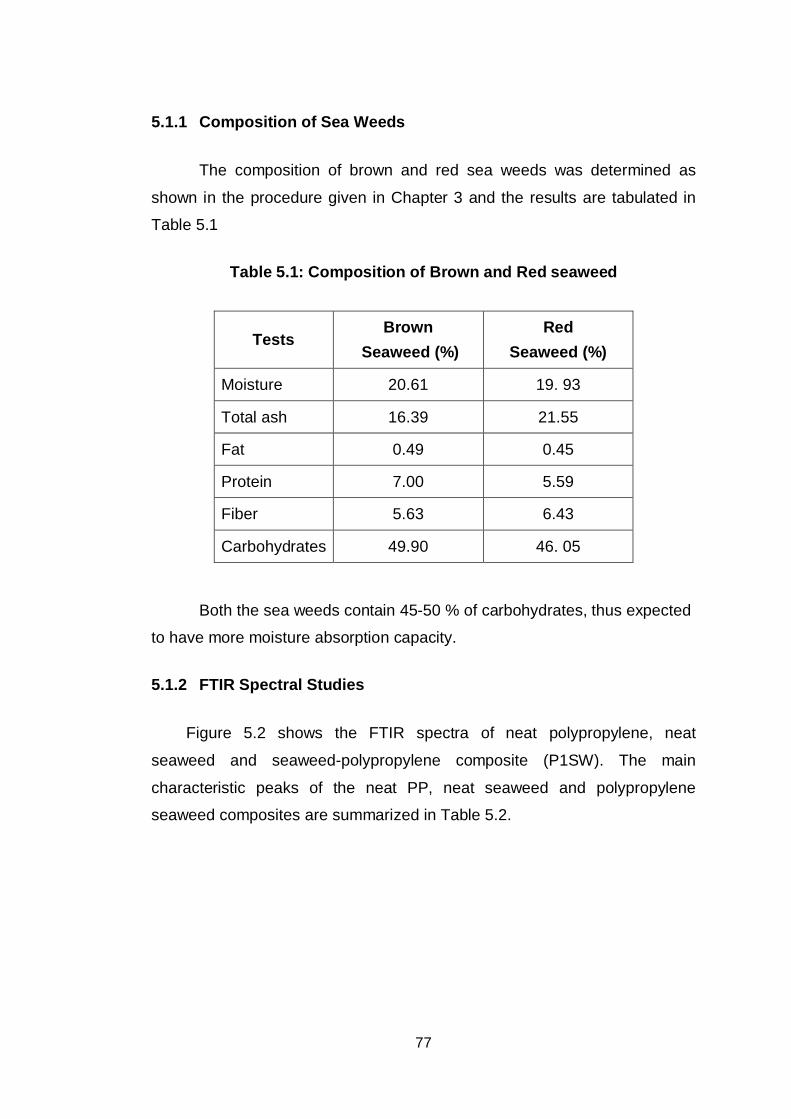
77
5.1.1 Composition of Sea Weeds
The composition of brown and red sea weeds was determined as
shown in the procedure given in Chapter 3 and the results are tabulated in
Table 5.1
Table 5.1: Composition of Brown and Red seaweed
Tests Brown
Seaweed (%) Red
Seaweed (%)
Moisture 20.61 19. 93
Total ash 16.39 21.55
Fat 0.49 0.45
Protein 7.00 5.59
Fiber 5.63 6.43
Carbohydrates 49.90 46. 05
Both the sea weeds contain 45-50 % of carbohydrates, thus expected
to have more moisture absorption capacity.
5.1.2 FTIR Spectral Studies
Figure 5.2 shows the FTIR spectra of neat polypropylene, neat
seaweed and seaweed-polypropylene composite (P1SW). The main
characteristic peaks of the neat PP, neat seaweed and polypropylene
seaweed composites are summarized in Table 5.2.
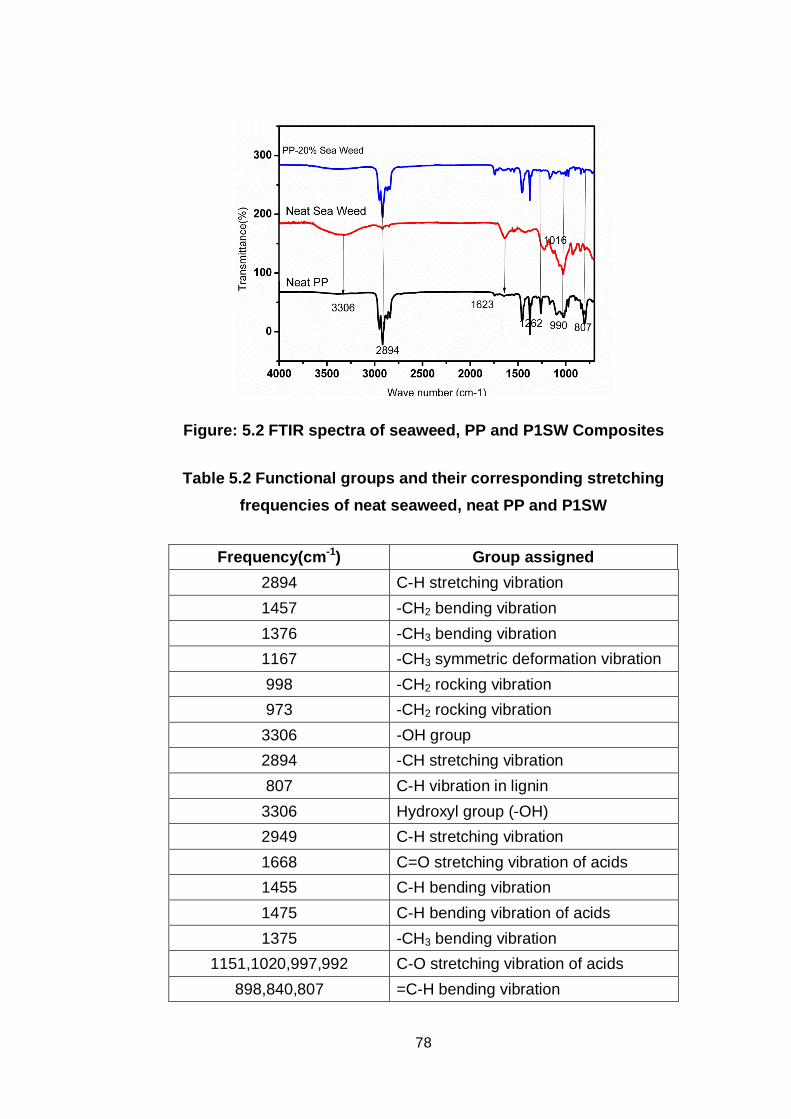
78
Figure: 5.2 FTIR spectra of seaweed, PP and P1SW Composites
Table 5.2 Functional groups and their corresponding stretching frequencies of neat seaweed, neat PP and P1SW
Frequency(cm-1) Group assigned 2894 C-H stretching vibration 1457 -CH2 bending vibration 1376 -CH3 bending vibration 1167 -CH3 symmetric deformation vibration 998 -CH2 rocking vibration 973 -CH2 rocking vibration
3306 -OH group 2894 -CH stretching vibration 807 C-H vibration in lignin
3306 Hydroxyl group (-OH) 2949 C-H stretching vibration 1668 C=O stretching vibration of acids 1455 C-H bending vibration 1475 C-H bending vibration of acids 1375 -CH3 bending vibration
1151,1020,997,992 C-O stretching vibration of acids 898,840,807 =C-H bending vibration
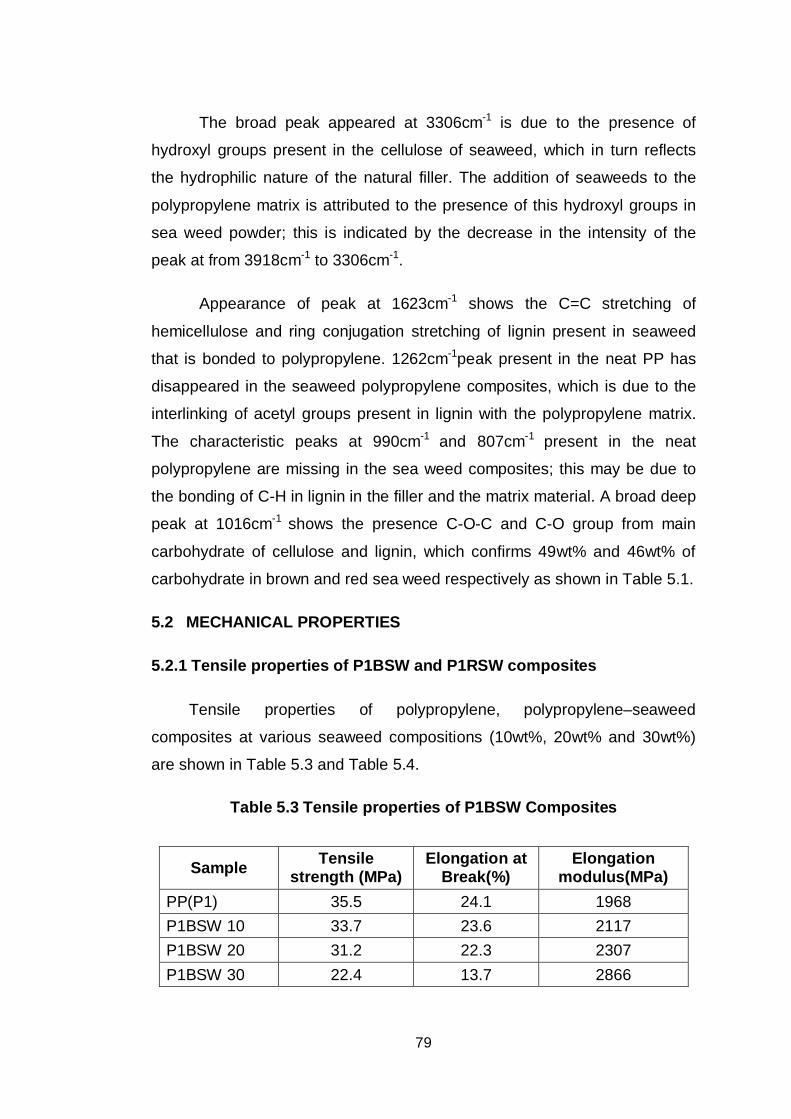
79
The broad peak appeared at 3306cm-1 is due to the presence of
hydroxyl groups present in the cellulose of seaweed, which in turn reflects
the hydrophilic nature of the natural filler. The addition of seaweeds to the
polypropylene matrix is attributed to the presence of this hydroxyl groups in
sea weed powder; this is indicated by the decrease in the intensity of the
peak at from 3918cm-1 to 3306cm-1.
Appearance of peak at 1623cm-1 shows the C=C stretching of
hemicellulose and ring conjugation stretching of lignin present in seaweed
that is bonded to polypropylene. 1262cm-1peak present in the neat PP has
disappeared in the seaweed polypropylene composites, which is due to the
interlinking of acetyl groups present in lignin with the polypropylene matrix.
The characteristic peaks at 990cm-1 and 807cm-1 present in the neat
polypropylene are missing in the sea weed composites; this may be due to
the bonding of C-H in lignin in the filler and the matrix material. A broad deep
peak at 1016cm-1 shows the presence C-O-C and C-O group from main
carbohydrate of cellulose and lignin, which confirms 49wt% and 46wt% of
carbohydrate in brown and red sea weed respectively as shown in Table 5.1.
5.2 MECHANICAL PROPERTIES
5.2.1 Tensile properties of P1BSW and P1RSW composites
Tensile properties of polypropylene, polypropylene–seaweed
composites at various seaweed compositions (10wt%, 20wt% and 30wt%)
are shown in Table 5.3 and Table 5.4.
Table 5.3 Tensile properties of P1BSW Composites
Sample Tensile strength (MPa)
Elongation at Break(%)
Elongation modulus(MPa)
PP(P1) 35.5 24.1 1968 P1BSW 10 33.7 23.6 2117 P1BSW 20 31.2 22.3 2307 P1BSW 30 22.4 13.7 2866
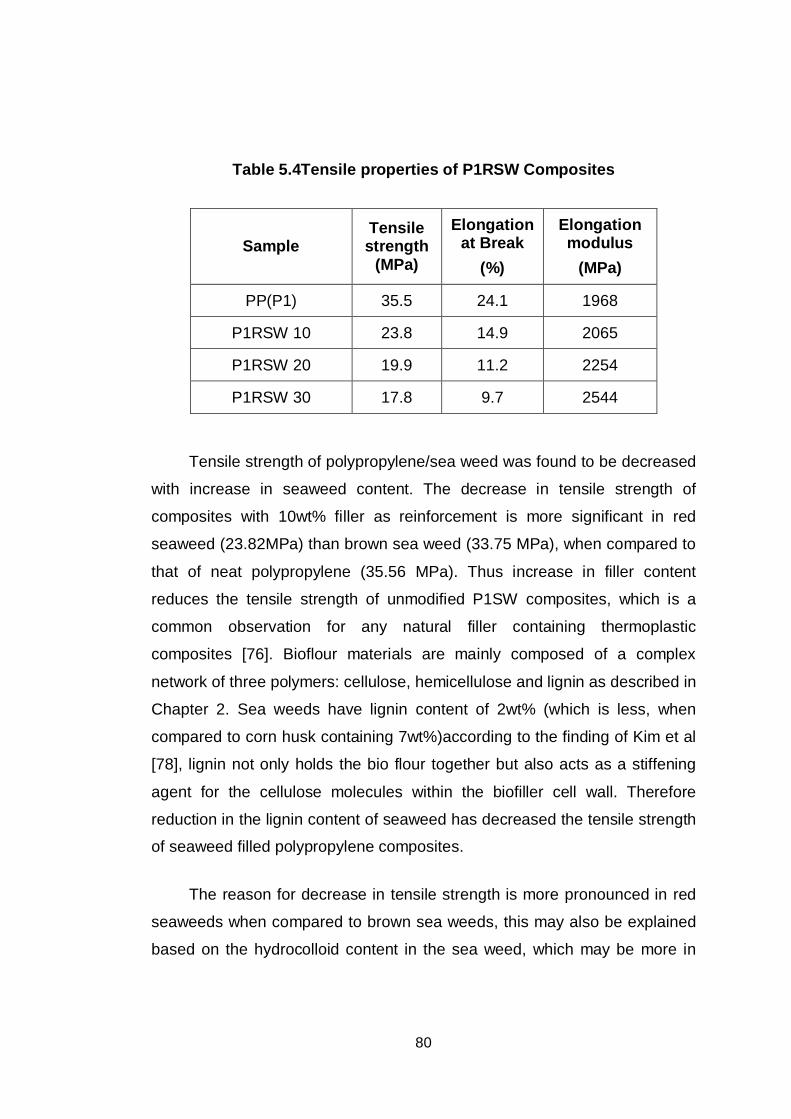
80
Table 5.4Tensile properties of P1RSW Composites
Sample Tensile strength
(MPa)
Elongation at Break
(%)
Elongation modulus
(MPa)
PP(P1) 35.5 24.1 1968
P1RSW 10 23.8 14.9 2065
P1RSW 20 19.9 11.2 2254
P1RSW 30 17.8 9.7 2544
Tensile strength of polypropylene/sea weed was found to be decreased
with increase in seaweed content. The decrease in tensile strength of
composites with 10wt% filler as reinforcement is more significant in red
seaweed (23.82MPa) than brown sea weed (33.75 MPa), when compared to
that of neat polypropylene (35.56 MPa). Thus increase in filler content
reduces the tensile strength of unmodified P1SW composites, which is a
common observation for any natural filler containing thermoplastic
composites [76]. Bioflour materials are mainly composed of a complex
network of three polymers: cellulose, hemicellulose and lignin as described in
Chapter 2. Sea weeds have lignin content of 2wt% (which is less, when
compared to corn husk containing 7wt%)according to the finding of Kim et al
[78], lignin not only holds the bio flour together but also acts as a stiffening
agent for the cellulose molecules within the biofiller cell wall. Therefore
reduction in the lignin content of seaweed has decreased the tensile strength
of seaweed filled polypropylene composites.
The reason for decrease in tensile strength is more pronounced in red
seaweeds when compared to brown sea weeds, this may also be explained
based on the hydrocolloid content in the sea weed, which may be more in
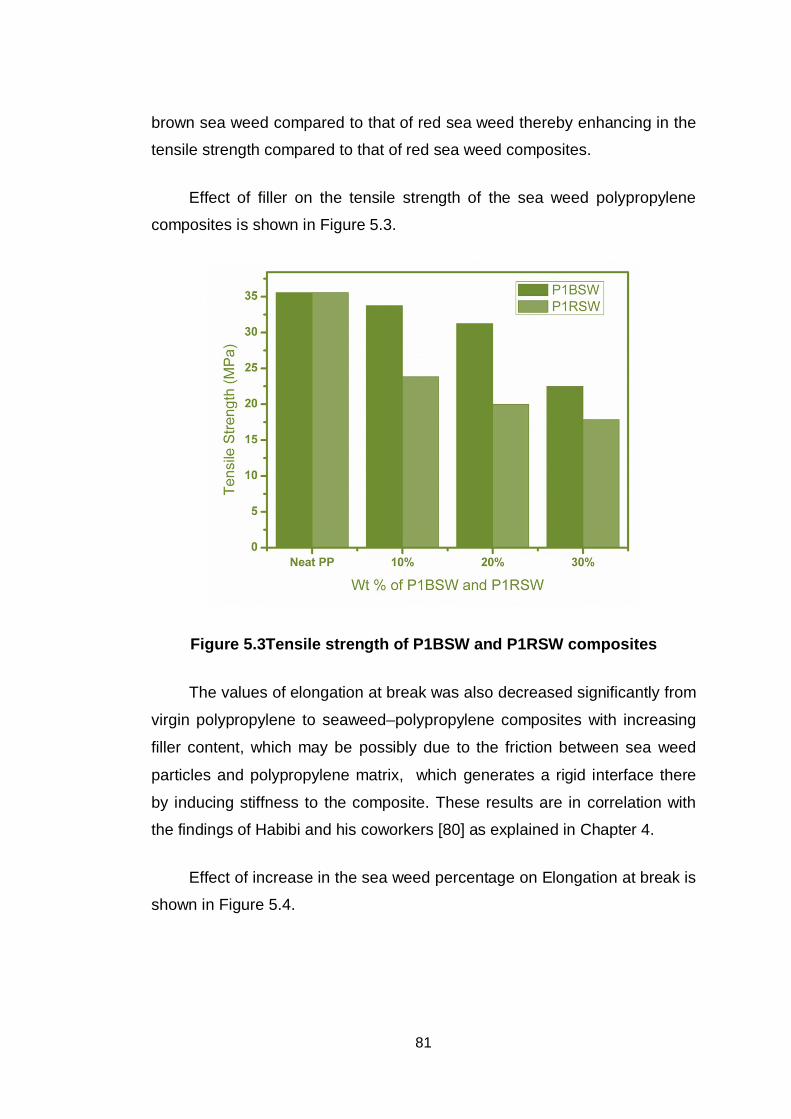
81
brown sea weed compared to that of red sea weed thereby enhancing in the
tensile strength compared to that of red sea weed composites.
Effect of filler on the tensile strength of the sea weed polypropylene
composites is shown in Figure 5.3.
Figure 5.3Tensile strength of P1BSW and P1RSW composites
The values of elongation at break was also decreased significantly from
virgin polypropylene to seaweed–polypropylene composites with increasing
filler content, which may be possibly due to the friction between sea weed
particles and polypropylene matrix, which generates a rigid interface there
by inducing stiffness to the composite. These results are in correlation with
the findings of Habibi and his coworkers [80] as explained in Chapter 4.
Effect of increase in the sea weed percentage on Elongation at break is
shown in Figure 5.4.
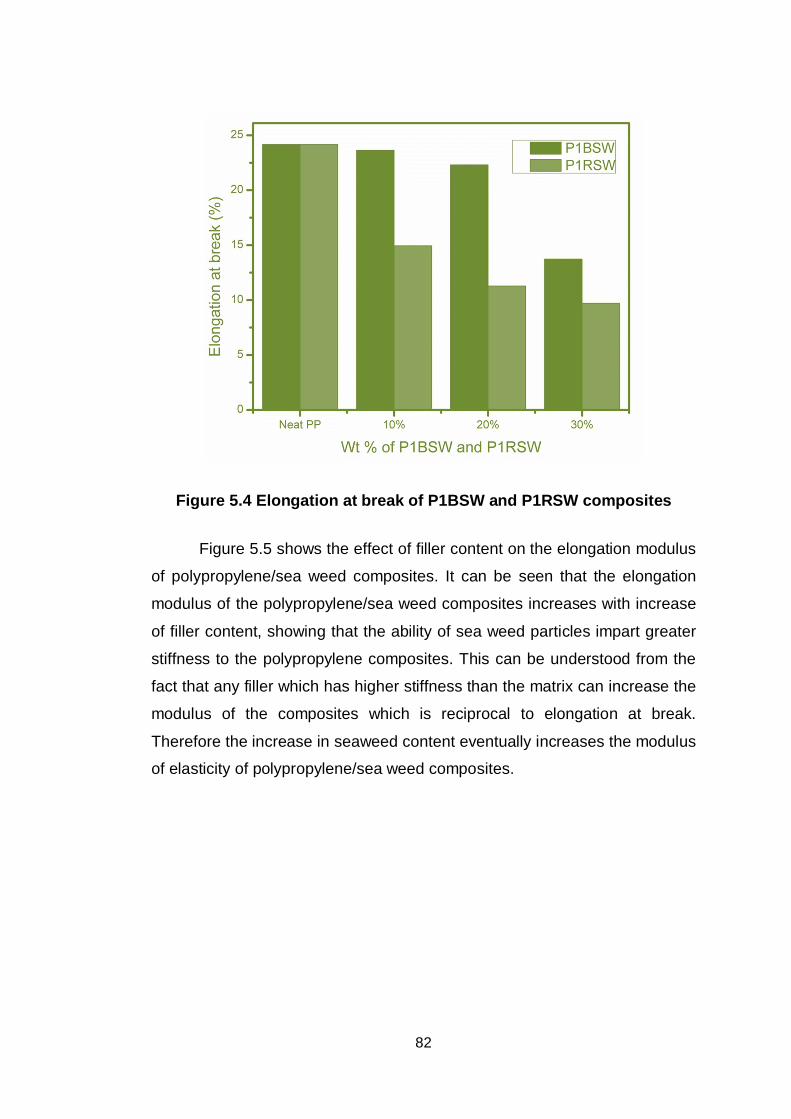
82
Figure 5.4 Elongation at break of P1BSW and P1RSW composites
Figure 5.5 shows the effect of filler content on the elongation modulus
of polypropylene/sea weed composites. It can be seen that the elongation
modulus of the polypropylene/sea weed composites increases with increase
of filler content, showing that the ability of sea weed particles impart greater
stiffness to the polypropylene composites. This can be understood from the
fact that any filler which has higher stiffness than the matrix can increase the
modulus of the composites which is reciprocal to elongation at break.
Therefore the increase in seaweed content eventually increases the modulus
of elasticity of polypropylene/sea weed composites.
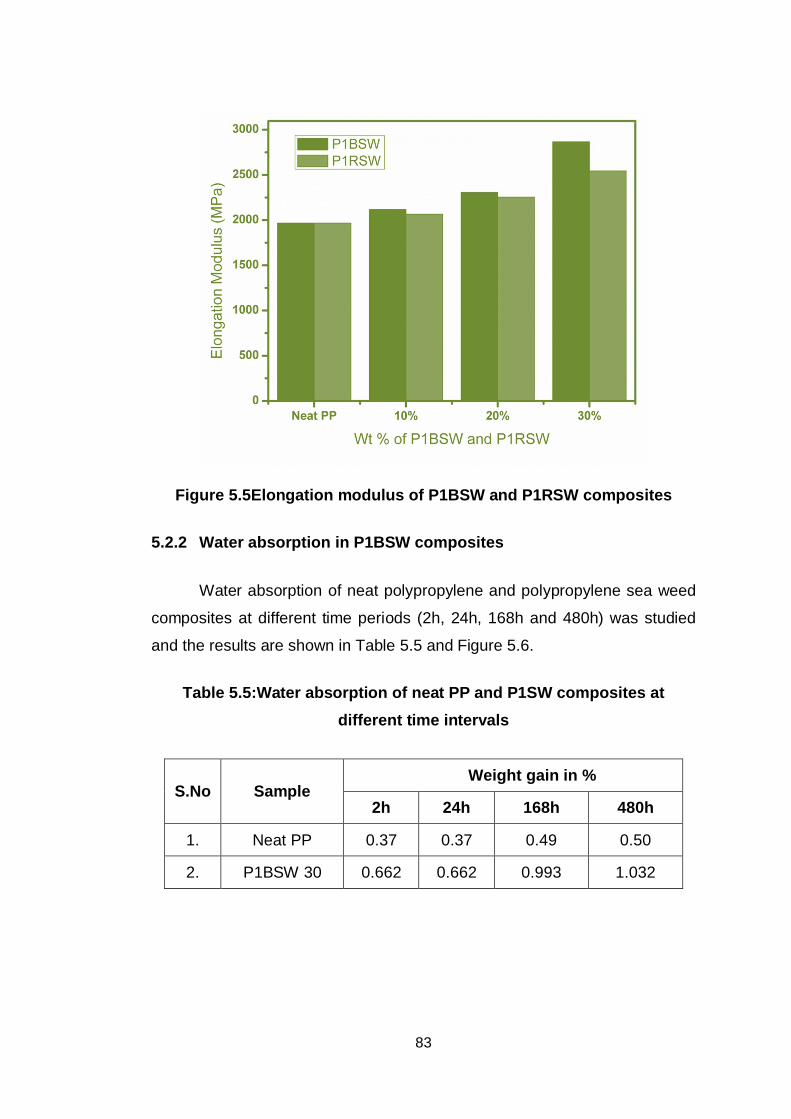
83
Figure 5.5Elongation modulus of P1BSW and P1RSW composites
5.2.2 Water absorption in P1BSW composites
Water absorption of neat polypropylene and polypropylene sea weed
composites at different time periods (2h, 24h, 168h and 480h) was studied
and the results are shown in Table 5.5 and Figure 5.6.
Table 5.5:Water absorption of neat PP and P1SW composites at different time intervals
S.No Sample Weight gain in %
2h 24h 168h 480h
1. Neat PP 0.37 0.37 0.49 0.50
2. P1BSW 30 0.662 0.662 0.993 1.032
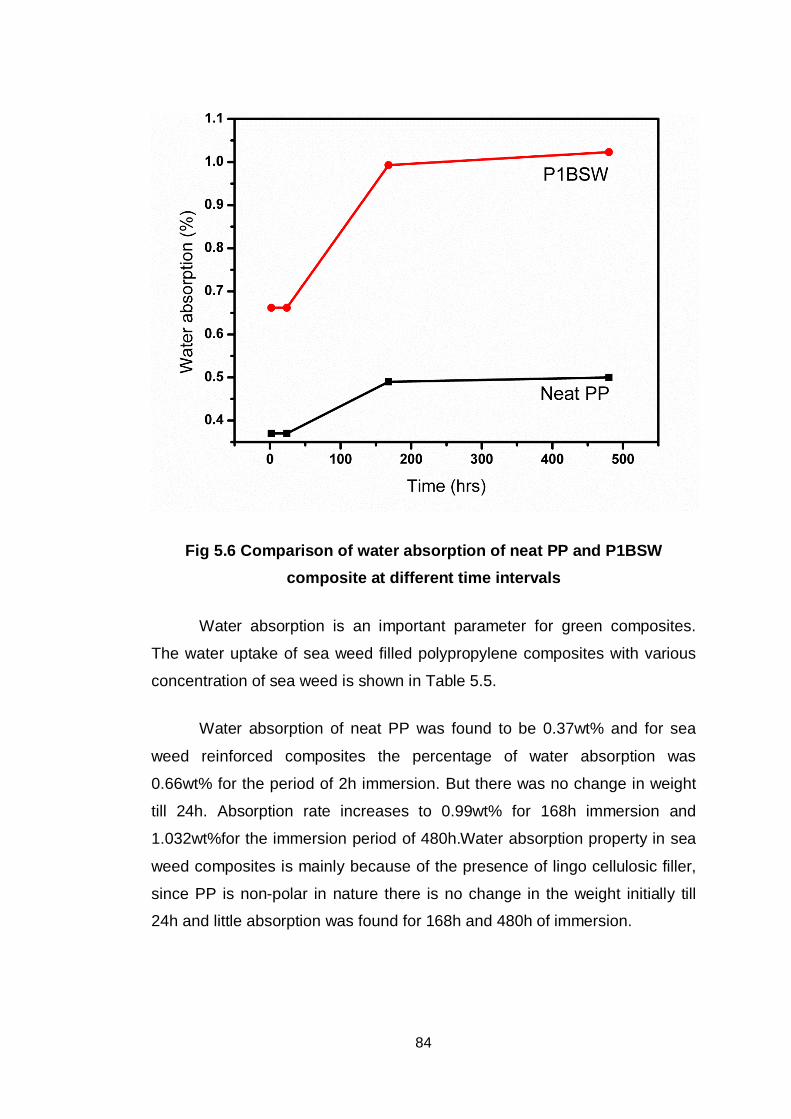
84
Fig 5.6 Comparison of water absorption of neat PP and P1BSW composite at different time intervals
Water absorption is an important parameter for green composites.
The water uptake of sea weed filled polypropylene composites with various
concentration of sea weed is shown in Table 5.5.
Water absorption of neat PP was found to be 0.37wt% and for sea
weed reinforced composites the percentage of water absorption was
0.66wt% for the period of 2h immersion. But there was no change in weight
till 24h. Absorption rate increases to 0.99wt% for 168h immersion and
1.032wt%for the immersion period of 480h.Water absorption property in sea
weed composites is mainly because of the presence of lingo cellulosic filler,
since PP is non-polar in nature there is no change in the weight initially till
24h and little absorption was found for 168h and 480h of immersion.
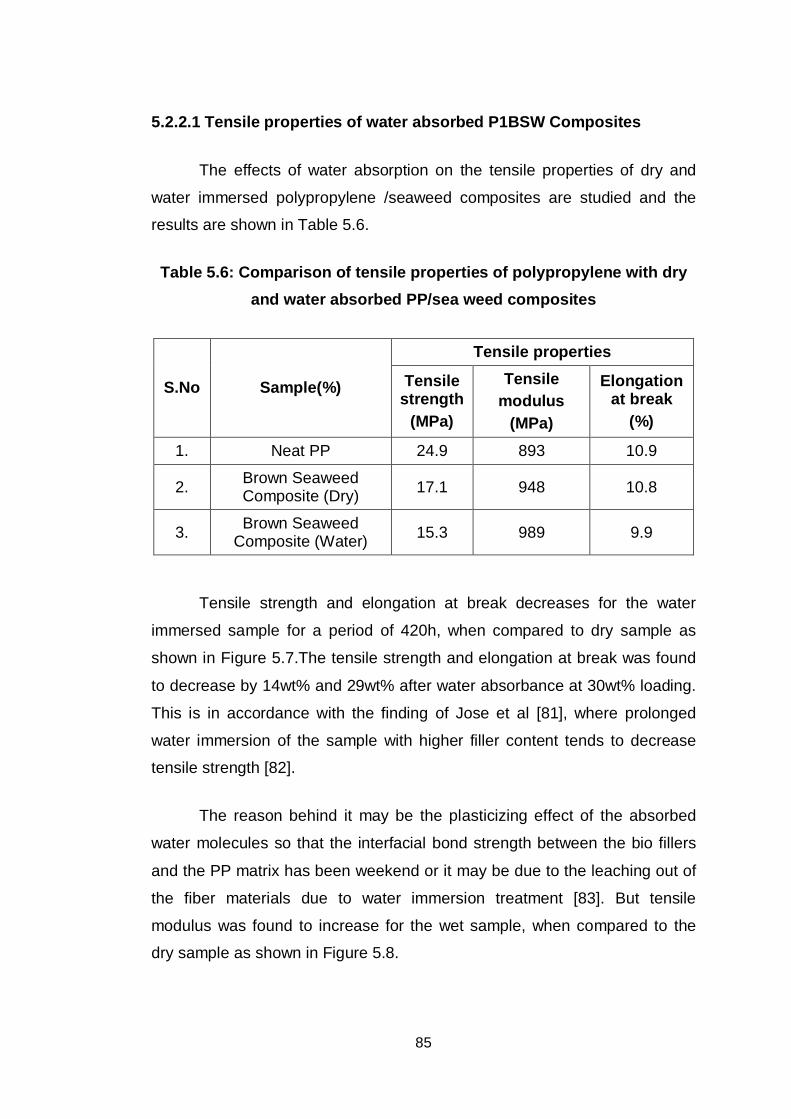
85
5.2.2.1 Tensile properties of water absorbed P1BSW Composites
The effects of water absorption on the tensile properties of dry and
water immersed polypropylene /seaweed composites are studied and the
results are shown in Table 5.6.
Table 5.6: Comparison of tensile properties of polypropylene with dry and water absorbed PP/sea weed composites
S.No Sample(%)
Tensile properties
Tensile strength
(MPa)
Tensile modulus
(MPa)
Elongation at break
(%)
1. Neat PP 24.9 893 10.9
2. Brown Seaweed Composite (Dry) 17.1 948 10.8
3. Brown Seaweed Composite (Water) 15.3 989 9.9
Tensile strength and elongation at break decreases for the water
immersed sample for a period of 420h, when compared to dry sample as
shown in Figure 5.7.The tensile strength and elongation at break was found
to decrease by 14wt% and 29wt% after water absorbance at 30wt% loading.
This is in accordance with the finding of Jose et al [81], where prolonged
water immersion of the sample with higher filler content tends to decrease
tensile strength [82].
The reason behind it may be the plasticizing effect of the absorbed
water molecules so that the interfacial bond strength between the bio fillers
and the PP matrix has been weekend or it may be due to the leaching out of
the fiber materials due to water immersion treatment [83]. But tensile
modulus was found to increase for the wet sample, when compared to the
dry sample as shown in Figure 5.8.
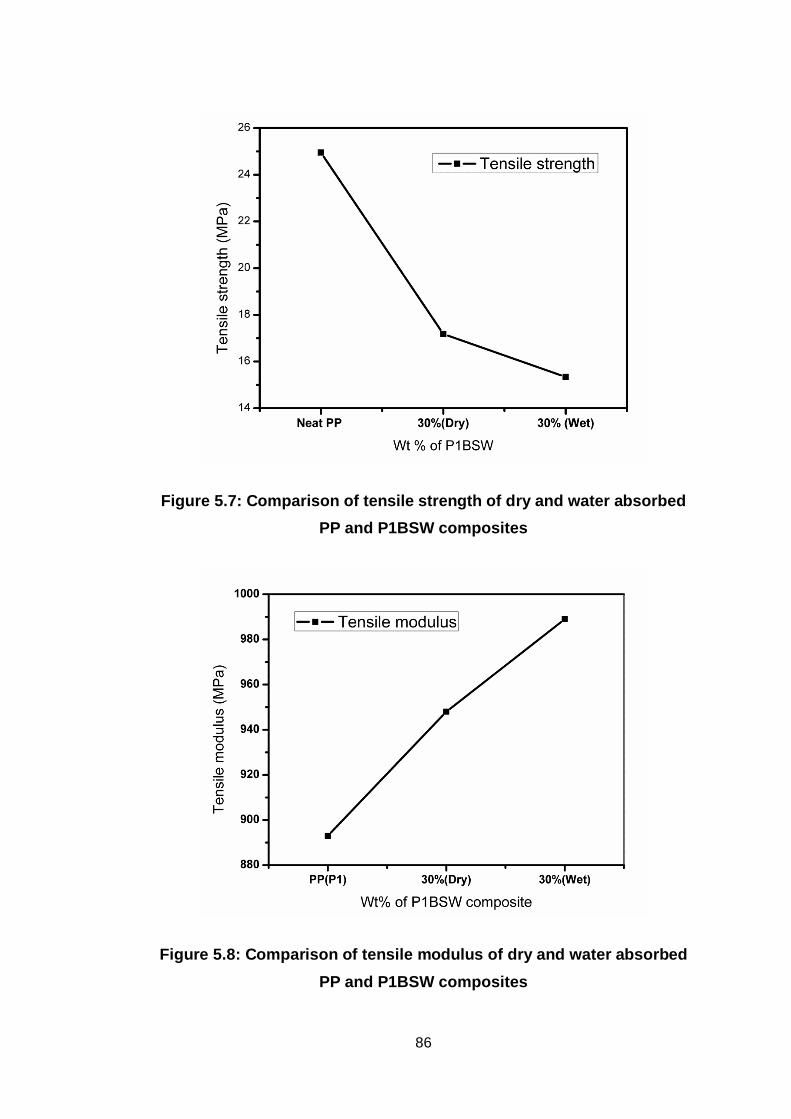
86
Figure 5.7: Comparison of tensile strength of dry and water absorbed PP and P1BSW composites
Figure 5.8: Comparison of tensile modulus of dry and water absorbed PP and P1BSW composites
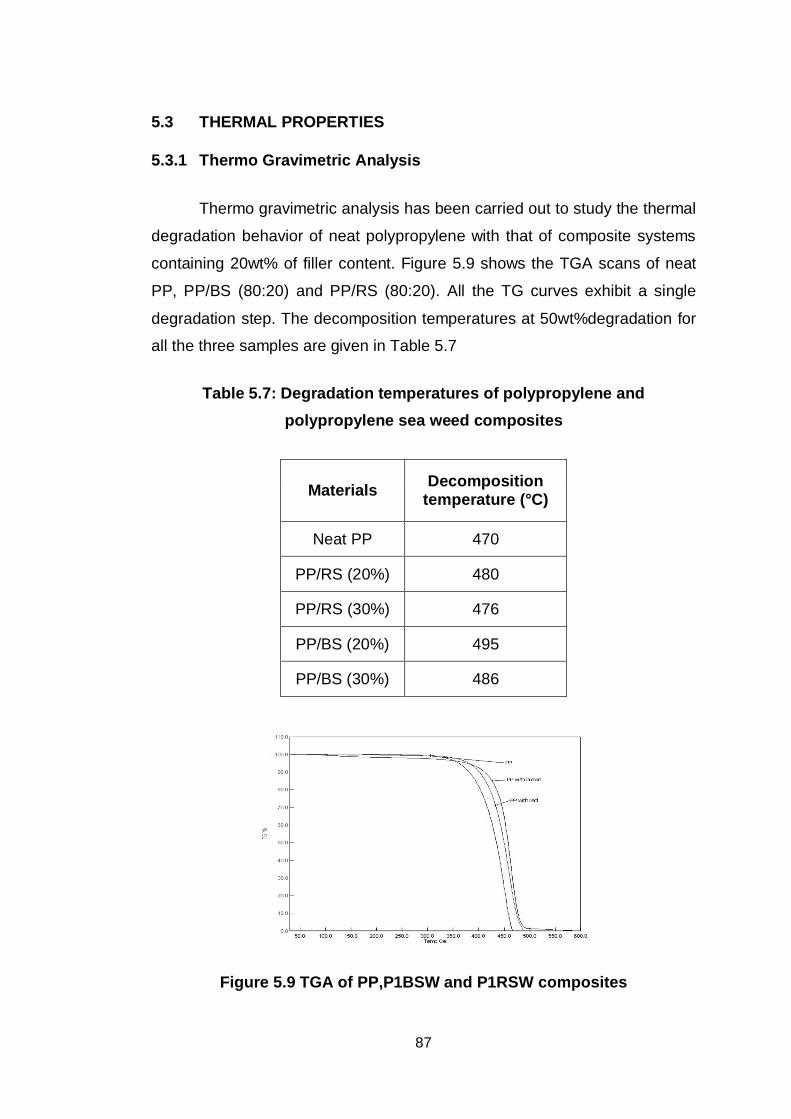
87
5.3 THERMAL PROPERTIES
5.3.1 Thermo Gravimetric Analysis
Thermo gravimetric analysis has been carried out to study the thermal
degradation behavior of neat polypropylene with that of composite systems
containing 20wt% of filler content. Figure 5.9 shows the TGA scans of neat
PP, PP/BS (80:20) and PP/RS (80:20). All the TG curves exhibit a single
degradation step. The decomposition temperatures at 50wt%degradation for
all the three samples are given in Table 5.7
Table 5.7: Degradation temperatures of polypropylene and polypropylene sea weed composites
Materials Decomposition temperature (°C)
Neat PP 470
PP/RS (20%) 480
PP/RS (30%) 476
PP/BS (20%) 495
PP/BS (30%) 486
Figure 5.9 TGA of PP,P1BSW and P1RSW composites
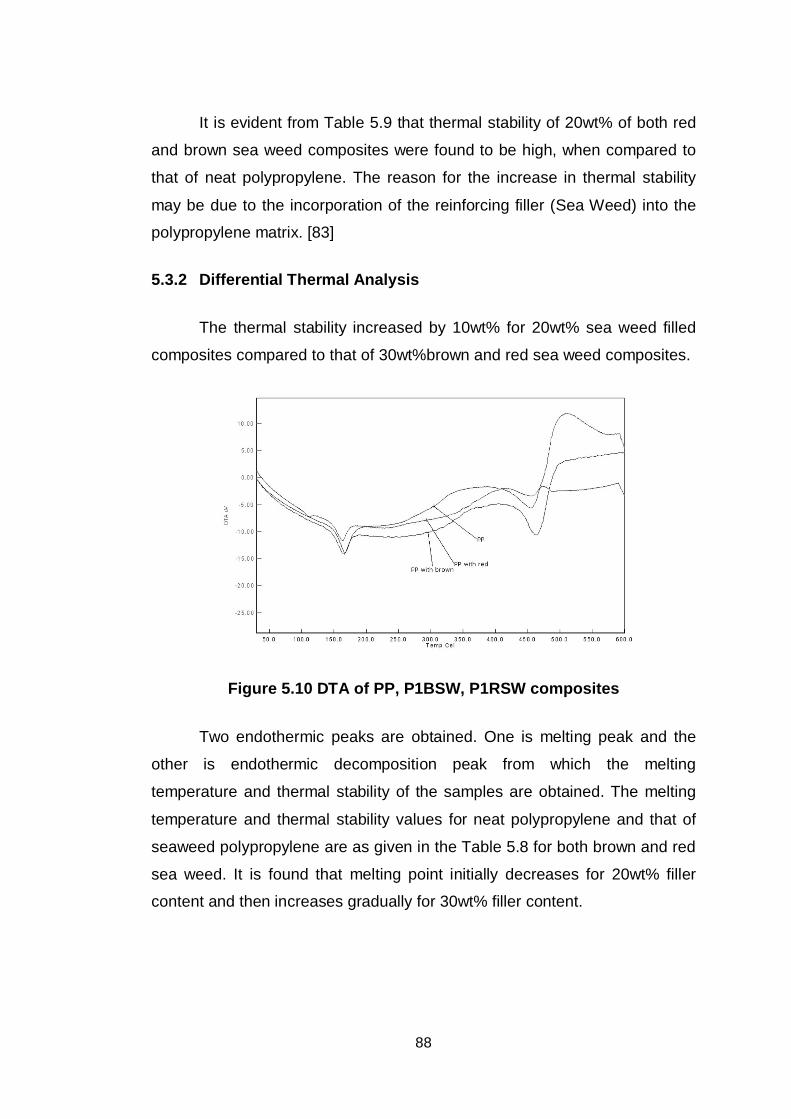
88
It is evident from Table 5.9 that thermal stability of 20wt% of both red
and brown sea weed composites were found to be high, when compared to
that of neat polypropylene. The reason for the increase in thermal stability
may be due to the incorporation of the reinforcing filler (Sea Weed) into the
polypropylene matrix. [83]
5.3.2 Differential Thermal Analysis
The thermal stability increased by 10wt% for 20wt% sea weed filled
composites compared to that of 30wt%brown and red sea weed composites.
Figure 5.10 DTA of PP, P1BSW, P1RSW composites
Two endothermic peaks are obtained. One is melting peak and the
other is endothermic decomposition peak from which the melting
temperature and thermal stability of the samples are obtained. The melting
temperature and thermal stability values for neat polypropylene and that of
seaweed polypropylene are as given in the Table 5.8 for both brown and red
sea weed. It is found that melting point initially decreases for 20wt% filler
content and then increases gradually for 30wt% filler content.
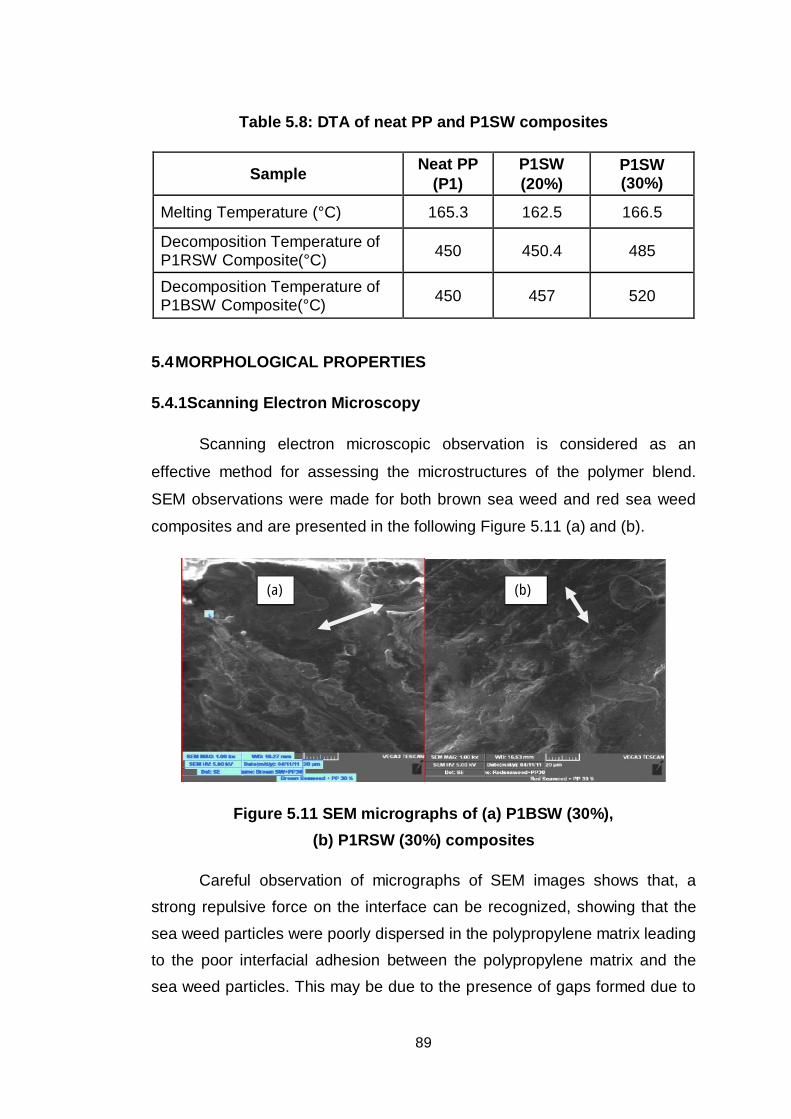
89
Table 5.8: DTA of neat PP and P1SW composites
Sample Neat PP (P1)
P1SW (20%)
P1SW (30%)
Melting Temperature (°C) 165.3 162.5 166.5
Decomposition Temperature of P1RSW Composite(°C) 450 450.4 485
Decomposition Temperature of P1BSW Composite(°C) 450 457 520
5.4 MORPHOLOGICAL PROPERTIES
5.4.1Scanning Electron Microscopy
Scanning electron microscopic observation is considered as an
effective method for assessing the microstructures of the polymer blend.
SEM observations were made for both brown sea weed and red sea weed
composites and are presented in the following Figure 5.11 (a) and (b).
Figure 5.11 SEM micrographs of (a) P1BSW (30%), (b) P1RSW (30%) composites
Careful observation of micrographs of SEM images shows that, a strong repulsive force on the interface can be recognized, showing that the
sea weed particles were poorly dispersed in the polypropylene matrix leading to the poor interfacial adhesion between the polypropylene matrix and the sea weed particles. This may be due to the presence of gaps formed due to
(b) (a)
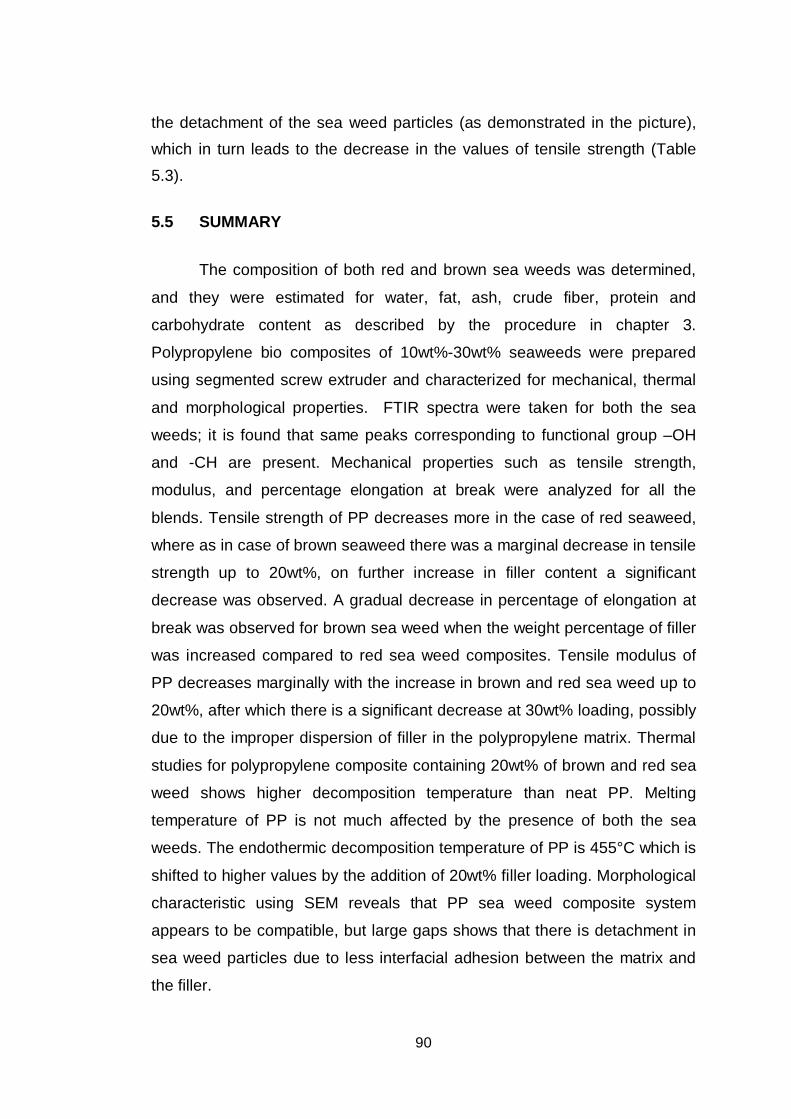
90
the detachment of the sea weed particles (as demonstrated in the picture), which in turn leads to the decrease in the values of tensile strength (Table 5.3).
5.5 SUMMARY
The composition of both red and brown sea weeds was determined,
and they were estimated for water, fat, ash, crude fiber, protein and
carbohydrate content as described by the procedure in chapter 3.
Polypropylene bio composites of 10wt%-30wt% seaweeds were prepared
using segmented screw extruder and characterized for mechanical, thermal
and morphological properties. FTIR spectra were taken for both the sea
weeds; it is found that same peaks corresponding to functional group –OH
and -CH are present. Mechanical properties such as tensile strength,
modulus, and percentage elongation at break were analyzed for all the
blends. Tensile strength of PP decreases more in the case of red seaweed,
where as in case of brown seaweed there was a marginal decrease in tensile
strength up to 20wt%, on further increase in filler content a significant
decrease was observed. A gradual decrease in percentage of elongation at
break was observed for brown sea weed when the weight percentage of filler
was increased compared to red sea weed composites. Tensile modulus of
PP decreases marginally with the increase in brown and red sea weed up to
20wt%, after which there is a significant decrease at 30wt% loading, possibly
due to the improper dispersion of filler in the polypropylene matrix. Thermal
studies for polypropylene composite containing 20wt% of brown and red sea
weed shows higher decomposition temperature than neat PP. Melting
temperature of PP is not much affected by the presence of both the sea
weeds. The endothermic decomposition temperature of PP is 455°C which is
shifted to higher values by the addition of 20wt% filler loading. Morphological
characteristic using SEM reveals that PP sea weed composite system
appears to be compatible, but large gaps shows that there is detachment in
sea weed particles due to less interfacial adhesion between the matrix and
the filler.
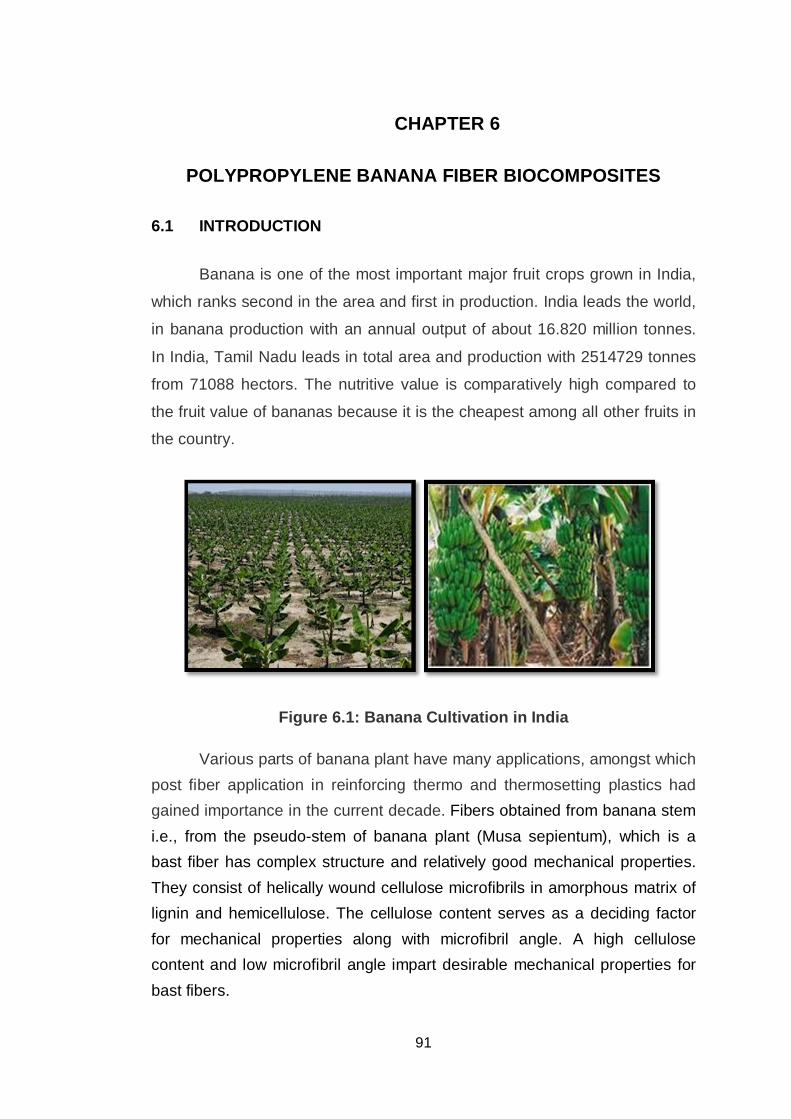
91
CHAPTER 6
POLYPROPYLENE BANANA FIBER BIOCOMPOSITES
6.1 INTRODUCTION
Banana is one of the most important major fruit crops grown in India,
which ranks second in the area and first in production. India leads the world,
in banana production with an annual output of about 16.820 million tonnes.
In India, Tamil Nadu leads in total area and production with 2514729 tonnes
from 71088 hectors. The nutritive value is comparatively high compared to
the fruit value of bananas because it is the cheapest among all other fruits in
the country.
Figure 6.1: Banana Cultivation in India
Various parts of banana plant have many applications, amongst which post fiber application in reinforcing thermo and thermosetting plastics had gained importance in the current decade. Fibers obtained from banana stem i.e., from the pseudo-stem of banana plant (Musa sepientum), which is a bast fiber has complex structure and relatively good mechanical properties. They consist of helically wound cellulose microfibrils in amorphous matrix of lignin and hemicellulose. The cellulose content serves as a deciding factor for mechanical properties along with microfibril angle. A high cellulose content and low microfibril angle impart desirable mechanical properties for bast fibers.
92
Lignin are composed of nine carbon units derived from substituted cinnamyl alcohol which is in turn associated with the hemicelluloses and play an important role in the natural decay resistance of the lingo cellulosic material. [85]
It can be noted that cellulose is the main constituent of plant fibers followed by hemi-celluloses and lignin interchangeably and pectin respectively. Cellulose present in the plant fiber in turn acts as the reinforcement for lignin, hemi cellulose and pectin. This makes plant fibers exhibit characteristics of a composite material. [86]
From the available literature as described in chapter 2, it was observed that the banana fiber possesses good specific strength properties comparable to those of conventional materials like glass fibers. Therefore utilization and application of the cheaper goods in high performance appliance is possible with the help of this composite technology.
Alkali treatments have been proven effective in removing impurities from the fiber, decreasing water sorption and enabling mechanical bonding and thereby improving matrix interface interaction. Therefore an effort had been taken to treat the banana fibers with sodium hydroxide (6wt%) and mechanical, thermal and morphological properties were studied for both untreated and treated fibers.
Polypropylene (Repol B650)was compounded with 10wt%-30wt%
banana fruit stem fiber (for simplicity mentioned as BF)were studied. Test
specimens were made as per ASTM standards and tested as described in
chapter 3. The results pertaining to polypropylene banana fiber composites,
their composition, mechanical, thermal and morphological studies are
discussed in this chapter.
6.1.1 Composition of Banana Fiber(BF)
The composition of Banana fiber was determined according to the procedure described in the Chapter 3 and the results are presented in Table 6.1.
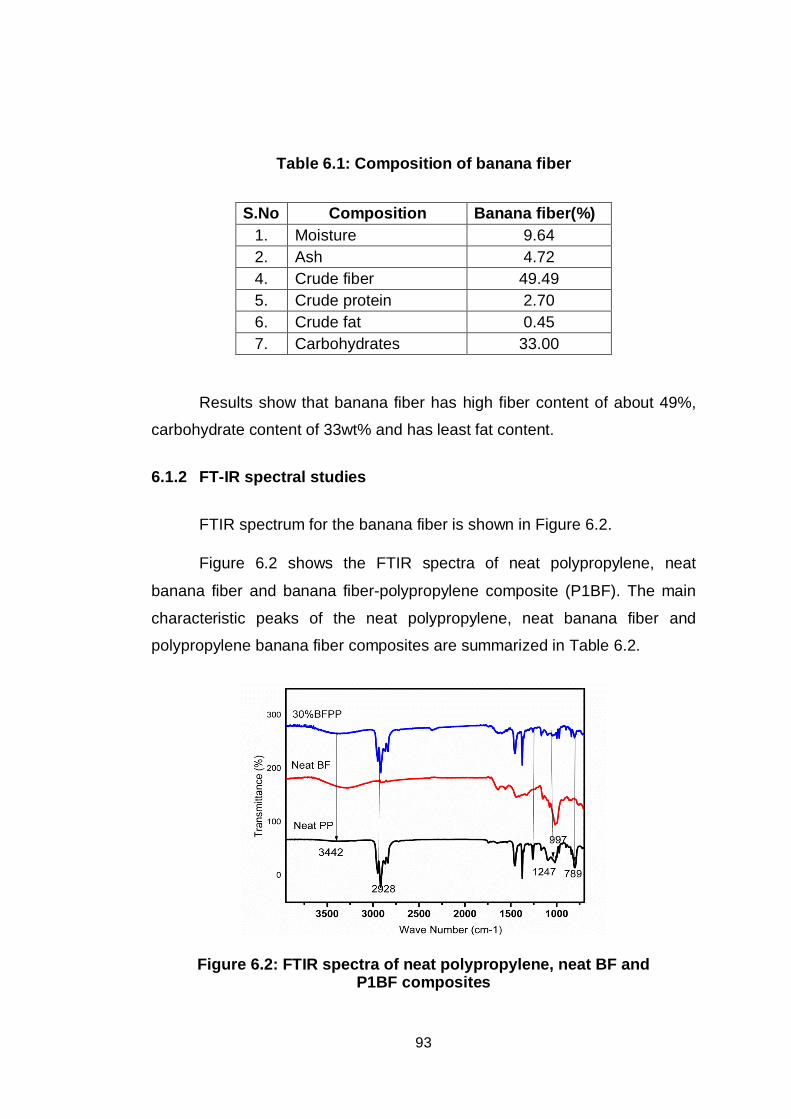
93
Table 6.1: Composition of banana fiber
S.No Composition Banana fiber(%) 1. Moisture 9.64 2. Ash 4.72 4. Crude fiber 49.49 5. Crude protein 2.70 6. Crude fat 0.45 7. Carbohydrates 33.00
Results show that banana fiber has high fiber content of about 49%,
carbohydrate content of 33wt% and has least fat content.
6.1.2 FT-IR spectral studies
FTIR spectrum for the banana fiber is shown in Figure 6.2.
Figure 6.2 shows the FTIR spectra of neat polypropylene, neat
banana fiber and banana fiber-polypropylene composite (P1BF). The main
characteristic peaks of the neat polypropylene, neat banana fiber and
polypropylene banana fiber composites are summarized in Table 6.2.
Figure 6.2: FTIR spectra of neat polypropylene, neat BF and P1BF composites
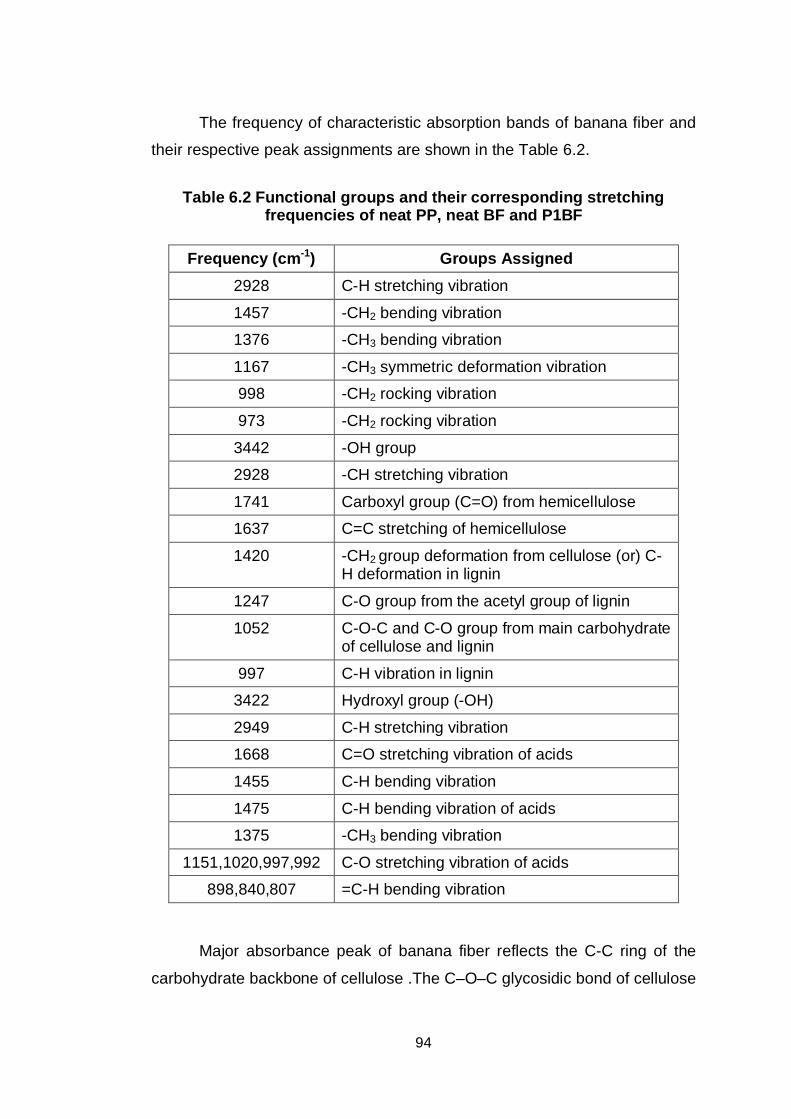
94
The frequency of characteristic absorption bands of banana fiber and
their respective peak assignments are shown in the Table 6.2.
Table 6.2 Functional groups and their corresponding stretching frequencies of neat PP, neat BF and P1BF
Frequency (cm-1) Groups Assigned 2928 C-H stretching vibration
1457 -CH2 bending vibration
1376 -CH3 bending vibration
1167 -CH3 symmetric deformation vibration
998 -CH2 rocking vibration
973 -CH2 rocking vibration
3442 -OH group
2928 -CH stretching vibration
1741 Carboxyl group (C=O) from hemicellulose
1637 C=C stretching of hemicellulose
1420 -CH2 group deformation from cellulose (or) C-H deformation in lignin
1247 C-O group from the acetyl group of lignin
1052 C-O-C and C-O group from main carbohydrate of cellulose and lignin
997 C-H vibration in lignin
3422 Hydroxyl group (-OH)
2949 C-H stretching vibration
1668 C=O stretching vibration of acids
1455 C-H bending vibration
1475 C-H bending vibration of acids
1375 -CH3 bending vibration
1151,1020,997,992 C-O stretching vibration of acids
898,840,807 =C-H bending vibration
Major absorbance peak of banana fiber reflects the C-C ring of the
carbohydrate backbone of cellulose .The C–O–C glycosidic bond of cellulose
95
was detected by the stretching vibration band to 1052cm-1. The C–OH of the
cellulose backbone (C–O secondary and C–O primary alcohols)
corresponded to the 1051cm-1and 1020cm-1 peak respectively for the
banana fiber composite. Peaks due to alcohol groups of cellulose (-OH
deformation) were located at 1375cm-1 and 1376cm-1 for the composite and
neat polypropylene respectively. The 1455cm-1band was attributed to the
CH2 bending of cellulose. The band observed in the 3422cm-1region was
mainly related to the -OH groups. Characteristic peaks relevant to
polypropylene were observed as indicated in the Table 6.2. All the bands in
the region between1700cm-1-500cm-1were absent, which may be due to the
higher processing temperature of the composites. [87]
On comparing the results with respect to untreated fiber composites
(Figure 6.3) with that of treated banana fiber composites (Figure 6.4), the
strong aromatic peak at 1595cm-1present in the untreated composite is found
to disappear. In case of treated composite, the peak at 1639cm-1relevant to
C-C stretching frequency of hemicellulose is present, but peak at 1745cm-1 is
absent. All these changes may be due to chemical treatment with sodium
hydroxide.[88] The peak corresponding to –OH bond had become intense in
the treated composite due to hydrogen bonding. [89]
Figure 6.3 FTIR spectra of untreated banana fiber composites
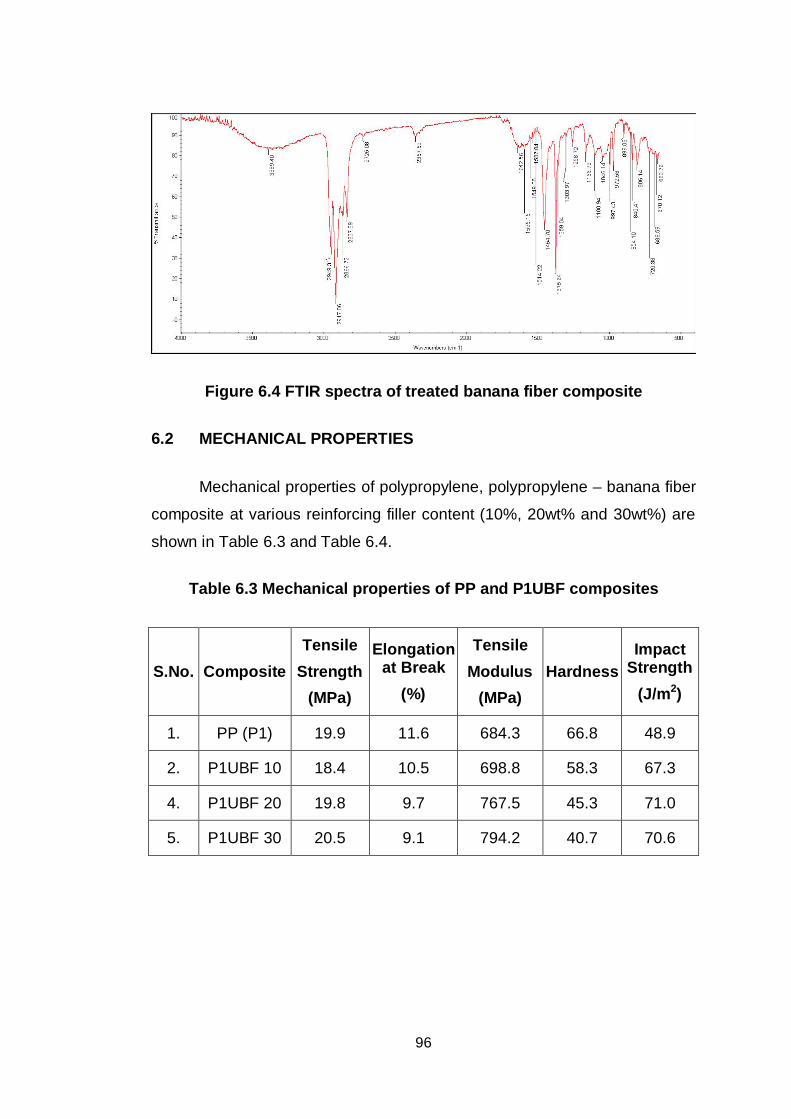
96
Figure 6.4 FTIR spectra of treated banana fiber composite
6.2 MECHANICAL PROPERTIES
Mechanical properties of polypropylene, polypropylene – banana fiber
composite at various reinforcing filler content (10%, 20wt% and 30wt%) are
shown in Table 6.3 and Table 6.4.
Table 6.3 Mechanical properties of PP and P1UBF composites
S.No. Composite Tensile
Strength (MPa)
Elongation at Break
(%)
Tensile Modulus
(MPa) Hardness
Impact Strength
(J/m2)
1. PP (P1) 19.9 11.6 684.3 66.8 48.9
2. P1UBF 10 18.4 10.5 698.8 58.3 67.3
4. P1UBF 20 19.8 9.7 767.5 45.3 71.0
5. P1UBF 30 20.5 9.1 794.2 40.7 70.6
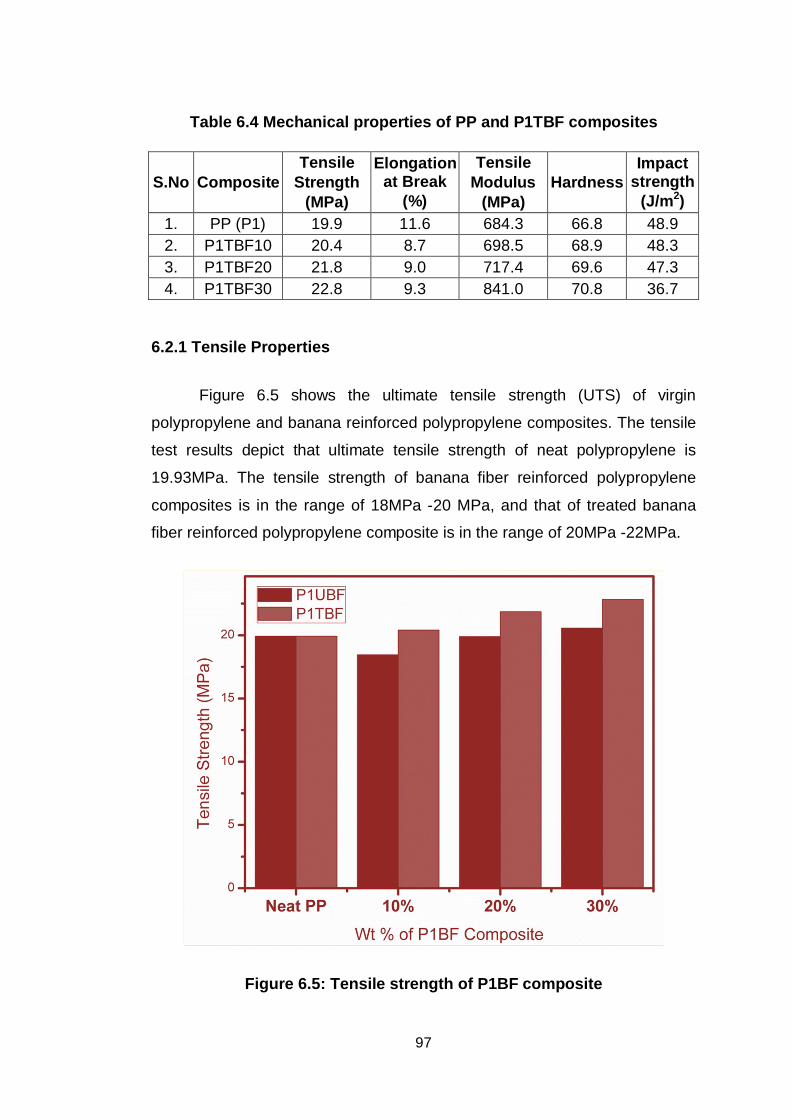
97
Table 6.4 Mechanical properties of PP and P1TBF composites
S.No Composite Tensile
Strength (MPa)
Elongation at Break
(%)
Tensile Modulus
(MPa) Hardness
Impact strength
(J/m2) 1. PP (P1) 19.9 11.6 684.3 66.8 48.9 2. P1TBF10 20.4 8.7 698.5 68.9 48.3 3. P1TBF20 21.8 9.0 717.4 69.6 47.3 4. P1TBF30 22.8 9.3 841.0 70.8 36.7
6.2.1 Tensile Properties
Figure 6.5 shows the ultimate tensile strength (UTS) of virgin
polypropylene and banana reinforced polypropylene composites. The tensile
test results depict that ultimate tensile strength of neat polypropylene is
19.93MPa. The tensile strength of banana fiber reinforced polypropylene
composites is in the range of 18MPa -20 MPa, and that of treated banana
fiber reinforced polypropylene composite is in the range of 20MPa -22MPa.
Figure 6.5: Tensile strength of P1BF composite
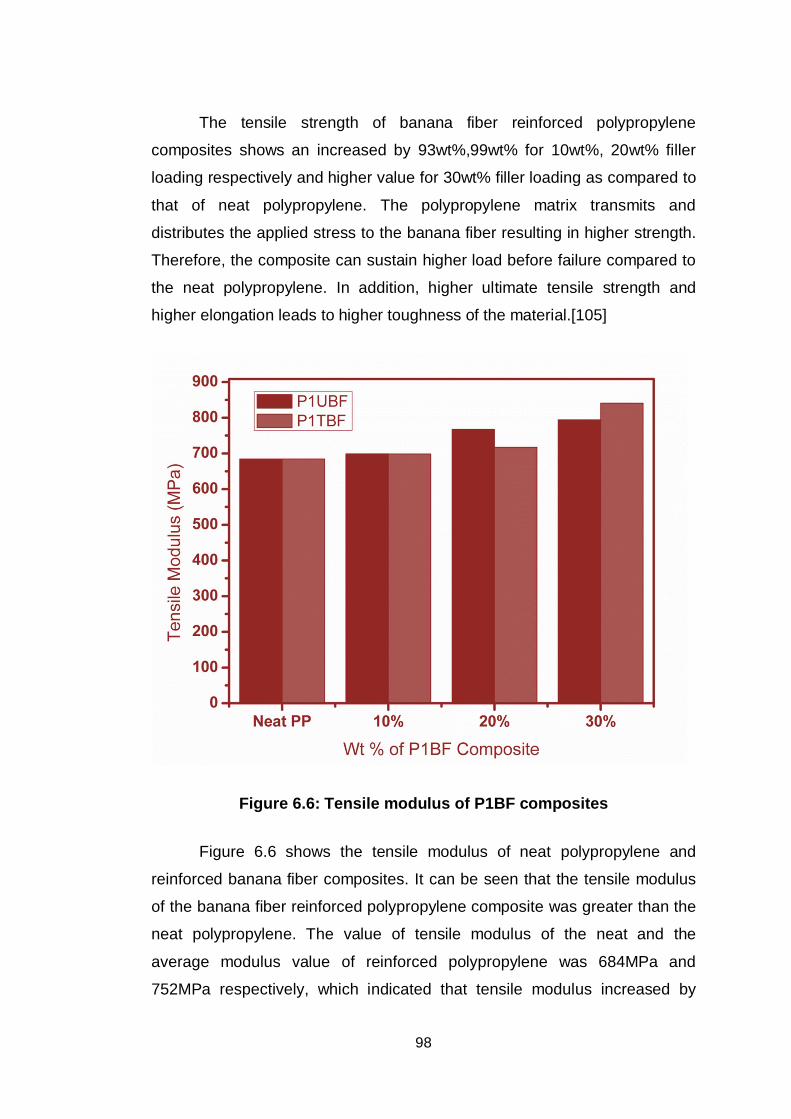
98
The tensile strength of banana fiber reinforced polypropylene
composites shows an increased by 93wt%,99wt% for 10wt%, 20wt% filler
loading respectively and higher value for 30wt% filler loading as compared to
that of neat polypropylene. The polypropylene matrix transmits and
distributes the applied stress to the banana fiber resulting in higher strength.
Therefore, the composite can sustain higher load before failure compared to
the neat polypropylene. In addition, higher ultimate tensile strength and
higher elongation leads to higher toughness of the material.[105]
Figure 6.6: Tensile modulus of P1BF composites
Figure 6.6 shows the tensile modulus of neat polypropylene and
reinforced banana fiber composites. It can be seen that the tensile modulus
of the banana fiber reinforced polypropylene composite was greater than the
neat polypropylene. The value of tensile modulus of the neat and the
average modulus value of reinforced polypropylene was 684MPa and
752MPa respectively, which indicated that tensile modulus increased by
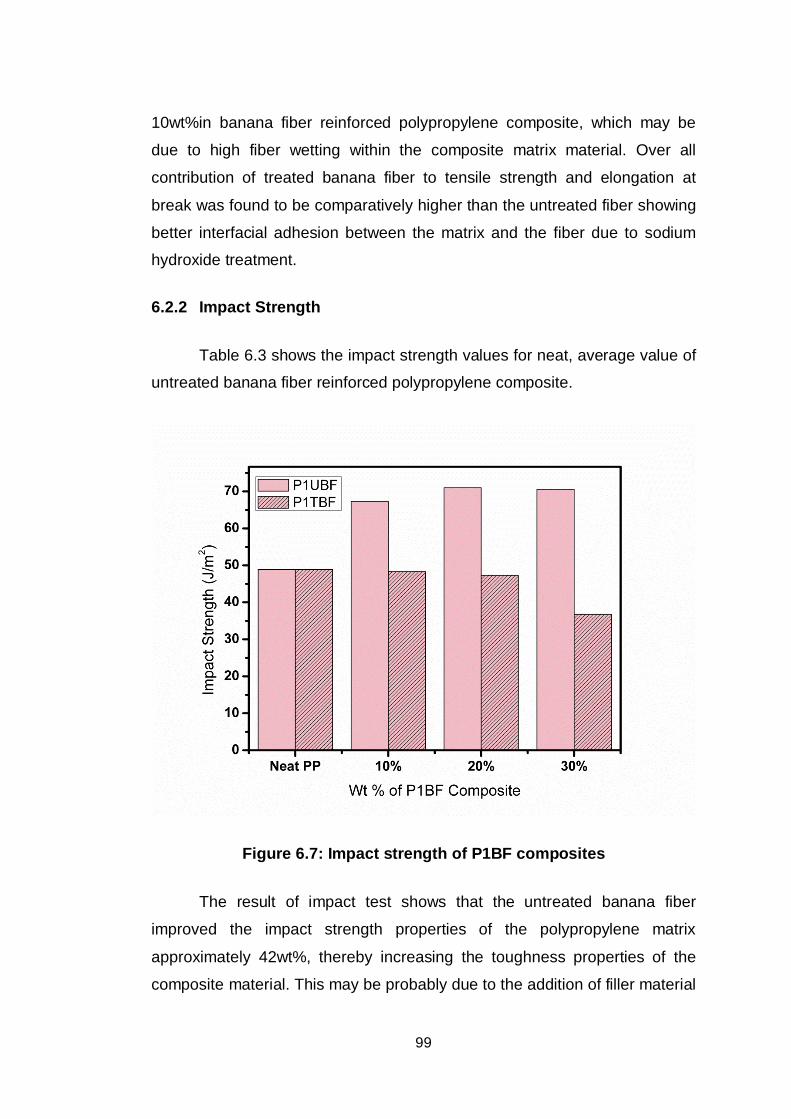
99
10wt%in banana fiber reinforced polypropylene composite, which may be
due to high fiber wetting within the composite matrix material. Over all
contribution of treated banana fiber to tensile strength and elongation at
break was found to be comparatively higher than the untreated fiber showing
better interfacial adhesion between the matrix and the fiber due to sodium
hydroxide treatment.
6.2.2 Impact Strength
Table 6.3 shows the impact strength values for neat, average value of
untreated banana fiber reinforced polypropylene composite.
Figure 6.7: Impact strength of P1BF composites
The result of impact test shows that the untreated banana fiber
improved the impact strength properties of the polypropylene matrix
approximately 42wt%, thereby increasing the toughness properties of the
composite material. This may be probably due to the addition of filler material
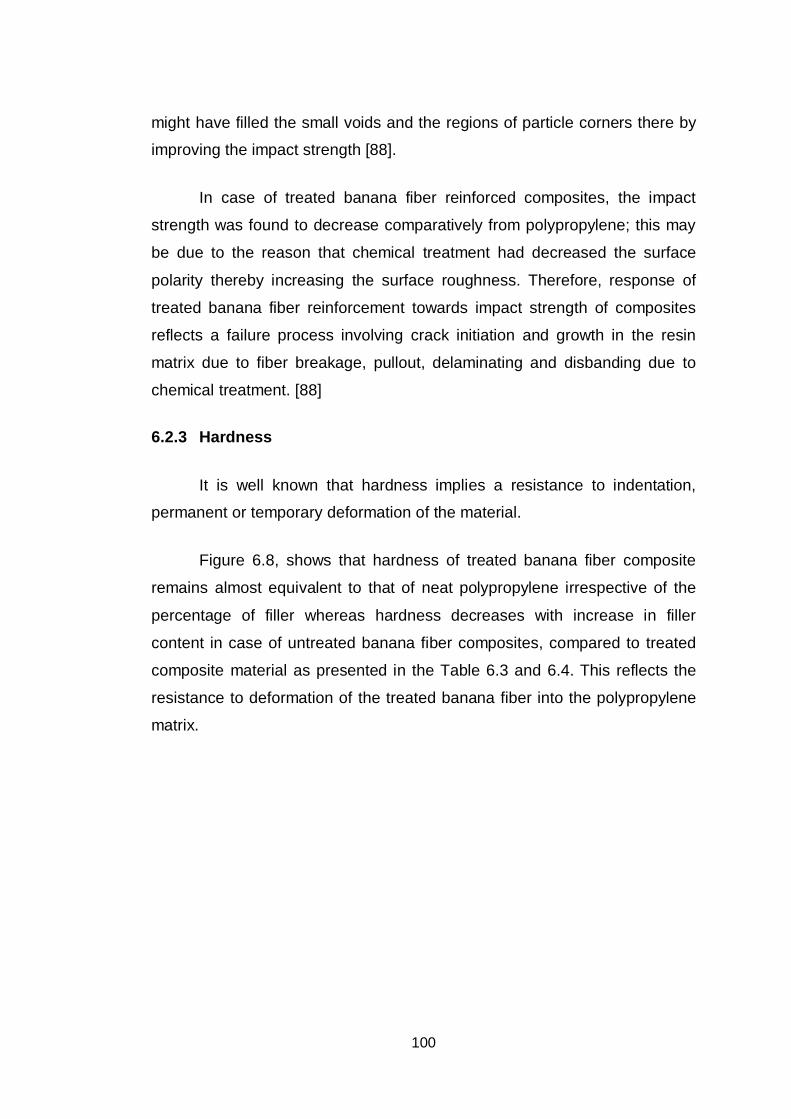
100
might have filled the small voids and the regions of particle corners there by
improving the impact strength [88].
In case of treated banana fiber reinforced composites, the impact
strength was found to decrease comparatively from polypropylene; this may
be due to the reason that chemical treatment had decreased the surface
polarity thereby increasing the surface roughness. Therefore, response of
treated banana fiber reinforcement towards impact strength of composites
reflects a failure process involving crack initiation and growth in the resin
matrix due to fiber breakage, pullout, delaminating and disbanding due to
chemical treatment. [88]
6.2.3 Hardness
It is well known that hardness implies a resistance to indentation,
permanent or temporary deformation of the material.
Figure 6.8, shows that hardness of treated banana fiber composite
remains almost equivalent to that of neat polypropylene irrespective of the
percentage of filler whereas hardness decreases with increase in filler
content in case of untreated banana fiber composites, compared to treated
composite material as presented in the Table 6.3 and 6.4. This reflects the
resistance to deformation of the treated banana fiber into the polypropylene
matrix.
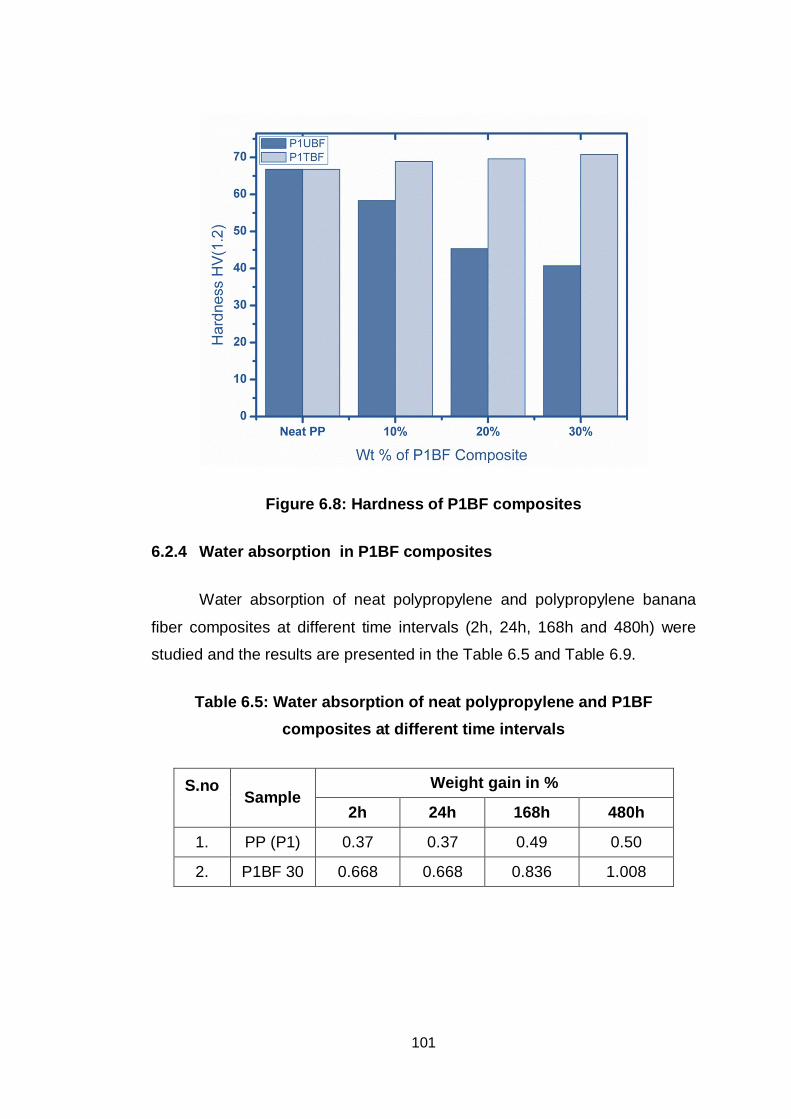
101
Figure 6.8: Hardness of P1BF composites
6.2.4 Water absorption in P1BF composites
Water absorption of neat polypropylene and polypropylene banana
fiber composites at different time intervals (2h, 24h, 168h and 480h) were
studied and the results are presented in the Table 6.5 and Table 6.9.
Table 6.5: Water absorption of neat polypropylene and P1BF composites at different time intervals
S.no
Sample Weight gain in %
2h 24h 168h 480h
1. PP (P1) 0.37 0.37 0.49 0.50
2. P1BF 30 0.668 0.668 0.836 1.008
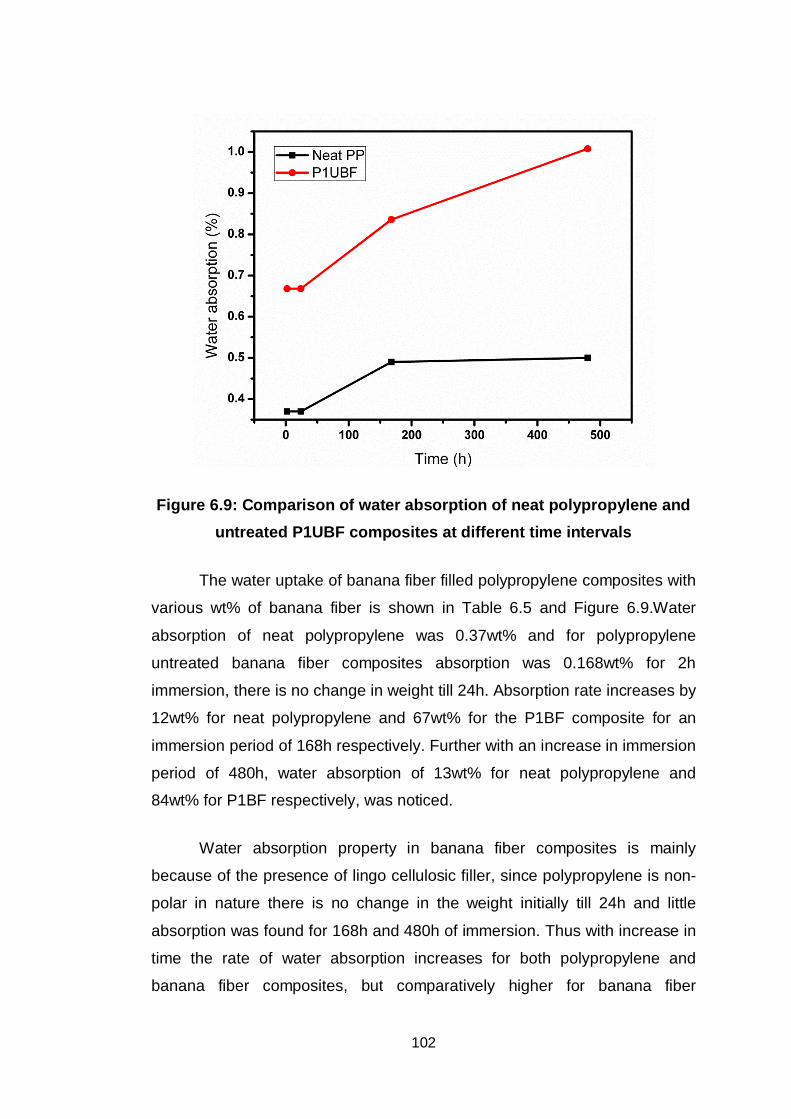
102
Figure 6.9: Comparison of water absorption of neat polypropylene and untreated P1UBF composites at different time intervals
The water uptake of banana fiber filled polypropylene composites with
various wt% of banana fiber is shown in Table 6.5 and Figure 6.9.Water
absorption of neat polypropylene was 0.37wt% and for polypropylene
untreated banana fiber composites absorption was 0.168wt% for 2h
immersion, there is no change in weight till 24h. Absorption rate increases by
12wt% for neat polypropylene and 67wt% for the P1BF composite for an
immersion period of 168h respectively. Further with an increase in immersion
period of 480h, water absorption of 13wt% for neat polypropylene and
84wt% for P1BF respectively, was noticed.
Water absorption property in banana fiber composites is mainly
because of the presence of lingo cellulosic filler, since polypropylene is non-
polar in nature there is no change in the weight initially till 24h and little
absorption was found for 168h and 480h of immersion. Thus with increase in
time the rate of water absorption increases for both polypropylene and
banana fiber composites, but comparatively higher for banana fiber
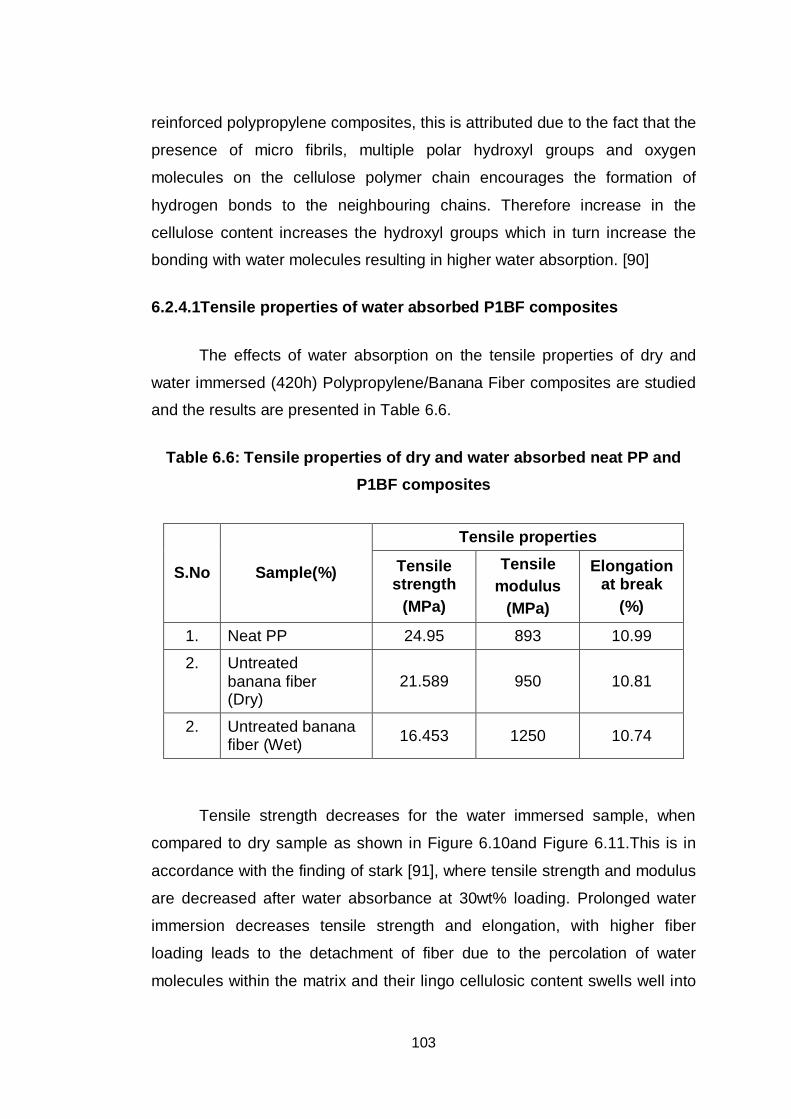
103
reinforced polypropylene composites, this is attributed due to the fact that the
presence of micro fibrils, multiple polar hydroxyl groups and oxygen
molecules on the cellulose polymer chain encourages the formation of
hydrogen bonds to the neighbouring chains. Therefore increase in the
cellulose content increases the hydroxyl groups which in turn increase the
bonding with water molecules resulting in higher water absorption. [90]
6.2.4.1Tensile properties of water absorbed P1BF composites
The effects of water absorption on the tensile properties of dry and
water immersed (420h) Polypropylene/Banana Fiber composites are studied
and the results are presented in Table 6.6.
Table 6.6: Tensile properties of dry and water absorbed neat PP and P1BF composites
S.No Sample(%)
Tensile properties
Tensile strength
(MPa)
Tensile modulus
(MPa)
Elongation at break
(%)
1. Neat PP 24.95 893 10.99
2. Untreated banana fiber (Dry)
21.589 950 10.81
2. Untreated banana fiber (Wet) 16.453 1250 10.74
Tensile strength decreases for the water immersed sample, when
compared to dry sample as shown in Figure 6.10and Figure 6.11.This is in
accordance with the finding of stark [91], where tensile strength and modulus
are decreased after water absorbance at 30wt% loading. Prolonged water
immersion decreases tensile strength and elongation, with higher fiber
loading leads to the detachment of fiber due to the percolation of water
molecules within the matrix and their lingo cellulosic content swells well into
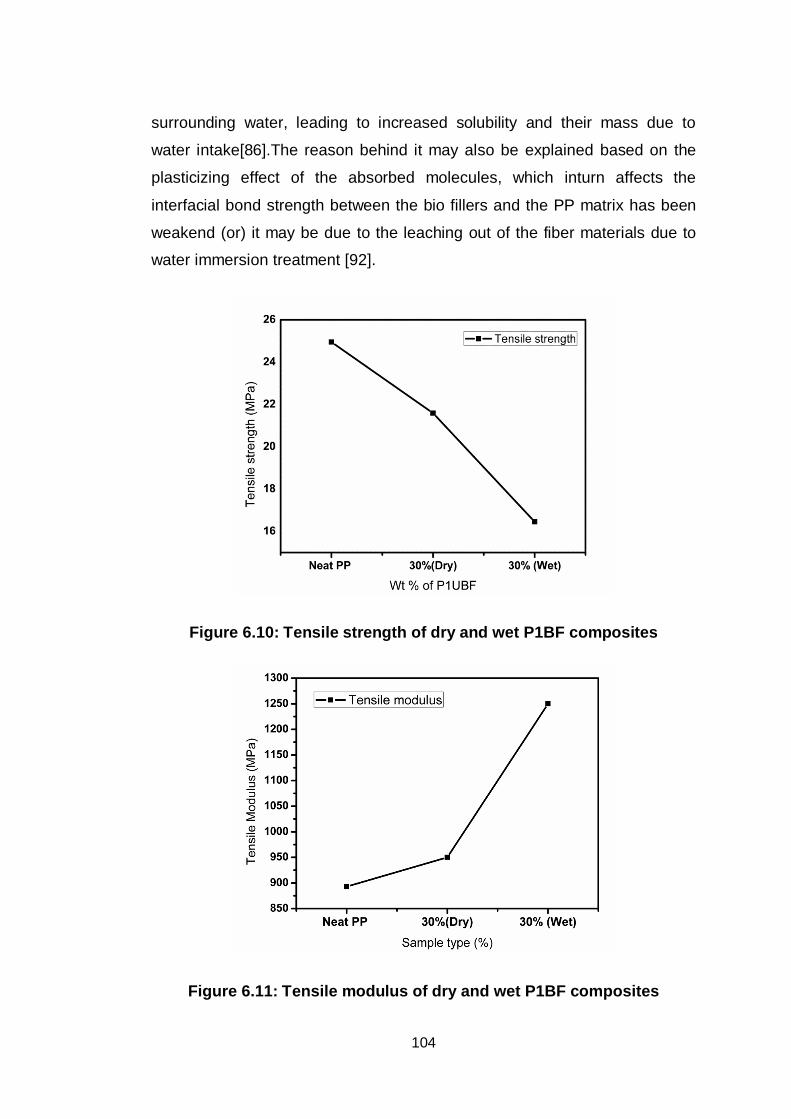
104
surrounding water, leading to increased solubility and their mass due to
water intake[86].The reason behind it may also be explained based on the
plasticizing effect of the absorbed molecules, which inturn affects the
interfacial bond strength between the bio fillers and the PP matrix has been
weakend (or) it may be due to the leaching out of the fiber materials due to
water immersion treatment [92].
Figure 6.10: Tensile strength of dry and wet P1BF composites
Figure 6.11: Tensile modulus of dry and wet P1BF composites
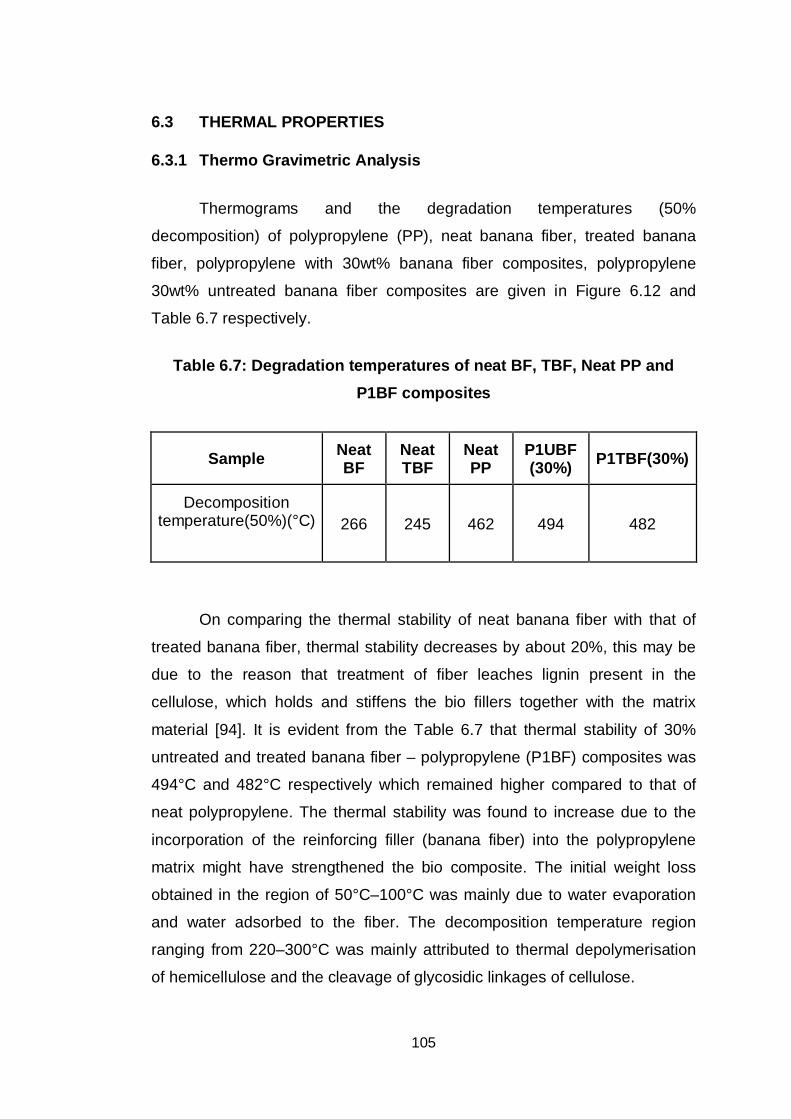
105
6.3 THERMAL PROPERTIES
6.3.1 Thermo Gravimetric Analysis
Thermograms and the degradation temperatures (50%
decomposition) of polypropylene (PP), neat banana fiber, treated banana
fiber, polypropylene with 30wt% banana fiber composites, polypropylene
30wt% untreated banana fiber composites are given in Figure 6.12 and
Table 6.7 respectively.
Table 6.7: Degradation temperatures of neat BF, TBF, Neat PP and P1BF composites
Sample Neat BF
Neat TBF
Neat PP
P1UBF (30%) P1TBF(30%)
Decomposition temperature(50%)(°C)
266 245 462 494 482
On comparing the thermal stability of neat banana fiber with that of
treated banana fiber, thermal stability decreases by about 20%, this may be
due to the reason that treatment of fiber leaches lignin present in the
cellulose, which holds and stiffens the bio fillers together with the matrix
material [94]. It is evident from the Table 6.7 that thermal stability of 30%
untreated and treated banana fiber – polypropylene (P1BF) composites was
494°C and 482°C respectively which remained higher compared to that of
neat polypropylene. The thermal stability was found to increase due to the
incorporation of the reinforcing filler (banana fiber) into the polypropylene
matrix might have strengthened the bio composite. The initial weight loss
obtained in the region of 50°C–100°C was mainly due to water evaporation
and water adsorbed to the fiber. The decomposition temperature region
ranging from 220–300°C was mainly attributed to thermal depolymerisation
of hemicellulose and the cleavage of glycosidic linkages of cellulose.
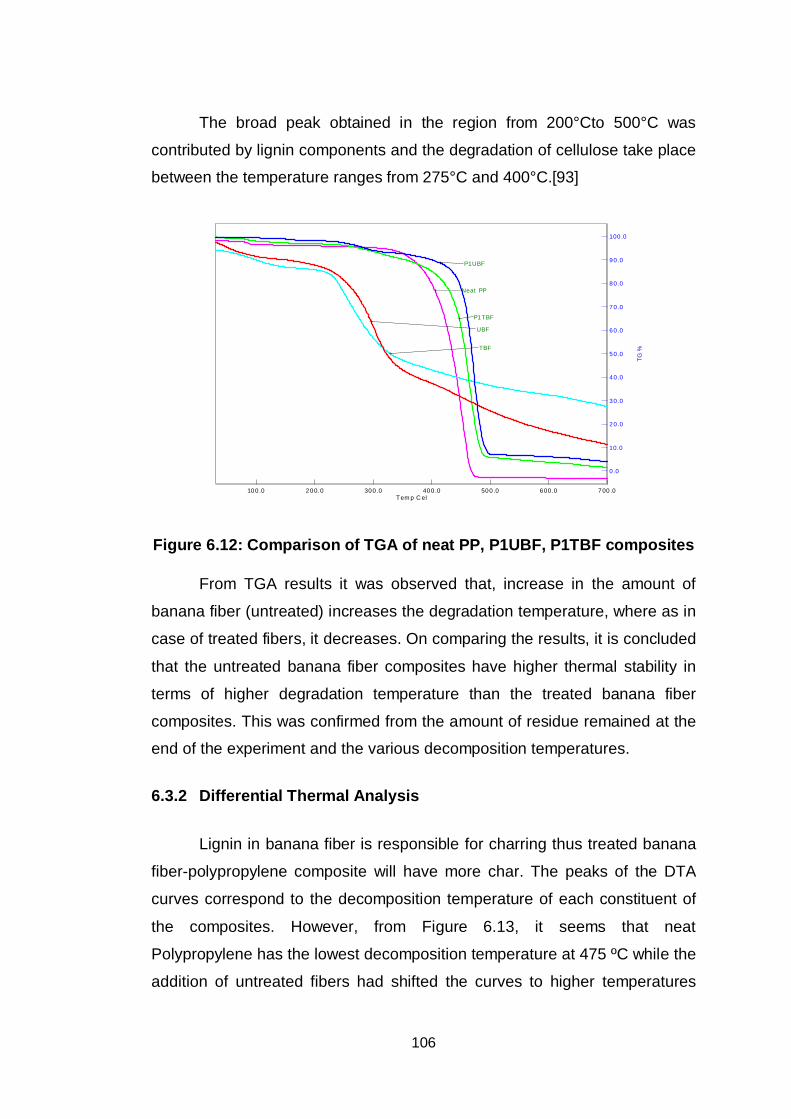
106
The broad peak obtained in the region from 200°Cto 500°C was
contributed by lignin components and the degradation of cellulose take place
between the temperature ranges from 275°C and 400°C.[93]
Figure 6.12: Comparison of TGA of neat PP, P1UBF, P1TBF composites
From TGA results it was observed that, increase in the amount of
banana fiber (untreated) increases the degradation temperature, where as in
case of treated fibers, it decreases. On comparing the results, it is concluded
that the untreated banana fiber composites have higher thermal stability in
terms of higher degradation temperature than the treated banana fiber
composites. This was confirmed from the amount of residue remained at the
end of the experiment and the various decomposition temperatures.
6.3.2 Differential Thermal Analysis
Lignin in banana fiber is responsible for charring thus treated banana
fiber-polypropylene composite will have more char. The peaks of the DTA
curves correspond to the decomposition temperature of each constituent of
the composites. However, from Figure 6.13, it seems that neat
Polypropylene has the lowest decomposition temperature at 475 ºC while the
addition of untreated fibers had shifted the curves to higher temperatures
Tem p C el700 .0600 .0500 .0400 .0300 .0200.0100 .0
TG %
100 .0
90 .0
80 .0
70 .0
60 .0
50 .0
40 .0
30 .0
20 .0
10.0
0 .0
Neat PP
TBF
P1TBF
UBF
P1UBF
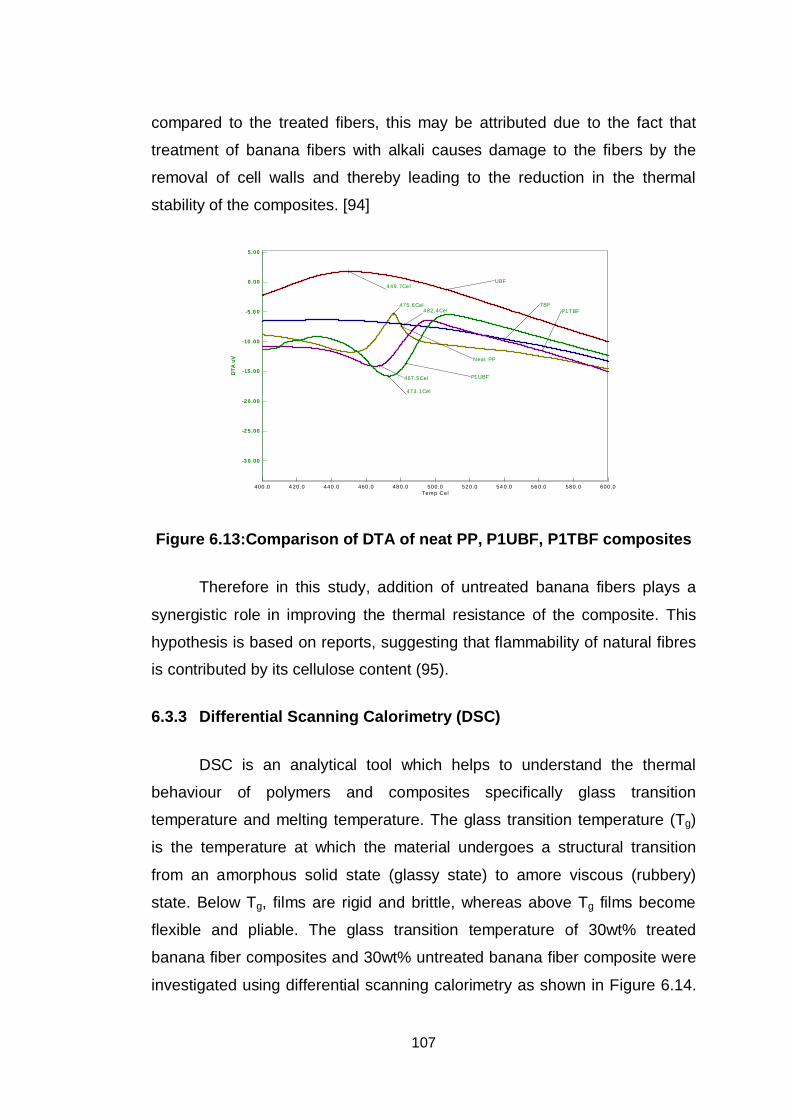
107
compared to the treated fibers, this may be attributed due to the fact that
treatment of banana fibers with alkali causes damage to the fibers by the
removal of cell walls and thereby leading to the reduction in the thermal
stability of the composites. [94]
Figure 6.13:Comparison of DTA of neat PP, P1UBF, P1TBF composites
Therefore in this study, addition of untreated banana fibers plays a
synergistic role in improving the thermal resistance of the composite. This
hypothesis is based on reports, suggesting that flammability of natural fibres
is contributed by its cellulose content (95).
6.3.3 Differential Scanning Calorimetry (DSC)
DSC is an analytical tool which helps to understand the thermal
behaviour of polymers and composites specifically glass transition
temperature and melting temperature. The glass transition temperature (Tg)
is the temperature at which the material undergoes a structural transition
from an amorphous solid state (glassy state) to amore viscous (rubbery)
state. Below Tg, films are rigid and brittle, whereas above Tg films become
flexible and pliable. The glass transition temperature of 30wt% treated
banana fiber composites and 30wt% untreated banana fiber composite were
investigated using differential scanning calorimetry as shown in Figure 6.14.
Temp Cel600.0580.056 0.054 0.0520.0500.048 0.0460.0440.04 20.0400 .0
DTA
uV
5 .00
0.00
-5 .0 0
-10 .00
-15 .00
-2 0.00
-2 5.00
-3 0.00
N eat PP
475.6Cel TBF482.4Ce l P1TBF
467.5Cel
UBF449.7Ce l
P1UBF
473.1Cel
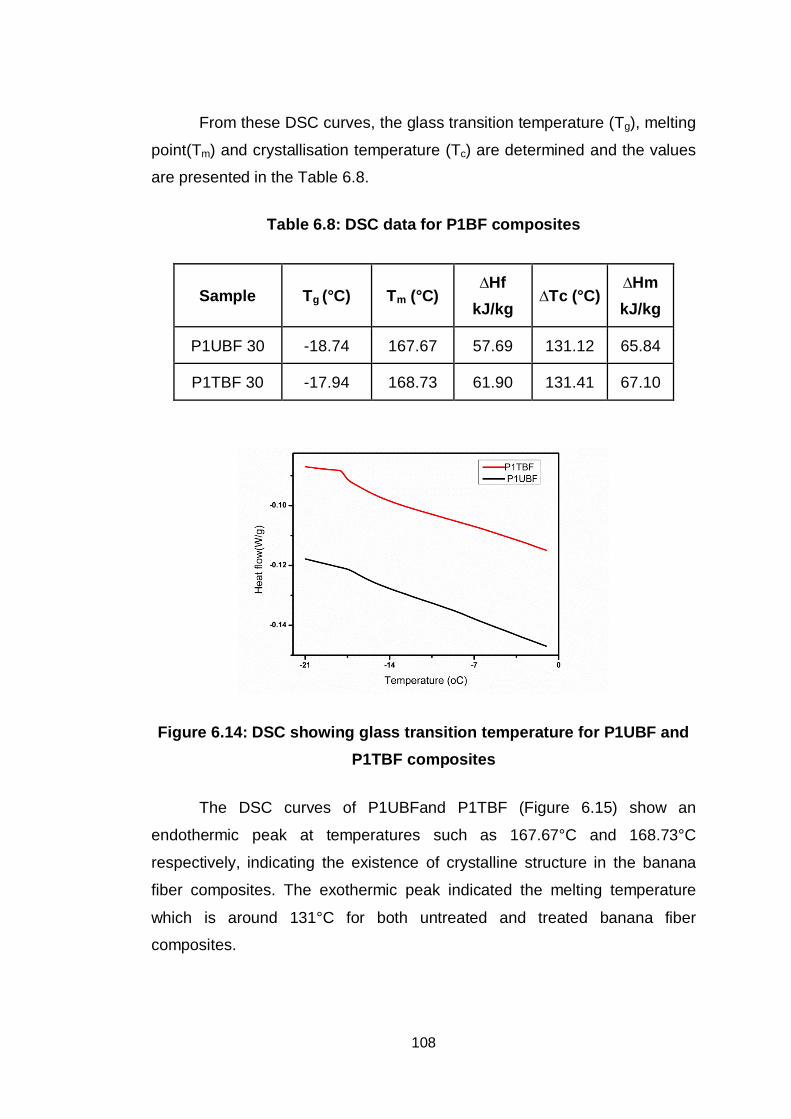
108
From these DSC curves, the glass transition temperature (Tg), melting
point(Tm) and crystallisation temperature (Tc) are determined and the values
are presented in the Table 6.8.
Table 6.8: DSC data for P1BF composites
Sample Tg (°C) Tm (°C) Hf
kJ/kg Tc (°C)
Hm kJ/kg
P1UBF 30 -18.74 167.67 57.69 131.12 65.84
P1TBF 30 -17.94 168.73 61.90 131.41 67.10
Figure 6.14: DSC showing glass transition temperature for P1UBF and P1TBF composites
The DSC curves of P1UBFand P1TBF (Figure 6.15) show an
endothermic peak at temperatures such as 167.67°C and 168.73°C
respectively, indicating the existence of crystalline structure in the banana
fiber composites. The exothermic peak indicated the melting temperature
which is around 131°C for both untreated and treated banana fiber
composites.
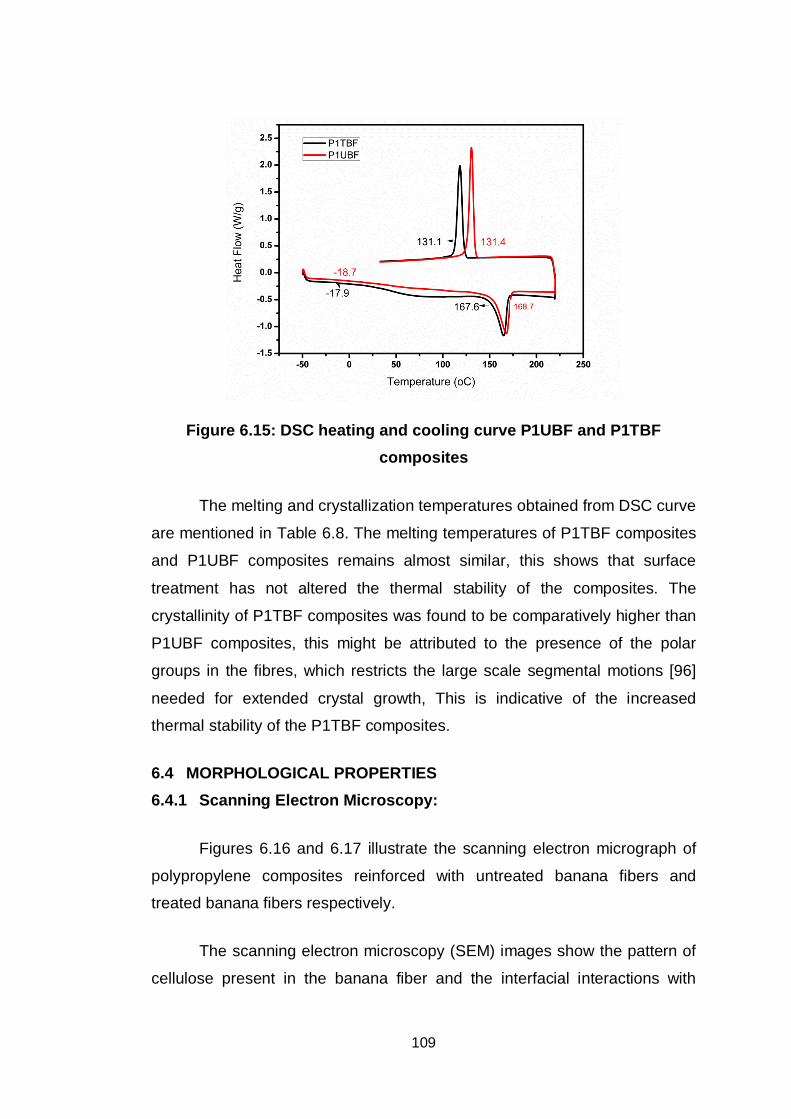
109
Figure 6.15: DSC heating and cooling curve P1UBF and P1TBF composites
The melting and crystallization temperatures obtained from DSC curve
are mentioned in Table 6.8. The melting temperatures of P1TBF composites
and P1UBF composites remains almost similar, this shows that surface
treatment has not altered the thermal stability of the composites. The
crystallinity of P1TBF composites was found to be comparatively higher than
P1UBF composites, this might be attributed to the presence of the polar
groups in the fibres, which restricts the large scale segmental motions [96]
needed for extended crystal growth, This is indicative of the increased
thermal stability of the P1TBF composites.
6.4 MORPHOLOGICAL PROPERTIES 6.4.1 Scanning Electron Microscopy:
Figures 6.16 and 6.17 illustrate the scanning electron micrograph of
polypropylene composites reinforced with untreated banana fibers and
treated banana fibers respectively.
The scanning electron microscopy (SEM) images show the pattern of
cellulose present in the banana fiber and the interfacial interactions with
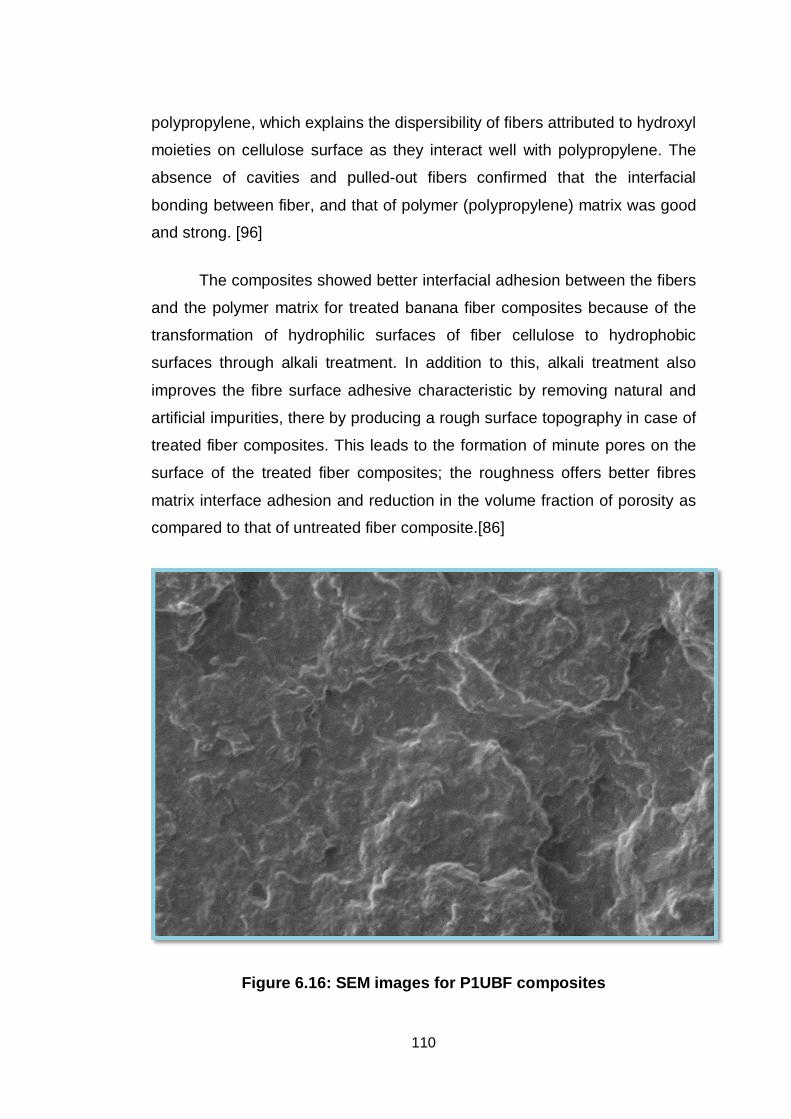
110
polypropylene, which explains the dispersibility of fibers attributed to hydroxyl
moieties on cellulose surface as they interact well with polypropylene. The
absence of cavities and pulled-out fibers confirmed that the interfacial
bonding between fiber, and that of polymer (polypropylene) matrix was good
and strong. [96]
The composites showed better interfacial adhesion between the fibers
and the polymer matrix for treated banana fiber composites because of the
transformation of hydrophilic surfaces of fiber cellulose to hydrophobic
surfaces through alkali treatment. In addition to this, alkali treatment also
improves the fibre surface adhesive characteristic by removing natural and
artificial impurities, there by producing a rough surface topography in case of
treated fiber composites. This leads to the formation of minute pores on the
surface of the treated fiber composites; the roughness offers better fibres
matrix interface adhesion and reduction in the volume fraction of porosity as
compared to that of untreated fiber composite.[86]
Figure 6.16: SEM images for P1UBF composites
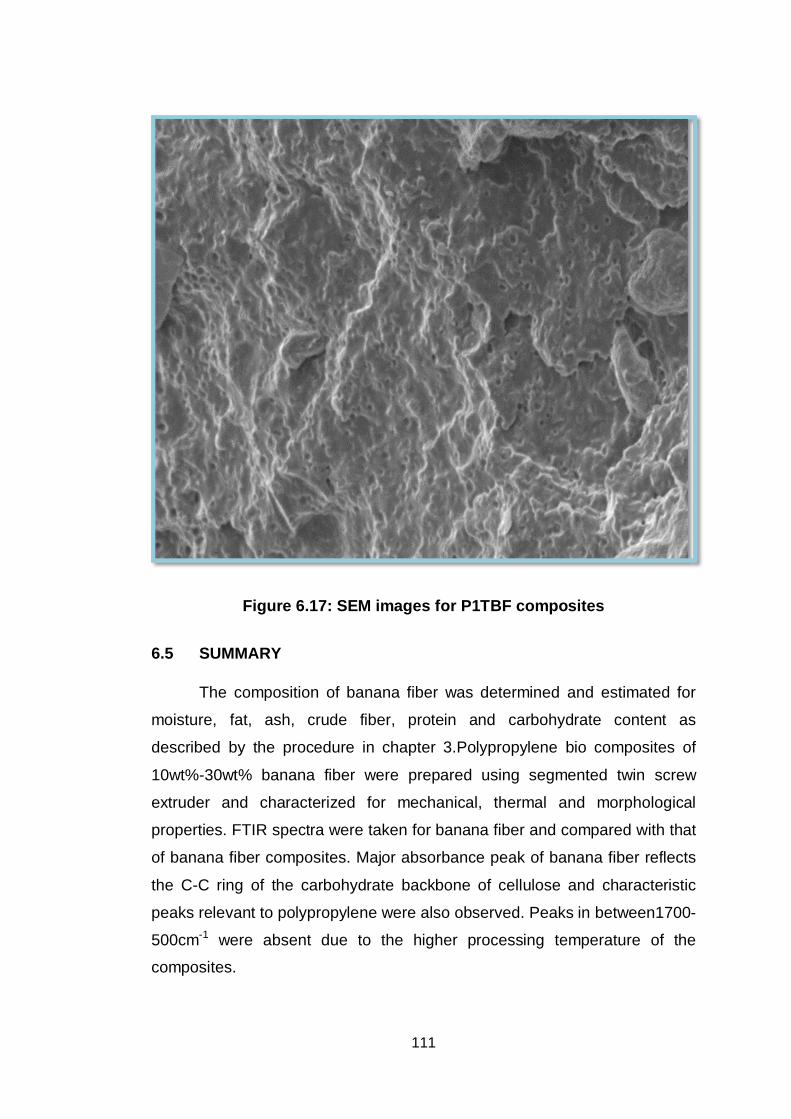
111
Figure 6.17: SEM images for P1TBF composites
6.5 SUMMARY
The composition of banana fiber was determined and estimated for
moisture, fat, ash, crude fiber, protein and carbohydrate content as
described by the procedure in chapter 3.Polypropylene bio composites of
10wt%-30wt% banana fiber were prepared using segmented twin screw
extruder and characterized for mechanical, thermal and morphological
properties. FTIR spectra were taken for banana fiber and compared with that
of banana fiber composites. Major absorbance peak of banana fiber reflects
the C-C ring of the carbohydrate backbone of cellulose and characteristic
peaks relevant to polypropylene were also observed. Peaks in between1700-
500cm-1 were absent due to the higher processing temperature of the
composites.
112
Mechanical properties such as tensile strength, modulus, and
percentage elongation at break were analyzed for all the blends. The tensile
strength of banana fiber reinforced polypropylene composites shows an
increased with increase in filler loading compared to the unreinforced
polypropylene (Neat PP), showing better interfacial adhesion between the
matrix and fiber due to sodium hydroxide treatment. Untreated banana fiber
composites improve the impact strength of the matrix material there by
increasing the toughness of the material, but reinforcement of treated fiber
decreases the impact strength, due to the reason that chemical treatment
decreases the surface polarity. Hardness of untreated composites decreases
with increase in filler content, possibly due to the improper dispersion of filler
in the polypropylene matrix, But for treated fiber hardness remains almost
equivalent to neat PP irrespective of the filler content. Water absorption
increases with increase in the filler content because of the Increase on the
hydroxyl group of the cellulose present in the natural filler. Prolonged water
immersion (480h) decreases the tensile strength and elongation, due to the
detachment of fiber and allowing water to percolate within the matrix.
Thermal studies for untreated banana fiber composites show higher
decomposition temperature than that of treated fiber and neat PP. This may
be attributed to the fact that treatment of banana fibers with alkali causes
damage to the fibers by the removal of cell walls and thereby leading to the
reduction in the thermal stability. The composites showed better interfacial
adhesion between the fibers and the polymer matrix for treated banana fiber
composites because of the transformation of hydrophilic surfaces of fiber
cellulose to hydrophobic surfaces through alkali treatment.
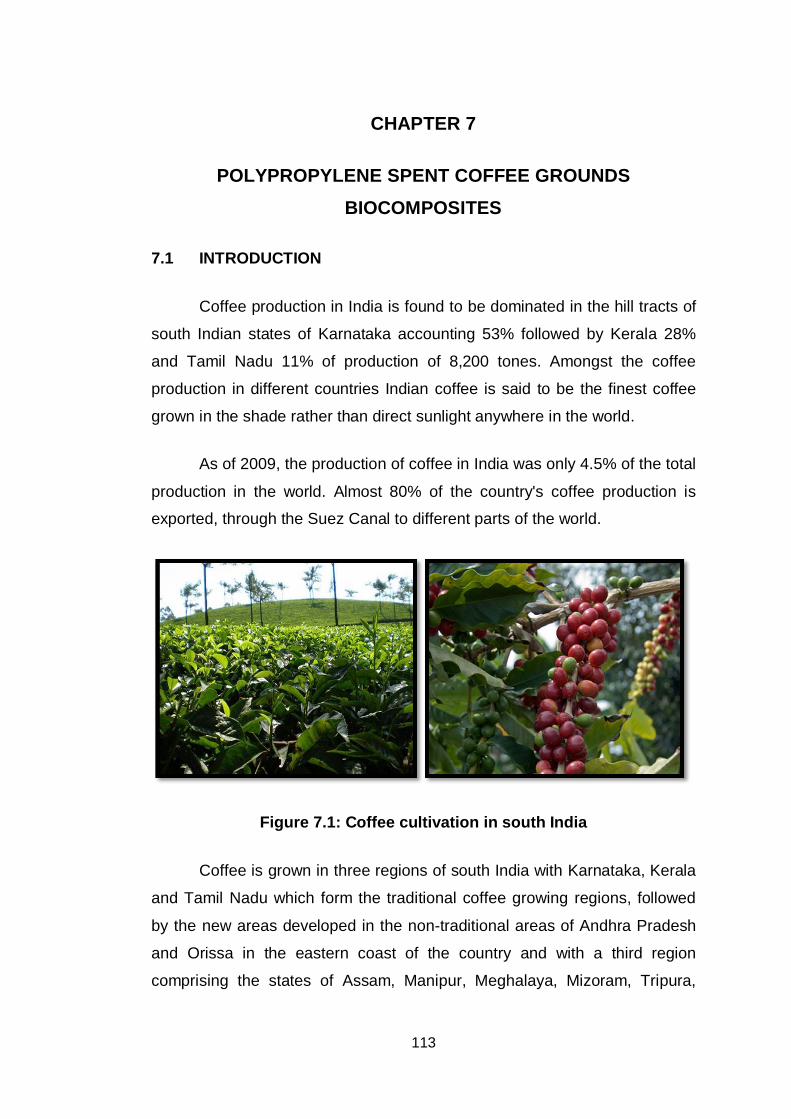
113
CHAPTER 7
POLYPROPYLENE SPENT COFFEE GROUNDS
BIOCOMPOSITES
7.1 INTRODUCTION
Coffee production in India is found to be dominated in the hill tracts of
south Indian states of Karnataka accounting 53% followed by Kerala 28%
and Tamil Nadu 11% of production of 8,200 tones. Amongst the coffee
production in different countries Indian coffee is said to be the finest coffee
grown in the shade rather than direct sunlight anywhere in the world.
As of 2009, the production of coffee in India was only 4.5% of the total
production in the world. Almost 80% of the country's coffee production is
exported, through the Suez Canal to different parts of the world.
Figure 7.1: Coffee cultivation in south India
Coffee is grown in three regions of south India with Karnataka, Kerala
and Tamil Nadu which form the traditional coffee growing regions, followed
by the new areas developed in the non-traditional areas of Andhra Pradesh
and Orissa in the eastern coast of the country and with a third region
comprising the states of Assam, Manipur, Meghalaya, Mizoram, Tripura,
114
Nagaland and Arunachal Pradesh of north eastern India, popularly known as
“Seven Sister States of India".
7.1.1 Composition of Spent Coffee Grounds (CG)
The composition of spent coffee ground (mentioned as CG throughout
the thesis) used for this research work was determined according to the
procedure described in Chapter 3 and the results are presented in Table 7.1.
Table 7.1: Composition of spent coffee grounds
S.No Composition Spent coffee grounds(CG)
1. Moisture 9.64
2. Ash 4.72
4. Crude fiber 49.49
5. Crude protein 2.70
6. Crude fat 0.45
7. Carbohydrates 33.00
7.1.2 FT-IR spectral studies
FTIR spectrum for the Coffee grounds composite is as shown in
Figure 7.2.
Figure 7.2 shows the FTIR spectra of neat PP, Spent coffee grounds
and coffee grounds/polypropylene composite (P1CG) and their main
characteristic peaks are summarized in Table 7.2.
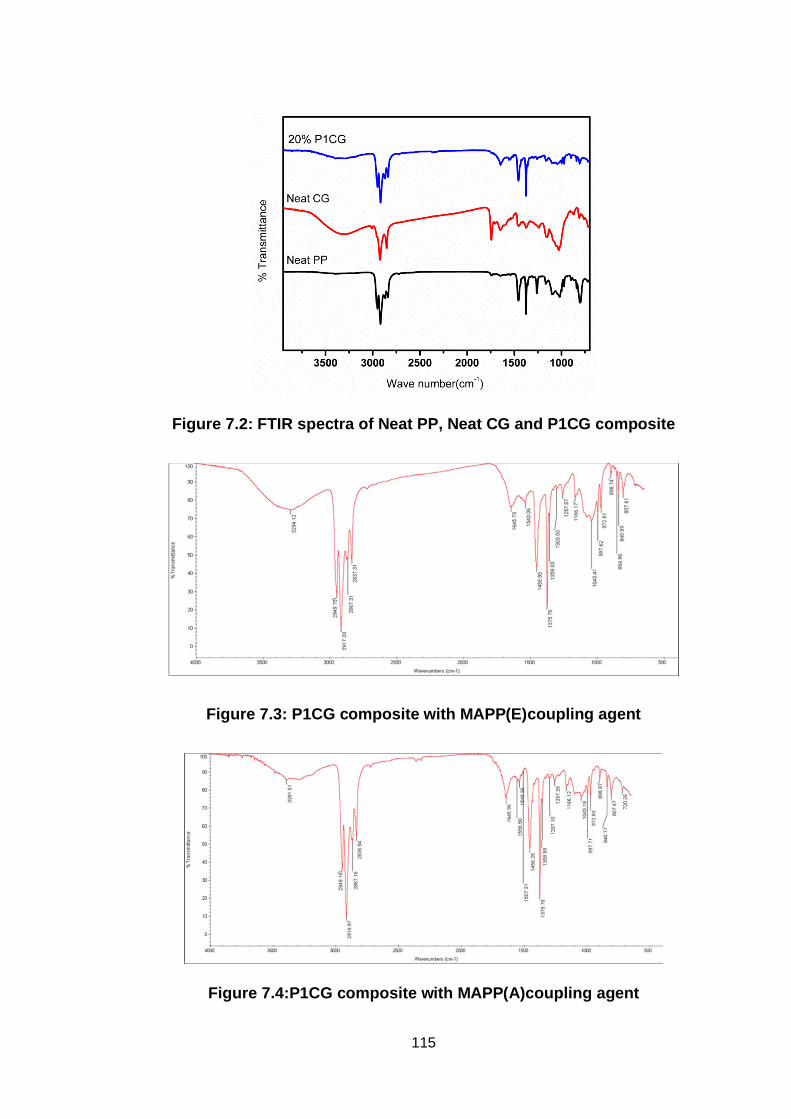
115
Figure 7.2: FTIR spectra of Neat PP, Neat CG and P1CG composite
Figure 7.3: P1CG composite with MAPP(E)coupling agent
Figure 7.4:P1CG composite with MAPP(A)coupling agent
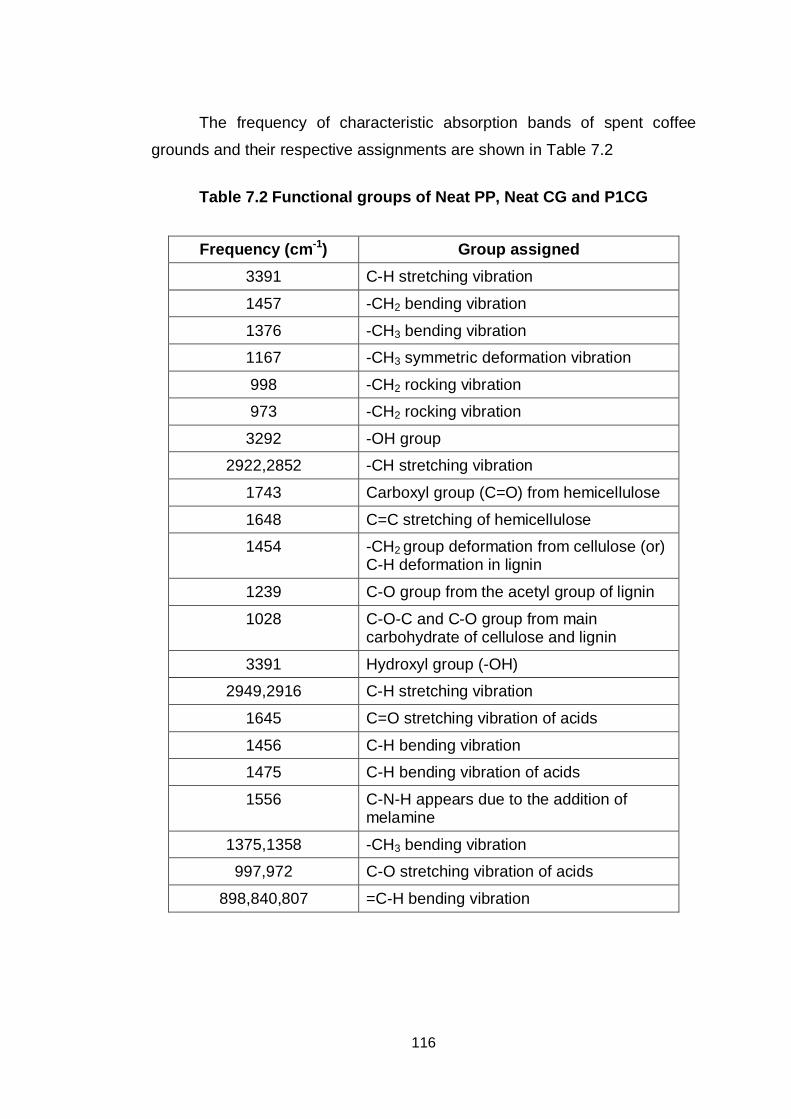
116
The frequency of characteristic absorption bands of spent coffee
grounds and their respective assignments are shown in Table 7.2
Table 7.2 Functional groups of Neat PP, Neat CG and P1CG
Frequency (cm-1) Group assigned 3391 C-H stretching vibration
1457 -CH2 bending vibration
1376 -CH3 bending vibration
1167 -CH3 symmetric deformation vibration
998 -CH2 rocking vibration
973 -CH2 rocking vibration
3292 -OH group
2922,2852 -CH stretching vibration
1743 Carboxyl group (C=O) from hemicellulose
1648 C=C stretching of hemicellulose
1454 -CH2 group deformation from cellulose (or) C-H deformation in lignin
1239 C-O group from the acetyl group of lignin
1028 C-O-C and C-O group from main carbohydrate of cellulose and lignin
3391 Hydroxyl group (-OH)
2949,2916 C-H stretching vibration
1645 C=O stretching vibration of acids
1456 C-H bending vibration
1475 C-H bending vibration of acids
1556 C-N-H appears due to the addition of melamine
1375,1358 -CH3 bending vibration
997,972 C-O stretching vibration of acids
898,840,807 =C-H bending vibration
117
The major compositions of lingo cellulosic fibers are cellulose, hemi
cellulose and lignin, while the minor constituents include minerals, pectin,
waxes and water-soluble components and hemicelluloses can form a linkage
between cellulose and lignin, and lignin-carbohydrate complex with lignin by
ether bonds [77].The infrared spectroscopy was used to investigate the
hydroxyl groups of cellulose in the 1930’s [53] and significant efforts were
made in the 1950’s to assign the different absorption maxima in the IR
spectrum of cellulose [54-59]; Major absorbance peak of coffee grounds
reflects the C-C ring of the carbohydrate backbone of cellulose .The C–O–C
glycosidic bond of cellulose was detected by the stretching vibration band to
1028cm-1. Peaks due to hydroxyl groups of cellulose (OH deformation) were
located at 3391cm-1 and 3272cm-1 for the composite and neat polypropylene
respectively.
Tashiro and Kobayashi [97] showed that hydrogen bonds contribute
about 20% of the strain energy to the cellulose. It is apparent that the
investigation of hydrogen bonds on cellulosic fibres and other materials gives
rise to great benefits for the research on all other aspects of natural fibres
and related materials. A peak at 1556 cm-1 indicates the presence of carbon
and nitrogen bonding, which is due to the addition of meleic anhydride. On
comparing the peaks of neat spent coffee grounds with that of composite
material, a peak at 1743 cm-1 disappears due to the bonding of C=O group
hemicellulose with the matrix material. The spectra are able to illustrate that
the coupling agent was located around the wood fibers rather than randomly
distributed in the polypropylene matrix and the coupling agent was attached
to the wood fibers either by ester or hydrogen bond [98].
IR spectra of the composites with both the coupling agents, Amplify
GR 216 and Exxelor PO 1020 remain almost similar. But the intensity of the
peaks corresponding to C-O-C and C-O group of cellulose and lignin was
found to be more pronounced in case of Exxelor compatibilizer compared to
Amplify compatiblizer(Figure 7.3 and Figure 7.4)
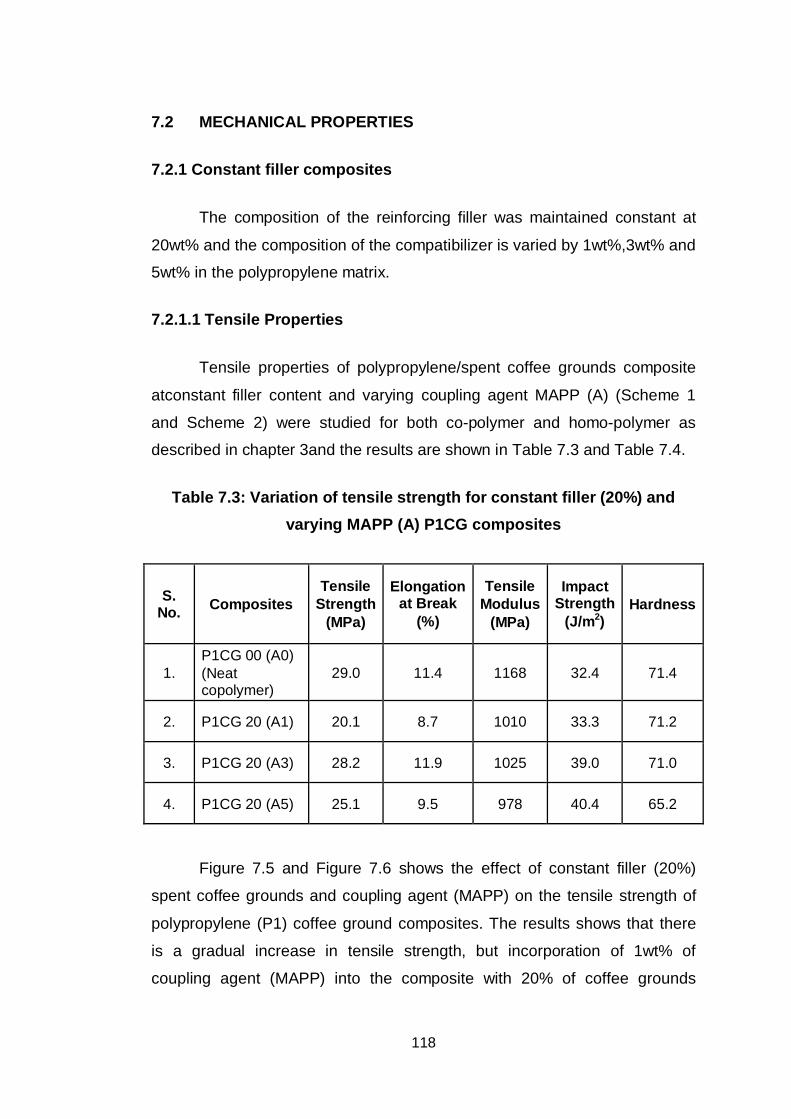
118
7.2 MECHANICAL PROPERTIES
7.2.1 Constant filler composites
The composition of the reinforcing filler was maintained constant at
20wt% and the composition of the compatibilizer is varied by 1wt%,3wt% and
5wt% in the polypropylene matrix.
7.2.1.1 Tensile Properties
Tensile properties of polypropylene/spent coffee grounds composite
atconstant filler content and varying coupling agent MAPP (A) (Scheme 1
and Scheme 2) were studied for both co-polymer and homo-polymer as
described in chapter 3and the results are shown in Table 7.3 and Table 7.4.
Table 7.3: Variation of tensile strength for constant filler (20%) and varying MAPP (A) P1CG composites
S. No. Composites
Tensile Strength
(MPa)
Elongation at Break
(%)
Tensile Modulus
(MPa)
Impact Strength
(J/m2) Hardness
1. P1CG 00 (A0) (Neat copolymer)
29.0 11.4 1168 32.4 71.4
2. P1CG 20 (A1) 20.1 8.7 1010 33.3 71.2
3. P1CG 20 (A3) 28.2 11.9 1025 39.0 71.0
4. P1CG 20 (A5) 25.1 9.5 978 40.4 65.2
Figure 7.5 and Figure 7.6 shows the effect of constant filler (20%)
spent coffee grounds and coupling agent (MAPP) on the tensile strength of
polypropylene (P1) coffee ground composites. The results shows that there
is a gradual increase in tensile strength, but incorporation of 1wt% of
coupling agent (MAPP) into the composite with 20% of coffee grounds
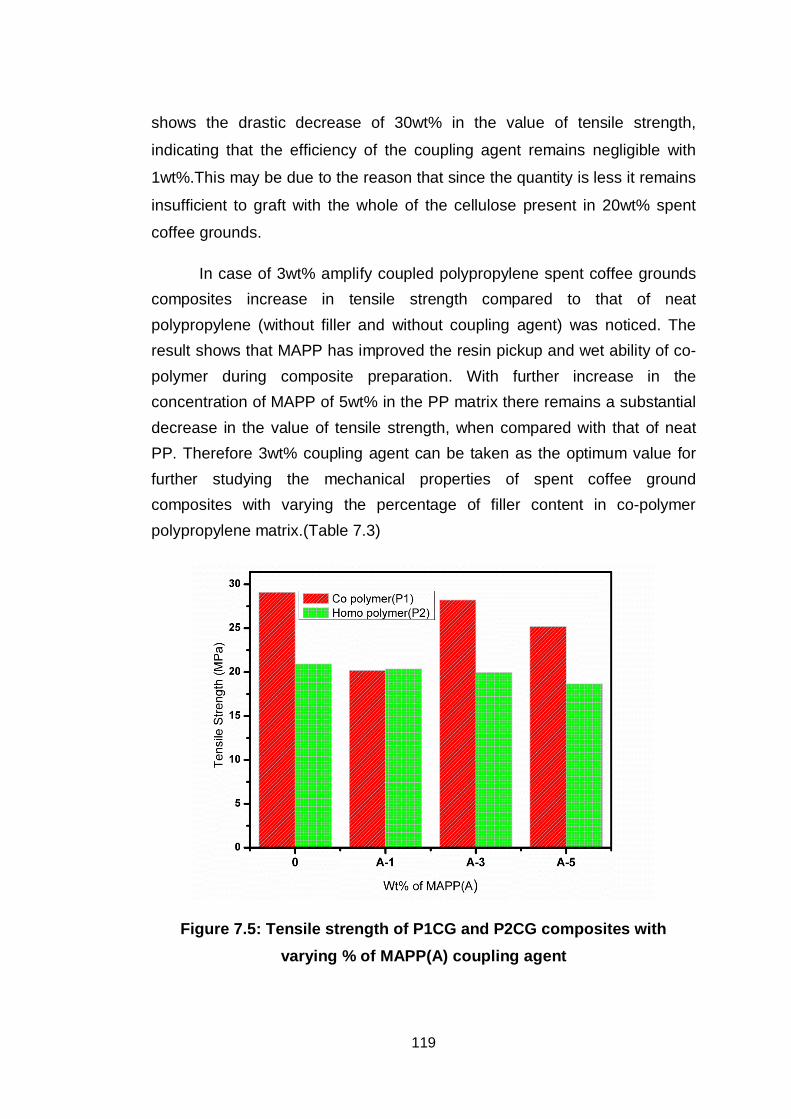
119
shows the drastic decrease of 30wt% in the value of tensile strength,
indicating that the efficiency of the coupling agent remains negligible with
1wt%.This may be due to the reason that since the quantity is less it remains
insufficient to graft with the whole of the cellulose present in 20wt% spent
coffee grounds.
In case of 3wt% amplify coupled polypropylene spent coffee grounds composites increase in tensile strength compared to that of neat polypropylene (without filler and without coupling agent) was noticed. The result shows that MAPP has improved the resin pickup and wet ability of co- polymer during composite preparation. With further increase in the concentration of MAPP of 5wt% in the PP matrix there remains a substantial decrease in the value of tensile strength, when compared with that of neat PP. Therefore 3wt% coupling agent can be taken as the optimum value for further studying the mechanical properties of spent coffee ground composites with varying the percentage of filler content in co-polymer polypropylene matrix.(Table 7.3)
Figure 7.5: Tensile strength of P1CG and P2CG composites with varying % of MAPP(A) coupling agent
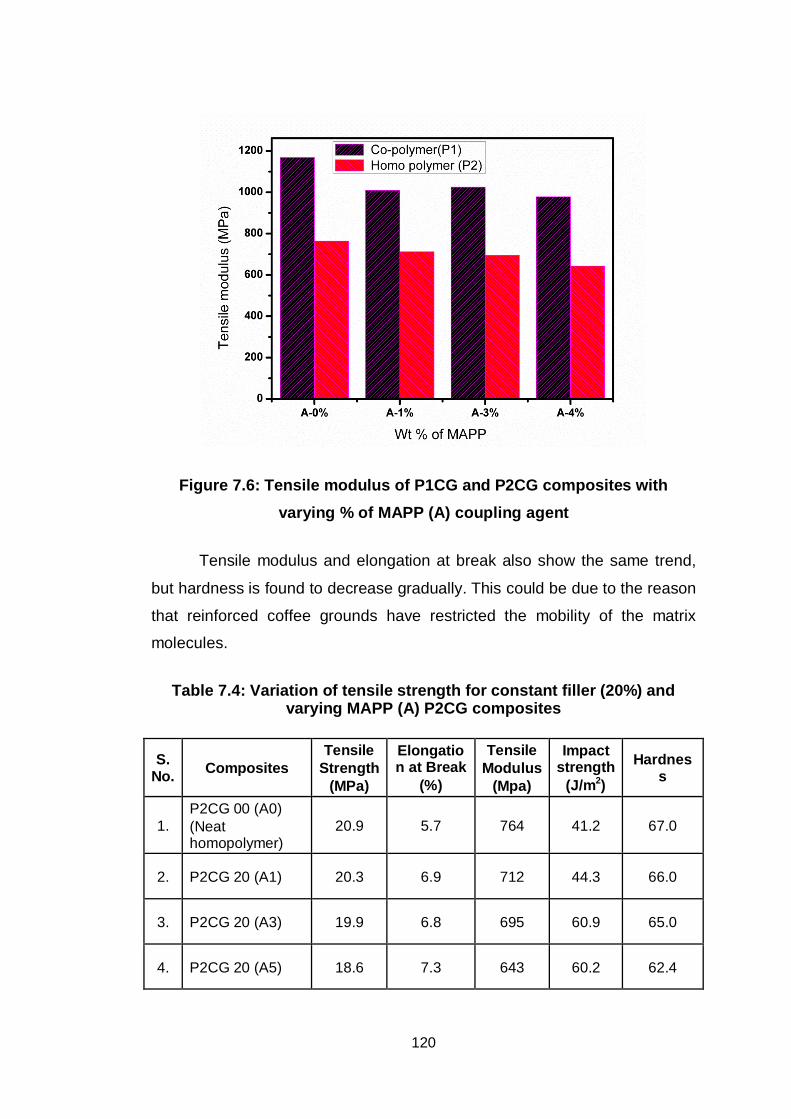
120
Figure 7.6: Tensile modulus of P1CG and P2CG composites with varying % of MAPP (A) coupling agent
Tensile modulus and elongation at break also show the same trend,
but hardness is found to decrease gradually. This could be due to the reason
that reinforced coffee grounds have restricted the mobility of the matrix
molecules.
Table 7.4: Variation of tensile strength for constant filler (20%) and varying MAPP (A) P2CG composites
S. No. Composites
Tensile Strength
(MPa)
Elongation at Break
(%)
Tensile Modulus
(Mpa)
Impact strength
(J/m2)
Hardness
1. P2CG 00 (A0) (Neat homopolymer)
20.9 5.7 764 41.2 67.0
2. P2CG 20 (A1) 20.3 6.9 712 44.3 66.0
3. P2CG 20 (A3) 19.9 6.8 695 60.9 65.0
4. P2CG 20 (A5) 18.6 7.3 643 60.2 62.4
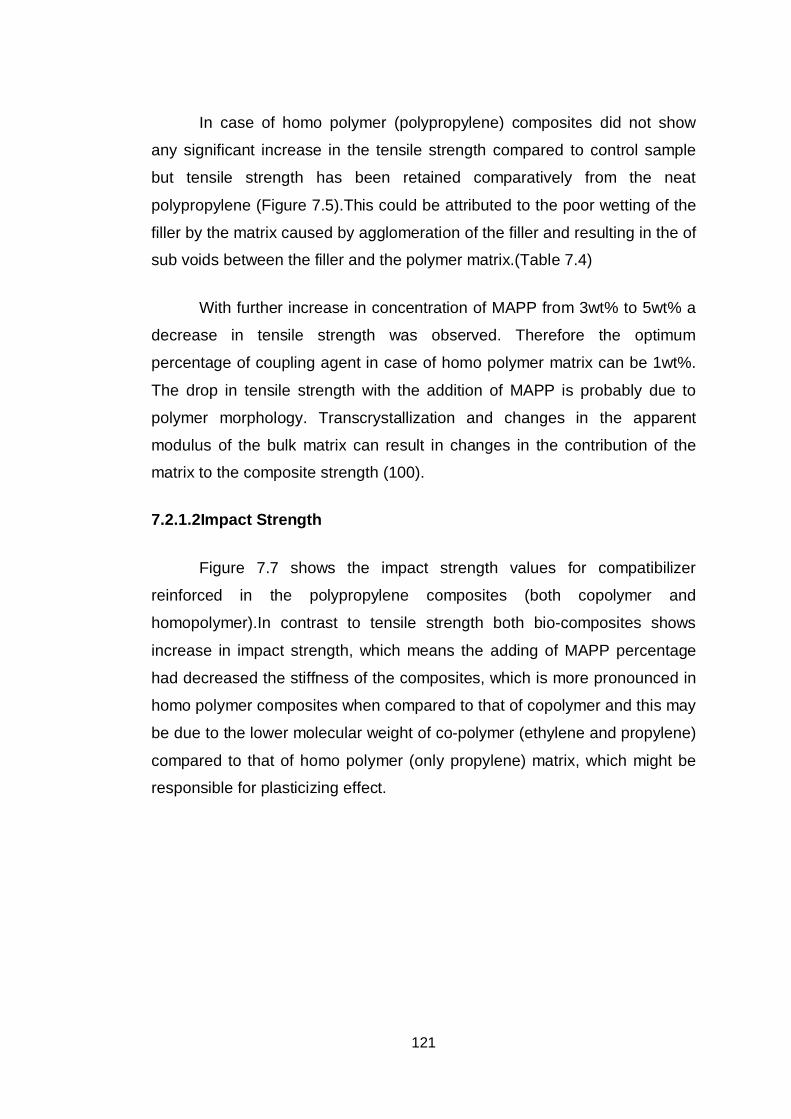
121
In case of homo polymer (polypropylene) composites did not show
any significant increase in the tensile strength compared to control sample
but tensile strength has been retained comparatively from the neat
polypropylene (Figure 7.5).This could be attributed to the poor wetting of the
filler by the matrix caused by agglomeration of the filler and resulting in the of
sub voids between the filler and the polymer matrix.(Table 7.4)
With further increase in concentration of MAPP from 3wt% to 5wt% a
decrease in tensile strength was observed. Therefore the optimum
percentage of coupling agent in case of homo polymer matrix can be 1wt%.
The drop in tensile strength with the addition of MAPP is probably due to
polymer morphology. Transcrystallization and changes in the apparent
modulus of the bulk matrix can result in changes in the contribution of the
matrix to the composite strength (100).
7.2.1.2Impact Strength
Figure 7.7 shows the impact strength values for compatibilizer
reinforced in the polypropylene composites (both copolymer and
homopolymer).In contrast to tensile strength both bio-composites shows
increase in impact strength, which means the adding of MAPP percentage
had decreased the stiffness of the composites, which is more pronounced in
homo polymer composites when compared to that of copolymer and this may
be due to the lower molecular weight of co-polymer (ethylene and propylene)
compared to that of homo polymer (only propylene) matrix, which might be
responsible for plasticizing effect.
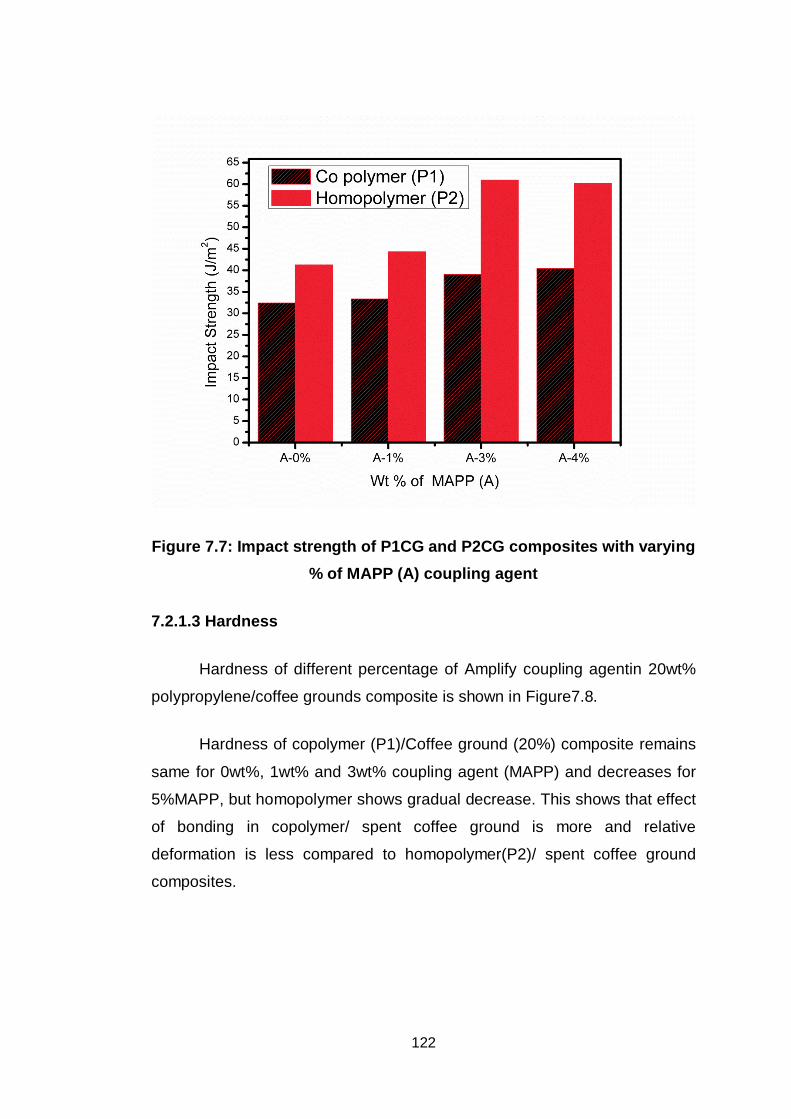
122
Figure 7.7: Impact strength of P1CG and P2CG composites with varying % of MAPP (A) coupling agent
7.2.1.3 Hardness
Hardness of different percentage of Amplify coupling agentin 20wt%
polypropylene/coffee grounds composite is shown in Figure7.8.
Hardness of copolymer (P1)/Coffee ground (20%) composite remains
same for 0wt%, 1wt% and 3wt% coupling agent (MAPP) and decreases for
5%MAPP, but homopolymer shows gradual decrease. This shows that effect
of bonding in copolymer/ spent coffee ground is more and relative
deformation is less compared to homopolymer(P2)/ spent coffee ground
composites.
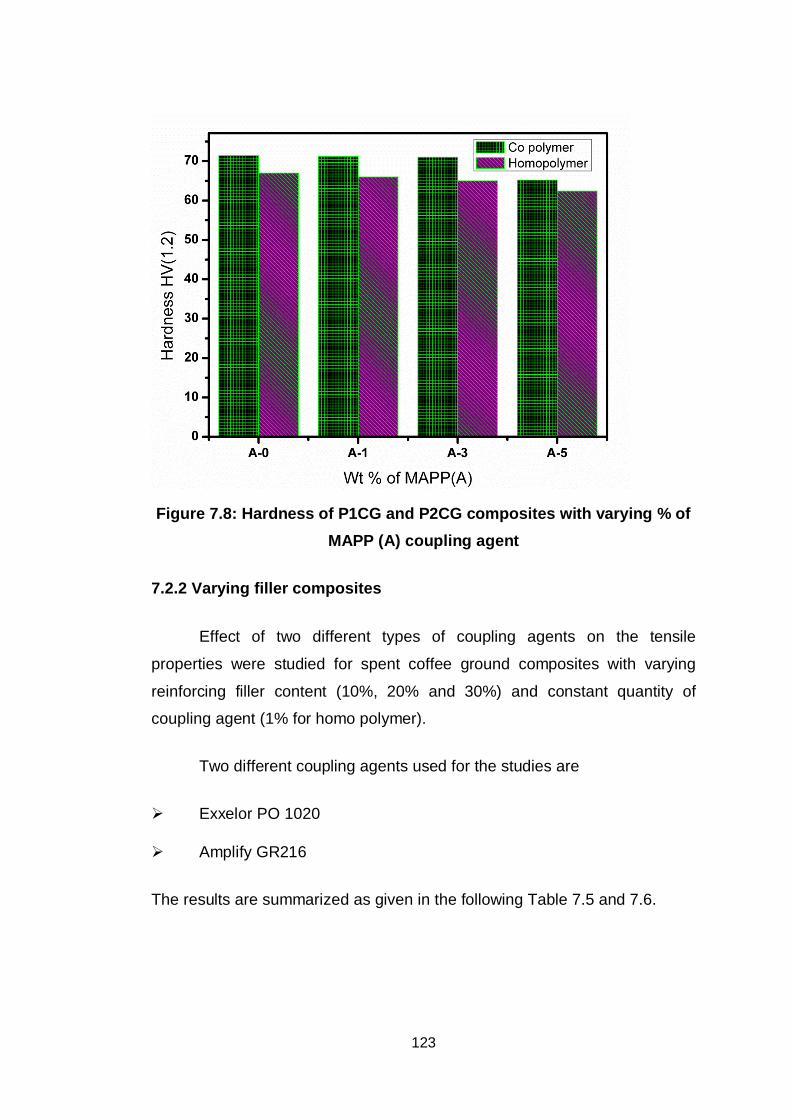
123
Figure 7.8: Hardness of P1CG and P2CG composites with varying % of MAPP (A) coupling agent
7.2.2 Varying filler composites
Effect of two different types of coupling agents on the tensile
properties were studied for spent coffee ground composites with varying
reinforcing filler content (10%, 20% and 30%) and constant quantity of
coupling agent (1% for homo polymer).
Two different coupling agents used for the studies are
Exxelor PO 1020
Amplify GR216
The results are summarized as given in the following Table 7.5 and 7.6.
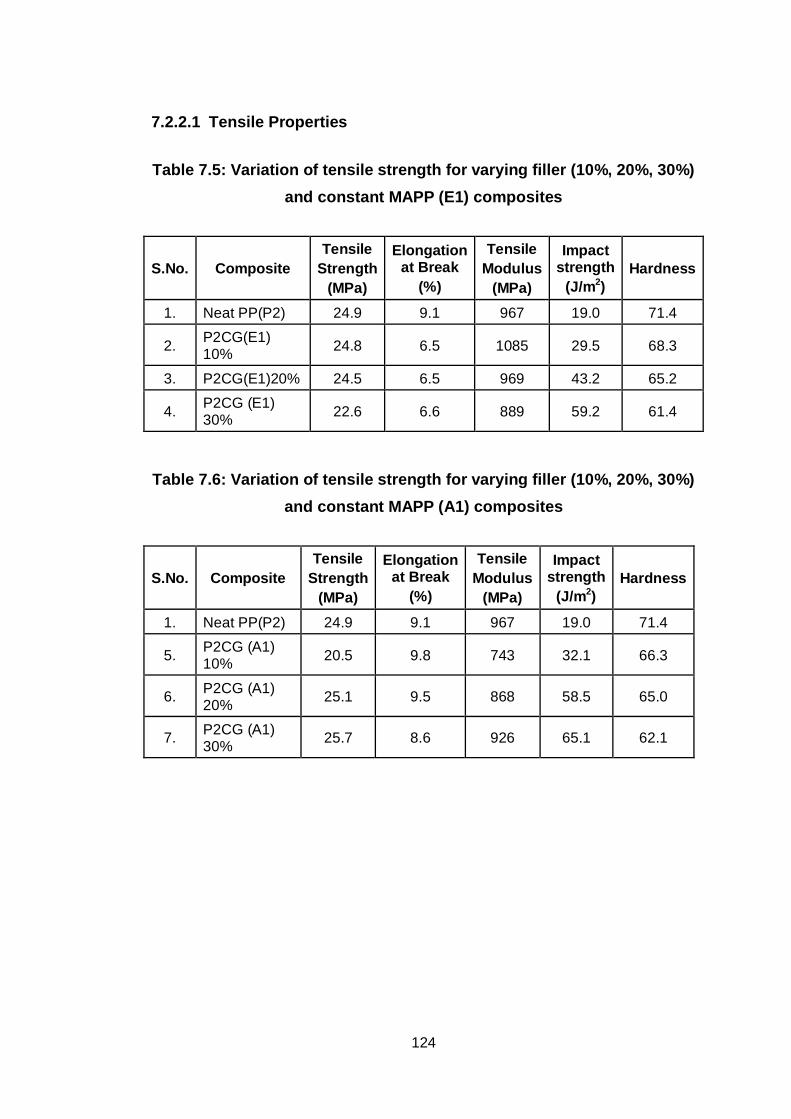
124
7.2.2.1 Tensile Properties
Table 7.5: Variation of tensile strength for varying filler (10%, 20%, 30%) and constant MAPP (E1) composites
S.No. Composite Tensile
Strength (MPa)
Elongation at Break
(%)
Tensile Modulus
(MPa)
Impact strength
(J/m2) Hardness
1. Neat PP(P2) 24.9 9.1 967 19.0 71.4
2. P2CG(E1) 10% 24.8 6.5 1085 29.5 68.3
3. P2CG(E1)20% 24.5 6.5 969 43.2 65.2
4. P2CG (E1) 30% 22.6 6.6 889 59.2 61.4
Table 7.6: Variation of tensile strength for varying filler (10%, 20%, 30%) and constant MAPP (A1) composites
S.No. Composite Tensile
Strength (MPa)
Elongation at Break
(%)
Tensile Modulus
(MPa)
Impact strength
(J/m2) Hardness
1. Neat PP(P2) 24.9 9.1 967 19.0 71.4
5. P2CG (A1) 10% 20.5 9.8 743 32.1 66.3
6. P2CG (A1) 20% 25.1 9.5 868 58.5 65.0
7. P2CG (A1) 30% 25.7 8.6 926 65.1 62.1
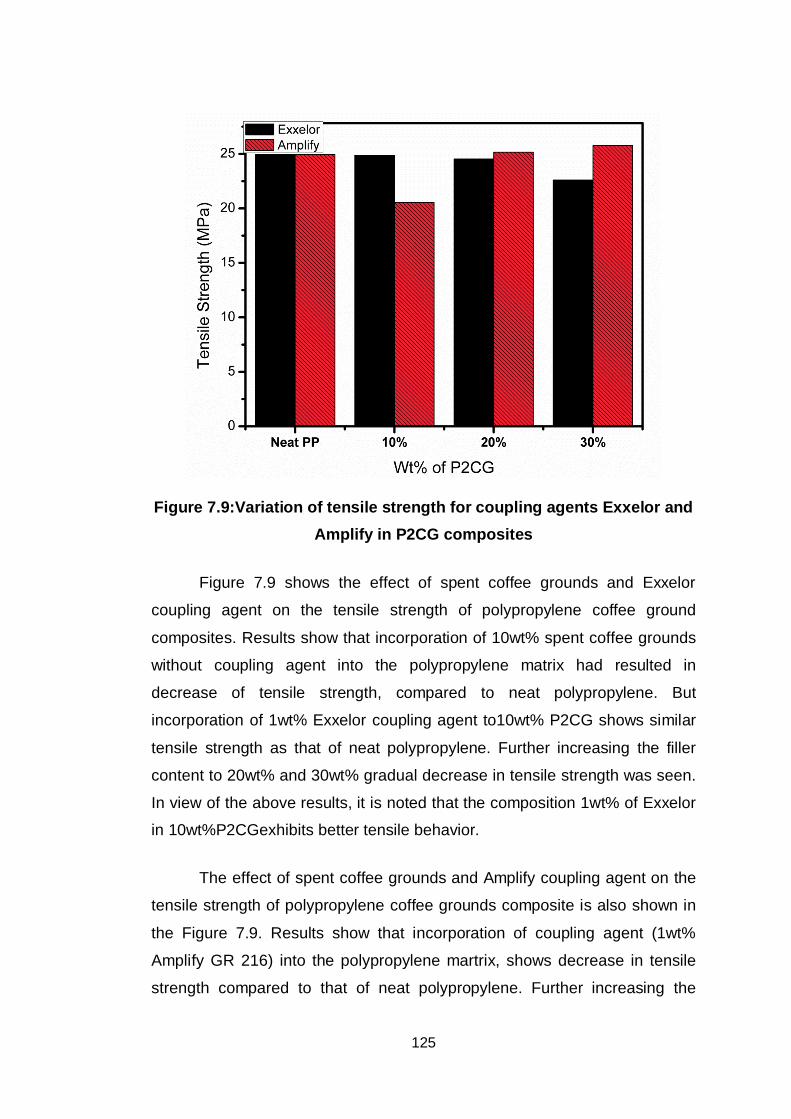
125
Figure 7.9:Variation of tensile strength for coupling agents Exxelor and Amplify in P2CG composites
Figure 7.9 shows the effect of spent coffee grounds and Exxelor
coupling agent on the tensile strength of polypropylene coffee ground
composites. Results show that incorporation of 10wt% spent coffee grounds
without coupling agent into the polypropylene matrix had resulted in
decrease of tensile strength, compared to neat polypropylene. But
incorporation of 1wt% Exxelor coupling agent to10wt% P2CG shows similar
tensile strength as that of neat polypropylene. Further increasing the filler
content to 20wt% and 30wt% gradual decrease in tensile strength was seen.
In view of the above results, it is noted that the composition 1wt% of Exxelor
in 10wt%P2CGexhibits better tensile behavior.
The effect of spent coffee grounds and Amplify coupling agent on the
tensile strength of polypropylene coffee grounds composite is also shown in
the Figure 7.9. Results show that incorporation of coupling agent (1wt%
Amplify GR 216) into the polypropylene martrix, shows decrease in tensile
strength compared to that of neat polypropylene. Further increasing the
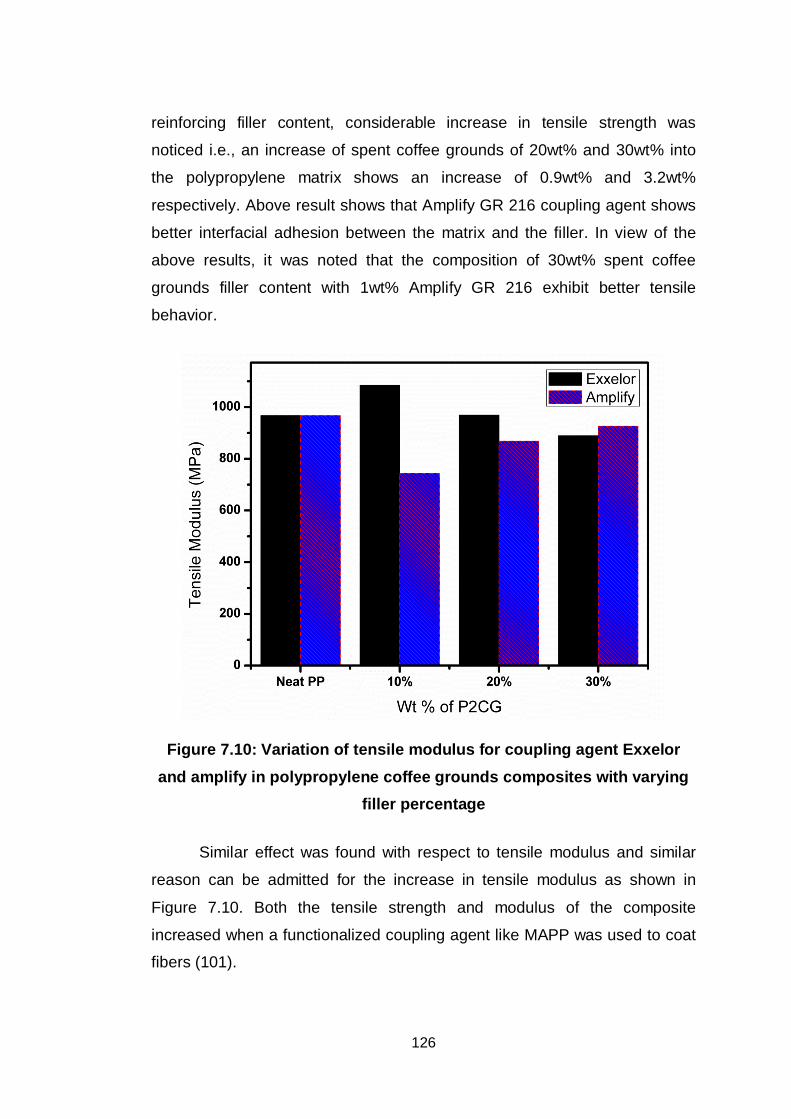
126
reinforcing filler content, considerable increase in tensile strength was
noticed i.e., an increase of spent coffee grounds of 20wt% and 30wt% into
the polypropylene matrix shows an increase of 0.9wt% and 3.2wt%
respectively. Above result shows that Amplify GR 216 coupling agent shows
better interfacial adhesion between the matrix and the filler. In view of the
above results, it was noted that the composition of 30wt% spent coffee
grounds filler content with 1wt% Amplify GR 216 exhibit better tensile
behavior.
Figure 7.10: Variation of tensile modulus for coupling agent Exxelor and amplify in polypropylene coffee grounds composites with varying
filler percentage
Similar effect was found with respect to tensile modulus and similar
reason can be admitted for the increase in tensile modulus as shown in
Figure 7.10. Both the tensile strength and modulus of the composite
increased when a functionalized coupling agent like MAPP was used to coat
fibers (101).
127
Decrease in the elongation at break was noticed while comparing
P2CG composite without coupling agent and gradual decrease after
incorporation of coupling agent, this is due to restriction of mobility of the
matrix molecules by the addition of filler and further decrease shows the
contribution of coupling agent towards the interfacial adhesion. Elongation at
break shows a linear variation with respect to Amplify GR 216 compared to
Exxelor PO 1020.
7.2.2.2 Impact Strength
Homopolymer bio-composites show increase in impact strength in
both the case of coupling agent MAPP (A) and MAPP (E) as shown in Table
7.5 and Table 7.6. But the effect of MAPP (A) is more pronounced compared
to MAPP (E).This shows that the coupling effect of Amplify coupling agent is
more than that of Exxelor in homo polymer composites (P2CG).
7.2.2.3 Hardness
There is a decrease in hardness of P2CG composite with respect to
both the compatiblizer (Table 7.5 and Table 7.6). Results shows that relative
deformation is less in Amplify composites homopolymer/ spent coffee ground
composites compared to Exxelor homopolymer/ spent coffee ground
composites.
7.2.3 Water Absorption inP2CG Composites
Water absorption of neat polypropylene and polypropylene spent
coffee grounds composites at different time intervals(2h, 24h, 168h and 480
h) was studied and the results are shown in Table 7.7 and Figure 7.11.
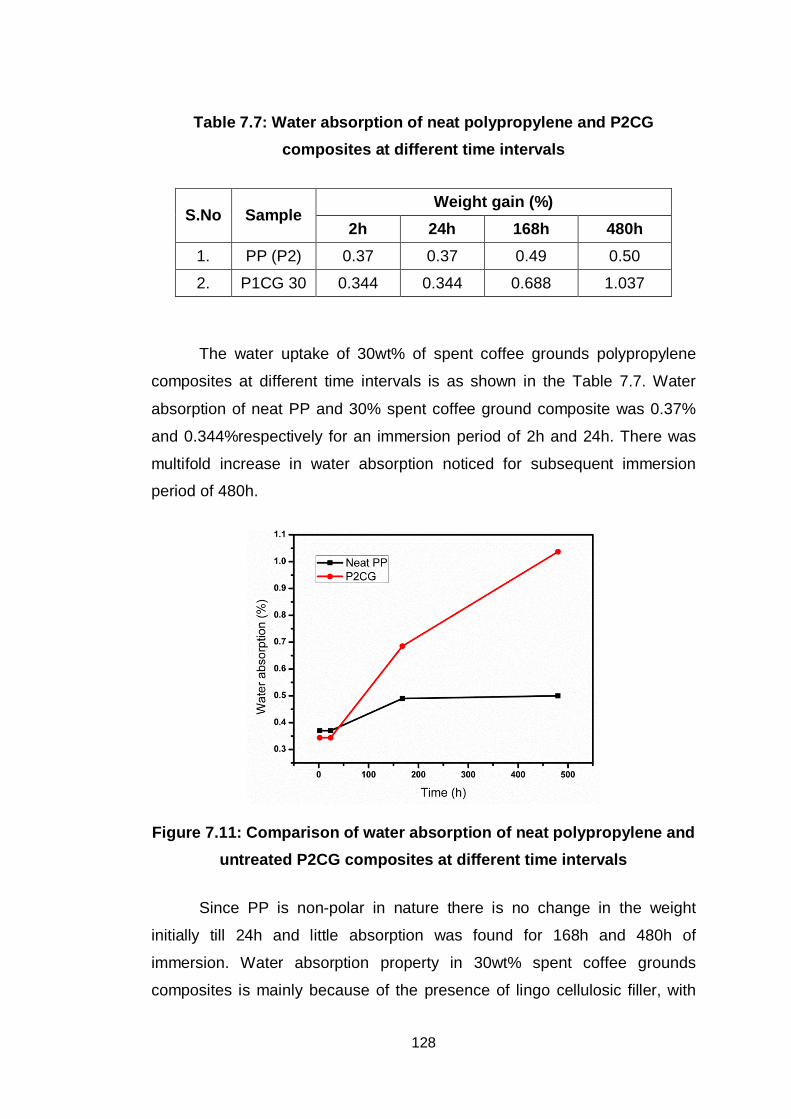
128
Table 7.7: Water absorption of neat polypropylene and P2CG composites at different time intervals
S.No Sample Weight gain (%)
2h 24h 168h 480h 1. PP (P2) 0.37 0.37 0.49 0.50
2. P1CG 30 0.344 0.344 0.688 1.037
The water uptake of 30wt% of spent coffee grounds polypropylene
composites at different time intervals is as shown in the Table 7.7. Water
absorption of neat PP and 30% spent coffee ground composite was 0.37%
and 0.344%respectively for an immersion period of 2h and 24h. There was
multifold increase in water absorption noticed for subsequent immersion
period of 480h.
Figure 7.11: Comparison of water absorption of neat polypropylene and untreated P2CG composites at different time intervals
Since PP is non-polar in nature there is no change in the weight
initially till 24h and little absorption was found for 168h and 480h of
immersion. Water absorption property in 30wt% spent coffee grounds
composites is mainly because of the presence of lingo cellulosic filler, with
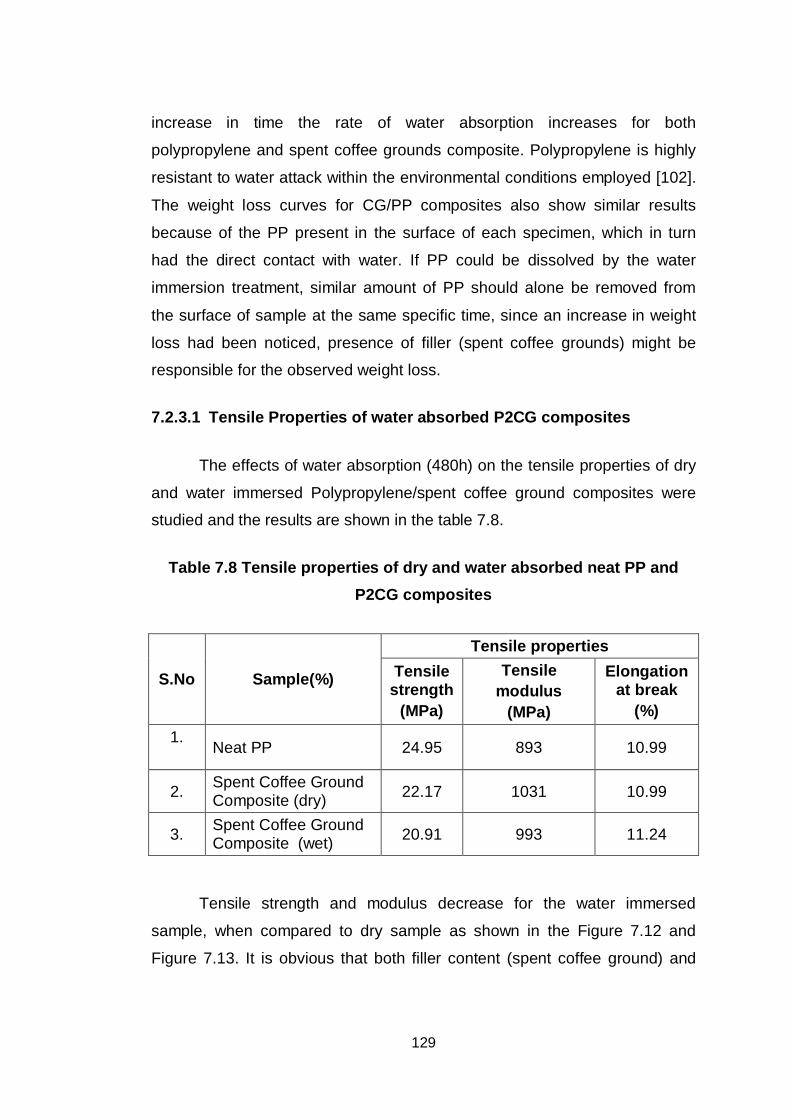
129
increase in time the rate of water absorption increases for both
polypropylene and spent coffee grounds composite. Polypropylene is highly
resistant to water attack within the environmental conditions employed [102].
The weight loss curves for CG/PP composites also show similar results
because of the PP present in the surface of each specimen, which in turn
had the direct contact with water. If PP could be dissolved by the water
immersion treatment, similar amount of PP should alone be removed from
the surface of sample at the same specific time, since an increase in weight
loss had been noticed, presence of filler (spent coffee grounds) might be
responsible for the observed weight loss.
7.2.3.1 Tensile Properties of water absorbed P2CG composites
The effects of water absorption (480h) on the tensile properties of dry
and water immersed Polypropylene/spent coffee ground composites were
studied and the results are shown in the table 7.8.
Table 7.8 Tensile properties of dry and water absorbed neat PP and P2CG composites
S.No Sample(%)
Tensile properties Tensile
strength (MPa)
Tensile modulus
(MPa)
Elongation at break
(%) 1. Neat PP 24.95 893 10.99
2. Spent Coffee Ground Composite (dry) 22.17 1031 10.99
3. Spent Coffee Ground Composite (wet) 20.91 993 11.24
Tensile strength and modulus decrease for the water immersed
sample, when compared to dry sample as shown in the Figure 7.12 and
Figure 7.13. It is obvious that both filler content (spent coffee ground) and
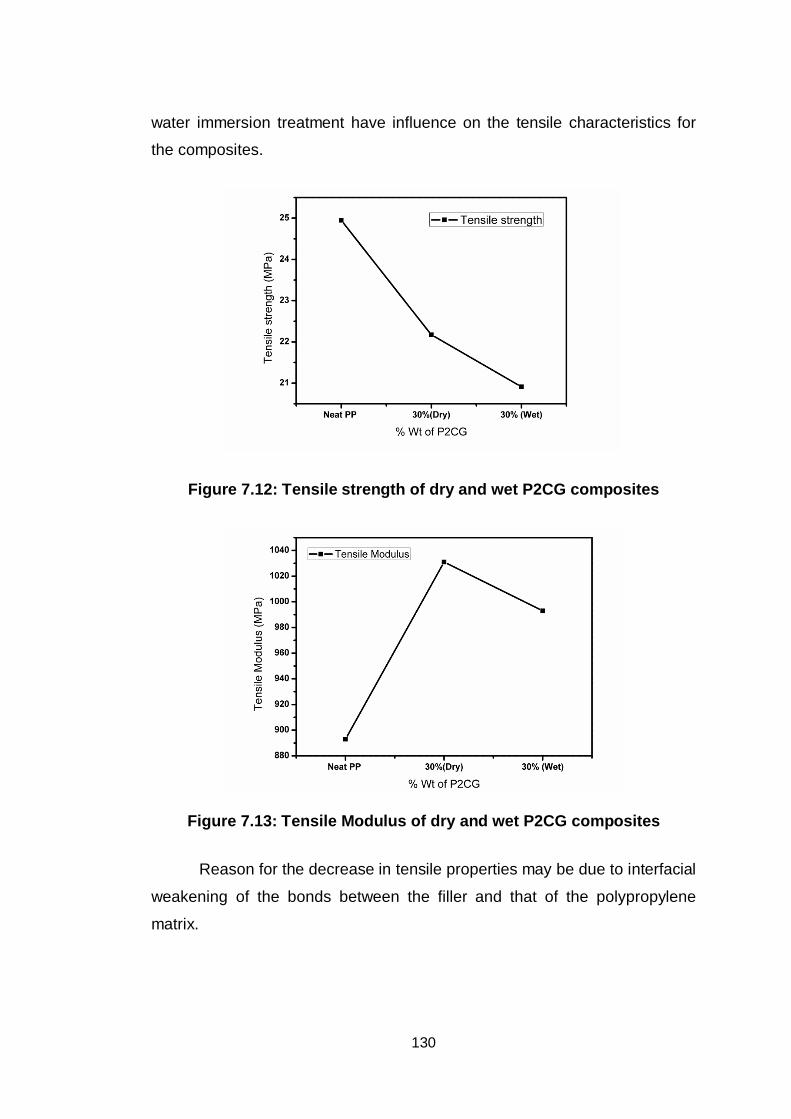
130
water immersion treatment have influence on the tensile characteristics for
the composites.
Figure 7.12: Tensile strength of dry and wet P2CG composites
Figure 7.13: Tensile Modulus of dry and wet P2CG composites
Reason for the decrease in tensile properties may be due to interfacial
weakening of the bonds between the filler and that of the polypropylene
matrix.
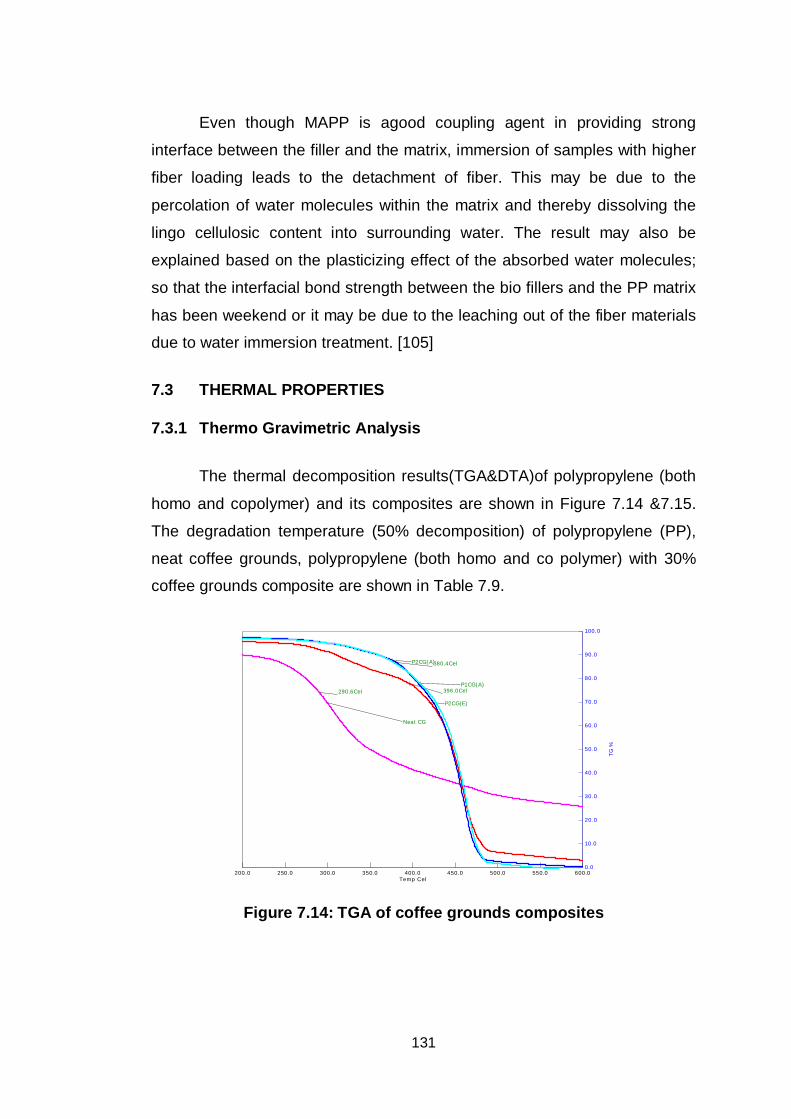
131
Even though MAPP is agood coupling agent in providing strong
interface between the filler and the matrix, immersion of samples with higher
fiber loading leads to the detachment of fiber. This may be due to the
percolation of water molecules within the matrix and thereby dissolving the
lingo cellulosic content into surrounding water. The result may also be
explained based on the plasticizing effect of the absorbed water molecules;
so that the interfacial bond strength between the bio fillers and the PP matrix
has been weekend or it may be due to the leaching out of the fiber materials
due to water immersion treatment. [105]
7.3 THERMAL PROPERTIES
7.3.1 Thermo Gravimetric Analysis
The thermal decomposition results(TGA&DTA)of polypropylene (both
homo and copolymer) and its composites are shown in Figure 7.14 &7.15.
The degradation temperature (50% decomposition) of polypropylene (PP),
neat coffee grounds, polypropylene (both homo and co polymer) with 30%
coffee grounds composite are shown in Table 7.9.
Figure 7.14: TGA of coffee grounds composites
Temp Cel600.0550.0500.0450.0400.0350.0300.0250.0200.0
TG %
100.0
90.0
80.0
70.0
60.0
50.0
40.0
30.0
20.0
10.0
0.0
Neat CG
P1CG(A)
P2CG(E)
P2CG(A)
290.6Cel 396.0Cel
380.4Cel
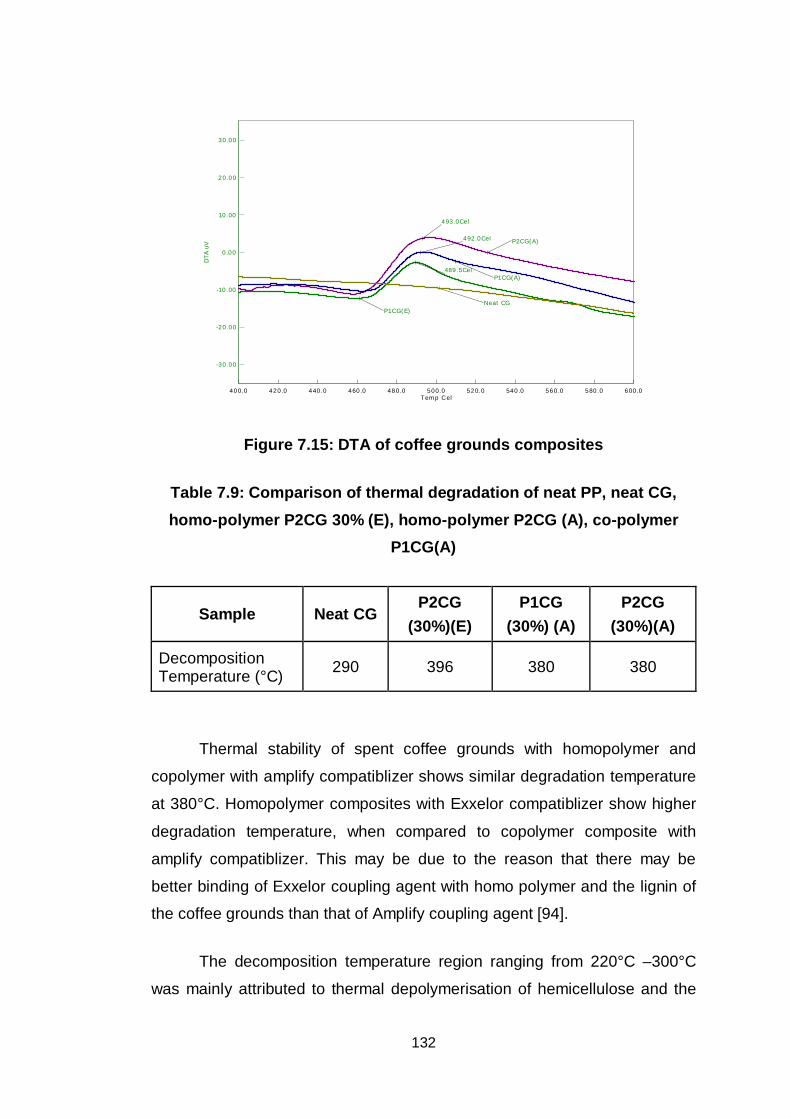
132
Figure 7.15: DTA of coffee grounds composites
Table 7.9: Comparison of thermal degradation of neat PP, neat CG, homo-polymer P2CG 30% (E), homo-polymer P2CG (A), co-polymer
P1CG(A)
Sample Neat CG P2CG
(30%)(E) P1CG
(30%) (A) P2CG
(30%)(A)
Decomposition Temperature (°C) 290 396 380 380
Thermal stability of spent coffee grounds with homopolymer and
copolymer with amplify compatiblizer shows similar degradation temperature
at 380°C. Homopolymer composites with Exxelor compatiblizer show higher
degradation temperature, when compared to copolymer composite with
amplify compatiblizer. This may be due to the reason that there may be
better binding of Exxelor coupling agent with homo polymer and the lignin of
the coffee grounds than that of Amplify coupling agent [94].
The decomposition temperature region ranging from 220°C –300°C
was mainly attributed to thermal depolymerisation of hemicellulose and the
Tem p Cel600.0580.0560.0540.0520.0500.0480.0460.0440.0420.0400.0
DTA
uV
30 .00
20.00
10.00
0.00
-10 .00
-20 .00
-30 .00
P1CG(E)
P2CG(A)
Neat CG
P1CG(A)
493 .0Cel
492 .0Cel
489 .5Cel
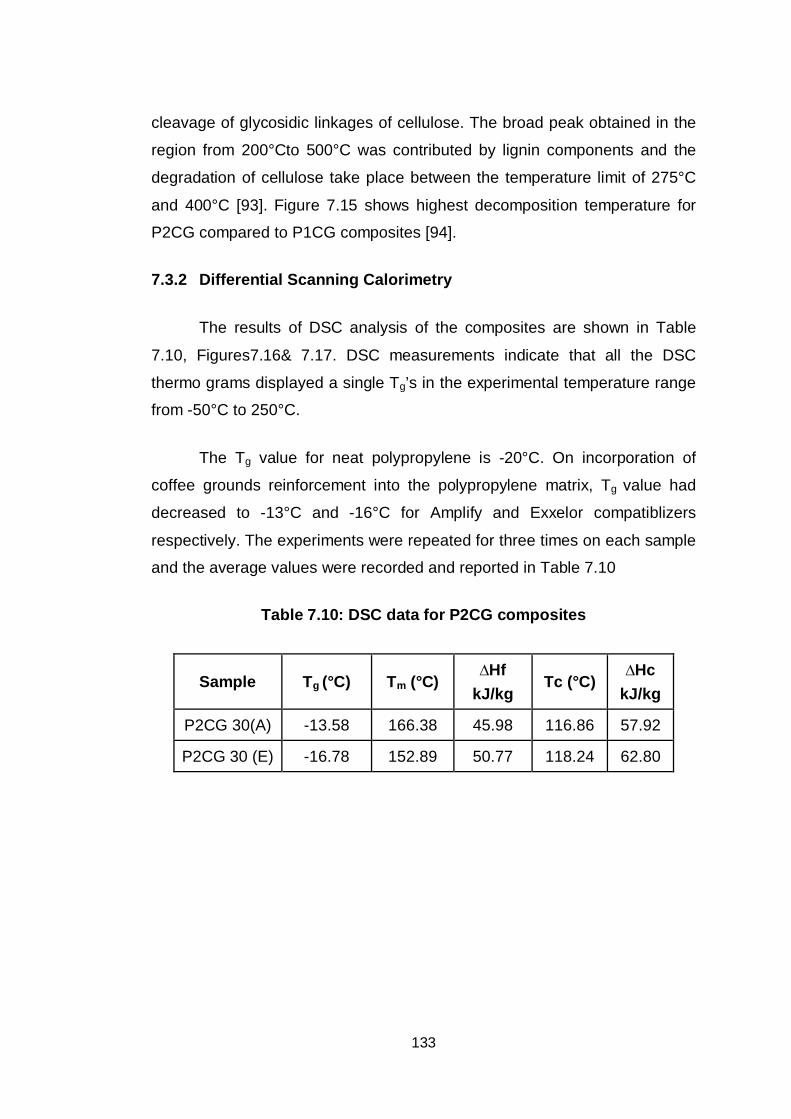
133
cleavage of glycosidic linkages of cellulose. The broad peak obtained in the
region from 200°Cto 500°C was contributed by lignin components and the
degradation of cellulose take place between the temperature limit of 275°C
and 400°C [93]. Figure 7.15 shows highest decomposition temperature for
P2CG compared to P1CG composites [94].
7.3.2 Differential Scanning Calorimetry
The results of DSC analysis of the composites are shown in Table
7.10, Figures7.16& 7.17. DSC measurements indicate that all the DSC
thermo grams displayed a single Tg’s in the experimental temperature range
from -50°C to 250°C.
The Tg value for neat polypropylene is -20°C. On incorporation of
coffee grounds reinforcement into the polypropylene matrix, Tg value had
decreased to -13°C and -16°C for Amplify and Exxelor compatiblizers
respectively. The experiments were repeated for three times on each sample
and the average values were recorded and reported in Table 7.10
Table 7.10: DSC data for P2CG composites
Sample Tg (°C) Tm (°C) Hf
kJ/kg Tc (°C)
Hc kJ/kg
P2CG 30(A) -13.58 166.38 45.98 116.86 57.92
P2CG 30 (E) -16.78 152.89 50.77 118.24 62.80
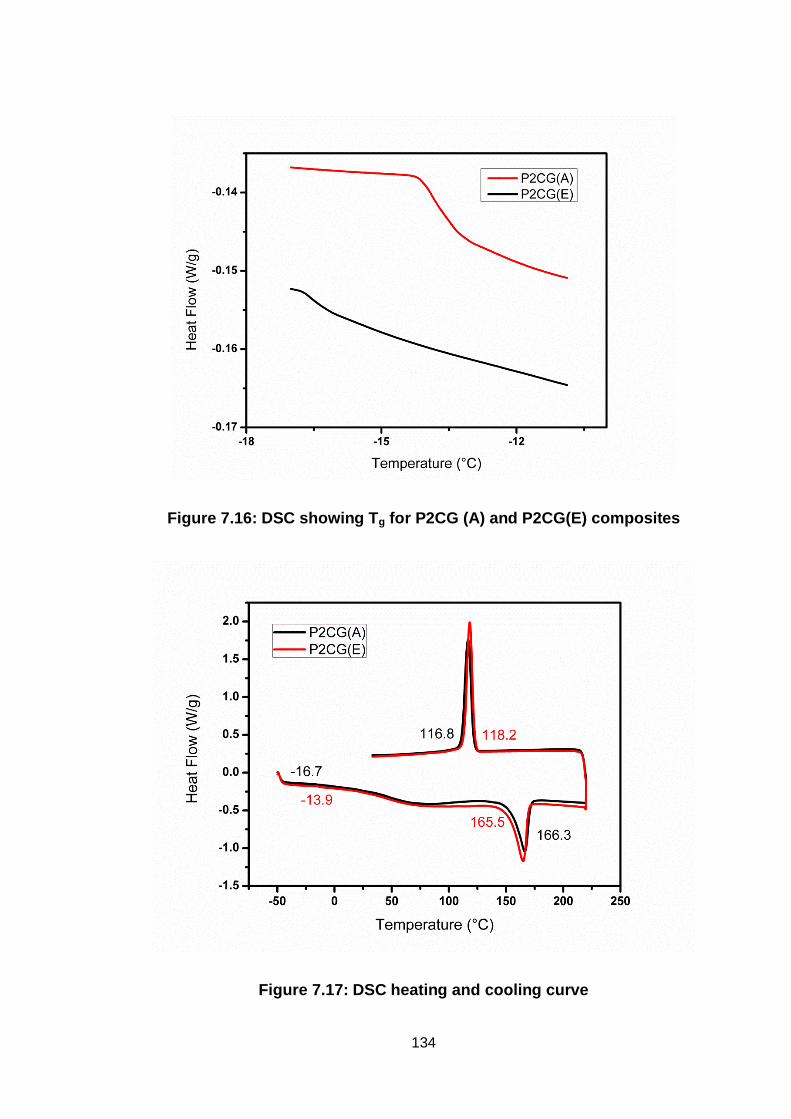
134
Figure 7.16: DSC showing Tg for P2CG (A) and P2CG(E) composites
Figure 7.17: DSC heating and cooling curve
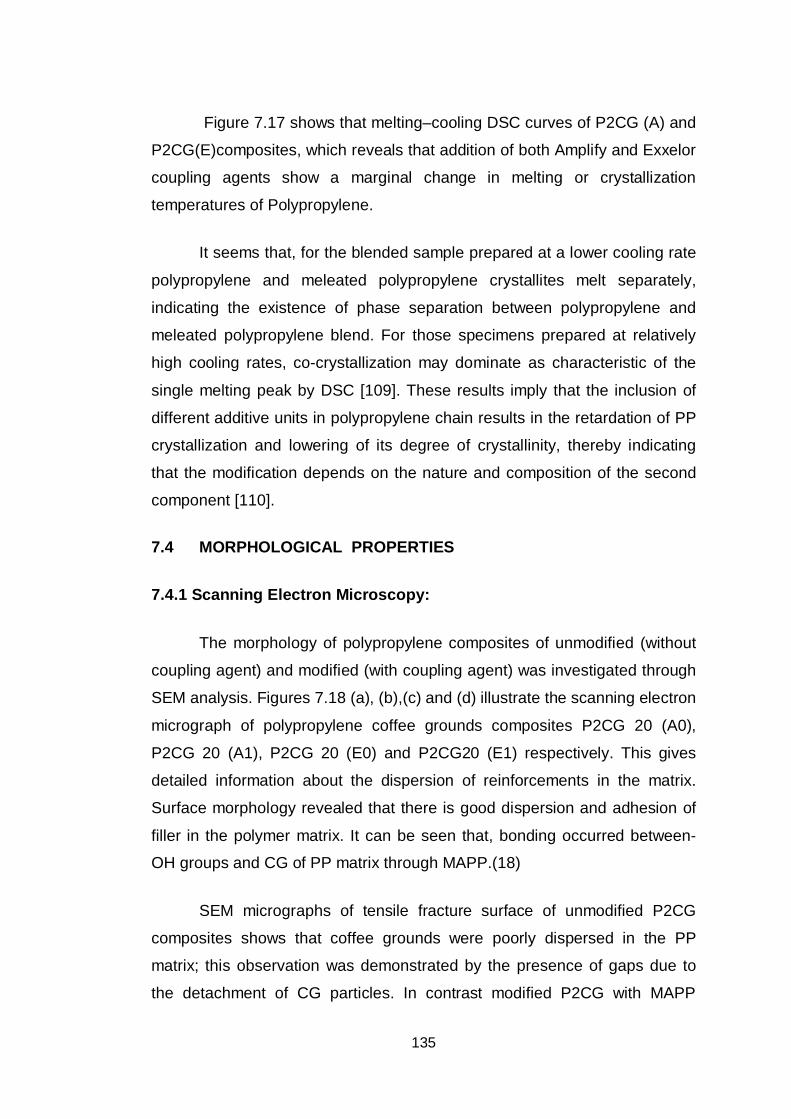
135
Figure 7.17 shows that melting–cooling DSC curves of P2CG (A) and
P2CG(E)composites, which reveals that addition of both Amplify and Exxelor
coupling agents show a marginal change in melting or crystallization
temperatures of Polypropylene.
It seems that, for the blended sample prepared at a lower cooling rate
polypropylene and meleated polypropylene crystallites melt separately,
indicating the existence of phase separation between polypropylene and
meleated polypropylene blend. For those specimens prepared at relatively
high cooling rates, co-crystallization may dominate as characteristic of the
single melting peak by DSC [109]. These results imply that the inclusion of
different additive units in polypropylene chain results in the retardation of PP
crystallization and lowering of its degree of crystallinity, thereby indicating
that the modification depends on the nature and composition of the second
component [110].
7.4 MORPHOLOGICAL PROPERTIES
7.4.1 Scanning Electron Microscopy:
The morphology of polypropylene composites of unmodified (without
coupling agent) and modified (with coupling agent) was investigated through
SEM analysis. Figures 7.18 (a), (b),(c) and (d) illustrate the scanning electron
micrograph of polypropylene coffee grounds composites P2CG 20 (A0),
P2CG 20 (A1), P2CG 20 (E0) and P2CG20 (E1) respectively. This gives
detailed information about the dispersion of reinforcements in the matrix.
Surface morphology revealed that there is good dispersion and adhesion of
filler in the polymer matrix. It can be seen that, bonding occurred between-
OH groups and CG of PP matrix through MAPP.(18)
SEM micrographs of tensile fracture surface of unmodified P2CG
composites shows that coffee grounds were poorly dispersed in the PP
matrix; this observation was demonstrated by the presence of gaps due to
the detachment of CG particles. In contrast modified P2CG with MAPP
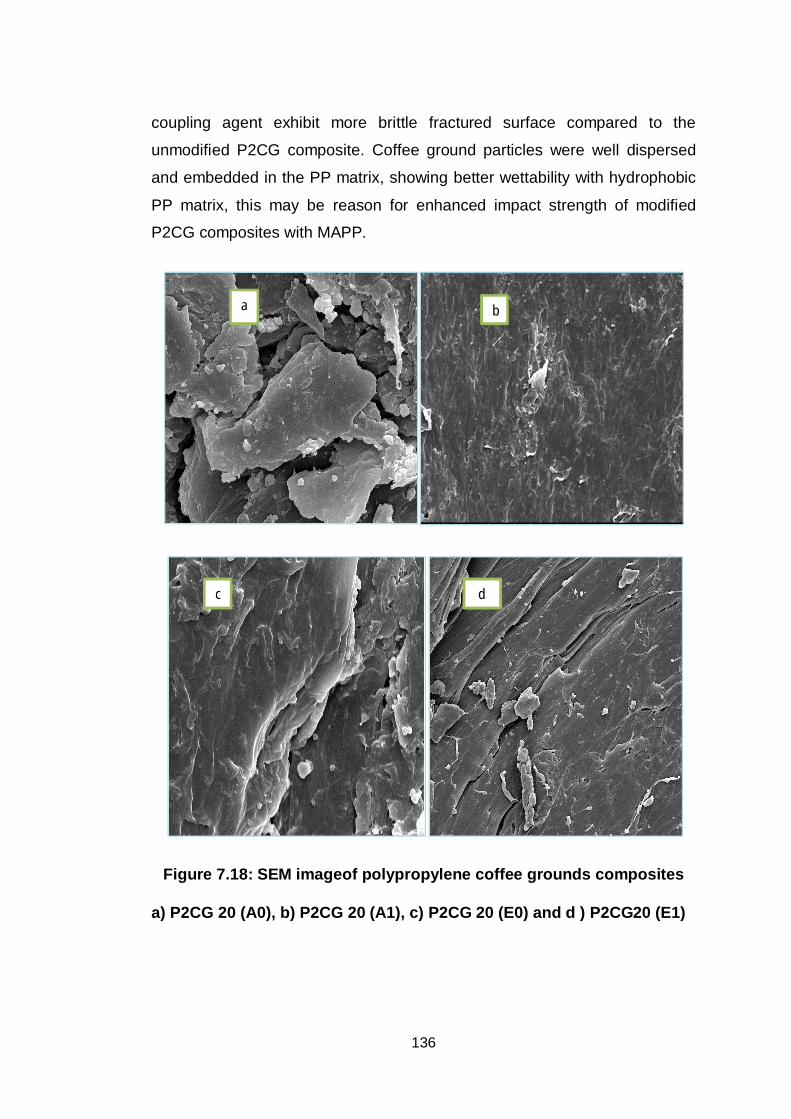
136
coupling agent exhibit more brittle fractured surface compared to the
unmodified P2CG composite. Coffee ground particles were well dispersed
and embedded in the PP matrix, showing better wettability with hydrophobic
PP matrix, this may be reason for enhanced impact strength of modified
P2CG composites with MAPP.
Figure 7.18: SEM imageof polypropylene coffee grounds composites
a) P2CG 20 (A0), b) P2CG 20 (A1), c) P2CG 20 (E0) and d ) P2CG20 (E1)
a b
c d
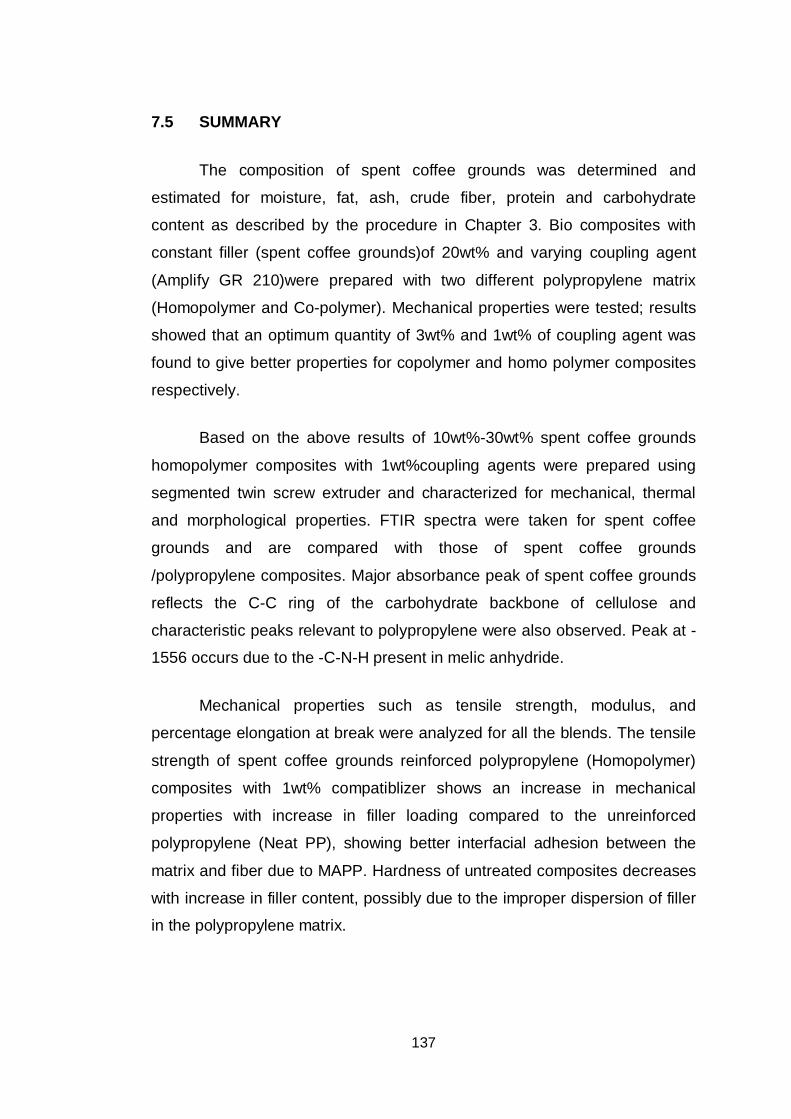
137
7.5 SUMMARY
The composition of spent coffee grounds was determined and
estimated for moisture, fat, ash, crude fiber, protein and carbohydrate
content as described by the procedure in Chapter 3. Bio composites with
constant filler (spent coffee grounds)of 20wt% and varying coupling agent
(Amplify GR 210)were prepared with two different polypropylene matrix
(Homopolymer and Co-polymer). Mechanical properties were tested; results
showed that an optimum quantity of 3wt% and 1wt% of coupling agent was
found to give better properties for copolymer and homo polymer composites
respectively.
Based on the above results of 10wt%-30wt% spent coffee grounds
homopolymer composites with 1wt%coupling agents were prepared using
segmented twin screw extruder and characterized for mechanical, thermal
and morphological properties. FTIR spectra were taken for spent coffee
grounds and are compared with those of spent coffee grounds
/polypropylene composites. Major absorbance peak of spent coffee grounds
reflects the C-C ring of the carbohydrate backbone of cellulose and
characteristic peaks relevant to polypropylene were also observed. Peak at -
1556 occurs due to the -C-N-H present in melic anhydride.
Mechanical properties such as tensile strength, modulus, and
percentage elongation at break were analyzed for all the blends. The tensile
strength of spent coffee grounds reinforced polypropylene (Homopolymer)
composites with 1wt% compatiblizer shows an increase in mechanical
properties with increase in filler loading compared to the unreinforced
polypropylene (Neat PP), showing better interfacial adhesion between the
matrix and fiber due to MAPP. Hardness of untreated composites decreases
with increase in filler content, possibly due to the improper dispersion of filler
in the polypropylene matrix.
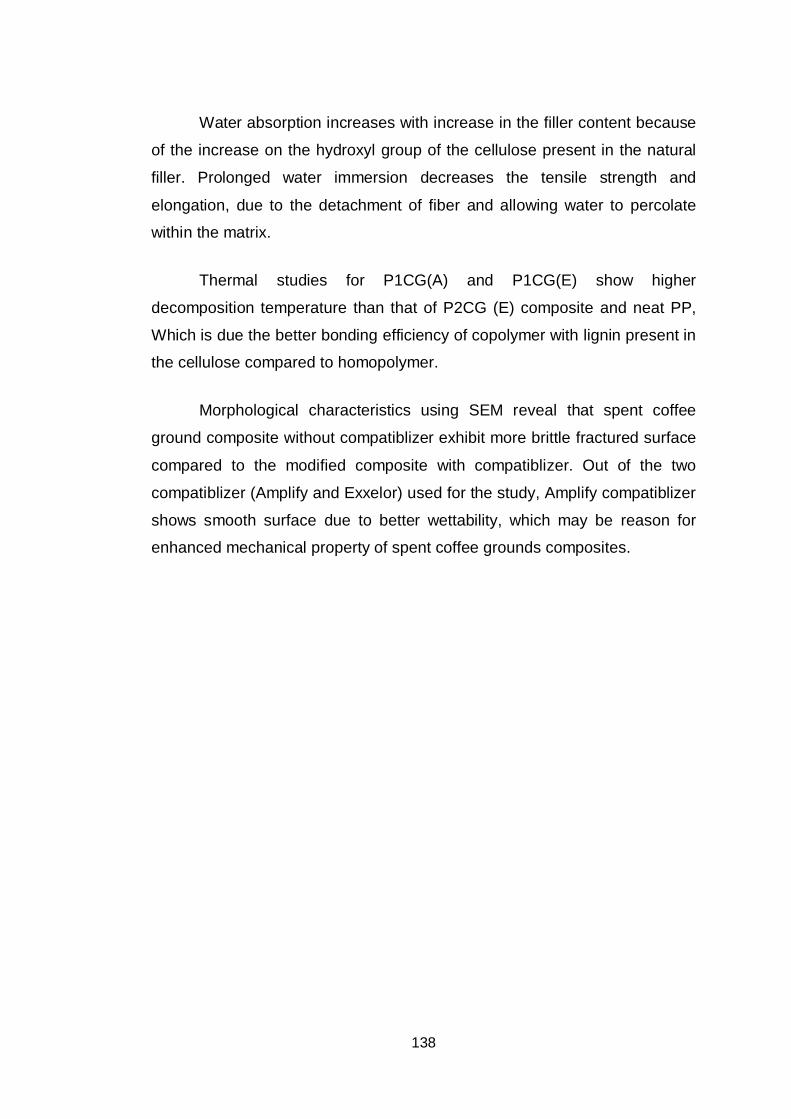
138
Water absorption increases with increase in the filler content because
of the increase on the hydroxyl group of the cellulose present in the natural
filler. Prolonged water immersion decreases the tensile strength and
elongation, due to the detachment of fiber and allowing water to percolate
within the matrix.
Thermal studies for P1CG(A) and P1CG(E) show higher
decomposition temperature than that of P2CG (E) composite and neat PP,
Which is due the better bonding efficiency of copolymer with lignin present in
the cellulose compared to homopolymer.
Morphological characteristics using SEM reveal that spent coffee
ground composite without compatiblizer exhibit more brittle fractured surface
compared to the modified composite with compatiblizer. Out of the two
compatiblizer (Amplify and Exxelor) used for the study, Amplify compatiblizer
shows smooth surface due to better wettability, which may be reason for
enhanced mechanical property of spent coffee grounds composites.
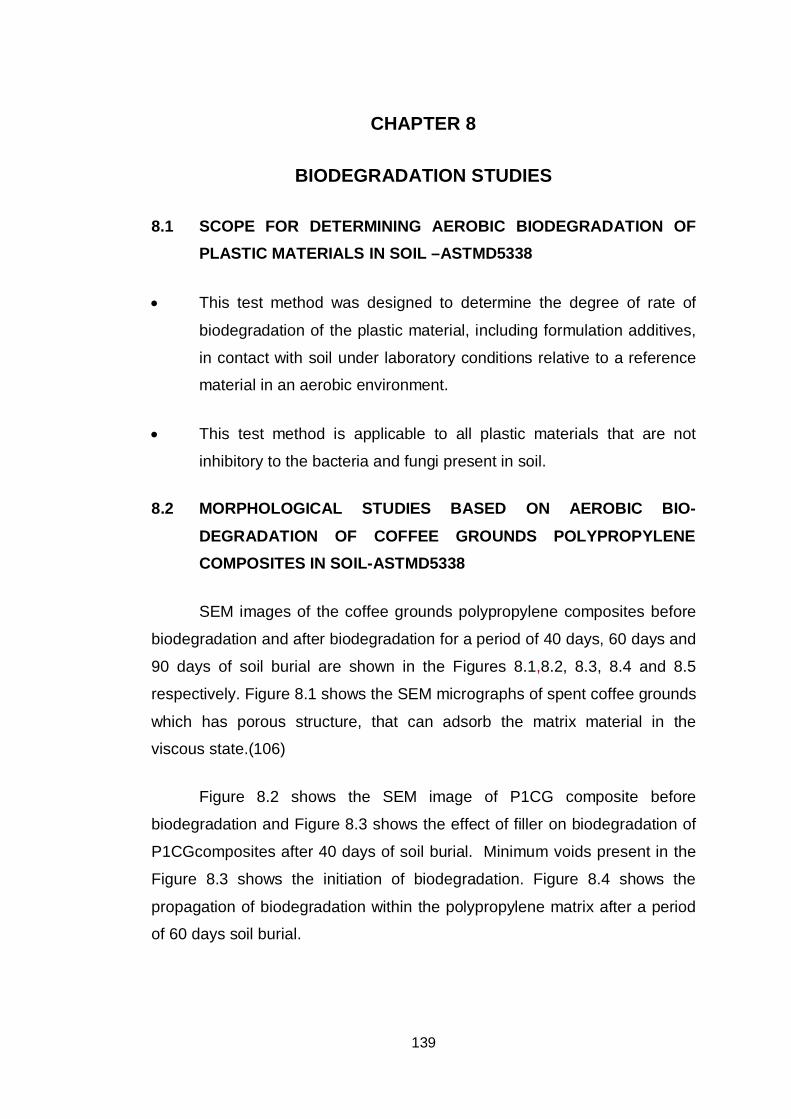
139
CHAPTER 8
BIODEGRADATION STUDIES
8.1 SCOPE FOR DETERMINING AEROBIC BIODEGRADATION OF PLASTIC MATERIALS IN SOIL –ASTMD5338
This test method was designed to determine the degree of rate of
biodegradation of the plastic material, including formulation additives,
in contact with soil under laboratory conditions relative to a reference
material in an aerobic environment.
This test method is applicable to all plastic materials that are not
inhibitory to the bacteria and fungi present in soil.
8.2 MORPHOLOGICAL STUDIES BASED ON AEROBIC BIO-
DEGRADATION OF COFFEE GROUNDS POLYPROPYLENE COMPOSITES IN SOIL-ASTMD5338
SEM images of the coffee grounds polypropylene composites before
biodegradation and after biodegradation for a period of 40 days, 60 days and
90 days of soil burial are shown in the Figures 8.1,8.2, 8.3, 8.4 and 8.5
respectively. Figure 8.1 shows the SEM micrographs of spent coffee grounds
which has porous structure, that can adsorb the matrix material in the
viscous state.(106)
Figure 8.2 shows the SEM image of P1CG composite before
biodegradation and Figure 8.3 shows the effect of filler on biodegradation of
P1CGcomposites after 40 days of soil burial. Minimum voids present in the
Figure 8.3 shows the initiation of biodegradation. Figure 8.4 shows the
propagation of biodegradation within the polypropylene matrix after a period
of 60 days soil burial.
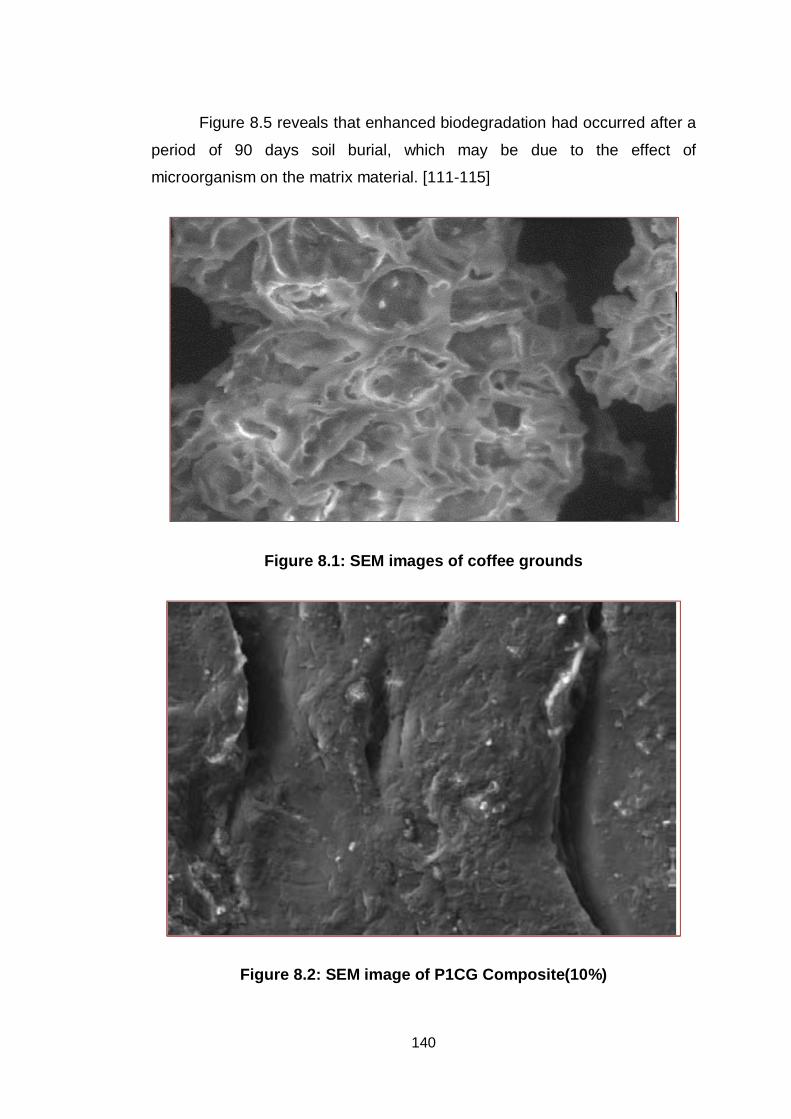
140
Figure 8.5 reveals that enhanced biodegradation had occurred after a
period of 90 days soil burial, which may be due to the effect of
microorganism on the matrix material. [111-115]
Figure 8.1: SEM images of coffee grounds
Figure 8.2: SEM image of P1CG Composite(10%)
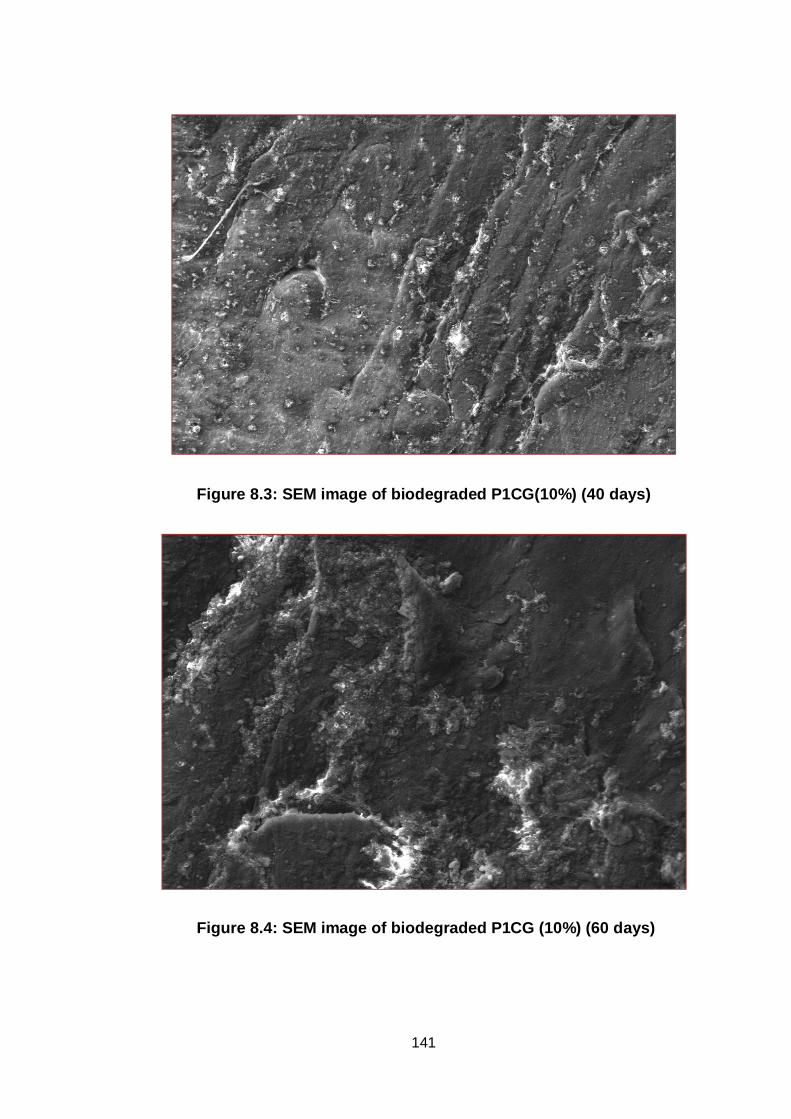
141
Figure 8.3: SEM image of biodegraded P1CG(10%) (40 days)
Figure 8.4: SEM image of biodegraded P1CG (10%) (60 days)
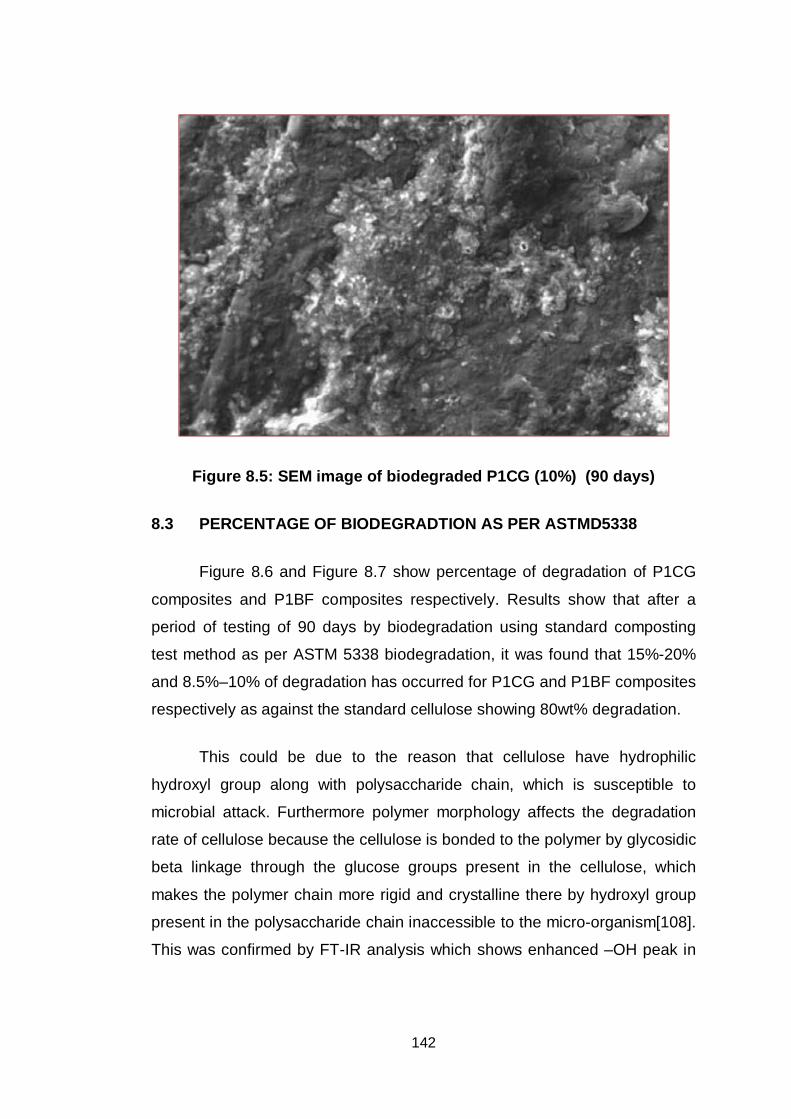
142
Figure 8.5: SEM image of biodegraded P1CG (10%) (90 days)
8.3 PERCENTAGE OF BIODEGRADTION AS PER ASTMD5338
Figure 8.6 and Figure 8.7 show percentage of degradation of P1CG
composites and P1BF composites respectively. Results show that after a
period of testing of 90 days by biodegradation using standard composting
test method as per ASTM 5338 biodegradation, it was found that 15%-20%
and 8.5%–10% of degradation has occurred for P1CG and P1BF composites
respectively as against the standard cellulose showing 80wt% degradation.
This could be due to the reason that cellulose have hydrophilic
hydroxyl group along with polysaccharide chain, which is susceptible to
microbial attack. Furthermore polymer morphology affects the degradation
rate of cellulose because the cellulose is bonded to the polymer by glycosidic
beta linkage through the glucose groups present in the cellulose, which
makes the polymer chain more rigid and crystalline there by hydroxyl group
present in the polysaccharide chain inaccessible to the micro-organism[108].
This was confirmed by FT-IR analysis which shows enhanced –OH peak in
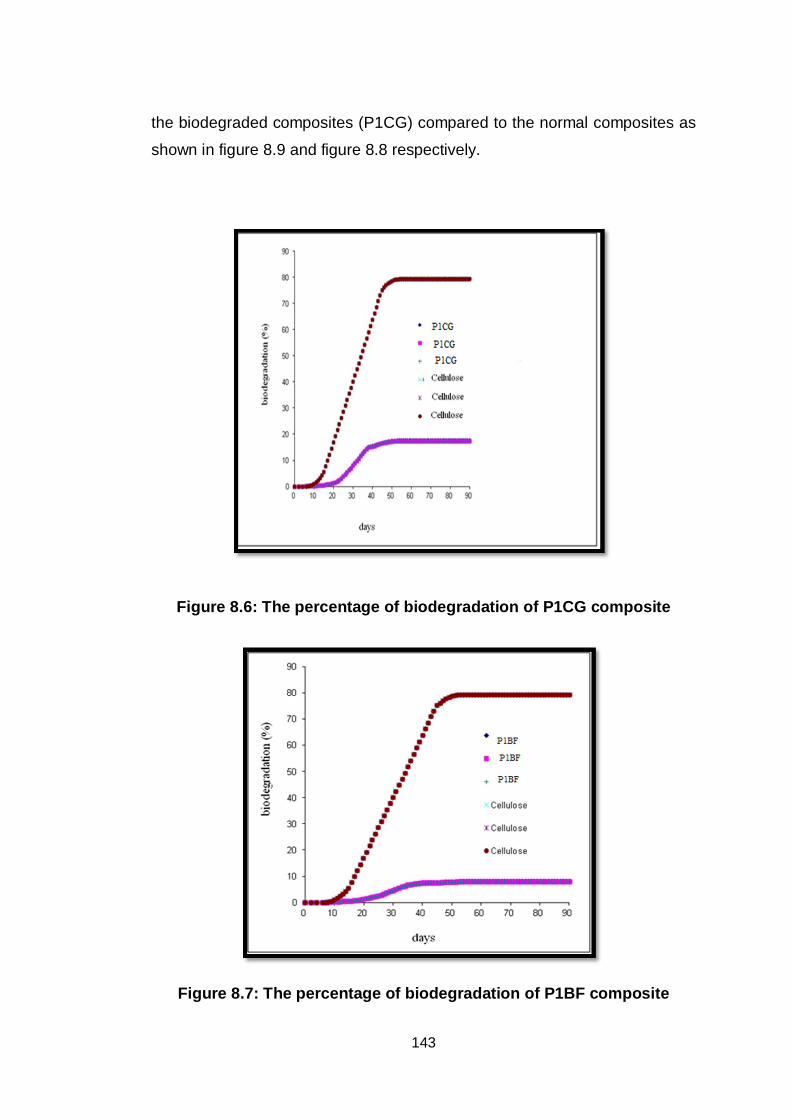
143
the biodegraded composites (P1CG) compared to the normal composites as
shown in figure 8.9 and figure 8.8 respectively.
Figure 8.6: The percentage of biodegradation of P1CG composite
Figure 8.7: The percentage of biodegradation of P1BF composite
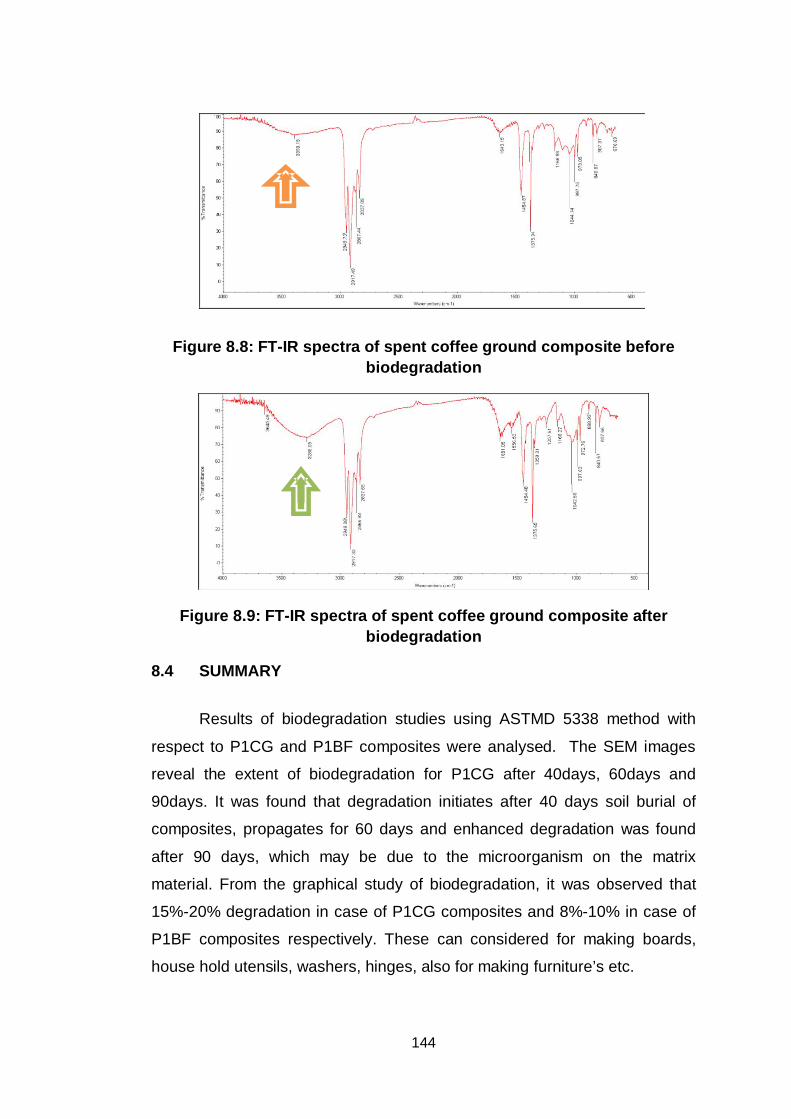
144
Figure 8.8: FT-IR spectra of spent coffee ground composite before biodegradation
Figure 8.9: FT-IR spectra of spent coffee ground composite after biodegradation
8.4 SUMMARY
Results of biodegradation studies using ASTMD 5338 method with
respect to P1CG and P1BF composites were analysed. The SEM images
reveal the extent of biodegradation for P1CG after 40days, 60days and
90days. It was found that degradation initiates after 40 days soil burial of
composites, propagates for 60 days and enhanced degradation was found
after 90 days, which may be due to the microorganism on the matrix
material. From the graphical study of biodegradation, it was observed that
15%-20% degradation in case of P1CG composites and 8%-10% in case of
P1BF composites respectively. These can considered for making boards,
house hold utensils, washers, hinges, also for making furniture’s etc.
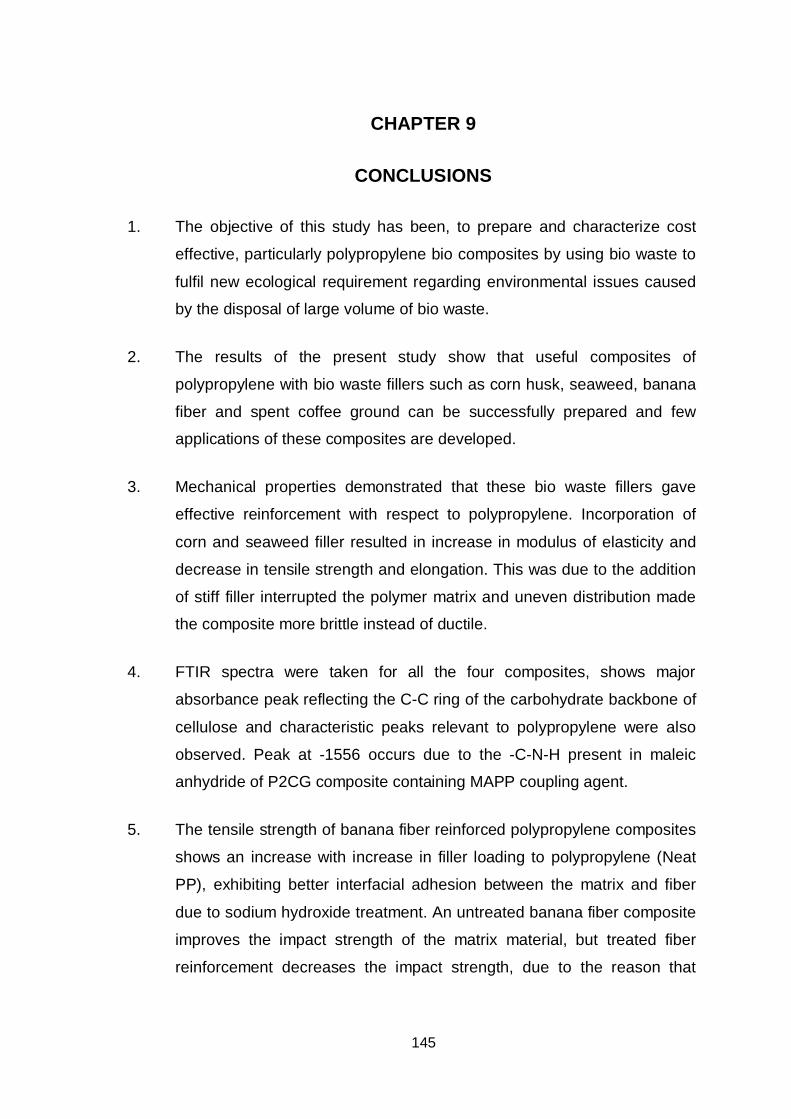
145
CHAPTER 9
CONCLUSIONS
1. The objective of this study has been, to prepare and characterize cost
effective, particularly polypropylene bio composites by using bio waste to
fulfil new ecological requirement regarding environmental issues caused
by the disposal of large volume of bio waste.
2. The results of the present study show that useful composites of
polypropylene with bio waste fillers such as corn husk, seaweed, banana
fiber and spent coffee ground can be successfully prepared and few
applications of these composites are developed.
3. Mechanical properties demonstrated that these bio waste fillers gave
effective reinforcement with respect to polypropylene. Incorporation of
corn and seaweed filler resulted in increase in modulus of elasticity and
decrease in tensile strength and elongation. This was due to the addition
of stiff filler interrupted the polymer matrix and uneven distribution made
the composite more brittle instead of ductile.
4. FTIR spectra were taken for all the four composites, shows major
absorbance peak reflecting the C-C ring of the carbohydrate backbone of
cellulose and characteristic peaks relevant to polypropylene were also
observed. Peak at -1556 occurs due to the -C-N-H present in maleic
anhydride of P2CG composite containing MAPP coupling agent.
5. The tensile strength of banana fiber reinforced polypropylene composites
shows an increase with increase in filler loading to polypropylene (Neat
PP), exhibiting better interfacial adhesion between the matrix and fiber
due to sodium hydroxide treatment. An untreated banana fiber composite
improves the impact strength of the matrix material, but treated fiber
reinforcement decreases the impact strength, due to the reason that
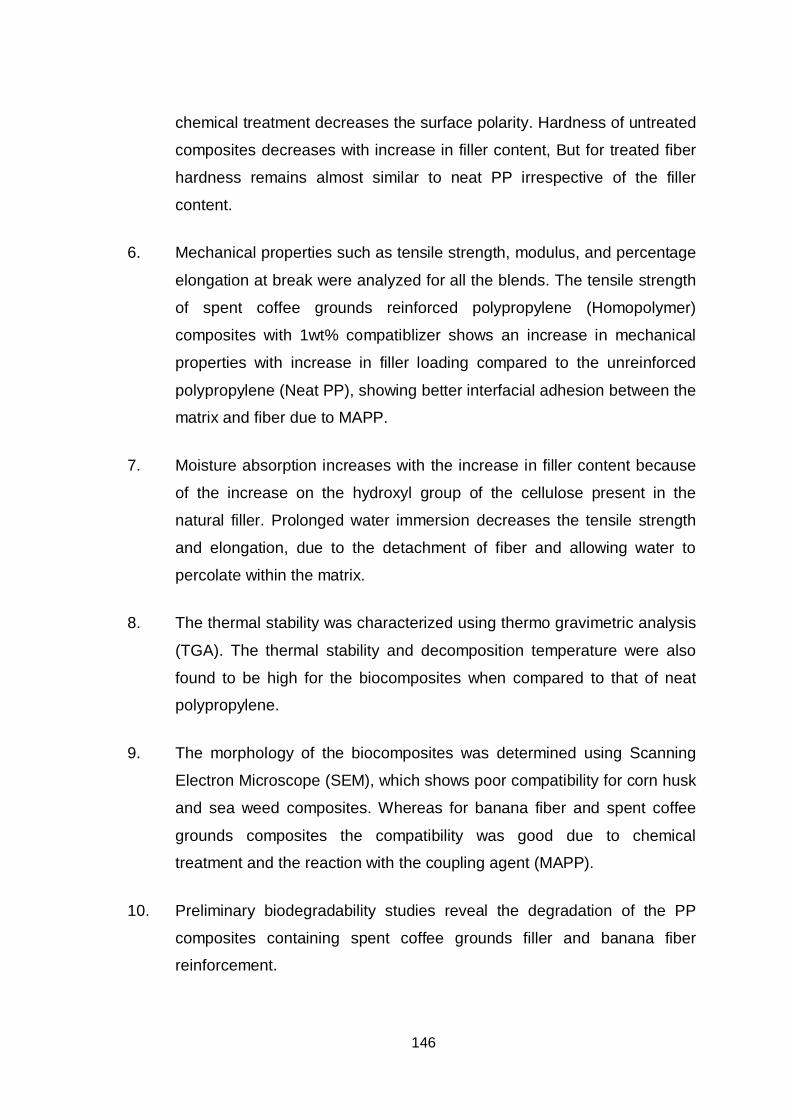
146
chemical treatment decreases the surface polarity. Hardness of untreated
composites decreases with increase in filler content, But for treated fiber
hardness remains almost similar to neat PP irrespective of the filler
content.
6. Mechanical properties such as tensile strength, modulus, and percentage
elongation at break were analyzed for all the blends. The tensile strength
of spent coffee grounds reinforced polypropylene (Homopolymer)
composites with 1wt% compatiblizer shows an increase in mechanical
properties with increase in filler loading compared to the unreinforced
polypropylene (Neat PP), showing better interfacial adhesion between the
matrix and fiber due to MAPP.
7. Moisture absorption increases with the increase in filler content because
of the increase on the hydroxyl group of the cellulose present in the
natural filler. Prolonged water immersion decreases the tensile strength
and elongation, due to the detachment of fiber and allowing water to
percolate within the matrix.
8. The thermal stability was characterized using thermo gravimetric analysis
(TGA). The thermal stability and decomposition temperature were also
found to be high for the biocomposites when compared to that of neat
polypropylene.
9. The morphology of the biocomposites was determined using Scanning
Electron Microscope (SEM), which shows poor compatibility for corn husk
and sea weed composites. Whereas for banana fiber and spent coffee
grounds composites the compatibility was good due to chemical
treatment and the reaction with the coupling agent (MAPP).
10. Preliminary biodegradability studies reveal the degradation of the PP
composites containing spent coffee grounds filler and banana fiber
reinforcement.
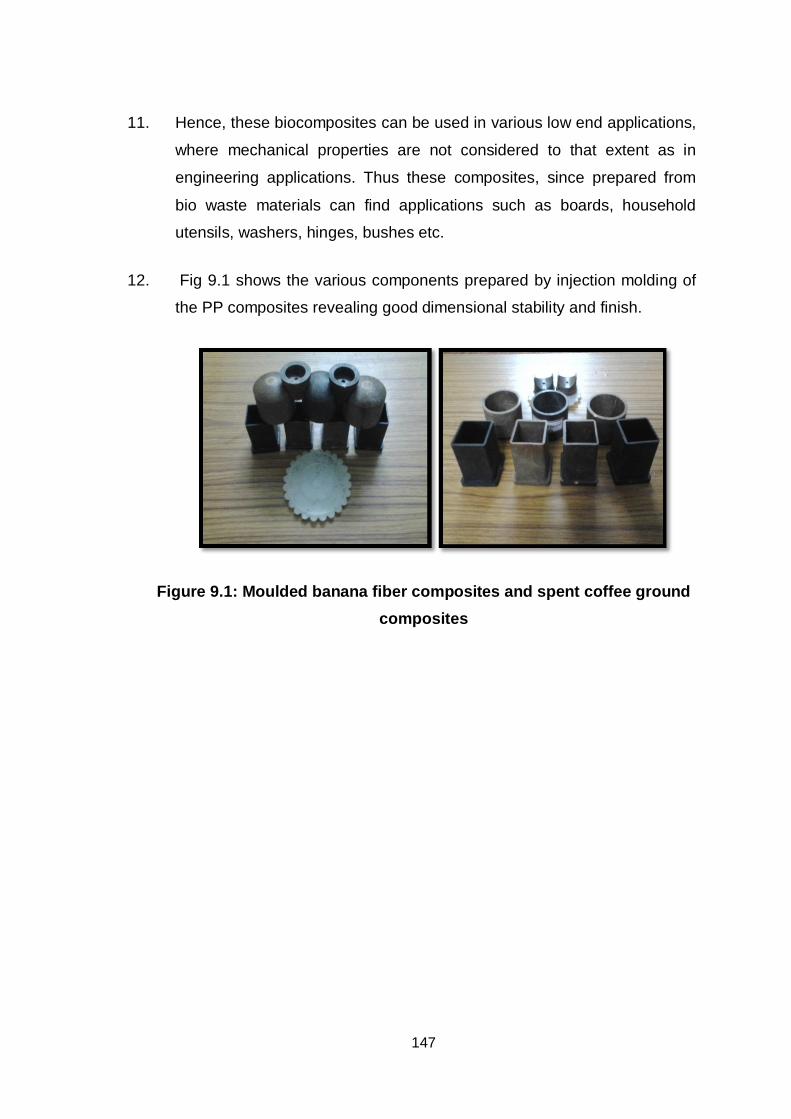
147
11. Hence, these biocomposites can be used in various low end applications,
where mechanical properties are not considered to that extent as in
engineering applications. Thus these composites, since prepared from
bio waste materials can find applications such as boards, household
utensils, washers, hinges, bushes etc.
12. Fig 9.1 shows the various components prepared by injection molding of
the PP composites revealing good dimensional stability and finish.
Figure 9.1: Moulded banana fiber composites and spent coffee ground composites
148
FUTURE WORK
Trials of preparation of PP composites with high loading levels of filler
using a suitable compatiblizer.
To study the effect of compatiblizer and sodium hydroxide treatment
with respect to corn husk and seaweed biocomposites.
To study the mechanism of coupling with various biofillers.
Various other methods of treatment (with silane treatment or plasma
treatment) of natural fillers for better adhesion.
Explore applications of PP composites to market the products.
Extensive biodegradability studies on with respect other natural filler
filled PP composites.
Extensive studies on effect of processing temperature of the bio PP
composites to remove the feasibility of thermal degradation of the
natural fillers.
Fracture mechanic studies of biocomposites.
149
REFERENCES
[1] Serrano D.P, Aguado J, EscolaJ.M, Garagorri E, Rodr guez J.M,
Morselli L, Palazzi G, and Orsi R, “Feedstock recycling of agriculture
plastic film wastes by catalytic cracking”, Applied Catalysis B:
Environmental, Vol. 49, pp. 257–265, 2004.
[2] Mugnozza G. S, Schettini E, Vox G, Malinconico M, Immirzi B, and
Pagliara S, “Mechanical properties decay and morphological
behaviour of biodegradable films for agricultural mulching in real scale
experiment”, Polymer Degradation and Stability, Vol. 91, pp. 2801-
2808, 2006.
[3] Briassoulis D, “Mechanical behaviour of biodegradable agricultural
films under real field conditions”, Polymer Degradation and Stability,
Vol. 91, no. 6, pp. 1256-1272, 2006.
[4] Khalid M, Ali S, Abdullah L.C, Ratnam C.T, and Thomas Choong S.Y,
“Effect of MAPP as coupling agent on the mechanical properties of
palm fiber empty fruit bunch and cellulose polypropylene”,
International Journal of Engineering and Technology, Vol. 3, pp.79-84,
2006.
[5] Zaini M. J, Ismail Z, Fuad M. Y. A, and Mustafah J, “The effect of filler
content and the size on the mechanical properties of polypropylene/oil
palm wood flour composite”, Polymer International Vol.40, pp.51-
56,1995.
[6] Nasrul Hatta and Nairul Akmar, “Mechanical properties of
polystyrene/polypropylene reinforced Coconut and Jute fibers”,
CUTSE, International Conference, 24-27 Nov, Miri, Sarawak,
Malaysia, 2008.
150
[7] Maldas D, and Kokta B.V, “Interfacial Adhesion of Ligno cellulosic
Materials in Polymer Composites: An Overview”, Composite
Interfaces Vol.1, pp. 87-108. 1993.
[8] Mohanty A. K, Misra M, and Drazl L. T, “Natural fibers, biopolymers
and biocomposites”, (chapter 12), CRC press, New York, 2005.
[9] Bogoeva-Gaceva, Avella M, and Malinoconico, “Natural fiber eco-
composites”, Polymer Composites, Vol.28, pp.98-107, 2007.
[10] Wei-ming Wang, Zai-sheng Cai, and Jian-yong Yu, “Study on the
chemical modification process of jute fiber”, Journal of Engineered
Fibers and Fabrics, Vol. 3, Issue 2, 2008.
[11] Coutinho F.M.B and Costa T.H.S, “Performance of polypropylene-
wood fiber composites”, Journal of Polymer Testing, Vol. 18, pp. 581-
587,1999.
[12] Karmakar A.C, and Young quist J.A, “Injection molding of
polypropylene reinforced with short jute fibers”, Journal of Applied
Polymer Science, Vol.62, pp.1147-115, 1998.
[13] Sushree Sangita Mullick, “Fabrication and characterisation of alkali
treated natural fibre reinforced polymer composites”, Thesis, NIT,
Rourkela, 2012.
[14] Chattopadhyay S. N, Pan N. C, Day A, Mondal S.B, and KhanA,
“Reactive dyeing of pretreated jute fabric using minimum application
technology”, The J. Tex. Inst. 97, Vol.6, pp. 493-501, 2006.
[15] Sabu Thomas, Kuruvilla Joseph, Sant Kumar Malhotra, Koichi Goda,
and Meyyarappallil Sadasivan Sreekala “Introduction to polymer
composites”, Vol. 1, First Edition, 2012.
151
[16] Avella M, Errico M. E, Laurienzo P, Martuscelli E, Raimo M, and
Rimedio R, “Preparation and characterization of compatibilized
polycaprolactone/starch composites”, Polymer 2000, Vol. 41, pp.
3875-3881.
[17] John Z. Lu, Ioan. I. Negulensuu, and Qinylin wu, “Maleated wood
fiber/high density polyethylene composites: Coupling mechanisms and
interfacial characterisation”, Composite Interface, Vol.12, pp.125-140,
2005.
[18] Campos A, Marconcini J. M, Martins-Franchetti S. M, and Mattoso L.
H.C, “The influence of UV-C irradiation on the properties of
thermoplastic starch and polycaprolactone biocomposite with sisal
bleached fiber”, Polymer Degradation and Stability, Vol.10, pp.1948-
1955, 2012.
[19] Pilla S, Gong S, ONeill E, Rowell R.M and Krzysik A.M, “Polylactide-
pine Wood Flour Composites”, Polym Eng Sci, Vol.4, pp. 578-587,
2007.
[20] Campos A, Marconcini J.M, Imam S.H, Klamczynski A, Ortis W.J,
Wood D H, Williams T G, Martins-Franchetti SM and Mattoso L.H.C,
“Morphological, mechanical properties and biodegradability of
biocomposite thermoplastic starch and polycaprolactone reinforced
with sisal fiber”, Journal of Reinforced Plastics and Composites, Vol.
31, pp. 573-581, 2012.
[21] Abdul Khalil H.P.S, Bhat A. H and Ireana Yusra A.F, “Green
composites from sustainable cellulose nanofibrils: A Review”,
Carbohydrate Polymers, Vol.87 (2), pp.969, 2012.
[23] Manikandan V, Winowlin Jappes J.T, Suresh Kumar S.M, and
Amuthakkannan P, “Investigation of the effect of surface modifications
on the mechanical properties of basalt fibre reinforced polymer
152
composites”, Composites Part B: Engineering, Vol. 43(2), pp. 812-
818, 2012.
[24] Huda M.S, Drzal, Lawrence T, Mohanty, Amar K, Misra and Manjusri,
“Effect of fiber surface-treatments on the properties of laminated
biocomposites from poly(lactic acid) (PLA) and kenaf fiber”,
Composites Science and Technology, Vol.68(2), pp. 424-432, 2008.
[25] Murariu M, Dechief, Anne Laure, Bonnaud, Leila, Paint, Yoann,
Gallos, Antoine, Fontaine, Gaëlle, Bourbigot, Serge, Dubois, and
Philippe, “The production and properties of polylactide composites
filled with expanded graphite”, Polymer Degradation and Stability, Vol.
95, pp. 889-900, 2010.
[26] Shibata S, Cao Yand Fukumoto I, “Flexural modulus of the
unidirectional and random composites made from biodegradable resin
and bamboo and kenaf fibres”, Composites Part A: Applied Science
and Manufacturing, Vol. 39(4), pp. 640-646, 2008.
[27] Mohanty A.K, Misra Manjusri and Drzal Lawrence, “Treateded natural
fibers, biopolymers and biocomposites”, Boca Raton: CRC Press.
2005.
[28] Ramires E.C, De Oliveira, Fernando, Frollini and Elisabete,
“Composites based on renewable materials: Polyurethane-type
matrices from forest by product/vegetable oil and reinforced with lingo
cellulosic fibers”, Journal of Applied Polymer Science, pp. 2224-2233,
2013.
[29] Rout J, Misra M, Tripathy S.S, Nayak S.K and Mohanty A. K, “The
Influence of fibre treatment on the performance of coir-polyester
composites”, Composite Science And Technology, Vol. 61, pp.1303 –
1310 , 2001.
153
[30] Dhakal H.N, Zhang Z.Y, Richardson M.O.W, “Effect of Water
Absorption on the mechanical properties of hemp fibre reinforced
unsaturated polyester composites” Composites Science and
Technology, Vol.67, pp.1674-1683, 2007.
[31] Mc Mullen P, “Fiber-resin composites for aircraft primary structures: a
short history 1936-1984”, Composites, Vol.5(3), pp. 222-300, 2001.
[32] Holbery J and Houston D, “Natural-fiber-reinforced polymer
composites in automotive applications” JOM, Vol.11, pp. 80-86.2006.
[33] Bledzki A. K, Faruk O and Sperber V. E, “Cars from bio-fibres”,
macromolecular material engineering, Vol.291, pp.449–457, 2006.
[34] Mohantya A.K, Misra M and Hinrichsen G, “Biodegradable polymers
and biocomposites: An Overview”, Macromolecules and Material
Engineering, Vol.276, pp.1-24, 2000.
[35] Bledzki A.K and Gassan J, “Composites reinforced with cellulose
based fibres” Progress in Polymer Science, Vol. 24, pp. 221–274,
1999.
[36] Saheb D. N and Jog J.P, “Natural fiber polymer composites: A
review”, Advances in Polymer Technology, Vol.1, pp.351–363, 1999.
[37] Li X, Tabil T. G and Panigrahi S, “Chemical treatments of natural fiber
for use in natural fiber-reinforced composites: A review”, Journal of
Polymers and the Environment, Vol.15, pp.25–33, 2007.
[38] Odian G, “Principles of Polymerization” Fourth Edition, John Wiley &
Sons, Inc: New Jersey, 2004.
[39] Bogoeva-Gaceva G, “Natural Fiber Eco-composites”, Polymer
Composites, Vol. 28(1), pp.98-107, 2007.
154
[40] Pickering K.L, “Properties and performance of natural-fibre
composites”, CRC Press: Florida, 2008.
[41] Rowell R. M, “Property enhanced natural fiber composite materials
based on chemical modification”, Science and Technology of
Polymers and Advanced Materials, pp. 717-732, 1998.
[42] George J, Sreekala M.S, Thomas S, “A review on interface
modification and characterization of natural fiber reinforced plastic
composites”, Polymer Engineering and Science, Vol. 41 (9), pp.1471-
1485, 2001.
[43] Singh B, Verma A and Gupta M, “Studies on adsorptive interaction
between natural fiber and coupling agents”, Journal of Applied
Polymer Science, Vol.70, pp.1847–1858, 1998.
[44] Yan Li Y, Mai Y and Ye L, “Sisal fibre and its composites: a review of
recent developments”, Composites Science and Technology, Vol. 60,
pp.2037-2055, 2000.
[45] Young R.A, Rowell R.M, Schultz T.P and Narayan R, “Utilization of
natural fibers: characterization, modification and application in lingo
cellulosic-plastic composites”, VSP, Sao Paulo, Brazil, pp.1-21,1997.
[46] Han Seung Yang, Douglas and Gardner J, “Morphological
characteristics of cellulose nanofibril-filled polypropylene composites”,
Wood and Fiber Science, Vol. 43, pp.215-224, 2011.
[47] Chandramohan D and Bharanichandar J, “Natural fiber reinforced
polymer composites for automobile accessories”, American Journal of
Environmental Science, Vol.9, pp.494-504, 2013.
155
[48] Lawrence T, Drzal, Mohanty A. K and Misra M, “Biofibers,
biodegradable polymers and biocomposites: An overview”, Macromol.
Mater.Eng, Vol.276/277, pp.1-2, 2000.
[49] Ing. Eva Aková, “Developement of natural fiber reinforced polymer
Composites”, Transferinovácií, Vol.25, 2013.
[50] Suddell B, “Industrial fibres: Recent and current developments”,
Proceedings of the Symposium on Natural Fibres, pp. 71-82, 2009.
[51] Priya P, Mishra and Acharya S. K, “Anisotropy abrasive wear
behaviour of bagasse fiber reinforced polymer composite”,
International Journal of Engineering, Science and Technology, Vol. 2,
pp. 104-112, 2010.
[52] Khairiah Haji Badri, Zulkefly Bin Othman and Ilyati Mohd Razali,
“Mechanical properties of polyurethane composites from oil palm
resources”, Iranian Polymer Journal, Vol.5, pp.441-448, 2005.
[53] Suwatthana, Phrommedetch and Cattaleeya Pattamaprom,
“Compatibility improvement of rice husk and bagasse ashes with
natural rubber by molten-state maleation”, European Journal of
Scientific Research, Vol.43, pp.411-416, 2010.
[54] Khalid M, Ali S, Abdullah L.C, Ratnam C.T and Thomas Choong S Y,
“Effect of MAPP as coupling agent on the mechanical properties of
palm fiber empty fruit bunch and cellulose polypropylene bio
composites”, International Journal of Engineering and Technology,
Vol. 3, No.1, pp.79-84, 2006.
[55] Doaa I. Osman, Khaled Z. Mohammed, Labiba I. Hussein Renee,
Abdallah, Afaf R. Taman and Ahmed I. Hashem, “Manufacturing and
characterization of oil-based polymer composites reinforced with kraft
156
pulp fiber”, Journal of Applied Sciences Research, Vol.6, pp. 813-821,
2010.
[56] Mohd Shahril, Ezuan Mustapa, Azman Hassan and Abdul Razak
Rahmat, “Preliminary study on the mechanical properties of
polypropylene rice husk composites”, Simposium Polimer
Kebangsaan, 23-24 Ogos, 2005.
[57] Muhammad Yasina, Abdul Waheed Bhuttob, Aqeel Ahmed Bazmia
and SadiaKarimb, “Efficient utilization of rice-wheat Straw to produce
value –added composite products”, International Journal of Chemical
and Environmental Engineering, Vol. 1, 2010.
[58] Huda M.S, Drzal L.T, Mohanty A.K. and Misra M., “Effect of fiber
surface-treatments on the properties of laminated bio composites from
poly(lactic acid) (PLA) and kenaf fibers”, Composites Science and
Technology, Vol.68, pp. 424-432, 2008.
[59] Cheung H.Y, Lau K.T, Tao X M and David H, “A potential material for
tissue engineering: silkworm silk/PLA bio composite”, Composites:
Part B, Vol.39, pp.1026-1033, 2008.
[60] Ramakrishna Malkapuram, Vivek Kumar and Yuvraj Singh Negi,
“Recent development in natural fiber reinforced polypropylene
composites”, Journal of Reinforced Plastics and Composite,Vol.28,
pp.1169,2009.
[61] Suarez J. C. M, Coutinho F. M. B and Syden stricker T. H, “SEM
studies of tensile fracture surfaces of polypropylene sawdust
composites”, Polymer Testing, Vol.22, pp.819–824, 2003.
[62] Girisha C, Sanjeeva murthy and Gunti Ranga Srinivas, “Sisal/coconut
coir natural fibers–epoxy composites: water absorption and
157
mechanical properties”, International Journal of Engineering and
Innovative technology (IJEIT), Vol.2, Issue 3, 2012.
[63] Pradeep Upadhyaya, Manoj Garg, Vijai Kumar and Ajay K. Nema,
“The effect of water absorption on mechanical properties of wood flour
/wheat husk polypropylene hybrid composites”, Materials Sciences
and Applications, Vol.3, pp.317-325, 2012.
[64] Roger M. Rowell, Sandra E. Lange and Rodney E. Jacobson, “Effects
of moisture on aspen-fiber/polypropylene composites”, Seventh
Pacific Rim Bio-Based Composites Symposium,2004.
[65] Chow C.P.L, Xing X.S and Li R.K, “Moisture absorption studies of
sisal fibre reinforced polypropylene composites”, Composites Science
and Technology, Vol.67, pp.306–313, 2007.
[66] Young R.A, Rowell R.M, Schultz T.P and Narayan R, “Utilization of
Natural fibers: Characterization, Modification and Application in
Lignocellulosic-Plastic Composites”, VSP, Sao Paulo,Brazil,pp.1-21,
1997.
[67] Saira Taj “Preparation and characterisation of agro-waste based
polymer composites”-Thesis, Institute of chemistry, University of
Punjab, 2007.
[68] Jayasekara R, Harding I, Bowater Iand Lonergan, “Biodegradability of
selected range of polymers and polymer blends and standard
methods for assessment of biodegradation”, J Polymer Environ.,
Vol.13, pp.231, 2005.
[69] GU J.D, “Microbiological deterioration and degradation of synthetic
polymeric materials: recent research advances” International bio
deterioration & biodegradation, Vol.52, pp. 69, 2003.
158
[70] Behjat T, Russly A. R, Luqman C. A, Yus A. Y and Nor Azowa I,
“Effect of PEG on the biodegradability studies of kenaf cellulose
polyethylene composites”, International Food Research Journal, Vol.
16,pp.243-247, 2009.
[71] Inderjeet Kaur and Neena Gautam, “Starch grafted polyethylene
evincing biodegradation behaviour”, Malaysian Polymer Journal, Vol.
5, No. 1, pp. 26-38, 2010.
[72] AzahariN. A, Othman Nand Ismail H, “Biodegradation studies of
polyvinyl alcohol/corn starch blend films in solid and solution media”,
Journal of Physical Science, Vol. 22(2), pp.15–31, 2011.
[73] Kim Hee-Soo, Kim Hyun-Joong, Lee Jae-Won and Choi In-Gyu,
“Biodegradability of bio-flour filled biodegradable poly (butylene
succinate) bio-composites in natural and compost soil”, Polymer
Degradation and Stability, Vol.91, pp. 127, 2006
[74] Nayak Sanjay K, “Degradation and flammability behavior of PP/
banana and glass fiber-based hybrid composites”, Int J Plast Technol,
Vol.13 (1), pp.47–67, 2006.
[75] Kh. Mumtahenah Siddiquee, Md. Maksud Helali, Md. Abdul Gafur and
Soma Chakraborty, “Investigation of an optimum method of
biodegradation process for jute polymer”, American Journal of
Engineering Research,Vol.3, pp-200-206, 2014.
[76] Chun K.S, Husseinsyah S and Osmanm H, “Properties of coconut
shell powder-filled polylactic acid ecocomposites: Effect of maleic
acid”, Polymer Engineering and Science, Vol. 53 (5), pp.1109-1116,
2013.
[77] Koay Seong Chun, Salmah Husseinsyah and Hakimah Osman
“Mechanical and thermal properties of coconut shell filled polylactic
159
acid, effect of filler and silane coupling agent on biocomposites”,
Journal of Polymer Research, Vol.19 (5), pp.1-8, 2012.
[78] Kim H. S, Lee B. H, Choi S. W, Kim S and Kim H. J, “The Effect of
types of maleic anhydride-grafted polypropylene on the interfacial
adhesion properties of bio-flour-filled polypropylene composites”,
Composite Part A: Applied Science and Manufacturing, Vol.38(6), pp.
1473-1482, 2007.
[79] Huda S and Yang Y, “A novel approach of manufacturing light-weight
composites with polypropylene web and mechanically split corn husk”,
Ind. Crops Prod., Vol.30 (1), pp.17–23, 2009.
[80] Habibi Y, Zawawy W. K, Ibrahim M. M and Dufresne A, “Processing
and characterization of reinforced polyethylene composites made with
lignocellulosics fibers from egyptian agro-industrial residues”,
Composites Science and Technology, Vol.68 (7-8), pp.1877-1885
2008.
[81] José Humberto Santos Almeida Júnior, Sandro Campos Amico,
Edson Cocchieri Botelho and Franco Dani Rico Amado, “Hybridization
effect on the mechanical properties of curaua/glass fiber”, Composites
Part B: Engineering, Vol. 55, pp. 492-497, 2013.
[82] Bledzki A. K, Mamuna A. A and Volk J, “Physical, chemical and
surface properties of wheat husk, rye husk and soft wood and their
polypropylene composites”, Composites Part A, Vol. 41, pp. 480-488,
2010.
[83] Murtuza Ali Syed, Siddaramaiah, Sania Akhtar, and Akheel Ahmed
Syed, “Development of green composites from agro waste material for
reducing carbon foot prints of plastic”, International Conference on
Advances on Polymer Technology, Feb 26-27,pp. 60, 2010.
160
[84] Guduri B.B.R, Khoathane C, Anandjiwala R D, “Effect of water
absorptionon mechanical properties of flax fibre reinforced
composites”, Sixth International Conference on Composite Science
and Technology, Durban, South Africa, 22-24, pp.1-10, 2007.
[85] Megiatto J.D, Silva C. G, Rosa D. S, and Frollini E, “Sisal chemically
modified with lignins: correlation between fibers and phenolic
Composites Properties”, Polymer Degradation and Stability,Vol.93,
pp.1109 – 1121, 2008.
[86] Pothan L. A, Thomas S and Groeninckx G, “The role of fibre/matrix
interactions on the dynamic mechanical properties of chemically
modified banana fibre/polyester composites”, Composites part A:
Applied Science and Manufacturing, Vol.37, pp.1260 -1269, 2006.
[87] Sgriccia N, Hawley M. C and Misra M, “Characterization of natural
fiber surfaces and natural fiber composites”, Composites Part A:
Applied Science and Manufacturing, Vol.39, No.10, pp.1632-1637,
2008.
[88] Singh V.K, Gope P.C, Chauhan Sakshi and Bisht Deepak Singh,
“Mechanical behaviour of banana fiber based hybrid biocomposite”,
J.Mater.Environ.Sci., Vol.3(1), pp.185-194, 2012.
[89] Sinha E. Rout S. K, “Influence of fibre-surface treatment on structural,
thermal and mechanical properties of jute fibre and its composite”
Bull. Mater. Sci., Vol. 32, pp. 65–76, 2009.
[90] Nishino T, “Natural polymer sources, green composites: polymer
composites and the environment”, Cambridge England, Wood Head
Publishing, 2000.
161
[91] Stark N, “Influence of moisture absorption on mechanical properties of
wood flour-polypropylene composites”, Journal of Thermoplastic
Composite Materials, Vol. 14, pp. 421-432, 2001.
[92] Dhakal H. N, Zhang Z. Y, Richardson M. O. W, “Effect of water
absorption on the mechanical properties of hemp fibre reinforced
unsaturated polyester composites”, Composites Science and
Technology, Vol.67, pp.1674-1683, 2007.
[93] Mubashirunnisa A, Vijayalakshmi K, Gomathi T and Sudha P.N,
“Development of banana/glass short hybrid fiber reinforced
nanochitosan polymer composities”, Scholars Research Library Der
Pharmacia Lettre, Vol.4 (4), pp.1162-1168, 2012.
[94] Husseinsyah S, and Moshtapha M, “The effect of filler content on
properties of coconut shell filled polyester composites”, Malaysian
polymer journal, Vol.6, No.1, pp. 87-97, 2011.
[95] Satish Pujari, Rama Krishna A and Suresh Kumar M, “Comparison of
jute and banana fiber composites: A review”, International Journal of
Current Engineering and Technology, E-ISSN 2277,2014.
[96] Gauthier R, Joly C, Coupas A.C, Gauthier H and Escoubes M,
“Interfaces in polyolefin/cellulosic fiber composites: chemical coupling,
morphology, correlation with adhesion and aging in moisture” , Polym
Compos, Vol.19, pp. 287-300,1998.
[97] Kohji Tashiro, Masamichi Kobayashi and Hiroyuki Tadokoro,
“Vibrational spectra and theoretical three-dimensional elastic
constants of isotactic polypropylene crystal: An important role of
anharmonic vibrations”, Polymer Journal, Vol.24,pp. 899-916; 1992.
162
[98] Tajvidi M, Falk R. H, “Effect of natural fibers on thermal and
mechanical properties of natural fiber polypropylene composites
studied by dynamic mechanical analysis”, Journal of Applied Polymer
Science,Vol. 101, Issue 6, pp. 4341–4349, 2006.
[99] Rout J, Misra M, Tripathy S. S, Nayak S. K and Mohanty A. K, “The
influence of fibre treatent on the performance of coir-polyester
composites”, Composites Science and Technology, Vol.61, pp.1303 –
1310, 2001.
[100] Satish Pujari, Rama krishna A and Suresh Kumar M, “Comparison of
jute and banana fiber composites: A review”, International Journal of
Current Engineering and Technology, E-ISSN 2277, 2014.
[101] Badri K. H, Othman Z. B and Razali I. M, “Mechanical properties of
polyurethane composites from oil palm resources”,Iranian Polymer
Journal, Vol.14, pp.441-448, 2005.
[102] Stark N, “Influence of moisture absorption on mechanical properties of
wood flour polypropylene composites”, Journal of thermoplastic
composite materials, Vol. 14, pp. 421-432, 2001.
[103] Mohanty S, Verma S.K, Nayak S. K and Tripathy S.S, “Effect of
surface treatment on the interface of HDPE/Jute fibre composites”
International Journal of Plastics Technology, Vol.7, pp.75-87, 2003.
[104] Mwaikambo L. Y and Ansell M. P, “The effect of chemical treatment
ontheproperties of hemp, sisal, jute and kapok for composite
reinforcement”, Die Angewandte Makromolekulare Chemie, Vol.272,
No.1, pp.108-116, 1999.
[105] Maleque M.A and Belal F.Y, “Mechanical properties study of pseudo-
stem fiber reinforced epoxy composite”, The Arabian Journal for
Science and Engineering, Vol.32, 2007.
163
[106] Dihia Djefel, Said Makhlouf, Souad Khedache, Nacer Lamrous, Gilles
Lefebvre and Laurent Royan, “Experimental study of the thermal
properties of composite stearic acid / coffee grounds / graphite for
thermal energy storage”, ACMA 2014.
[107] Santhos kumar A.U, Devarajan S, Palanivelu K and Romauld. Ivo, “A
new additive formulation to improve biodegradation of low density
polyethylene”,International Journal of Chem Tech Research, Vol.6,
No.9, pp 4194-4200, 2014.
[108] Yosita Rudekit, Thanawadec Leejakpai, Nukul Euaphantasate and
Kongkiatkonysuwan, “Comparative biodegradation of plastics by
aerobic microorganism by ASTM D5338 and ASTM D59 as standard
method”, National metal and material technology center,
phathumthani.
[109] Kilwon Cho, Fengkui Li and Jaeseung Choi, “Crystallization and
melting behavior of polypropylene and maleated polypropylene
blends”,Polymer 40, 1719–1729, 1999.
[110] Cheng-Fang Ou, “The crystallization characteristics of polypropylene
and low ethylene content polypropylene copolymer with copolyesters”,
European Polymer Journal, Vol.38, pp.467–473, 2002.
[111] Petinakis E, Liu, Xingxun, Yu, Long, Way, Cameron, Sangwan,
Parveen, Dean, Katherine, Bateman, Stuart, Edward and Graham,
“Biodegradation and thermal decomposition of poly(lactic acid)-based
materials reinforced by hydrophilic fillers”, Polymer Degradation and
Stability. Vol.95(9), pp.1704-1707, 2010.
[112] Wahit M. U,Akos, Noel Ibrahim, Laftah and Waham Ashaier,
“Influence of natural fibers on the mechanical properties and
biodegradation of poly(lactic acid) and poly( -caprolactone)
164
composites: A review”, Polymer Composites, Vol. 33(7),pp.1045-
1053, 2012.
[113] Fukushima K, Tabuani, Daniela, Abbate, Cristina, Arena,
Maria.,Ferreri and Loredana, “Effect of sepiolite on the biodegradation
of poly(lactic acid) and polycaprolactone”, Polymer Degradation and
Stability, Vol.95(10),pp. 2049-2056, 2010.
[114] Gan Z, Yu D, Zhong Z, Liang Q and Jing X, “Enzymatic degradation of
poly( -caprolactone)/poly(DL-lactide) blends in phosphate buffer
solution”,Polymer.Vol.40(10), pp. 2859-2862,1999.
[115] Tsutomu Okita L. S.H., “Thermal degradation and biodegradability of
poly(lactic acid)/corn starch biocomposites”, Journal of Applied
Polymer Science, Vol. 100, pp.3009-3017, 2006.
165
LIST OFPUBLICATION
1. N. Jaya Chitra, R.Vasanthakumari “Studies on Polypropylene Bio Composite with sea weeds”, Research Journal of Pharmaceutical,
Biological and Chemical Sciences, RJPBCS, volume 3, Issue 3, page
No. 1165(ISSN: 0975-8585).July-September-2012.
2. N. Jaya Chitra, R.Vasanthakumari “Studies on Polypropylene Bio Composite with Corn Husk waste”, International Journal of
Scientific & Engineering Research, IJSER, volume 3, Issue 7 (ISSN
2229-5518),July-2012.
3. N.JayaChitra, R.Vasanthakumari, Syed Amanulla, “Preliminary studies on the effect of coupling agent on the properties if spent coffee grounds polypropylene composite”, International journal of
Engineering Research and Technology, IJERT Volume 7, pp. 9-16
(ISSN: 2278-0181,ISO 3297:2007 ISSN 0974-3154), Feb-March-
2014.
166
PAPERS PRESENTED IN NATIONAL AND INTERNATIONAL CONFERENCES
1. N.JayaChitra, R.Vasanthakumari, “Quality Monitoring of Polymer
Systems by using near- infra Red Spectroscopy” International conference organized by Department of Management Studies in
commemoration of 111th Birth anniversary of Dr.W Edwards Deming
of Dr.M.G.R Educational and Research Institute University,
Maduravoyal, Chennai-95.(Oct 2011).
2. N.JayaChitra, R.Vasanthakumari, “Agro Waste based plastic
Composites-Current Status and Challenges”, in the National Conference on Recent Advances in Applied Sciences (NCRS 2012)
of Dr.M.G.R Educational and Research Institute
University,Maduravoyal,Chennai-95.(Feb 2012).
3. N.JayaChitra, R.Vasanthakumari, “Studies on Polypropylene Bio-
composite with Corn Husk and Sea weeds” in the International Conference on Advancements in Polymeric materials APM-12 at
Central Institute of Plastic Engineering and technology (CIPET)
Ahmedabad, India( Feb 2012).
4. N.JayaChitra, R.Vasanthakumari, “Studies on Polypropylene Coffee
Composites” in thethird International Conference on Natural
Polymers, Bio-Polymers, Bio-Materials, their composites, Blends,
IPNs, Polyelectrolytes and Gels: Macro to Nano Scales (ICNP 12)
Organized by Centre for Nanoscience and Nanotechnology, Mahatma
Gandhi University, Kottayam, Kerala(Oct 2012).
5. N.JayaChitra, R.Vasanthakumari, “Mechanical Properties of Corn
Composite” National conference on Emerging trends in design,
thermal and manufacturing-ETDTM’13 organized by Saveetha
Engineering college, Thandalum, Chennai.(18th April 2013).
167
6. N.JayaChitra, R.Vasanthakumari, Poster presentationon ‘SEM
analysis of Coffee Residue filled Polypropylene Bio-Composites’ in
National Seminar on Biopolymers and Green Composites-Emerging
Science and Technology(BPGC 13) by Centre for Biopolymer Science
and Technology(CBPST)-Kochi, Kerala.(27th September 2013).
7. N.JayaChitra, R.Vasanthakumari, ‘Mechanical and thermal
properties of banana fruit stem fiber Polypropylene Bio-composite’ in
the International Conference on Advancements in Polymeric
materials APM-14 at Central Institute of Plastic Engineering and
Technology(CIPET), Bhubaneswar, India Feb 2014.
168
LIST OF CONFERENCE/WORK SHOPS/SEMINARS PARTICIPATED
1. Attended Work shop on ‘Research Methodology and Biostatistics’
by Department of Biotechnology & academic Staff College of
Dr.M.G.R Educational and Research Institute University,
Maduravoyal, Chennai-95(Oct 2011).
2. Participated in the Seminar on ‘Advanced Materials and Composites for Marine Applications’ AMCM 12 conducted by
centre of Nano Science and Technology, Departmentof polymer
technology, B.S.Abdur Rahman University, Vandalur, Chennai-48
(July 2012).
3. Attended one day Workshop on ‘Managing Computers &Microsoft office’ at IBM Centre of Excellence, by Department of CSE-IT in
association with Academic Staff College , Maduravoyal, Chennai-95
(July 2012).
4. Attended the National Conference on ‘Innovations in Process
Engineering for Sustainable Development’ at Sri Venkateswara
College of Engineering, Sriperumbudur-105 (Sep 2012).
5. Participated in a Workshop on ‘Recent Trends in Qualitative Research Methods’ Organized by LISSTAR at Loyola College,
Chennai-34 (Feb 2013).
6. Participated in the one day National level seminar on ‘Modern Techniques for the Characterization of Polymeric Materials’
organized by the chemistry Division, School of Advanced
Sciences,VIT-Chennai-127(March 2013).
169
7. Participated in one day National seminar on ‘Literary Seminary on Journal Writing and Writing on Child Rights’ by UNICEF and by
Department of English, Dr.M.G.R Educational and Research Institute
University, Chennai-(31st July 2013).
8. Attended one day Workshop on ‘Innovative Thinking’ by Department
of Biotechnology in association with Academic Staff College,
Dr.M.G.R Educational and Research Institute University Maduravoyal,
Chennai-95(25th July 2013).
170
TECHNICAL BIOGRAPHY
Mrs. N.Jaya Chitra (RRN: 0982202) was born on 18th June, 1976 in
Krishnagiri, Tamil Nadu, India. She had completed B.Sc., Chemistry in
Government Arts College, Krishnagiri in 1996 from Madras University. She
had completed her post graduation of M.Sc., (Applied Chemistry) and
M.Tech., (Polymer Science and Engineering ) subsequently in the year1998
and 2000 in Anna University, Chennai. Further she completed her M.Phil
(Chemistry) in the year 2010 from Global University, Nagaland.
She had got fifteen years of teaching experience in the area of
Chemistry, Polymer Science, Chemical Engineering and Environmental
Engineering. She started her career as Lecturer in the Department of
Chemistry in the year 2001 from Raja Lakshmi Engineering College,
Thandalam, Chennai. She had joined as Senior Lecturer in the Chemistry
Department of Dr.M.G.R Educational Research Institute, Chennai in the year
2003. She was transferred to Department of Chemical Engineering as
Assistant professor by June 2010 and was promoted as Head of Chemical
Department by Jan 2014. She is currently pursuing her Ph.D degree in the
area of Composites in the Department of Polymer Technology of B.S.Abdur
Rahman University, Chennai. Her academic interest includes Polymer
Composites, Nano Composites, Biopolymer, Green Composites, Polymer
Processing and Biodegradation. She had published three research articles
in reputed International Journals. Her research papers had also been
presented in National and International conferences.


![[Amar Chitra Katha Pvt] Amar Chitra Katha 266 Man(BookFi.org)](https://img.pdfslide.net/doc/110x75/563dbb98550346aa9aae8a9e/amar-chitra-katha-pvt-amar-chitra-katha-266-manbookfiorg.jpg)