Embed Size (px)
Citation preview

STUDIES ON PHARMACOKINETICS,
BIOAVAILABILITY AND SAFETY OF KETOPROFEN
IN COW CALVES
BY
RATN DEEP SINGH B.V.Sc. & A.H.
DEPARTMENT OF VET. PHARMACOLOGY & TOXICOLOGY
COLLEGE OF VETERINARY SCIENCE & ANIMAL HUSBANDRY
ANAND AGRICULTURAL UNIVERSITY
ANAND
2008


STUDIES ON PHARMACOKINETICS,
BIOAVAILABILITY AND SAFETY OF KETOPROFEN
IN COW CALVES
A THESIS
SUBMITTED TO THE
ANAND AGRICULTURAL UNIVERSITY
IN THE PARTIAL FULFILMENT OF THE REQUIREMENTS
FOR THE AWARD OF THE DEGREE
OF
Master of Veterinary Science
IN
VETERINARY PHARMACOLOGY & TOXICOLOGY
BY
RATN DEEP SINGH B.V.Sc. & A.H.
(Reg. No. : 04-0463-2006)
DEPARTMENT OF VET. PHARMACOLOGY & TOXICOLOGY
COLLEGE OF VETERINARY SCIENCE & ANIMAL HUSBANDRY
ANAND AGRICULTURAL UNIVERSITY
ANAND
2008

dedicated to
my dear parents
Smt. Keshwari Devi
and
Shri Ganga Prasad Singh

Dr. S.K. BHAVSAR
M.V.Sc., Ph.D. Assistant Research Scientist,
Department of Pharmacology & Toxicology, College of Veterinary Science and Animal Husbandry,
Anand Agricultural University,
Anand- 388 001
CERTIFICATE
This is to certify that the thesis entitled “STUDIES ON
PHARMACOKINETICS, BIOAVAILABILITY AND SAFETY OF
KETOPROFEN IN COW CALVES” submitted by RATN DEEP SINGH (Reg.
No. 04-0463-2006) in partial fulfillment of the requirements for the award of the
degree of MASTER OF VETERINARY SCIENCE in the subject of
VETERINARY PHARMACOLOGY & TOXICOLOGY of the Anand
Agricultural University is record of bonafide research work carried out by him under
my guidance and supervision and the thesis has not previously formed the basis for
the award of any degree, diploma or other similar title.
Place: Anand (S. K. BHAVSAR)
Date: 09 / 05/ 2008 Major Advisor

CERTIFICATE
This is to certify that I have no objection for supplying to any scientist
only one copy of any part of this thesis at a time through reprographic process, if
necessary for rendering reference service in a library or documentation center.
Place: Anand
Date: 09/ 05/ 2008 (RATN DEEP SINGH)
(Dr. S. K. BHAVSAR)
Major Advisor

Abstract

ABSTRACT
“STUDIES ON PHARMACOKINETICS, BIOAVAILABILITY
AND SAFETY OF KETOPROFEN IN COW CALVES”
Name of Student Name of Major Advisor
Ratn Deep Singh Dr. S.K. Bhavsar
Department of Pharmacology & Toxicology
College of Veterinary Science and Animal Husbandry
Anand Agricultural University
Anand 388 001
Gujarat state, INDIA
Ketoprofen is a non steroidal anti- inflammatory drug (NSAID) used for its
anti- inflammatory, analgesic and antipyretic properties in Veterinary medicine. The
pharmacokinetics of ketoprofen after its single dose intravenous and intramuscular
administration was investigated in six crossbred cow calves by non compartmental
approach. The drug was administered at the dose rate of 3.0 mg.kg-1 body weight and
assayed in plasma by HPLC analysis. The present study also evaluated safety of
ketoprofen (3.0 mg.kg-1
) after repeated administration at 24 h interval for 5 days in calves.
Following intravenous and intramuscular administration of ketoprofen, values
of elimination half- life (t1/2), volume of distribution of drug at steady state [Vd(ss)],
total body clearance (ClB), area under plasma drug concentration-time curve (AUC),
and mean residence time (MRT) were 1.55 ± 0.05 and 3.40 ± 0.05 h; 0.64 ± 0.03 and
0.72 ± 0.02 L.kg-1; 4.82 ± 0.16 and 2.83 ± 0.06 ml.min-1.kg-1; 10.42 ± 0.32 and 17.72
± 0.39 µg.h.ml-1; and 1.20 ± 0.06 and 4.22 ± 0.07 h, respectively. Following
intramuscular administration peak plasma concentration (Cmax) of 6.15 0.24 g.ml-
1 was achieved at 0.50 h (Tmax). The systemic bioavailability of ketoprofen following

intramuscular administration in the calves was 77.31 per cent. Longer elimination
half- life, extensive volume of distribution at steady state and slower total body
clearance of ketoprofen following intramuscular administration as compared to
intravenous administration makes it more suitable for intramuscular use in calves.
Repeated intravenous administration of ketoprofen (3.0 mg.kg-1
body weight
repeated at 24 h interval for 5 days) in calves was found safe based on evaluation of
haematological (Hb, PCV, TLC and DLC) and blood biochemical (AKP, ACP, AST,
ALT, LDH, Total Bilirubin, Serum Creatinine, BUN, Total Serum Protein, Serum
Albumin and Blood glucose) parameters.
The present study indicate that intramuscular administration of ketoprofen at
dose rate of 3.0 mg.kg-1 in cow calves would be provide a satisfactory plasma
concentration of drug equal to its median effective concentration up to 18 h.
Therefore, ketoprofen given via intramuscular route at the dose rate of 3.0 mg.kg-1 of
body weight repeated every 18 h would be satisfactory therapeutic dosage regimen for
cow calves. However, therapeutic efficacy of the dosage remains to be evaluated in
clinical cases under field conditions.

Acknowledgement

ACKNOWLEDGEMENT
On the completion of the present study, I would like to take this opportunity to extend my deepest sense of gratitude and words of thanks
towards those, who helped me during the entire pursuit of study. Words are inadequate in the available lexicon to express my gratitude
and sincere thanks to my major advisor Dr. S. K. Bhavsar, Assistant
Research Scientist, Department of Pharmacology & Toxicology, College of Veterinary Science and Animal Husbandry, Anand Agricultural University, Anand for his scholarly guidance, prudent planning, excellent cooperation with constructive criticism, and diligent efforts throughout the pursuit of this study and preparation of this manuscript. It was indeed a valuable
opportunity to pursue my M.V.Sc. study under such a brilliant and caring man. I also thank him for introducing me to the very interesting and fascinating field of pharmacokinetics.
I express my sincere gratitude to my minor advisor Dr. B. P. Joshi, Professor, Department of Veterinary Pathology, Veterinary College, Anand for providing me spirited guidance, and critical advice as the occasions required.
I wish to express my heart-felt gratitude and thanks to Dr. A. M.
Thaker, Professor and Head, Department of Pharmacology & Toxicology, Veterinary College, Anand and Director of Student’s Welfare, Anand Agricultural University, Anand, for providing me constant guidance and valuable suggestions and for his kind supportive attitude during my entire M.V.Sc. study.
I am genuinely beholden by Dr. J. G. Sarvaiya, Ex-Director,
Information Technology Center (ITC) and Associate Research Scientist, Department of Pharmacology & Toxicology and ITC staff for providing me
superb IT & Computer amenities whenever needed during the entire study period. I extend my sincere thanks to Shri R.S. Parmar (Director, ITC) for his kind help to carry out statistical analysis of the raw data.
I am modestly thankful to Dr. R. M. Tripathi, Ex-Professor and Head,
Department of Pharmacology & Toxicology, College of Veterinary Science and Animal Husbandry, S. D. Agricultural University, S.K. Nagar for building my subject base and generating my interest in pharmacology.
I am extremely thankful to the Principal and Dean Dr. J. V. Solanki,
College of Veterinary Science and Animal Husbandry, Anand, for providing Research facilities and an opportunity to pursue my higher studies from such an esteemed institute of Gujarat state.
I am thankful to Dr. K. N. Wadhvani, Associate Professor, Instructional Farm, Anand Agricultural University, Anand for providing animals, infrastructural facility and necessary help for the research purpose.
I want to extend my fervent thanks to Dr. D. S. Nauriyal, Associate
Professor, Department of Vet. Medicine and Dr. D. M. Patel, Head, Teaching Vet. Clinics Service Complex, Veterinary College, Anand for providing facility of Blood Autoanalyzer and Serum Biochemical Autoanalyzer, respectively.

I am highly thankful to our departmental staff, Rajubhai, Parmar kaka and Bhupatbhai and all the college library staff for their kind co-operation throughout the course of study.
I extend my affable thanks to my lovely departmental friends Jatin,
Sanjay, Rasesh, Paresh, Sandip and Amar for their timely and unreserved help, support, wholehearted co-operation and continuous motivations during
the entire course of study. I feel lucky to have friends like them because friends in need are the best friend indeed.
I am especially thankful to Dr. Urvesh D. Patel for his precious
suggestions and constructive discussion that help me in a multitude of
ways. I also wish to express my sincere thanks to all my respectable seniors specially Dr. (s), Deepak Barot, LaxmiNarayan, Haresh, Jayesh, Nilesh, Himanshu, and Vaibhavi for their love, affection and unreserved help during my study and research period. I also thanks to Dr. Amit Verma for helping me out during haematological analysis.
Especial words of thanks are due to Dr. Satish Bhai and my dear
juniors Dr. (s) Anil, Kamlesh, V.C., Anirudh and S.K. Nagar internees for their timely help, love and affections. Thanks are also due to them for never
taking serious of any harsh word, if any I said.
I desperately thank to all my friends and seniors outside the department and my forever U.G. friends from S.K. Nagar for all the good as well as hard times we shared.
A distant thanks is due to my cousin Narendra Kumar Singh,
Department of Pharmaceutics, IT, BHU, Varanasi for making me available some literature resources.
My vocabulary utterly fails in expressing my admiration to my dearest Mother and Father who brought me to this stage. I am indebted to the pain they bear for my knowledge gain. I take this opportunity to dedicate this work to them. I would remain ever grateful to my brothers Amardeep and
Pradeep, sister Pooja and Saroj bhabhi for tolerating the inconvenience I might have created being away from home during this period.
I fall short of words in expressing thanks to Sarita, the wise part of myself and very special to me. She always stays on my side with patience,
dedication and love. Much of what I am, and a large amount of all I have done are on her account.
There are many, many who have helped in various ways but whose
names I have missed out. They know who they are, and I hope they will accept my sincere thanks for all that they did.
Finally, I would like to thank the Almighty Goddess Amba Maa, for it is under her grace that we live, learn and flourish.
Place : Anand (Ratn Deep Singh) Date : 09/05/ 2008

CONTENTS
CHAPTER NO.
TITLE PAGE
NO.
I INTRODUCTION 1
II REVIEW OF LITERATURE 4
III MATERIALS AND METHODS 58
IV RESULTS 73
V DISCUSSION 106
VI SUMMARY AND CONCLUSIONS 119
REFERENCES I - XIII

LIST OF TABLES
Table No. Title Page
No.
1. IC50 cyclooxygenase (COX-1: COX-2) inhibition ratio of NSAIDs in human whole blood assay.
8
2. Important pharmacokinetic parameters of ketoprofen in various species of domestic animals.
30-33
3. Recommended dosage of ketoprofen in animals. 45
4. Experimental schedule to study pharmacokinetics and safety
of ketoprofen in crossbred calves.
59
5. Scheme of preparation of ketoprofen standards in plasma. 63
6. Intraday and Interday precision and accuracy of ketoprofen in calf plasma by HPLC - UV detection.
63
7. Methods used for the determination of haematological and serum biochemical parameters in safety study.
72
8. Plasma concentrations of ketoprofen in calves following intravenous administration of ketoprofen at the dose rate of 3
mg.kg-1 body weight.
76
9. Pharmacokinetic parameters of ketoprofen in calves
following intravenous administration at the dose rate of 3 mg.kg-1 body weight.
79
10. Plasma concentrations of ketoprofen in calves following intramuscular administration of ketoprofen at the dose rate of
3 mg.kg-1 body weight.
81
11. Pharmacokinetic parameters of ketoprofen in calves following intramuscular administration at the dose rate of 3 mg.kg-1 body weight.
84
12. Effect of multiple dose intravenous administration of ketoprofen (3 mg.kg-1 of body weight, repeated for 5 days at
24 h intervals) on hemoglobin.
88
13. Effect of multiple dose intravenous administration of ketoprofen (3 mg.kg-1 of body weight, repeated for 5 days at 24 h intervals) on packed cell volume.
88
14. Effect of multiple dose intravenous administration of
ketoprofen (3 mg.kg-1 of body weight, repeated for 5 days at 24 h intervals) on total leukocyte count.
90
15. Effect of multiple dose intravenous administration of ketoprofen (3 mg.kg-1 of body weight, repeated for 5 days at 24 h intervals) on neutrophil count.
90
16. Effect of multiple dose intravenous administration of
ketoprofen (3 mg.kg-1 of body weight, repeated for 5 days at 24 h intervals) on lymphocyte count.
91
17. Effect of multiple dose intravenous administration of ketoprofen (3 mg.kg-1 of body weight, repeated for 5 days at 24 h intervals) on basophil count.
91

Table No. Title Page
No.
18. Effect of multiple dose intravenous administration of ketoprofen (3 mg.kg-1 of body weight, repeated for 5 days at
24 h intervals) on eosinophil count.
92
19. Effect of multiple dose intravenous administration of
ketoprofen (3 mg.kg-1 of body weight, repeated for 5 days at 24 h intervals) on monocyte count.
92
20. Effect of multiple dose intravenous administration of ketoprofen (3 mg.kg-1 of body weight, repeated for 5 days at
24 h intervals) on serum alkaline phosphatase.
94
21. Effect of multiple dose intravenous administration of
ketoprofen (3 mg.kg-1 of body weight, repeated for 5 days at 24 h intervals) on serum acid phosphatase.
94
22. Effect of multiple dose intravenous administration of ketoprofen (3 mg.kg-1 of body weight, repeated for 5 days at
24 h intervals) on serum aspartate aminotransferase.
96
23. Effect of multiple dose intravenous administration of
ketoprofen (3 mg.kg-1 of body weight, repeated for 5 days at 24 h intervals) on serum alanine aminotransferase.
96
24. Effect of multiple dose intravenous administration of ketoprofen (3 mg.kg-1 of body weight, repeated for 5 days at
24 h intervals) on serum lactate dehydrogenase.
98
25. Effect of multiple dose intravenous administration of
ketoprofen (3 mg.kg-1 of body weight, repeated for 5 days at 24 h intervals) on total serum bilirubin.
98
26. Effect of multiple dose intravenous administration of ketoprofen (3 mg.kg-1 of body weight, repeated for 5 days at
24 h intervals) on serum creatinine.
100
27. Effect of multiple dose intravenous administration of ketoprofen (3 mg.kg-1 of body weight, repeated for 5 days at 24 h intervals) on blood urea nitrogen.
100
28. Effect of multiple dose intravenous administration of ketoprofen (3 mg.kg-1 of body weight, repeated for 5 days at
24 h intervals) on total serum protein.
102
29. Effect of multiple dose intravenous administration of ketoprofen (3 mg.kg-1 of body weight, repeated for 5 days at 24 h intervals) on serum albumin.
102
30. Effect of multiple dose intravenous administration of
ketoprofen (3 mg.kg-1 of body weight, repeated for 5 days at 24 h intervals) on blood glucose.
104

LIST OF FIGURES
Figure
No. Title
Page
No.
1. General Structure of Non steroidal anti- inflammatory drugs. 5
2. (a) General structure of propionic acid NSAIDs. 11
(b) Structure of ketoprofen.
(c) Structure of ketoprofen enantiomers [R(+) and S (-)].
3. Standard curve of ketoprofen in calf plasma. 64
4. Representative chromatograms of drug free plasma (A) and
ketoprofen (KTP) standard (25 µg.ml-1) (B).
74
5. Representative chromatograms of ketoprofen (KTP) plasma samples.
75
6. Semilogarithmic plot of ketoprofen concentration in plasma versus time following single dose intravenous administration at
the dose rate of 3.0 mg.kg-1 of body weight in calf.
76
7. Semilogarithmic plot of ketoprofen concentration in plasma
versus time following single dose intramuscular administration at the dose rate of 3.0 mg.kg-1 of body weight in calf.
82
8. Semilogarithmic plot of ketoprofen concentration in plasma versus time following single dose intravenous and intramuscular
administrations at the dose rate of 3.0 mg.kg-1 of body weight in calf.
85
9. Effect of multiple dose intravenous administration of ketoprofen (3 mg.kg-1 of body weight, repeated for 5 days at 24 h intervals)
on hemoglobin.
89
10. Effect of multiple dose intravenous administration of ketoprofen
(3 mg.kg-1 of body weight, repeated for 5 days at 24 h intervals) on packed cell volume.
89
11. Effect of multiple dose intravenous administration of ketoprofen (3 mg.kg-1 of body weight, repeated for 5 days at 24 h intervals)
on total leukocyte count.
93
12. Effect of multiple dose intravenous administration of ketoprofen
(3 mg.kg-1 of body weight, repeated for 5 days at 24 h intervals) on differential leukocyte count.
93
13. Effect of multiple dose intravenous administration of ketoprofen (3 mg.kg-1 of body weight, repeated for 5 days at 24 h intervals)
on serum alkaline phosphatase.
95
14. Effect of multiple dose intravenous administration of ketoprofen
(3 mg.kg-1 of body weight, repeated for 5 days at 24 h intervals) on serum acid phosphatase.
95
15. Effect of multiple dose intravenous administration of ketoprofen (3 mg.kg-1 of body weight, repeated for 5 days at 24 h intervals)
on serum aspartate aminotransferase (AST/ SGOT).
97
16. Effect of multiple dose intravenous administration of ketoprofen
(3 mg.kg-1 of body weight, repeated for 5 days at 24 h intervals) on serum alanine aminotransferase (ALT/ SGPT).
97

Figure
No. Title
Page
No.
17. Effect of multiple dose intravenous administration of ketoprofen
(3 mg.kg-1 of body weight, repeated for 5 days at 24 h intervals) on serum lactate dehydrogenase (LDH).
99
18. Effect of multiple dose intravenous administration of ketoprofen (3 mg.kg-1 of body weight, repeated for 5 days at 24 h intervals)
on total serum bilirubin.
99
19. Effect of multiple dose intravenous administration of
ketoprofen (3 mg.kg-1
of body weight, repeated for 5 days at 24 h intervals) on serum creatinine.
101
20. Effect of multiple dose intravenous administration of
ketoprofen (3 mg.kg-1
of body weight, repeated for 5 days at 24 h intervals) on blood urea nitrogen (BUN).
101
21. Effect of multiple dose intravenous administration of ketoprofen (3 mg.kg-1 of body weight, repeated for 5 days at 24 h intervals)
on total serum protein.
103
22. Effect of multiple dose intravenous administration of ketoprofen
(3 mg.kg-1 of body weight, repeated for 5 days at 24 h intervals) on serum albumin.
103
23. Effect of multiple dose intravenous administration of ketoprofen (3 mg.kg-1 of body weight, repeated for 5 days at 24 h intervals)
on blood glucose.
105

ABBREVIATIONS
% Per Cent
α Distribution rate constant
Elimination rate constant
µg.h.ml-1 Microgram hour per milliliter
g.h2.ml-1 Microgram square hour per milliliter
μg.L-1 Microgram per Liter
μg.ml-1 Microgram per milliliter
µl Microliter
A‟ Zero-time intercept of absorption phase
A Zero-time intercept of distribution phase
ACP Acid phosphatase
AKP Alkaline phosphatase
ALT Alanine aminotransferase
AST Aspartate aminotransferase
AUC Area under curve
AUMC Area under first moment of curve
B Zero-time intercept of elimination phase
b.i.d. bis in die (twice a day)
BUN Blood urea nitrogen
°C Degree centigrade
CBC Complete Blood Count
ClB Total body clearance
Cmax Maximum drug concentration
cmm Cubic millimeter
COX Cyclooxygenase
Cp Plasma concentration

Cp0 Theoretical concentration of drug in plasma at zero-time
C.V. Co-efficient of variance
DLC Differential leukocyte count
EC50 Median Effective Concentration
e Base of natural logarithm
e.g. exempli gratia (for example)
et al. et alii (and others)
F Bioavailability of drug
g Gram
x g times gravity
g/dl Gram per deciliter
h Hour
h-1 Per hour
Hb Haemoglobin
HPLC High Performance Liquid Chromatography
IC50 Median Inhibitory Concentration
i.e. id est (that is)
I.M. Intramuscular administration
I.V. Intravenous administration
IU/L International unit per litre
K12 Rate constant of transfer of drug from central to tissue
compartment
K21 Rate constant of transfer of drug from tissue to central
compartment
Ka Absorption rate constant
Kel Elimination rate constant from central compartment
KTP Ketoprofen
L.h-1.kg-1 Liter per hour per kilogram

L.kg-1 Liter per kilogram
L.min-1.kg-1 Liter per minute per kilogram
LDH Lactate dehydrogenase
M Molar
MAT Mean absorption time
mg Milligram
mg/dl Milligram per deciliter
mg.h.ml-1 Milligram hour per milliliter
mg.h.L-1 Milligram hour per liter
mg.h2.L-1 Milligram square hour per liter
mg.kg-1 Milligram per kilogram
mg.ml-1 Milligram per milliliter
min. Minute
ml Milliliter
ml.kg-1 Milliliter per kilogram
ml.h-1.kg-1 Milliliter per hour per kilogram
ml.min-1.kg-1 Milliliter per minute per kilogram
mm Millimeter
mM Millimolar
MRT Mean residence time
ng.ml-1 Nanogram per milliliter
NSAIDs Non steroidal anti- inflammatory agents
P Level of significance
PCV Packed Cell Volume
PG Prostaglandins
PGE2 Prostaglandin E2
PGF2α Prostaglandin F2α
pH Negative logarithm of H+ ion concentration

pKa Dissociation constant
PK/PD Pharmacokinetic – Pharmacodynamic relationship
P.O. Per os (oral route)
R(–) Rectus (right) enantiomer
S(+) Sinister (left) enantiomer
S.E. Standard error
SGOT Serum glutamic-oxaloacetic transaminase
SGPT Serum glutamic-pyruvic transaminase
SPSS Statistical Package for the Social Sciences
t Time
t1/2 Distribution half life
t1/2 Elimination half life
t1/2Ka Absorption half life
t.i.d. ter in die (3 times a day)
TLC Total leukocyte count
Tmax Time of maximum observed concentration in plasma
TxB2 Thromboxane B2
USP United States Pharmacopoeia
Vd Volume of distribution
Vd(area) Apparent volume of distribution
Vd(ss) Volume of distribution at steady state
v/v volume by volume
viz. Videlicet (namely)

Introduction

CHAPTER I
INTRODUCTION
Inflammation is the complex biological response of vascular tissues to harmful
stimuli, such as pathogens, damaged cells or irritants. It is a protective mechanism by
the body to remove the injurious stimuli as well as initiate the healing process for the
tissue. However, inflammation which runs unchecked can also lead to host of
diseases, such as atherosclerosis and rheumatoid arthritis. The mediators released
during the inflammatory process perpetuate the inflammatory response and are
responsible for the clinical signs associated with inflammation, including pain and
fever (Vane and Botting, 1987). Administration of anti- inflammatory agents to
alleviate signs of inflammation is a standard therapeutic approach. The main anti-
inflammatory agents are the glucocorticoids and the non-steroidal anti- inflammatory
drugs (NSAIDs).
NSAIDs include a variety of different agents of different chemical classes
having anti- inflammatory, analgesic and antipyretic effects. In general, all of these
effects are related to the primary action of the drugs i.e. inhibition of arachidonate
cyclooxygenase and thus inhibition of the production of prostaglandins and
thromboxanes. There are two main types of cyclooxygenase enzymes, namely COX-1
and COX-2. COX-1 is a constitutive enzyme involved in tissue homeostasis whilst
COX-2 is responsible for the production of the prostanoid mediators of inflammation
(Vane et. al., 1998).
Ketoprofen (KTP) is an aryl propionic acid derivative, non-selective COX
inhibitor NSAID. Ketoprofen is a strong inhibitor of cyclooxygenase; it has powerful
anti- inflammatory, analgesic and antipyretic properties (Boothe, 2001). Ketoprofen

contains an asymmetrical carbon atom and exists in two enantiomeric forms like S(+)
Ketoprofen and R(–) Ketoprofen (Sweetman, 2002). Differences in pharmacokinetics
and pharmacodynamics between the two enantiomers occur in animals and can also
vary significantly among species. In veterinary practice, ketoprofen is used to lower
body temperature in animals with fever, to relieve respiratory signs in calf and piglet
pneumonias, and to relieve pain in conditions as diverse as equine colic and joint
diseases of the horse and dog, as well as for the control of traumatic and postoperative
pain in all species (Lees et. al., 2004).
As per the figures of 2003 livestock census, India has 187.38 million cattle
population which is about 15 per cent of the world cattle population. India ranks first
in cattle population. Out of the 187.38 million cattle, 22.63 million were crossbred,
which is 12.07 per cent of the total cattle population. Between 1997 and 2003,
crossbred population increased by 12.6 per cent. Ban on some NSAIDs like
Diclofenac sodium had been put on, to be used in bovines and other domestic animals,
due to increased extinction of vultures. Under this condition ketoprofen and other
NSAIDs have emerged as a newer therapeutic substitute for treating musculoskeletal
disorders (as anti- inflammatory) and painful conditions (as analgesic) in cow calves
and adult cattle.
Ketoprofen pharmacokinetic have been reported in some domestic species like
Cattle (Landoni and Lees, 1995a; De Graves et al., 1996), Sheep (Landoni et al.,
1999; Arifah et al., 2001), Goat (Musser et al., 1998; Arifah et al., 2003; Pravin et al.,
2005; Pranvendra et al., 2005) and in Horses (Jaussaud et al., 1993; Sams et al., 1995;
Landoni and Lees, 1995b; Landoni and Lees, 1996; De graves et al., 1998). However,
data on pharmacokinetics of ketoprofen in cattle are very sparse, hence the study was
undertaken.

In Veterinary therapeutics, Ketoprofen is given by oral and parenteral routes in
cattle, cats, dogs and horses. However, it is recommended that ketoprofen treatment
should be limited to a maximum of five consecutive days to reduce the risk of
gastrointestinal effects. Ketoprofen can cause gastrointestinal irritation that may lead
to ulceration. Other side effects, including hepatopathies and renal disease, have been
reported in animals (Thompson, 2006). Most of the safety and toxicity studies are
conducted in laboratory animals following oral administration. As the drug is used
parenterally in domestic animals, safety data following its repeated administrations
are needed.
Materializing that there is lack of literature on pharmacokinetics and safety of
ketoprofen in the target species like cattle (calves), the present study was planned with
the following objectives:
1. To optimize and standardize the method for detection of ketoprofen in
plasma of cow calves by High Performance Liquid Chromatography
(HPLC).
2. To study the pharmacokinetics of single dose intravenous administration
of ketoprofen (3 mg.kg-1 body weight) in crossbred cow calves.
3. To study the pharmacokinetics and bioavailability of single dose
intramuscular administration of ketoprofen (3 mg.kg-1 body weight) in
crossbred cow calves.
4. To assess safety of ketoprofen in cow calves following multiple
intravenous doses given at rate of 3 mg.kg-1 of body weight repeated at 24
hour intervals for 5 days.

Review of Literature

CHAPTER II
REVIEW OF LITERATURE
2.1 Introduction to NSAIDs:
Salicylic acid was first synthesized in 1859 and marketed in 1878 and was
the first drug with recognized antipyretic, anti- inflammatory and analgesic activities.
Numerous drugs were discovered after the development of aspirin (acetyl salicylic
acid); these drugs came to be known as “Aspirin like drugs”. The term NSAIDs was
first applied to phenylbutazone after its introduction into clinical practice in 1949
(Hart and Huskisson, 1984). NSAIDs principally act as anti- inflammatory agents and
are used to treat arthritis, other inflammatory diseases, injuries and in the
management of different post-operative conditions (Lombardino and Wiseman,
1982; Hawkey, 1999). NSAIDs produce a mild degree of analgesia, which is much
less than the analgesia produced by opioid analgesics such as morphine. Many of the
NSAIDs cause the excretion of uric acid (uricosuric effect), and thus are useful in the
treatment of gout (Altman et al., 1988).
The importance of pain management and the use of nonsteroidal anti-
inflammatory drugs (NSAID) in animals have recently increased significantly.
NSAID have the potential to relieve pain and inflammation without the
immunosuppressive and metabolic side effects associated with corticosteroids.
NSAIDs, which possess analgesic, anti- inflammatory and antipyretic properties, are a
heterogeneous group of substances without any uniform chemical properties, but
share the same therapeutic and side effects (Steinmeyer, 2000).
The first veterinary use of a synthetic NSAID, the sodium salt of salicylic acid
was reported in 1875. Currently, several NSAIDs designated for human use are being
investigated for possible veterinary application in the expectation that they may be
more effective and without the risks of adverse effects seen with previous NSAIDs.
Phenylbutazone, salicylic acid, meloxicam, ketoprofen and some other NSAIDs are
used as therapeutic measures for pain, inflammation and fever in clinical veterinary
medicine. Modern veterinary uses of NSAIDs are to lower body temperature in
animals with fever, to relieve respiratory signs in calf and piglet pneumonias, and to
relieve pain in conditions as diverse as equine colic and joint diseases of the horse and
dog, as well as the control of traumatic and postoperative pain in all species (Lees et.
al., 2004).
2.2 Structure of NSAID‟s:
In general, NSAIDs structurally consist of an acidic moiety (carboxylic acid,
enols) attached to a planar, aromatic functionality. Some analgesics also contain a
polar linking group, which attaches the planar moiety to an additional lipophilic group
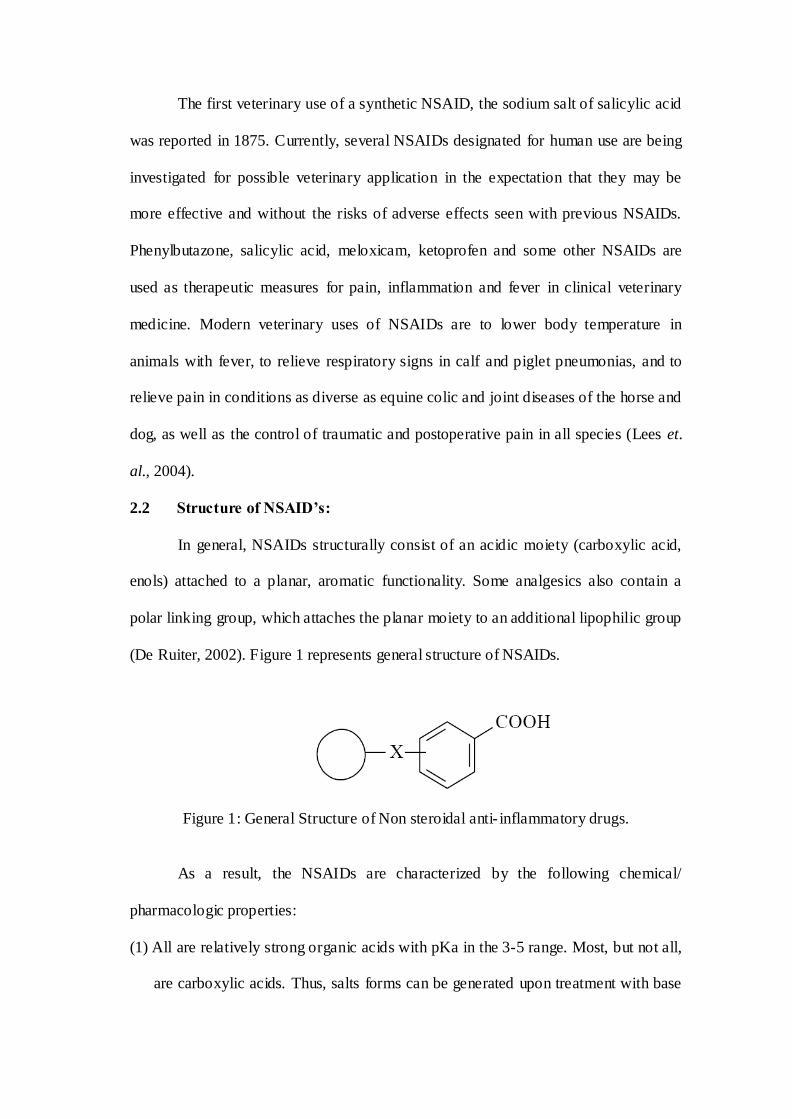
(De Ruiter, 2002). Figure 1 represents general structure of NSAIDs.
Figure 1: General Structure of Non steroidal anti- inflammatory drugs.
As a result, the NSAIDs are characterized by the following chemical/
pharmacologic properties:
(1) All are relatively strong organic acids with pKa in the 3-5 range. Most, but not all,
are carboxylic acids. Thus, salts forms can be generated upon treatment with base

and all of these compounds are extensively ionized at physiological pH. The
acidic group is essential for COX inhibitory activity.
(2) The NSAIDs differ in their lipophilicities based on the lipophilic character of their
aryl groups and additional lipophilic moieties and substituents.
(3) The acidic group in these compounds serves a major binding group (ionic binding)
with plasma proteins. Thus all NSAIDs are highly bound by plasma proteins.
(4) The acidic group also serves as a major site of metabolism by conjugation. Thus a
major pathway of clearance for many NSAIDs is glucuronidation (and
inactivation) followed by renal elimination.
2.3 Classification of NSAID‟s:
Depending on their chemical structures, NSAIDs are broadly divided into two
major classes like non selective COX inhibitors and selective COX-2 inhibitors
(Roberts and Morrow, 2001).
(1) Non-Selective COX Inhibitors:
i. Salicylic acid derivatives: e.g. Aspirin, Sodium salicylate.
ii. Para-amino phenol derivatives : e.g. Acetaminophen
iii. Indol and Indane acetic acids: e.g. Indomethacin, Sulindac
iv. Heteroaryl acetic acids: e.g. Tolmetin, Diclofenac, Keterolac
v. Aryl propionic acids: e.g. Ibuprofen, Naproxen, Flurbiprofen,
Ketoprofen, Fenoprofen, Oxaprofen
vi. Anthranilic acids: e.g. Mefenamic acid, Meclofenamic acid
vii. Enolic acids (Oxicams): e.g. Piroxicam, Meloxicam, Tenoxicam,
Isoxicam
viii. Alkanones: e.g. Nabumetone
(2) Selective COX-2 Inhibitors :
i. Indole acetic acids: e.g. Etodolac
ii. Sulfonanilides: e.g. Nimesulide
iii. Diaryl substituted furanones: e.g. Rofecoxib
iv. Diaryl substituted pyrazoles: e.g. Celecoxib
2.4 Mechanism of action of NSAID‟s:
Unlike corticosteroids, which inhibit numerous pathways, NSAIDs act
primarily to reduce the biosynthesis of prostaglandins (PG) by inhibiting
cyclooxygenase (COX) enzymes (Smith and Willis, 1971; Vane, 1971). A sub-group
of the eicosanoid group of inflammatory mediators is of special interest in relation to
mechanism of action of NSAID. These are formed from cell membrane phospholipid,
which in response to tissue damage releases short chain fatty acids such as the 20
carbon compound arachidonic acid (5, 8, 11, 14 - eicosatetraenoic acid), under the
influence of phospholipase A2. Arachidonic acid can serve as a substrate for four
groups of enzymes, cyclooxygenase (COX), 5- lipoxygenase, 12- lipoxygenase and 15-
lipoxygenase (Lees et al., 2004).
The discovery of the 2 isoforms of COX (COX-1 and COX-2) has advanced
understanding of the mechanism of action (Vane et al., 1998). COX-1, expressed in
virtually all tissues of the body, catalyzes the formation of constitutive PG, which
mediates a variety of normal physiologic effects including hemostasis, gastrointestinal
mucosal protection, and protection of the kidney from hypotensive insult. In contrast,
COX-2 is activated in damaged and inflamed tissues and catalyzes the formation of
inducible PG, including PGE2, associated with intensifying the inflammatory response.
COX-2 is also involved in thermoregulation and the pain response to injury.

Therefore, COX-2 inhibition by NSAIDs is thought to be responsible for the
antipyretic, analgesic, and anti- inflammatory actions of NSAIDs (Thompson, 2006).
NSAIDs appear to inhibit both COX-1 and COX-2. The amount of drug
necessary to inhibit each of the two isoforms provides a basis for assessing the
relative safety and efficacy of each drug. The ratio of COX-1 to COX-2 describes the
amount of drug necessary to inhibit the respective isoforms of the cyclooxygenase
enzyme in an experimental environment. A COX-1/COX-2 ratio of more than 1 is
desirable since a drug, that inhibits COX-2 (inducible) prostaglandins at lower
concentrations than that necessary to inhibit COX-1 (constitutive) prostaglandins, is
probably safer. IC50 inhibition ratio (COX-1: COX-2) of some NSAIDs is given in
Table 1.
Table: 1. IC50 inhibition ratio (COX-1: COX-2) of NSAIDs in human whole blood
assay (Lees et al., 2004).
Drugs COX-1 WBA: COX-2 WBA
IC50 ratio1
COX-1 WBA: COX-2 WBMA
IC50 ratio2
COX-2 WBA: COX-2 WBMA
IC50 ratio3
Diclofenac 1.97 3.75 1.90
Meloxicam 2.71 24.78 9.13
Nimesulide 5.26 25.64 4.87
Salicylate 0.14 10.28 71.73
Ketoprofen 0.02 0.20 12.10
Etodolac 5.45 12.77 2.34
Carprofen 0.02 ---- ----
1Whole blood assay (WBA) for both COX-1 and COX-2
2Whole blood assay for COX-1, William Harvey modified whole blood assay
(WHMA) for COX-2
3Ratio of whole blood: William Harvey modified whole blood assays for COX-2

The hypothesis that COX-1 inhibition is associated with side-effects of
NSAIDs whilst COX-2 inhibition is responsible for the therapeutic effects still holds
true, but it has been modified by the following developments:
i. Evidence from several sources has indicated a role for central actions of
NSAIDs as analgesics and anti- inflammatory agents in addition to their
peripheral actions (Smith et al., 1998; Dolan et al., 2003).
ii. Existence of a third COX isoform, COX-3, was postulated (Willoughby et al.,
2000) and then identified in the CNS of the dog (Chandrasekharan et al.,
2002); inhibition of this isoform which is a spliced COX-1 variant may
account, in part, for the central analgesia produced by NSAIDs; some
compounds such as paracetamol and the pyrazolone derivative dipyrone
(metamizole) being possibly COX-3 preferential.
iii. Selective COX-2 inhibitors, whilst being more gastrotolerant than COX-1
inhibitors, are unlikely to be entirely free of side-effects; concerns have been
expressed that wound healing may be delayed, fracture healing may be
impaired or delayed and COX-2 inhibitors may have potentially damaging
side-effects on the kidney and some aspects of reproductive function, because
COX-2 is also a constitutive enzyme in these tissues. Also, there is
controversy concerning whether COX-2 inhibitors produce a small increase in
adverse cardiovascular events in human subjects (Mengle-Gaw & Schwartz,
2002).
iv. Both COX-1 and COX-2 may contribute to the generation of prostaglandins at
sites of inflammation (Smith et al., 1998; Wallace et al., 1998).
v. There is mounting evidence that COX-2 not only produces proinflammatory
prostaglandins in the initial stages of acute inflammation but also anti-

inflammatory prostaglandins such as 15 deoxy ∆12-14 PGJ2 in the resolution
phase (Gilroy et al., 1999).
vi. A recent investigation in the rat indicated that low doses of selective COX-2
inhibitors induced hypoalgesia in acute inflammation, whereas higher doses
associated with COX-1 inhibition did not induce hypoalgesia but produced
suppression of experimental hyperalgesia (Francischi et al., 2002).
2.5 Ketoprofen:
Ketoprofen (KTP) is an aryl propionic acid derivative non-selective COX
inhibitor NSAID. It was synthesized by Rhone-Poulenc Research Laboratories, Paris
in 1967 and was first approved for clinical use in France and the United Kingdom in
1973 (Vavra, 1987). Ketoprofen is a potent inhibitor of COX and bradykinin and may
also inhibit some lipoxygenases. Its efficacy is comparable to that of opioids in the
management of pain following orthopedic and soft-tissue surgery in dogs. As with
other NSAID, ketoprofen is metabolized in the liver to inactive metabolites that are
eliminated by renal excretion (Thompson, 2006).
2.5.1 Chemistry and Structure:
Ketoprofen is a white or almost white, crystalline, odourless powder with a
sharp bitter taste (Sweetman, 2002). It is prepared by chemical synthesis as a
racemate and contains not less than 99.0% and not more than the equivalent of
100.5% of (2RS)-2-(3-benzoylphenyl) propanoic acid, calculated with reference to the
dried substance (The British Pharmacopoeia, 2002). Structures of propionic acid
NSAIDs in general, ketoprofen and its enantiomers are shown in figure 2 (a, b and c).
Its empirical formula is C16H14O3, with molecular weight of 254.28.
Ketoprofen is a weak monocarboxylic acid and has reported dissociation constant
values, pKa, of 4.60 in water.

Figure 2(a): General structure of propionic acid NSAIDs.
Figure 2(b): Structure of ketoprofen.
Figure 2(c): Structure of ketoprofen enantiomers [R(+) and S (-)].

Adjusting the pH to a higher value can solubilize ketoprofen, as solubility
increases at pH values above its pKa (Sridevi and Diwan, 2002). It has a pKa of 5.94
in methanol:water (3:1) and an n-octanol:water partition coefficient of 0.97 (buffer pH
of 7.4). Ketoprofen is practically insoluble in water, freely soluble in acetone, ethanol
and methylene chloride (The British Pharmacopoeia, 2002). Ketoprofen has been
reported to melt in the range of 93°C to 95°C (Liversidge, 1981) and 94°C to 97°C
(Sweetman, 2002). Ketoprofen is highly lipophilic. Ketoprofen is stable below 25°C.
It must be protected from light and moisture (Liversidge, 1981).
2.5.1.1 Stereochemistry
The presence of at least one asymmetric carbon atom in a chemical entity
results in the existence of stereoisomers. Ketoprofen has one asymmetric carbon, also
referred to as a chiral centre, which gives rise to two enantiomers viz. S(+) ketoprofen
and R(–) ketoprofen (Sweetman, 2002). Currently, commercially available products
contain a racemic (50:50) mixture of the two enantiomers, S(+) ketoprofen and R(–)
ketoprofen. It has been shown that S(+) aryl propionates are many times more potent
than their R(-) enantiomers (Evans, 1992). In vitro studies on the relative anti-
inflammatory activity of individual ketoprofen enantiomers have shown that their
effect on cyclooxygenase is due to the S(+) enantiomer (Caldwell et al., 1988; Evans,
1992). Differences in pharmacokinetics and pharmacodynamics between the two
enantiomers occur in animals and can also vary significantly among species (Aberg et
al., 1995).
Chiral inversion is a characteristic metabolic pathway for various profens and,
in the case of KTP, the R(-) enantiomer readily undergoes biotransformation to the
S(+) enantiomers (Soraci et al., 1996). The R(-) enantiomer of the ketoprofen was
administered orally at 20 mg.kg-1 to a series of 8 animal species. In all species, a

highly significant degree of inversion occurred after 1 h which varied from 27%
(gerbil) to 73% (dog) and persisted or increased in plasma samples obtained 3 h after
drug administration. Percentage of total plasma ketoprofen identified as the S(+)
enantiomer 3 hours after administration of 20 mg of R(–) ketoprofen per kg in
different species was as follow: gerbil (33%), mouse (44%), monkey (45%), guinea
pig (47%), rabbit (51%), rat (74%), hamster (81%), dog (91.9%) (Aberg et al., 1995).
The chiral inversion of R(–) to S(+) ketoprofen after an intravenous dose of
R(-) ketoprofen is reported to be 31.7% in calves, 5.9 to 13.8% in sheep, 15% in goat,
48.8% in horses, 22.4% in cats and 8.9% in man. (Lees et al., 2004). Chiral inversion
of R(-) ketoprofen to S(+) ketoprofen also differs in cattle at different ages and in
different physiological situations (Igarza et al., 2002). Inversion was higher in
newborn calves than in early lactation or cows in gestation (50.5%, 33.3% and 26%,
respectively). For ketoprofen chiral inversion mechanism is almost unidirectional,
from R(-) to S(+) inversion (Evans, 1992; Jamali et al., 1997; Landoni et al.,
1999).The reverse process, conversion of S(+) to R(–) ketoprofen, has only been
demonstrated in mice (Jamali et al., 1997).
The pharmacokinetics of ketoprofen enantiomers also varies in volume of
distribution, elimination rate and plasma protein binding. In some species (rat, dog,
horse, monkey and rabbit), S(+) ketoprofen was the predominant enantiomer in
plasma after administration of the racemic ketoprofen (Abas and Meffin, 1987; Foster
and Jamali, 1988; Jaussaud et al., 1993). In humans and calves, on the other hand,
concentration of the two enantiomers were similar (Geisslinger et al., 1995; Landoni
and Lees, 1995a; Landoni et al., 1995), while R(-) ketoprofen predominated in plasma
of goat and sheep (Landoni et al., 1999; Arifah et al., 2001).

2.5.2 Pharmacological actions:
Ketoprofen is an effective anti- inflammatory and analgesic drug in clinical
practice and is used in the treatment of rheumatoid arthritis and osteoarthritis. It is as
effective in clinical trials as other NSAIDs such as naproxen from both the efficacy
and side effect point of view (Dollery, 1991). Like most NSAIDs, ketoprofen is
advantageous because it lacks addictive potential and does not result in sedation or
respiratory depression. In addition ketoprofen also exerts analgesic and antipyretic
pharmacological properties (Green, 2001).
2.5.2.1 Anti-inflammatory effects
In several animal models (rats, mice, rabbits, guinea pigs and pigeons)
ketoprofen displayed potent activity against acute inflammation (increased vascular
permeability, oedema and erythema), sub acute inflammation (pleurisy, abscess and
granuloma formation) and chronic inflammation (experimental arthritis and synovitis)
(Kantor, 1986). Its anti- inflammatory activity is 20 times more potent than ibuprofen,
80 times more potent than phenylbutazone and 160 times more potent than aspirin
(Dollery, 1991).
Ghezzi et al. (1998) compared the anti- inflammatory effects of R(-) and S(+)
ketoprofen in vitro and in vivo. S(+) ketoprofen efficiently inhibited carrageenan
induced edema formation, but it could also amplify the lipo-polysaccharide induced
production of the inflammatory cytokines, tumor necrosis factor and interleukin-1 , in
close correlation with its ability to inhibit prostaglandin synthesis. Because these
inflammatory cytokines are among the factors involved in carrageenan- induced
inflammation and also are possibly involved in gastric damage, enhanced cytokine
production could partially mask the analgesic effect of S(+) ketoprofen, and it can be
associated with the clinical evidence of its gastric toxicity. On the other hand, R(-)

ketoprofen contributes to the overall activity of the racemate, by playing the main role
in ketoprofen- induced analgesia. Unlike the S(+) isomer, R(-) ketoprofen did not
induce a significant increase of cytokine production even at cyclooxygenase-blocking
concentrations. It is concluded that the R(-) isomer directly contributes to the anti-
inflammatory effects of ketoprofen, being more analgesic, and because it does not
amplify inflammatory cytokine production.
2.5.2.2 Analgesic effects:
The action of NSAIDs, such as ketoprofen, in the relief of pain is believed to
be the interruption of mediators of inflammation, such as bradykinin, and prevention
of their effect on peripheral pain endings.
NSAIDs also reduce the hyperalgesia that
occurs in inflammation (Owens et al., 1995b; Johnston and Fox, 1997; Arrioja, 2002).
Ketoprofen was shown to be a potent, peripherally acting analgesic in two
classical animal models of pain. It was also shown to be equivalent to indomethacin,
slightly more potent than naproxen and 30 times more potent than aspirin in pain
management. Like other NSAIDs, ketoprofen is inactive in assays measuring centrally
mediated analgesia (Kantor, 1986).
Owens et al. (1995b) employed a combination of subjective and objective
methods to compare the effects of ketoprofen and phenylbutazone on chronic hoof
pain and lameness in horses. They found that ketoprofen at 1.65 times more than the
recommended dose significantly reduced chronic pain and lameness when compared
to phenylbutazone.
2.5.2.3 Antipyretic effects:
Antipyretic effect of ketoprofen is believed to be due to inhibition of
prostaglandins synthesis in the hypothalamus (Arrioja, 2002).

Glew et al. (1996) investigated the antipyretic effectiveness of ketoprofen in
pyretic cats with a variety of bacterial and viral infections. Cats were randomly
assigned to receive a broad-spectrum antibiotic or a broad-spectrum antibiotic plus
ketoprofen. Body temperature was monitored 3 times daily, and attitude and appetite
were evaluated once daily. Mean temperatures were significantly different during the
4 and 8 h post-treatment observations, with a reduction to normal temperatures in the
ketoprofen group compared with no change in the group treated with antibiotics
alone. The antipyretic effect of ketoprofen was rapid and persisted for at least 8 h, but
for less than 24 h. The overall recovery period from pyrexia, depression, and
inappetance was also shorter in cats treated with antibiotics and ketoprofen (3 days)
than in cats treated only with antibiotics (5 days). Ketoprofen was a useful adjunct in
the treatment of pyretic cats.
2.5.3 Mechanism of action
Ketoprofen is one of the most powerful inhibitors of cyclooxygenase at
concentrations well within the range of therapeutic plasma concentrations (EC50: 2
μg.L-1) (Kantor, 1986). The primary mechanism of action for ketoprofen is considered
to be inhibition of the cyclooxygenase pathway of arachidonic acid metabolism,
leading to decreased production of prostaglandins (Lees et al., 1990; Johnston and
Fox, 1997). It produces reversible COX inhibition by competing with the substrate,
arachidonic acid, for the active site of the enzyme (Vane and Botting, 1998).
Normally, cell membrane damage triggers arachidonic acid metabolism and
production of short- lived endoperoxidases by action of cyclooxygenase (Johnston and
Fox, 1997). The endoperoxidases are converted by other enzymes to thromboxane,
prostaglandin E2, prostaglandin F
2α, prostacyclin and oxygen radicals (Kalpravidh et

al., 1984).
Inhibition of cyclooxygenase prevents the formation of these
prostaglandins and the inflammation they cause.
This inhibition results in a reduction in the tissue production of prostaglandins
such as PGE2 and PGF2α. In addition to its effects on cyclooxygenase, ketoprofen
inhibits the lipoxygenase pathway of the arachidonic acid cascade. This pathway
produces non-cyclized monohydroxyl acids and leukotrienes. Of these, only
leukotrienes (B4, C4, and D4) are thought to increase vascular permeability, however,
both monohydroxyl acids and leukotrienes synthesised within leukocytes are active in
promoting leukocyte migration and activation. It has been suggested that
lipoxygenase inhibitors may attenuate cell-mediated inflammation and thus retard the
progression of tissue destruction in inflamed joints.
Ketoprofen is a powerful inhibitor of bradykinin, an important chemical
mediator of pain and inflammation. It also stabilizes lysosomal membranes against
osmotic damage and prevents the release of lysosomal enzymes that mediate tissue
destruction in inflammatory reactions (Kantor, 1986; Dollery, 1991).
2.5.3.1 Pharmacodynamic of ketoprofen in calves.
Ketoprofen (KTP) pharmacodynamics was evaluated by determining the
effects on serum thromboxane (TxB2), exudate prostaglandin (PGE2), leukotriene
(LTB4), β- glucuronidase and bradykinin induced oedematous swelling (Landoni et
al., 1995). Effect-concentration inter-relationships were analyzed by PK/PD
modeling. KTP did not affect exudate LTB4, but inhibition of the other variables was
statistically significant. The mean EC50 values for inhibition of serum TxB2, exudate
PGE2, β- glucuronidase, and bradykinin induced swelling were 0.118, 0.086, 0.06 and
0.00029 μg.ml-1, respectively. The data indicate that KTP exerted an inhibitory action
not only on eicosanoids (TxB2 and PGE2) synthesis but also on exudate β-

glucuronidase and bradykinin induced oedema. The EC50 values for these actions
indicate that they are likely to contribute to the overall anti- inflammatory effects of
KTP in calves. COX-1 is a constitutive enzyme, involved in the synthesis of
eicosanoids related to „house keeping functions‟ while COX-2 is an inducible
isoenzyme, involved in the production of eicosanoids related to the inflammatory
response. Therefore, reduction in serum TxB2 is a measure of inhibition of COX-1,
whilst decreased exudate PGE2 synthesis indicates inhibition of COX-2. The IC50
ratio (serum TxB2 : exudates PGE2) was 1.37. The greater the concentration required
to inhibit TxB2 might indicate a lesser likelihood of toxic reactions after ketoprofen
administration in cattle compared to NSAIDs with lower ratios.
2.6 General Pharmacokinetics
Pharmacokinetics is concerned with the study and characterization of the time
course of drug absorption, distribution, metabolism and excretion. It studies the
relationship of these processes with regards to the intensity and duration of
characteristic effects of drugs (Baggot, 1995). It is mainly concerned with the passage
of drug to its site of action and maintenance of adequate concentration to exer t its
therapeutic, diagnostic or toxicological effect. The pharmacokinetic study of drugs
provides an important tool to achieve the effective dosage regimens.
2.6.1 Drug absorption and Bioavailability
A drug can be given either orally or by a parenteral route. A variable degree of
drug absorption takes place from these sites of administration. The extent of
absorption depends largely on the formulation of the administered preparation and on
the drug itself. A low degree of ionization and high lipid solubility of the non- ionized
moiety are properties favouring absorption (Baggot, 1995). Bioavailability is defined
as the rate and extent to which a drug, administered as particular dosage form, enters
the systemic circulation intact. Bioavailability of drug can be adequately characterized
by determining three parameters from the plasma drug concentration-time profile viz.
peak plasma concentration (Cmax), time taken to reach peak concertration (Tmax) and
area under the curve (AUC).
2.6.2 Rate of drug movement
Pharmacokinetics is described as mathematical description of changes in drug
concentration in the body. These changes can obey first order or zero order rates. In
first order process, the actual rate of the process varies in direct proportion to the mass
of the compound. In zero order processes, the rate of drug movement is fixed and thus
independent of the amount of compound available (Riviere, 1999). First order kinetics
is typical in most of the drug studies. At low drug concentration, the drug follows first
order kinetics. When the elimination processes become gradually more saturated, the
drug follows mixed order kinetics, eventually discharging into zero order kinetics, at
high drug concentrations (Shargell and Yu, 1993).
2.6.3 Disposition curve and compartment models
Following an I.V. injection of a single dose of the drug, the decline in plasma
concentration of the drug is expressed graphically by the disposition curve. This
curve, plotted on semilogarithmic graph paper, is either monophasic or biphasic.
The study of pharmacokinetics is based on creation of mathematical models to
describe the concentration changes of drugs with time in animal body. A common
approach to study pharmacokinetics of a drug is to depict the animal body as a system
of distribution compartments (Riegelman et al., 1968a). These compartments are
mathematical entities that have no physiological meaning but are useful in describing
disposition kinetics of a drug. The purpose of pharmacokinetics is to study the time

course of drugs and metabolite concentration in various body fluids, tissues and
excreta and to interpret such data based on suitable models (Wagner, 1968).
The body eliminates all drugs at widely varying rates, and is therefore
designated as an open system. The drug is said to follow one compartment open
model when the distribution is instantaneous between blood and tissues. Any change
in blood drug level reflects directly the quantitative changes in its tissue
concentration. Baggot (1977) reported that the rate of drug elimination from the body
is proportional to the concentration in blood. If the plotted data of log blood
concentrations of the drug versus time after a rapid intravenous injection shows a
straight line, it indicates the application of one compartment open model (Sams,
1978). In this model, the plasma drug level declines monoexponentially according to
equation 1:
Cp = Be -t -------- Equation 1
Where B is the zero time intercept of the terminal elimination phase line and
is overall elimination rate constant, t is the time elapsed after drug administration and
„e‟ represents the base of natural logarithm. One compartment model with no
absorption phase has been employed for describing the pharmacokinetics o f
ketoprofen in Japanese quail after I.M. and P.O. administration (Graham et al., 2005).
The rate of change of the amount of drug in the body is a function of both the
absorption rate and the elimination rate. When the absorption rate is greater than the
elimination rate, the amount of drug in the body and the drug concentration in the
plasma increases with time. On the contrary, when the amount of drug remaining at
the absorption site is sufficiently small so that the elimination rate exceeds the
absorption rate, the amount of drug in the body and the drug concentration in the
plasma decrease with time. The peak concentration after drug administration occurs at

the moment when the absorption rate equals the elimination rate. The faster a drug is
absorbed, the higher is the peak concentration in plasma after a given dose and the
shorter is the time after administration when the peak is observed (Gibaldi and Perrier,
1982).
Majority of the drugs appear to be absorbed in a first order from the site of
administration. The rate of decline in their plasma concentration is monoexponential
as noted after intravenous administration. The disposition kinetics of such drugs have
been reported to follow a one compartment open model with first order absorption
where the plasma concentration is expressed according to equation 2 given below.
Cp = Be -t - A‟e -Kat ------- Equation 2
Where Cp is the concentration of drug in plasma at time t, A‟ and B are the
zero time plasma drug concentration intercepts for the absorption and elimination
components, is the first order rate constant of the elimination phase, Ka is the first
order absorption rate constant after drug administration and e represents the base of
natural logarithm. The disposition kinetics of phenylbutazone (I.M.) in camel (Kadir
et al., 1997), phenylbutazone (P.O.) in calves (Arifah and Lees, 2002), nimesulide
(P.O.) in goats (Rao et al., 2007) and meloxicam (P.O. and I.M.) in vultures (Naidoo
et al., 2008) has been best described by one compartment open model with first order
absorption.
The disposition kinetics of many drugs fit well to two compartment
open model which is generally adjudged by a pronounced departure from longevity in
the semilog plot during early time period following drug administration (Sams, 1978).
In this model, the drug distributes instantaneously into the central compartment
(consisting of blood and other readily accessible tissues like liver and kidney), and
then relatively slowly into the peripheral compartment (the remainder body space).

The two compartment open model also specifies that after intravenous administration
the elimination of a drug take place exclusively from the central compartment. The
distribution and elimination processes are assumed to follow the first order kinetics.
The rate of decline in plasma concentration following intravenous administration of
the drug in this model is biexponential and can be expressed by equation 3 given
below.
Cp = Ae -t + Be -t ------- equation 3
Where Cp is the concentration of drug in plasma, A and B are zero time
intercepts of the initial and terminal phases of the plasma concentration time curve
with the concentration expressed as g.ml-1, and are respectively the distribution
and elimination rate constants expressed as min-1 or h-1 and e represents the base of
natural logarithm.
In a two compartment open model the initial steep decline in plasma drug
concentration is mainly due to distribution of drug from central to peripheral
compartment. Once apparent distribution is established, the rate of decline in plasma
drug concentration is determined mainly by irreversible elimination of drug from the
central compartment, appropriately termed as or elimination phase. The straight
portion of the curve has a slope defined as -/2.303 and an extrapolated zero time
intercept B. Subtraction of extrapolated values from corresponding experimental
plasma values on the semilog plot yields a series of residual concentrations. These
residuals yield a second linear segment called the alpha () or distribution phase with
a slope equal to -/2.303 and a zero time intercept A with units in concentration
(Gibaldi et al., 1969). These experimental constants (A, B, and ) are used to
calculate the actual pharmacokinetic rate constants (K12, K21, Kel) associated with the
two-compartment model.

The disposition kinetics of ketoprofen, phenylbutazone and sodium
meclofenamate in dairy cattle (De Graves et al., 1996; Arifah and Lees, 2002; Picco
et al., 2004), phenylbutazone in camel (Kadir et al., 1997), indomethacin in sheep
(Vinagre et al., 1998), ketorolac in dogs (Pasloske et al., 1999) ketoprofen and
carprofen in horses (Verde et al., 2001; Lees et al., 2002), ibuprofen in broiler
chickens (Vermeulen and Remon, 2001), ketoprofen and nimesulide in goats (Arifah
et al., 2003; Rao et al., 2007), flunixin in cats (Horii et al., 2004) and flunixin-
meglumine in angora rabbits and swine (Elmas, et al., 2005; Burr et al., 2006)) have
been best described by two compartment open model.
Some drugs after extravascular administration (oral or intramuscular) are
absorbed in a first order fashion but their plasma concentration time profiles show a
biexponential decline during the elimination phase. The pharmacokinetics of these
drugs is well fitted to a two compartment open model where the plasma concentration
is described by equation 4 given below.
Cp = Ae -t + Be -t – A‟e -Kat ------- equation 4
Where Cp is the concentration of drug in plasma at time t. A‟, A and B are the
zero time plasma drug concentration intercepts for the absorption, distribution and
elimination phases, respectively. Ka, and are the respective first order rate
constants and e is the base of natural logarithm. The disposition kinetics of
indomethacin (I.M.) in sheep (Vinagre et al., 1998), ibuprofen (P.O.) in broiler
chickens (Vermeulen and Remon, 2001), sodium meclofenamate (I.V.) in cattle
(Picco et al., 2004), ketoprofen (P.O.) in dogs (Montoya et al., 2004) and etodolac
(P.O.) in horses (Davis et al., 2007) have been best described by a two compartment
open model with first order absorption.

The disposition kinetics of some drugs may follow three-compartment open
model, where the plasma concentrations after single intravenous administration are
described by a triexponential expression (equation 5).
Cp = Ae -t + Be -t + Pe -t ------- equation 5
The additional constants P and are estimated by the method of residuals.
The rate constants for drug entry into and out of the third component i.e. K13 and K31,
respectively, can be calculated from the above equation (Baggot, 1977; Gibaldi and
Perrier, 1982). The disposition kinetics of ketoprofen (I.V.) in mares (Sams et al.,
1995), ketorolac (P.O.) in dogs (Pasloske et al., 1999) and sodium meclofenamate
(I.M.) in cattle (Picco et al., 2004) have been reported to fit well into three
compartment open model.
Baggot (1977) has stated that overall elimination rate constant () is the most
important pharmacokinetic parameter as it is a part of the equations used to calculate
the elimination half- life, volume of distribution by area method, total body clearance ,
microconstants for multicompartment models and dosage intervals of multiple dose
regimen. Mercer et al. (1977) further indicated that it might be helpful in predicting
the withdrawal periods for drug residues in tissues.
2.6.4 Half –life, Volume of distribution, Clearance and Mean residence time
The rate of drug elimination is determined by the elimination mechanisms.
The half- life of elimination of a drug is defined as the time required for the body to
eliminate one-half of the drug. If the drug obeys first order kinetics, the half- life value
is independent of the dose administered. When drug absorption from the
gastrointestinal tract or an injection site is rapid, the half- life is independent of the
route of administration. When drug obeys zero order kinetics, the half- life becomes

progressively longer as the dose increased (Baggot, 1995). The half- life is inversely
proportional to the overall elimination rate constant.
Another parameter, apparent volume of distribution [Vd(area)] is hypothetical
volume of body fluids that could be required to dissolve the total amount of drug at
the same concentration as that found in blood. This value serves as a proportionality
constant relating the total amount of drug in the body at any time to the pla sma
concentration of a drug after pseudo-distribution equilibrium has been attained. It is
the volume of fluid that would be required to contain the amount of drug in the body
if it were uniformly distributed at a concentration equal to plasma. The calculated
value of apparent volume of distribution [Vd(area)] is not dependent upon the method
used for its calculation, if the drug distributes truly according to one compartment
(Riegelman et al., 1968b) or multicompartment open model (Notari, 1973). The
apparent volume of distribution indicates the extent or magnitude of distribution of
drug without providing any clue whether the drug is uniformly distributed or
restricted to certain body tissues. This kinetic parameter is most helpful for computing
the dosage regimen that must be administered to maintain the desired plasma
concentration (Baggot, 1977). .
Total body clearance (ClB) of a drug is important as it gives the sum of
clearance from each elimination organ, primarily liver and kidneys. It is defined as the
volume of plasma cleared of the drug by various elimination processes per unit of
time (Shargel and Yu, 1993). Unlike and t½ which are dependent upon K12, K21 and
Kel, the blood clearance changes exactly in proportion to Kel (Jusko and Gibaldi, 1972;
Rowland et al., 1973).
After the administration of dose of a drug, a large number of drug molecules
distribute throughout the body. These molecules will stay in the body for various time
periods. Some drug molecules will leave the body almost immediately after entering,
where as other drug molecules will leave the body at later time periods. The term
mean residence time (MRT) describes the average time for all the drug molecules to
reside in the body. MRT may also be considered as the mean transit t ime.
2.6.5 Non-compartmental technique
As discussed earlier, compartmental models were the primary approach to
pharmacokinetics. Only in the last two decades has there been an indication of a
migration in pharmacokinetics to non-compartmental methods. Non-compartmental
models were first developed and applied to radiation decay analysis and remain
dominant in the physical and biological science literature for general applications.
Since their first application to problems in pharmacokinetics by Yamaoka et al. in
1978, non-compartmental methods have grown steadily in use. This relatively new
approach is for the most part based on classical statistical moment theory.
A moment in statistic is simply a mathematical description of a discrete
distribution of data. In pharmacokinetics, a moment is a true estimate of
pharmacokinetic function describing the entire time profile of plasma drug
concentration (Cp) (Yamaoka et al., 1978). It reveals overall properties of time course
of its residence in a body or in a body compartment. The primary task of model-
independent or non-compartment methods is the direct estimation of the moments
form data. Statistical moments analysis simply done as SHAM (slops, height, areas
and moments) analysis to stress that these are the only data requirements for solution
of these models.
Many non-compartmental methods have been propounded for
pharmacokinetic data analysis, especially for estimation of summary parameters like
clearance and volume of distribution. Amongst the popular ones are linear system

analysis, recirculatory models and the statistical moment approach. Linear system
analysis tends to describe the entire time course of plasma drug concentration in body
in a relatively more comprehensive and dynamic manner (Veng-Pedersen, 1991). This
approach may be exploited for prediction or simulation of systemic drug
concentration by convolution, estimation of time course of drug absorption by
deconvolution, and can even be used for establishing in vivo correlations. The
recirculatory models tend to describe drug disposition in terms of repeated cycle
through the body circulatory system (Cutler, 1978). The statistical moment approach
is doubtlessly the most indisputable non-compartmental approach for pharmacokinetic
data analysis. The technique of statistical moments yields simplistic modeling and has
less restrictive, easily verifiable and realistic assumptions (Chan and Gibaldi, 1982).
This approach is applicable to virtually any linear body model and can be used to
detect nonlinearity, if any, in the data.
Non-compartmental methods can be used to determine certain
pharmacokinetic parameters without fitting data in any compartmental model. The
basic calculations are based on the area under the plasma concentration verses time
curve (Zero moment) and the first moment curve (AUMC). Only the zero to second
order moments have been employed in pharmacokinetics, as higher moments are
prone to unacceptable limits of computational error. The area under curve (AUC) and
area under moment curve (AUMC) can be calculated by using the trapezoidal rule
without making any assumption concerning the number of compartments. Non-
compartmental technique has been used to determine pharmacokinetics of ketoprofen
in horse, camel and cat (Landoni and Lees, 1995b; Alkatheeri et al., 1999; Castro et
al., 2000), tiaprofenic acid in horse (Delbeke et al., 1998), ketorolac in sheep (Santos
et al., 2001) and meloxicam in dogs (Montoya et al., 2004).

2.7 Pharmacokinetics of ketoprofen
2.7.1 General Pharmacokinetics
The absorption of ketoprofen was rapid and almost complete on oral
administration while its bioavailability was 71–96% and 73–93% following I.M. and
rectal administration, respectively, in humans (Jamali and Brocks, 1990). Substantial
concentrations of the drug are attained in synovial fluid, the proposed site of action of
NSAIDs in case of rheumatoid arthritis. Ketoprofen binds to plasma albumin,
apparently in a stereoselective manner. Plasma protein binding of ketoprofen was
extensive; the mean plasma protein binding of ketoprofen was 92.8% at 5 g.ml-1 and
91.6% at 10.0 g.ml-1 (Jamali and Brocks, 1990). Generally, volume of distribution is
relatively low; attributable to a high degree of binding to plasma protein. In case of
horse the plasma protein binding was 92% (Landoni and Lees, 1996).
Ketoprofen is completely metabolized in liver and excreted through kidneys.
Metabolism of ketoprofen consists of three stages of biotransformation: (1) inversion
of R(-) to S(+) enantiomers, (2) hydroxylation on the aromatic ring of the benzoic
group and (3) conjugation to an acylglucuronide (Mauleon et al., 1996). It is
eliminated following extensive biotransformation to inactive glucuronide conjugated
metabolite (Jamali and Brocks, 1990). The process of glucuronidation is the major
transformation in all the species studied while the relevance of other two types of
biotransformation varies considerable between species, according to their age and
different physiological situation (Aberg et al., 1995; Igarza et al., 2002). A ketoprofen
metabolite, hydroxyl ketoprofen, resulting from reduction of keto group has been
identified in the horse (Sams et al., 1995).
Marked species differences occur in some pharmacokinetic parameters,
notably terminal half- life and clearance (Landoni and Lees, 1996). Total plasma
clearance was attributed to renal excretion of ketoprofen and metabolism of
ketoprofen to baseline conjugate, which was also excreted in the urine. Renal
clearance of ketoprofen was attributed to renal tubular secretion, as rena l clearance
was grater than filtration clearance (Sams et al., 1995). Urinary recovery of
ketoprofen during first 7 h post administration accounted for 26.4% of the dose as
unconjugated ketoprofen and 29.8% of the dose as a base- labile conjugate of
ketoprofen. Thus, total urinary recovery was 56.2% of the dose (Jamali and Brocks,
1990).
2.7.2 Pharmacokinetics of ketoprofen: In various species
Ketoprofen pharmacokinetics have been reported in following main species:
1. Cattle (Landoni and Lees, 1995a; Landoni et.al., 1995; De Graves et al.,
1996; Igarza et al., 2004).
2. Sheep (Landoni et al., 1999).
3. Goat (Musser et al., 1998; Arifah et al., 2003; Pranvendra et al., 2005;
Pravin et al., 2005).
4. Horse (Jaussaud et al., 1993; Landoni and Lees, 1995b; Owens et al.,
1995a; Sams et al., 1995; Landoni and Lees, 1996; Corveleyn et al., 1996;
Anfossi et al., 1997; De Graves et al., 1998; Wilcke et al., 1998; Verde et
al., 2001).
5. Dog (Schmitt and Guentert, 1990; Montoya et al., 2004).
6. Cat (Lees et al., 2003).
7. Camel (Alkatheeri et al., 1999; Alkatheeri et al., 2000).
8. Japanese quail (Graham et al., 2005).
Important Pharmacokinetic parameters of ketoprofen in various species of
domestic animals are compared in Table 2.

Table 2: Important pharmacokinetic parameters of ketoprofen in various species of domestic animals.
Animal Spp.
Dose (mg.kg
-1)
Route of Administ
-ration
Enanti-omer
Pharmacokinetic Parameters
References t1/2 (h)
Vd (area) (L.kg
-1)
Vd (ss) (L.kg
-1)
ClB (ml.min
-1.kg
-1)
AUC
(g.h.ml-1
)
Cmax
(g.ml-1
) Tmax (h)
MRT (h)
F (%)
1 2 3 4 5 6 7 8 9 10 11 12 13 14
Cattle including
calves
1.5 IV
S(+) 2.19
± 0.42
---- 0.26
± 0.04
1.98 ± 0.20 ---- ---- ---- ---- ---- Landoni and Lees,
1995(a) R(-)
1.30 ±
0.27 ----
0.19 ± 0.03
2.51 ± 0.60 ---- ---- ---- ---- ----
3.0
IV
S(+) 0.42
± 0.08
0.22 ±
0.06 ----
5.50 ± 0.67
9.94 ± 1.09 ---- ---- 2.67
± 0.79
----
Landoni et al., 1995
R(-) 0.42
± 0.09
0.20 ±
0.06 ----
5.50 ± 0.50
9.49 ± 0.84 ---- ---- 1.69
± 0.25
----
3.3 IV ---- 0.49 ---- 0.11 2.8 ---- ---- ---- ---- ---- De Graves et al.,
1996
0.5
IV (in gesta-
tion)
S(+) 0.26 ---- 0.28 ---- 0.67 ---- ---- 0.38 ----
Igarza et al., 2004
R(-) 0.31 ---- 0.33 ---- 0.87 ---- ---- 0.45 ----
IV (Early
lactation)
S(+) 0.69 ---- 0.19 ---- 2.78 ---- ---- 0.99 ----
R(-) 0.87 ---- 0.25 ---- 2.93 ---- ---- 1.25 ----
IV (New born)
S(+) 1.71 ---- 0.25 ---- 5.15 ---- ---- 2.47 ----
R(-) 0.52 ---- 0.30 ---- 3.24 ---- ---- 2.02 ----

Table 2: continued.
1 2 3 4 5 6 7 8 9 10 11 12 13 14
Sheep
3 IV
S(+) 0.86
± 0.08
---- 0.26
± 0.02
5.85 ± 0.83
0.36 ± 0.05
----- ---- 0.79
± 0.11
----
Landoni et al., 1999
R(-) 0.87
± 0.10
---- 0.17
± 0.02
3.27 ± 0.53 0.20 ± 0.03 ---- ---- 0.95
± 0.13
----
1.5 IV
S(+) 3.23
± 1.56
---- 0.47
± 0.14
4.77 ± 0.98 0.29 ± 0.06 ---- ---- 1.90
± 0.72
----
R(-) 1.63
± 0.34
---- 0.34
± 0.05
3.87 ± 0.50 0.23 ± 0.03 ---- ---- 1.47
± 0.20
----
Goat
2.2 IV ---- 0.32
± 0.14
---- 0.23
± 0.05
12.33 ± 2.0 3.05 ± 0.052
---- ---- 0.31
± 0.06
---- Musser et al., 1998
3 IV
S(+) 1.79
± 0.24
---- 0.39
± 0.07
5.0 ± 0.05 5.15 ± 0.46 ---- ---- 1.28
± 0.20
----
Arifah et al., 2003
R(-) 0.87
± 0.28
---- 0.29
± 0.05
3.83 ± 0.02 6.81 ± 0.66 ---- ---- 1.36
± 0.29
----
3 IV ---- 0.81 0.67 ---- 9.53 5.31 ---- ---- 0.95 ---- Pravin et al., 2005
3 IV ---- 1.21 0.93 ---- 8.81 5.95 ---- ----- ---- ----
Pranvendra et al., 2005 IM ---- 0.46 0.43 ---- 14.43 3.97 ----- ---- ---- 80.15

Table 2: continued.
1 2 3 4 5 6 7 8 9 10 11 12 13 14
Horse
2.2
P.O. (paste)
S(+) 5.69
± 1.69
---- ---- ---- 0.99
± 0.10
0.28 ±
0.08
0.50 ±
0.07
8.12 ±
2.43
5.75 ±
1.48
Landoni and Lees, 1995
R(-) 5.64
± 0.60
---- ---- ---- 0.85
± 0.02
0.23 ±
0.03
0.50 ±
0.60
8.35 ±
0.88
2.67 ±
0.43
P.O. (powder capsule)
S(+) 3.18
± 0.93
---- ---- ---- 6.75
± 0.81
2.73 ±
0.49
0.92 ±
0.14
4.40 ±
1.28
54.17 ±
9.90
R(-) 3.15
± 0.99
---- ---- ---- 4.13
± 0.58
2.19 ±
0.44
0.83 ±
0.05
3.93 ±
1.20
50.50 ±
10.95
2.2 IV ----
1.02 ±
0.47
0.28 ±
0.14
0.14 ±
0.05
3.08 ± 0.38
12.06 ±
1.64 ---- ----
0.76 ±
0.25 ----
Owens et al., 1995a 0.63
± 0.29
0.20 ±
0.08
0.13 ±
0.03
3.66 ± 0.39
10.10 ±
1.00 ---- ----
0.62 ±
0.13 ----
2.2 IV
(Mare) ----
1.63 0.68 0.16 4.81 7.44 378 6.54 0.54 ---- Sams et al., 1995 1.60 0.64 0.18 4.80 7.63 362 4.64 0.63
1.1 IV
S(+) 1.09 0.64 ---- 6.62 2.74 ---- ---- ---- ---- Landoni and Lees, 1996 R(-) 1.98 0.53 ---- 5.77 2.73 ---- ---- ---- ----
Dog 100 mg
PO ---- ---- ---- ---- ---- ---- --- 0.83
± 0.61
---- 0.90
± 0.10
Schmitt and Guentert, 1990

Table 2: continued.
1 2 3 4 5 6 7 8 9 10 11 12 13 14
Cat
2 IV S(+) 1.52 ----- 0.10 0.88 20.25 ----- ----- 1.73 -----
Lees et al., 2003
R(-) 0.56 ----- 0.14 4.95 4.09 ----- ----- 0.59 -----
1 P.O. S(+) 0.87 ----- ----- ----- 6.36 2.47 0.95 ----- 112
R(-) 0.60 ----- ----- ----- 1.83 1.22 0.57 ----- 85
1 IV S(+) 1.18 ----- 0.22 2.17 10.02 6.31 ----- 1.70 -----
Camel
2 IV --- 4.16 0.32 0.13 1.00 ---- ---- ---- ---- ----- Alkatheeri et al.,
1999 IM 3.28 0.27 ---- 0.99 44.0 12.2 1.5 3.77 121.1
2
IV
(Female)
S(+) 1.83 0.13 0.10 50.6 19.8 ---- ---- 2.08 ----
Alkatheeri et al.,
2000
R(-) 1.88 0.11 0.09 44.6 22.4 ---- ---- 2.13 ----
IV
(Male)
S(+) 2.33 0.22 0.15 69.6 14.4 ---- ---- 2.20 ----
R(-) 2.11 0.21 0.15 62.8 16.0 ---- ---- 2.17 ----

2.7.2.1 Cattle
Landoni and Lees (1995a) studied pharmacokinetics and pharmacodynamics
of S(+) and R(-) ketoprofen (KTP) enantiomers in calves after intravenous
administration of each enantiomer at a dose of 1.5 mg.kg-1. Chiral inversion of R(-) to
the S(+) antipode occurred. The R:S ratio in plasma was 33:1 at 5 min after
administration, decreasing to 1:1 at 8 h. The calculated extent of inversion was 31 ±
7%. The R:S ratio in inflammatory exudate was of the order 3:1 at all the sampling
times and the ratio in transudate was approximately 2:1 at 6 h, declining to 1:1 at 30
h. Only S(+) KTP was detected in biological fluids after administration of this
enantiomer. Elimination half- life was longer for the S(+) (2.19 h) than the R(-)
enantiomer (1.30 h) and volume of distribution was slightly higher for the S(+)
enantiomer. They concluded that effects of R(-) KTP were obtained as a hybrid, since
they potentially reflect the actions of both enantiomers.
Landoni et al. (1995) studied pharmacokinetics and pharmacodynamics of
ketoprofen (KTP) in calves following intravenous administration of the drug racemate
at a dose rate of 3 mg.kg-1. No differences were observed between disposition curves
of KTP enantiomers in plasma, exudates or transudate. This indicates that in calves
KTP pharmacokinetics is not enantioselective. S(+) and R(-) KTP each had a short
elimination half- life (t1/2β) of 0.42 ± 0.08 h and 0.42 ± 0.09 h, respectively. The
volume of distribution were 0.20 ± 0.06 and 0.22 ± 0.06 L.kg-1 for R(-) and S(+) KTP,
respectively. Body clearance (ClB) was high i.e. 0.33 ± 0.03 and 0.32 ± 0.04 L.h-1.kg-1
for R(-) and S(+) KTP, respectively, correlating with the short elimination half- life.
De Graves et al. (1996) determined plasma and milk concentration-time
profiles and pharmacokinetic variables after I.V. administration of ketoprofen to
lactating dairy cows. Apparent volume of distribution at steady state was 0.11 L.kg-1,

elimination half- life was 0.49 h and total clearance was 0.17 L.h-1.kg-1. Ketoprofen
was detected in some milk samples, 10 to 120 minutes after administration, but all
concentrations were below the limit of quantification.
Igarza et al. (2004) studied pharmacokinetic of ketoprofen in three categories
of cattle following intravenous administration at a dose of 0.5 mg.kg-1. Significant
differences between the three categories of animal (i.e. cows in gestation, early
lactation and newborn calves, respectively) were obtained in elimination half- life
(t1/2β) (0.31, 0.87, 1.52 and 0.26, 0.69, 1.71 h), mean residence time (MRT) (0.45,
1.25, 2.20 and 0.38, 0.99, 2.47 h), and area under the plasma concentration-time curve
(AUC) (0.87, 2.93, 3.24, and 0.67, 2.78, 5.13 µg.h.ml-1) for the R(-) and S(+)
enantiomer, respectively.
2.7.2.2 Sheep
Landoni et al. (1999) established pharmacokinetic and pharmacodynamic
parameters for the R(-) and S(+) enantiomers of ketoprofen. Each enantiomers was
administered separately (1.5 mg.kg-1) and in a racemic mixture (3 mg.kg-1)
intravenously to a group of eight sheep in a four-way, four-period cross-over study
using a tissue cage model of inflammation. Plasma disposition of each KTP
enantiomer was similar following separate administration of the pure compounds
compared to administration of the racemic mixture. Following I.V. administration of
racemic ketoprofen, values of distribution rate constant, elimination rate constant,
distribution half life, elimination half life, volume of distribution at steady state, total
body clearance, area under curve and mean resident time were 5.23 h-1, 0.85 h-1, 0.14
h, 0.86 h, 0.27 L.kg-1, 0.351 L.h-1.kg-1, 4.74 µg.h.ml-1 and 0.79 h, respectively for S(+)
KTP and 9.28 h-1, 0.86 h-1, 0.13 h, 0.87 h, 0.17 L.kg-1, 0.196 L.h-1.kg-1, 8.73 µg.h.ml-1
and 0.95 h, respectively for R(−) KTP.

2.7.2.3 Goat
Musser et al. (1998) reported pharmacokinetic parameters and milk
concentrations of ketoprofen in six lactating goats after single intravenous bolus dose
(2.2 mg.kg-1) administration. Blood and milk samples were collected prior to and for
24 h after drug administration. Drug concentrations in serum and milk were
determined by high performance liquid chromatography. Elimination half- life, total
body clearance and volume of distribution at steady state were 0.32 ± 0.14 h, 0.74 ±
0.12 L.h-1.kg-1 and 0.23 ± 0.051 L.kg-1, respectively. Ketoprofen was not detectable by
the employed method in all milk samples.
Arifah et al. (2003) investigated pharmacokinetics and pharmacodynamics of
ketoprofen (KTP) using a tissue cage model of acute inflammation. In this study,
ketoprofen was administered intravenously to goats as the racemate (3.0 mg.kg-1 total
dose) and as the single enantiomers, S(+) KTP and R(−) KTP (1.5 mg.kg-1 of each).
Following I.V. administration of racemic ketoprofen, values of distribution rate
constant, elimination rate constant, distribution half life, elimination half life, volume
of distribution at steady state, total body clearance, area under curve and mean
resident time were 3.9 h-1, 0.45 h-1, 0.18 h, 1.79 h, 0.39 L.kg-1, 0.30 L.h-1.kg-1, 5.15
µg.h.ml-1 and 1.28 h, respectively for S(+) KTP and 3.75 h-1, 0.42 h-1, 0.19 h, 1.87 h,
0.29 L.kg-1, 0.23 L.h-1.kg-1, 6.81 µg.h.ml-1 and 1.86 h, respectively for R(−) KTP. The
pharmacokinetics of both KTP enantiomers was characterized by rapid clearance,
short mean residence time (MRT) and low volume of distribution. The penetration of
R(−) KTP into inflamed (exudate) and noninflamed (transudate) tissue cage fluids
was delayed but area under the curve values were only slightly less than those in
plasma, whereas MRT was much longer. The S(+) enantiomer of KTP penetrated less

readily into exudate and transudate. Unidirectional inversion of R(−) to S(+) KTP
occurred.
Pravin et al. (2005) studied the pharmacokinetics of ketoprofen in five female
goats following intravenous administration. The peak concentrations of 9.87 ± 0.48
and 106.15 ± 7.40 μg.ml-1 were obtained at 0.042 and 0.75 h in plasma and urine,
respectively. The drug was detectable up to 6 h in plasma and 12 h in urine. The
distribution half- life (t1/2α) and elimination half- life (t1/2β) were 0.15 ± 0.02 h and 0.81
± 0.02 h, respectively. The shorter t1/2α denoted the faster distribution of ketoprofen in
goats. Area under plasma concentration time curve (AUC), area under first moment
curve (AUMC), mean resident time and apparent volume of distribution [Vd(area)] were
5.31 ± 0.22 mg.h.L-1, 5.06 ± 0.21 mg.h2.L-1, 0.95 ± 0.02 h, and 0.67 ± 0.04 L.kg-1,
respectively. Higher value of total body clearance (ClB) of 9.53 ± 0.39 ml.min-1.kg-1
denoted faster excretion of ketoprofen in goats.
Pranvendra et al. (2005) studied the pharmacokinetics of ketoprofen following
single dose (3.0 mg.kg-1 body weight) administration through I.V. and I.M. routes in
healthy goats. A two-compartment and one-compartment open model adequately
described plasma concentration time profile of ketoprofen in healthy goats following
single dose I.V. and I.M. administration, respectively. Peak concentration of 18.64
μg.ml-1 was obtained at 0.033 h, following I.V. administration of ketoprofen in goats,
which declined to 0.25 μg.ml-1 at 6 h. The value of distribution half life (t1/2α) and
elimination half life (t1/2β) were, 0.1 h and 1.21 h, respectively, while the values of
volume of distribution (Vd), clearance (Cl) and area under curve (AUC) were 932.03
ml.kg-1, 529.1 ml.h-1.kg-1 and 5.95 μg.h.ml-1, respectively following I.V.
administration. Absorption half- life (t1/2Ka) and elimination half- life (t1/2β) were 0.08 h
and 0.46 h, respectively following I.M. administration. The values of volume of

distribution (Vd), clearance (ClB) and area under curve (AUC) were 430.27 ml.kg-1,
866.75 ml.h-1.kg-1 and 3.97 μg.h.ml-1, respectively following I.M. administration.
Intramuscular bioavailability of ketoprofen was 80.15 % in goats.
2.7.2.4 Horse
Jaussaud et al. (1993) calculated pharmacokinetic parameters of ketoprofen in
horses after single dose administration (2.2 mg.kg.-1). The elimination half life, area
under the curve, clearance and volume of distribution were in range of 21.7-28.7 min.,
221.9-319.9 µg.h.ml-1, 1.5 -2.3 L.min-1.kg-1 and 59.7-96.1 L.kg-1, respectively.
Landoni and Lees (1995b) studied influence of formulation on the
pharmacokinetics and bioavailability of racemic ketoprofen in horses after oral
administration. Two oral formulations were studied, an oil-based paste containing
micronised rac-KTP (racemic form of ketoprofen) and powder from the same source
in hard gelatin capsules, each at a dose rate of 2.2 mg.kg-1. After intravenous
administration of rac-KTP, S(+) enantiomer concentrations exceeded those of the R(-)
enantiomer. For S(+) KTP, elimination half life, total body clearance and volume of
distribution at steady state were 0.99 ± 0.14 h, 0.56 ± 0.09 L.h.kg-1 and 0.61 ± 0.10
L.kg-1, respectively. For R(-) KTP, elimination half life, total body clearance and
volume of distribution at steady state were 0.70 ± 0.13 h, 0.92 ± 0.20 L.h.kg-1 and
0.53 ± 0.11 L.kg-1, respectively. The study demonstrates that rac-KTP had a modest
bioavailability when administered as a micronised powder in hard gelatin capsules to
horses with restricted access to food. When powder from the same source was
administered as an oil-based paste, bioavailability was very poor regardless of the
feeding schedule.
Owens et al. (1995a) studied pharmacokinetics of single intravenous dose of
ketoprofen (2.2 mg.kg-1) in healthy and experimentally acute synovitis induced

horses. The plasma harmonic mean half- life in healthy horses (0.88 h) was longer
than in horses with synovitis (0.55 h). In horses with synovitis, synovial fluid
concentrations approximated plasma concentrations by 1 h. Synovial fluid
concentrations of ketoprofen in horses with synovitis were 6.5 times higher than those
in healthy horses at 1 h. The area under the synovial fluid concentration curve for
horses with synovitis was greater than in healthy horses. These data suggest that the
inflamed joint serves as a site of sequestration for ketoprofen. Furthermore, these
results indicate that plasma pharmacokinetics may be altered by inflammation in
peripheral compartments such as the joint.
Sams et al. (1995) studied pharmacokinetics and urinary excretion of
ketoprofen after multiple intravenous doses to mares. The harmonic mean of the
terminal elimination half- life of ketoprofen after the first and last dose was 98.2 and
78.0 min, respectively. The median values of the total plasma clearance and the renal
clearance after the first dose were 4.81 and 1.93 ml.min-1.kg-1, respectively.
Landoni and Lees (1996) establish pharmacokinetic and pharmacodynamic
parameters for enantiomers of ketoprofen, each administered separately at a dose level
of 1.1 mg.kg-1 to geldings. For both S(+) and R(-) KTP, penetration into tissue cage
fluid (transudate) and inflamed tissue cage fluid (exudate) was rapid, and clearances
from exudate and transudate were much slower than from plasma. AUC values were,
therefore, higher for exudate and, to a lesser degree, transudate than for plasma.
Unidirectional chiral inversion of R(-) to S(+) KTP was demonstrated. Administration
of both enantiomers produced marked, time-dependent inhibition of synthesis of
serum thromboxane B2 and exudate prostaglandin E2, indicating non-selective
inhibition of cyclo-oxygenase (COX) isoenzymes COX-1 and COX-2, respectively.

Corveleyn et al. (1996) administered three different formulations in horses,
each containing 1 g of ketoprofen, in a fatty and hydrophilic suppository base and
liquid suspension per rectal. An average elimination half- life of 1.3 h was calculated.
The average value for the total plasma clearance (ClB), volume of distribution
[Vd(area)] and the mean residence time (MRT) were 131.9 ml.min-1.kg-1, 255 ml.kg-1
and 0.47 h, respectively. After rectal administration, the mean maximal plasma
ketoprofen concentrations were 1.6, 1.1 and 1.6 g.ml-1 for the fatty suppository, the
hydrophilic suppository and the liquid suspension, respectively. The absolute
bioavailability of ketoprofen was relatively low with an inter- individual variability
(24.5-31.3 %).
Anfossi et al. (1997) studied the intramuscular bioavailability of ketoprofen,
administered as the lysine salt in horses treated at the dose rate of 2.2 mg.kg-1. The
absorption rate of ketoprofen administered as the lysine salt was rather low; the mean
residence time increase from 31.7 min. following intravenous administration to 128.9
min. following intramuscular administration and the bioavailability was high (92.4%).
De Graves et al. (1998) determine intravascular and intrasynovial
pharmacokinetics of the R(-) and S(+) enantiomers of ketoprofen after I.V. and I.M.
administration to horses. Mean S(+) to R(-) serum concentration ratios after I.V. and
I.M. administrations were 1.36 ± 0.214 and 1.34 ± 0.245, respectively. Intrasynovial
concentrations of the S(+) and R(-) enantiomer of ketoprofen could be measured for
only the first 3 hours after I.V. administration. Concentrations were less than the limit
of quantification by 4 hours after I.V. administration and at all times after I.M.
administration. Extent of protein binding of the R(-) enantiomer was not significantly
different from extent of protein binding of the S(+) enantiomer, extent of protein
binding did not appear to be concentration dependent. Mean free S(+) to free R(-)

serum concentration ratios, adjusted for protein binding, after I.V. and I.M.
administration were 1.58 and 1.56, respectively.
Wilcke et al. (1998) determine pharmacokinetic variables that describe
disposition of ketoprofen in healthy foals less than 24 hours old. Ketoprofen was
administered I.V. to foals at a dosage of 2.2 mg.kg-1 of body weight. Plasma
concentration versus time profiles were best described, using a two-compartment
open model. Clearance (normalized for body weight) was significantly lower than that
determined for adult horses. Volume of distribution (normalized for body weight) was
larger than that determined for adult horses. Mean (harmonic) plasma half- life for
healthy foals less than 24 hours old was 4.3 hours.
Verde et al. (2001) reported pharmacokinetic of ketoprofen in plasma and
synovial fluid of horse with acute synovitis after I.V. administration at the dose rate of
2.2 mg.kg -1 body weight. Various Pharmacokinetic parameters like distribution half
life, elimination half life, area under curved, volume of distribution at steady state,
body clearance and mean residence time were 0.20 ± 0.03 and 0.13 ± 0.01 h, 1.14 ±
0.18 and 1.87 ± 0.63 h, 5.54 ± 0.98 and 3.13 ± 0.50 mg.h.ml-1, 0.10 ± 0.01 and 0.12 ±
0.01 L.kg-1, 0.23 ± 0.04 and 0.40 ± 0.07 ml.h-1.kg-1, and 0.93 ± 0.13 and 1.40 ± 0.51 h
for S(+) and R(-) enantiomer, respectively.
2.7.2.5 Dog
Schmitt and Guentert (1990) conducted pharmacokinetic of ketoprofen in dogs
following oral administration. The parameters observed were time required to attain
maximum concentration (t max) of 0.83 ± 0.61 h and bioavailability of 0.90 ± 0.10.
Montoya et al. (2004) compared pharmacokinetic of meloxicam and
ketoprofen following oral administration to healthy dogs. Pharmacokinetics of
ketoprofen (KTP) and meloxicam were studied in dogs following a single oral dose of

1 mg.kg-1 and 0.2 mg.kg-1, respectively. There were differences between the
disposition curves of the KTP enantiomers, confirming that the pharmacokinetics of
KTP is enantioselective in dogs. S(+) KTP was the predominant enantiomer. The S:R
ratio in the plasma increased from 2.58 ± 0.38 at 15 min to 5.72 ± 2.35 at 1 h. The
area under the concentration–time curve (AUC) of S(+) KTP was approximately 6
times greater than that of R(–) KTP. The mean pharmacokinetic parameters like Tmax,
Cmax, t1/2β, AUC, Vd/F and Cl/F for ketoprofen and meloxicam were 0.76 ± 0.19 and
8.5 ± 1.91 h, 2.02 ± 0.41 and 0.82 ± 0.29 µg.ml-1, 1.65 ± 0.48 and 12.13 ± 2.15 h, 6.06
± 1.16 and 15.41 ± 1.24 mg.h.ml-1, 0.39 ± 0.07 and 0.23 ± 0.03 L.kg-1 and 170 ± 39
and 10 ± 1.4 ml.h-1.kg-1, respectively. These results indicated a significant
pharmacokinetic difference between meloxicam and ketoprofen after therapeutic
doses in dogs.
2.7.2.6 Cat
Lees et al. (2003) studied pharmacokinetic of racemate ketoprofen
administered intravenously and orally at the dose rate of 2 and 1 mg.kg-1, respectively,
in cats. The absorption of both S(+) and R(-) enantiomers was rapid after oral dosing.
Enantioselective pharmacokinetics was demonstrated by the predominance of S(+)
KTP, as indicated by plasma AUC of 20.25 mg.h.ml-1 for S(+) KTP and 4.09
mg.h.ml-1 for R(-) KTP following I.V. administration and 6.36 mg.h.ml-1 for S(+)
KTP and 1.83 mg.h.ml-1 for R(-) KTP following oral dosing of ketoprofen.
2.7.2.7 Camel
Alkatheeri et al. (1999) studied the pharmacokinetics of ketoprofen following
I.V. and I.M. administration (2.0 mg.kg-1). Following I.V. administration elimination
half- life (t1/2β), volume of distribution at steady state [Vd(ss)], volume of distribution
[Vd(area)] and total body clearance (ClB) were 4.16 h, 130.2 ml.kg-1, 321.5 ml.kg-1 and

1.00 ml.min-1.kg-1, respectively. Following I.M. administration, the drug was rapidly
absorbed with peak serum concentration of 12.2 mg.ml-1 at 1.50 h. The elimination
half- life was 3.28 h.
Alkatheeri et al. (2000) studied pharmacokinetics of racemic ketoprofen
enantiomers in ten female and eight male camels after a single intravenous dose (2.0
mg.kg-1). The areas under the curve to infinity (AUC) (μg.h.ml-1) were 22.4 (13.5-
29.7) and 19.8 (13.8-22.1) for R(-) and S(+) KTP, respectively, in female camels
while the corresponding values in male camels were 16.0 (12.9-22.4) and 14.4 (11.0-
19.3). In both sexes, the AUC for the R(-) enantiomer was significantly larger than
that of the S(+) enantiomer. Total body clearances (ClB) were 44.6 (33.7-74.1) and
50.6 (45.2-72.4) ml.h-1.kg-1 for R(-) and S(+) KTP, respectively, in female camels and
were 62.8 (44.6-77.8) and 69.6 (51.8-91.1) ml.h-1.kg-1 for R(-) and S(+) KTP,
respectively, in male camels. The steady-state volumes of distribution [Vd(ss)] were
97.9 (82.8-147.2) and 102.0 (90.1-169.0) ml.kg-1 for R(-) and S(+) KTP, respectively,
in female camels and were significantly different from each other, while the
respective values in male camels were 151.5 (105.3-222.3) and 154.0 (114.7-229.0)
ml.kg-1 but were not significantly different from each other. The volumes of
distribution (area) [Vd(area)] followed a similar pattern, where the values for R(-) and
S(+) KTP in female camels were 118.5 (95.6-195.2) and 137.6 (115.8-236.2) ml.kg-1,
respectively, and the respective values in male camels were 215.6 (119.1-270.1) and
229.1 (143.3-277.4) ml.kg-1. The elimination half- lives (t1/2β) were 1.88 (1.42-2.34) h
and 1.83 (1.67-2.26) h for R(-) and S(+) KTP, respectively, in female camels and
were significantly different from each other, while the corresponding values in male
camels were 2.11 (1.50-4.20) and 2.33 (1.52-3.83) h for R(-) and S(+) KTP,
respectively, but were not significantly different from each other. The mean residence

time followed a similar pattern. All pharmacokinetic parameters for R(-) and S(+)
KTP in female camels were significantly different from their corresponding values in
male camels.
2.7.2.8 Japanese Quail
Graham et al. (2005) reported pharmacokinetic of ketoprofen in 45 Japanese
quails. The drug was given at 2 mg.kg-1 body weight intravenously (I.V.),
intramuscularly (I.M.) or orally (P.O.) in a three-period crossover design. The
bioavailability of ketoprofen following I.M. and P.O. administrations were 56 and
24%, respectively. The elimination half- life was shortest for the I.M. route (8.7 min)
compared to the I.V. (21.1 min) and P.O. routes (35 min). They proposed that short
half- life of ketoprofen in Japanese quails may be due to their rapid metabolism and
excretion of the drug.
2.8 Therapeutic efficacy:
Ketoprofen is used for musculoskeletal and joint disorders such as ankylosing
spondylitis, osteoarthritis, rheumatoid arthritis and in peri-articular disorders such as
bursitis and tendinitis. It is also used for treating postoperative pain, painful and
inflammatory conditions such as acute gout or soft tissue disorders and to reduce
fever (Dollery, 1991; Sweetman, 2002). It is also indicated for the management of
acute painful shoulder syndrome and juvenile rheumatoid arthritis (Kantor, 1986).
Ketoprofen can also be used in the following instances (Dollery, 1991).
i. In surgical and traumatic situations where analgesic action is required.
ii. In infectious diseases which require analgesic, anti- inflammatory and
anti-pyretic effects.
iii. In gynaecological conditions for uterine relaxation and analgesia in
post-partum.

Recommended dosage of ketoprofen in domestic animals (USP monograph, 2004) is
shown in table 3.
Table 3: Recommended dosage of ketoprofen in animals.
Animals Route of Administration Dosages
Cattle Intravenous 3 mg kg -1 every 24 h. for 3 days.
Intramuscular 3 mg kg -1 every 24 h. for 3 days
Dog & Cat
Intravenous 2 mg kg -1 as single dose followed by maintenance dose 1 mg kg -1 24 h.
Intramuscular 2 mg kg -1 as single dose followed by
maintenance dose 1 mg kg -1 24 h.
Horse including
Foals
Intravenous 2.2 mg kg -1 every 24 h.
Intramuscular 2.2 mg kg -1 every 24 h.
Longo et al. (1990) found that Ketoprofen given at 2 mg.kg-1 I.V. daily for 1-5
days, showed good to very good results in 81% of 91 horses with different
musculoskeletal affections.
Shpigel et al. (1994) conducted two separate clinical trials in cows to evaluate
efficacy of ketoprofen for mastitis. All cows were treated with 20 g sulfadiazine and 4
g trimethoprim I.M. and a half dosage daily thereafter. The ketoprofen treatment
groups received 2 g ketoprofen I.M. once daily for the duration of the antimicrobial
therapy. They concluded that ketoprofen significantly improved recovery in gram
negative clinical mastitis in dairy cows.
Glew et al. (1996) studied the antipyretic effectiveness of Ketoprofen in
pyretic cats with a variety of bacterial and viral infections. Cats were randomly
assigned to receive broad-spectrum antibiotic or broad-spectrum antibiotic plus
ketoprofen. Body temperature was monitored 3 times daily and attitude and appetite
were evaluated once daily. The treatment groups were compared with respect to mean
body temperatures, using a one-way analysis of variance. Mean temperatures were

significantly different during the 4 and 8 h post-treatment observations, with a
reduction to normal temperatures in the ketoprofen group compared with no change in
the group treated with antibiotics alone. The antipyretic effect of ketoprofen was rapid
and persisted for at least 8 h, but for less than 24 h. The overall recovery period from
pyrexia, depression, and inappetance was also shorter in cats treated with antibiotics
and ketoprofen (3 days) than in cats treated only with antibiotics (5 days). They
concluded that ketoprofen was a useful adjunct in the treatment of pyretic cats.
Pibarot et al. (1997) compared analgesic effects of ketoprofen, oxymorphone
hydrochloride, and butorphanol when used to control postoperative pain associated
with elective orthopedic surgery. 70 dogs undergoing orthopedic surgery on a hind
limb were randomly assigned to 1 of 4 postoperative analgesic treatment groups like
ketoprofen alone, oxymorphone alone, butorphanol alone and ketoprofen-
oxymorphone combination. Drugs were given I.M. at the end of anesthesia. Pain
score, sedation score, arterial blood pressures, arterial blood gas partial pressures, and
plasma cortisol concentration were measured for 12 h after surgery. They found that
except during the first hour after surgery, dogs given ketoprofen alone after elective
orthopedic surgery had a greater level of, and longer- lasting, analgesia than did dogs
given oxymorphone or butorphanol alone.
Cabre et al. (1998a) examined the analgesic, anti- inflammatory and antipyretic
activities of S(+) ketoprofen in rats and mice. Anti-nociceptive action of S(+)
ketoprofen was measured in abdominal pain models. After I.V. administration (0.5
mg.kg-1), S(+) ketoprofen inhibited 92.1 ± 2.2% of writhing in mice but I.V.
administration of the R(-) enantiomer resulted in no statistically significant activity in
a dose range of 0.15-1.0 mg.kg-1. Similar results were obtained after oral
administration in mice. In the rat, S(+) ketoprofen was more potent analgesic than
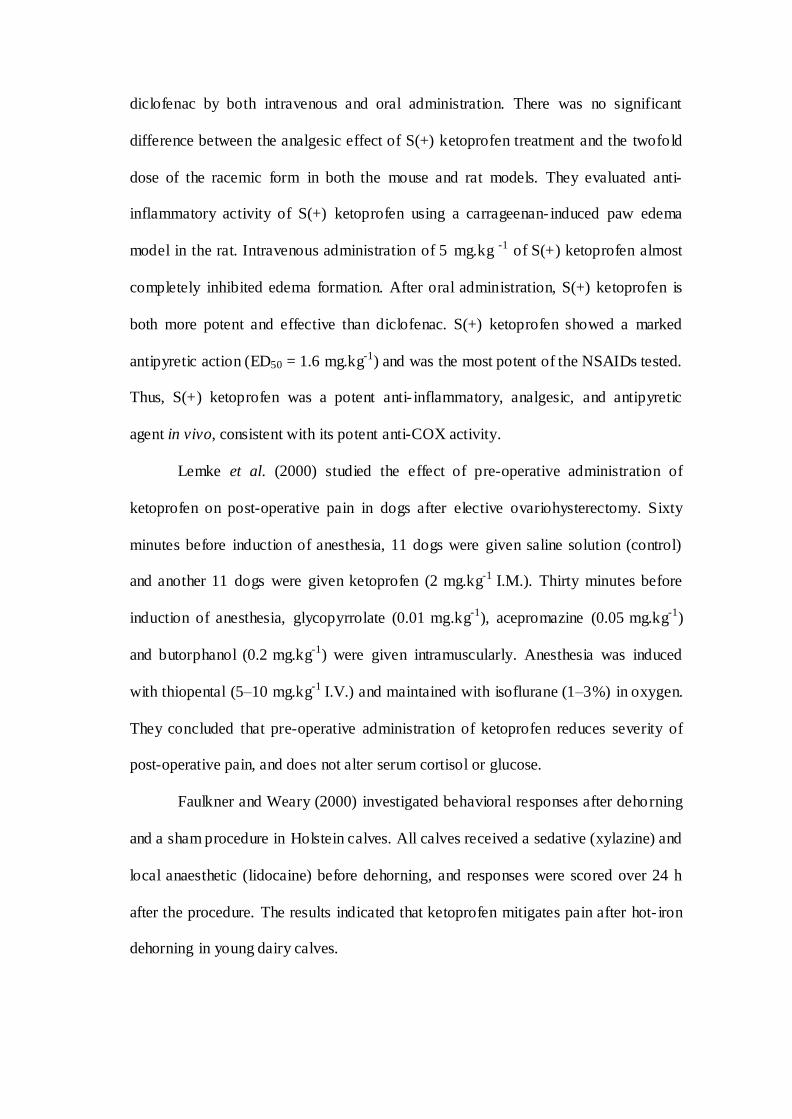
diclofenac by both intravenous and oral administration. There was no significant
difference between the analgesic effect of S(+) ketoprofen treatment and the twofold
dose of the racemic form in both the mouse and rat models. They evaluated anti-
inflammatory activity of S(+) ketoprofen using a carrageenan- induced paw edema
model in the rat. Intravenous administration of 5 mg.kg -1 of S(+) ketoprofen almost
completely inhibited edema formation. After oral administration, S(+) ketoprofen is
both more potent and effective than diclofenac. S(+) ketoprofen showed a marked
antipyretic action (ED50 = 1.6 mg.kg-1) and was the most potent of the NSAIDs tested.
Thus, S(+) ketoprofen was a potent anti- inflammatory, analgesic, and antipyretic
agent in vivo, consistent with its potent anti-COX activity.
Lemke et al. (2000) studied the effect of pre-operative administration of
ketoprofen on post-operative pain in dogs after elective ovariohysterectomy. Sixty
minutes before induction of anesthesia, 11 dogs were given saline solution (control)
and another 11 dogs were given ketoprofen (2 mg.kg-1 I.M.). Thirty minutes before
induction of anesthesia, glycopyrrolate (0.01 mg.kg-1), acepromazine (0.05 mg.kg-1)
and butorphanol (0.2 mg.kg-1) were given intramuscularly. Anesthesia was induced
with thiopental (5–10 mg.kg-1 I.V.) and maintained with isoflurane (1–3%) in oxygen.
They concluded that pre-operative administration of ketoprofen reduces severity of
post-operative pain, and does not alter serum cortisol or glucose.
Faulkner and Weary (2000) investigated behavioral responses after dehorning
and a sham procedure in Holstein calves. All calves received a sedative (xylazine) and
local anaesthetic (lidocaine) before dehorning, and responses were scored over 24 h
after the procedure. The results indicated that ketoprofen mitigates pain after hot- iron
dehorning in young dairy calves.

Earley and Crowe (2002) studied the effects of the ketoprofen alone or with
local anesthesia during castration on cortisol, immune and acute phase responses in
friesian calves. They concluded that surgical castration induced a significant elevation
in cortisol secretion and the rise in cortisol was reduced to control levels by the
administration of ketoprofen but not local anaesthetic. Thus, systemic analgesia using
ketoprofen was more effective than local anesthesia during castration to alleviate the
associated stress response.
Lockwood et al. (2003) studied clinical efficacy of flunixin, carprofen and
ketoprofen as adjuncts to the antibacterial treatment (ceftiofur) of naturally occurring
bovine respiratory disease in beef cattle. They were allocated randomly to four
treatment groups. All the groups received ceftiofur for three days at a dose rate of 1·1
mg.kg-1 by I.M. injection, and three groups received, in addition, a single dose of
either flunixin (2·2 mg.kg-1 by intravenous injection) or ketoprofen (3 mg.kg-1 by
intravenous injection) or carprofen (1·4 mg.kg-1 by subcutaneous injection). During
the first 24 hours of the study, the pyrexia of the three groups treated with a NSAID
was reduced significantly more than the pyrexia of the group treated with ceftiofur
alone, and two and four hours after treatment, the reduction in pyrexia was
significantly greater in the groups treated with flunixin and ketoprofen than in the
group treated with carprofen.
Milligan et al. (2004) experimentally dehorned dairy calves of less than 2
weeks age with (20 calves) or without (20 calves) intramuscular injections of
ketoprofen. All calves received a local anesthetic (lidocaine) prior to dehorning and
were dehorned with heat cauterization. Cortisol concentration was measured via
jugular blood samples taken immediately before dehorning and at 3 and 6 hours
following dehorning. Calf behavior was recorded between 0 and 2, 3 and 5, and 6 and
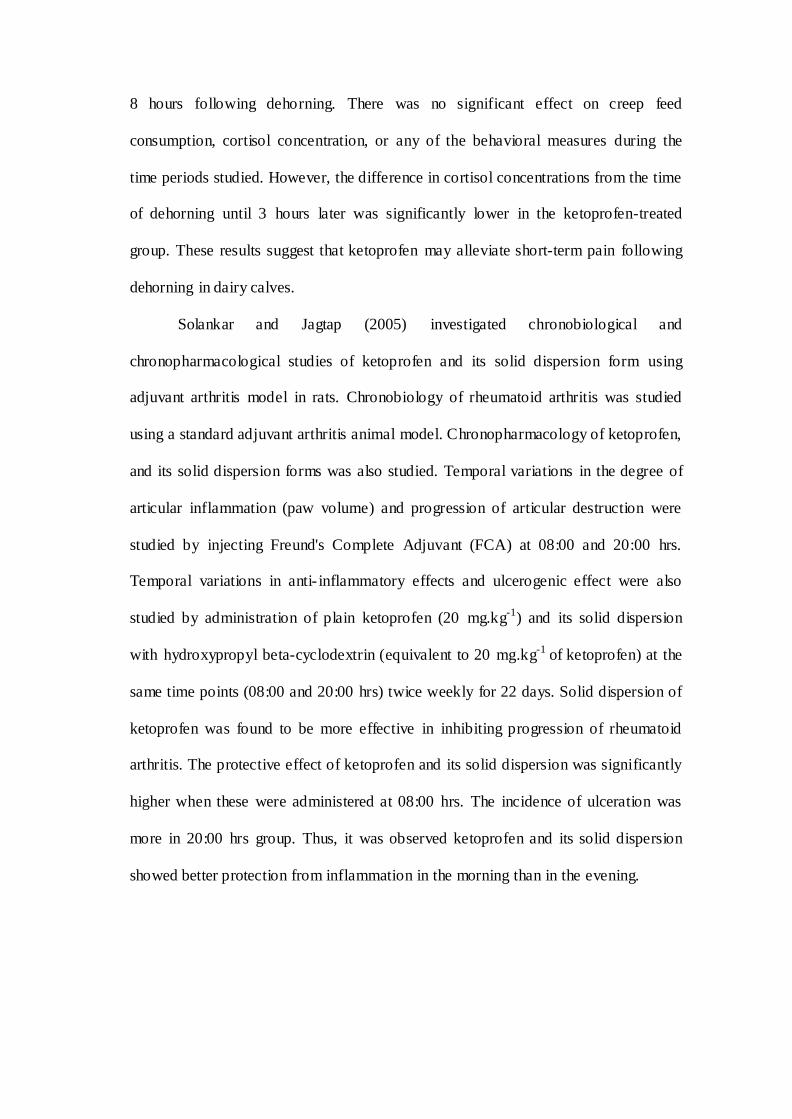
8 hours following dehorning. There was no significant effect on creep feed
consumption, cortisol concentration, or any of the behavioral measures during the
time periods studied. However, the difference in cortisol concentrations from the time
of dehorning until 3 hours later was significantly lower in the ketoprofen-treated
group. These results suggest that ketoprofen may alleviate short-term pain following
dehorning in dairy calves.
Solankar and Jagtap (2005) investigated chronobiological and
chronopharmacological studies of ketoprofen and its solid dispersion form using
adjuvant arthritis model in rats. Chronobiology of rheumatoid arthritis was studied
using a standard adjuvant arthritis animal model. Chronopharmacology of ketoprofen,
and its solid dispersion forms was also studied. Temporal variations in the degree of
articular inflammation (paw volume) and progression of articular destruction were
studied by injecting Freund's Complete Adjuvant (FCA) at 08:00 and 20:00 hrs.
Temporal variations in anti- inflammatory effects and ulcerogenic effect were also
studied by administration of plain ketoprofen (20 mg.kg-1) and its solid dispersion
with hydroxypropyl beta-cyclodextrin (equivalent to 20 mg.kg-1 of ketoprofen) at the
same time points (08:00 and 20:00 hrs) twice weekly for 22 days. Solid dispersion of
ketoprofen was found to be more effective in inhibiting progression of rheumatoid
arthritis. The protective effect of ketoprofen and its solid dispersion was significantly
higher when these were administered at 08:00 hrs. The incidence of ulceration was
more in 20:00 hrs group. Thus, it was observed ketoprofen and its solid dispersion
showed better protection from inflammation in the morning than in the evening.

2.9 Adverse effects of ketoprofen
Adverse effects including gastro- intestinal upset are similar to those of other
NSAIDs. Other side effects, including hepatopathies and renal disease, have been
reported in animals. Due to potential antiplatelet effects, care should be exercised
when using ketoprofen perioperatively (Thompson, 2006).
2.9.1 Gastrointestinal effects:
The most common NSAIDs induced unwanted toxic effect is gastric or
intestinal ulceration that can sometimes be accompanied by anemia from the resultant
blood loss (Gabriel et al., 1991; Figueras et al., 1994). They inhibit gastric acid
secretion and stimulate the production of protective mucous in the stomach and
duodenum. The decrease in prostaglandins caused by NSAIDs may decrease
gastrointestinal cytoprotection, secretion of bicarbonate, and repair of tissue,
eventually leading to vascular compromise in the gastrointestinal mucosa and
subsequent tissue necrosis (Dow et al., 1990).
Collins et al. (1998) tested the effect of ketoprofen, on the upper
gastrointestinal tract (UGIT) in patients with osteoarthritis. The drug was given as
simple ketoprofen and as a slow release preparation. These formulations were
compared with indomethacin for endoscopically proven damage to the UGIT. Both
type of preparations produced similar damage to previously normal UGITs over 56
days; each formulation produced about a 50% incidence of ulceration and
inflammation. Indomethacin, by comparison produced less damage. The results
suggested that the direct action of ketoprofen (barrier breaking effect) adds little to the
mechanism of gastric cytotoxicity of this drug, which may be assumed to be
predominantly caused by a systemic effect of ketoprofen on gastric cytoprotective
mechanisms.

Jerussi et al. (1998) evaluated clinical endoscopy of the gastroduodenal
tolerance to R(-) ketoprofen, R(-) flurbiprofen, racemic ketoprofen, and paracetamol.
Seventy-two healthy male volunteers not receiving NSAIDs, alcohol, or anti-ulcer
drugs, were enrolled in a randomized, investigator-blind, placebo-controlled trial to
evaluate the gastroduodenal tolerance of R(-) ketoprofen 100 mg b.i.d., R(-)
flurbiprofen 100 mg b.i.d., racemic ketoprofen 100 mg b.i.d., and paracetamol 1,000
mg b.i.d. Gastroduodenal endoscopies at baseline and after 25 days of dosing were
used to detect newly occurring hemorrhages and erosions. The incidence of
submucosal hemorrhages was 4/16 in the R(-) ketoprofen group, 5/16 in the R(-)
flurbiprofen group, 12/16 in the racemic ketoprofen group, 1/16 in the paracetamol
group, and 1/8 in the placebo group. The incidence of erosions was 2/16 in the R(-)
ketoprofen group, 4/16 in the R(-) flurbiprofen group, 10/16 in the racemic ketoprofen
group, 0/16 in the paracetamol group, and 2/8 in the placebo group. The differences in
hemorrhages and erosions among treatments were statistically significant. At 100 mg
b.i.d., R(-) ketoprofen caused fewer gastroduodenal hemorrhages and erosions than
racemic ketoprofen. The difference between 100 mg b.i.d. R(-) ketoprofen and 100
mg b.i.d. R(-) flurbiprofen was not statistically significant. The dissociation between
analgesic and anti- inflammatory properties for R(-) ketoprofen suggests that it may
represent a unique analgesic with a favorable safety profile.
Cabre et al. (1998b) examined the intestinal ulcerogenic effects of single oral
doses of S(+) ketoprofen compared with racemic ketoprofen in the small intestine and
cecum of rats. The toxicity in the small intestine was measured as the weight ratio
between portions of intestine showing lesions and the total weight of the tissue.
Toxicity in the cecum was evaluated by measuring the s ize of the ulcers. S(+)
ketoprofen had no significant ulcerogenic effect at 10 or 20 mg.kg-1. However,

racemic ketoprofen was clearly ulcerogenic in the small intestine and cecum at the 40
mg.kg-1 dose. R(-) ketoprofen at 20 mg.kg-1 does not show any effect in the cecum
and only limited ulcerogenesis was observed in the small intestine. The latter effect
may be the result of racemic inversion. Therefore, the ulcerogenic act ion of racemic
ketoprofen was interpreted as a synergism between S(+) and R(-) ketoprofen.
Donnelly et al. (2000) studied dose-dependent effects of ketoprofen on the
human gastric mucosa in comparison with ibuprofen in healthy volunteers. Each
subject took, over four separate 10-day dosing periods, ibuprofen 400 mg t.d.s.,
ketoprofen 12.5 mg t.d.s., ketoprofen 25 mg t.d.s. or ketoprofen 50 mg t.d.s. Mucosal
injury was assessed by endoscopy at baseline and on the 3rd and 10th day of each
dosing period. Ketoprofen 50 mg t.d.s. suppressed prostaglandin synthesis to a
significantly greater extent than ibuprofen and caused significantly more
gastroduodenal injury. The profile of prostaglandin synthesis and injury on ketoprofen
12.5 mg t.d.s. most closely resembled that of ibuprofen 400 mg t.d.s.. They concluded
that ketoprofen 12.5 mg t.d.s. was an appropriate dose for self-medication, which was
likely to be similar to ibuprofen 400 mg t.d.s. in its effects on the stomach and
duodenum.
Narita et al. (2005) investigated the adverse effects of long-term
administration of ketoprofen in dogs. Ketoprofen (1 mg.kg-1) was administered to five
clinically healthy beagle dogs and gelatin capsules (control group) were administered
to four clinically healthy beagle dogs for 30 days. The lesions in the stomach,
especially in the pyloric antrum, and fecal occult blood progressively worsened in the
ketoprofen group. However, the differences between the ketoprofen treated group and
the control group were not statistically significant. One dog in the ketoprofen treated
group temporarily exhibited a decrease in renal plasma flow and two dogs exhibited
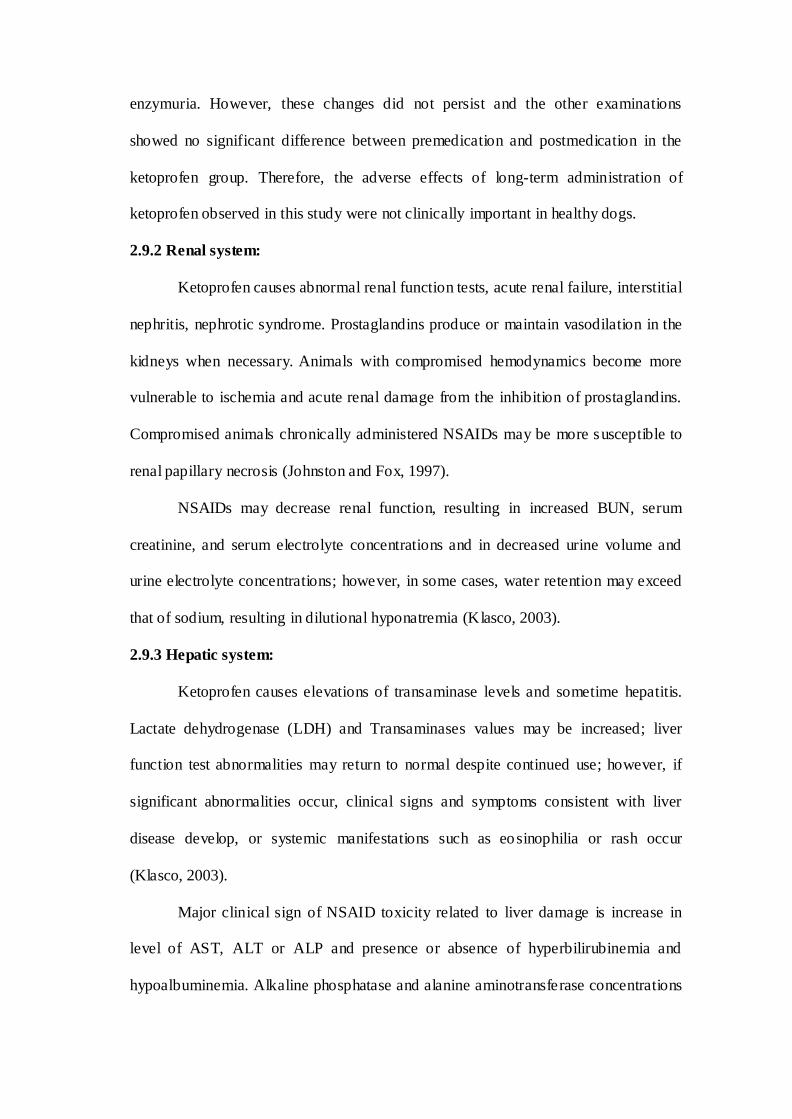
enzymuria. However, these changes did not persist and the other examinations
showed no significant difference between premedication and postmedication in the
ketoprofen group. Therefore, the adverse effects of long-term administration of
ketoprofen observed in this study were not clinically important in healthy dogs.
2.9.2 Renal system:
Ketoprofen causes abnormal renal function tests, acute renal failure, interstitial
nephritis, nephrotic syndrome. Prostaglandins produce or maintain vasodilation in the
kidneys when necessary.
Animals with compromised hemodynamics become more
vulnerable to ischemia and acute renal damage from the inhibition of prostaglandins.
Compromised animals chronically administered NSAIDs may be more susceptible to
renal papillary necrosis (Johnston and Fox, 1997).
NSAIDs may decrease renal function, resulting in increased BUN, serum
creatinine, and serum electrolyte concentrations and in decreased urine volume and
urine electrolyte concentrations; however, in some cases, water retention may exceed
that of sodium, resulting in dilutional hyponatremia (Klasco, 2003).
2.9.3 Hepatic system:
Ketoprofen causes elevations of transaminase levels and sometime hepatitis.
Lactate dehydrogenase (LDH) and Transaminases values may be increased; liver
function test abnormalities may return to normal despite continued use; however, if
significant abnormalities occur, clinical signs and symptoms consistent with liver
disease develop, or systemic manifestations such as eosinophilia or rash occur
(Klasco, 2003).
Major clinical sign of NSAID toxicity related to liver damage is increase in
level of AST, ALT or ALP and presence or absence of hyperbilirubinemia and
hypoalbuminemia. Alkaline phosphatase and alanine aminotransferase concentrations

were significantly increased compared with baseline with meloxicam (0.2 mg.kg-1)
and ketoprofen (2 mg.kg-1) in dogs (Deneuche et al., 2004).
2.9.4 Hypersensitivity reactions:
Ketoprofen causes dermatological reactions such as rash, pruritis, urticaria,
angioedema, respiratory reactions such as asthmatic attack, bronchospasm and
anaphylactic reactions. Prolonged photosensitivity has been often observed in
ketoprofen- induced photocontact dermatitis long after stopping contact to the
causative agent (Fumikazu et al., 2003).
Gregoricka et al. (1990) studied the effect of the intramuscular administration
of ketoprofen in horses. It was administered intramuscularly to evaluate its potential
to induce injection site reactions at the neck and gluteal regions. Forty horses were
divided into 2 test groups; one given single doses, the other multiple doses. Horses in
both groups were observed again at 4 and 7 days following the last injection to assess
any long-term reactions. They concluded that ketoprofen administered
intramuscularly did not produce injection site heat, muscle soreness, or inappetence.
Pyorala et al. (1999) evaluated tissue irritation after intramuscular injections
of 4 nonsteroidal anti- inflammatory agents in 5 lactating cows. Preparations
containing phenylbutazone, flunixin, metamizole and ketoprofen were investigated;
physiological saline was used as a control. Tissue reactions at the injection sites were
examined by palpation and by measuring serum creatine kinase. The metamizole
preparation clearly induced signs of pain in all the cows. After flunixin and
phenylbutazone injections slight reactions were observed, and ketoprofen and saline
did not cause any clinical signs. Some palpation findings after injections were found
for all the preparations except saline. Based on serum creatine kinase, the 2 most
irritating preparations were those containing flunixin and phenylbutazone. After

injections of these 2 substances, the estimated amount of damaged muscle was about
80 g. The statistical difference between flunixin and phenylbutazone and the other 2
preparations was significant. Physiological saline had no effect on serum creatine
kinase.
2.9.5 Haematological and Biochemical Safety Profile:
Jelic-Ivanovic et al. (1985) investigated the in vivo effects of acetylsalicylic
acid (2.7 to 4 g), diclofenac (75-150 mg), indomethacin (75-200 mg), ibuprofen (600-
1600 mg), and ketoprofen (150-200 mg) on the concentrations of various blood
constituents on human patients suffering from rheumatic disorders. Total protein,
glucose, calcium, and inorganic phosphate were not significantly affected by any of
these drugs. Ketoprofen had no definite influence on any constituent.
MacAllister et al. (1993) studied the relative toxicity of phenylbutazone,
flunixin meglumine, and ketoprofen in healthy adult horses. Sixteen horses were
randomly assigned to receive 10 ml of physiologic saline solution, or ketoprofen (2.2
mg.kg-1 of body weight), flunixin meglumine (1.1 mg.kg-1), or phenylbutazone (4.4
mg.kg-1) I.V., every 8 hours, for 12 days. Mean CBC values remained within normal
limits for all groups. Phenylbutazone-treated horses had a significant decrease in
serum total protein and albumin concentrations. Mean values of all other serum
biochemical assays were not different from those of the saline-treated group.
Ketoprofen causes thrombocytopenia, anaemia, agranulocytosis, bone marrow
aplasia and hypocoagulability. Ketoprofen is effective in inhibiting the production of
thromboxane B2, a platelet aggregation promoter (Landoni et al.,1999).
Nazifi et al. (2002) conducted comparative study on the effects of flunixin
meglumine and ketoprofen on haematological and some biochemical parameters of
cattle. Five male cattle were used in the study. Haematocrit decreased and the
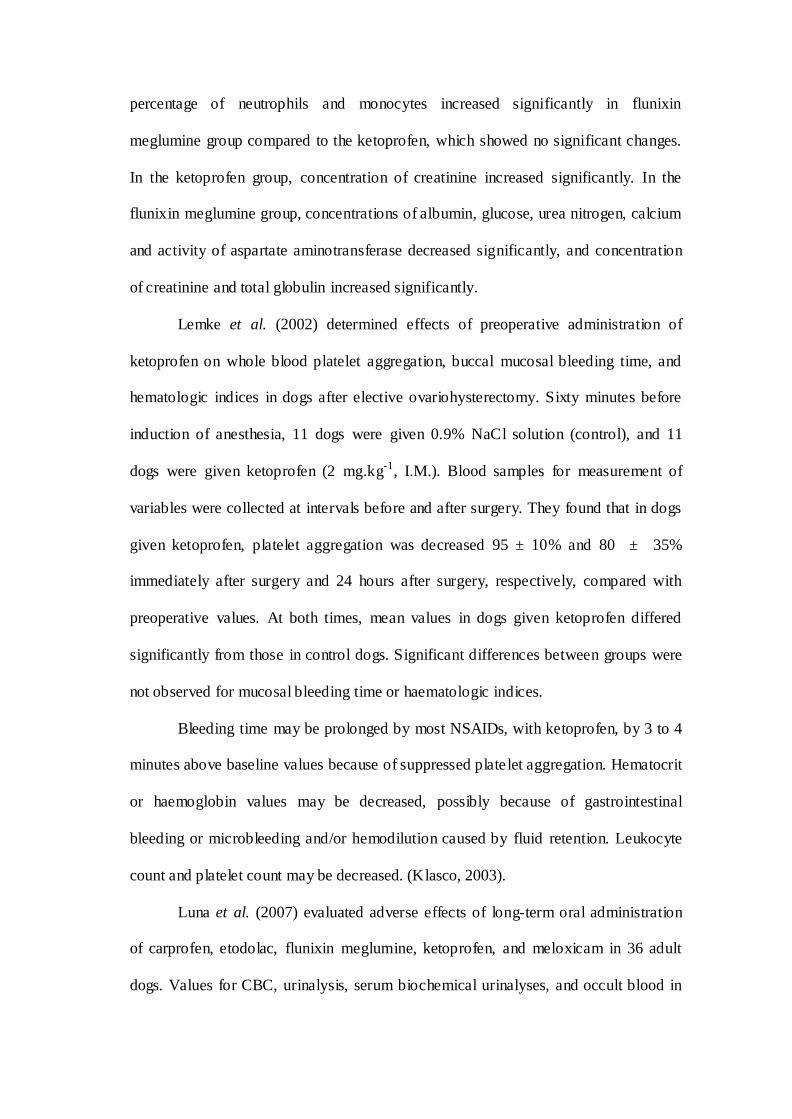
percentage of neutrophils and monocytes increased significantly in flunixin
meglumine group compared to the ketoprofen, which showed no significant changes.
In the ketoprofen group, concentration of creatinine increased significantly. In the
flunixin meglumine group, concentrations of albumin, glucose, urea nitrogen, calcium
and activity of aspartate aminotransferase decreased significantly, and concentration
of creatinine and total globulin increased significantly.
Lemke et al. (2002) determined effects of preoperative administration of
ketoprofen on whole blood platelet aggregation, buccal mucosal bleeding time, and
hematologic indices in dogs after elective ovariohysterectomy. Sixty minutes before
induction of anesthesia, 11 dogs were given 0.9% NaCl solution (control), and 11
dogs were given ketoprofen (2 mg.kg-1, I.M.). Blood samples for measurement of
variables were collected at intervals before and after surgery. They found that in dogs
given ketoprofen, platelet aggregation was decreased 95 ± 10% and 80 ± 35%
immediately after surgery and 24 hours after surgery, respectively, compared with
preoperative values. At both times, mean values in dogs given ketoprofen differed
significantly from those in control dogs. Significant differences between groups were
not observed for mucosal bleeding time or haematologic indices.
Bleeding time may be prolonged by most NSAIDs, with ketoprofen, by 3 to 4
minutes above baseline values because of suppressed plate let aggregation. Hematocrit
or haemoglobin values may be decreased, possibly because of gastrointestinal
bleeding or microbleeding and/or hemodilution caused by fluid retention. Leukocyte
count and platelet count may be decreased. (Klasco, 2003).
Luna et al. (2007) evaluated adverse effects of long-term oral administration
of carprofen, etodolac, flunixin meglumine, ketoprofen, and meloxicam in 36 adult
dogs. Values for CBC, urinalysis, serum biochemical urinalyses, and occult blood in

faeces were investigated before and 7, 30, 60, and 90 days afte r daily oral
administration (n = 6 dogs/group) of lactose (1 mg.kg-1, control treatment), etodolac
(15 mg.kg-1), meloxicam (0.1 mg.kg-1), carprofen (4 mg.kg-1), and ketoprofen (2
mg.kg-1for 4 days, followed by 1 mg.kg-1 daily thereafter) or flunixin (1 mg.kg-1 for 3
days, with 4-day intervals). Gastroscopy was performed before and after the end of
treatment. Gastric lesions were detected in all dogs treated with etodolac, ketoprofen,
and flunixin, and one of six treated with carprofen. At 7 days, bleeding time was
significantly longer in dogs treated with meloxicam, ketoprofen, and flunixin,
compared with control dogs. They concluded that carprofen induced the lowest
frequency of gastrointestinal adverse effects, followed by meloxicam.

Materials and Methods

CHAPTER III
MATERIALS AND METHODS
3.1 Experimental animals:
The present study was carried out on six healthy crossbred (Holstein-Friesian
x Kankrej) male calves, weighing between 60 to 122 kilograms, at Instructional Farm,
College of Veterinary Science and Animal Husbandry, Anand Agricultural
University, Anand. The calves were housed in experimental calf pen having concrete
floor, two weeks before start of experiment for acclimatization to the new
environment. During this period they were kept under observation in order to rule out
the possibility of any disease. The study was undertaken during the months of
September-October when the ambient temperature was recorded between 20-35oC.
The animals were maintained on concentrate, green fodder and dry grass. Water was
provided ad libitum. All essential managemental measures were adopted to keep the
calves free from stress.
3.2 Drugs and Chemicals:
Ketoprofen injection (Neoprofen, Vetnex Ranbaxy Fine Chemicals Limited,
New Delhi, India) was procured from local market. Water, Methanol, Acetonitrile and
Diethyl ether of HPLC grade and Ortho-phosphoric acid and Hydrochloric acid
(analytical grade) were purchased from Merck India Ltd., Mumbai. Sodium hydroxide
pellets and di-sodium hydrogen orthophosphate anhydrous (analytical grade) were
purchased from Qualigens fine chemicals, Mumbai. Ketoprofen technical grade
powder was obtained from Ranbaxy Fine Chemicals Limited, New Delhi.

3.3 Plan of Work:
Pharmacokinetic and safety study was undertaken in three different phases with an
interval of at least fifteen days between two successive phases. Pharmacokinetic
study was planned in a cross over design. Six calves were randomly allocated to
receive the drug by either intravenous or intramuscular injection. Entire study was
carried out as per the plan given in Table 4.
Table 4: Experimental schedule to study pharmacokinetics and safety of ketoprofen in
crossbred calves.
Phase I
Pharmacokinetic study of ketoprofen by intravenous route at the
dose rate of 3 mg.kg-1 body weight in three healthy crossbred
calves (C1, C2 and C3) and pharmacokinetic study of ketoprofen
for intramuscular route at the dose rate of 3 mg.kg-1 body weight
in another three healthy crossbred calves (C4, C5 and C6).
Phase II
Pharmacokinetic study of ketoprofen for intravenous route at the
dose rate of 3 mg.kg-1 body weight in three calves (C4, C5 and
C6) and pharmacokinetic study of ketoprofen for intramuscular
route at the dose rate of 3 mg.kg-1 body weight in others calves
(C1, C2 and C3).
Phase III
Safety study of ketoprofen in all six healthy calves (C1, C2, C3,
C4, C5 and C6) administered Ketoprofen intravenously at the
dose rate of 3 mg.kg-1 body weight repeated at 24 hour intervals
for 5 days.

3.4 Pharmacokinetics of ketoprofen following single dose intravenous and intramuscular administration:
Six male calves numbered C1, C2, C3, C4, C5 and C6 were employed to study
the pharmacokinetics of ketoprofen following single dose intravenous and
intramuscular administration at the rate of 3 mg kg-1 of body weight.
3.4.1 Dosage and administration of ketoprofen:
Ketoprofen (100 mg.ml-1) was administered at the dose rate of 3 mg.kg-1
intravenously through left jugular vein, while intramuscular injection was given in the
lateral deeper neck muscles (just anterior to leading edge of scapula through the
trapezius and serratus ventrallis) using a 20G x 25 mm needle.
3.4.2 Collection of blood samples:
Blood samples (approximately 5 ml) were collected from intravenous catheter
(venflon) fixed into the right jugular vein. Blood samples were collected at 0 time
(just before drug administration), and at 0.033 (2 minute), 0.083 (5 minute), 0.166 (10
minute), 0.25 (15 minute), 0.5 (30 minute), 0.75 (45 minute), 1, 2, 4, 8, 12, 18, and 24
h respectively after intravenous administration. Following intramuscular
administration the blood samples were collected at 0 time (before drug
administration), and at 0.083 (5 minute), 0.166 (10 minute), 0.25 (15 minute), 0.5 (30
minute), 0.75 (45 minutes), 1, 2, 4, 8, 12, 18, 24, and 36 h respectively. The blood
samples were drawn into sterile heparinised centrifuge tubes of 10 ml capacity to
separate the plasma. The blood samples were centrifuged (2000 x g for 15 minutes)
and plasma were taken into separate cryo-vials (2 ml) from all samples. Plasma
samples were stored at – 40oC and were analyzed within two weeks.

3.5 High Performance liquid Chromatography (HPLC) assay of ketoprofen
Ketoprofen concentration was analyzed in plasma as per the method developed by
Wanwimolruk et al. (1991), with minor modifications.
3.5.1 Apparatus:
The high performance liquid chromatography (HPLC) apparatus of Lab
Alliance (USA) was used. It comprised of quaternary gradient delivery pump (model
AIS 2000) and UV detector (model 500). Chromatographic separation was performed
by using reverse phase C18 column (Thermo, 5 ODS; 250 4.6 mm ID) at room
temperature. The data integration was performed using „Clarity‟ (Version 2.4.0.190)
software.
3.5.2 Chromatographic conditions:
The analysis of samples of ketoprofen was performed using mobile phase
consisting of a mixture of acetonitrile-methanol-water (25:25:50, v/v) containing 10
mM Na2HPO4, and adjusted to pH equal to 4.15 with pure orthophosphoric acid.
Mobile phase was filtered by filter assembly using 0.45 filters (PALL Life Sciences,
Mumbai, India) and pumped into column at a flow rate of 1.5 ml.min-1 at room
temperature. The effluent was monitored through UV detector operated at 258 nm
wavelength.
3.5.3 Preparation of standard curve:
Initially, stock solution was prepared by dissolving 0.5 mg of pure ketoprofen
powder in 1 ml methanol. Known concentrations of ketoprofen in plasma were
prepared by diluting the stock standard with drug-free calf plasma. The final

ketoprofen concentrations in plasma were 0.01, 0.05, 0.1, 0.25, 0.5, 1, 2.5, 5, 10, 25
and 50 g.ml-1. Scheme for preparation of standards is shown in table 5.
Calibration curve was prepared using the final dilution in plasma by plotting
the area of curve at the ordinate and the drug concentration at abscissa (Figure 3). The
sensitivity of ketoprofen assay was 0.05 g.ml-1. The assay was sensitive,
reproducible and linearity was observed from 0.05 to 50 g.ml-1. The mean
correlation coefficient (R2) was 0.99945. The lower level of detection (LOD) was
0.05 g.ml-1.
3.5.4 Validation of HPLC method:
Plasma sample (n=5) with the final concentration of 0.05, 1 and 50 μg.ml-1 for
ketoprofen were extracted according to the procedure mentioned above. To fulfill the
requirement of partial validation of modified method, intraday and interday absolute
recovery, precision and accuracy were determined. Precision C.V. % (Co-efficient of
variance) and accuracy of ketoprofen in calf plasma are presented in table 6.
The absolute recovery of recemate ketoprofen was measured by comparison
of the areas of ketoprofen after injection of the extracted sample with those obtained
after injection of the standard solution containing equivalent concentrations of the
drug. The mean recovery of ketoprofen from plasma was 81.45 % at 0.05 μg.ml-1 and
86.23 % at 50 μg.ml-1 (n=5).
Various concentrations of ketoprofen were added into blank plasma (n=5).
Intraday and interday (n=5) precision and accuracy were calculated. At all
concentration studied the precision C.V. was less than 10%. These results indicate
good precision and accuracy of the assay. It also indicates that the method is reliable,
reproducible and accurate.

Table 5: Scheme of preparation of ketoprofen standards in plasma.
0.5 mg Ketoprofen powder + 1 ml Methanol Stock solution (500 μg.ml-1)
Drug free plasma + Solution Final solution (concentration)
1800 μl + 200 μl Stock solution Standard A (50 μg.ml-1)
1000 μl + 1000 μl Standard A Standard B (25 μg.ml-1)
1500 μl + 1000 μl Standard B Standard C (10 μg.ml-1)
1000 μl + 1000 μl Standard C Standard D (5 μg.ml-1)
1000 μl + 1000 μl Standard D Standard E (2.5 μg.ml-1)
1500 μl + 1000 μl Standard E Standard F (1.0 μg.ml-1)
1000 μl + 1000 μl Standard F Sandard G (0.5 μg.ml-1)
1000 μl + 1000 μl Standard G Standard H (0.25 μg.ml-1)
1500 μl + 1000 μl Standard H Standard I (0.10 μg.ml-1)
1000 μl + 1000 μl Standard I Standard J (0.05 μg.ml-1)
800 μl + 1000 μl Standard J Standard K (0.01 μg.ml-1)
Table 6: Intraday and Interday precision and accuracy of ketoprofen in calf
plasma by HPLC - UV detection.
Spiked
concentration (μg.ml-1)
Observed
concentration (μg.ml-1)
Mean ± S.D.
Precision C.V. (%) Accuracy (%)
Intraday (n=5)
0.05 0.046 ± 0.004 8.133 92.800
1 0.964 ± 0.068 7.084 96.400
50 47.098 ± 2.241 4.758 94.196
Inter day (n=5)
0.05 0.049 ± 0.004 7.861 98.400
1 0.948 ± 0.059 6.201 94.800
50 47.636 ± 2.003 4.206 95.272
Accuracy % = (Observed concentration / Spiked concentration) X 100.
Precision C.V. % = (Standard deviation / Mean of observed concentration) X 100.

0
500
1000
1500
2000
2500
3000
3500
4000
4500
5000
5500
6000
6500
0 10 20 30 40 50 60
Ketoprofen concentration in plasma (ug/ml)
Are
a o
f P
eak
(m
Vs)
Figure 3: Standard curve of ketoprofen in calf plasma. Each point represents a mean of six replicates.

3.5.5 Sample preparation
Plasma samples (1 ml) were taken in a centrifuge tube and 100 l of 4-N-HCL
was added in each tube. The contents were then shaken with 7 ml of diethyl ether for
10 minutes. The mixture were centrifuged at 4 0C for 10 minutes at 1500 x g to
separate the phases and upper organic layer was transferred to clean centrifuge tube
containing 200 l of 0.1-M-NaOH. The mixture was shaken for 15 minutes and
centrifuged at 1500 x g at 40 C for 10 minutes. Upper organic layer was discarded by
aspiration and 50 l of 0.5-M-H3PO4 was added to the remaining aqueous phase.
Then the aqueous solution was transferred into a chromatographic vial and 20 µl
injected into HPLC column manually using microliter syringe.
3.6 Pharmacokinetic analysis:
Various pharmacokinetic parameters were calculated from plasma
concentration of ketoprofen by software PK solution (version 2.0) after its single dose
intravenous and intramuscular administration given at the rate of 3.0 mg.kg-1 of body
weight in calves. “PK Solutions 2.0” relies on the use of non-compartmental method
of analysis for the estimation of pharmacokinetic parameters.
3.6.1 Formula used by „PK Solutions 2.0‟ Software for single dose
pharmacokinetics.
3.6.1.1 General Disposition Parameters and Constant
A) Dose Amount: D
B) Exponential Summation: Expression for sum of 1 st order kinetic terms.
(for n exponential terms)
C) Y-Intercept: Coefficient of each exponential term: Cn

D) Slope:
E) Rate constant:
F) Elimination rate constant: z
G) Half- life:
3.6.1.2 Descriptive Curve Parameters
A) C initial: Initial concentration extrapolated to time zero for I.V. dose
B) Cmax (obs) = maximum concentration observed
C) Tmax (obs) = time at maximum concentration observed
3.6.1.3 Curve Area Calculation
A) AUC(0-t) (obs area):
Trapezoid calculation of AUC using observed data points only (not extrapolated
to infinity).
Where, n is the number of data points.
B) AUC (area): Total AUC computed by combining
Where, Cn is the last concentration.

3.6.1.4 Statistical Moment Calculations
A) AUMC (area):
Calculation of total area under the first-moment curve by combining trapezoid
calculation of AUMC (0-t) and extrapolated area
B) MRT (area):
Mean residence time is calculated using trapezoid area calculations extrapolated to
infinity.
Where, both area terms use trapezoidal calculations.
C) MAT (Mean Absorption Time) = MRT i.m. – MRT i.v.
3.6.1.5 Volume of Distribution Calculations
A) Vd(area):
Apparent volume of distribution based on trapezoid AUC (area) and elimination
rate. Applies mainly to I.V., but also to intramuscular if complete absorption
(F=1) is assumed.
B) Vd(area) / kg:
Apparent volume of distribution normalized by animal weight. Uses same
equation as Vd (area).
+

C) Vdss (area):
Apparent volume of distribution at steady state estimated graphically from
trapezoidal total area measurements (Applies to I.V. dose).
3.6.1.6 Systemic Clearance Calculations
A) CL (area):
Systemic clearance based on trapezoid AUC (area). Applies mainly to I.V. data
Limited to oral data only if complete absorption (F=1) is assumed.
B) CL (area) / kg:
Systemic clearance normalized by animal weight.
3.6.1.7 Two-compartment Open Model Micro-constants
A) Kel (or K10): Micro-constant calculated using exponentials (Applies to two
compartment I.V. dose data only).
B) K12: Micro-constant calculated using exponentials. (Applies to two compartment
I.V. dose data only).
C) K21: Micro-constant calculated using exponentials. (Applies to two compartment
I.V. dose data only).

3.6.2 Calculation of Bioavailability (F):
F, the fraction of drug absorbed after intramuscular administration (Wagner, 1967):
AUC (I.M.) X t1/2β (I.V.)
F (%) = X 100
AUC (I.V.) X t1/2β (I.M.)
3.7 The safety study of ketoprofen in calves following repeated intravenous administration
Six healthy male crossbred calves (C1, C2, C3, C4, C5 and C6) were employed
to assess safety of ketoprofen following multiple dose intravenous administration at
the rate of 3 mg.kg-1 of body weight repeated at 24 hour intervals for 5 days. The
animals were observed for any clinical abnormalities during the period of experiment.
Safety of repeated intravenous administration of ketoprofen was assessed by studying
the following parameters.
1. Haematology
2. Serum biochemistry
3.7.1 Collection of blood samples for safety study
Blood samples from calves were withdrawn from jugular vein into sterile
heparinized and non-heparinized test tube at 0 hour (before drug administration) and
at 24, 48, 72, 96, and 120 hours for haematological and serum biochemical analysis.
Blood smears for determination of differential leukocyte count (DLC) were prepared
from fresh blood at the time of blood collection. Blood samples (2 ml) collected in
heparinized test tubes were utilized for haematological evaluation and those collected
in non-heparinized test tubes (5 ml) were allowed to clot at room temperature. Serum
was collected and stored at -20ºC for biochemical analysis.

3.7.2 Haematological evaluation
Blood samples collected in heparinised test tubes and blood smear
prepared at predetermined time intervals during course of experiment were used to
study the following parameters.
1. Haemoglobin
2. Packed cell volume
3. Total leukocyte count
4. Differential leukocyte count
3.7.3 Serum biochemical parameters
Serum from blood samples collected at predetermined time intervals was
used to determine following parameters.
1. Serum alkaline phosphatase (AKP)
2. Serum acid phosphatase (ACP)
3. Serum aspartate aminotransferase (AST) / Serum glutamic-oxaloacetic
transaminase (SGOT)
4. Serum alanine aminotransferase (ALT) / Serum glutamic-pyruvic
transaminase (SGPT)
5. Serum lactate dehydrogenase (LDH)
6. Total serum bilirubin
7. Serum creatinine
8. Blood urea nitrogen
9. Total serum protein
10. Serum albumin
11. Blood glucose

All the biochemical parameters were estimated using standard assay kits
(Anamol Laboratories Pvt. Ltd., Palghar, India) with the help of Clinical Chemistry
Analyzer (Junior Selectra, Vital Scientific, Netherland) at Zhaveri Veterinary Clinical
Complex, Veterinary College, AAU, Anand. Haemoglobin estimation and Total
Leukocyte Count were done by Automated Hematology Analyzer (CA 620 VET,
Boule Medical, Sweden) at Department of Medicine, Veterinary College, AAU,
Anand. Packed Cell Volume and Differential Leukocyte Count were manually carried
out at the Department of Pathology, Veterinary College, AAU, Anand. The methods
employed for determination of various haematological and biochemical indices are
presented in Table 7.
3.7.4 Statistical analysis
The data generated from the safety profile study were compared by Least
Square Difference test using SPSS software (version 12.0.1). All the data are
presented as mean ± S.E.

Table 7: Methods used for the determination of haematological and serum biochemical parameters in safety study.
Sr.
No. Parameter Method
Expression of
result (Unit)
Haematology
1 Haemoglobin Colorimetric Photometer System
(Automated hematology analyzer) g/dl
2 Packed Cell Volume Wintrobe‟s tube method Per cent
3 Total Leukocyte Count Electronic impedance principle
(Automated hematology analyzer) Per cmm
4 Differential Leukocyte
Count Whole blood smear counting method Per cent
Blood Biochemistry
5 Serum Alkaline
Phosphatase (AKP) Kinetic Method using p-nitro
phenylphosphate IU/L
6 Serum Acid Phosphatase
(ACP) Kinetic method using -
Napthylphosphate IU/L
7 Serum Aspartate Aminotransferase
(SGOT/ AST) UV kinetic method IU/L
8 Serum Alanine
Aminotransferase (SGPT /ALT)
UV kinetic method IU/L
9 Serum Lactate
Dehydrogenase (LDH) IFCC method IU/L
10 Total Serum Bilirubin Jendrassik & Grof method mg/dl
11 Serum Creatinine Alkaline picrate initial rate method mg/dl
12 Blood Urea Nitrogen
(BUN) Enzymatic UV-kinetic initial rate
method mg/dl
13 Total Serum Protein Biuret Method gm/dl
14 Serum Albumin BCG Method gm/dl
15 Blood glucose GOD/POD Enzymatic Method mg/dl

Results

CHAPTER IV
RESULTS
The present study was conducted to investigate pharmacokinetics of
ketoprofen in crossbred calves following single intravenous and intramuscular
administration at the dose rate of 3 mg.kg-1 of body weight and to evaluate safety of
repeated administration of ketoprofen. The plasma samples were assayed for
ketoprofen concentration using validated High Performance Liquid Chromatography
(HPLC) assay. Calibration curve prepared from plasma s tandards was used to
determine the concentration of ketoprofen in plasma samples obtained from calves for
kinetic study. Representative chromatograms of drug free plasma and ketoprofen
standard are shown in figure 4 and that of plasma samples after intrave nous and
intramuscular administration of drug are shown in figure 5.
4.1 Plasma levels and pharmacokinetics of ketoprofen following
single dose intravenous administration (3.0 mg.kg-1
of body weight) in crossbred calves.
4.1.1 Plasma levels:
The Plasma levels of ketoprofen as a function of time in healthy calves after
its single intravenous administration at the dose rate of 3 mg.kg-1 of body weight are
given in Table 8. The graphical representation of mean plasma values of ketoprofen is
presented in Figure 6. The mean peak plasma ketoprofen level of 31.63 ± 1.71 g.ml-1
was observed at 0.033 h, which rapidly declined to 4.16 ± 0.19 g.ml-1 at 0.5 h.
Thereafter, the drug concentration in plasma diminished gradually and was not
detectable after 8 h.

(A) (B)
Figure 4: Representative chromatograms of drug free plasma (A) and ketoprofen (KTP) standard (25 µg.ml-1) (B).
Time (min) Time (min)
Voltag
e (m
v.)
Voltag
e (m
v.)
10.4
13, K
TP

(A) (B)
Figure 5: Representative chromatograms of ketoprofen (KTP) plasma samples.
(A) Plasma sample collected at 1 h post intravenous administration of ketoprofen at the dose rate of 3 mg.kg-1 body weight in calf No. 4. (B) Plasma sample collected at 1 h post intramuscular administration of ketoprofen at the dose rate of 3 mg.kg-1 body weight in calf No. 1.
10.4
63, K
TP
10.4
77, K
TP
Time (min) Time (min)
Voltag
e (m
v.)
Voltag
e (m
v.)

Table 8: Plasma concentrations of ketoprofen in calves following intravenous administration of ketoprofen at the dose rate of 3 mg.kg-1 body weight.
Time after drug
adminis-tration
(h)
Plasma concentration (µg.ml-1)
Calf Number Mean
S.E. (n = 6)
C1 C2 C3 C4 C5 C6
0.0333 26.20 28.80 36.90 30.10 36.10 31.70 31.63 ± 1.71
0.0833 14.60 15.50 27.20 21.60 23.60 21.40 20.65 ± 1.97
0.1666 10.20 8.30 14.40 8.90 10.70 13.40 10.98 ± 1.00
0.25 7.20 4.88 6.60 4.84 7.00 6.50 6.17 ± 0.43
0.5 4.36 3.56 4.40 3.60 4.46 4.60 4.16 ± 0.19
0.75 2.74 2.58 2.86 3.12 2.80 2.84 2.82 ± 0.07
1 1.62 1.49 1.45 1.94 1.47 1.69 1.61 ± 0.08
2 0.74 0.68 0.72 0.76 0.78 0.85 0.76 ± 0.02
4 0.34 0.31 0.26 0.35 0.33 0.24 0.31 ± 0.02
8 0.095 0.103 0.091 0.094 0.117 0.088 0.098 ± 0.004
12 ND ND ND ND ND ND ND
ND = Not detectable; under level of detection.

31.63
20.65
10.98
6.17
4.16
2.82
1.61
0.76
0.31
0.098
0.0
0.1
1.0
10.0
100.0
0 1 2 3 4 5 6 7 8 9 10
Time (h)
Pla
sma
ket
opro
fen
con
cen
trat
ion
(u
g/m
l)
Figure 6: Semilogarithmic plot of ketoprofen concentration in plasma versus time following single dose intravenous
administration at the dose rate of 3.0 mg.kg-1
of body weight in calf. Each point represents mean ± S.E of six calves.

4.1.2 Pharmacokinetic studies:
Observed plasma levels of ketoprofen were analyzed by non-compartmental
approach. The detailed pharmacokinetic parameters calculated for calves given single
intravenous dose of 3 mg.kg-1 body weight of ketoprofen are presented in Table 9.
The distribution rate constant () varied from 5.41 to 10.71 h-1 with a mean
of 7.50 ± 0.86 h-1. The distribution half- life (t1/2 ) ranged between 0.07 and 0.13 h
with a mean of 0.10 h. The range of elimination rate constant () was 0.40 to 0.50 h-1
with a mean of 0.45 ± 0.01h-1. The elimination half- life (t1/2 ) ranged from 1.39 to
1.73 h with a mean of 1.55 ± 0.05 h. The elimination rate from the central
compartment (Kel) was calculated to be 3.26 ± 0.24 h-1. The average rates of transfer
of drug from central to the tissue compartment (K12) and tissue to the central
compartment (K21) were calculated to be 3.66 ± 0.60 and 1.04 ± 0.09, respectively.
The mean values of apparent volume of distribution [Vd (area)] and volume of
distribution of drug at steady-state [Vd(ss)]were calculated to be 0.64 ± 0.03 and 0.35 ±
0.02 L.kg-1, respectively. The mean value of total body clearance (ClB) was 4.82 ±
0.16 ml.min-1.kg-1 with a range of 4.45 to 5.43 ml.min-1.kg-1. The average values for
area under plasma drug concentration-time curve (AUC) and area under first moment
of curve (AUMC) were 10.42 ± 0.32 g.h.ml-1 and 12.37 ± 0.38 g.h2.ml-1. The
average value of mean residence time (MRT) was 1.20 ± 0.06 h.

Table 9: Pharmacokinetic parameters of ketoprofen in calves following intravenous administration at the dose rate of 3 mg.kg-1 body weight.
Pharmaco-kinetic
Parameter
Unit
Calf Number Mean
S.E. (n = 6)
C1 C2 C3 C4 C5 C6
Cp0 µg.ml-1 28.40 37.30 36.30 27.40 31.40 44.00 34.13 ± 2.57
A µg.ml-1 25.29 34.56 34.00 24.58 29.04 40.69 31.36 ± 2.53
B µg.ml-1 3.15 2.73 2.33 2.83 2.32 3.32 2.78 ± 0.17
α h-1 7.25 10.71 5.74 6.59 5.41 9.31 7.50 ± 0.86
β h-1 0.47 0.45 0.44 0.45 0.40 0.50 0.45 ± 0.01
t ½ α h 0.10 0.07 0.12 0.11 0.13 0.07 0.10 ± 0.01
t ½ β h 1.47 1.56 1.59 1.54 1.73 1.39 1.55 ± 0.05
AUC µg.h.ml-1 9.90 9.20 11.20 10.20 11.10 10.90 10.42 ± 0.32
AUMC µg.h2.ml-1 12.50 12.10 11.50 12.80 13.90 11.40 12.37 ± 0.38
Kel h-1 2.80 3.99 3.23 2.74 2.81 4.00 3.26 ± 0.24
K12 h-1 3.70 5.97 2.18 3.22 2.23 4.65 3.66 ± 0.60
K21 h-1 1.22 1.20 0.78 1.09 0.77 1.17 1.04 ± 0.09
Vd(area) L.kg-1 0.64 0.73 0.61 0.65 0.68 0.55 0.64 ± 0.03
Vd(ss) L.kg-1 0.38 0.43 0.27 0.37 0.34 0.29 0.35 ± 0.02
ClB ml.min-1. kg-1 5.05 5.43 4.45 4.91 4.51 4.57 4.82 ± 0.16
MRT h 1.30 1.30 1.00 1.30 1.30 1.00 1.20 ± 0.06
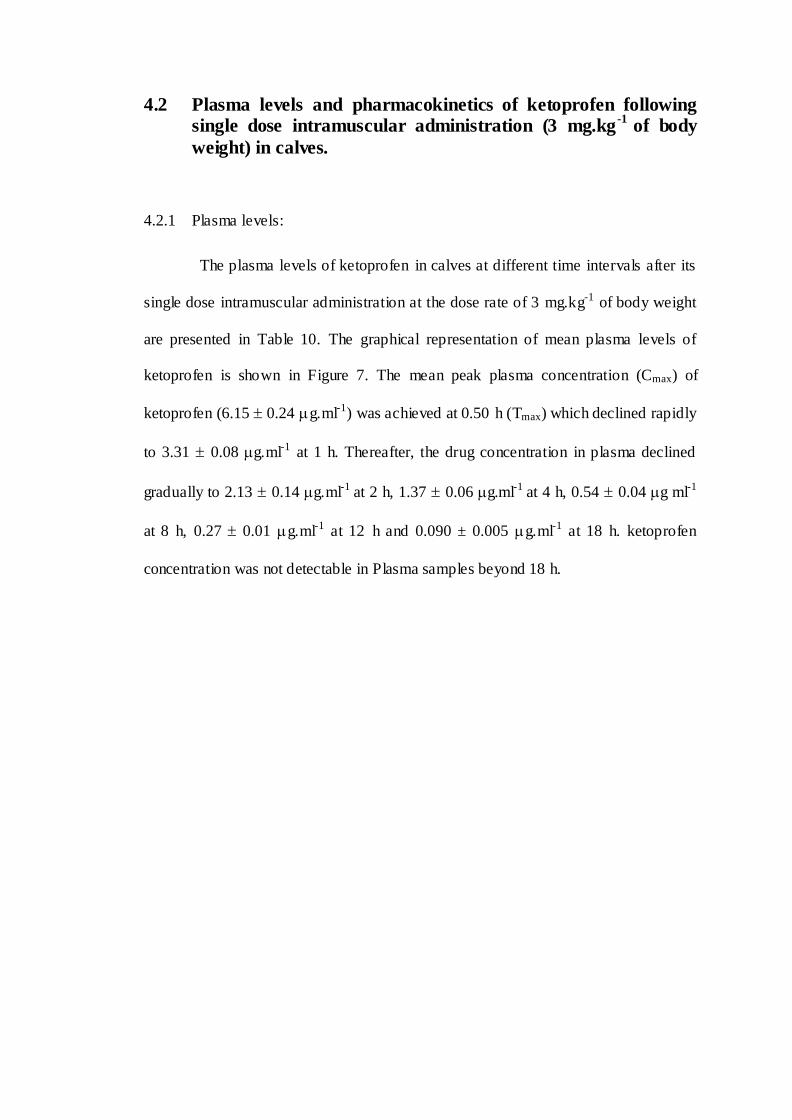
4.2 Plasma levels and pharmacokinetics of ketoprofen following single dose intramuscular administration (3 mg.kg
-1 of body
weight) in calves.
4.2.1 Plasma levels:
The plasma levels of ketoprofen in calves at different time intervals after its
single dose intramuscular administration at the dose rate of 3 mg.kg-1 of body weight
are presented in Table 10. The graphical representation of mean plasma levels of
ketoprofen is shown in Figure 7. The mean peak plasma concentration (Cmax) of
ketoprofen (6.15 0.24 g.ml-1) was achieved at 0.50 h (Tmax) which declined rapidly
to 3.31 0.08 g.ml-1 at 1 h. Thereafter, the drug concentration in plasma declined
gradually to 2.13 0.14 g.ml-1 at 2 h, 1.37 0.06 g.ml-1 at 4 h, 0.54 0.04 g ml-1
at 8 h, 0.27 0.01 g.ml-1 at 12 h and 0.090 ± 0.005 g.ml-1 at 18 h. ketoprofen
concentration was not detectable in Plasma samples beyond 18 h.
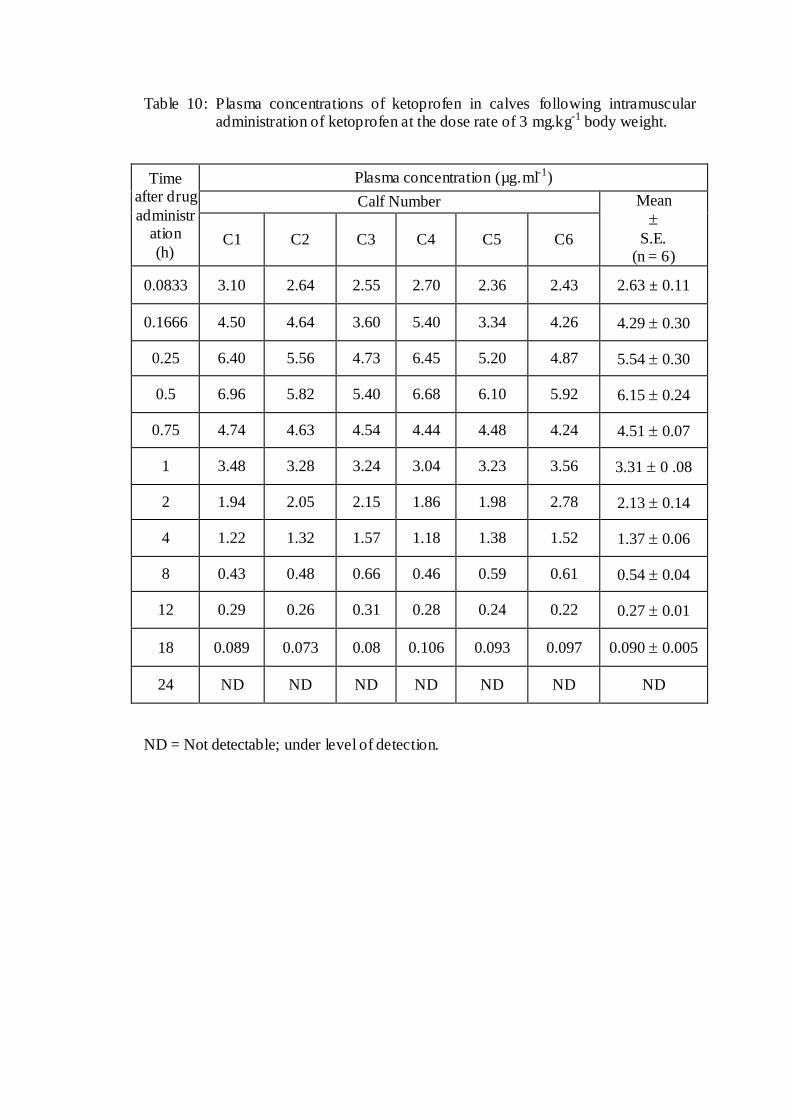
Table 10: Plasma concentrations of ketoprofen in calves following intramuscular administration of ketoprofen at the dose rate of 3 mg.kg-1 body weight.
Time after drug
administration
(h)
Plasma concentration (µg.ml-1)
Calf Number Mean
S.E. (n = 6)
C1 C2 C3 C4 C5 C6
0.0833 3.10 2.64 2.55 2.70 2.36 2.43 2.63 ± 0.11
0.1666 4.50 4.64 3.60 5.40 3.34 4.26 4.29 0.30
0.25 6.40 5.56 4.73 6.45 5.20 4.87 5.54 0.30
0.5 6.96 5.82 5.40 6.68 6.10 5.92 6.15 0.24
0.75 4.74 4.63 4.54 4.44 4.48 4.24 4.51 0.07
1 3.48 3.28 3.24 3.04 3.23 3.56 3.31 0 .08
2 1.94 2.05 2.15 1.86 1.98 2.78 2.13 0.14
4 1.22 1.32 1.57 1.18 1.38 1.52 1.37 0.06
8 0.43 0.48 0.66 0.46 0.59 0.61 0.54 0.04
12 0.29 0.26 0.31 0.28 0.24 0.22 0.27 0.01
18 0.089 0.073 0.08 0.106 0.093 0.097 0.090 0.005
24 ND ND ND ND ND ND ND
ND = Not detectable; under level of detection.

2.63
4.29
5.546.15
4.51
3.31
2.13
1.37
0.54
0.27
0.090
0.0
0.1
1.0
10.0
0 2 4 6 8 10 12 14 16 18 20
Time (h)
Pla
sma
ket
opro
fen
con
cen
trat
ion
(u
g/m
l)
Figure 7: Semilogarithmic plot of ketoprofen concentration in plasma versus time following single dose intramuscular
administration at the dose rate of 3.0 mg.kg-1
of body weight in calf. Each point represents mean ± S.E of six calves.

4.2.2 Pharmacokinetic studies:
Observed plasma levels of ketoprofen were analyzed by non-compartmental
approach. The detailed pharmacokinetic parameters calculated for calves given single
intramuscular dose of 3 mg.kg-1 body weight of ketoprofen are presented in Table 11.
The mean elimination rate constant () was 0.20 ± 0.00 h-1. The
corresponding elimination half- lives were in the range of 3.27 to 3.65 h with an
average of 3.40 ± 0.05 h. The mean area under the plasma concentration-time curve
(AUC), mean area under first moment of curve (AUMC), mean residence time (MRT)
and mean absorption time (MAT) were 17.72 ± 0.39 g.h.ml-1, 74.93 ± 2.02
g.h2.ml-1, 4.22 ± 0.07 h and 3.02 ± 0.10 h, respectively. The volume of distribution
at steady state [Vd(ss)] was 0.72 ± 0.02 L.kg-1. The bioavailability of the ketoprofen
following single dose intramuscular administration ranged from 69.80% to 85.65%
with an average of 77.31 ± 2.23 %. Figure 8 shows the comparative plasma levels of
ketoprofen following single dose intravenous and intramuscular administration at the
dose rate of 3 mg.kg-1 in calves.

Table 11: Pharmacokinetic parameters of ketoprofen in calves following intramuscular administration at the dose rate of 3 mg.kg-1 body weight.
Pharmaco-kinetic
Parameter
Unit
Calf Number Mean
S.E. (n = 6)
C1 C2 C3 C4 C5 C6
β h-1 0.20 0.21 0.21 0.19 0.21 0.21 0.20 ± 0.00
t ½ β h 3.41 3.36 3.36 3.65 3.38 3.27 3.40 ± 0.05
Cmax µg.ml-1 7.00 5.80 5.40 6.70 6.10 5.90 6.15 ± 0.24
Tmax h 0.50 0.50 0.50 0.50 0.50 0.50 0.50 ± 0.00
AUC µg.h.ml-1 17.20 17.00 18.60 16.90 17.40 19.20 17.72 ± 0.39
AUMC µg.h2.ml-1 70.70 68.90 82.00 73.90 75.10 79.00 74.93 ± 2.02
Vd(ss) L.kg-1 0.71 0.71 0.71 0.78 0.74 0.65 0.72 ± 0.02
ClB ml.min-1. kg-1 2.90 2.94 2.69 2.96 2.87 2.61 2.83 ± 0.06
MRT h 4.10 4.00 4.40 4.40 4.30 4.10 4.22 ± 0.07
MAT h 2.80 2.70 3.40 3.10 3.00 3.10 3.02 ± 0.10
F % 75.03 85.65 78.43 69.80 80.35 74.57 77.31 ± 2.23

0.0
0.1
1.0
10.0
100.0
0.0 2.0 4.0 6.0 8.0 10.0 12.0 14.0 16.0 18.0 20.0
Time (hr)
Pla
sma
ket
opro
fen
con
cen
trat
ion
(u
g/m
l)
Intravenous
Intramuscular
Figure 8: Semilogarithmic plot of ketoprofen concentration in plasma versus time following single dose intravenous and
intramuscular administrations at the dose rate of 3.0 mg.kg-1
of body weight in calf. Each point represents mean ±
S.E of six calves.

4.3 Studies on the safety assessment of ketoprofen following multiple dose intravenous administration at the dose rate of 3.0
mg.kg-1
of body weight repeated at 24-hour intervals for five days in crossbred calves.
4.3.1 Effect on haematological parameters
Values of haemoglobin, packed cell volume, total leukocyte count and
differential leukocyte count (neutrophil, lymphocyte, basophil, eosinophil a nd
monocyte) for calves under safety study are presented in tables 12 to 19 and same has
been presented graphically in figures 9 to 12.
The mean values of haemoglobin, packed cell volume, total leukocyte count,
and differential leukocyte count observed in treated animal (24-120 h) do not differ
significantly (P < 0.05) from the corresponding values observed in control (0 h)
animals.
4.3.2 Effect on biochemical parameters
4.3.2.1 Effect on serum enzymes
The values of serum alkaline phosphatase, acid phosphatase, aspartate
aminotransferase, alanine aminotransferase and lactate dehydrogenase of calves under
safety study are presented in tables 20 to 24, respectively and same has been
presented graphically in figures 13 to 17, respectively.
The mean values of serum alkaline phosphatase, acid phosphatase, aspartate
aminotransferase, alanine aminotransferase and lactate dehydrogenase observed at 0 h
and during treatment period (24-120 h) do not differ significantly (P < 0.05) from the
corresponding values observed in control (0 h) animals.
4.3.2.2 Effect on other blood biochemical parameters:
The values of total serum bilirubin, serum creatinine, blood urea nitrogen,
total serum protein, serum albumin and blood glucose of calves under safety study are

presented in tables 25 to 30, respectively and same has been presented graphically in
figures 18 to 23, respectively.
The mean values of total serum bilirubin, serum creatinine, blood urea
nitrogen, total serum protein, serum albumin and blood glucose observed in treatment
animals (24-120 h) did not differ significantly (P < 0.05) from the values of these
blood biochemical parameters observed in control (0 h) animals.

Table 12: Effect of multiple dose intravenous administration of ketoprofen (3 mg.kg-1 of body weight, repeated for 5 days at 24 h intervals) on hemoglobin.
Time of treatment
(hours)
Haemoglobin (g/dl)
Calf Number Mean ± S.E.
(n = 6) C1 C2 C3 C4 C5 C6
0 11.2 10.5 10.7 11.8 11.4 10.1 10.95 ± 0.26
24 11.2 10.8 10.4 11.3 11.2 10.3 10.87 ± 0.18
48 11.3 11.1 10.8 11.6 10.8 10.5 11.02 ± 0.16
72 10.9 10.7 11.2 11.6 11.2 10.3 10.98 ± 0.19
96 10.8 10.6 10.8 12.2 10.7 9.8 10.82 ± 0.32
120 11.1 10.9 10.6 11.9 10.5 10.2 10.87 ± 0.24
Table 13: Effect of multiple dose intravenous administration of ketoprofen (3 mg.kg-1 of body weight, repeated for 5 days at 24 h intervals) on packed cell volume.
Time of treatment (hours)
Packed Cell Volume (%)
Calf Number Mean ± S.E.
(n = 6) C1 C2 C3 C4 C5 C6
0 35 34 34 36 35 34 34.67 ± 0.33
24 34 34 33 35 35 34 34.17 ± 0.31
48 36 35 35 36 34 35 35.17 ± 0.31
72 34 34 35 36 36 35 35.00 ± 0.37
96 34 34 34 37 35 34 34.67 ± 0.49
120 35 35 34 36 35 34 34.83 ± 0.31

0
2
4
6
8
10
12
0 24 48 72 96 120
Treatment hour
Haem
og
lob
in C
on
cen
trati
on
(mg
/dl)
Figure 9: Effect of multiple dose intravenous administration of ketoprofen (3 mg.kg-1 of body weight, repeated for 5 days at 24 h intervals) on hemoglobin.
0
6
12
18
24
30
36
0 24 48 72 96 120
Treatment hour
PC
V (
Perc
en
tag
e)
Figure 10: Effect of multiple dose intravenous administration of ketoprofen (3 mg.kg-1
of body weight, repeated for 5 days at 24 h intervals) on packed cell volume.

Table 14: Effect of multiple dose intravenous administration of ketoprofen (3 mg.kg-1 of body weight, repeated for 5 days at 24 h intervals) on total leukocyte
count.
Time of
treatment (hours)
Total Leukocyte Count (per cmm)
Calf Number Mean ± S.E.
(n = 6) C1 C2 C3 C4 C5 C6
0 7600 8800 9200 7800 8200 8400 8333.33 ± 245.85
24 7700 8700 9100 8200 8500 8400 8433.33 ± 192.64
48 7400 8800 9400 8100 8200 8300 8366.67 ± 276.49
72 7600 9000 9300 8200 8200 8200 8416.67
± 253.53
96 7600 9100 9500 8300 7900 8400 8466.67
± 292.88
120 7700 8900 9500 8300 8000 8500 8483.33
± 263.84
Table 15: Effect of multiple dose intravenous administration of ketoprofen (3 mg.kg-1
of body weight, repeated for 5 days at 24 h intervals) on neutrophil count.
Time of treatment (hours)
Neutrophil (%)
Calf Number Mean ± S.E.
(n = 6) C1 C2 C3 C4 C5 C6
0 24 21 23 25 24 22 23.17 ± 0.60
24 24 24 22 26 24 20 23.33 ± 0.84
48 21 19 24 23 26 23 22.67 ± 0.99
72 23 21 20 24 24 19 21.83 ± 0.87
96 21 23 21 20 23 21 21.50 ± 0.50
120 23 19 22 22 23 21 21.67 ± 0.61
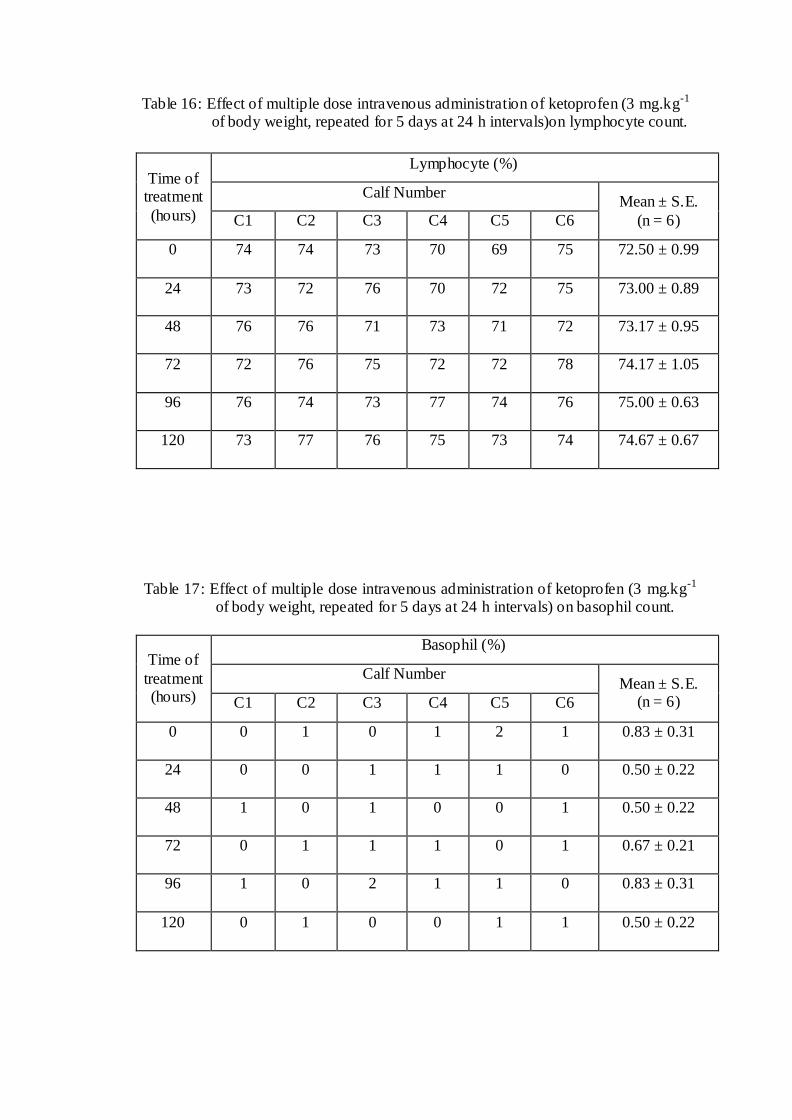
Table 16: Effect of multiple dose intravenous administration of ketoprofen (3 mg.kg-1 of body weight, repeated for 5 days at 24 h intervals)on lymphocyte count.
Time of treatment
(hours)
Lymphocyte (%)
Calf Number Mean ± S.E.
(n = 6) C1 C2 C3 C4 C5 C6
0 74 74 73 70 69 75 72.50 ± 0.99
24 73 72 76 70 72 75 73.00 ± 0.89
48 76 76 71 73 71 72 73.17 ± 0.95
72 72 76 75 72 72 78 74.17 ± 1.05
96 76 74 73 77 74 76 75.00 ± 0.63
120 73 77 76 75 73 74 74.67 ± 0.67
Table 17: Effect of multiple dose intravenous administration of ketoprofen (3 mg.kg-1 of body weight, repeated for 5 days at 24 h intervals) on basophil count.
Time of
treatment (hours)
Basophil (%)
Calf Number Mean ± S.E.
(n = 6) C1 C2 C3 C4 C5 C6
0 0 1 0 1 2 1 0.83 ± 0.31
24 0 0 1 1 1 0 0.50 ± 0.22
48 1 0 1 0 0 1 0.50 ± 0.22
72 0 1 1 1 0 1 0.67 ± 0.21
96 1 0 2 1 1 0 0.83 ± 0.31
120 0 1 0 0 1 1 0.50 ± 0.22

Table 18: Effect of multiple dose intravenous administration of ketoprofen (3 mg.kg-1 of body weight, repeated for 5 days at 24 h intervals) on eosinophil count.
Time of treatment
(hours)
Eosinophil (%)
Calf Number Mean ± S.E.
(n = 6) C1 C2 C3 C4 C5 C6
0 1 2 3 2 3 1 2.00 ± 0.37
24 2 3 1 1 3 3 2.17 ± 0.40
48 2 4 3 3 2 3 2.83 ± 0.31
72 3 2 3 2 3 1 2.33 ± 0.33
96 1 2 2 0 1 1 1.17 ± 0.31
120 2 2 1 2 2 2 1.83 ± 0.17
Table 19: Effect of multiple dose intravenous administration of ketoprofen (3 mg.kg-1 of body weight, repeated for 5 days at 24 h intervals) on monocyte count.
Time of
treatment (hours)
Monocyte (%)
Calf Number Mean ± S.E.
(n = 6) C1 C2 C3 C4 C5 C6
0 1 2 1 2 2 1 1.50 ± 0.22
24 1 1 0 2 0 2 1.00 ± 0.37
48 0 1 1 1 1 1 0.83 ± 0.17
72 2 0 1 1 1 1 1.00 ± 0.26
96 1 1 2 2 1 2 1.50 ± 0.22
120 2 1 1 1 1 2 1.33 ± 0.21
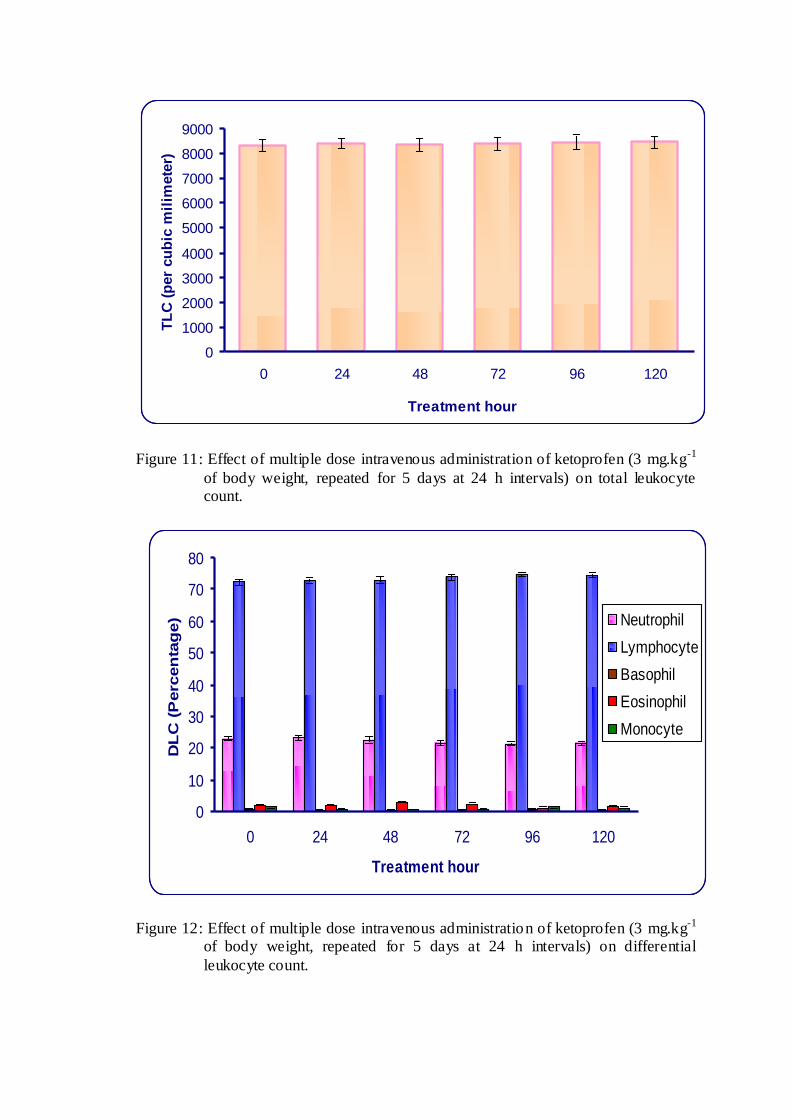
0
1000
2000
3000
4000
5000
6000
7000
8000
9000
0 24 48 72 96 120
Treatment hour
TL
C (
per
cu
bic
mil
imete
r)
Figure 11: Effect of multiple dose intravenous administration of ketoprofen (3 mg.kg-1
of body weight, repeated for 5 days at 24 h intervals) on total leukocyte count.
0
10
20
30
40
50
60
70
80
0 24 48 72 96 120
Treatment hour
DL
C (
Perc
en
tag
e) Neutrophil
Lymphocyte
Basophil
Eosinophil
Monocyte
Figure 12: Effect of multiple dose intravenous administration of ketoprofen (3 mg.kg-1
of body weight, repeated for 5 days at 24 h intervals) on differential
leukocyte count.

Table 20: Effect of multiple dose intravenous administration of ketoprofen (3 mg.kg-1 of body weight, repeated for 5 days at 24 h intervals) on serum alkaline
phosphatase.
Time of
treatment (hours)
Serum Alkaline Phosphatase (IU/L)
Calf Number Mean ± S.E.
(n = 6) C1 C2 C3 C4 C5 C6
0 282.15 258.64 275.27 280.51 257.87 277.81 272.04 ± 4.46
24 291.49 267.31 276.44 278.45 258.56 280.21 275.41 ± 4.62
48 271.75 271.22 282.16 274.56 263.27 282.38 274.22 ± 2.97
72 278.33 268.25 276.98 277.34 256.78 282.65 273.39 ± 3.83
96 286.13 267.56 283.65 282.55 261.18 284.97 277.67 ± 4.31
120 276.67 259.92 281.46 279.21 259.54 287.23 274.01 ± 4.73
Table 21: Effect of multiple dose intravenous administration of ketoprofen (3 mg.kg-1 of body weight, repeated for 5 days at 24 h intervals) on serum acid phosphatase.
Time of treatment (hours)
Serum Acid Phosphatase (IU/L)
Calf Number Mean ± S.E.
(n = 6) C1 C2 C3 C4 C5 C6
0 1.07 2.63 2.4 2.97 0.96 3.02 2.18 ± 0.38
24 1.27 2.83 2.54 2.84 1.37 2.94 2.30 ± 0.31
48 1.24 2.72 2.58 2.63 1.24 3.12 2.26 ± 0.33
72 1.41 2.78 2.72 2.42 1.19 2.88 2.23 ± 0.30
96 2.32 2.58 2.81 2.57 1.26 3.11 2.44 ± 0.26
120 2.06 2.71 2.65 2.63 1.35 3.13 2.42 ± 0.26

0
40
80
120
160
200
240
280
320
0 24 48 72 96 120
Treatment hour
AK
P (
IU/L
)
Figure 13: Effect of multiple dose intravenous administration of ketoprofen (3 mg.kg-1
of body weight, repeated for 5 days at 24 h intervals) on serum alkaline phosphatase.
0.0
0.4
0.8
1.2
1.6
2.0
2.4
2.8
0 24 48 72 96 120
Treatment hour
AC
P (
IU/L
)
Figure 14: Effect of multiple dose intravenous administration of ketoprofen (3 mg.kg-1 of body weight, repeated for 5 days at 24 h intervals) on serum acid
phosphatase.
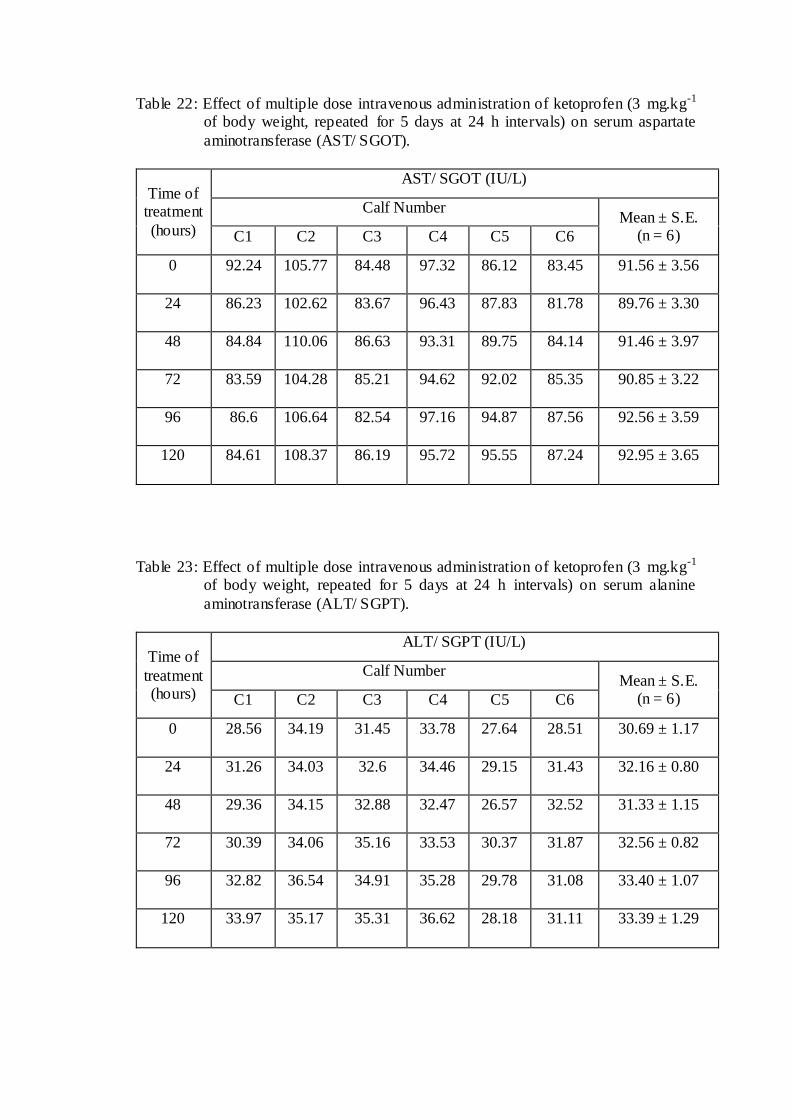
Table 22: Effect of multiple dose intravenous administration of ketoprofen (3 mg.kg-1 of body weight, repeated for 5 days at 24 h intervals) on serum aspartate
aminotransferase (AST/ SGOT).
Time of treatment
(hours)
AST/ SGOT (IU/L)
Calf Number Mean ± S.E.
(n = 6) C1 C2 C3 C4 C5 C6
0 92.24 105.77 84.48 97.32 86.12 83.45 91.56 ± 3.56
24 86.23 102.62 83.67 96.43 87.83 81.78 89.76 ± 3.30
48 84.84 110.06 86.63 93.31 89.75 84.14 91.46 ± 3.97
72 83.59 104.28 85.21 94.62 92.02 85.35 90.85 ± 3.22
96 86.6 106.64 82.54 97.16 94.87 87.56 92.56 ± 3.59
120 84.61 108.37 86.19 95.72 95.55 87.24 92.95 ± 3.65
Table 23: Effect of multiple dose intravenous administration of ketoprofen (3 mg.kg-1
of body weight, repeated for 5 days at 24 h intervals) on serum alanine
aminotransferase (ALT/ SGPT).
Time of
treatment (hours)
ALT/ SGPT (IU/L)
Calf Number Mean ± S.E.
(n = 6) C1 C2 C3 C4 C5 C6
0 28.56 34.19 31.45 33.78 27.64 28.51 30.69 ± 1.17
24 31.26 34.03 32.6 34.46 29.15 31.43 32.16 ± 0.80
48 29.36 34.15 32.88 32.47 26.57 32.52 31.33 ± 1.15
72 30.39 34.06 35.16 33.53 30.37 31.87 32.56 ± 0.82
96 32.82 36.54 34.91 35.28 29.78 31.08 33.40 ± 1.07
120 33.97 35.17 35.31 36.62 28.18 31.11 33.39 ± 1.29

0
10
20
30
40
50
60
70
80
90
100
0 24 48 72 96 120
Treatment hour
AS
T (
IU/L
)
Figure 15: Effect of multiple dose intravenous administration of ketoprofen (3 mg.kg-1 of body weight, repeated for 5 days at 24 h intervals) on serum aspartate aminotransferase (AST/ SGOT).
0
5
10
15
20
25
30
35
40
0 24 48 72 96 120
Treatment hour
AL
T (
IU/L
)
Figure 16: Effect of multiple dose intravenous administration of ketoprofen (3 mg.kg-1
of body weight, repeated for 5 days at 24 h intervals) on serum alanine aminotransferase (ALT/ SGPT).

Table 24: Effect of multiple dose intravenous administration of ketoprofen (3 mg.kg-1 of body weight, repeated for 5 days at 24 h intervals) on serum lactate
dehydrogenase (LDH).
Time of
treatment (hours)
LDH (IU/L)
Calf Number Mean ± S.E.
(n = 6) C1 C2 C3 C4 C5 C6
0 738.56 747.6 787.16 763.25 745.03 721.43 750.51 ± 9.19
24 758.52 751.16 774.72 757.63 728.33 744.36 752.45 ± 6.35
48 767.35 733.62 785.82 762.18 737.15 748.15 755.71 ± 8.11
72 754.39 744.52 783.34 778.14 708.25 731.37 750.00 ± 11.61
96 747.54 726.13 808.34 781.14 760.74 725.65 758.26 ± 13.23
120 762.52 755.21 817.57 775.42 730.45 736.52 762.95 ± 12.85
Table 25: Effect of multiple dose intravenous administration of ketoprofen (3 mg.kg-1 of body weight, repeated for 5 days at 24 h intervals) on total serum bilirubin.
Time of treatment (hours)
Total Serum Bilirubin (mg/dl)
Calf Number Mean ± S.E.
(n = 6) C1 C2 C3 C4 C5 C6
0 0.24 0.32 0.27 0.32 0.28 0.32 0.29 ± 0.01
24 0.26 0.26 0.24 0.26 0.23 0.38 0.27 ± 0.02
48 0.23 0.33 0.26 0.26 0.28 0.31 0.28 ± 0.01
72 0.28 0.35 0.26 0.34 0.27 0.36 0.31 ± 0.02
96 0.28 0.3 0.24 0.37 0.24 0.37 0.30 ± 0.02
120 0.25 0.29 0.28 0.33 0.26 0.35 0.29 ± 0.02
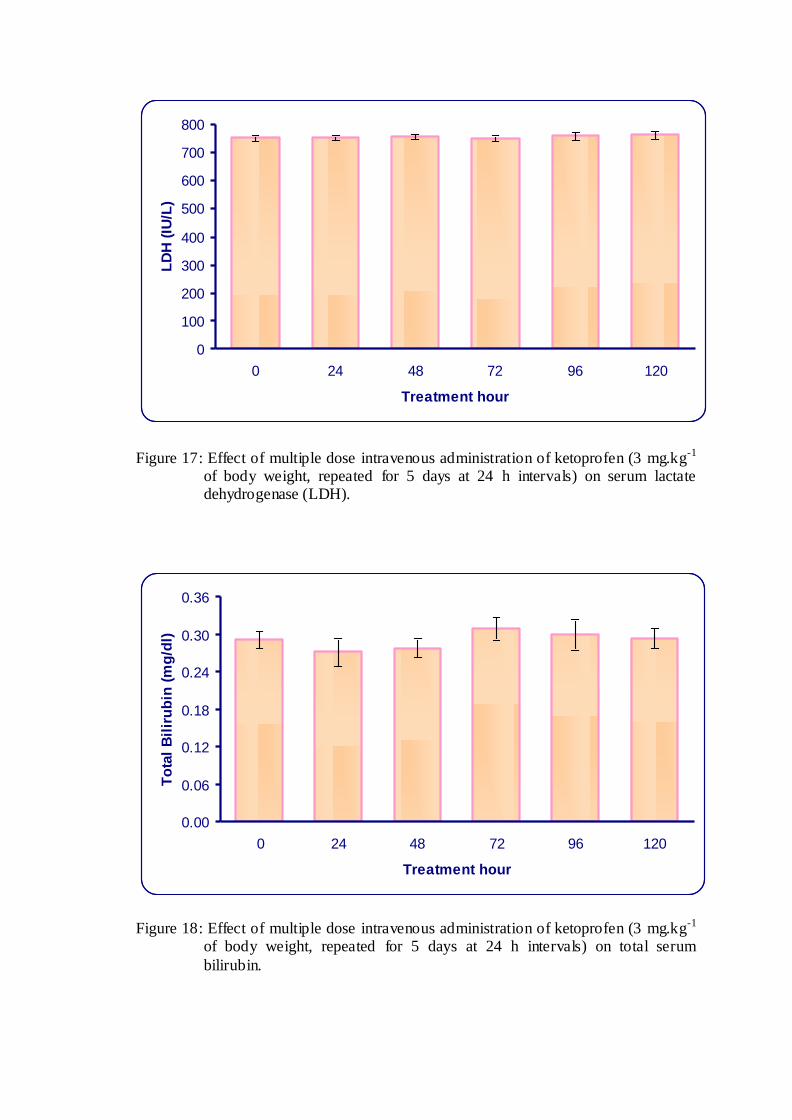
0
100
200
300
400
500
600
700
800
0 24 48 72 96 120
Treatment hour
LD
H (
IU/L
)
Figure 17: Effect of multiple dose intravenous administration of ketoprofen (3 mg.kg-1 of body weight, repeated for 5 days at 24 h intervals) on serum lactate dehydrogenase (LDH).
0.00
0.06
0.12
0.18
0.24
0.30
0.36
0 24 48 72 96 120
Treatment hour
To
tal
Bil
iru
bin
(m
g/d
l)
Figure 18: Effect of multiple dose intravenous administration of ketoprofen (3 mg.kg-1
of body weight, repeated for 5 days at 24 h intervals) on total serum
bilirubin.

Table 26: Effect of multiple dose intravenous administration of ketoprofen (3 mg.kg-1 of body weight, repeated for 5 days at 24 h intervals) on serum creatinine.
Time of treatment
(hours)
Serum Creatinine (mg/dl)
Calf Number Mean ± S.E.
(n = 6) C1 C2 C3 C4 C5 C6
0 1.27 1.13 1.19 1.24 1.14 1.21 1.20 ± 0.02
24 1.25 1.17 1.18 1.19 1.15 1.18 1.19 ± 0.01
48 1.24 1.15 1.16 1.2 1.15 1.23 1.19 ± 0.02
72 1.22 1.21 1.2 1.18 1.19 1.19 1.20 ± 0.01
96 1.19 1.18 1.15 1.17 1.14 1.28 1.19 ± 0.02
120 1.23 1.16 1.2 1.18 1.19 1.23 1.20 ± 0.01
Table 27: Effect of multiple dose intravenous administration of ketoprofen (3 mg.kg-1
of body weight, repeated for 5 days at 24 h intervals) on blood urea nitrogen (BUN).
Time of
treatment (hours)
BUN (mg/dl)
Calf Number Mean ± S.E.
(n = 6) C1 C2 C3 C4 C5 C6
0 16.73 17.46 16.49 18.19 16.54 17.65 17.18 ± 0.28
24 16.87 17.21 18.61 17.64 15.32 17.68 17.22 ± 0.45
48 16.26 17.74 17.88 18.35 16.81 16.83 17.31 ± 0.33
72 16.77 17.39 18.03 17.55 16.38 17.43 17.26 ± 0.24
96 17.29 17.87 18.32 18.08 17.76 18.38 17.95 ± 0.17
120 17.22 17.11 18.17 18.16 17.54 19.12 17.89 ± 0.31

0.0
0.2
0.4
0.6
0.8
1.0
1.2
1.4
0 24 48 72 96 120
Treatment hour
Cre
ati
nin
e (
mg
/dl)
Figure 19: Effect of multiple dose intravenous administration of ketoprofen (3 mg.kg-1 of body weight, repeated for 5 days at 24 h intervals) on serum creatinine.
0
3
6
9
12
15
18
0 24 48 72 96 120
Treatment hour
BU
N (
mg
/dl)
Figure 20: Effect of multiple dose intravenous administration of ketoprofen (3 mg.kg-1
of body weight, repeated for 5 days at 24 h intervals) on blood urea nitrogen (BUN).

Table 28: Effect of multiple dose intravenous administration of ketoprofen (3 mg.kg-1 of body weight, repeated for 5 days at 24 h intervals) on total serum protein.
Time of treatment
(hours)
Total Serum Protein (g/dl)
Calf Number Mean ± S.E.
(n = 6) C1 C2 C3 C4 C5 C6
0 6.8 6.8 6.8 6.3 6.5 6.9 6.68 ± 0.09
24 6.8 6.8 6.8 6.2 6.6 7.1 6.72 ± 0.12
48 6.6 6.9 6.7 6.3 6.6 7.1 6.70 ± 0.11
72 7.0 6.9 6.7 6.3 6.5 7.1 6.75 ± 0.13
96 6.8 6.9 6.7 6.2 6.6 7.2 6.73 ± 0.14
120 6.7 6.9 6.8 6.4 6.6 7.0 6.73 ± 0.09
Table 29: Effect of multiple dose intravenous administration of ketoprofen (3 mg.kg-1 of body weight, repeated for 5 days at 24 h intervals) on serum albumin.
Time of
treatment (hours)
Serum Albumin (g/dl)
Calf Number Mean ± S.E.
(n = 6) C1 C2 C3 C4 C5 C6
0 3.2 3.1 3.1 2.8 2.9 3.3 3.07 ± 0.08
24 3.1 3.2 3.0 2.7 3.0 3.3 3.05 ± 0.08
48 3.0 3.1 2.9 2.7 3.2 3.2 3.02 ± 0.08
72 3.1 3.3 3.1 2.7 3.1 3.4 3.12 ± 0.10
96 3.1 3.1 3.1 2.7 3.1 3.5 3.10 ± 0.10
120 3.2 3.0 3.2 2.8 3.1 3.4 3.12 ± 0.08

0
1
2
3
4
5
6
7
0 24 48 72 96 120
Treatment hour
To
tal
Pro
tein
(g
/dl)
Figure 21: Effect of multiple dose intravenous administration of ketoprofen (3 mg.kg-1 of body weight, repeated for 5 days at 24 h intervals) on total serum protein.
0.0
0.4
0.8
1.2
1.6
2.0
2.4
2.8
3.2
3.6
0 24 48 72 96 120
Treatment hour
Alb
um
in (
gm
/dl)
Figure 22: Effect of multiple dose intravenous administration of ketoprofen (3 mg.kg-1
of body weight, repeated for 5 days at 24 h intervals) on serum albumin.

Table 30: Effect of multiple dose intravenous administration of ketoprofen (3 mg.kg-1 of body weight, repeated for 5 days at 24 h intervals) on blood glucose.
Time of treatment
(hours)
Blood Glucose (mg/dl)
Calf Number Mean ± S.E.
(n = 6) C1 C2 C3 C4 C5 C6
0 62.34 67.65 60.98 64.97 63.88 65.55 64.23 ± 0.97
24 64.49 64.46 63.59 65.15 57.06 66.36 63.52 ± 1.35
48 58.46 69.51 64.64 63.65 62.48 67.14 64.31 ± 1.56
72 67.76 64.68 65.05 59.98 59.24 60.42 62.86 ± 1.41
96 63.81 62.78 66.48 63.47 63.64 68.37 64.76 ± 0.89
120 64.19 66.03 65.78 65.34 62.46 68.58 65.40 ± 0.83

0
10
20
30
40
50
60
70
0 24 48 72 96 120
Treatment hour
Glu
co
se (
mg
/dl)
Figure 23: Effect of multiple dose intravenous administration of ketoprofen (3 mg.kg-1 of body weight, repeated for 5 days at 24 h intervals) on blood glucose.

Discussion
CHAPTER V
DISCUSSION
Pharmacokinetic studies provide highly relevant information on the time
course of drugs and their concentration in the body and are mainly related to the
absorption, distribution, metabolism and elimination of therapeutic agent. It also
studies the relationship of these processes with regards to the intensity and duration of
characteristic effects of drugs. Thus, pharmacokinetic data of a drug provides an
important tool to achieve its effective dosage regimen.
Non-Steroidal Anti Inflammatory Drugs (NSAIDs) have been commonly used
to reduce pain and inflammation in different inflammatory and painful conditions. The
therapeutically effective concentration of NSAIDs are expressed as median effective
concentration (EC50) which must be achieved and maintained at the site of action in
animal body. Thus, a proper dosage regimen should be anticipated on the basis of
kinetic disposition of the drug in the animal body.
Ketoprofen is a promising and safer NSAID for treating various
musculoskeletal disorders including arthritis, other inflammatory and painful
conditions in animals including cattle. Considering this, it is prudent to investigate its
pharmacokinetics in domestic animal species like cattle in local environment, in
which it is to be employed clinically in Veterinary medicine. Therefore, present study
was conducted to determine pharmacokinetic parameters of ketoprofen in calves
following single dose intravenous and intramuscular administration at the dose rate of
3 mg.kg-1. Safety of repeated intravenous ketoprofen administration (3 mg.kg-1) for
five days was also evaluated.

5.1 Plasma levels and pharmacokinetics of single dose intravenous and intramuscular administration of ketoprofen in calves
5.1.1 Plasma levels
For a successful anti- inflammatory therapy, the plasma concentration of an
anti- inflammatory agent should not fall below the median effective concentration
(EC50) for COX-2 inhibition during the course of treatment. It is, therefore,
mandatory to measure the plasma drug concentrations at various time intervals after
the administration of drug. The plasma drug concentrations so determined are utilized
to compute various pharmacokinetic parameters, which are ultimately employed for
the determination of proper dosage regimen of a drug in a particular species for
suitable treatment.
In the present study, ketoprofen was given as a single dose at the rate of 3
mg.kg-1 via I.V. and I.M. routes in crossbred calves. Pharmacokinetic studies of
ketoprofen have been conducted following intravenous administration at the dose rate
of 1.5 mg.kg-1 (Landoni and Lees, 1995a), 3 mg.kg-1 (Landoni et al., 1995), 3.3
mg.kg-1 (De Graves et al., 1996) and 0.5 mg.kg-1 (Igarza et al., 2004) in cattle
including purebred calves, 3 mg.kg-1 (Landoni et al., 1999) in sheep, 2.2 mg.kg-1
(Musser et al., 1998) and 3 mg.kg-1 (Arifah et al., 2003; Pranvendra et al., 2005;
Pravin et al., 2005) in goats, 2.2 mg.kg-1 (Owens et al., 1995a; Sams et al., 1995;
Landoni and Lees, 1996) in horses, 2 mg.kg-1 (Lees et al., 2003) in cat and 2 mg.kg-1
(Alkatheeri et al., 1999; Alkatheeri et al., 2000) in camel. Pharmacokinetic studies of
ketoprofen have been carried out following intramuscular administration at a dose rate
of 3 mg.kg-1 (Pranvendra et al., 2005) in goat and 2 mg.kg-1 (Alkatheeri et al., 2000)
in camel. But, pharmacokinetic data following intramuscular administration of
ketoprofen in calves have not been reported.

In present study, following single dose I.V. administration of ketoprofen at the
dose rate 3 mg.kg-1 of body weight, peak plasma ketoprofen level of 31.63 ± 1.71
µg.ml-1 was obtained at 0.033 h and minimal level of 0.098 ± 0.004 µg.ml-1 was
obtained at 8 h. Ketoprofen concentration in plasma was not detectable after 8 h
following intravenous administration. Peak plasma ketoprofen level of 44 µg.ml-1 was
obtained in calves by Landoni et al. (1995) where as Pranvendra et al. (2005) reported
peak concentration of 18.64 μg.ml-1 obtained at 0.033 h, following I.V. administration
of ketoprofen in goats, which declined to 0.25 μg.ml-1 at 6 h. Pravin et al. (2005)
reported peak plasma concentrations of ketoprofen 9.87 ± 0.48 obtained at 0.042 h.
The drug was detectable up to 6 h in plasma.
Following single dose intramuscular administration in present study, the peak
(Cmax) and minimal detectable levels of 6.15 ± 0.24 and 0.090 ± 0.005 µg.ml-1 of
ketoprofen in calves were found at 0.5 (Tmax) and 18 h, respectively. Ketoprofen
concentration was not detectable in plasma samples beyond 18 h. Peak serum
concentration (12.2 g.ml-1) of ketoprofen at 1.5 h following intramuscular
administration at 2.0 mg.kg-1 dose rate was reported in camel by Alkatheeri et al.
(2005). It is evident from results that the maximum concentration (Cmax) of ketoprofen
in calves is lower than that of camel, however it was achieved faster in calves than
camels. The therapeutically effective concentration of ketoprofen for inhibition of
exudates PGE2 (EC50 for COX-2 inhibition), in calves with the value of 0.086 μg.ml-1
(Landoni et al., 1995), was maintained for up to 18 h. Thus, ketoprofen can be
administered intramuscularly for the effective treatment of arthritis, postoperative
analgesia and as antipyretic in calves.

5.1.2 Pharmacokinetics
Plasma drug concentrations measured at various time intervals in calves
following intravenous and intramuscular administration of racemic ketoprofen (rac-
KTP) in present study were employed for the calculation of absorption and
elimination half lives, apparent volume of distribution, volume of distribution at
steady state, total body clearance, mean residence time and bioavailability. The semi-
logarithmic plot of the plasma drug concentration as a function of time following
single dose intravenous and intramuscular administration of ketoprofen was analyzed
by non-compartmental technique. It was also used by Landoni and Lees (1995b),
Alkatheeri et al. (1999) and Castro et al. (2000) to describe the pharmacokinetic of
ketoprofen in horse, camel and cat, respectively.
Although I.V. is not the most likely route of administration of ketoprofen in
calves, I.V. pharmacokinetic study was performed to establish pharmacokinetic
variables, such as Vdarea, Vdss and ClB. The values of area under the plasma
concentration-time curves obtained after I.V. injection were employed for
determination of bioavailability of ketoprofen following I.M. administration.
The high value of distribution rate constant (α: 7.50 ± 0.86 h-1) and low value
of elimination rate constant (β: 0.45 ± 0.01 h-1) observed in the present study
following single dose intravenous administration of ketoprofen (KTP) indicate that
the drug is rapidly distributed and then relatively slowly eliminated. Similar values of
distribution rate constant for S(+) and R(-) KTP (6.40 and 4.97 h-1, respectively) and
elimination rate constant for S(+) and R(-) KTP (0.882 and 0.592 h-1, respectively)
were reported in horse (Landoni & Lees, 1996). Similar values of distribution rate
constant for S(+) and R(-) KTP (5.226 ± 0.488 and 9.227 ± 3.912 h-1, respectively)
and elimination rate constant for S(+) and R(-) KTP (0.848 ± 0.090 and 0.858 ± 0.111

h-1, respectively) were also reported in sheep (Landoni et al., 1999). However, in
calves faster distribution (33.72 ± 13.54 and 56.57 ± 18.45 h-1, respectively) and
elimination (2.13 ± 0.36 and 2.07 ± 0.34 h-1, respectively) for S(+) and R(-) KTP
were also reported (Landoni et al., 1995). In goats, lower value of distribution rate
constant for S(+) and R(-) KTP (3.90 ± 0.23 and 3.75 ± 0.30 h-1, respectively) but
similar elimination rate constant for S(+) and R(-) KTP (0.45 ± 0.11 and 0.42 ± 0.06
h-1, respectively) was observed (Arifah et al., 2003).
These values indicate that the rate of distribution and rate of elimination of
ketoprofen in calf is identical with horse and sheep and almost same as in goat.
However, differences in these parameters with that reported in calves (Landoni et al.,
1995) may be due to differences in environment, age, breed or pharmacokinetic data
analysis method. A previous report also described the differences in pharmacokinetic
behaviour of ketoprofen in cattle at different age and in different physiological
situations (Igarza et al., 2004).
The distribution half life (t1/2α) of ketoprofen following single dose
intravenous administration in the present study was 0.10 ± 0.01 h which is in close
agreement with distribution half life for S(+) and R(-) KTP (0.10 and 0.09 h,
respectively) reported in horse (Landoni and Lees, 1996), for S(+) and R(-) KTP (both
0.13) reported in sheep (Landoni et al., 1999), for rac-KTP (0.08 ± 0.05) reported in
goat (Musser et al., 1998), for rac-KTP (0.11 ± 0.04 h) in normal horses and (0.09 ±
0.06 h) in horses with acute synovitis (Owens et al., 1995a), and for S(+) and R(-)
KTP (0.18 ± 0.01 and 0.19 ± 0.01 h, respectively) reported in healthy goats (Arifah et
al., 2003). However, distribution half- life of ketoprofen following intravenous
administration was higher for S(+) and R(-) KTP (0.20 ± 0.03 and 0.13 ± 0.01 h,

respectively) reported in horses with acute synovitis in another study (Verde et al.,
2001).
The elimination half life (t1/2 β) of ketoprofen in present study, following single
dose intravenous administration in calves was calculated to be 1.55 ± 0.05 h. This
value is near to the elimination half life for S(+) and R(-) KTP (2.19 ± 0.42 and 1.30 ±
0.27 h, respectively) in calves following intravenous administration (Landoni & Lees,
1995a), for rac-KTP (1.63 h) in mare (Sams et al., 1995), for S(+) and R(-) KTP in
female (1.83 and 1.88 h, respectively) and male (2.33 and 2.11 h, respectively) camel
(Alkatheeri et al., 2000) and for rac-KTP (1.21 h) in goat (Pranvendra et al., 2005).
While shorter elimination half life of 0.42 ± 0.08 and 0.42 ± 0.09 h, respectively for
S(+) and R(-) enantiomers in calves (Landoni et al., 1995), 0.49 h for rac-KTP in
cattle (De Graves et al., 1996), 1.02 ± 0.47 and 0.63 ± 0.29 h, respectively for S(+)
and R(-) enantiomers in horse (Owens et al., 1995a), 0.86 ± 0.08 and 0.87 ± 0.10 h,
respectively for S(+) and R(-) enantiomers in sheep (Landoni et al., 1999) and 0.81 ±
0.02 h for rac-KTP in goat (Pravin et al., 2005) were reported. However, longer
elimination half life for S(+) and R(-) KTP (3.23 ± 1.56 and 1.63 ± 0.34 h,
respectively) in sheep (Landoni et al., 1999) and 4.19 h for rac-KTP in camel
(Alkatheeri et al., 1999) were also reported. Such variations in elimination half- life
might be attributable to interspecies and inter- individual variation.
The elimination half life of ketoprofen following intramuscular administration
in the present study was 3.40 ± 0.05 h. This value closely resembles to the elimination
half life of 3.28 h reported in camel (Alkatheeri et al., 1999) but higher than the value
of 0.46 h as reported in goat (Pranvendra et al., 2005). The longer elimination half- life
of ketoprofen following intramuscular administration observed in the present study
indicates that the drug being continuously absorbed during the elimination phase also.
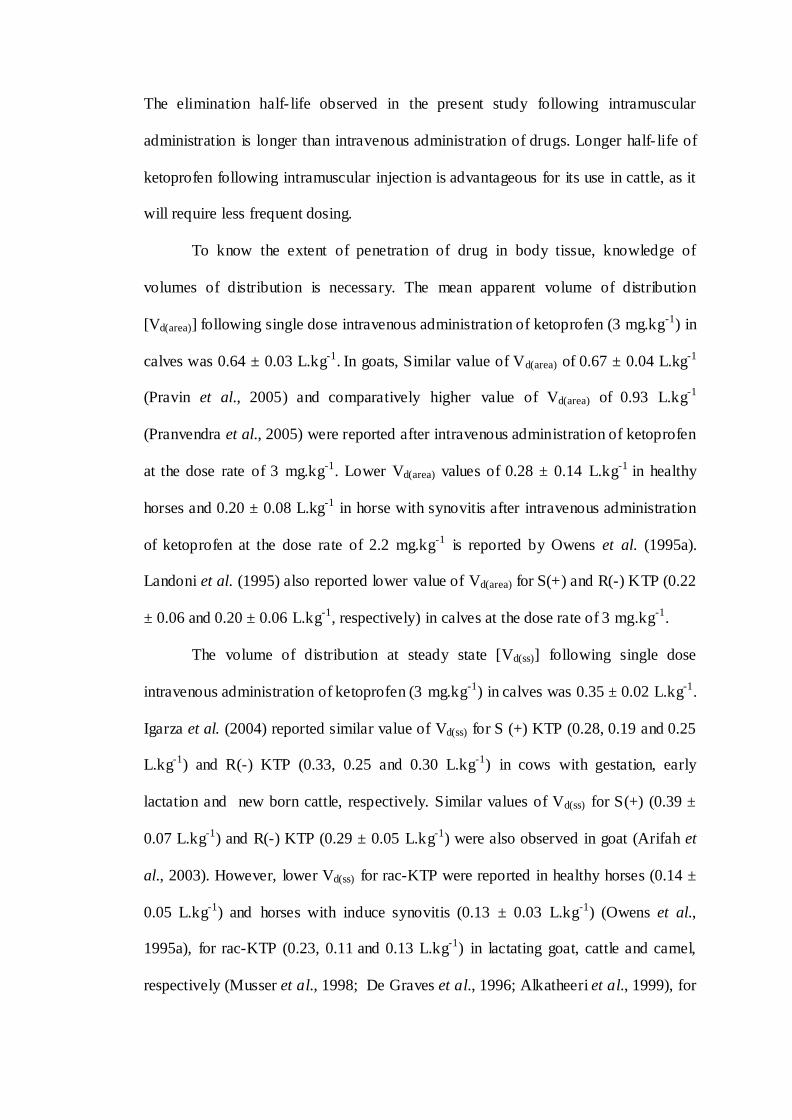
The elimination half- life observed in the present study following intramuscular
administration is longer than intravenous administration of drugs. Longer half- life of
ketoprofen following intramuscular injection is advantageous for its use in cattle, as it
will require less frequent dosing.
To know the extent of penetration of drug in body tissue, knowledge of
volumes of distribution is necessary. The mean apparent volume of distribution
[Vd(area)] following single dose intravenous administration of ketoprofen (3 mg.kg-1) in
calves was 0.64 ± 0.03 L.kg-1. In goats, Similar value of Vd(area) of 0.67 ± 0.04 L.kg-1
(Pravin et al., 2005) and comparatively higher value of Vd(area) of 0.93 L.kg-1
(Pranvendra et al., 2005) were reported after intravenous administration of ketoprofen
at the dose rate of 3 mg.kg-1. Lower Vd(area) values of 0.28 ± 0.14 L.kg-1 in healthy
horses and 0.20 ± 0.08 L.kg-1 in horse with synovitis after intravenous administration
of ketoprofen at the dose rate of 2.2 mg.kg-1 is reported by Owens et al. (1995a).
Landoni et al. (1995) also reported lower value of Vd(area) for S(+) and R(-) KTP (0.22
± 0.06 and 0.20 ± 0.06 L.kg-1, respectively) in calves at the dose rate of 3 mg.kg-1.
The volume of distribution at steady state [Vd(ss)] following single dose
intravenous administration of ketoprofen (3 mg.kg-1) in calves was 0.35 ± 0.02 L.kg-1.
Igarza et al. (2004) reported similar value of Vd(ss) for S (+) KTP (0.28, 0.19 and 0.25
L.kg-1) and R(-) KTP (0.33, 0.25 and 0.30 L.kg-1) in cows with gestation, early
lactation and new born cattle, respectively. Similar values of Vd(ss) for S(+) (0.39 ±
0.07 L.kg-1) and R(-) KTP (0.29 ± 0.05 L.kg-1) were also observed in goat (Arifah et
al., 2003). However, lower Vd(ss) for rac-KTP were reported in healthy horses (0.14 ±
0.05 L.kg-1) and horses with induce synovitis (0.13 ± 0.03 L.kg-1) (Owens et al.,
1995a), for rac-KTP (0.23, 0.11 and 0.13 L.kg-1) in lactating goat, cattle and camel,
respectively (Musser et al., 1998; De Graves et al., 1996; Alkatheeri et al., 1999), for
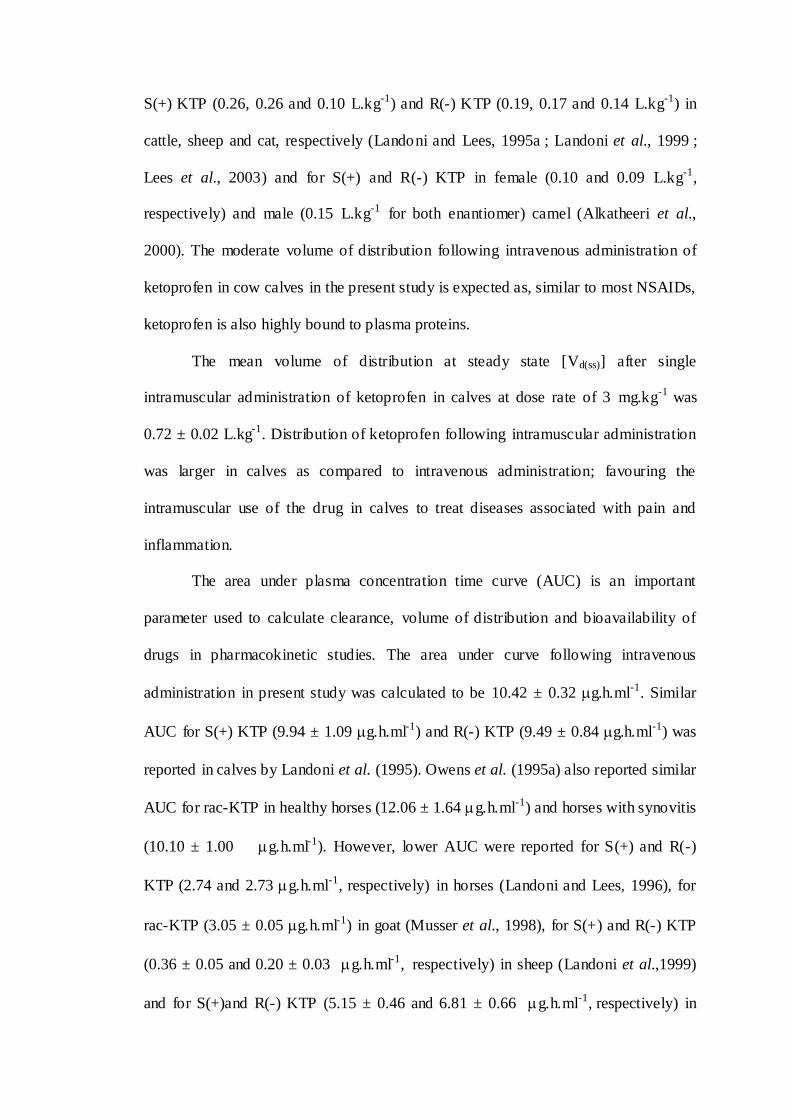
S(+) KTP (0.26, 0.26 and 0.10 L.kg-1) and R(-) KTP (0.19, 0.17 and 0.14 L.kg-1) in
cattle, sheep and cat, respectively (Landoni and Lees, 1995a ; Landoni et al., 1999 ;
Lees et al., 2003) and for S(+) and R(-) KTP in female (0.10 and 0.09 L.kg-1,
respectively) and male (0.15 L.kg-1 for both enantiomer) camel (Alkatheeri et al.,
2000). The moderate volume of distribution following intravenous administration of
ketoprofen in cow calves in the present study is expected as, similar to most NSAIDs,
ketoprofen is also highly bound to plasma proteins.
The mean volume of distribution at steady state [Vd(ss)] after single
intramuscular administration of ketoprofen in calves at dose rate of 3 mg.kg-1 was
0.72 ± 0.02 L.kg-1. Distribution of ketoprofen following intramuscular administration
was larger in calves as compared to intravenous administration; favouring the
intramuscular use of the drug in calves to treat diseases associated with pain and
inflammation.
The area under plasma concentration time curve (AUC) is an important
parameter used to calculate clearance, volume of distribution and bioavailability of
drugs in pharmacokinetic studies. The area under curve following intravenous
administration in present study was calculated to be 10.42 ± 0.32 g.h.ml-1. Similar
AUC for S(+) KTP (9.94 ± 1.09 g.h.ml-1) and R(-) KTP (9.49 ± 0.84 g.h.ml-1) was
reported in calves by Landoni et al. (1995). Owens et al. (1995a) also reported similar
AUC for rac-KTP in healthy horses (12.06 ± 1.64 g.h.ml-1) and horses with synovitis
(10.10 ± 1.00 g.h.ml-1). However, lower AUC were reported for S(+) and R(-)
KTP (2.74 and 2.73 g.h.ml-1, respectively) in horses (Landoni and Lees, 1996), for
rac-KTP (3.05 ± 0.05 g.h.ml-1) in goat (Musser et al., 1998), for S(+) and R(-) KTP
(0.36 ± 0.05 and 0.20 ± 0.03 g.h.ml-1, respectively) in sheep (Landoni et al.,1999)
and for S(+)and R(-) KTP (5.15 ± 0.46 and 6.81 ± 0.66 g.h.ml-1, respectively) in

goat (Arifah et al., 2003). Following intramuscular administration of drug, relatively
higher value of area under curve (AUC) of 17.72 ± 0.39 g.h.ml-1 was reported in
present study, which is higher than the value of 3.97 g.h.ml-1 reported in goats by
Pranvendra et al. (2005). Alkatheeri et al. (1999) reported much higher value of AUC
up to 44 g.h.ml-1 in camel after intramuscular administration (2 mg.kg-1). The
difference in AUC may be due to interspecies variation or differences in dose or
different intramuscular bioavailability.
The total body clearance (ClB) is an important pharmacokinetic parameter that
gives sum of the clearance by each elimination organs. The total body clearance of
ketoprofen in present study following intravenous and intramuscular administration of
drug was 4.82 ± 0.16 and 2.83 ± 0.06 ml.min-1.kg-1, respectively. The value of total
body clearance following intravenous administration observed in the present study is
in agreement with the reported values of 5.50 ± 0.67 and 5.50 ± 0.50 ml.min-1.kg-1,
respectively for S(+) and R(-) KTP in calves (Landoni et al., 1995), 5.85 ± 0.83 and
4.77 ± 0.98 ml.min-1.kg-1 for S(+) KTP and 3.27 ± 0.50 and 3.87 ± 0.50 ml.min-1.kg-1
for R(-) KTP, respectively at the dose rate of 3 and 1.5 mg kg-1 in sheep (Landoni et
al., 1999) and 5.0 ± 0.05 and 3.83 ± 0.02 ml.min-1.kg-1, respectively for S(+) and R(-)
KTP at the dose rate 3 mg.kg-1 in goat (Arifah et al., 2003). However, lower ClB
values of 1.98 ± 0.20 and 2.51 ± 0.60 ml.min-1.kg-1, respectively for S(+) and R(-)
KTP in calves (Landoni and Lees, 1995a), 3.08 ± 0.38 and 3.66 ± 0.39 ml.min-1.kg-1,
respectively in healthy horses and horses with induce synovitis (Owens et al., 1995a)
and 2.8 ml.min-1.kg-1 in cattle (De Graves et al., 1996) were reported where as higher
ClB values of 9.53 and 12.33 ml.min-1.kg-1 in goats were reported by Pravin et al.
(2005) and Musser et al. (1998), respectively.
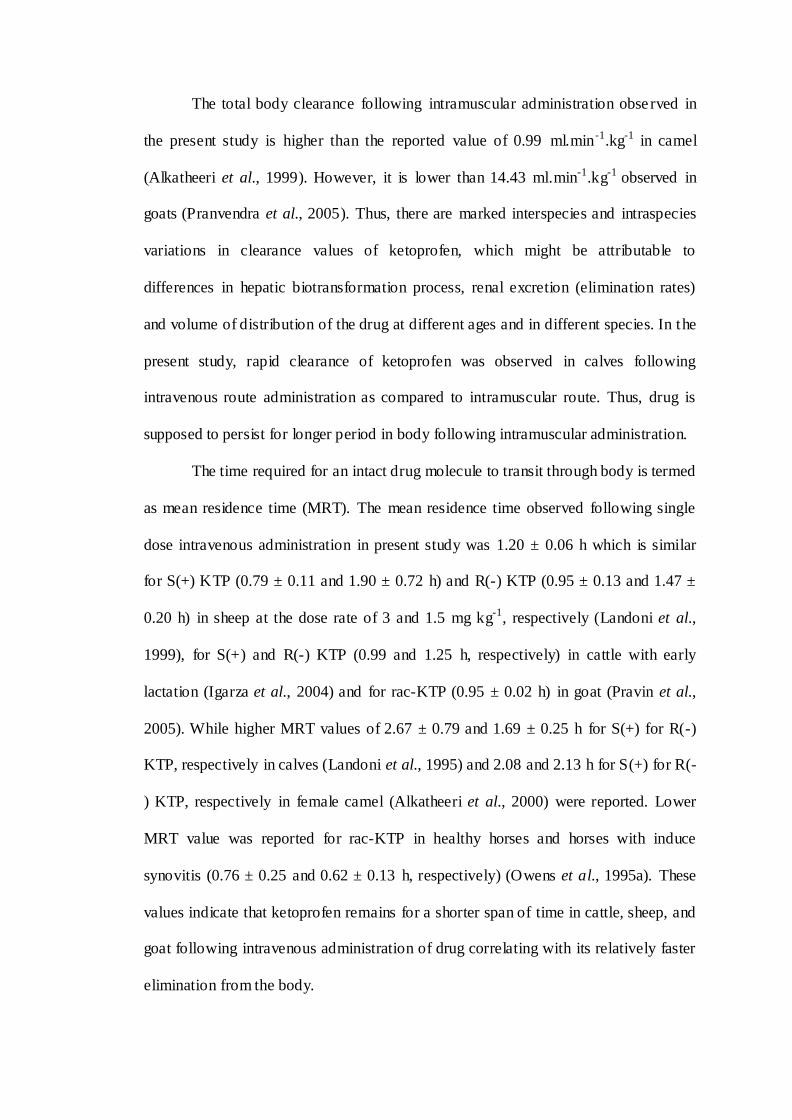
The total body clearance following intramuscular administration obse rved in
the present study is higher than the reported value of 0.99 ml.min-1.kg-1 in camel
(Alkatheeri et al., 1999). However, it is lower than 14.43 ml.min-1.kg-1 observed in
goats (Pranvendra et al., 2005). Thus, there are marked interspecies and intraspecies
variations in clearance values of ketoprofen, which might be attributable to
differences in hepatic biotransformation process, renal excretion (elimination rates)
and volume of distribution of the drug at different ages and in different species. In the
present study, rapid clearance of ketoprofen was observed in calves following
intravenous route administration as compared to intramuscular route. Thus, drug is
supposed to persist for longer period in body following intramuscular administration.
The time required for an intact drug molecule to transit through body is termed
as mean residence time (MRT). The mean residence time observed following single
dose intravenous administration in present study was 1.20 ± 0.06 h which is similar
for S(+) KTP (0.79 ± 0.11 and 1.90 ± 0.72 h) and R(-) KTP (0.95 ± 0.13 and 1.47 ±
0.20 h) in sheep at the dose rate of 3 and 1.5 mg kg-1, respectively (Landoni et al.,
1999), for S(+) and R(-) KTP (0.99 and 1.25 h, respectively) in cattle with early
lactation (Igarza et al., 2004) and for rac-KTP (0.95 ± 0.02 h) in goat (Pravin et al.,
2005). While higher MRT values of 2.67 ± 0.79 and 1.69 ± 0.25 h for S(+) for R(-)
KTP, respectively in calves (Landoni et al., 1995) and 2.08 and 2.13 h for S(+) for R(-
) KTP, respectively in female camel (Alkatheeri et al., 2000) were reported. Lower
MRT value was reported for rac-KTP in healthy horses and horses with induce
synovitis (0.76 ± 0.25 and 0.62 ± 0.13 h, respectively) (Owens et al., 1995a). These
values indicate that ketoprofen remains for a shorter span of time in cattle, sheep, and
goat following intravenous administration of drug correlating with its relatively faster
elimination from the body.

The mean residence time calculated following single dose intramuscular
administration in present study was 4.22 ± 0.07 h. Similar MRT value of 3.77 h was
reported in camel after intramuscular administration at the dose rate of 2 mg.kg-1. The
MRT data indicates that ketoprofen remains for a longer time after intramuscular
administration than intravenous administration in calves.
5.1.3 Systemic Bioavailability
The value of the absolute bioavailability of ketoprofen in calves following
intramuscular administration at the dose rate of 3 mg.kg-1 was 77.31 ± 2.23 percent.
Bioavailability of ketoprofen obtained in the present study is similar to 80.15 percent
reported in goat by Pranvendra et al. (2005) and 71-96 percent in human by Jamali
and Brocks (1990). However, in camel and Japanese quail birds it is reported to be
121.1 and 56 percent, respectively (AlKatheeri et al., 1999; Graham et al., 2005).
There is also wide variation reported in oral bioavailability of ketoprofen in different
animal species like 5.75 to 54.17 percent [S(+) ketoprofen] and 2.67 to 50.50 percent
[R(-) ketoprofen] for different oral formulation in horses (Landoni and Lees, 1995),
90 percent in dogs (Schmitt and Guentert, 1990), 112 percent [S(+) ketoprofen] and
85 percent [R(-) ketoprofen] in cats (Lees et al., 2003) and 24 percent in Japanese
quail (Graham et al., 2005). Good bioavailability (77.31 percent) of ketoprofen and
maintenance of therapeutic concentration up to 18 h following intramuscular injection
suggests that ketoprofen is most suitable for intramuscular administration for the
treatment of painful and inflammatory conditions in cattle.
5.2 Dosage regimen of ketoprofen in crossbred calves
Pharmacokinetic behaviour of ketoprofen varies in different domestic animal
species including cattle. Therefore, the therapeutic dosage regimens of this drug are
needed to be established in cattle by assessing kinetic parameters. The ultimate

objective of a satisfactory dosage regimen of anti- inflammatory, analgesic and anti-
pyretic agents are to maintain the plasma or serum drug level above minimum
effective concentration [EC50] during the treatment. Ketoprofen inhibits both COX-1
and COX-2 with the IC50 ratio (serum TxB2 : exudates PGE2) of 1.37 in cattle.
However, therapeutic effects of NSAIDs are due to inhibition of COX-2 enzyme.
Inhibitory activity of ketoprofen on inflammatory exudate prostaglandin E2 (PGE2) is
considered as measure of COX-2 inhibition. For racemic ketoprofen, the mean EC50
value for inhibition of exudate PGE2 in cattle was 0.086 μg.ml-1 (Landoni et al.,
1995). In the present study, following intramuscular administration, ketoprofen
concentrations in calf plasma were greater than 0.086 g.ml-1 up to 18 h (Table 11).
Thus, COX-2 inhibitory EC50 concentrations persisted up to 18 h in calves after I.M.
injection of ketoprofen at 3 mg.kg-1 body weight. Therefore, ketoprofen given at the
dose rate of 3 mg.kg-1 body weight and repeated at 18 h would be satisfactory dosage
regimen in calves to achieve its therapeutic goals.
5.3 Safety Studies
NSAIDs are routinely employed to treat inflammatory conditions and to
alleviate pain and fever in animals. Prolonged therapy or high dosage regimen
implemented during the treatment may exhibit the toxic effect, if any. Considering
this fact, safety study of a drug is indeed necessary to notify any alteration in the
physiological or biochemical parameters of the body fluid and tissue along with
therapeutic effects. If alterations are very minor, the drug is relatively safe and if
severe, then adverse effects of such drug will observed. As ketoprofen is likely to be
used repeatedly for 3 to 5 days in many cases, its safety assessment is necessary by
evaluating haematological and biochemical parameters.
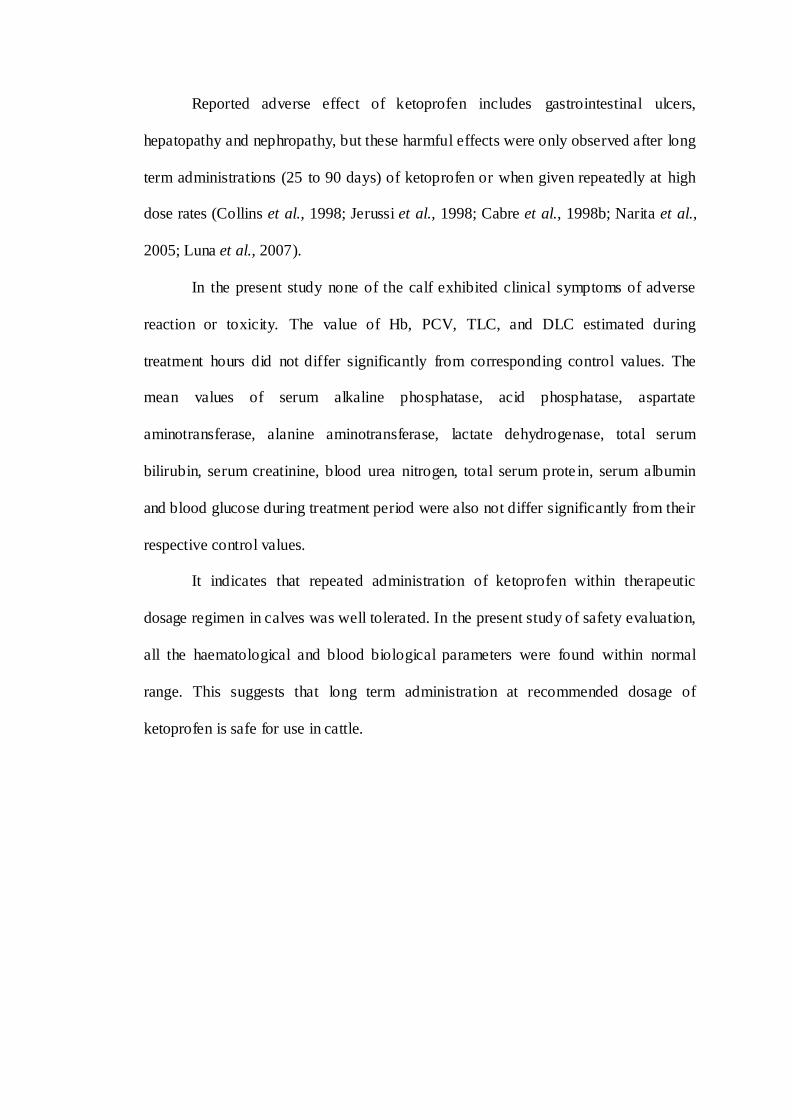
Reported adverse effect of ketoprofen includes gastrointestinal ulcers,
hepatopathy and nephropathy, but these harmful effects were only observed after long
term administrations (25 to 90 days) of ketoprofen or when given repeatedly at high
dose rates (Collins et al., 1998; Jerussi et al., 1998; Cabre et al., 1998b; Narita et al.,
2005; Luna et al., 2007).
In the present study none of the calf exhibited clinical symptoms of adverse
reaction or toxicity. The value of Hb, PCV, TLC, and DLC estimated during
treatment hours did not differ significantly from corresponding control values. The
mean values of serum alkaline phosphatase, acid phosphatase, aspartate
aminotransferase, alanine aminotransferase, lactate dehydrogenase, total serum
bilirubin, serum creatinine, blood urea nitrogen, total serum prote in, serum albumin
and blood glucose during treatment period were also not differ significantly from their
respective control values.
It indicates that repeated administration of ketoprofen within therapeutic
dosage regimen in calves was well tolerated. In the present study of safety evaluation,
all the haematological and blood biological parameters were found within normal
range. This suggests that long term administration at recommended dosage of
ketoprofen is safe for use in cattle.

Summary and
Conclusions
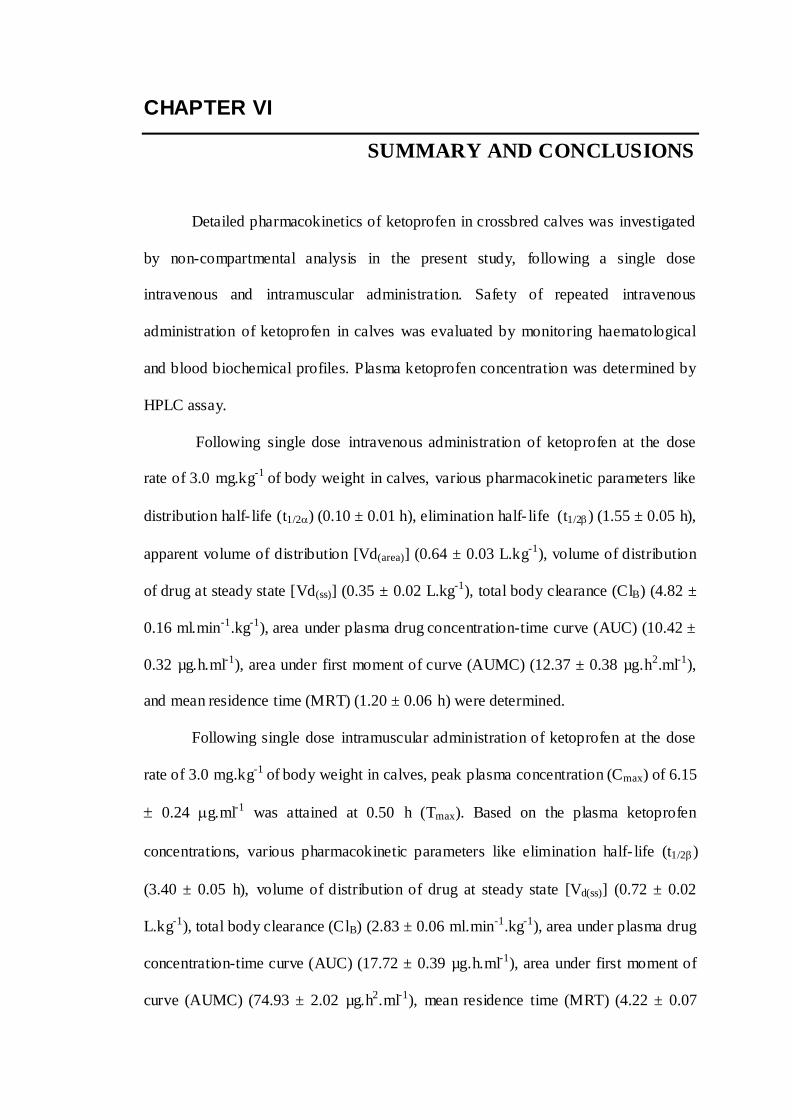
CHAPTER VI
SUMMARY AND CONCLUSIONS
Detailed pharmacokinetics of ketoprofen in crossbred calves was investigated
by non-compartmental analysis in the present study, following a single dose
intravenous and intramuscular administration. Safety of repeated intravenous
administration of ketoprofen in calves was evaluated by monitoring haematological
and blood biochemical profiles. Plasma ketoprofen concentration was determined by
HPLC assay.
Following single dose intravenous administration of ketoprofen at the dose
rate of 3.0 mg.kg-1 of body weight in calves, various pharmacokinetic parameters like
distribution half- life (t1/2) (0.10 ± 0.01 h), elimination half- life (t1/2) (1.55 ± 0.05 h),
apparent volume of distribution [Vd(area)] (0.64 ± 0.03 L.kg-1), volume of distribution
of drug at steady state [Vd(ss)] (0.35 ± 0.02 L.kg-1), total body clearance (ClB) (4.82 ±
0.16 ml.min-1.kg-1), area under plasma drug concentration-time curve (AUC) (10.42 ±
0.32 µg.h.ml-1), area under first moment of curve (AUMC) (12.37 ± 0.38 µg.h2.ml-1),
and mean residence time (MRT) (1.20 ± 0.06 h) were determined.
Following single dose intramuscular administration of ketoprofen at the dose
rate of 3.0 mg.kg-1 of body weight in calves, peak plasma concentration (Cmax) of 6.15
0.24 g.ml-1 was attained at 0.50 h (Tmax). Based on the plasma ketoprofen
concentrations, various pharmacokinetic parameters like elimination half- life (t1/2)
(3.40 ± 0.05 h), volume of distribution of drug at steady state [Vd(ss)] (0.72 ± 0.02
L.kg-1), total body clearance (ClB) (2.83 ± 0.06 ml.min-1.kg-1), area under plasma drug
concentration-time curve (AUC) (17.72 ± 0.39 µg.h.ml-1), area under first moment of
curve (AUMC) (74.93 ± 2.02 µg.h2.ml-1), mean residence time (MRT) (4.22 ± 0.07

h), and mean absorption time (MAT) (3.02 ± 0.10 h) were determined. The
intramuscular bioavailability of ketoprofen in calves was 77.31 ± 2.23 per cent.
Longer elimination half- life, extensive volume of distribution at steady state
and slower total body clearance of ketoprofen following intramuscular administration
as compared to intravenous administration makes it more suitable for intramuscular
use in calves. Furthermore, therapeutically effective concentration (EC50 for COX-2
inhibition) of ketoprofen in calves ( 0.086 g.ml-1) was maintained in plasma up to 8
and 18 hours following intravenous and intramuscular administration, respectively.
Plasma concentration profile also support intramuscular use of ketoprofen in calves
for convenient approach. Therefore, based on observed plasma drug concentration
profile following intramuscular administration, optimal dosage regimen of ketoprofen
would be 3.0 mg.kg-1 repeated at an interval of 18 h.
Safety of repeated intravenous administration of ketoprofen (3.0 mg.kg-1 at 24
h interval for 5 days) was evaluated by means of various haematological (Hb, PCV,
TLC and DLC) and blood biochemical parameters (AKP, ACP, AST, ALT, LDH,
Total Bilirubin, Serum Creatinine, BUN, Total Serum Protein, Serum Albumin and
Blood glucose). All the parameters were found to fluctuate within normal range
during treatment hours and the mean values were not significantly different from
corresponding control hour (0 h) values. No clinical symptoms of adverse reaction or
toxicity were observed throughout this period. Results suggest that repeated use of
ketoprofen at twenty-four hours for five days is safe in calves.

In conclusion, therapeutically effective concentration of ketoprofen was
maintained up to 18 h after intramuscular administration. Observed plasma ketoprofen
concentrations and calculated pharmacokinetic parameters shows suitability of the
drug for intramuscular use in the treatment of diseases associated with pain and
inflammation of calves. Therefore, ketoprofen given intramuscularly at the dose rate
of 3 mg.kg-1 body weight and repeated at 18 h would be satisfactory dosage regimen
in calves to achieve its therapeutic goals. The systemic bioavailability of ketoprofen
following intramuscular administration in the calves was 77.31 per cent. Ketoprofen
(3 mg.kg-1) was found safe, following repeated intravenous administration for five
days at twenty-four hour interval, based on evaluation of the hematological and
biochemical parameters.

References

REFERENCES
Abas, A. and Meffin, P.J. (1987). Enantioselective disposition of 2-arylpropionic acid
non-steroidal anti- inflammatory drugs. IV. Ketoprofen disposition. J.
Pharmacol. Exp. Ther., 240(2): 637-641.
Aberg, G.; Ciofalo, V.B.; Pendleton, R.G.; Ray, G. and Weddle, D. (1995). Inversion
of R(-) to S(+) ketoprofen in eight animal species. Chirality, 7(5): 383-387.
Alkatheeri, N.A.; Wasfi, I.A. and Lambert, M. (1999). Pharmacokinetics and
metabolism of ketoprofen after intravenous and intramuscular administration
in camels. J. Vet. Pharmacol. Ther., 22(2): 127-135.
Alkatheeri, N.A.; Wasfi, I.A.; Lambert, M.; Saeed, A. and Khan, I.A. (2000).
Pharmacokinetics of ketoprofen enantiomers after intravenous administration
of racemate in camels: effect of gender. J. Vet. Pharmacol. Ther., 23(3): 137-
143.
Altman, R.D.; Honig, S.; Levin, J.M. and Lightfoot, R.W. (1988). Ketoprofen versus
indomethacin in patients with acute gouty arthritis: a multicenter, double blind
comparative study. J. Rheumatol., 15: 1422-1426.
Anfossi, P.; Villa, R.; Montesissa, C. and Carli, S. (1997). Intramuscular
bioavailability of ketoprofen lysine salt in horses. Vet. Q., 19(2): 65-68.
Arifah, A.K.; Landoni, M.F.; Frean, S.P. and Lees, P. (2001). Pharmacodynamics and
pharmacokinetics of ketoprofen enantiomers in the sheep. Am. J. Vet. Res.,
62(1): 77-86.
Arifah, A.K. and Lees, P. (2002). Pharmacodynamics and pharmacokinetics of
phenylbutazone in calves. J. Vet. Pharmacol. Ther., 25(4): 299-309.
Arifah, A.K.; Landoni, M.F. and Lees, P. (2003). Pharmacodynamic, chiral
pharmacokinetic and PK-PD modeling of ketoprofen in the goat. J. Vet.
Pharmacol. Ther., 26(2): 139-150.
Arrioja, D.A. (2002). Anafen Injection (large animal) and Anafen Injection and
Tablets (small animal) (Merial-Canada). Compendium of veterinary products,
CD ed. Port Huron, MI: North American Compendiums.

Baggot, J.D. (1977). In: Principles of Drug Disposition in Domestic Animals: The
Basis of Veterinary Clinical Pharmacology. 1 st Ed., W.B. Saunders Co.,
Philadelphia, U.S.A, pp. 144-189.
Baggot, J.D. (1995). Pharmacokinetics: Disposition and fate of drugs in the body. In:
Veterinary Pharmacology and Therapeutics (Edi. Adams, H.R.). 7 th Ed., Lowa
State University Press. Ames, pp. 18-52.
Boothe, D.M. (2001). The analgesic, antipyretic, anti- inflammatory drugs. In:
Veterinary Pharmacology and Therapeutics (Edi. Adams, H.R.). 8 th Ed., Lowa
State University Press. Ames, pp. 433-451.
Burr, J.L.; Baynes, R.E.; Smith,G. and Riviere, J.E. (2006). Pharmacokinetics of
flunixin meglumine in swine after intravenous dosing. J. Vet. Pharmacol.
Ther., 29(5): 437-440.
Cabre, F.; Fernandez, M.F.; Calvo, L.; Ferrer, X.; Garcia, M.L. and Mauleon, D.
(1998a).
Analgesic, antiinflammatory, and antipyretic effects of S(+) ketoprofen in
vivo. J. Clin. Pharmacol., 38: S3-10.
Cabre, F.; Fernandez, M.F.; Zapatero, M.I.; Arano, A.; Garcia, M.L. and Mauleon D.
(1998b). Intestinal ulcerogenic effect of S(+) ketoprofen in the rat. J. Clin.
Pharmacol., 38: 27S-32S.
Caldwell, J.; Hutt, A.J. and Fournel-Gigleux, S. (1988). The metabolic chiral
inversion and disposition of the 2-arylpropionic acids and their biological
consequences. Biochemical pharmacol., 37: 105-114.
Castro, E.; Soraci, A.; Fogel, F. and Tapia, O. (2000). Chiral inversion of R(–)
fenoprofen and ketoprofen enantiomers in cats. J. Vet. Pharmacol. Ther., 23:
265-271.
Chan, K.K.H. and Gibaldi, M. (1982). Estimation of statistical moments and steady
state volume of distribution for a drug given a by intravenous infusion. J.
Pharmacokinet. Biopharm., 10: 551-558.
Chandrasekharan, N.V., Hu Dai, K., Roos, L.T., Evanson, N.K., Tomsik, J., Elton,
T.S. and Simmons, D.L. (2002). COX-3, a cyclooxygenase-1 variant inhibited
by acetaminophen and other analgesic/antipyretic drugs: cloning, structure and
expression. Proceedings of the National Academy of Sciences, 99: 13926–
13931.

Collins, A.J.; Davis, J. and Dixon, A.S.J. (1998). A prospective endoscopic study of
the effect of orudis and oruvail on the upper gastrointestinal tract, in patients
with osteoarthritis. Br. J. Rheumatol., 27:106-109.
Corveleyn, S.; Henrist, D.; Van der Weken, G.; Baeyens, W. and Remon, J.P. (1996).
Bioavailability of ketoprofen in horses after rectal administration. J. Vet.
Pharmacol. Ther., 19(5): 359-363.
Cutler, D.J. (1978). Theory of the mean absorption time, an adjunct to conventional
bioavailability studies. J. Pharm. Pharmacol., 30: 476-478.
Davis, J.L.; Papich, M.G.; Morton, A.J.; Gayle, J.; Blikslager, A.T. and Campbell,
N.B. (2007). Pharmacokinetics of etodolac in the horse following oral and
intravenous administration. J. Vet. Pharmacol. Ther., 30(1): 43-48.
De Graves, F.J.; Riddell, M.G. and Schumacher, J. (1996). Ketoprofen concentrations
in plasma and milk after intravenous administration in dairy cattle. Am. J. Vet.
Res., 57(7): 1031-1033.
De Graves, F.J.; Ravis, W.R.; Johansen, D.; Campbell, J.D. and Duran, S.H. (1998).
Stereospecific pharmacokinetics of free and protein-bound ketoprofen in
serum and synovial fluid of horses after intravenous and intramuscular
administration. Am. J. Vet. Res., 59(6): 739-743.
De Ruiter, J. (2002). Non-Steroidal Antiinflammatory Drugs (NSAIDs). In: Principles
of Drug Action: 2. (http://www.duc.auburn.edu/~deruija/nsaids_2002.pdf.
:accessed and downloaded from website on 31-01-2008).
Delbeke, F.T.; Baert, K. and De Backer, P. (1998). Disposition of human drug
preparations in the horse. VI. Tiaprofenic acid. J. Chromatography B, 701(1-
2): 207-214.
Deneuche, A.J.; Dufayet, C.; Goby, L.; Fayolle, P. and Desbois, C. (2004). Analgesic
comparison of meloxicam or ketoprofen for orthopedic surgery in dogs. Vet.
Surgery, 33(6): 650-660.
Dolan, S.; Kelly, J.G.; Huan, M. and Nolan, A.M. (2003). Transient upregulation of
spinal cyclooxygenase-2 and neuronal nitric oxide synthase following surgical
inflammation. Anesthesiology, 98: 170-180.

Dollery, C. (1991). Therapeutic Drugs: Volume 2, Churchill Livingstone, London,
UK, pp: 25-27.
Donnelly, M.T.; Richardson, P.; Hawkey, C.J.; Courtauld, E. and Stack, W.A. (2000).
Dose-dependent effects of ketoprofen on the human gastric mucosa in
comparison with ibuprofen. Aliment. Pharmacol. Ther., 14(5): 543-549.
Dow, S.W.; Rosychuk, R.A.; McChesney, A.E. and Curtis, C.R. (1990). Effects of
flunixin and flunixin plus prednisone on the gastrointestinal tract of dogs. Am.
J. Vet. Res., 51(7): 1131-1138.
Earley, B. and Crowe, M.A. (2002). Effects of ketoprofen alone or in combination
with local anesthesia during the castration of bull calves on plasma cortisol,
immunological, and inflammatory responses. J. Ani. Sci., 80(4): 1044-1052.
Elmas, M.; Uney, K.; Karabacak, A. and Yazar, E. (2005). Pharmacokinetics of
flunixin-meglumine following intravenous administration in angora rabbits.
Bull. Vet. Inst. pulawy., 49(2): 85-88.
Evans, A.M. (1992). Enantioselective pharmacodynamics and pharmacokinetics of
chiral non-steroidal anti- inflammatory drugs. Eur. J. Clin. Pharmacol., 42:
237-256.
Faulkner, P.M. and Weary, D.M. (2000). Reducing pain after dehorning in dairy
calves. J. Dairy Sci., 83(9): 2037-2041.
Figueras, A.; Capella, D.; Castel, J.M. and Laorte, J.R. (1994). Spontaneous reporting
of adverse drug reactions to NSAID. A report from the Spanish system of
pharmacovigilance, including an early analysis of topical and enteric coated
formulations. Eur. J. Clin. Pharmacol., 47: 297-303.
Foster, M.L. and Jamali, F. (1988). Stereoselective pharmacokinetic of ketoprofen in
the rat. Drug metab. Dispos., 16(4): 623-626.
Francischi, J.N.; Chaves, C.T.; Moura, A.C.L.; Lima, A.S.; Rocha, O.A.; Ferreira-
Alves, D.L. and Bakhle, Y.S. (2002). Selective inhibitors of cyclooxygenase-2
(COX-2) induce hypoalgesia in a rat paw model of inflammation. Br. J.
Pharmacol., 137: 837-844.
Fumikazu, Y.; Yoko, H. and Takeshi, H. (2003). Experimental studies on
phototoxicity, phoallergenicity and prolonged photosensitivity due to
nonsteroidal anti- inflammatory drugs (NSAIDs). Japanese J. Dermatol.,
113(4): 405-411.

Gabriel, S.E.; Jaakkimainen, L. and Bombardier, C. (1991). Risk for serious
gastrointestinal complications related to use of non-steroidal anti-
inflammatory drugs: A meta-analysis. Ann. Intern. Med., 328:1313-1316.
Geisslinger, G.; Mangel, S.; Wissel, K. and Brune, K., (1995). Pharmacokinetic of
ketoprofen enantiomers after different doses of recemate. Br. J. Clin.
Pharmacol., 40: 73-75.
Ghezzi, P.; Melillo, G.; Meazza, C.; Sacco, S.; Pellegrini, L.; Asti, C.; Porzio, S.;
Marullo, A.; Sabbatini, V.; Caselli, G. and Bertini, R. (1998). Differential
contribution of R(-) and S(+) isomers in ketoprofen anti- inflammatory
activity: Role of cytokine modulation. J. Pharmacol. Exp. Ther., 287: 969-
974.
Gibaldi, M.; Nagashima, R. and Levy, G. (1969). Relationship between drug
concentration in plasma or serum and amount of drug in the body. J. Pharm.
Sci., 58: 193-197.
Gibaldi, M. and Perrier, D. (1982). In: Pharmacokinetics, 2nd Ed., Marcel Dekker Inc.,
New York.
Gilroy, D.W.; Colville-Nash, P.R.; Willis, D.; Chivers, J.; Paul-Clark, M.J. and
Willoughby, D.A. (1999). Inducible cyclooxygenase may have anti-
inflammatory properties. Nature Med., 6: 698-701.
Glew, A.; Aviad, A.D.; Keister, D.M. and Meo, N.J. (1996). Use of ketoprofen as an
antipyretic in cats. Canadian Vet. J., 37(4): 222-225.
Graham, J.E.; Kollias-baker, C.; Craigmill, A.L.; Thomasy, S.M. and Tell, L.A.
(2005) Pharmacokinetics of ketoprofen in Japanese quail (Coturnix japonica).
J. Vet. Pharmacol. Ther., 28(4): 399-402.
Green, G.A. (2001). Understanding NSAIDs: from aspirin to COX-2. Clin.
Cornerstone Sports Med., 3: 50-59.
Gregoricka, M.J.; Sutherland, S.F.; Dedrickson, B.J. and Busch, K.R. (1990).
Assessment of the intramuscular administration of ketoprofen. Equine Pract.,
12(7): 15-22.
Hart, F.D. and Huskisson, E.C. (1984). Nonsteroidal anti inflammatory drugs - current
status and rationale therapeutic use. Drugs, 27: 232-235.
Hawkey, C.J. (1999). COX-2 inhibitors. Lancet, 353(9149): 307-314.

Horii, Y.; Ikenaga, M.; Shimoda, M. and Kokue, E. (2004). Pharmacokinetics of
flunixin in the cat: enterohepatic circulation and active transport mechanism in
the liver. J. Vet. Pharmacol. Ther., 27(2): 65-69.
Igarza, L.; Soraci, A.; Auza, N. and Zeballos, H. (2002). Chiral inversion of R(-)
ketoprofen: Influence of age and differing physiological status in dairy cattle.
Vet. Res. Commun., 26: 29-37.
Igarza, L.; Soraci, A.; Auza, N. and Zeballos, H. (2004). Some pharmacokinetic
parameters of R(-) and S(+) ketoprofen: The influence of age and differing
physiological status in dairy cattle. Vet. Res. Commun., 28: 81-87.
Jamali, F. and Brocks, D.R. (1990). Clinical pharmacokinetic of ketoprofen and its
enantiomers. Clin. Pharmacokinet., 19(3): 197-217.
Jamali, F.; Lovalin, R. and Aberg, G. (1997). Bi-directional chiral inversion of
ketoprofen in CD-1 mice. Chirality, 9(1): 29-31.
Jaussaud, P.; Bellon, C.; Besse, S.; Courtot, D. and Delatour, P. (1993).
Enantioselective pharmacokinetics of ketoprofen in horse. J. Vet. Pharmacol.
Ther., 16(3): 373-376.
Jelic-Ivanovic, Z.; Spasic, S.; Majkic-Singh, N. and Todorovic, P. (1985). Effects of
some anti- inflammatory drugs on 12 blood constituents: protocol for the study
of in vivo effects of drugs. Clin. Chem., 31: 1141-1143.
Jerussi, T.P.; Caubet, J.F.; McCray, J.E. and Handley, D.A. (1998). Clinical
endoscopic evaluation of the gastroduodenal tolerance to (R)- ketoprofen, (R)-
flurbiprofen, racemic ketoprofen, and paracetamol: a randomized, single-
blind, placebo-controlled trial. J. Clin. Pharmacol., 38: 19-24.
Johnston, S.A. and Fox, S.M. (1997). Mechanisms of action of anti- inflammatory
medications used for the treatment of osteoarthritis. J. Am. Vet. Med. Assoc.,
210(10): 1486-1492.
Jusko, W.J. and Gibaldi, M. (1972). Effects of changes in elimination on various
parameters of the two compartment open model. J. Pharm. Sci., 61(8): 1270-
1272.
Kadir, A.; Ali, B.H.; Al Hadrami, G.; Bashir, A.K.; Landoni, M.F. and Lees P.
(1997). Phenylbutazone pharmacokinetics and bioavailability in the
dromedary camel (Camelus dromedarius). J. Vet. Pharmacol. Ther., 20(1):
54-60.

Kalpravidh, M.; Lumb, W.V.; Wright, M. and Heath, R.B. (1984). Effects of
butorphanol, flunixin, levorphanol, morphine, and xylazine in ponies. Am. J.
Vet. Res., 45(2): 217-223.
Kantor, T.G. (1986). Ketoprofen: a review of its pharmacologic and clinical
properties. Pharmacotherapy, 6: 93-103.
Klasco, R.K. (2003). In: USP DI: Drug information for the healthcare professional.
Volume I. Greenwood Village, Thomson Micromedex, Inc.
Landoni, M.F. and Lees, P. (1995a). Pharmacokinetic and pharmacodynamics of
ketoprofen enantiomers in calves. Chirality, 7(8): 586-597.
Landoni, M.F. and Lees, P. (1995b). Influence of formulation on pharmacokinetic and
bioavailability of racemic ketoprofen in horse. J. Vet. Pharmacol. Ther., 18:
446-450.
Landoni, M.F. and Lees, P. (1996). Pharmacokinetics and pharmacodynamics of
ketoprofen enantiomers in the horse. J. Vet. Pharmacol. Ther., 19: 466-476.
Landoni, M.F.; Cunningham, F.M. and Lees, P. (1995). Pharmacokinetics and
pharmacodynamics of ketoprofen in calves applying PK/PD modeling. J. Vet.
Pharmacol. Ther., 18: 315-324.
Landoni, M.F.; Comas, W.; Mucci, N.; Anglarilli, G.; Bidal, D. and Lees, P. (1999).
Enantiospecific pharmacokinetics and pharmacodynamics of ketoprofen in
sheep. J. Vet. Pharmacol. Ther., 22(6): 349-359.
Lees, P.; May, S.A. and White, D. (1990). Pharmacokinetics and dosage regimens of
anti- inflammatory drugs. Ann. Rech. Vet., 21(1): 735-738.
Lees, P.; Aliabadi, F.S. and Landoni, M.F. (2002). Pharmacodynamics and
enantioselective pharmacokinetics of racemic carprofen in the horse. J. Vet.
Pharmacol. Ther., 25(6): 433–448.
Lees, P.; Taylor, P.M.; Landoni, F.M.; Arifah, A.K. and Waters, C. (2003).
Ketoprofen in the cat: pharmacodynamics and chiral pharmacokinetics. Vet. J.,
165 (1): 21-35.
Lees, P.; Landoni, M.F.; Giraudel, J. and Toutain, P.L. (2004). Pharmacodynamics
and pharmacokinetics of nonsteroidal anti- inflammatory drugs in species of
veterinary interest. J. Vet. Pharmacol. Ther., 27: 479–490.

Lemke, K.A.; Runyon, C.L. and Horney, B.S. (2000). Effect of pre-operative
administration of ketoprofen on post-operative pain in dogs after elective
ovariohysterectomy. Vet. Anaes. Analg., 27(2): 97-111.
Lemke, K.A.; Runyon, C.L. and Horney, B.S. (2002). Effects of pre-operative
administration of ketoprofen on whole blood platelet aggregation, buccal
mucosal bleeding time, and haematologic indices in dogs undergoing elective
ovariohysterectomy. J. Am. Vet. Med. Assoc., 220(12): 1818-1822.
Liversidge, G.G. (1981). Ketoprofen. In: Analytical Profiles of Drug Substances:
Volume 10. (Ed. Florey, K.), Academic Press, London, UK, pp. 443-471.
Lockwood, P.W.; Johnson, J.C. and Katz, T.L. (2003). Clinical efficacy o f flunixin,
carprofen and ketoprofen as adjuncts to the antibacterial treatment of bovine
respiratory disease. Vet. Record, 152(13): 392-394.
Lombardino, J.G. and Wiseman, E.H. (1982). Piroxicam and other anti- inflammatory
oxicams. Medicinal Res. Rev., 2(2): 127-152.
Longo, F.; Autefage, A.; Bayle, R.; Gool, F. and Van-Gool, F. (1990). Efficacy of
ketoprofen in musculoskeletal diseases of horses. Bulletin-Mensuel-de-la-
Societe-Veterinaire-Pratique-de-France. 74(6): 349-364.
Luna, S.P.; Basilio, A.C.; Steagall, P.V.; Machado, L.P.; Moutinho, F.Q.; Takahira,
R.K. and Brandao, C.V. (2007). Evaluation of adverse effects of long-term
oral administration of carprofen, etodolac, flunixin meglumine, ketoprofen,
and meloxicam in dogs. Am. J. Vet. Res., 68(3): 258-264.
MacAllister, C.G.; Morgan, S.J.; Borne, A.T. and Pollet, R.A. (1993). Comparison of
adverse effects of phenylbutazone, flunixin meglumine, and ketoprofen in
horses. J. Am. Vet. Med. Assoc., 202(1):71-77.
Mauleon, D.; Artigas, R.; Garcia, M.L. and Carganico, G. (1996). Preclinical and
clinical development of dexketoprofen. Drugs, 52: 24-46.
Mengle-Gaw, L.J. and Schwartz, B.D. (2002). Cyclooxygenase-2 inhibitors: promise
or peril? Mediators of Inflammation, 11: 275–286.
Mercer, H.D.; Baggot, J.D. and Sams, R.A. (1977). Application of pharmacokinetic
methods to the drug residue profile. J. Toxicol. Environ. Health., 2(4): 787-
801.
Milligan, B.J.; Duffield, T. and Lissemore, K. (2004). The utility of ketoprofen for
alleviating pain following dehorning in young dairy calves. Canadian Vet. J.,
45: 140-143.
Montoya, L.; Ambrose, L.; Kreil, V.; Bonafine, R.; Albarellos, G.; Hallu, R. and
Soraci A. (2004). A pharmacokinetic comparison of meloxicam and
ketoprofen following oral administration to helthy dogs. Vet. Res. Commun.,
28(5): 415-428.
Musser, J.M.; Anderson, K.L. and Tyczkowska, K.L. (1998). Pharmacokinetic
parameters and milk concentrations of ketoprofen after administration as a
single intravenous bolus dose to lactating goats. J. Vet. Pharmacol. Ther.,
21(5): 358-363.
Naidoo, V.; Wolter, K.; Cromarty, A.D.; Bartels, P.; Bekker, L.; McGaw, L.; Taggart,
M.A.; Cuthbert, R. and Swan, G.E. (2008). The pharmacokinetics of
meloxicam in vultures. J. Vet. Pharmacol. Ther., 31(2): 128-134.
Narita, T.; Tomizawa, N.; Sato, R.; Goryo, M. and Hara, S. (2005). Effects of long-
term oral administration of ketoprofen in clinically healthy beagle dogs. J. Vet.
Med. Sci., 67 (9): 847-853.
Nazifi, S.; Rezakhani, A. and Maharloo, F.G. (2002). Comparative study on the
effects of flunixin meglumine and ketoprofen on haematological and some
biochemical parameters of cattle. J. Faculty Vet. Med., University of Tehran,
57(2): 95-99.
Notari, R.E. (1973). Pharmacokinetics and molecular modification: Implication in
drug design and evaluation. J. Pharm. Sci., 62(6): 865-881.
Owens, J.G.; Kamerling, S.G. and Barker, S.A. (1995a). Pharmacokinetics of
ketoprofen in healthy horses and horses with acute synovitis. J. Vet.
Pharmacol. Ther., 18(3): 187-195.
Owens, J.G.; Kamerling, S.G.; Stanton, S.R. and Keowen, M.L. (1995b). Effects of
ketoprofen and phenylbutazone on chronic pain and lameness in the horse.
Equine Vet. J., 27: 296-300.
Pasloske, K.; Renaud, R.; Burger, J. and Conlon, P. (1999). Pharmacokinetics of
ketorolac after intravenous and oral single dose administration in dogs. J. Vet.
Pharmacol. Ther., 22(5): 314-319.

Pibarot, P.; Dupuis, J.; Grisneaux, E.; Cuvelliez, S.; Plante, J.; Beauregard, G.;
Bonneau, N.H.; Bouffard, J. and Blais, D. (1997). Comparison of ketoprofen,
oxymorphone hydrochloride, and butorphanol in the treatment of
postoperative pain in dogs. J. Am. Vet. Med. Assoc., 211(4): 438-444.
Picco, E.J.; Diaz David, D.C.; Encinas, T.; Rubio, M.R. and Boggio, J.C. (2004).
Pharmacokinetics of sodium meclofenamate in pre-ruminant cattle. Arq. Bras.
Med. Vet. Zootec., 56(6): 695-700.
Pranvendra, K.; Ahmed, A.H.; Singh, K.P.; Hore, S.K.; Rahal, A. and Ahuja, V.
(2005). Bioavailability and pharmacokinetics of ketoprofen in indigenous
goats. Paper presented at national seminar on “Veterinary Pharmacology in
post WTO era and fifth annual conference of ISVPT” held at Madras
Veterinary College, Chennai, pp. 37.
Pravin, K.; Jayachandran, C.; Sinha, S.; Nirbhay, K. and Thakur B. S. (2005).
Disposition kinetics of ketoprofen in goats after intravenous administration.
Paper presented at national seminar on “Veter inary Pharmacology in post
WTO era and fifth annual conference of ISVPT” held at Madras Veterinary
College, Chennai, pp. 33.
Pyorala, S.; Laurila, T.; Lehtonen, S.; Leppa, S. and Kaartinen, L. (1999). Local tissue
damage in cows after intramuscular administration of preparations containing
phenylbutazone, flunixin, ketoprofen and metamizole. Acta Veterinaria
Scandinavica, 40(2):145-150.
Rao, G.S.; Malik, J.K.; Siddaraju, V.B. and Shankaramurthy, N.C. (2007).
Pharmacokinetics and bioavailability of nimesulide in goats. J. Vet.
Pharmacol. Ther., 30(2): 157-162.
Riegelman, S.; Loo, J. and Rowland, M. (1968a). Shortcoming in Pharmacokinetic
analysis by conceiving the body to exhibit properties of a single compartment.
J. Pharm. Sci., 57(1):117-123.
Riegelman, S.; Loo, J. and Rowland, M. (1968b). Concept of volume of distribution
and possible errors in evaluation of this parameter. J. Pharm. Sci., 57(1): 128-
133.
Riviere, J.E. (1999). In: Comparative Pharmacokinetics: Principles, Techniques, and
Applications. Lowa State University Press. Ames.

Roberts, L.J. and Morrow, J.D. (2001). Chemical classification of analgesic,
antipyretic and non steroidal anti- inflammatory drugs. In: Goodman and
Gillman‟s The Pharmacological Basis of Therapeutics (Eds. Hardman, J.G.
and Limbird, L.E.), 10th Ed., McGraw-Hill Companies, Inc., USA, pp. 691.
Rowland, M.; Benet, L.J. and Grahum, G.C. (1973). Clearance concept in
pharmacokinetics. J. Pharmacokinet. Biopharm., 1(2): 123-136.
Sams, R. (1978). Pharmacokinetics and metabolic considerations as they apply to
clinical pharmacology. In: Proceedings of the second Equine Pharmacology
Symposium (Eds. Powers, J.D. and Powers, T.E.). Am. Assoc. Equine Pract.,
Colorado.
Sams, R.; Gerken, D.F. and Ashcraft, S.M. (1995). Pharmacokinetic of ketoprofen
after multiple intravenous doses to mares. J. Vet. Pharmacol. Ther., 18(2):
108-116.
Santos, Y.; Ballesteros, C.; Ros, J.M.; Lazaro, R.; Rodriguez, C. and Encinas, T.
(2001). Chiral pharmacokinetics of ketorolac in sheep after intravenous and
intramuscular administration of the racemate. J. Vet. Pharmacol. Ther., 24(6):
443-446.
Schmitt, M. and Guentert, T.W. (1990). Biopharmaceutical evaluation of ketoprofen
following intravenous, oral and rectal administration in dogs. J. Pharm. Sci.,
79(7): 614-616.
Shargel, L. and Yu, A.B.C. (1993). In: Applied Biopharmaceutics and
Pharmacokinetics, 4th Ed., Appleton and Lange, Stamford.
Shpigel, N.Y.; Longo, F.; Saran, A.; Ziv, G. and Trenti, F. (1994). Ketoprofen
efficacy as adjunctive therapy in the treatment of field cases of clinical
mastitis in dairy cows. Proceedings 18th World Buiatrics Congress: 26th
Congress of the Italian Association of Buiatrics, Bologna, Italy, 1: 595-598.
Smith, C.J.; Zhang, Y.; Koboldt, C.M.; Muhammad, J.; Zweifel, B.S.; Shaffer, A.;
Talley, J.J.; Masferrer, J.L.; Seibert, K. and Isakson, P.C. (1998).
Pharmacological analysis of cyclooxygenase-1 in inflammation. Proceedings
of the National Academy of Sciences, 95: 13313–13318.
Smith, J.B. and Willis, A.L. (1971). Aspirin selectively inhibits prostaglandin
production in human platelets. Nature (New Biology), 231: 235–237.

Solankar, A.K. and Jagtap, A.G. (2005). Chronobiological and
chronopharmacological studies of ketoprofen and its solid dispersion form
using adjuvant arthritis model in rats. Indian J. Exp. Biol., 43(1): 46-52.
Soraci, A.; Tapia, O.; Castro, E. and Sanmartin, M.F. (1996). Asimetria molecular:
importancia de su conocimiento. Acta Bioquimica Clinica Latinoamericana, 3:
151-163.
Sridevi, S. and Diwan, P.V.R. (2002). Optimized transdermal delivery of ketoprofen
using pH and hydroxypropyl-β-cyclodextrin as coenhancers. Eur. J. Pharm.
Biopharm., 54: 151-154.
Steinmeyer, J. (2000). Pharmacological basis for the therapy of pain and inflammation
with nonsteroidal anti- inflammatory drugs. Arthritis Res., 2: 379-385.
Sweetman, S.C. (2002). In: Martindale: The Complete Drug Reference, 33rd Ed., The
Pharmaceutical Press, London, UK, pp: 47-48.
The British Pharmacopoeia. (2002). The Pharmaceutical Press, London, UK, pp.
1003-1004.
Thompson, L. (2006). Anti- inflammatory Agents. In: Merck Veterinary Manual. (Edi.
Kahn, C.M.). Merck & Co., Inc., Whitehouse Station, NJ, USA.
USP Veterinary Pharmaceutical Information Monographs (2004). Anti-
inflammatories. J. Vet. Pharmacol. Ther., 27 (supplement 1): 75-84.
Vane, J.R. (1971). Inhibition of prostaglandin synthesis as a mechanism of action for
aspirin- like drugs. Nature (New Biology), 231: 232–235.
Vane, J.R. and Botting R. M. (1987). Inflammation and the mechanism of action of
anti- inflammatory drugs. F.A.S.E.B. J., 1: 89-96.
Vane, J.R. and Botting, R.M. (1998). Anti- inflammatory drugs and their mechanism
of action. Inflammation Res., 47: 78-87.
Vane, J.R.; Bakhle, Y.S. and Botting, R.M. (1998). Cyclooxygenase 1 and 2. Annu.
Rev. Pharmacol. Toxicol., 38: 97-120.
Vavra, I. (1987). Ketoprofen. In: Nonsteroidal anti- inflammatory drugs: Mechanisms
and clinical use (Eds. Lewis, A.J. and Furst D.E.). New York: Marcel Dekker,
pp: 419-438.

Veng-Pedersen, P. (1991). Stochastic interpretation of linear pharmacokinetics: A
linear system analysis approach. J. Pharm. Sci., 80: 621-631.
Verde, C.R.; Simpson, M.I.; Frigoli, A. and Landoni, M.F. (2001). Enantiospecific
pharmacokinetics of ketoprofen in plasma and synovial fluid of horses with
acute synovitis. J. Vet. Pharmacol. Ther., 24(3): 179-185.
Vermeulen, B. and Remon, J.P. (2001). The oral bioavailability of ibuprofen
enantiomers in broiler chickens. J. Vet. Pharmacol. Ther., 24(2): 105 -109.
Vinagre, B.; Rodriguez, C.; San Andres, M.I.; Boggio, J.C; San Andres, M.D.;
Encinas, T. and Vinagre, E. (1998). Pharmacokinetics of indomethacin in
sheep after intravenous and intramuscular administration. J. Vet. Pharmacol.
Ther., 21(4): 309-314.
Wagner, J.G. (1967). Method of estimating relative absorption of a drug in a series of
clinical studies in which blood levels are measured after single and/or multiple
doses. J. Pharm. Sci., 56: 652-653.
Wagner, J.G. (1968). Pharmacokinetics. Ann. Rev. Pharm., 8(3): 67-94.
Wallace, J.L.; Bak, A.; McKnight, W.; Asfaha, S.; Sharkey, K.A. and Mac-Naughton,
W.K. (1998). Cyclooxygenase 1 contributes to inflammatory responses in rats
and mice: implications for gastrointestinal toxicity. Gastroenterology, 115:
101–109.
Wanwimolruk, S.; Wanwimolruk, S.Z. and Zoest, A.R. (1991). Sensitive HPLC assay
for ketoprofen in human plasma and its application to pharmacokinetic study.
J. Liq. Chromatography, 14(20): 3685-3694.
Wilcke, J.R.; Crisman, M.V.; Scarratt, W.K. and Sams, R.A. (1998).
Pharmacokinetics of ketoprofen in healthy foals less than twenty-four hours
old. Am. J. Vet. Res., 59(3): 290-292.
Willoughby, D.A.; Moore, A.R. and Colville-Nash, P.R. (2000). COX-1, COX-2 and
COX-3 and the future treatment of chronic inflammatory disease. The Lancet,
355: 646–648.
Yamaoka, K.; Nakagawa, T. and Uno, T. (1978). Statistical moments in
pharmacokinetics. J. Pharmacokinet. Biopharm., 6: 79-98.


![pharmacokinetics of [14C] procyanidin B2 in male ratsdmd.aspetjournals.org/content/dmd/early/2009/11/12/dmd.109.030304... · wine. The average dietary ... bioavailability, pharmacokinetics](https://img.pdfslide.net/doc/110x75/5b16eeb47f8b9a0b548b4fda/pharmacokinetics-of-14c-procyanidin-b2-in-male-wine-the-average-dietary-.jpg)