Embed Size (px)
Citation preview
1
STUDIES ON SOME FACTORS AFFECTING FLOWER BUD INDUCTION IN SWEET ORANGE (Citrus sinensis OSBECK): COLD, DROUGHT AND REMOVAL OF TERMINAL
BUDS
By
EDUARDO J. CHICA
A THESIS PRESENTED TO THE GRADUATE SCHOOL OF THE UNIVERSITY OF FLORIDA IN PARTIAL FULFILLMENT
OF THE REQUIREMENTS FOR THE DEGREE OF MASTER OF SCIENCE
UNIVERSITY OF FLORIDA
2007
2
© 2007 Eduardo J. Chica
3
ACKNOWLEDGMENTS
I thank all the persons who enriched my academic and personal experience through my
program, most of them also contributed in various ways to the completion of this project. Thank
you for your patience, understanding, support, and the countless things I learned from you.
4
TABLE OF CONTENTS page
ACKNOWLEDGMENTS ...............................................................................................................3
LIST OF TABLES...........................................................................................................................6
LIST OF FIGURES .........................................................................................................................7
ABSTRACT.....................................................................................................................................8
CHAPTER
1 LITERATURE REVIEW .......................................................................................................10
Citrus Flowering .....................................................................................................................10 General Characteristics of Citrus Flower Buds and Shoots ............................................10 Citrus Flower Bud Induction ...........................................................................................12
External (environmental) factors regulating flower bud induction in citrus ............12 Internal factors regulating flower bud induction in citrus........................................13
Pruning and Flowering ...........................................................................................................15
2 COMPARISON OF COLD AND DROUGHT FLOWER BUD INDUCTION IN ORANGE (Citrus sinensis osbeck) ........................................................................................17
Introduction.............................................................................................................................17 Materials and Methods ...........................................................................................................18
Growth Chamber/Greenhouse Experiment I ...................................................................18 Growth Chamber/Greenhouse Experiment II..................................................................19 Field Experiments............................................................................................................20
Results.....................................................................................................................................22 Growth Chamber/Greenhouse Experiments....................................................................22 Field Experiments............................................................................................................23
Discussion...............................................................................................................................24
3 EFFECT OF LATE FALL TIPPING OF SUMMER FLUSH ON SUBSEQUENT FLOWER BUD INDUCTION IN FLORIDA ORANGES....................................................39
Introduction.............................................................................................................................39 Materials and Methods ...........................................................................................................40 Results.....................................................................................................................................42 Discussion...............................................................................................................................43
4 CONCLUSIONS ....................................................................................................................54
LIST OF REFERENCES...............................................................................................................56

5
BIOGRAPHICAL SKETCH .........................................................................................................60
6
LIST OF TABLES
Table page 2–1 Analysis of variance table of five flowering variables of 4-year-old ‘Valencia’
orange trees after exposure to different flower inductive conditions. ...............................31
2–2 Growth Chamber Experiment II. Number of 4-year-old potted ‘Valencia’ orange trees that flowered after exposure to inductive conditions. ...............................................33
2–3 Accumulation of days under cool and drought flower bud induction conditions for citrus in seasons 2005–06 and 2006–07 in Lake Alfred, Florida. .....................................36
3–1 Types of sprouts formed in late-fall tipped vigorous summer shoots of ‘Hamlin’ and ‘Valencia’ sweet orange trees under field conditions in two successive seasons..............49
3–2 Comparison of five flowering parameters between late-fall summer shoots tipped at bud position 4 (from the apex) and bud positions >4 of intact summer shoots ‘Hamlin’ and ‘Valencia’ sweet orange trees, under field conditions (season 2006–07). .....................................................................................................................................53
7
LIST OF FIGURES
Figure page 2–1 Main effect plots of time under induction, temperature and water deficit on five
flowering variables of potted 4-year-old ‘Valencia’ orange trees. ....................................30
2–2 Growth Chamber Experiment I. Interaction plots Temperature x Water Deficit for five flowering variables of 4-year-old potted ‘Valencia’ orange trees. .............................32
2–3 Effect of winter drought on five flowering variables of field-grown citrus trees.. ............34
2–4 Effect of extra-drought on five flowering variables of field-grown ‘Valencia’ orange trees (Season 2005–06). .....................................................................................................35
2–5 Distribution of days under natural cool induction for citrus and available soil water content in non-irrigated plots in seasons 2005–06 and 2006–07.......................................37
2–6 Effect of two levels of drought on five flowering variables of field-grown ‘Valencia’ sweet orange trees (Season 2006–07).. ..............................................................................38
3–1 Primary flowering intensity parameters of late-fall tipped vigorous summer shoots of ‘Hamlin’ and ‘Valencia’ sweet orange trees under field conditions on two successive seasons.. .............................................................................................................................48
3–2 Distribution of different types of sprouts on late-fall tipped and intact summer shoots of ‘Hamlin’ and ‘Valencia’ sweet orange trees, under field conditions. ...........................50
3–3 Distribution of sprouts of late-fall-tipped and intact summer shoots of ‘Hamlin’ and ‘Valencia’ sweet orange trees on different bud positions (counting from the apex after tipping), under field conditions. ................................................................................51
3–4 Percent distribution of different types of spring sprouts on the first 4 nodes of late-fall tipped and intact vigorous summer shoots of ‘Hamlin’ and ‘Valencia’ sweet orange trees under field conditions (season 2006–07).......................................................52
8
Abstract of Thesis Presented to the Graduate School of the University of Florida in Partial Fulfillment of the
Requirements for the Degree of Master of Science
STUDIES ON SOME FACTORS AFFECTING FLOWER BUD INDUCTION IN SWEET ORANGE (Citrus sinensis OSBECK): COLD, DROUGHT AND REMOVAL OF TERMINAL
BUDS
By
EDUARDO J. CHICA
August 2007 Chair: L. Gene Albrigo Major: Horticultural Science
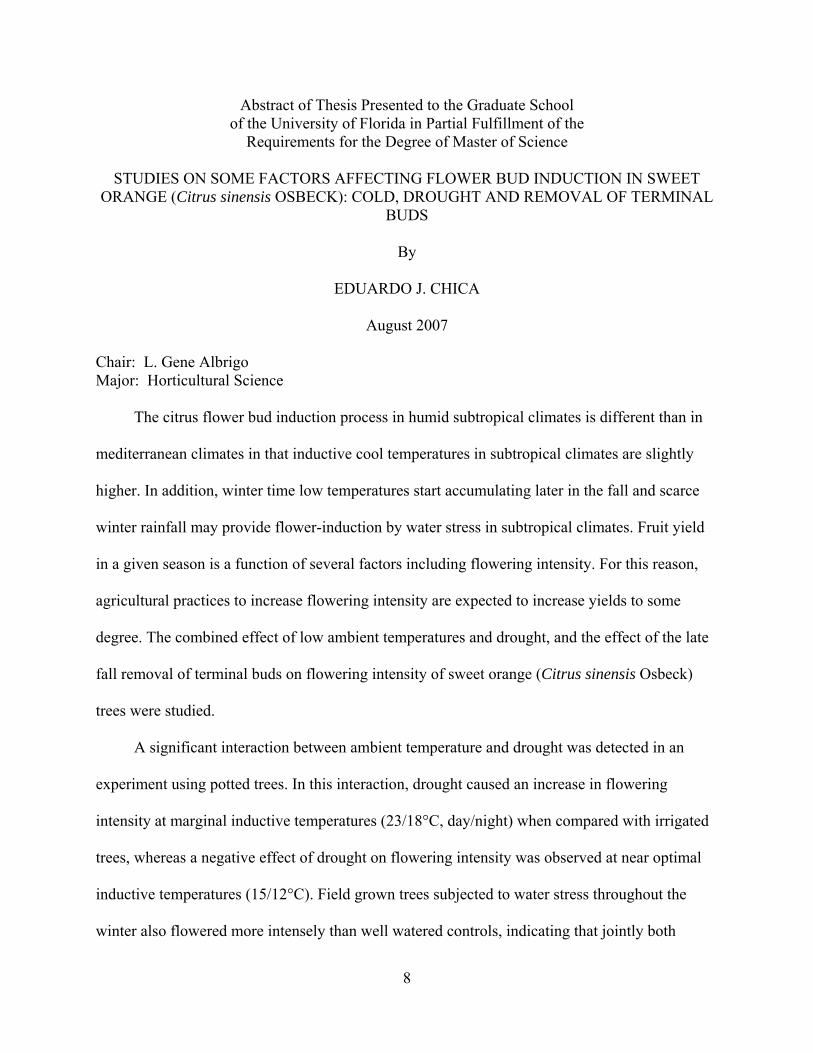
The citrus flower bud induction process in humid subtropical climates is different than in
mediterranean climates in that inductive cool temperatures in subtropical climates are slightly
higher. In addition, winter time low temperatures start accumulating later in the fall and scarce
winter rainfall may provide flower-induction by water stress in subtropical climates. Fruit yield
in a given season is a function of several factors including flowering intensity. For this reason,
agricultural practices to increase flowering intensity are expected to increase yields to some
degree. The combined effect of low ambient temperatures and drought, and the effect of the late
fall removal of terminal buds on flowering intensity of sweet orange (Citrus sinensis Osbeck)
trees were studied.
A significant interaction between ambient temperature and drought was detected in an
experiment using potted trees. In this interaction, drought caused an increase in flowering
intensity at marginal inductive temperatures (23/18°C, day/night) when compared with irrigated
trees, whereas a negative effect of drought on flowering intensity was observed at near optimal
inductive temperatures (15/12°C). Field grown trees subjected to water stress throughout the
winter also flowered more intensely than well watered controls, indicating that jointly both

9
stimuli increase flower induction in sweet orange trees under Florida’s Humid subtropical
climate.
In another experiment, late fall tipped shoots flowered less intensely than intact shoots.
However, late-fall tipping increased sprouting and flowering of buds at bud positions along the
shoot that otherwise would not have sprouted or flowered. Indirectly it is concluded that shoots
tipped in the fall flowered more intensely than shoots tipped after bud differentiation starts
(winter), suggesting that late fall hedging of commercial orchards may have less negative impact
on flowering intensity than at other times of the year. Also, late fall tipping increased or
maintained the leafiness of the inflorescences formed and the number of vegetative sprouts when
compared with intact shoots. Thus, even though flowering intensity was reduced, percentage of
fruit-set may increase because leafier inflorescences set more fruit than inflorescences with less
number or leaves.
10
CHAPTER 1 LITERATURE REVIEW
Citrus is commercially grown primarily in regions with mild winters located between 20°
and 40° of latitude in both hemispheres. Climates within these regions have a great influence on
the physiology of citrus flowering. More than 70% of the world’s total production of citrus for
processing is grown in humid subtropical climates in Florida (US) and São Paulo (Brazil).
Humid subtropical climates are characterized by cool and dry winters (McKnight and Hess,
2000), which create unique conditions for flower bud induction in citrus. The purpose of this
section is to review the main features of citrus flowering as they relate to humid subtropical
climates.
Citrus Flowering
Citrus flowering is highly influenced by environment. Typically a single strong flush of
flowers is produced each year following prolonged exposure to natural floral inductive
conditions (Cassin et al., 1969). Two major environmental cues induce flowering in citrus: low
non-freezing temperatures and water stress (Cassin et al., 1969). Winter low ambient
temperatures are the major floral inductive stimuli for citrus grown in mediterranean climates,
while in tropical climates, it is water stress (Davenport, 1990). Humid subtropical climates are
unique in that it is possible for both floral inductive stimuli to be present simultaneously during
the citrus flower bud induction season, thus creating possibilities for interactive effects on flower
induction (Albrigo et al., 2004).
General Characteristics of Citrus Flower Buds and Shoots
Citrus seedlings start flowering after the completion of a juvenile stage that may last from
5 to 13 years depending on the cultivar (Davies and Albrigo, 1994). Buds in newly formed
shoots of adult trees require 6–8 weeks to become competent to flower (Albrigo, unpublished
11
data). Unlike those of temperate trees, citrus floral buds are not visible, even microscopically,
until shortly before bloom (Abbot, 1935; Lord and Eckard, 1985). Flower bud differentiation
starts with sepal initiation and ends with the formation of carpels, in a process that lasts about 2
weeks (Lord and Eckard, 1985). Under California mediterranean-like conditions, anthesis occurs
3–4 months after this point, and flower buds are macroscopically noticeable two months prior to
anthesis (Lord and Eckard, 1985). These times can be shorter in humid subtropical climates
where late-winter and spring temperatures are higher than in mediterranean-like climates
(Valiente and Albrigo, 2000). In tropical climates, where the main inductive stimulus is water
deficit, anthesis occurs about one month after the first precipitation that replenishes adequate soil
moisture to start growth (Cassin et al., 1969).
In mediterranean and humid subtropical climates, the spring flush accounts for almost all
of the flowers produced in a given year (Davenport, 1990). In tropical climates the major
reproductive flush normally occurs after the dry season ends (Cassin et al., 1969), but if the
region is wet and not prone to prolonged drought, trees may become ever-bearing (Reuther and
Ríos-Castaño, 1969). Lemons and limes normally produce flowers throughout the year even in
mediterranean climates, with specific peaks of flowering coinciding with those of other citrus
species (Erickson, 1969).
The spring flush is composed of vegetative and flowering shoots (Moss, 1969). Flowering
shoots may be of five types depending on their leafiness (Moss, 1969). Leafy inflorescences are
commonly associated with higher fruit set in sweet oranges (Moss, 1970, Sauer, 1954).
Inflorescence leafiness is inversely proportional to the duration of reproductive temperatures and
proportional to the temperature of induction and date of bud break (Albrigo and Galán-Saúco,
2004; Moss, 1969; Sauer, 1954). Flowering shoots are formed primarily in buds from the

12
previous year’s spring and summer flush (Sauer, 1951; Valiente and Albrigo, 2004). Summer
shoots tend to produce greater number of flowers per shoot (Valiente and Albrigo, 2004). Buds
nearest to the apex of the shoot tend to become induced first and most frequently (Sauer, 1954;
Valiente and Albrigo, 2004).
Citrus Flower Bud Induction
Though it has been widely studied, the flower induction process in citrus has not been
satisfactorily explained. Floral induction is the process by which competent vegetative
meristems become committed to flower (McDaniel et al., 1992). There is no argument about the
inductive role of low temperature and water stress but very little is known about how these
stimuli actually trigger the flowering response in citrus. From other species, it is known that a
complex genetic network integrates internal and environmental cues that work as signals of
conditions that favor reproductive success and triggers flowering (i.e. seed/fruit formation, cross
pollination; Araki, 2001; Putterill et al., 2004). This section reviews the influence of external and
internal factors regulating citrus flower induction.
External (environmental) factors regulating flower bud induction in citrus
Citrus trees are photoperiod insensitive (Lenz, 1969; Moss, 1969) and undergo floral
induction primarily by exposure to cold temperatures or drought under natural conditions
(Borroto and Rodríguez, 1977; Cassin et al., 1969; Moss, 1969). Drought and cold temperatures
can be considered as both qualitative and quantitative stimuli since the flowering response
depends on the intensity of the stimulus (qualitative: temperature range / water stress severity)
and time of exposure (quantitative) (Moss, 1969; Southwick and Davenport, 1986). Even so,
their inductive optima and thresholds are not clearly defined (Krajewsky and Rabe, 1995).
Flower buds can be induced in containerized plants by as little as 2 weeks of exposure to
limiting water conditions and induction is more intense under severe water stress (Leaf water

13
potential ≈ -3.5MPa; Southwick and Davenport, 1986). Under field conditions, periods between
55 and 70 days under moderate water stress are commonly regarded as optimal (Albrigo et al.,
2004; Cassin et al., 1969).
Inductive temperatures are considered optimal between 10°C and 15°C (Moss, 1969), with
a lower and upper limit of 5°C and 19°C, respectively (García-Luis et al., 1992; Moss, 1969;
Valiente and Albrigo, 2000, 2004). Flowering intensity is proportional to the accumulation of
hours at inductive temperatures, and induction can be observed after 2 weeks of daily exposure
to the cold stimulus (Moss, 1969). Exposure to temperatures above 23°C for more than 5 days
may interrupt the flower induction process and promote floral differentiation (Valiente and
Albrigo, 2000).
It is not clear whether water stress and low temperatures induce flowering by the same
physiological mechanism. The number of investigations characterizing the flowering response of
citrus to low temperatures is extensive (García-Luis et al., 1989; Lenz, 1969; Moss, 1969, 1971a,
1973b, 1976; Southwick and Davenport, 1986; Valiente and Albrigo, 2004), but drought stress
effects on flowering are not as well characterized (Borroto and Rodríguez, 1977; Cassin et al.,
1969; Koshita and Takahara, 2004; Nir et al., 1972; Southwick and Davenport, 1986). Although
results vary, field experiments indicate that effects of these stimuli might be additive under
certain conditions (Albrigo et al., 2004). It has been proposed that cessation of vegetative growth
could be by itself the condition required for flower bud induction (Monselise, 1985).
Internal factors regulating flower bud induction in citrus
The role of internal factors in citrus flower bud induction has been regarded mainly as
indirect (Krajewsky and Rabe, 1995). As opposed to external factors that actually induce
flowering, internal factor such as plant hormones, carbohydrates, crop load, or nitrogen

14
metabolism are believed to modulate the characteristics of the generative flush but may not
actually induce flowering.
Gibberellins are the only group of plant growth regulators that have a demonstrated effect
on citrus flowering by reducing and delaying bud sprouting (Cooper and Peynado, 1958; García-
Luis et al., 1986; Koshita and Takahara, 2004; Monselise and Halevy, 1964). This line of
evidence is supported by reports of gibberellin synthesis inhibitors enhancing flowering
(Davenport, 1990). However, effects of gibberellins on flowering are not expressed unless trees
are subjected to cold or drought induction treatments (Davenport, 1990), thus indicating a
secondary role on flower bud induction.
Environmentally induced hormonal responses have been proposed to explain the common
flowering response (Monselise, 1985). Low levels of GAs were found in citrus leaves during
cold and drought induction conditions (Koshita et al., 1999; Koshita and Takahara, 2004), which
is consistent with the inhibitory effect of GA on flowering. Conversely, higher levels of ABA
and auxins were found simultaneously (Koshita et al., 1999; Koshita and Takahara, 2004).
Earlier work reported little involvement of the former two hormones on flowering control
(Krajewsky and Rabe, 1995).
Reduced flowering intensity is associated with crop load in the previous season
(Goldschmidt and Golomb, 1982; Moss, 1971b; Syvertsen et al., 2003; Valiente and Albrigo,
2004). The reason for the inverse relationship between crop load and flowering has not been
established (Valiente and Albrigo, 2004). Some workers have suggested a role for carbohydrates
to explain crop load effects on flowering (Goldschmidt and Golomb, 1982), but other reports
indicate a less relevant role of carbohydrates on flowering (García-Luís et al., 1988). An
15
alternative explanation for the effect of crop load on flowering is associated with increased
gibberellin concentrations in fruit-bearing branches (Koshita et al., 1999).
Similarly to gibberellins, the accumulation of ammonia (NH3-NH4+) in citrus leaves after
exposure to low temperatures or drought stress has been proposed as an alternative mechanism
for flower induction (Lovatt et al., 1988). The proposed role of NH3-NH4+ is as a precursor for
the biosynthesis of polyamines which have been associated with floral promotion and
morphogenesis in other species (Edwards, 1986). Studies so far indicate that NH3-NH4+ only
enhances the already established flowering ability and does not initiate flowering (Lovatt et al.,
1988).
Pruning and Flowering
Commercial citrus are pruned periodically to control tree size and architecture so that
productivity is maintained over time. Hedging and topping are the most common pruning
practices in commercial citrus orchards in humid subtropical climates. These two pruning
practices non-selectively cut portions of branches and promote growth of lateral buds (Davies
and Albrigo, 1994). Pruning stimulates the growth of a new flush of shoots, but the nature and
vigor of this flush varies depending on the time of the year, cultivar and severity of pruning
(Bacon and Bevington, 1978). In mediterranean-like Australia, light pruning in spring or early
summer is regarded as the most effective intensity and pruning times (Bevington, 1980).
Late winter or spring pruning normally is practiced after the risks of freezes has passed,
and just before the spring flush (Davies and Albrigo, 2004). Pruning at this time of the year
avoids both freezing damage to the new flush and removal of flowers and young fruits. However,
spring pruning likely removes flower buds that have been already induced (Davies and Albrigo,
2004). Yield reductions from this timing have been reported for spring pruning in Australia
(Bacon and Bevington, 1978; Bacon, 1981). Pruning early in the summer would avoid the loss of
16
induced flower buds, but reduce the number of young fruit, thus decreasing yields in that season
(Bacon and Bevington, 1978). Pruning at later times in Australia, reduced yields the most when
compared with other pruning times by delaying flushing until next spring and causing a mainly
vegetative flush (Bevington, 1981). A mostly vegetative spring flush suggest that the buds
remaining in the pruned shoots did not respond to flower inductive temperatures during the
winter for some reason. Another report indicates that pruning in fall may also stimulate a flush
just prior to winter that might be killed by freezes in the winter or grow less vigorously due to
lower temperatures (Moss, 1973a). Interestingly there are no comparative reports on the response
of citrus trees pruned in late-fall or winter even though these are common times of pruning for
commercial orchards in Florida.
17
CHAPTER 2 COMPARISON OF COLD AND DROUGHT FLOWER BUD INDUCTION IN ORANGE
(Citrus sinensis OSBECK)
Introduction
Predicting bloom intensity is an important component for assessing crop load in orange
trees in a given season. A model for predicting bloom date in sweet orange trees has been
designed and provides an accuracy of ±7 days, and estimates a general level of flowering
intensity (Albrigo et al., 2006). This model is based on the effect of temperature on flower bud
induction, bud growth initiation, and bud development using historical weather data of Central
Florida, a humid subtropical climate. Several models have been developed for predicting bloom
date using weather data from regions with mediterranean climates (Bellows and Morse, 1986;
Ben Mechlia and Carrol, 1989; Lovatt et al., 1984). These models may not be applicable under
humid subtropical conditions due to marked differences in weather conditions during the flower
bud induction season. The presence of drought during the citrus flower bud induction season is
very common in humid subtropical climates, as opposed to mediterranean climates with
relatively rainy winters. A recent study has shown evidence supporting some additive role
between cold and drought flower bud induction in another humid subtropical climate: São Paulo,
Brazil (Albrigo et al., 2004). However, it is not completely clear whether low temperatures and
drought simultaneously modifies the flowering response of sweet orange trees.
Determining whether there is an interaction between temperature and drought in the flower
bud induction would be useful in fine-tuning the bloom prediction model for humid subtropical
climates. This project tested the hypothesis that low temperatures and drought interact to induce
flowering in sweet orange trees, thus modifying flowering intensity. Therefore, the objective of
this study is to determine whether low temperature and drought flower bud induction signals are
additive, competitive or do not interact during the flower bud induction process in oranges.
18
Materials and Methods
Growth Chamber/Greenhouse Experiment I
Growth chamber/greenhouse experiments were conducted at the University of Florida’s
Citrus Research and Education Center (CREC) in Lake Alfred, Florida. Young (4 year old)
‘Valencia’ seedless orange trees grafted on Carrizo citrange growing in 45L pots filled with high
organic peat growing media were used for the experiment. Before the beginning of the
experiment all fruits were removed.
The experiment was conducted using a completely randomized design with 4 replicates per
treatment in a 4x2x2 factorial arrangement. The factors evaluated were: time under inductive
conditions (3, 5, 7, and 9 weeks), temperature (15/12 and 23/18°C, day/night; near-optimal
inductive and marginally inductive, respectively), and water deficit (drought and irrigated). Each
replicate consisted of one tree and represented one independent experimental unit (64
experimental units total).
At the beginning of the experiment, plants were transferred to 2 identical growth chambers
with temperatures set according to the levels indicated above. Illumination was the same for both
chambers averaging about 250 μmol·m-2·h-1 with a photoperiod of 12h/12h (day/night).
The two levels of water deficit were achieved by applying polyethylene glycol 8000 (4.44
g·L-1; PEG 8000, Fisher Scientific) to the soil media via irrigation water. The desired level of
depressed water status was later fine-tuned by modifying the frequency of irrigation and
recycling the water that leached out of the pots. Midday stem water potential (ψs) was used as an
indicator of water stress and was measured weekly using the pressure chamber method
(Kaufmann, 1968; Scholander et al., 1965) using covered leaves (Begg and Turner, 1970).
Average ψs readings in the well-irrigated plants were -0.79±0.04 and -0.69±0.03MPa, in the cool
and warm chamber, respectively. Average reduction of ψs in drought treatments represented a

19
very mild water stress with average readings of -1.00±0.02 and -1.08±0.04MPa in the cold and
warm chamber, respectively.
After induction conditions were applied for the time indicated by the treatment, the plants
were transferred to a greenhouse at >20°C and PEG was washed out by applying excess water.
Higher non-inductive temperatures and non-restricted irrigation were intended to stop the
induction process and promote bud sprouting.
The variables evaluated were: number of available buds per shoot, number of new sprouts
per shoot, number of inflorescences per shoot and total number of flowers per shoot. These
variables were used to calculate the number of flowers per inflorescence and number of flowers
per available bud. All the shoots from the previous summer and spring flushes were tagged on
each tree, and at least 12 shoots per tree were present. The values of the variables were averaged
for each experimental unit (tree) and these averages were used for analysis. Data were analyzed
using ANOVA (MINITAB® 14.20, Minitab Inc.). The variables, number of inflorescences per
shoot, number of flowers per shoot and number of flowers per available bud were transformed to
their square root values in order to achieve normality of their distributions.
Growth Chamber/Greenhouse Experiment II
A second growth chamber experiment was conducted six months after the conclusion of
experiment I using the same group of plants. This experiment (II) was conducted using the same
methodology as Experiment I but higher temperatures and more severe water stress was used
(102 g·L-1 PEG). The levels of temperature used in this experiment were: 20/10°C (inductive)
and 27/21°C (presumably non-inductive). Drought was more severe in this second experiment
and caused severe water stress in the plants (ψs = -3.2MPa and -3.6MPa in drought treatments of
the cool and warm chamber respectively).
20
Field Experiments
Field experiments were conducted over two inductive seasons (2005–06 and 2006–07) at
CREC in Lake Alfred, Florida (28°5′ N, 81°43′ W). Each season three adult sweet orange [cv.
‘Valencia’ (2 blocks) and ‘Hamlin’ (1 block)] blocks and one grapefruit (cv. ‘Marsh’) block
were used for the experiment. Sweet orange trees were growing in Candler sand (hyperthermic,
uncoated Typic Quartzipsamments) while the grapefruit trees were growing in Apopka fine sand
(loamy, siliceous, hyperthermic Grossarenic Paleudults).
Experiments were conducted under a completely randomized block design with 5
replicates1 and two treatments (drought and irrigation). Levels of the block factor were 2 sweet
orange [‘Valencia’ (2 blocks) and ‘Hamlin’] and one grapefruit (‘Marsh’) cultivar. Each replicate
consisted of one tree, and measurements were taken on 20 shoots distributed on each side of the
hedgerow.
Irrigated treatments consisted of plants receiving adequate irrigation throughout the
induction season, while drought treatments consisted of plants that were deprived of irrigation
just before the induction season started (mid-November) and remained un-irrigated for 75–80
days. In both seasons, one sweet orange plot (cv. ‘Valencia’) had an additional treatment which
consisted of extra drought. Extra drought was achieved by covering the soil under the trees with
a sheet of Tyvek® (E. I. DuPont de Nemours and Company, Richmond, Virginia, US) and
withholding irrigation as before. Depression of ψs was used as an indicator of water stress in the
trees, and was monitored throughout the experiment using the pressure chamber method using
covered leaves (Kaufmann, 1968; Scholander et al., 1965). Maxima, minima and mean ambient
temperature, as well as rainfall data were obtained from the IFAS-FAWN weather station at
1 In the first year of data collection, 2 replicates from one of the blocks were lost, therefore, for that year the experimental design consisted of an unbalanced completely randomized block design.
21
Lake Alfred. The total number of hours under optimum inductive conditions (10°C–15°C), and
total inductive conditions (<20°C) were calculated from these data. Water balances of non-
irrigated plots were calculated as follows: volumetric available soil water holding capacity for
Candler sand was calculated to a depth of 0.90 m by subtracting the volumetric soil water
content at permanent wilting point (0.01%; soil matric potential ≤ -1.5MPa) from the volumetric
soil water content at field capacity (0.08%; soil matric potential = -5×10⁻³MPa; Obreza et al.,
1989). Volumetric soil water content at field capacity represented 100% available soil water
content (ASWC) and the volumetric soil water content at permanent wilting point represented
0% ASWC. Available soil water content at the beginning of the experiment was 0.08%
equivalent to field capacity (100% ASWC). Afterwards, water use due to crop evapotranspiration
was subtracted from the available soil water content of the previous day and water input from
precipitation (rainfall only) was added on daily basis. Thirty-three percent and 50% depletion of
the available ASWC were considered as reference values for calculating total number of days
under moderate and severe drought (Obreza et al., 1997; Smajstrla et al., 1987). Bud
differentiation date, after which additional accumulation of induction units was not effective, was
obtained from the predictions of the Citrus Flowering Monitor (CFM) of the Decision
Information System for Citrus (© University of Florida, http://www.minuetto.net/bloom).
The variables evaluated were the same as those described for the growth
chamber/greenhouse experiment. Sampled shoots were spring and summer shoots formed during
the previous season. For each experimental unit, data was averaged and analyzed as indicated
before, but in this case data did not need to be transformed.
22
Results
Growth Chamber/Greenhouse Experiments
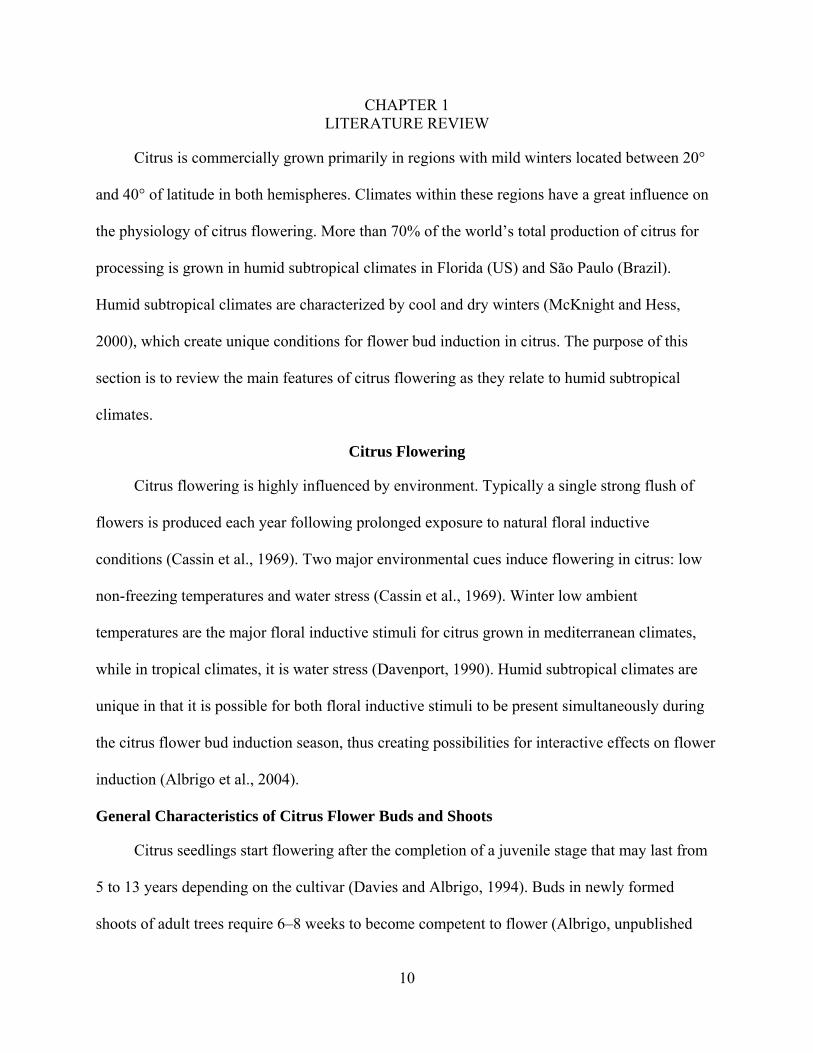
The main effect of temperature significantly (p≤0.05) increased flowering with lower
temperatures, for all the variables evaluated. Time under inductive conditions was also
significant for increasing all the variables except for the number of flowers per inflorescence,
whereas water deficit by itself did not affect any of the variables. In general, low temperatures
and increased time of exposure to inductive conditions produced more intense flowering (Figure
2–1, Table 2–1). These observations are in agreement with previous reports so will not be further
discussed here (Moss, 1969; Southwick and Davenport, 1986).
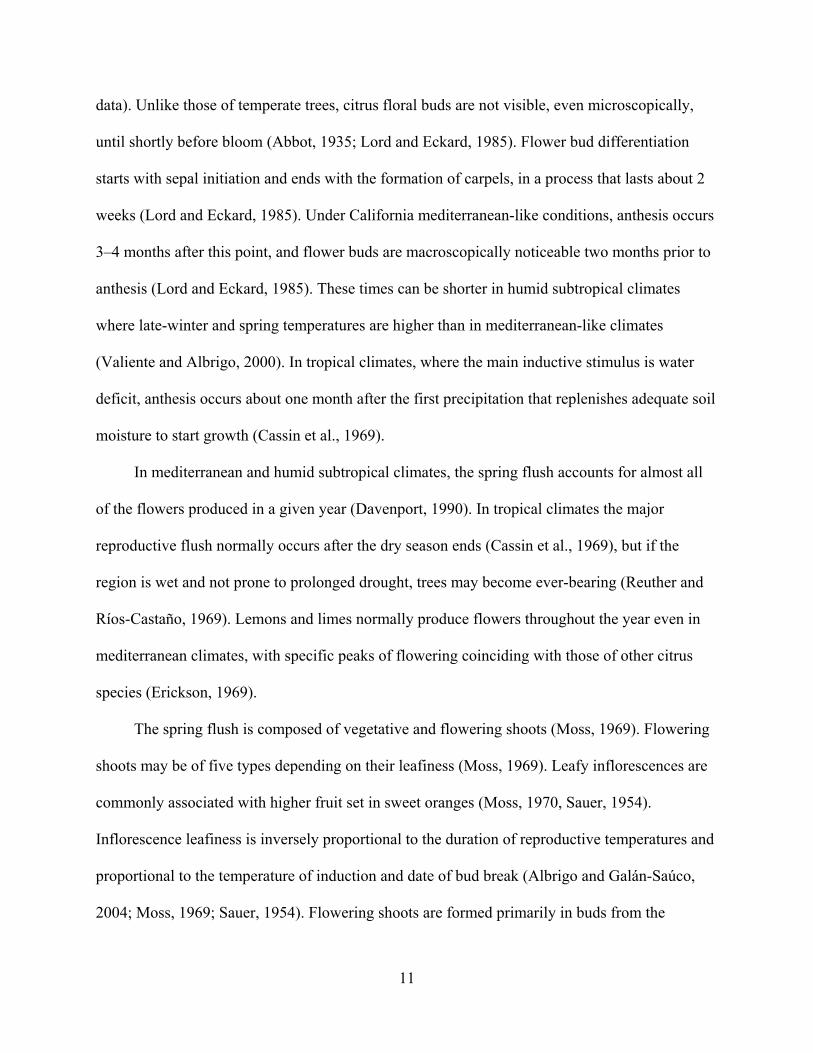
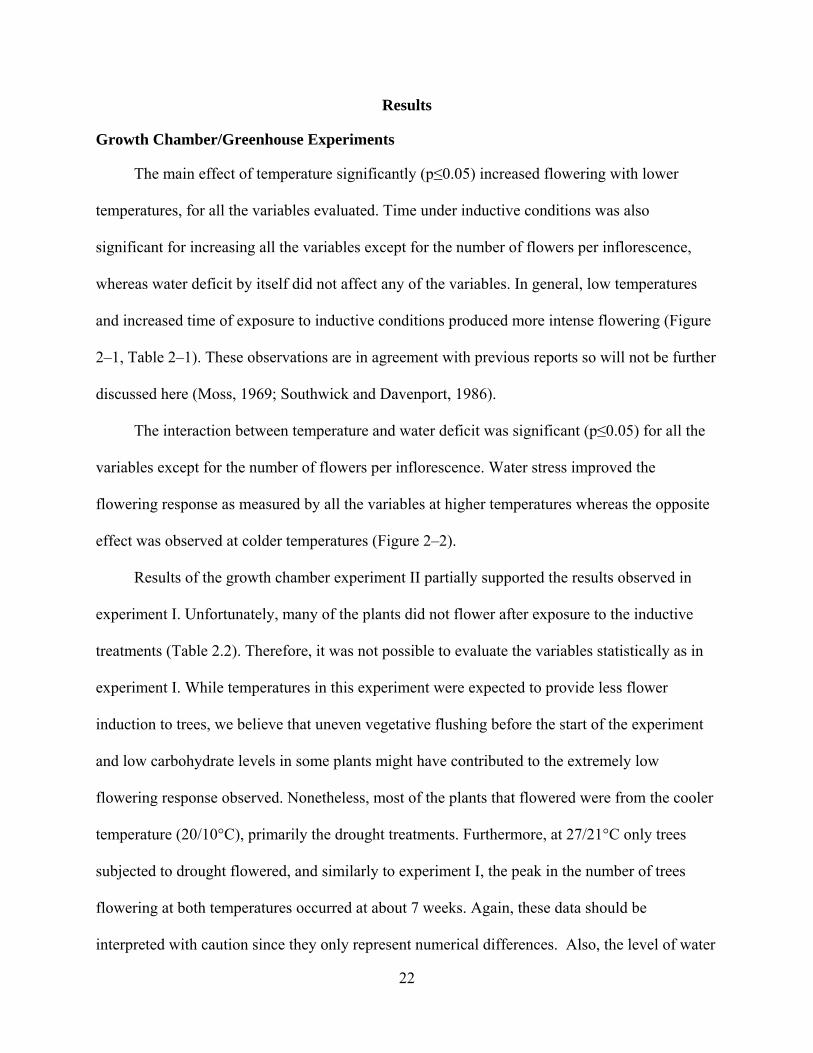
The interaction between temperature and water deficit was significant (p≤0.05) for all the
variables except for the number of flowers per inflorescence. Water stress improved the
flowering response as measured by all the variables at higher temperatures whereas the opposite
effect was observed at colder temperatures (Figure 2–2).
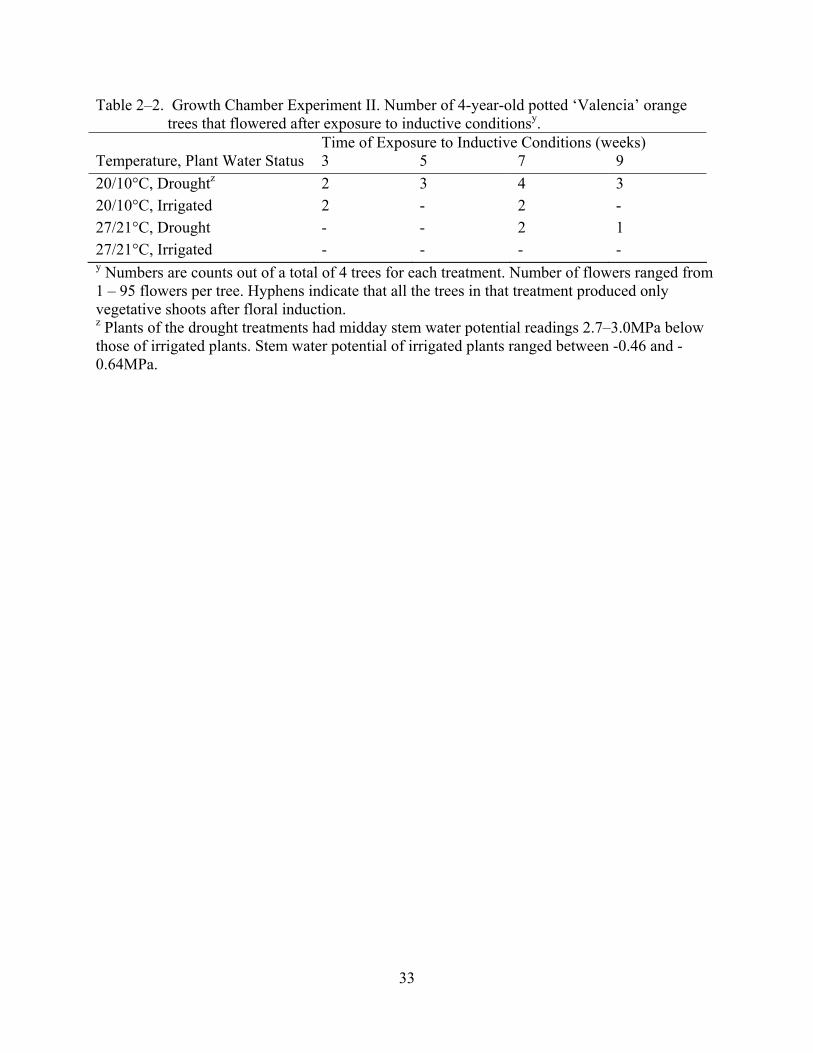
Results of the growth chamber experiment II partially supported the results observed in
experiment I. Unfortunately, many of the plants did not flower after exposure to the inductive
treatments (Table 2.2). Therefore, it was not possible to evaluate the variables statistically as in
experiment I. While temperatures in this experiment were expected to provide less flower
induction to trees, we believe that uneven vegetative flushing before the start of the experiment
and low carbohydrate levels in some plants might have contributed to the extremely low
flowering response observed. Nonetheless, most of the plants that flowered were from the cooler
temperature (20/10°C), primarily the drought treatments. Furthermore, at 27/21°C only trees
subjected to drought flowered, and similarly to experiment I, the peak in the number of trees
flowering at both temperatures occurred at about 7 weeks. Again, these data should be
interpreted with caution since they only represent numerical differences. Also, the level of water
23
stress associated with the drought treatments was apparently excessive since severe leaf drop and
drying of young twigs was observed, potentially another limitation in this experiment. The
tendency towards more flowering with drought in the cooler chamber is contradictory to the first
experiment but this may be because temperature in the cooler chamber in the second experiment
was also slightly higher than that used in the first experiment.
Field Experiments
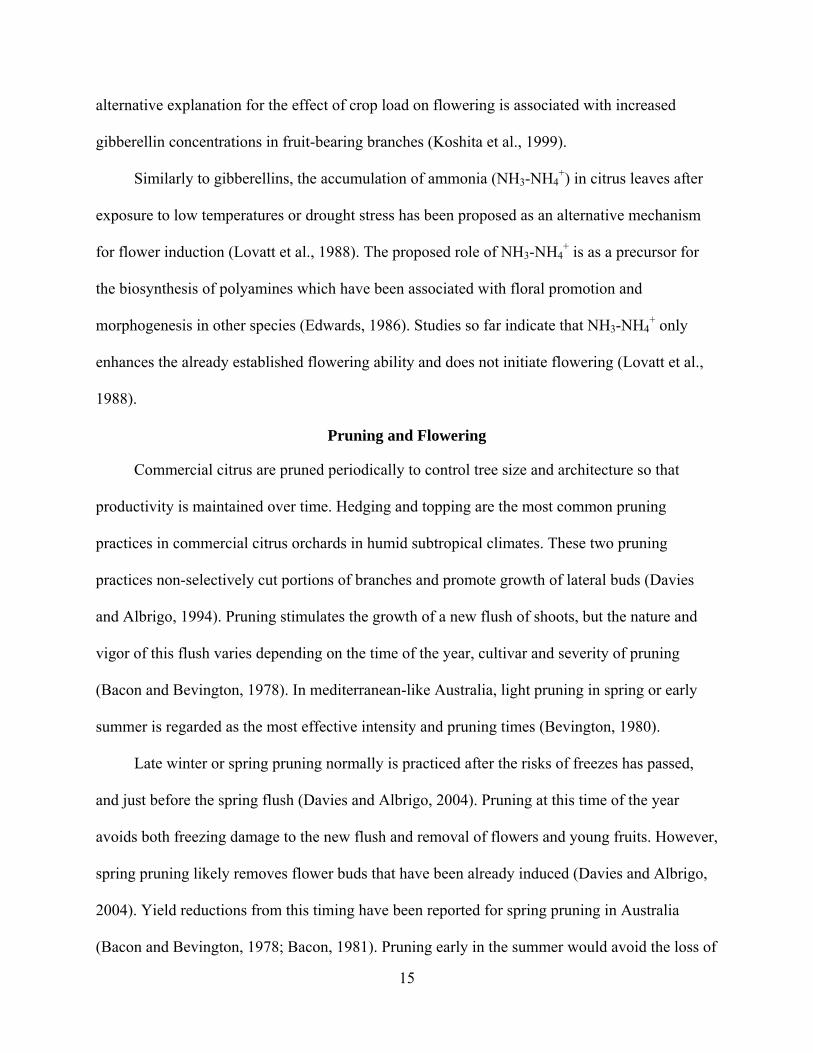
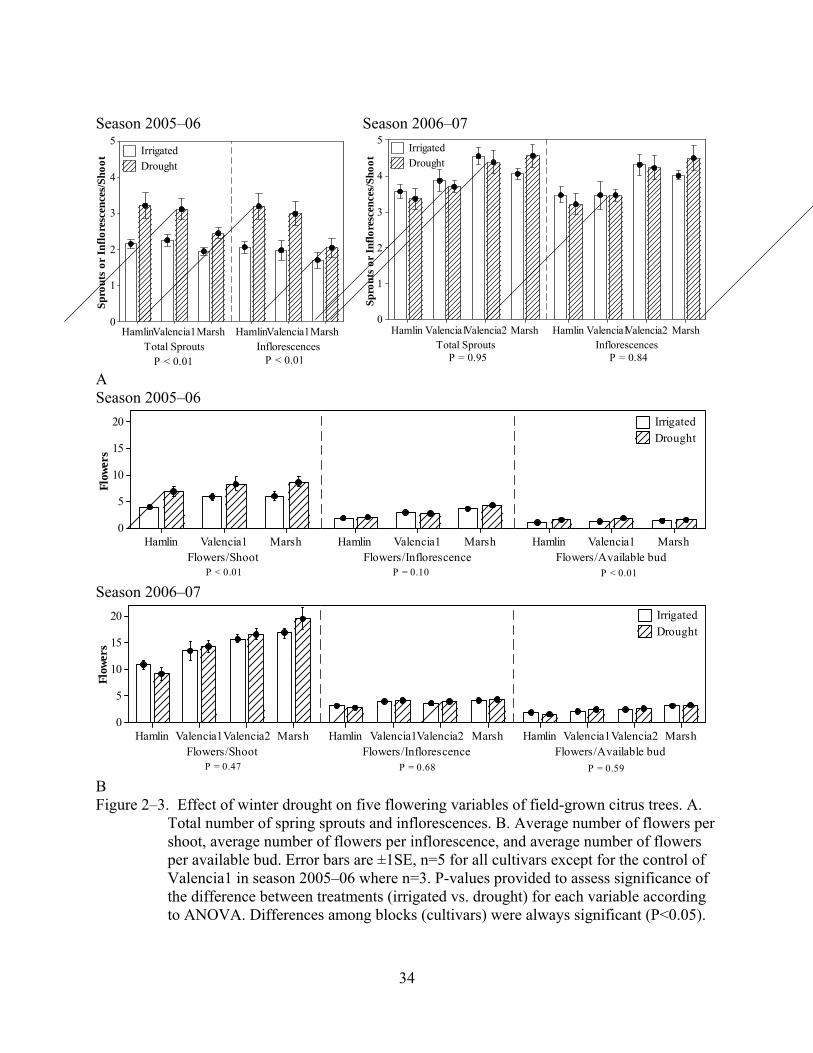
Inductive season 2005–06. Drought significantly increased (p≤0.075) the response of
most of the variables evaluated (Figure 2–3). Drought increased by almost one unit the average
number of sprouts and the average number of inflorescences per shoot in the sweet orange
cultivars, but not in Marsh grapefruit. Trees from the drought treatments in all the cultivars
produced about 2 more flowers per shoot than trees from the irrigated treatments. The number of
flowers per inflorescence was apparently less affected by the drought treatment (p=0.095). The
main effect of blocks (cultivars) was always significant (p<0.05) but did not interact with
drought. In general sweet orange cultivars (‘Valencia’ and ‘Hamlin’) had higher values for all
the variables than ‘Marsh’ grapefruit.
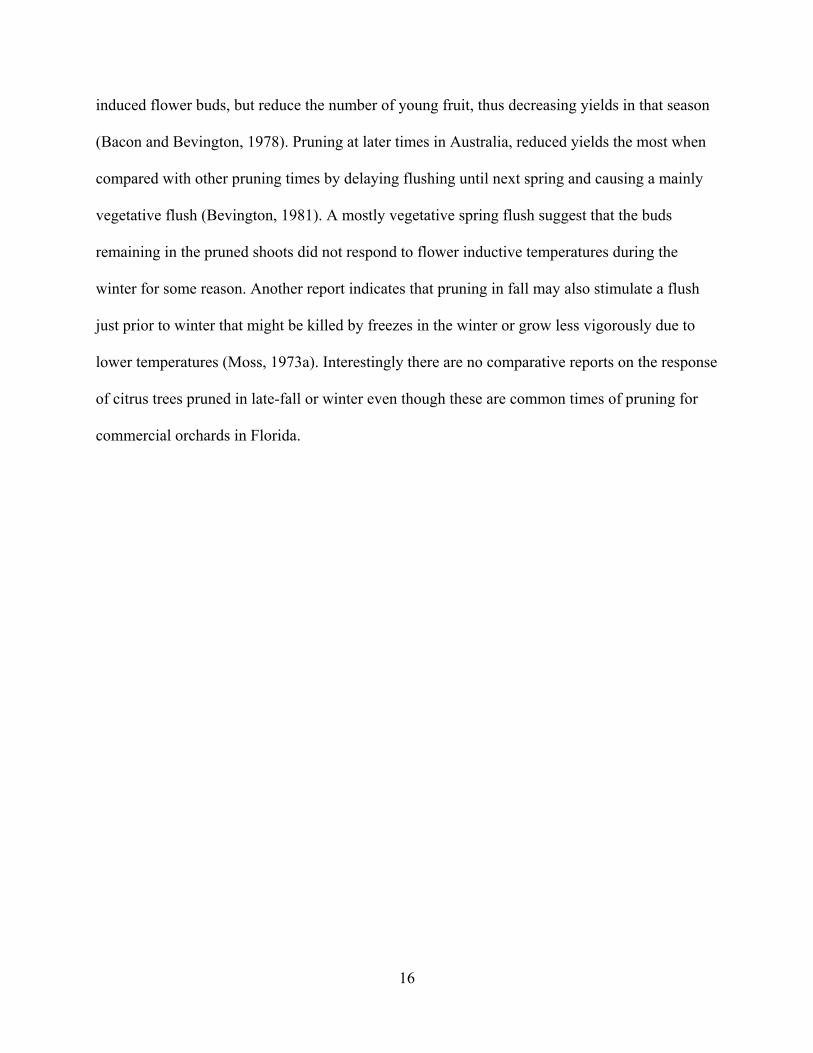
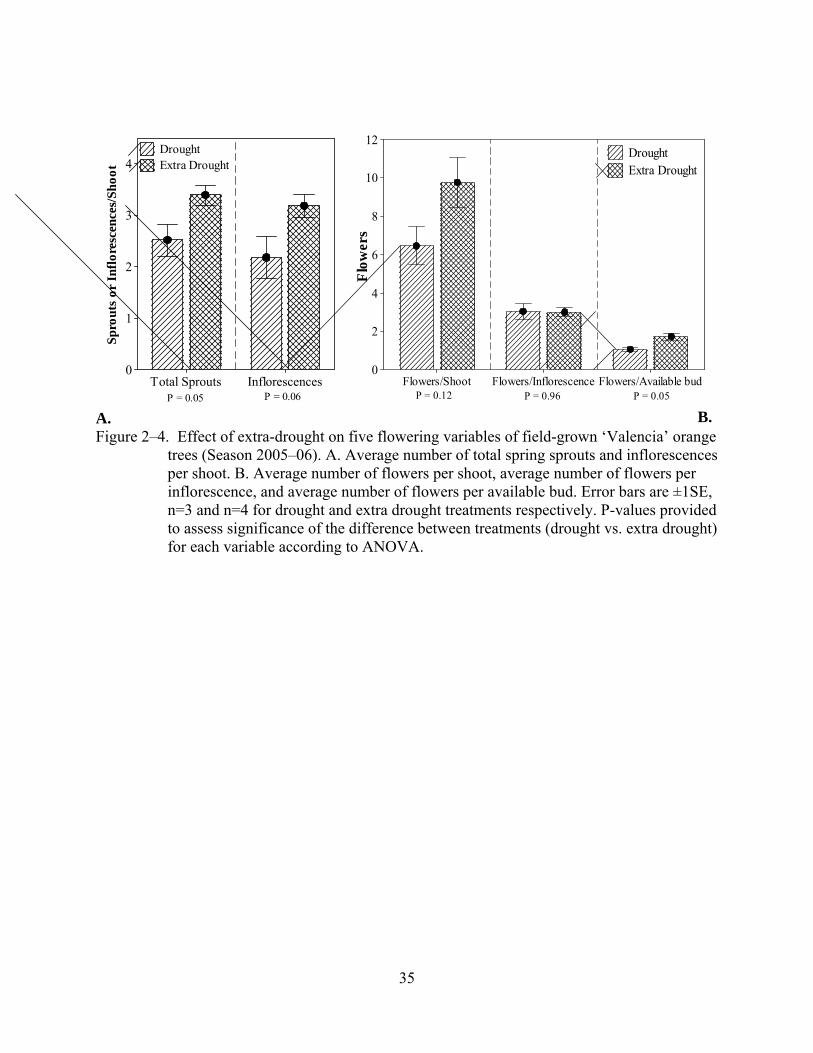
Extra drought significantly (p<0.075) increased the average number of sprouts and
inflorescences per shoot, as well as the average number of flowers per available bud. Trees
subjected to extra drought (‘Valencia’ only) produced about one more sprout and one more
inflorescence per shoot than trees that were only deprived of irrigation (Figure 2–4). Again, the
variable number of flowers per inflorescence was less affected by the additional water stress
treatment.
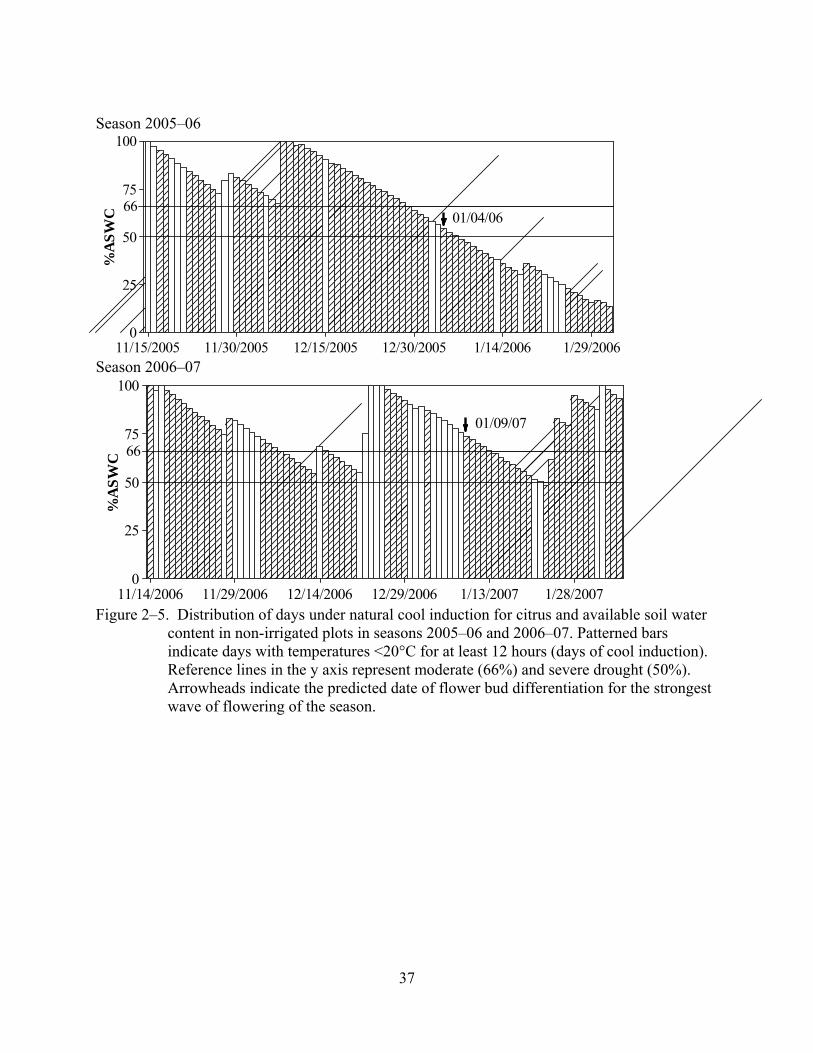
Table 2–3 and Figure 2–5 summarize weather conditions relevant to flower bud induction
in the two seasons of the experiment. Season 2005–06 accumulated 7 days more of combined
induction than season 2006–07. In season 2005–06, 33% depletion of the ASWC occurred six

24
days before the bud differentiation date predicted by the CFM. Two days after the predicted bud
differentiation date, depletion of the ASWC was 50%, and drought continued afterwards for 24
days more until irrigation resumed. Total rainfall accumulation during this experiment was
approximately 48mm.
Inductive season 2006–07. No significant differences were found between drought and
irrigated treatments in the experiment, however some significant differences were found in extra
drought treatments applied to ‘Valencia’ trees (Figure 2–6). Again, the effect of cultivars was
significant but did not interact with water deficit. Extra drought significantly increased the
average number of sprouts and the average number of inflorescences per shoot, but significantly
reduced (P<0.075) the number of flowers per inflorescence. The number of flowers per shoot and
number of flowers per available bud were not affected by water stress in all the blocks.
Weather conditions for season 2006–07 were already presented in Table 2–3. In this
season, days of simultaneous cold and drought inductive conditions started accumulating prior to
the predicted date of bud differentiation, but occurred in two intervals of no more than 7 days
interrupted by days with rain and low cold induction. Total rainfall accumulation during this
experiment was approximately 169mm.
Discussion
Results from the first growth chamber experiment indicate that both factors, temperature
and water deficit, can interact during the flower bud induction process in citrus. Due to this
interaction, trees subjected to drought responded differently when exposed to optimal or
marginal inductive temperatures (Figure 2–2). Based on the main effect of the factors, the values
of the variables were inversely proportional to temperature and water deficit. However, since the
effect of the interaction was significant, simple additivity of the effects of temperature and water
deficit alone can not explain the response observed. Apparently, drought enhances flowering at

25
warmer temperatures, whereas it decreases flowering at cold temperatures. It is of practical
interest that water deficit and temperature may interact to enhance flowering at temperatures that
are marginally inductive. In season 2005–06 trees exposed to drought in the field flowered more
intensely than those that were irrigated (Figure 2–3), possibly confirming the positive effect of
drought detected at marginal inductive temperatures in the growth chamber.
Severe drought (ASWC<50%) is apparently not required to enhance flowering intensity in
field grown trees exposed to natural inductive conditions. In season 2005–06, severe drought
occurred only after the predicted bud differentiation date and therefore it may not have been
necessary to trigger the enhancing effect observed in drought treatments since buds were already
determined to flower. Days of simultaneous cold induction and moderate drought
(50%<ASWC<66%) started accumulating about a week prior to the predicted date of bud
differentiation. These days could have provided the additional induction units that enhanced
flowering, but it is also possible that flower-inductive drought started at ASWC levels higher
than 66% since 7 days may be a short time to cause a response based on our results of the second
season. Nonetheless, another possibility is that the actual date of bud differentiation was delayed
because of the drought, thus allowing for further effective floral induction of the buds.
No differences between drought and irrigated treatments in season 2006–07 may be a
consequence of interrupted drought periods. Sporadic rains during the induction season split the
days of simultaneous cool and drought induction in three periods no longer than a week each.
Two of these periods of potential combined induction occurred prior to the predicted date of
differentiation of the major bloom, but were followed by five days of non inductive conditions
that may have stopped induction and promoted bud differentiation. Lack of differences between
drought and irrigated treatments in 2006–07 in spite of the 2 seven-day intervals accumulated

26
prior to bud differentiation support the hypothesis that 7 days of combined drought and low
temperatures is not enough time to produce a response and that flower inductive drought starts at
levels of ASWC higher than our reference value for moderate drought (66%). It is interesting to
note that in this season trees produced more flowers and inflorescences than in the previous year,
despite equal or reduced accumulation of cool or drought induction. Since the shift was
synchronized in all the blocks, this is might have been due to year-to-year climatic variations
affecting tree vigour, but more specifically previous-season crop load and carbohydrate levels
might have also been a factor.
Further evidence supporting a role of drought in enhancing flowering above the cool
temperature level comes from the experiments in which trees were subjected to extra drought by
covering the soil with an impermeable sheet of Tyvek® to exclude rain (Figures 2–4 and 2–6). In
this treatment more days in which water stress and cool induction occurred simultaneously
should have occurred as well as earlier accumulation of induction units (before bud
differentiation date) since soil water was not replenished by sporadic rains. The number of
sprouts and inflorescences per shoot in the extra drought treatment were clearly increased when
the soil was covered. This response was consistent between both years for the number of sprouts
and inflorescences per shoot. However, fewer flowers per inflorescence were produced in extra
drought treatments during season 2006–07 and this numerically reduced (though not
significantly) the overall level of flowering intensity, as measured by the number of flowers per
available bud, when compared with irrigated trees.
The effect of water stress enhancing flowering at warmer inductive temperatures may be
inherently related with the flower bud induction process and its internal mechanisms (Lovatt et
al., 1988). Nevertheless, what is not clear is why drought reduced flowering at optimal cold

27
inductive temperatures in the growth chamber. One hypothesis is that trees became overstressed
when both stimuli were present at the same time. However, water stress applied in the first
growth chamber experiment was very mild as ψs was never less than -1.1MPa, no more than
0.3MPa below that of irrigated trees, and no visible symptoms of wilting were observed. It is
interesting to note that this level of ψs was almost the same as that registered in field trees on
which irrigation was withhold through the season. Since ambient temperatures during the
induction season in humid subtropical climates usually are not within the optimal inductive
temperature range, this level of water stress was apparently adequate to enhance flowering in the
field under Florida conditions.
It is known that greater accumulation of cold or drought induction hours leads to an
increased number of total sprouts and inflorescences (Moss, 1969; Southwick and Davenport,
1986). Therefore, the increase in number of sprouts and inflorescences reported for these field
experiments suggests that buds of drought treatments perceived more induction units than
irrigated trees (Figures 2–3, 2–4 and 2–6). A similar increase occurred in the growth chamber
experiment providing evidence supporting the hypothesis of increased perception of the
inductive stimuli. On the other hand, the number of flowers per inflorescence was the variable
that was least sensitive to combinations of cold and water stress (the only exception is in Figure
2–6B). This indicated that the number of sprouts and inflorescences produced may be more
important than the number of flowers per inflorescence in determining the level of flowering
intensity in a given season.
Nevertheless, the number of flowers per inflorescence is an imperfect indicator of the type
of inflorescence formed, and inflorescence leafiness is another indicator of the level of induction
perceived by the buds (Moss, 1969). Leafy and leafless inflorescences may often bear the same
28
number of flowers, and a reduction in the number of flowers per inflorescence may more likely
imply a transition toward leafier inflorescences and thus slightly lower perceived level of
induction. The study reported here did not evaluate inflorescence leafiness, so small differences
between irrigated and drought treatments in flower induction may not have been detected in this
aspect. Future studies should evaluate inflorescence leafiness to assess more precisely the level
of induction perceived by the buds. From a practical standpoint, leafier inflorescences (probably
related with lower levels of induction) are more desirable since they set more fruit than leafless
inflorescences.
Growth chamber experiments indicated that water stress and temperature can interact in the
flower induction process in citrus. This interaction had a positive effect at warmer marginal
inductive temperatures and a negative effect at colder optimal inductive temperatures. When
compared to irrigated trees, water stress increased the flowering response variables between 10%
and 130% at warmer temperatures, but reduced flowering by 30% under lower near-optimal
inductive temperatures. Field experiments support a role for water stress enhancing flowering
intensity at warmer inductive temperatures. The average number of sprouts and inflorescences
per shoot had the greatest gain (about 40%) in flowering due to drought for all the variables
evaluated in the field experiments. At least under our experimental conditions, covering the soil
with an impermeable sheet to exclude rain further increases flowering by 20% when compared
with trees for which only irrigation was withheld. Based on the results of the growth chamber
experiment, this increase was probably caused by greater accumulation of days in which cold
and drought occurred at the same time. Field trials using impermeable sheets to cover the soil
and different irrigation programs would be useful to elucidate whether this hypothesis is
supported. The negative effect of drought reported at lower optimal induction temperatures

29
indicates that drought conditions during the inductive season may not be as useful to stimulate
flowering in climates where high accumulation of cool temperatures occurs (i.e. mediterranean
climates). However, for humid subtropical climates, where temperatures during winter are
relatively warm; withholding irrigation in winter may be useful to increase flowering intensity in
commercial groves. Winter precipitation may pose a practical limitation for application of water
stress in the field, as noted in the results of season 2006–07. Evidence reported here indicates
that the reported increase in flowering intensity caused by drought may be due to increased
sprouting and number of inflorescences rather than increased number of flowers per
inflorescence. Experiments with more levels of inductive and non-inductive temperatures would
be helpful to better characterize the interaction of cold and drought in flower bud induction.

30
M
ean
Spr
outs
/sho
ot
9753
2.8
2.4
2.0
1.6
23°C / 18°C15°C / 12°C DroughtIrrigated
Time under Induction Temperature Water Availability
Weeks
Infl
ores
cenc
es/s
hoot
9753
1.6
1.20.8
0.423°C / 18°C15°C / 12°C DroughtIrrigated
Time under Induction Temperature Water Availability
Weeks
Mea
n Fl
ower
s/sh
oot
9753
54321
23°C / 18°C15°C / 12°C DroughtIrrigated
Time under Induction Temperature Water Availability
Weeks
Flow
ers/
Infl
ores
cenc
e
9753
2.6
2.4
2.2
2.023°C / 18°C15°C / 12°C DroughtIrrigated
Time under Induction Temperature Water Availability
Weeks
Flow
ers/
Ava
ilab
le B
ud
9753
0.8
0.6
0.4
0.2
23°C / 18°C15°C / 12°C DroughtIrrigated
Time under Induction Temperature Water Availability
WeeksFigure 2–1. Main effect plots of time under induction, temperature and water deficit on five
flowering variables of potted 4 year old ‘Valencia’ orange trees. A. Average number of sprouts per shoot. B. Average number of inflorescences per shoot. C. Average number of flowers per shoot. D. Average number of flowers per inflorescence E. Average number of flowers per available. Main effects of time under induction and temperature were always significant (P≤0.05) except for the effect of in time of induction on the number of flowers per inflorescence (P=0.16). Main effect of water deficit was never significant according to ANOVA.
A
B
C
D
E

31
Table 2–1. Analysis of variance table of five flowering variables of 4-year-old ‘Valencia’ orange trees after exposure to different flower inductive conditionsy.
Sequential mean squaresP-value Source df Sprouts
per shoot Inflorescences per shoot
Flowers per shootz
Flowers per inflorescencez
Flowers per available budz
Time of induction (A) 3 1.830.05 0.88<0.01 2.780.01 1.210.16 0.420.01 Ambient temperature (B) 1 25.75<0.01 9.05<0.01 26.99<0.01 3.610.02 4.44<0.01 Water deficit (C) 1 0.330.49 0.010.80 0.010.89 0.160.63 0.000.89 A × B 3 1.200.16 0.370.10 0.810.29 0.090.93 0.160.18 A × C 3 0.060.96 0.060.76 0.290.71 0.370.64 0.040.73 B × C 1 3.270.03 1.080.01 2.830.03 0.010.91 0.340.06 A × B × C 3 0.490.53 0.160.41 0.860.26 0.230.78 0.090.42 Error 40 0.66 0.17 0.63 0.66 0.09 Total 55 yTime of induction (3, 5, 7, and 9 weeks), ambient temperature (15/12°C and 23/18°C, day/night), water deficit (irrigated and drought). zANOVA with square root transformed values due to non-normality of residuals of the original data.
32
A
Ave
rage
Spr
outs
/Sho
ot
DroughtIrrigated
3
2
1
15°C / 12°C23°C / 18°C
B
Ave
rage
Inf
lore
scen
ces/
Shoo
tDroughtIrrigated
2
1
0
15°C / 12°C23°C / 18°C
C
Ave
rage
Flo
wers
/Sho
ot
DroughtIrrigated
8
7
6
5
4
3
2
1
0
15°C / 12°C23°C / 18°C
D
Ave
rage
Flo
wers
/Inf
lore
scen
ce
DroughtIrrigated
3.5
3.0
2.5
2.0
1.5
15°C / 12°C23°C / 18°C
EAv
erag
e Fl
ower
s/A
vaila
ble
Bud
DroughtIrrigated
1.25
1.00
0.75
0.50
0.25
0.00
15°C / 12°C23°C / 18°C
Figure 2–2. Growth Chamber Experiment I. Interaction plots Temperature x Water Deficit for five flowering variables of 4-year-old potted ‘Valencia’ orange trees. A. Average number of sprouts per shoot. B. Average number of inflorescences per shoot. C. Average number of flowers per shoot. D. Average number of flowers per inflorescence E. Average number of flowers per available bud. Values are means and bars are ±1SE (n=8). Reference dashed line in the y axis is the grand mean of the variable (n=64). All interactions presented were statistically significant (P<0.05) according to ANOVA, except for the number of flowers per inflorescence (P=0.91)
33
Table 2–2. Growth Chamber Experiment II. Number of 4-year-old potted ‘Valencia’ orange trees that flowered after exposure to inductive conditionsy.
Time of Exposure to Inductive Conditions (weeks) Temperature, Plant Water Status 3 5 7 9 20/10°C, Droughtz 2 3 4 3 20/10°C, Irrigated 2 - 2 - 27/21°C, Drought - - 2 1 27/21°C, Irrigated - - - - y Numbers are counts out of a total of 4 trees for each treatment. Number of flowers ranged from 1 – 95 flowers per tree. Hyphens indicate that all the trees in that treatment produced only vegetative shoots after floral induction. z Plants of the drought treatments had midday stem water potential readings 2.7–3.0MPa below those of irrigated plants. Stem water potential of irrigated plants ranged between -0.46 and -0.64MPa.
34
Season 2005–06
Spro
uts
or I
nflo
resc
ence
s/Sh
oot
InflorescencesTotal SproutsMarshValencia1HamlinMarshValencia1Hamlin
5
4
3
2
1
0
IrrigatedDrought
P < 0.01 P < 0.01 A
Season 2006–07
Spro
uts
or I
nflo
resc
ence
s/Sh
oot
InflorescencesTotal SproutsMarshValencia2Valencia1HamlinMarshValencia2Valencia1Hamlin
5
4
3
2
1
0
IrrigatedDrought
P = 0.95 P = 0.84
Season 2005–06
Flow
ers
Flowers/Available budFlowers/InflorescenceFlowers/ShootMarshValencia1HamlinMarshValencia1HamlinMarshValencia1Hamlin
20
15
10
5
0
IrrigatedDrought
P < 0.01 P < 0.01P = 0.10 Season 2006–07
Flow
ers
Flowers/Available budFlowers/InflorescenceFlowers/ShootMarshValencia2Valencia1HamlinMarshValencia2Valencia1HamlinMarshValencia2Valencia1Hamlin
20
15
10
5
0
IrrigatedDrought
P = 0.47 P = 0.68 P = 0.59 B Figure 2–3. Effect of winter drought on five flowering variables of field-grown citrus trees. A.
Total number of spring sprouts and inflorescences. B. Average number of flowers per shoot, average number of flowers per inflorescence, and average number of flowers per available bud. Error bars are ±1SE, n=5 for all cultivars except for the control of Valencia1 in season 2005–06 where n=3. P-values provided to assess significance of the difference between treatments (irrigated vs. drought) for each variable according to ANOVA. Differences among blocks (cultivars) were always significant (P<0.05).
35
Sp
rout
s or
Inf
lore
scen
ces/
Shoo
t
InflorescencesTotal Sprouts
4
3
2
1
0
DroughtExtra Drought
P = 0.05 P = 0.06 A.
Flow
ers
Flowers/Available budFlowers/InflorescenceFlowers/Shoot
12
10
8
6
4
2
0
DroughtExtra Drought
P = 0.12 P = 0.96 P = 0.05 B.
Figure 2–4. Effect of extra-drought on five flowering variables of field-grown ‘Valencia’ orange trees (Season 2005–06). A. Average number of total spring sprouts and inflorescences per shoot. B. Average number of flowers per shoot, average number of flowers per inflorescence, and average number of flowers per available bud. Error bars are ±1SE, n=3 and n=4 for drought and extra drought treatments respectively. P-values provided to assess significance of the difference between treatments (drought vs. extra drought) for each variable according to ANOVA.

36
Table 2–3. Accumulation of days under cool and drought flower bud induction conditions for citrus in seasons 2005–06 and 2006–07 in Lake Alfred, Floridaw.
<15°Cx 15°C–20°C >20°C Sum 2005–06 <50%ASWCy 11(0)z 9(0) 6(0) 26(0) 50%–66%ASWC 3(2) 4(3) 2(2) 9(7) > 66%ASWC 17(17) 17(17) 10(10) 44(44) Sum 2005–06 31(19) 30(20) 18(12) 79(51) 2006–07 <50%ASWC 0(0) 1(0) 0(0) 1(0) 50%–66%ASWC 3(2) 16(9) 3(1) 22(12) > 66%ASWC 20(11) 17(12) 24(22) 61(45) Sum 2006–07 23(13) 34(21) 27(23) 84(57)
w Season 2005–06 from 11/15/05 to 02/01/06 (78 days). Season 2006–07 from 11/14/06 to 02/05/07 (83 days).
x Days with at least 12h at the indicated temperature range. y ASWC = Volumetric available soil water content. z Numbers in parenthesis indicate days accumulated from the beginning of the experiment until
the predicted date of bud differentiation for each category.
37
Season 2005–06
%A
SWC
1/29/20061/14/200612/30/200512/15/200511/30/200511/15/2005
100
75
50
25
0
6601/04/06
Season 2006–07
%A
SWC
1/28/20071/13/200712/29/200612/14/200611/29/200611/14/2006
100
75
50
25
0
66
01/09/07
Figure 2–5. Distribution of days under natural cool induction for citrus and available soil water
content in non-irrigated plots in seasons 2005–06 and 2006–07. Patterned bars indicate days with temperatures <20°C for at least 12 hours (days of cool induction). Reference lines in the y axis represent moderate (66%) and severe drought (50%). Arrowheads indicate the predicted date of flower bud differentiation for the strongest wave of flowering of the season.

38
Sp
rout
s or
Inf
lore
scen
ces/
Shoo
t
InflorescencesTotal Sprouts
8
7
6
5
4
3
2
1
0
IrrigatedDroughtExtra Drought
a
bb b b
a
A.
Flow
ers
Flowers/Available budFlowers/InflorescenceFlowers/Shoot
20
15
10
5
0
IrrigatedDroughtExtra Drought
aab b
aa
a
a a a
B. Figure 2–6. Effect of two levels of drought on five flowering variables of field-grown ‘Valencia’
sweet orange trees (Season 2006–07). A. Average number of total spring sprouts and inflorescences per shoot. B. Average number of flowers per shoot, average number of flowers per inflorescence, and average number of flowers per available bud. Error bars are ±1SE, n=5. Different letters above the bars indicates statistical difference according to Fisher’s protected LSD procedure (α=0.075).

39
CHAPTER 3 EFFECT OF LATE FALL TIPPING OF SUMMER FLUSH ON SUBSEQUENT FLOWER
BUD INDUCTION IN FLORIDA ORANGES
Introduction
Hedging and topping in citrus may induce regrowth flushes composed of only vigorous
vegetative shoots without flowers if performed too intensely or followed by warm weather
(Bevington, 1980; Bacon, 1981). In addition, more frequent and intense vegetative regrowth
increases the susceptibility of citrus trees to pest and diseases, including citrus canker
(Xanthomonas axonopodis pv. citri) and greening (“Candidatus Liberibacter”, Huanglongbing,
HLB) (Graham et al., 2004; Halbert and Manjunath, 2004). Limiting flushing frequency and
coordinating its timing and intensity within a region was proposed to help improve pesticide
coverage and thereby decrease susceptibility of the trees to these diseases (Albrigo et al., 2007).
Light pruning of the outer 0.2m of the canopy in spring just prior to flowering is regarded
as the most effective pruning time and intensity for commercial citrus orchards in the
mediterranean climate of Australia (Bacon and Bevington, 1978; Bevington, 1980). At this time
of the year, the risk of freezes killing the new flush is low, as well as the potential for flower and
fruit losses (Davies and Albrigo, 1994), at least for early and mid-season varieties. Nonetheless,
early spring pruning may remove a number of induced flower buds, thus reducing that season’s
flowering intensity and increasing the production of vegetative shoots (Davies and Albrigo,
1994).
In mediterranean climates, fall hedging produces less vigorous regrowth and reportedly
reduced fruitfulness of the regrowth than spring pruning (Bacon and Bevington, 1978; Bacon,
1981). Reduced vigour of this flush has been related with the onset of low temperatures during
winter that limits vegetative growth (Moss, 1973a) On the other hand, reduced fruitfulness may
be a consequence of immature fall flush meristems from the 1st regrowth not being able to

40
respond to floral-inductive winter temperatures (incompetence to flower). Citrus shoots require
6–8 weeks of development in order for their buds to become fully responsive to floral induction
(Albrigo, unpublished data). If hedging occurred close enough to the onset of floral-inductive
winter temperatures, the occurrence of a fall flush would be avoided and only mature buds would
be subjected to floral induction. Precise timing of this program may be more important in humid
subtropical climates, such as Florida (U.S.A.) or São Paulo (Brazil) in which accumulation of
hours below the floral-inductive threshold (20°C, Moss, 1969; Valiente and Albrigo, 2000) is
less than in mediterranean climates. Also, Valiente and Albrigo (2004) noted that bud positions
1–4 (counting from the apex) produce most of the flowers in a given season (>80%), supporting
previous views of apical dominance influencing flower bud induction (Lovatt et al., 1984). Since
more basal bud positions are still able to flower but at a much lesser intensity, these buds are
competent to flower but may be kept from doing so by apical dominance effects of distal buds
during the floral-induction process.
In this study, we tested the hypothesis that removal of the four most apical buds of
moderately vigorous summer shoots (>8 nodes long) just prior to the onset of floral-inductive
temperatures (mimicking a light late-fall hedging) changes flowering intensity in reference to
intact shoots but does not precludes flowering . If true, then tipping transfers flowering to the
new terminal buds (formerly less inducible basal buds) during next spring’s flush. The objective
of this study was therefore to determine if late fall tipping modifies the flowering intensity of the
next spring flush. Results of this study should provide useful information for the further
exploration of hedging timing for horticultural and pest-management purposes in citrus.
Materials and Methods
A field experiment was conducted using adult ‘Valencia’ and ‘Hamlin’ sweet orange trees
(Citrus sisnesis Osbeck) growing in Candler sand (hyperthermic, uncoated typic
41
Quartzipsamments). The two adjacent experimental plots with similar characteristics were
located at the University of Florida’s Citrus Research and Education Center in Lake Alfred,
Florida (28°5′ N, 81°43′ W). The experiment was conducted in two successive seasons at the
same location (2005–06 and 2006–07).
Experiments were conducted using a randomized block split-plot design with 10 and 6
replicates in season 2005–06 and 2006–07, respectively. Individual trees were used as blocks and
were nested within the main plot. Each experimental unit consisted of half of all the vigorous (>8
nodes long) summer shoot pairs present on the trees. On each tree there were at least 4
subreplicates per treatment.
The factors evaluated were Cultivar (main plot) and Tipping (subplot). Tipping consisted
of two treatments: 4 most apical buds (nodes) removed, and intact shoots which served as
controls. Cultivar consisted of two levels: ‘Valencia’ and ‘Hamlin’ sweet orange trees.
Treatments were applied to shoots >8 nodes long and similar in vigour. Tip removal was done
manually using pruning clippers. Inductive cool hours (<20°C) accumulated by the date the
treatments were applied were 322h and 155h for the 2005–06 and 2006–07 inductive seasons,
respectively. Subsequent hours of induction after tipping for these seasons were 1216 (01/04/06)
and 1156 (01/09/07) as of the predicted date of bud differentiation responsible for the strongest
flowering wave (DISC’s Citrus Flowering Monitor, © University of Florida). Trees received
proper irrigation throughout the experiment.
The number of available buds, number of sprouts, number of inflorescences (all types:
leaf-abundant, leaf-deficient, and single flowers), total number of flowers per shoot, sprout
position (1–4, 5–8, >8), and type of sprout were evaluated at bloom. The proportion of
inflorescences forming and proportions of each type of inflorescences were calculated from the
42
variables listed above. For the sake of simplification of the analysis, inflorescences were divided
in three types: leaf-abundant inflorescences (La; inflorescences with a leaf to flower ratio ≥ 1),
leaf deficient inflorescences (Ld; inflorescences with a leaf to flower ratio < 1) (Lovatt et al.,
1984) and single flowers (one flower no leaves). Data were analyzed using analysis of variance
(SAS®, SAS Institute Inc.). In season 2006–07, an additional comparison was performed
between whole tipped shoots and bud positions >4 of intact shoots with the intention to indirectly
compare the flowering response of shoots tipped in the fall (tipped shoots) and shoots tipped
after bud differentiation (positions >4 in intact shoots; bud position #5 in intact shoots
corresponds to bud position #1 in late-fall tipped shoots). For this last comparison, only the
number of sprouts, number of inflorescences, and type of sprout were analyzed.
Results
Tipping the four most apical meristems removed about 27% of the total number of buds
available for induction taking the number of available buds in intact shoots as reference. Tipping
reduced the number of sprouts, inflorescences, and flowers per shoot, when compared with intact
shoots but did not affect the number of flowers per inflorescence (Figure 3–1). However, in
percentages, tipped shoots were not different than intact shoots in the proportion of available
buds sprouting (Table 3–1). Tipped shoots produced either higher or equal number of leaf-
abundant inflorescences than intact shoots but had less leaf-deficient inflorescences than intact
shoots, and had more vegetative sprouts per shoot than intact shoots (Figure 3–2). Results for the
number of single flowers were inconsistent in that differences between tipped and intact shoots
were significant only in the season 2006–07 but not in 2005–06, however, tipping numerically
reduced the number of single flowers formed when compared with intact shoots in both seasons
(Table 3–1, Figure 3–2). The effect of cultivars and interactions between cultivars and tipping
were not consistent between the two seasons evaluated for any of the variable above mentioned.
43
Roughly, 1–2 sprouts and inflorescences were lost on each shoot due to tipping using intact
shoots as reference. All the treatments flowered at the same time and none of the tagged shoots
showed late-fall/early winter sprouting.
Sprouting at different bud positions along the shoot was less in tipped shoots than in intact
shoots (Figure 3–3). However, at bud positions 1–4, differences in the number of sprouts
between tipped and intact shoots were numerically smaller and sometimes not significant (season
2005–06) when compared to bud positions 5–8 and >8. The percentage of leaf-deficient
inflorescences and single flower inflorescences formed in the 4 most apical buds of tipped shoots
was lower than in the 4 most apical buds of intact shoots, but the percent of vegetative sprouts
was higher in these bud positions (1–4) in the tipped shoots than of intact shoots (Figure 3–4).
The proportion of leaf-abundant inflorescences formed in the 4 most apical buds was not affected
by tipping, but for ‘Valencia’ it was numerically higher. Again, neither cultivars nor interactions
between cultivars and tipping significantly affected sprouting and the type of
inflorescence/sprout formed at different bud positions.
In a theoretical comparison of buds tipped in late fall and after the bud differentiation date
(buds >4 in intact shoots), there were significantly more sprouts, inflorescences, leaf-abundant
inflorescences and vegetative sprouts in tipped shoots than in intact shoots, whereas the number
of leaf-deficient inflorescences and single flower inflorescences were the same for both
treatments (Table 3–2).
Discussion
Late fall tipping reduced flowering intensity in the next spring, but stimulated sprouting
and flowering in buds that otherwise would not have flowered. The overall reduction in
flowering intensity may be due to two factors: a) reduction of the number of buds available for
flower-induction and/or b) loss of units of flower induction (hours <20°C) in the buds removed.
44
Less flowering in tipped shoots (versus intact shoots) due to reduction in the number of
buds available for induction was verified by: 1) significant differences in the number of sprouts
per shoot but non-significant differences in the percent of buds sprouting in each shoot (Figure
3–1 and Table 3–1), and 2) the number of sprouts per shoot in tipped shoots was ≈75% that of
intact shoots, the same proportional reduction that tipping caused in the total number of buds
available for flower induction (≈73%).
On the other hand, the difference in the number of sprouts per shoot between tipped and
intact shoots roughly parallels the difference in the number of inflorescences per shoot between
tipped and intact shoots (Figure 3–1), suggesting that those sprouts that were lost were mainly
inflorescences. In addition, the difference in the number of leaf-abundant inflorescences and
vegetative shoots between tipped and intact shoots was fractional whereas the difference in the
number of leaf-deficient inflorescences was often greater or equal to 1 (Figure 3–2), indicating
that less flowering in tipped shoots, as compared with intact shoots, was due to less leaf-deficient
inflorescences forming and an increase in the number vegetative sprouts. The proportion of
leafier inflorescences (based on the leaf to flower ratio) and vegetative sprouts increases when
citrus trees are exposed to less intense inductive temperatures (Moss, 1969); therefore,
considering that buds in tipped shoots were competent to flower, this may indicate that some
induction units already accumulated by the date of tipping were lost in those buds that were
removed. However, it is interesting to note that the number of flowers per inflorescence was not
different between tipped and intact shoots, suggesting that leaf-abundant and leaf-deficient
inflorescences had approximately the same number of flowers, and therefore the main difference
between the types of inflorescences must have been the number of leaves accompanying the
flowers.
45
Higher sprouting and flowering at the four most apical buds of tipped shoots (formerly
buds 5–8 before tipping) when compared with more basal positions indicates that apical
dominance was reset in the new most apical buds (positions 1–4 in tipped shoots) (Figure 3–3).
Sprouts in new positions 1–4 of tipped shoots were mostly inflorescences, but there was a higher
percentage of vegetative sprouts in tipped shoots than in intact shoots. This supports our previous
claim of lower level of induction of the buds in tipped shoots due to loss of partially induced
buds after tipping.
Future experiments including earlier dates of tipping and different tipping intensities could
be useful to maximize the exposure of the buds in the tipped shoots to floral inductive stimuli
possibly increasing the intensity of flowering. Also, these studies would help determine how
early in the fall tipping can be done without stimulating a late fall flush. However, even though
the number of flowers produced in a given season is an important factor determining yield
(Moss, 1973b), it has been shown also that inflorescences with leaf:flower ratio >1 set more fruit
than inflorescences with leaf:flower ratio <1 (Sauer, 1954; Moss, 1970). In this experiment small
or no differences were found for the number of leaf-abundant inflorescences produced in tipped
and intact shoots. Therefore it is not clear whether the reduction in flowering intensity observed
here will have a parallel effect on fruit-set and yield since most of the flowers that were lost due
to tipping came (hypothetically) from inflorescences that had fewer number of leaves than
flowers (less fruitful; Sauer, 1954). Future experiments should include fruit-set data to clarify
this point.
The comparison of late fall tipped shoots and bud positions >4 of intact shoots provided
insights on the difference of the flowering responses of shoots tipped early during flower
induction and after the bud differentiation date, when floral induction is over. Late fall tipped
46
shoots produced more sprouts and inflorescences than bud positions >4 of intact shoots,
indicating that late fall tipping may minimize reductions in flowering intensity when compared
with tipping times later than the bud differentiation date (Table 3–2). Moreover, a tendency
toward leafier inflorescences in late fall tipped shoots implies that fruit set could be better after
late fall tipping than tipping after bud differentiation. More vegetative sprouts in late fall tipped
shoots at the cost of a reduction in leaf-deficient and single flower inflorescences may be useful
to provide young bearing-wood for next season’s flower induction.
The results of these experiments provide evidence supporting the hypothesis that late fall
hedging changes the flowering intensity observed in the following spring flush. The observed
reduction in flowering intensity after tipping in late fall may have been caused by two factors:
the reduction in the total number of buds available for flower induction, and the loss of induction
units already accumulated in the removed buds. While the first factor was unavoidable, tipping
earlier in the fall may reduce the loss of induction units and increase flowering intensity.
However, it is not clear if increasing flowering intensity per se in our experiments would have
been beneficial from a commercial standpoint. The loss in flowering intensity observed was
related to a reduction in the number of inflorescences with less number of leaves than flowers,
which generally set less fruit than inflorescences with more leaves than flowers and an increase
in vegetative sprouts. However, the number of leafier inflorescences, which tend to set more
fruit, remained almost unaffected after tipping. Late fall hedging may not avoid yield losses but
it may recover much of the flowering bud potential otherwise lost from hedging after induction.
It is not clear how this effect compares with yields derived from other timings of tipping. Further
experiments including more tipping times and fruit-set/yield data, as well as tipping intensity
(number of buds removed) during maintenance hedging in commercial groves will help elucidate
47
whether late fall hedging is a viable option for tree size control and maintaining adequate new
vegetative flushes while having less impact in flowering and yields of sweet orange trees grown
in humid subtropical climates.

48
A
ValenciaHamlin
7
6
5
4
3
2
1
0ValenciaHamlin
6
5
4
3
2
1
0ValenciaHamlin
35
30
25
20
15
10
5
0ValenciaHamlin
5
4
3
2
1
0
Total Sprouts Inflorescences Flowers Flowers/InflorescenceIntactTipped
a
b
a
b a
b
a
b
a
b
a
b
aa
aa
B
ValenciaHamlin
8
7
6
5
4
3
2
1
0ValenciaHamlin
7
6
5
4
3
2
1
0ValenciaHamlin
30
25
20
15
10
5
0ValenciaHamlin
5
4
3
2
1
0
Total Sprouts Inflorescences Flowers/Shoot Flowers/Inflorescence IntactTippeda
b
a
b
a
b
a
b
a
b
a
b
a a
a a
Figure 3–1. Primary flowering intensity parameters of late-fall tipped vigorous summer shoots of ‘Hamlin’ and ‘Valencia’ sweet orange trees under field conditions on two successive seasons. A. Season 2006–07. B. Season 2006–07. Values are means of 10 and 6 trees for season 2005–06 and 2006–07 respectively (≥ 4 subreplicates/tree/treatment). Bars are 1SE of the mean (pooled). Different letters within each variety indicate significant differences between treatments (tipped vs. intact) for that variable according to Fisher’s protected LSD (α=0.05).
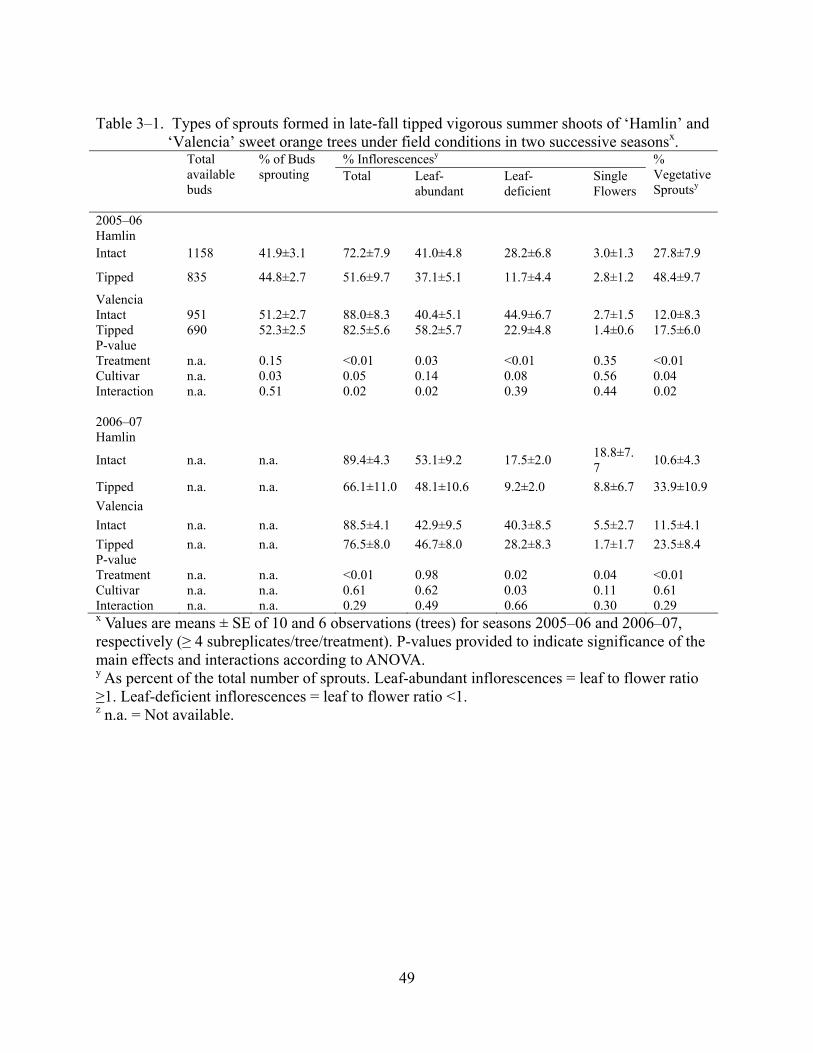
49
Table 3–1. Types of sprouts formed in late-fall tipped vigorous summer shoots of ‘Hamlin’ and
‘Valencia’ sweet orange trees under field conditions in two successive seasonsx. % Inflorescencesy Total
available buds
% of Buds sprouting Total Leaf-
abundant Leaf-deficient
Single Flowers
% Vegetative Sproutsy
2005–06 Hamlin Intact 1158 41.9±3.1 72.2±7.9 41.0±4.8 28.2±6.8 3.0±1.3 27.8±7.9
Tipped 835 44.8±2.7 51.6±9.7 37.1±5.1 11.7±4.4 2.8±1.2 48.4±9.7
Valencia Intact 951 51.2±2.7 88.0±8.3 40.4±5.1 44.9±6.7 2.7±1.5 12.0±8.3 Tipped 690 52.3±2.5 82.5±5.6 58.2±5.7 22.9±4.8 1.4±0.6 17.5±6.0 P-value Treatment n.a. 0.15 <0.01 0.03 <0.01 0.35 <0.01 Cultivar n.a. 0.03 0.05 0.14 0.08 0.56 0.04 Interaction n.a. 0.51 0.02 0.02 0.39 0.44 0.02 2006–07 Hamlin
Intact n.a. n.a. 89.4±4.3 53.1±9.2 17.5±2.0 18.8±7.7 10.6±4.3
Tipped n.a. n.a. 66.1±11.0 48.1±10.6 9.2±2.0 8.8±6.7 33.9±10.9 Valencia Intact n.a. n.a. 88.5±4.1 42.9±9.5 40.3±8.5 5.5±2.7 11.5±4.1 Tipped n.a. n.a. 76.5±8.0 46.7±8.0 28.2±8.3 1.7±1.7 23.5±8.4 P-value Treatment n.a. n.a. <0.01 0.98 0.02 0.04 <0.01 Cultivar n.a. n.a. 0.61 0.62 0.03 0.11 0.61 Interaction n.a. n.a. 0.29 0.49 0.66 0.30 0.29 x Values are means ± SE of 10 and 6 observations (trees) for seasons 2005–06 and 2006–07, respectively (≥ 4 subreplicates/tree/treatment). P-values provided to indicate significance of the main effects and interactions according to ANOVA. y As percent of the total number of sprouts. Leaf-abundant inflorescences = leaf to flower ratio ≥1. Leaf-deficient inflorescences = leaf to flower ratio <1. z n.a. = Not available.

50
A
vera
ge N
umbe
r of
Spr
outs
/ Sh
oot
VegetativeSingle FlowerLeaf-deficientLeaf-abundantValenciaHamlinValenciaHamlinValenciaHamlinValenciaHamlin
3
2
1
0
IntactTipped
P = 0.23 P < 0.01 P = 0.16 P = 0.01
A
Ave
rage
Num
ber
of S
prou
ts /
Shoo
t
VegetativeSingle FlowerLeaf-deficientLeaf-abundantValenciaHamlinValenciaHamlinValenciaHamlinValenciaHamlin
5
4
3
2
1
0
IntactTipped
P = 0.02 P < 0.01 P = 0.01 P = 0.01
B Figure 3–2. Distribution of different types of sprouts on late-fall tipped and intact summer
shoots of ‘Hamlin’ and ‘Valencia’ sweet orange trees, under field conditions. A. Season 2005–06, B. Season 2006–07. Leaf-abundant inflorescences = leaf to flower ratio ≥1. Leaf-deficient inflorescences = leaf to flower ratio <1. Error bars are ±1SE of the mean (n=10 and n=6 for A and B, respectively, with > 4 sub replicates/treatment/tree). P-values provided to assess significance between treatments (tipped vs. intact).
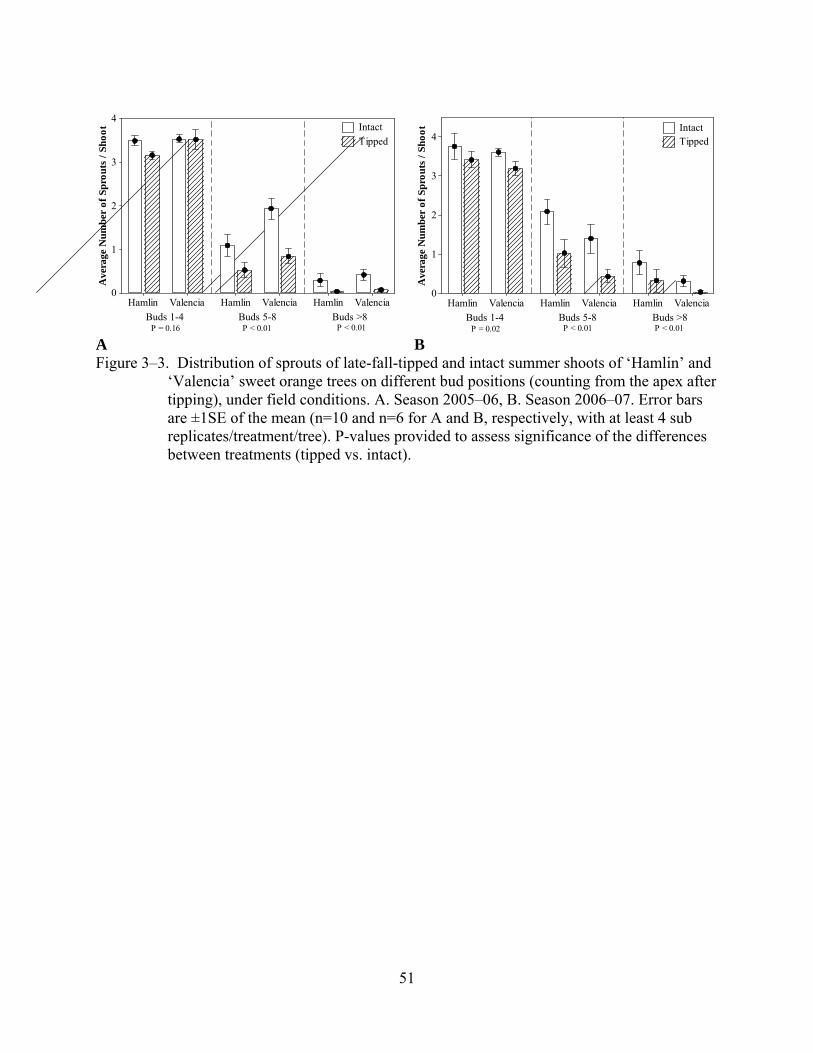
51
A
vera
ge N
umbe
r of
Spr
outs
/ Sh
oot
Buds >8Buds 5-8Buds 1-4ValenciaHamlinValenciaHamlinValenciaHamlin
4
3
2
1
0
IntactTipped
P = 0.16 P < 0.01 P < 0.01 A
Ave
rage
Num
ber
of S
prou
ts /
Shoo
t
Buds >8Buds 5-8Buds 1-4ValenciaHamlinValenciaHamlinValenciaHamlin
4
3
2
1
0
IntactTipped
P = 0.02 P < 0.01 P < 0.01 B
Figure 3–3. Distribution of sprouts of late-fall-tipped and intact summer shoots of ‘Hamlin’ and ‘Valencia’ sweet orange trees on different bud positions (counting from the apex after tipping), under field conditions. A. Season 2005–06, B. Season 2006–07. Error bars are ±1SE of the mean (n=10 and n=6 for A and B, respectively, with at least 4 sub replicates/treatment/tree). P-values provided to assess significance of the differences between treatments (tipped vs. intact).
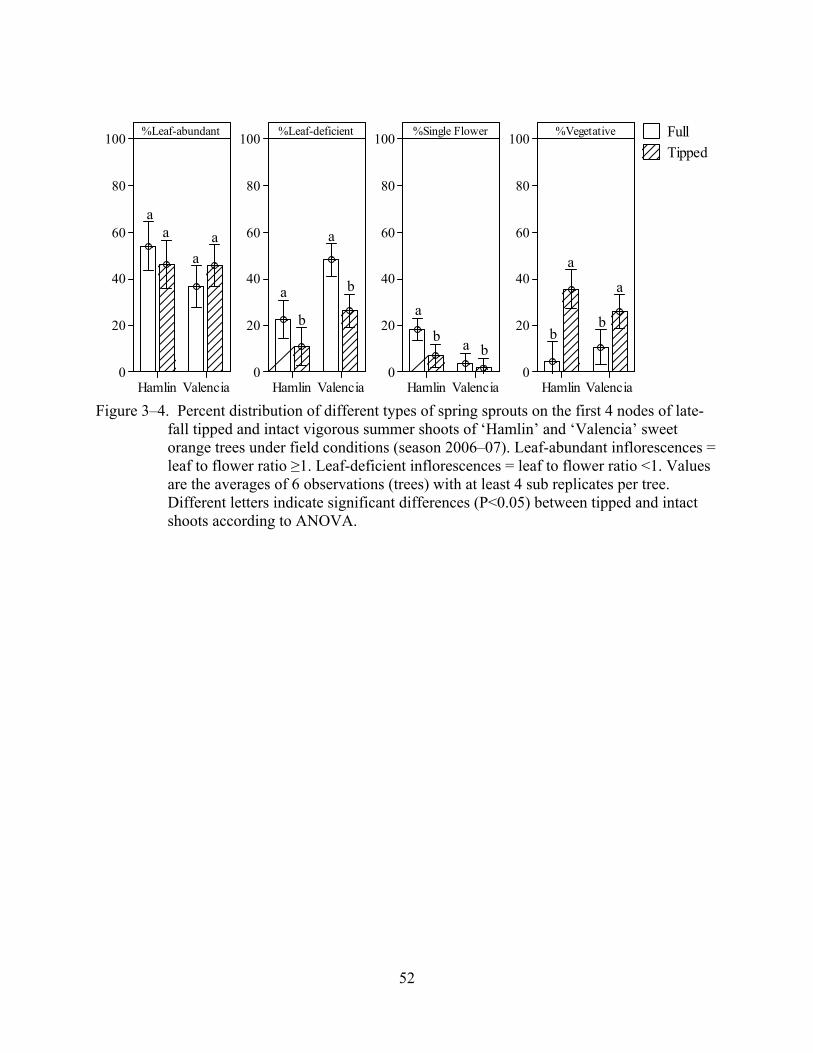
52
ValenciaHamlin
100
80
60
40
20
0ValenciaHamlin
100
80
60
40
20
0ValenciaHamlin
100
80
60
40
20
0ValenciaHamlin
100
80
60
40
20
0
%Leaf-abundant %Leaf-deficient %Single Flower %Vegetative FullTipped
aa
aa
a
b
a
ba
b a bb
a
a
b
Figure 3–4. Percent distribution of different types of spring sprouts on the first 4 nodes of late-
fall tipped and intact vigorous summer shoots of ‘Hamlin’ and ‘Valencia’ sweet orange trees under field conditions (season 2006–07). Leaf-abundant inflorescences = leaf to flower ratio ≥1. Leaf-deficient inflorescences = leaf to flower ratio <1. Values are the averages of 6 observations (trees) with at least 4 sub replicates per tree. Different letters indicate significant differences (P<0.05) between tipped and intact shoots according to ANOVA.

53
Table 3–2. Comparison of five flowering parameters between late-fall summer shoots tipped at bud position 4 (from the apex) and bud positions >4 of intact summer shoots ‘Hamlin’ and ‘Valencia’ sweet orange trees, under field conditions (season 2006–07)y.
Inflorescences Sprouts/Shoot Total Leaf-
abundantz Leaf-deficientz
Single Flowers
Vegetative Sprouts
Hamlin Intact 3.74±0.68 2.96±0.69 2.12±0.75 0.41±0.11 0.43±0.17 0.64±0.28 Tipped 4.74±0.77 3.10±0.76 2.34±0.66 0.46±0.16 0.30±0.20 1.64±0.43 Valencia Intact 2.61±0.61 2.04±0.39 1.20±0.41 0.66±0.16 0.19±0.09 0.32±0.16 Tipped 3.71±0.38 2.80±0.43 1.81±0.42 0.95±0.25 0.04±0.04 0.91±0.32 P-value 0.01 0.04 0.06 0.38 0.18 <0.01 y Values are means ± SE of 6 observations (trees) with at least 4 sub replicates per tree per treatment. P-values provided to assess significance of the differences between means of intact and tipped shoots according to ANOVA (split-plot with nested randomized blocks). No difference for cultivars or interaction was detected. z Leaf-abundant inflorescences = leaf to flower ratio ≥1. Leaf-deficient inflorescences = leaf to flower ratio <1
54
CHAPTER 4 CONCLUSIONS
We studied some factors that affect flower bud induction in sweet oranges under humid
subtropical conditions and show some potential to enhance flowering in commercial orchards in
Florida. Several conclusions follow:
• Drought enhances flower bud induction in sweet orange trees at marginal inductive temperatures but reduces induction at lower near-optimal inductive temperatures, apparently due to an interaction between ambient temperatures and water deficit.
• Under humid subtropical conditions of Florida, reducing water availability to trees during by only withholding irrigation during the winter can increase flowering intensity if rainfall is scarce.
• Late fall tipping of summer shoots can reduce subsequent flowering in these shoots when compared to intact shoots, but some flowering was transferred to more basal buds that otherwise would neither sprout nor flower.
• Shoot tipping in late fall may provide more intense flowering in the spring flush than tipping in winter or tipping in spring just before bloom.
• Late fall tipping can cause an increase in the number and proportion of inflorescence leaves, inflorescences and vegetative shoots formed in the spring compared to tipping after induction.
Future growth chamber experiments including more levels of temperature and drought
would be useful to confirm the interactive effects observed in our growth chamber experiment.
On the other hand, confirmation of interactive effects in the field is more elusive, but analysis of
accumulation of days of cool induction, drought induction and both simultaneously on more
seasons and more plots could be useful to complement findings of growth chamber studies
dealing the with potential interactive effects of ambient temperatures and water deficit in citrus
flower bud induction.
For our tipping experiment, if the response observed in summer shoots tipped in the fall
represents the response of trees hedged using commercial equipment, late fall hedging may
represent a viable time for routine tree size control hedging. However, to determine the

55
effectiveness of late-fall hedging under commercial conditions further studies are needed in
which fruit-set and yield variables should be evaluated.
56
LIST OF REFERENCES
Abbot, C.E. 1935. Blossom-bud differentiation in citrus trees. Am. J. Bot. 22:476–485.
Albrigo, L. G. and V. Galen Sauco. 2004. Flower bud induction, flowering and fruit-set of some tropical and subtropical fruit tree crops with special reference to citrus. Acta Horticulturae 632:81–91.
Albrigo, L. G., J. I. Valiente, and C. Van Parys de Wit. 2004. Influence of winter and spring weather on year-to-year citrus fruit set and yield variation in Sao Paulo, Brazil. Proc. Int. Soc. Citriculture 2004. 1:263–267.
Albrigo, L.G., H.W. Beck, and J.I. Valiente. 2006. Testing a flowering expert system for the ‘decision information system for citrus’. Acta Hort. 707:17–24.
Albrigo, L.G., J.P. Syvertsen, T.M. Spann. 2007. Canopy flush control for management of canker and greening. Citrus Industry 88(3):12–14.
Araki, T. 2001. Transition from vegetative to reproductive phase. Curr. Opin. Plant Biol. 4:63–68.
Bacon, P.E. 1981. The effect of hedging time on regrowth and flowering of mature Valencia orange trees. Aust. J. Agric. Res. 32:61–68.
Bacon, P.E., K.B. Bevington. 1978. Effect of time of hedging on shoot growth and flowering in citrus. Proc. Int. Soc. Citriculture 1974. 314–316.
Begg, J. E., N.C. Turner. 1970. Water potential gradients in field tobacco. Plant Physiol. 46:343–346.
Bellow, T.S., J.G. Morse. 1986. Modeling flower development in Navel oranges. Scientia Horticulturae. 30:117–126.
Ben Mechlia, N., J.J. Carroll. 1989. Agroclimatic modeling for the simulation of phenology, yield and quality of crop production. I. Citrus response formulation. Intl. J. Biometeorology. 33:36–51.
Bevington, K.B. 1980. Response of Valencia orange trees in Australia to hedging and topping. Proc. Fla. State Hort. Soc. 93:65–66.
Borroto, C.G., A.M. Rodríguez. 1977. The effect of water stress on flowering and fruit set of Valencia oranges in Cuba. Proc. Int. Soc. Citriculture 1977. 3:1069–1073.
Cassin, J., J. Bourdeaut, A. Fougue, V. Furon, J.P. Gaillard, J. LeBourdelles, G. Montagut, C. Moreuil. 1969. The influence of climate upon the blooming of citrus in tropical areas. Proceedings 1st International Citrus Symposium 1:315–23.
57
Cooper, W.C., A. Peynado. 1958. Effect of giberellic acid on growth and dormancy in citrus. Proc. Am. Soc. Hort. Sci. 72:284–289.
Davenport, T.L. 1990. Citrus flowering. Hort. Rev. 12:349–408.
Davies, F.S., Albrigo, L.G. 1994. Citrus, p.158–161. CAB International, Wallingford, UK.
Edwards, G.R. 1986. Ammonia, arginine, polyamines and flowering in apple. Acta Horticulturae 179:363.
Erickson, L.C. 1968. The general physiology of citrus, p. 97–99. In: Reuther, W., L.D. Batchelor and H.J. Webber (eds.). The Citrus Industry vol. 2 Chapter 2. University of California Division of Agricultural Sciences, Riverside, California
García-Luis A, V. Almela, C. Monerri, M Agustí, and J.L. Guardiola. 1986. Inhibition of flowering in vivo by existing fruits and applied growth regulators in Citrus unshiu. Physiol. Plant. 66:515–520
García-Luis, A., F. Fornes, A. Sanz, J.L. Guardiola. 1988. The regulation of flowering and fruit set in Citrus: relationship with carbohydrate levels. Israel J. Bot. 37:189–201.
García-Luis, A., M. Kanduser, P. Santamarina, J.P. Guardiola. 1992. Low temperature influence in citrus: The separation of inductive and bud dormancy releasing effects. Physiol. Plant. 86:648–652.
García-Luis, A., P. Santamarina, J.L. Guardiola. 1989. Flower formation from Citrus unshiu buds cultured In Vitro. Annals of Botany 64:515–519.
Goldschmidt, E.E., A. Golomb. 1982. The carbohydrate balance of alternate bearing Citrus trees and the significance of reserves for flowering and fruiting. J. Am. Soc, Hort. Sci. 107:206–208.
Graham, J.H., T.R. Gottwald, J. Cubero, D.S. Achor. 2004. Xanthomonas axonopodis pv. citri: factors affecting successful eradication of citrus canker. Mol. Plant Path. 5:1–15.
Halbert, S.E., K.L. Manjunath. 2004. Asian citrus psyllids (Sternorrhyncha: Psyllidae) and greening disease of citrus: a literature review and assessment of risk in Florida. Florida Entomologist 87:330–353.
Kaufmann, M. R. 1968. Evaluation of the pressure chamber method for measurement of water stress in citrus. J. Am. Soc. Hort. Sci. 93:186–190.
Koshita, Y., T. Takahara, T. Ogata, A. Goto. 1999. Involvement of endogenous plant hormones (IAA, ABA, GAs) in leaves and flower bud formation of Satsuma mandarin (Citrus unshiu Marc.). Scientia Horticulturae 79:185–194.
Koshita, Y., T. Takahara. 2004. Effect of water stress on flower-bud formation and plant hormone content of Satsuma mandarin (Citrus unshiu Marc.). Sci. Hort. 99:301–307.

58
Krajewsky, A.J., E. Rabe. 1995. Citrus flowering: a critical evaluation. J. Hort. Sci. 70:357–374.
Lenz, F. 1969. Effect of day length and temperature on the vegetative and reproductive growth of Washington Navel orange. Proceedings 1st International Citrus Symposium 1:333–338.
Lord, E.M., K.J. Eckard. 1985. Shoot development in Citrus sinensis L. (Washington Navel Orange). I. Floral and inflorescence ontogeny. Botanical Gazette 146:320–326.
Lovatt, C.J., S.M. Streeter, T.C. Minter, N.V. O’Connell, D.L. Flaherty, M.W. Freeman, P.B Goodell. 1984. Phenology of flowering in Citrus sinensis (L.) Osb., cv. Washington navel orange. Proc. Int. Soc. Citriculture 1984. 1:186–190.
Lovatt, C.J., Y. Zheng, K.D. Hake. 1988. Demonstration of a change in nitrogen metabolism influencing flower initiation in citrus. Israel J. Bot. 37:181–188.
McDaniel, C.N., S.R. Singer, S.M.E. Smith. 1992. Developmental states associated with the floral transition. Dev. Biol. 153:59–69.
McKnight, T.L., Hess, D. 2000. Physical Geography: A Landscape Appreciation, p.221–226. 8th ed. Prentice Hall, Upper Saddle River, NJ.
Monselise, S.P. 1985. Citrus and related genera. p.275–294. In: CRC Handbook of Flowering vol. II. CRC Press, Boca Ratón, Florida.
Monselise, S.P., A.H. Halevy. 1964. Chemical inhibition and promotion of citrus flower bud induction. Proc. Am. Soc. Hort. Sci. 84:141–146.
Moss, G.I. 1969. Influence of temperature and photoperiod on flower induction and inflorescence development in sweet orange (Citrus sinensis L. Osbeck). J. Hort. Sci. 44:311–20.
Moss, G.I. 1970. Fruit-set in sweet orange (Citrus sinensis): the influence of inflorescence-leaves. Phyton 21:141–148.
Moss, G.I. 1971a. Promoting flowering in sweet orange. Aust. J. Agric. Res. 22:625–9.
Moss, G.I. 1971b. Effect of fruiting on flowering in relation to biennial bearing in sweet orange (Citrus sinensis). J. Hort. Sci. 46:177–184.
Moss, G.I. 1973a. Regrowth and flowering of sweet orange after pruning. Aust. J. Agric. Res. 24:101–109.
Moss, G.I. 1973b. Major factors influencing flower formation and subsequent fruit set of sweet orange. Proc. Int. Soc. Citriculture 1973. 1:215–222.
Moss, G.I. 1976. Temperature effects of flower initiation in sweet orange (Citrus sinensis). Aust. J. Agric. Res. 27:399–407.
59
Nir, I., R. Goren, and B. Leshem. 1972. Effects of water stress, gibberellic acid and 2 chloroethyltrimethylammoniumchloride (CCC) on flower differentiation in ‘Eureka’ lemon trees. J. Am. Soc. Hort. Sci. 97:774–778.
Obreza, T.A., D.J. Pitts, L.R. Parsons, T.A. Wheaton, and K.T. Morgan. 1997. Soil water-holding characteristic affects citrus irrigation scheduling strategy. Proc. Fla. State Hort. Soc. 110:36–39.
Putterill, J., R. Laurie, R. Macknight. 2004. It’s time to flower: the genetic control of flowering time. BioEssays 26:363–373.
Reuther, W., D. Ríos-Castaño. 1969. Comparison of growth, maturation and composition of citrus fruits in subtropical California and tropical Colombia. Proceedings 1st International Citrus Symposium 1:277–300.
Sauer, M.R. 1951. Growth of orange shoots. Aust. J. Agric. Res. 2:105–117.
Sauer, M.R. 1954. Flowering in the sweet orange. Aust. J. Agric. Res. 5:649–657.
Scholander, P. F., H.T. Hammel, A.D. Bradstreet, E.A. Hemmingsen. 1965. Sap pressure in vascular plants. Science 148:339–346.
Smajstrla, A.G., D.S. Harrison, F.S. Zazueta, L.R. Parsons, K.C. Stone. 1987. Trickle irrigation scheduling for Florida citrus. Fla. Coop. Ext. Service Bulletin 208. University of Florida, Gainesville.
Southwick, S. M. and T.L. Davenport. 1986. Characterization of water stress and low temperature effects on flower induction in citrus. Plant Physiol. 81:26–9.
Syvertsen, J.M., C. Goñi, and A. Otero. 2003. Fruit load and canopy shading affect leaf characteristics and net gas exchange of ‘Spring’ navel orange trees. Tree Physiology 23:899–906.
Valiente, J.I., L.G. Albrigo. 2000. Modeling flowering date of sweet orange trees in central Florida based on historical weather. Proc. Int. Soc. Citriculture 296–299.
Valiente, J.I., L.G. Albrigo. 2004. Flower bud induction of sweet orange trees [Citrus sinensis (L.) Osbeck]: effect of temperature, crop load and bud age. J. Am. Soc. Hort. Sci. 129:158–164.

60
BIOGRAPHICAL SKETCH
Eduardo José Chica Martínez was born on June 9, 1982 in Guayaquil, Ecuador. In July
2005, he obtained the degree of Ingeniero Agropecuario (a 4-years-degree in agriculture) from
the Escuela Superior Politécnica del Litoral in Guayaquil. In the same year, he was admitted as a
student in the Master of Science program in the Horticultural Science Department at the
University of Florida. He finished his program in August 2007.