Embed Size (px)
Citation preview

Chapter IV

GROWTH RESPONSE
INTRODUCTION
The two major considerations, one should have
a diet for aquaculture, are (1) the ingredients
satisfy both the nutritional requirements and
effectiveness and (2) the formulated feed
acceptability and digestibility.
ln formulating
chosen should
the economic
should have
Diatoms are the most preferred food during the
protozoea stages of the penaeid prawns Artemia nauplii are also
used as a food. In the absence of ready- made food, farmers
depend on locally available food of low grade prawns and
mussels. Particulate suspensions of crustacean tissue made out
of cheap and easily available marine crustaceans with a size
suitable to the particular larval stages are reported to be
excellent feed in prawn culture. It is found that body
constituents of clams are almost the same as those of prawns and
feeding prawns with clams is reported to give good growth rate.
In course of time natural feed will be scarce and hence
artificial feed is a great necessity for promoting prawn culture
on a large scale. Nowadays artificial dry feed pellets
containing essential components are also applied in culture
systems. The ingredients of plant origin and essential minerals
are properly combined in definite proportions to make suitable
feed by utilizing the locally available cheap materials.
Normally feed preference differs with species cultured. Feed
application is also related to the type of culture practiced.

29
The supplemental diet is one which contains required amounts
of proteins, lipids, carbohydrates, fibers, minerals and
vitamins. The requirements of essential amino acid and poly
unsaturated fatty acids are very specific for achieving high
rates of production. Protein- Energy ratio and growth promoting
substances also play an important role in optimal growth. The
percentage requirements of these components vary from species to
species and also with age within the same speCles. Larval
feeds, grow out feeds and maturation feeds thus differ 1n their
composition.
During the past two decades prawn nutrition received
tremendous impetus with active development of aquaculture. As a
result enormous literature is now available on dietary
requirements of larval nutrition, feed formulation and feed
technology <Andrews and Sick, 1972; Zein-Eldin and Meyers, 1973;
Colvin,1976; Glude, 1976; Joseph, 1977; AQUACOP, 1978; Bottino
et al., 1980; Conklin et al., 1980; New, 1980; Fenucii et al.,
1980; Dall and Moriaity, 1983). Kanazawa (1984) brought out the
achievements made in penaeid prawn nutrition.
There are reports regarding the preliminary studies on the
preparation and feeding of crustacean diets (Deshimaru and
Shigueno, 1972; Forster, 1972b, 1976; Deshimaru and Kuroki,
1974; 1975; 1976, 1979; Balazs et al., 1973; Brand and Colvin,
1977; Deshimaru and Yone,1978; Goswami and Goswami, 1979,1980;
Conklin et al., 1980; Rajyalakshmi et al., 1982 and Mohamed et
al., 1980; Ahamed Ali and Mohamed, 1985)
Several workers had directed their effort on developing
artificial diets capable of sustaining good growth of prawns.
The contributions by Sick et al. (1972), Andrews et al. (1972),
Forster (1972a), Forster and Beard (1973), Zein-Eldin et al.
(1973, 1976); Balazs et al. (1974), Deshimaru and Kuroki (1975),
Venkataramiah et al. (1975), Balazs and Ross (1976), colvin
(1976), Sandifer et al. (1976), Bages and Sloane (1981),
Kanazawa et al. (1981), Bautista (1986> and Rajyalakshmi (1991)

30
are worth mentioning. Recently purified diets based on casein
were also successfully tried by many investigators in
nutritional studies on various penaeid prawns (AQUACOP, 1978;
Gopal, 1986; Ahamed Ali, 1988a; Civera and Guillaume, 1989;
Diminu and Lim, 1989).
The protein requirements for various species of shrimp have
also been investigated. A wide range of dietary protein
requirement values were reported by the investigators for
various species of shrimp and prawns as given in the Table 4.1
This variation may be due to the differences in the species, raw
materials and environmental conditions. Several materials have
therefore been defined as suitable major sources of protein for
shrimp diets. The available informations suggest that a protein
level ranging from 30 - 40% will be adequate for different
species of prawn (Cherian et al., 1991).
Energy production from protein oxidation is both
nutritionally and economically wasteful. Thus, it is necessary
to spare protein for growth by optimizing the level of
non-protein energy sources. A suitable source and an adequate
amount of inexpensive carbohydrate in the diet are therefore
potentially desirable to improve the protein utilization. There
is little information on the carbohydrate nutrition of penaeid
prawns (New, 1976; 1980; Kanazawa, 1984). The type and level of
carbohydrates in the diet have been shown to effect the growth
and survival of Penaeus japonicus (Abdel-Rahman et al., 1979),
Penaeus aztecus (Andrews et al., 1972) and in Penaeus duorarum
(Sick and Andrews, 1973). In Penaeus monodon, Pascual et al.
(1983) obtained significant differences between the type and
level of carbohydrates in the diet on the survival of juveniles.
Alava and Pascual (1987) reported the quantitative and
qualitative needs of Penaeus monodon juveniles for carbohydrates
in semi purified diets and ascertained the effect.
The crustaceans were found to be unable to tolerate high
levels of dietary fat (Kitabayashi et al., 1971; Andrews et a1,

Table 4.1
Dietary protein requirement of prawns (expressed as % of dry diet).
No Species Life stage Optimum level Reference(%)
1 P. monodon Juvenile 45 Lee (1971)
2 " Postlarva 30 Khannapa <1977 )
3 " Juvenile 30-40 Khannapa <1979 }
4 " Postlarva 55 Bages & Sloane (1981)5 to Juvenile 35 Lin et al. <1981>6 " Juvenile 40 Alava & Lim <1983}7 " Juvenile 40-50 Bautista <1986 )8 " Juvenile 55 Nezaki (1986)
9 " Brood stock 50-55 Millamena et al.
<1986 )10 P.indicus Jevenile 43 Colvin (1976)
11 " Juvenile 50-60 Sambasivam et al.<1982 }
12 to Juvenile 43 Ahamed Ali (1982a)13 to Early postlarva 40 Bhasker (1982)
14 " Late postlarval 30 Bhasker (1982)
Juvenile
15 " Juvnile 35-40 Gopal (1986)
16 " Juvenile 25 Ahamed Ali <1988a}17 to Juvenile 29 Ahamed Ali (1988a)
18 P. Juvenile 50-55 AQUACOP (1978)
merguiensi
19 " Juvenile 34-42 Sedgwick <1979 )20 P.japon i cu 5 Juvenile 55 Kanazawa et al.(1970
21 " Juvenile 54 Kitabayashi
et al. il')71)
22 " Juvenile 60 Deshimaru and
Shigueno <1972 }
23 " Juvenile 60 Shigueno
et al. <1972 )
24 " Juvenile 40 Balazs et al. (1973)
25 " Juvenile 50 Deshimaru sKuroki (1974)

Table 4.1 (Contd.)
No Species Life stage Optimum level Reference(% )
26 P.japonicus Juvenile 52-57 Deshimaru &
Yone (1978)
27 .. Larva 45 Teshima & Kanazawa
(1984)
28 P. aztecus 23-31 Shewbart et al.--(1973 )
29 .. 40 Balazs et al. (1973)--
30 to Post larva 40 Venkataramiah
et al. (1975b)
31 .. Juvenile 52 Zein-Eldin &
Corliss 0976 )
32 to Juvenile 37 Fenucii & Zein- Eldi
(1976)
33 P.setiferus Juvenile 28-32 Andrews et al. ( 1972)
34 .. 30 Fenucci et al. ( 1980)--
35 P.duorarum Juvenile 28-30 Sick & Andrews (1973)
36 P. Postlarva 30-35 Colvin & Brand (1977)
stlirorostris
37 to30 Fenucci et al. (1980)--
38 P.
aliforniensis Early postlarva 44 Colvin & Brand ( 1977)
39 .. Late postlarva 30-35 Brand & Colvin (1977)
40 Pv v erineme i Postlarva 30-35 Colvin s Brand ( 1977)
41 to Larva 38 Smith & Lawrence
<1988 )
42 M.monoceros Juvenile 55 Kanazawa et al. ( 1981)
43 M.macleayi 27 Maguire & Hume ( 1982)
44 P.serratus 30-40 Forster&Beard <1973 )--
45 M.nobili Juvenile 35 Murugadas s Pandian
(1987)

Table 4.1 (Contd.)
No Species Life stage Optimum level Reference( %)
46 M. Juvenile 35 Balazs & Ross (1976)
rosenbergii
47 M. 25 Manik (1976)--rosenbergii
48 " Larva 15-20 Sick <1976 )
49 " Juvenile 25 Clifford & Brick
<1979 )
50 " Juvenile 40 Millikin et al. (980)
51 " Juvenile/ 15 Boonyaratpalin
Sub adult & New (1982)
52 " 25 Perry et al. (1984)--53 " 14 Antiporda <1986 )--
54 " Juvenile 33-35 D1Abramo & Reed
(1988)
55 " Juvenile 13-25 Gomez et al. 0988 )
56 " Juvenile 30 Freuchtenicht et al.
(1988)

31
1972; Forster and Beared, 1973; New,
optimum level was between 5 to 10%.
1976). The suggested
Along with the organically bound hydrogen, carbon, nitrogen
and oxygen, there are about 20 inorganic elements which are
considered to be essential to animal life, including fish and
shrimp. The essential mineral elements are usually classified
into two main groups according to their concentrations in the
animal body; (a) the macroelement which are structural
constituents and (b) the micro elements maintain the metabolic
function of organisms. Prawn moults at frequent intervals and
the shell and carapace require a continuous supply of calcium,
phosphorus and other minerals apart from chitin. Mineral
metabolism differs from that of other nutrients in that, 1n
contrast to proteins, carbohydrates, fats and vitamins, minerals
are neither produced nor consumed by the prawns in bulk. The
evaluation of mineral requirement 1S extremely difficult because
of the problems in limiting their concentrations in the diet and
also of the water borne contribution to the intake of the
minerals.
References to mineral on shrimp nutrition are scarce,
although many workers have used mineral supplements in diet
meant for shrimps (Table 4.2). These supplements were formulated
mainly based on premixes used for other farm experimental
animals (New, 1976). Crustaceans have high content of ash
(15.9%) in the body. Since sea water is rich in many ions of
minerals,the organisms may satisfy most of their mineral
requirements from the surrounding environment. The composition
of four of the mineral mixetures which have been used in shrimp
ration is given in Table 4.3. The Table 4.3 also presents the
calculated contributions of these supplements to diets.
The trace metal concentrations in the prawn Palaemon elegans
with respect to the trace metal concentrations in the
surrounding water was studied by White and Rainbow (1982). The
importance of copper in crustacea was reviewed by Lontie and

Table 4.2
Composition of some shrimp diet mineral premlxes
(g \ 100g dry diet)
'"Composition Premix numbers
1 2 3 4
K2HP0 4
2.310 0.500 1. 500 0.600
caHP0 4 . 2H2O1.370 0.548
Ca3(P04)2
2.110 0.750
KCI 0.724 0.470 0.188
MgS0 4 1.140 0.740 0.296
CaC0 31. 293 0.840 0.336
C3HS0 3 2ca.5H 2O3.750
FeCl 3 0.070 0.028
FeS04•7H2O 0.108
MnS0 4· 7H2O 0.015 0.010 0.004
Total premix inclusion
in the diet Po) 7.700 5.000 5.000 2.000
'" 1. Kanazawa et-al. (1972)
3. Sick et al. (1972)
2. Deshimaru and Shigueno (1972)
4. Andrews and Sick (1972)

Table 4.3
Mineral contribution to shrimp diets by premixes
lit
Mineral Premix number1 2 3 4 5
(g \ lOOg dry diet)
Calcium 1. 336 0.679 0.655 0.264
Phosphorous 0.832 0.239 0.514 0.206
Potassium 1. 417 0.244 0.919 0.368
Magnesium 0.230 0.150 0.060
Sodium 0.157
Chloride 0.344 0.270 0.107 0.243
Sulphate 0.951 0.594 0.237
(mg\dry diet)
Iron 216.60 240.90 96.40 19.80
Copper 2.00
Manganese 30.50 19.80 7.90 60.00
Zinc 44.10
Cobalt 0.20
Iodine 1. 20
Calcium-Phosphorus 1. 61 2.84 1. 28 1. 28Ratio
lit
1. Kanazawa et al. (1970)
3. Sick et al. (1972)
5. Balazs et al. <1974b)
2. Deshimura and Shigueno (1972)
4. Andrews and Sick (1972)

32
Vanquickenborne (1974), and the variation in copper in the
different part of the body was studied by Stickney et al. (1975)
in R aztecus and R setiferus, Zingde et al. (1976) in P. monodon
and M. affinis, Horowitz and Preseley (1977) in P. aztecus and
subash Chander (1986) in P.indicus. It was suggested that copper
is absorbed by crustaceans from the surrounding water (Byran,
1968: White and Rainbow, 1982: Subash Chander, 1986).
Zinc is an essential component of more than 80
metalloenzymes, including carbonic anhydrase (required for the
~ransport of carbon dioxide by the blood and for the secretion
of HCl in the stomach), glutamic dehydrogenase, superoxide
dismutase, pancreatic carboxypeptidase, and tryptophan
desmolase, thus many metabolic functions are affected by the
deficiency of zinc. Many workers reviewed the concentration of
zinc in the body of lobster, Homorusvu1garis (Byran, 1964), in
the crab Ca11inactus sapides (Colvocorresses and Lynch, 1975)
in the prawn P.californiensis (Byran, 1968), in the Palaemon
e1egans (White and Rainbow, 1984) and in Penaeus
indicus(Chandran, 1986 and Ahamed Ali, 1988a). All have reported
varying results. Their studies indicated that zinc was absorbed
to some extent by these animals from the surrounding medium.
Determination of food intake, growth and conversion
efficiency are known to be the best indices to evaluate the
growth of organisms. Thus laboratory studies on growth and
conversion efficiency of decapod crustaceans were useful in
promoting crustacean culture (Katre and Reddy, 1977). Several
workers have directed their effects on the evaluation of the
growth, survivalassimilation and food conversion efficiencies of
various species of prawns using the artificial diets (Karim and
Aldrich, 1970 on P.aztecus and P. setiferus: Condrey, 1971
Grajcer and Neal, 1972 on P.aztecus; Kittaka, 1976 and Knight,
1976 on Macrobrachium rosenbergii and Sedgwick, 1979, on
Penaeus. merguiensis: Brisson and Pace,1978 and Forster, 1976,
on Pa1aemon serratus; Katre and ReddY,1977 on Pa1aemon lamarrei:
Pascual et al., 1983 on Penaeus. Monondon: Sambasivam et a1.,1982

33
on Penaeus indicusl. Since the work of Subrahmanyan and
Oppenheimer (1969), numerous studies have been reported on the
growth rates and feed efficiencies of various crustaceans fed on
different levels of dietary protein. (Kanazawa et al., 1970;
Deshimaru and Shiguen~ 1972).
So far the efficiency of a diet was monitored only through
survival rate, increase 1n body length and weight. It was
suggested that biochemical analysis of tail meat should be done
regularly so as to manipulate the feeding regime and composition
to maximise the protein content of shrimp and shrimp product
(Hanson and Goodwin, 1977). Similarly for several nutrient
concentrations, metabolites in different tissues would reflect
utilization of specific nutrients in the animal (Cowey and
Forster, 1971; Gatling and Wilson, 1985). Such an approach
would provide an insight on the interaction between different
nutrients and also provide valuable information in assessing the
nutritional status for an organism.
In the present study the formulated and standard diet were
fed to various size groups of juveniles of prawns in the
laboratory, paddy field, and esturine shrimp ponds. In the
laboratory the low density and high density cultures were also
performed. The percentage survival growth and food conversion
ratios were simutaneously recorded. The results of preliminary
investigation to assess the suitability of the prepared diet
as shrimp diet for future experiments were given and discussed.
The experiments were designed to assess the relationship between
dietary protein and growth in juvenile prawns. The nutritional
quality of protein and meal combinations werefurther tested 1n
assimilation studies. The trace metal content in the diet with
their various concentration were also analysed.
The aim of the present study was to develop a feeding regime
which would stimulate maximum growth rate with efficient food
conversion in juvenile prawns fed with an artificial diet 1n a
culture station.

34
MATERILAS AND METHODS.
Acclimation of animals and experimental procedures have been
detailed in CHAPTER 11.
RESULTS
A two stage evaluation procedure was adopted to critically
examine the efficiencies of the formulated feeds with respect to
acceptability, growth rate and percentage of survival. In the
first phase laboratory culture experiments (both low density and
high density) with Penaeus indicus, Penaeus monodon, Metapenaeus
dobsoni,were conducted. On the basis of evaluation of the
efficiency parameters, three of the five formulated feeds were
selected for the second phase of the study. In this, high
density mass cultures, with a mixed seed were done in the
estuarine ponds and paddy fields.
Low Density Laboratory Experiments
The growth of the three species of prawns studied with
respect to weight for 90 days feeding experiments for the
formulated feeds and the standard are given in the Table 4.4.
All the formulated feeds exhibited a comparable growth 1n all
the three species of prawns. The standard feed always presented
a better growth. The period of culture was divided into three
phases of 30 days duration each, the period of each phase being
0-30 days, second 30- 60 days, and the third 60-90 days. The
percentage of growth, taking the growth rate of standard as the
base,was found to be the highest (86.4%) with the feed PD4 among
the formulated feeds for Penaeus indicus 1n the first phase of
the experiment followed by PD2 (84.9%) and the lowest
contribution was given by PD1 (75.09%). In the second phase of
the experiment the percentage growth was highest for PD!
(121.7%) followed by PD5 (121%) and lowest was observed with
PD4(85.40%). In the third phase the order of percentage growth

35
was P05 (90.90%) > P04 (87.19%) > P03 (83.1%) > P02 (83.05%) >
POl (79.75%).
For Penaeus monodon in the first phase P02 gave highest
value (90.2%) for percentage of growth and the lowest(62.6%) by
P03. In the second phase P05 gave highest percentage(121.4%) of
growth followed by P03 (120.1%) and in the third phase the order
was P01 >P02 >P03 > P04 >P05.
In the case of Metapenaeus dobsoni the percentage of growth
compared to standard was 1n the order, P02 (90.24%) > PO!
(88.2%) > P03 (74.39%) > po5 (73.1%) > P04 (70.3%) for first
phase of the experiment.Where as in the second phase the highest
value of growth was for P04 (104.3%) and lowest for P05 (91.20%)
and in the final phase PD5 (178.3%) recorded highest value
followed by PD4(144.4%) and the lowest for PD2 (·100%).
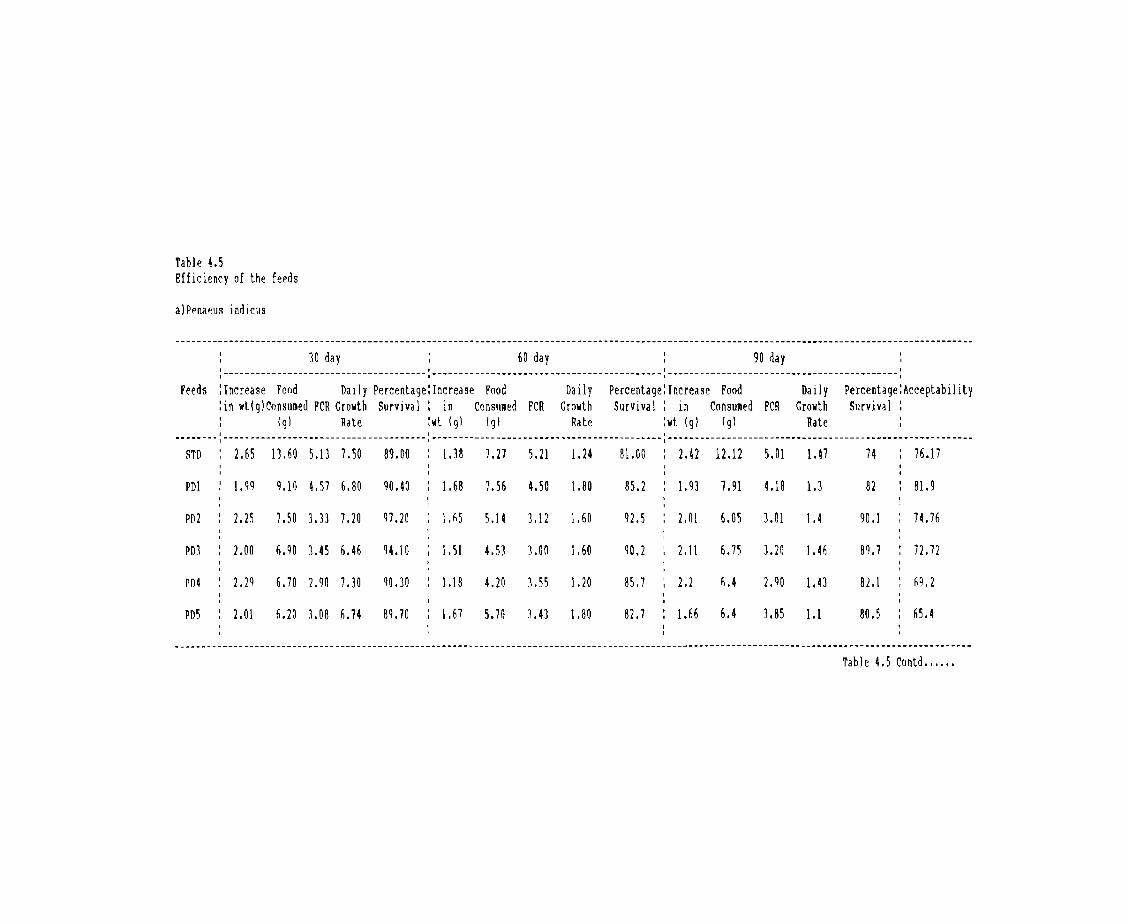
The efficiency of the feeds in terms of percentage survival,
FCR and acceptability for the three species of prawns are glven
in the Table 4.5. In all three phases of growth, P02 gave the
maximum survival for all the three species. The values were
(97.2, 92.5, 90.1), for Penaeus indicus, (95.4, 93.2, 90.1) for
Penaeus monodon and (93.2, 90.5, 89.7) for M.dobsoni during the
I,ll, and III phase respectively. The lowest percentage
survival was given by standard in all the cases. Among the
formulated feeds the lowest percentage survival in all three
phases was glven by PD5 for P.indicus and P.monodon and PD4 for
M. dobsoni.
The feed efficiency values 1n terms of food conversion ratio
for the three species of prawn in the three phases of growth
showed that the formulated feeds was more efficient than
standard FCR 1n terms of FCR values.
The acceptability of feeds for the
indicus were in the order P02 (81.9%)
(74.76%) ) P03 (72.72%) > P04 (69.2%) >
90 day period
> STD (76.17%)
P05 (65.4%) and
for P.
> PO!
for P
Tabl~ 4.5Efficiency of the feeds
alPenaeus indicus
30 day , 60 day , 90 nay, I
I , I I
l--------------------------------------I--~----------------------~-----------------l-------------------------------------------~
Feeds :Increase Food Daily Percentage:lncrease Food Da iIy Percentage:lncrease Food Daily Percentage:Acceptability:in wtlglConsumed FCR Growth Survival: In Consumed FCR Growth Survival: In Consumed FeR Growth Survival :
{g I Rate :wt (gl (g f Rate :lIt Ig) (g) RateI I ,------··1------·_------------------------------.-------------------------------------------.---------------------------------------------------------
STD, 2.65 13.60 5.13 7.50 89.00 , 1.38 7.27 5.21 1.24 81. 00 I 2.42 12.12 5.01 1.47 74
, 76.17, , I ,, I I I, , I ,
PD1 I 1.99 9.10 4.57 6.80 90.40 ,1.68 7.56 4.50 1.80 85.2 ,
1.93 7.91 4.18 1.3 82 I 81.9, , I I
, , I, I I
PD2 ) 2.25 7.50 3.33 7.20 91.20 I 1. ~5 5.14 3.12 1.60 92.5 , 2.01 6.05 3.01 1.4 90.1 , 74.76I , , I
I I ,I I ,
PD1 I 2.00 6.90 3.45 6.46 94.10 ,I. 51 4.53 3.00 1. 60 90.2 , 2.11 6.75 3.20 1.46 89.7 t 72.12, I , ,
I I ,, , ,PD4 I 2.29 6.70 2,90 7.30 90.30 I 1.18 4020 1.55 1.20 85.7 I 2.2 6.4 2.90 1.4] 82.1
, 69,2, , I ,, I ,, , I
PD5 ,2.01 6.20 1.08 6.74 89.70
, 1.67 5.70 1.4] 1.80 82.7 I 1.66 6.4 3.85 1.1 80.5 I 65.4, I I I
, , ,, I I
--_._.------------------------------------------~----- - - - - - - - - - - - - - - - - - - - - - - - - - - - - - - - - - - - - - - - - - - - - - - - - - - - - - - - - - - - - - - - - - - - - - - - - - - - - - - - - - - - - - - - - - - - - - - -
Table 4.5 Contd., ..••

Tabl~ 4.5 Contd,., •••
bl Penaeus monodon
._----------------~~---------~--------_.~-------_._--------------------~----------_._-------------------~--- - - - - - - - - - - - - - - - - - - - - - - _ ..----------------30 day I 60 day I 90 day, I
I I , I.--------------------------------------.-------------------------------------------1-------------------------------------------tFeeds :Increas~ Food Daily Percentage:rncrease Food Daily Percentage:rncrease food Da i ly Percentage:Acceptability
:in wttglConsumed FCR Growth Survival: in Consumed FCR Growth Surviva I : in Consumed FCR Growth Surviva I :Ig) Rate :wt Ig I Ig I Rate :lIt (g) I9I Rate
I I , I--------1--------------------------------------,-------------------------------------------1------------------------------------------.,-------------II
STD : 2.46 12.5 5.08 8.60 87.00 : 3. 34 15.36 4,59 3. 20 78.00 : 2,70 14.04 5.20 1.20 73.00 , 83.00I
I , , ,I I I ,
PD1 , 2.21 9.60 4.34 8.40 n,oo I 2.85 9,40 3. 24 2.60 90.00 I 1. 97 8.47 4.23 1.06 87.00 : 91. 50I I I, I I I, , I I
PD2 I 2.22 7,10 3.19 8,60 95.40 : 3.57 8.90 2.49 3.06 91.20 : 1.42 4.27 3.07 0,90 90.10 : 86.80I
I I I ,I , I ,
PD) : 1.54 6.10 ),96 7.40 93.20 : 4.04 10.10 :~n 4. 00 90.20 I 1.19 4,64 3.86 0.80 85.70 I 84,88I ,I , II , ,
PD4 : 1.67 6.30 3.77 7.90 93.00 : 3.61 10,53 2.H 3.60 89.00 I 1.12 4.39 3,92 0.60 85,00 : 88.68I
I II I
PDS : 1.61 5.90 3,68 6.90 90.40 I 4.05 12.06 2.97 3.90 88.70 I 1.06 4.21 3.96 US 81.20 : 85.40I I
Table 4.5 Contd ••• , ••

Table 4.5 Contd •.•.••
cl Metapenaeu8 dobsoni
________ ~ ~ __ • ~ ~ • 6 •• • 6 • _
30 day 60 day 90 dayI I I I,----------------_ .. -------------------.-------------------------------------------,-------------------------------------------1
reeds :Increase Food Daily Percentage:lncrease Food:in wt(glConsumed FCR Growth Survival: 1n Consumed FCR
(gl Rate :wt (gl (ql
Da i IyGrowth
Rate
Percentage:lncreasp. FoodSurvival: in Consumed FCR
:wt Ig f (91
DailyGrowth
Rate
Percentage:AcceptabllitySurvival:
I I I 1--------I-------------~-----·_-----------------I------ - - - - - - - - - - - - - - - - - - - - - - - - - - - - - - - - - - - - - 1 - - - - - - - - - - - - - - - - - - - - - - - - - - - - - - - - - - - - - - - - - - - 1 - - - - - - - - - - - - -
STD
PDl
PD2
VD3
VD4
PD5
2.56 13.20 5.36 6.5G 85.20
2.17 7.30 3.36 6.10 90.00
2.22 6.40 2.88 6.30 93.20
1.83 6.70 3.66 5.QO 91.80
\.73 6.90 3.90 5.80 90.70
1.80 1.56 4.20 5.70 90.70
2.75 14.02 5,09 2.20
2.61 10.46 4,07 2.30
2.77 9.48 3,42 2.01
2.79 8.65 3.09 2.75
2.87 10.33 3.70 2.80
2.51 9.70 3.18 2.50
81,20
87.00
90.50
89.40
85.30
87.20
1,80 9,36 5.20 0.90
1,82 1,46 4.11 1.00
1.80 5,04 2.80 0.91
2,57 8.61 3.35 0.95
2.60 8.10 3.38 1.40
3.21 10.22 3.18 1.70
81.20
84.00
83.60
19.80
14.08
78.50
81.20
84.00
83.60
79.80
74.08
78.50

36
monodon the order was POl > P04 > P02 > P03 > P05 > STD and for
Meta penaeus dobsoni the order was P01 > po2 > STD > po3 > PD5 >
P04.
The daily growth rate of three species of prawn are given in
the Table 4.6. The result showed that daily growth rate varied
with growth step of the prawns. When prawns were small in size
(first phase of the experiments) the growth rate was higher for
all three species, P.indicus, P. monodon and M. dobsoni with the
standard feed. The values for first phase were 7.5, 8.6 and
6.5; for second phase the values were 1.27, 3.2 and 2.2 and for
third phase the values were 1.4 , 1.2 and 0.9 respectively for
the same diet in the same order of species of prawns. Among the
formulated diets, in the first phase P04 gave the highest growth
rate (7.3), P01 and P05 (1.8) in the second phase and P02 (1.46)
in the third phase for P.indicus. In the case of P. monodon P02
presented maximum value in first phase (8.6) followed by P03 in
second phase (4.0) and in third phase P01 gave the maximum value
(1.06). With M. dobsoni PD2 gave the highest value (6.3) in the
first phase, P04 (2.8) in the second phase and P05 (1.7)in the
third phase.
The results of conversion efficiency of the formulated and
standard feeds are given in the Table 4.7. The po2 exhibited
assimilation efficiency, which is comparable with the standard
for all the three species 94.6 and 94.5 for P. indicus, and
93.94 and 95.06. for P. monodon and 94.3 and 94.5 for M.dobsoni,
for P04. and standard respectively. A very low assimilation
efficiency was observed with P02 and P05 for P. indicus (84.05,
86.05). The gross and net conversion efficiencies were found to
be maximum with P02 in the case of M.dobsoni and P.monodon, but
PD4 gave the highest values for P. indicus. In all the cases
standard was found to have considerably low conversion
efficiencies. The order of efficiency for the three species
were i). PD4 > PD5 > P02 >PD3 >PD1 > STD for gross conversion
and P05 > P04 > PD3 >P02 ) P01 > STD for net conversion
efficiencies for P. indicus ii). PD2 > PD5 > P04 ) PD3 > P01 )

Table 4.6
Daily growth rate of prawns
Prawn Days Feed used
Species STD PD1 PD2 PD3 PD4 PD5
P.indicus 30 7.5 6.8 7.2 6.4 7.3 6.7
60 1.3 1.8 1.6 1.6 1.2 1.8
90 1.5 1.3 1.4 1.5 1.4 1.1
P.monodon 30 8.6 8.4 8.6 7.4 7.9 6.9
60 3.2 2.6 3.1 4.0 3.6 3.9
90 1.2 1.1 0.9 0.8 0.6 0.5
M.dobsoni 30 6.5 6.1 6.3 5.9 5.8 5.7
60 2.2 2.3 2.0 2.7 2.8 2.5
90 0.9 1.0 0.9 0.9 1.4 1.7

Table 4.7Conversion Efficiency of the feeds(30 days)
a) P.indicus
Feeds:Consumption:Faeces:Production:Assimilation :Gross Conversion:Net Conversion(g) C : (g) F: (g) P :efficiency (00) :Efficiency :efficiency
:A = C-F/C :P/C (%) :P/A (%)
STDP01P02PD3PD4PDS
1 3.69.17.56.96.76.2
0.740.530.400.600.900.82
2.651. 992.252.002.292.04
94.594.194.691. 3084.0586.05
19.421.830.028.9834.1732.90
20.6023.2131. 631.7439.4837.41
b) P. monodon
STDP01PD2P03PD4po5
12.59.67.16.16.35.9
0.620.510.430.420.390.37
2.462.212.221. 541.671. 61
95.0694.6893.9493.1193.8093.72
19.6823.0231.2625.2426.5027.28
20.7024.3133.2827.1128.2529.11
c) M. dobsoni
STDPOlpo2PO]PD4POS
13.27.36.46.76.97.6
0·.720.410.350.420.510.32
2.462.172.221. 831. 731. 80
94.5494.3894.5393.7392.6095.70
18.0829.7234.6827.3125.0723.80
21.2331. 7536.6929.1427.0431.25
37
STD for gross conversion and PD2 ) PD5 > PD4 > PD3 > PDl > STD
for net conversion efficiencies for P.monodon. iii). PD2 > PO!>
PD3 > PD4 > PD5 > STD for gross conversion and PD2 > P01 > PD5 )
PD3 > P04 > STD for net conversion efficiencies for M.dobsoni.
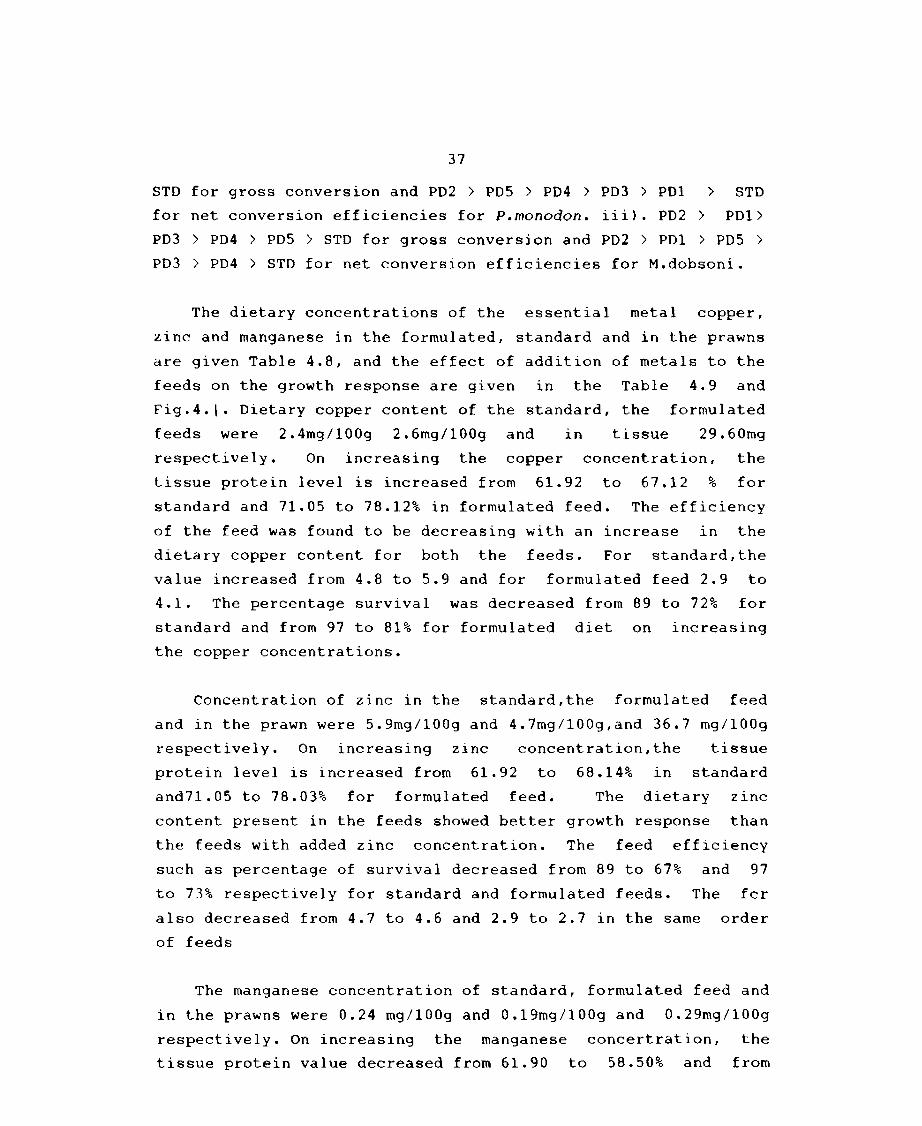
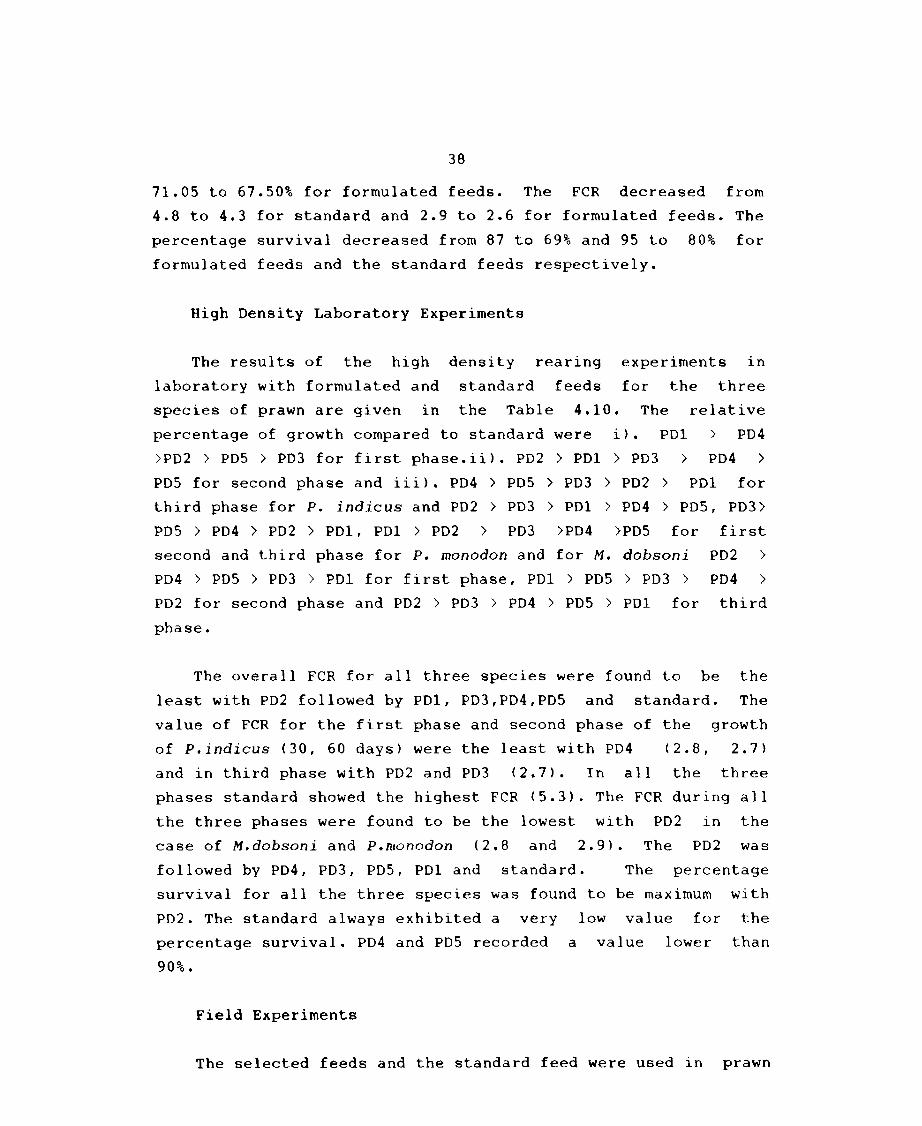
The dietary concentrations of the essential metal copper,
zinc and manganese in the formulated, standard and in the prawns
are given Table 4.8, and the effect of addition of metals to the
feeds on the growth response are given In the Table 4.9 and
Fig.4.1. Dietary copper content of the standard, the formulated
feeds were 2.4mg/100g 2.6mg/!OOg and 1n tissue 29.60mg
respectively. On increasing the copper concentration, the
tissue protein level is increased from 61.92 to 67.12 % for
standard and 71.05 to 78.12% in formulated feed. The efficiency
of the feed was found to be decreasing with an increase In the
dietary copper content for both the feeds. For standard,the
value increased from 4.8 to 5.9 and for formulated feed 2.9 to
4.1. The percentage survival was decreased from 89 to 72% for
standard and from 97 to 81% for formulated diet on increasing
the copper concentrations.
Concentration of ZInc in the standard,the formulated feed
and in the prawn were 5.9mg/lOOg and 4.7mg/lOOg,and 36.7 mg/lOOg
respectively. On increasing zinc concentration, the tissue
protein level is increased from 61.92 to 68.14% in standard
and71.05 to 78.03% for formulated feed. The dietary zinc
content present in the feeds showed better growth response than
the feeds with added zinc concentration. The feed efficiency
such as percentage of survival decreased from 89 to 67% and 97
to 73% respectively for standard and formulated feeds. The fcr
also decreased from 4.7 to 4.6 and 2.9 to 2.7 in the same order
of feeds
The manganese concentration of standard, formulated feed and
in the prawns were 0.24 mg/100g and O.19mg/lOOg and 0.29mg/lOOg
respectively. On increasing the manganese concertration, the
tissue protein value decreased from 61.90 to 58.50% and from

Table 4.8Concentration of Metals in feeds and Prawns(ppm)
Items Cu Zn Mn
STD I 2.4 I 5.9 I 0.24I I I
I II I
PD1 I 2.2 . 4.2 , 0.22I , I, , II I I
PD2 I 2.6 I 4.7 I 0.21I I .I I II I I
PD3 I 1.8 I 4.8 , 0.19I I I
I I ,I I I
PD4 I 2.0 I 4.6 , 0.20, I I
I II I
PD5 I 2.2 , 4.1 I 0.21I I ,I I II I I
Prawn I 29.9 I 36.7 , 0.29, I I

Table 4.9 Growth response in presence of added metals--------------------------------------------------------------------------------------------------
Tissueprotein
(percentage)
No Name ofthe feed metals
:Conc of the:Conc of the : Conc of the:metal dosed:metal observed:metal observed:
(ppm) :in the feed :in the prawn(ppm) : (ppm)
FCR Percentagesurvival
8983817872
4.85.1:5.4:5.6:5.9:
:61.92:65.11:66.22:66.52:67.12
:29.60:29.90:30.07:30.10: 31. 20
2.403.104.705.80
:17.01
oo0.0100.0500.100
Cu
----:----------:---------:----- 1 --------:- ~:--_---
: standardII
1
2 :formulated: Cu o0.0050.0100.0500.100
2.603.704.906.30
:18.02
:29.60:30.00:31.10:32.20:33.40
:71.05:73.02:75.66:77.12:78.12
2.9:3.1:3.4:3.8:4.1:
9794908981
3 standard Zn o0.0200.0500.0800.100
5.9:12.9:15.4:24.3:30.6
:36.4:36.3:36.1:35.9\34.3
:61.92:65.22:66.12:67.22:68.14
4.7:4.8:4.7:4.8:4.6:
8985797167
4 :formulated: Zn o0.0200.0500.0800.100
4.7:13.2:17.5:26.3:32.4
:36.7:34.5:31.4:33.8:33.0
:71.05:76.02:77.34:77.47:78.03
2.9:2.7:2.7:2.6:2.7:
9792887673
5 standard Mn o0.0020.0030.0040.005
0.240.570.890.991.40
0.290.310.320.440.63
: 61. 92:60.25:59.77:59.27:58.50
4.8:4.7:4.7:4.3'4.3
8785787369
6 :formulated: Mn o0.0020.0030.0040.005
0.190.540.820.971.30
0.290.300.320.420.55
:71.05:69.80:68.52:68.30:67.50
2.92.72.72.72.6
9593898480
--------------------------------------------------------------------------------------------------

o
- _. - - - ....j
IIn
~;Z:;~~ O_ l0.06
0.0 1=---,,"--.z::r---:-T' 0 .006
Formulated
Protein Cu
Formulated --,
Mu Protein
---'
,-
Protein
Standard~---_:"'=":::==-------,
.-/--
o
80,-
,-.0
,20
0Protein euStandard
80
20
80
60
100
60
.0
20
o-"--ir--"'--;='--.L---.--L-r--~~
100
110
ProlelA zn ProIeIA Zn
Standard Formulated
Fig .4.1 Growth response of th e prawns when fed with feedcontain ing different concentrations of the m etals
38
71.05 to 67.50% for formulated feeds. The FCR decreased from
4.8 to 4.3 for standard and 2.9 to 2.6 for formulated feeds. The
percentage survival decreased from 87 to 69% and 95 to 80% for
formulated feeds and the standard feeds respectively.
High Density Laboratory Experiments
The results of the high density rearing experiments 1n
laboratory with formulated and standard feeds for the three
species of prawn are given in the Table 4.10. The relative
percentage of growth compared to standard were i). P01 ) P04
>po2 > P05 > PD3 for first phase.ii). P02 > PD1 > P03 > PD4 >P05 for second phase and iii). P04 > PD5 > PD3 > PD2 > POl for
third phase for P. indicus and P02 > po3 > pol > P04 > PD5, P03>
po5 > P04 > P02 > POl, POl > PD2 > P03 >po4 >PD5 for first
second and third phase for P. monodon and for M. dobsoni P02 >PD4 > PD5 > PD3 > POl for first phase, POl > PD5 > P03 > po4 >PD2 for second phase and PD2 > PD3 > PD4 > P05 > pOl for third
phase.
The overall FCR for all three species were found to be the
least with PD2 followed by PDl, PD3,PD4,PD5 and standard. The
value of FCR for the first phase and second phase of the growth
of P.indicus (30, 60 days) were the least with PD4 (2.8, 2.7)
and in third phase with P02 and P03 (2.7). In all the three
phases standard showed the highest FeR (5.3). The FCR during all
the three phases were found to be the lowest with PD2 in the
case of M.dobsoni and P.monodon (2.8 and 2.9). The PD2 was
followed by po4, PD3, PD5, PD! and standard. The percentage
survival for all the three speC1es was found to be maximum with
po2. The standard always exhibited a very low value for the
percentage survival. P04 and P05 recorded a value lower than
90%.
Field Experiments
The selected feeds and the standard feed were used in prawn

Table 4.10Growth response of prawns with feeds (High density culture)a) P.indicus
30day 60day 90day-----:---------:---------------------------------~----- - - - - - - - - - - - - - - - - - - - - - - - - : - - - - - - - - - - - - - - - - - - - - - - - - - - - - - - - -Feeds: Initial : Final
:wt of :wt of:prawn (9) : prawn (gl:
% wt*
iciency
: FeR :%survival:
% wt.. Efficiency :wt.---------------:: FeR :%survival:
(gl: % wt*
Efficiency,.----------------: FeR :%surviva1
STD : 0.31, 3.01 , : 5.2 : 89.00 :5.53 : : 5.4 : 85.00 : 7.90 : : 4.9 : 80.00, ,
P01 : 0.27 · 3.10 :105.50 : 4.2 : 92.00 :5.52 : 98.03 : 4.5 : 90.00 : 7.04 : 103.40 : 4.4 : 90.00,PD2 : 0.30 · 2.99 :100.00 : 3.2 : 97.50 :5.42 : 96.40 : 2.9 : 95.00 : 7.21 : 121.00 : 2.7 : 93.00,P03 : 0.26 , 2.37 : 78.40 : 3.3 : 95.00 :4.47 : 83.30 : 3.0 : 93.00 : 6.57 : 142.80 : 2.7 : 92.00,P04 : 0.23
,2.99 :102.60 : 2.8 : 90.00 :4.12 : 74.84 : 2.7 : 90.00 : 6.03 : 129.93 : 3.4 : 80.70·po5 : 0.26
, 2.87 : 97.02 : 3.1 : 90.00 :4.21 : 75.17 : 3.9 : 89.40 : 6.23 : 137.00 : 4.1 : 85.40,----------------------------------------------------------------------------------------------------------------b) P.monodon--------------------------------------------------------------- ------------------------------- ----------------
STD, 0.20 ,
2.99, , 4.9 · 89.00 :6.22 I 5.2 ,
87.00,
8.22, 5.3 ,
85.00, , , , · , · , , ,P01 , 0.23 t 2.82
, 92.80 · 4.3 , 93.00 :6.01 , 98.16 4.2 , 92.00,
7.99 , 99.00 4.5 , 90.00, , , • · , · , , ,po2 · 0.20
, 2.91, 97.10 · 2.9 , 98.00 :6.12 . 99.38 3.1 · 94.00
,7.99 ,
93.50 2.9 I 91.00, , , , · . , · , ,P03 · 0.24 , 2.85 . 93.54 , 3.6 , 95.00 :6.17 :102.78 3.5 · 95.00 · 8.01 , 92.00 3.2 I 92.00, , , · · · , , ,PD4 ,
0.22 · 2.79, 92.10
,3.4 ,
90.00 :6.07 :101.50 3.4 , 87.00,
7.89 . 91.00 3.5 · 85.00, , , , , , · , ,po5 ,
0.23 · 2.57,
83.80,
3.6 · 89.00 :6.03 :107.10 3.7, 84.00
,7.73
,85.00 3.9
,82.00, , I , • , , . ,
----------------------------------------------------------------------------------------------------------------cl M.dobsoni------------------------------------------------------------------------------- --------------------------------
STD : 0.41 · 3.56, ,
5.4 , 87.0 :5.01, . 5.1 , 82.00 7.97 , ,
5.2,
80.00, , , , , , , , ,pol ,
0.45,
3.11 : 86.08, 4.1
,92.0 :4.97 :128.20
,4.4 · 90.00 7.02 ,
69.20 t 4.5, 88.00, , , , I , , , ,
PD2,
0.44,
3.42 , 96.40 · 2.8 ,97.0 :4.99 :108.20
,2.9
, 93.00 7.27 ,77.02 . 2.7 · 90.00, , , , · . , , , ,
PD3,
0.41 ,3.21
, 87.70 , 3.4 , 93.0 :4.89 :115.60,
3.6 , 90.00 7.04 ,72.60 . 3.7 ,
90.00, I , · , , I , , ,P04 ,
0.39,
3.19, 90.61 :3.01 · 89.0 :4.79 :110.30 ,
3.2 , 85.00 6.99 ,72.60
,3.1 , 83.00, , , t , , , , ,
po5 · 0.42,
3.17, 88.99
, 3.4 · 87.8 :4.97 :124.00,
3.6, 86.40 6.92 , 74.30
,3.9
,82.00, , , , , , · , , ·
* - compared to standard

39
culture in the paddy fields and 1n the esturine fish ponds. The
results were given in the Table 4.11. In the paddy fields, P02
gave a production level which is comparable to that obtained
with the standard diet followed by P01 and P03. po2 recorded
the lowest FeR (2.74). In the fish pond, P03 gave a production
level which 1S comparable to that obtained with the standard
followed by P01 and PD2. The lowest FCR was recorded by P02,
followed by standard P01 and P03.
DISCUSSION
The evaluation of efficiency of formulated diet is generally
carried out by estimating the growth rate and feed converS10n
ratio. Data on food conversion ratios of various penaeid prawns
1n response to various dietary formulations have been
investigated by Andrews et al. (1972); Venkataramiah et al.
(1975b) and Royan et al. (1977), AQUACOP, (1978), Fenucci et
al.(1980), Goswami and Goswami (1980), Alava and Lim (1983),
Gopal (1986), Ahamed Ali and Mohamed (1985) and Jaenike (1989).
A generalisation cannot be evolved from results reported in
these studies due to the differences in composition of diets,
species, size of the animals and other environmental parameters
(Kinne, 1960; Hysmith et al.,1972; De Silva and Perera, 1976;
New 1976; Condrey, 1982; Goswami and Goswami, 1980; De Silva,
1989).
In a mass culture normally one encounters with a mixture of
~pecies of prawns in varying growth stages. This makes it
essential to have the investigations for evaluation of the
efficiencies of feeds independently done with different species
of prawn that will be present in the culture to finalise the
feasibility of the feeds for rearing of prawns. The species that
are generally present 1n the aquaculture farms of Kerala are
Metapenaeus dobsoni, P.indicus, ~ monodon and Macrobrachium
rosenbergii. The Macrobrachium rosenbergii, 1S well known as
giant prawn, is not included in this study mainly due to the
large size and non availability of seeds at all the seasons.

Table 4.11 Field culture
a) In esturine fjsh pond (90 days)
Code No. of Feed used
Initial weight of PrawnFinal weight at harvestIncrease in weightTotal feed givenFe0d conversion Valup* Cost efficeincy ratio** Productivity ratio %Cost of feed per kgof prawn produced
PD1
0.3509.619.2635.373.8233.3073.9913.55
PD2
0.33510.73
10.43830.276
2.925.3183.4110.30
PD3
0.3779.7379.3639.314.2
36.6574.7914.91
:Standard
0.34812.86212.514
40.573.2
40.63
a) In Paddy field (90 days)
Code No. of Feed usedInitial weight of PrawnFinal weight at harvestIncrease in weightTotal feed givenFeed conversion Value* Cost efficiecny ratio•• Productivity ratioCost of feed per Kg ofprawn produced
PD10.66017.9117.2565.553.8
27.2684.7613.48
PD2o•• 55219.9119.3552.242.7419.3095.399.58
PD30.573
17.52316.9570.14.1329.5883.3414.68
: Standard0.527
20.83220.30580.33.95
49.63
* -
.- -
Cost efficiency ratio = cost of feed for 1kg of PDl __cost of feed resuced for 1kg with std
Productivity ratio = i~crease in wt for PDl x 100increase in wt for std

40
Under specified conditions, the growth maxima generally
depend on the range of dietary protein concentration and an
improvement in growth and food conversion is expected from the
low to high protein levels in the range. The observed higher
growth rate in the case of the standard feed for all the three
phases of growth in this study may have been the result of the
effect of hormones, that is present in the feed. The high food
conversion ratio, the low percentage survival and the low gross
and net conversion efficiency values also confirms the role of
hormones in the growth with the standard feed. Earlier works
also suggests such an increased growth when the feed contains
hormones (Fagerland and MC bridge, 1975; Yamazaki, 1976; Matty
and Cheema, 1978; Yu et al., 1979; Matty, 1986; Pillai et al.,
1987). The significantly high growth rate presented by the
formulated feeds (72 to 91.7%) with respect to the standard even
in the absence of growth inducing hormones, suggest that the
percentage of protein 1n the diets (30 to 43%) represents an
optimum range.
A review of the literature indicated an optimum protein
level of 30-45% for shrimp culture (Table 4.1). The effect of
substitution of dietary protein of animal or1gin with that of
plant origin was studied, by gradually replacing the former by
latter in formulated diets. An improved feed conversion
efficiency'and other growth parameters for the young shrimp were
reported by Balaz and Ross (1976). In the present study the
feeds were with 50% prolpin of animal origin and 50% of plant
origin. The high growth rate observed with the formulated feeds
in this study may have resulted from the application of this
combination of proteins • The low food conversion ratio compared
to the standard for all the three species of prawns studied are
indicative of a better utilisation of the feed consumed by the
prawns.
In penaeid shrimps employing various compounded feeds based
on varying protein sources and experimental conditions varying

41
food conversion values were reported (Vekitaramiah et al.,1975b;
Royan et al., 1977; Rajyalakshmi et al., 1979; Ahamed Ali,
1982a, 1988a; Goswami and Goswami, 1980; Raman et al., 1982;
sultan et al.,1982; Liu and Manceho, 1983; Ahamed Ali and
Mohamed, 1985; Gopal, 1986; Hajra et al., 1986; Dominy and Ako,
1988). Because of difference in the dietary formulations,a
direct comparison of the food conversion efficiencies obtained
in the present experiment with those obtained for the penaeid
shrimps in the earlier works is not possible. Stern et al.
(1976) reported that addition of vegetable matter to the food
improved the food conversion efficiency as well as the survival
rate of young shrimp. Balazs <1974 ) and Balazs and Ross (1976)
used multi- protein diet containing plant and animal proteins
and described them as good growth promoters. Venkataramiah et
al. (1975) reported that the presence of vegetable matter
enhanced the food converSIon ratio in the diet of Penaeus
aztecus.The high percentage of survival observed may be the
result of the addition of vegetable matter to the feed.
Generally the compounded feeds exhibit a high survival rate
(Venkaitaramiah et al.,1975b and Royan et al., 1977) .
GrOss(K1)
and net (K2) growth efficiencies are two other
important parameters which can enlighten the effectiveness of a
feed. Welch (1968) assigned a value of 15 to 35% for Kl and
20-90% for K2. If the Kland K2 are more over less agrees to each
other, the assimilation efficiencies considered to be high
(Welch,1968; Sambasivam et al., 1982). In this study, the gross
and net growth efficiency values were close to each other
indicating a high assimilation efficiency for the feeds.
Only sparce information on the dietary mineral nutrition of
prawns exist. In the present study, the important nutritive
trace metals such as copper, zinc and mangan~se were studied
with a view to formulate a suitable nutritionally balanced diet
including the minerals.
Copper was found to be required In the diet of fin fishes.

42
Diets having 3 mg copper/kg showed higher weight gain 1n common
carp. Deshimaru and Yone (1978) have remarked that copper may
not be required in the diet of prawn .However, some of the
natural feeds used for rear1ng prawns contain appreciable amount
of copper, for eg., copper content in the Roteiferus plicate
(brachionous) varies from 4 to 23mg/g on dry basis. Therefore,
it may be considered that diet is a source of copper for prawns.
In this study addition of copper to the diet did not improve the
growth rate of prawns. Literature on the effect of dietary
copper content on the growth and food conversion ratio of the
prawns are not available.
Requirement of zinc in the diet of prawn has not been
studied in any of the earlier works though its regulation in the
body has already been confirmed (Byran, 1964, 1968). Deshimaru
and Yone(1978) indicated that 0.2% of trace elements were
required in the diet of the prawn Penaeus japoincus. The trace
element mixtures used in their study contained Zinc sulphate
equivalent to about 34.5 mg of zinc per 100g diet. Compared to
this, the zinc requirement shown in this study is lower.
Feeding the diet with manganese level varying from 0.21 to
2.60mg/100g diet to P indicus did not improve the growth and
food conversion ratio (Ahamed Ali, 1988a). Kanazawa et al.(
1984) reported that the growth of P japonicus is dependent on
the manganese concentration in the diets.The modification of the
manganese. concentration in the diet had no beneficial effect on
growth.
The selection of three feeds, PD1, PD2 and P03, for the
field experiments were done taking into consideration the
overall FCR and the percentage of survival, in the laboratory
mass culture with due consideration to the various growth
parameters obtained in the low density individual culture
experiments. The comparable productivity ratio (73.99 to 95.29)
with respect to the standard indicate that these feeds can very
well be suggested as a replacement for the aquaculture.

43
The economics of the various feed mixtures shows that the
per kg cost of the feed for imported one is Rs 12.55 whereas,
the feed formulated in this study works out to 3.55 only. Taking
the conversion factor into consideration. the cost of producing
1kg of prawns comes out to be in the range of Rs 10.05 to 14.91
for the PD feeds and under the same condition, the cost of the
standard feeds was in the range of Rs 40.63 to 43.72 and the
available local feeds are in the range Rs. 17.0 20.0. This
represents a high economic advantage at the same time of
doubles the production at the cost of a single production with
any of the feeds available in the market, even if the market
economy of the manufacture of the formulated feeds may double
the cost of feed when it will be marketed for regular usage.