Embed Size (px)
Citation preview
Biochimica et Biophysica Acta, 731 (1983) 217-221 217 Elsevier
BBA71680
STUDIES ON THE LACK OF COOPERATIVITY IN THE MELTING OF LIPID BILAYERS
OLE G. MOURITSEN
Department of Physical Chemistry, Chemical Institute, A arhus University, DK-8000 A arhus C (Denmark)
(Received January 4th, 1983)
Key words: Lipid bilayer; Phase transition," Non -cooperativity," Cluster distribution," Non -equilibrium effect
The gel-to-fluid first-order melting transition of lipid bilayers is simulated by the use of a microscopic interaction model which includes a variable number of lipid-chain conformational states. The results suggest that the experimental observation of 'continuous melting' in pure wet lipid bilayers, rather than being ascribed to the presence of impurities, may be explained as a result of kinetically caused metastability of intermediate lipid-chain conformations.
Introduction
Since the pioneering work by Chapman and co-workers [1] it has remained a puzzle why the endothermic gel-to-fluid first-order phase transi- tion of pure one-component uncharged lipid bi- layers appears as a broadened 'continuous' melt- ing process in every experimental investigation (see, e.g., Refs. 2 and 3 for recent reviews on lipid bilayer phase transitions). It is now experimentally well established that this main transition is indeed of first-order, being a consequence of lipid chain melting which causes a dramatic change in the lipid bilayer thickness, leaving the total volume almost constant [4,5]. Theoretical calculations on a variety of microscopic as well as phenomenologi- cal models lend support to this conclusion (see, e.g., Refs. 6 and 7 for recent reviews on theories of lipid bilayer phase transitions).
In some experiments, the first-order nature is inferred from the presence of hysteresis [8-10]. In order experiments, a completely reversible behav- ior is found and the first-order nature is assessed by a simple Van 't Hoff analysis [11-14]. Most frequently, the 'continuous' nature of the transi- tion has been explained in terms of 'lack of perfect cooperativity' [2,11,15], the degree of cooperativity
0005-2736/83/$03.00 © 1983 Elsevier Science Publishers B.V.
being diminished by the presence of site defects or small amounts of impurities. The recent finding of a 'continuous' transition in large single phos- phatidylcholine vesicles [12] rules out that the broadening is caused by interlayer couplings.
Obviously, it is of interest to determine the origin of the rounding of the first-order transition. It is important to stress at this point that for a pure one-component system in thermal equi- librium, Gibbs's phase rule forbids rounding of a transition and coexistence of phases over a finite temperature range. Such phenomena are, there- fore, strictly non-equilibrium effects. The question we seek to answer here is whether there exists an intrinsic molecular property of the pure lipid bi- layer which may be responsible for the observed 'continuous' melting. If this is in fact the case, one need not look for more complicated explanations (e.g., in terms of impurities or experimental inade- quacies) of the broadened transition. In this paper, I report on a numerical simulation of the phase transition in a theoretical microscopic interaction model for a genuinely pure one-component lipid bilayer. The results demonstrate that in the vicin- ity of the first-order transition the diversity of lipid-chain conformations accounted for in the model leads to extremely slow-relaxing, non-equi-
218
librium distributions of large clusters of the oppo- site phase. The macroscopic consequence of this phenomenon is a complete smearing of the transi- tion as well as a strong enhancement of the lateral density fluctuations and the compressibility of the bilayer.
Model calculation
The model on which the results are based is a q-state Pink model [7] which assumes the lipid molecules to be positioned on a triangular lattice. Each lipid chain can be in any one of q distinct conformational states and each state is char- acterized by an internal energy, a cross-sectional area, and a degeneracy. The q states incorporate a ground (all-trans) state, a highly fluid ( 'melted') state, and q - 2 intermediate gel-like excited states (e.g., with kink and jog defects). The hydrocarbon chains interact via anisotropic Van der Waals forces and the polar-head-group attraction is mod- elled by an internal lateral pressure. For q = 2 and q = 10, the Pink model has proven to contain the essential physics for describing a great variety of experimental measurements on phosphatidylcho- line bilayers, notably the thermodynamic and structural properties in the main transition region [7,16]. Strong arguments can be presented for the phase transition of the q-state model to be of first-order. This is most easily demonstrated within the mean-field solution scheme, which assumes the equilibrium state of the system to be without spa- tial fluctuations. The mean-field theory predicts for the q-state model a first-order transition associ- ated with pronounced discontinuities in various thermodynamic properties at the transition tem- perature, T m, i.e., no smeared transition. However, the appearance of the first-order transition may well be different within a more accurate solution scheme, such as numerical simulation [16], which allows for spatial fluctuations. In, this work, I have used a Monte Carlo importance sampling proce- dure [16] to simulate the statistics of q-state Pink models. From these statistics, all thermodynamic properties are readily derived as functions of tem- perature. Furthermore, in a numerical Monte Carlo simulation the microscopic states of the system are available and detailed insight on the molecular level can be obtained. A Monte Carlo simulation
may be considered an experiment on a well-de- fined system carried out under completely con- trolled conditions.
I have examined the phase transition in q-state models with 2_< q < 10. The parameters of the q = 10 state model are those pertinent for di- palmitoylphosphatidylcholine [7,16]. In order to allow an investigation of the influence of the value of q on the phase transition no attempt was made to fit to experiment the model parameters of the other models. Rather, these models are derived from the q = 10 state model by deleting an ap- propriate number of intermediate states, keeping constant the total number of states (i.e., the sum of the degeneracies).
Results
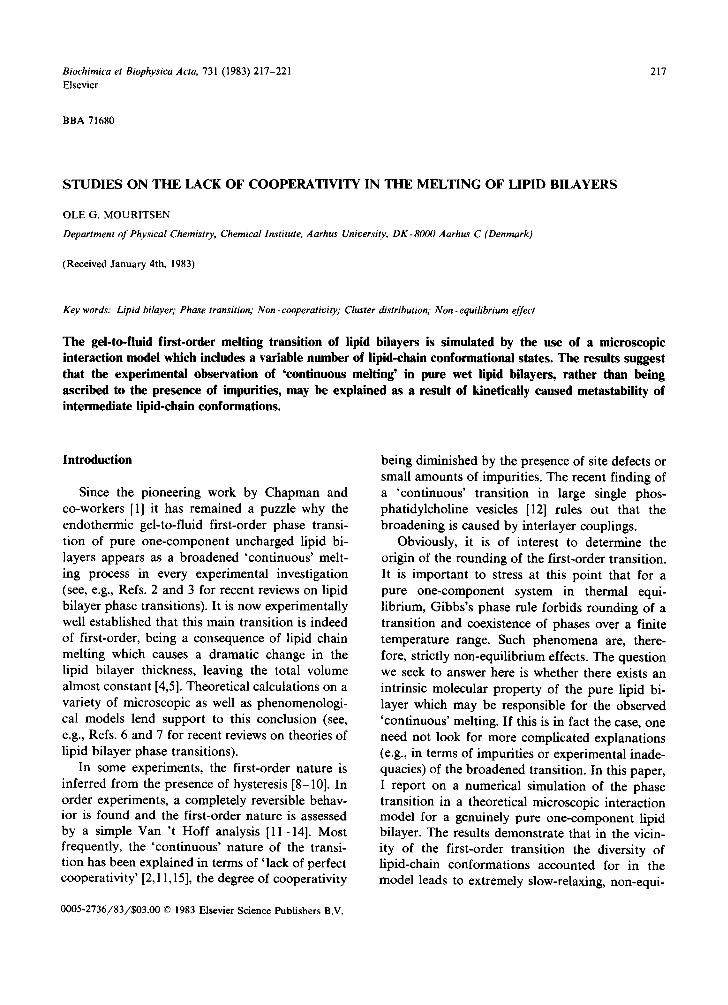
In Fig. 1 are given the results for the average cross-sectional area per chain, A(T) , as a function of reduced temperature for various values of q. Results from increasing as well as descreasing temperature series are shown. The temperature has been changed in very small steps in order to facilitate the relaxation towards thermal equi- librium. In these calculations a system with 3600
34
z 32
~ 3o
<
} 2c
//o
/
- - ° J J - - o - - ° ~ o ~ . . . . . _o o ° ~ o o ~ ° _ o ~ O
_ _ o - - O
0.99 1.00 I.()I REDUCED TEMPERATURE
Fig. 1. Average cross-sect ional area per chain as a funct ion of
reduced temperature , T I T m, for q-state Pink models . T m is the equ i l ib r ium mel t ing temperature . ©, D a t a ob ta ined from Monte Car lo calcula t ions . In the case of q = 3 the subscr ip t refers to k ink (k) and jog (j) in te rmedia te chain confo rmat iona l states. The dashed loops specify for the q = 6 and q = l0 state models the range over which metas tab le s tates have been detected.
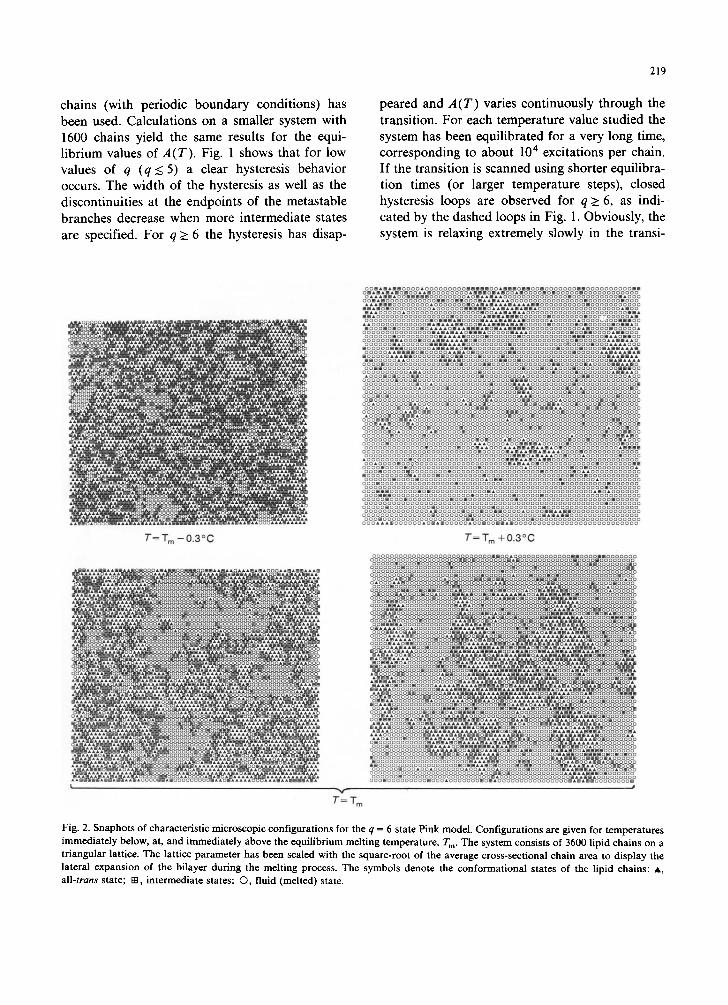
chains (with periodic boundary conditions) has been used. Calculations on a smaller system with 1600 chains yield the same results for the equi- librium values of A(T). Fig. 1 shows that for low values of q (q_< 5) a clear hysteresis behavior occurs. The width of the hysteresis as well as the discontinuities at the endpoints of the metastable branches decrease when more intermediate states are specified. For q _> 6 the hysteresis has disap-
219
peared and A(T) varies continuously through the transition. For each temperature value studied the system has been equilibrated for a very long time, corresponding to about 10 4 excitations per chain. If the transition is scanned using shorter equilibra- tion times (or larger temperature steps), closed hysteresis loops are observed for q >_ 6, as indi- cated by the dashed loops in Fig. 1. Obviously, the system is relaxing extremely slowly in the transi-
~:;~-i: i . .~.,,Y " , , .v,~.~, ,-j: :7" ".~;~, ~,' ;~.~T ,," ,,'~,'~:t;~..
, , , ,T~:, ,..11~....11~, . , . , , .,~,,, . .V, i, ,I~.T~T..., ' ?.
T = T m - 0 . 3 o c
Y
T = ' r ~
oom6mam|ooooaooooooooom mooam|mo moo ooooooo oooooooooom| o . , . , . , . ...... . ooo oo ooo ~Y~do~ • .oo ,Q'o'oo ~o= .... ~Y~oooo ..... oo oaa~maoommmmmooooooooao~a aaoooooooooooooomoooooooooomaooo
ooua ooooooooooommoom~ooo aa aaaooooo oooooooooo ooooooouooo mm~momooooooooo~oooooommm mo~ ~ ~mm~oooooooooooooooooo~moo ~aaoooooaooooooooooooooo~ooa~a~aaoooooooooooooooooooooo~ mmaoooooooooooooooomooooo amm • moooooomooooooomoocToooooam oo o oo oo o ooo ooomo~mm~ mooo~ ~ ~m~m~llo o ooo~ ooooo~ oooo ~ ooomoo • ~oooooooooooom~m~ mooom~ • • ooooomooooomo ooooo omm~o mooomomo .... mo .... b~mmm~ • m m m a ~ommm~Z ~mm~ ~m~ o o o o o o .... oo ~ o oo~oooo*
ooooooooooooooomamauaaomnu~ooooo~aaaooooooooo)moommm¢.mmoo: ooooam o ..... o.o ....... om .... • .... .oooooo= .... o o o o o o omoo o o. • .~. =o o
oooooomlaooomooa aaaa omooooooooooooooooooo omooooooaammlao ...... ~Xooo .... ~ , , , ~ d o ....... .ooo ........ ~oooo=o ....... oo
mooooomm ooooooammamaomloooooooo ooooooooomooo mooooma maaam ooooo.~==o.oooo~,,=,~ooooooo'~ .... oooooooo~Joooo.~'/.=,. moooooaaammoooooo oomlooomoooo oooooooooooooooooooooo aa maa ..... oo ......... ~W.,~d ...... o~Woo. ...... .oooo0o~oooo~%'~/... oooo ooooooooooooomoomoooommooooooooooooommooooomaoooom • o oom~ooooooooooooooooooooooooooooomooomooaooomoooooooo~do
ooooooooooa aoooooooooooo~ooooooooooooooo~oooomoooooooa~maao ~ooomomooo~Wooooooooooooomooooooooaoooooooooooommooooooooaoo ooooooomooo oooooooooooooooooooo mmoooooooooo ooooooooooooo .... oooooo~oo,oooo ....... o.ooo~/ ..... oooo~o~doooooooooooo.
ooooooooooooaooooomoooooooooooooo )omm~ amooooooo)m(ooaoooooooooomo . . . . . . oooo . . . . . . . . ooooo . . . . = o o o o o ~ = , o o . . . . . o = o o . o o o o o . . . . . . .
ooonomoooooooooooooooooooom ooooooaa oooooooooooooooooomoooo omoooooooooooooooooooaoooo~oooooo~a~doooooaoooooooo~o000oooo oo~ooooooomaoooooomoooamoo oooooooomomoo aooomoooo oo ooooo o o o oo o omo om~o ~ ooo oo o oo oom>mmm~oo o oooo o ooom~m~m~ ~ o o ooomo>~mdo~ oooo o
ooooooooo~a~ommooooomoooooooooo m o o o o o o o o o ~ o o o o o o o o o o o o o o o o aoooomoommmaooooooooooomoooooo~ooomoooooooooomoooooooooooo
ooo~moo~aooooooooooooooooooooaoomooooooooooooooooooom oooo oo~aamooomaoooooooooooooooooooooooooooooooooooomo0000o~ooo~ oooom~oooomooomoooooom|olooooooooooooomomoooooooooooooo6ooo ~o~ol oo . . . . . • o , o o . . . . . . . . . . . = o o o o o o . . . . . . . . . o o o o o o o o . . . . . o o ~ o o % . ~ o o
oooooomoooooomoooooooooooooooooooooooooooooooaoooooomoo amo oooooooooooooooooooooooomo~oooamooaooooooooo~ooomooooo~ll~doo ooooomoooooooooooooooooo~aaooooao m aooooo~ooooooooooomooo ooooooooooooomoooooomooomaaoooaaa • aa aomooo ooooooooammmm ................................ ..... ............ oooooooooooooooooooooooooooooooo~mmmc~moam~ ~oomooo~ooooooomoooo • oo ....... =cooooo ............. om°mm..m o, = = ....... oooooo ...... oo~oooomoo ~ooooooooooooooooooom~ma~omoooooooooooomooooooomm oooomoooom oooooooooooooomoooooooooaooooooooo oomooooooooooa ooomoooo~m~dooooooomooooooooooooooooooomooooo~o~ooooooooooo mooooooooo~oooomooooooooomoooooooooooooooooomoomooooooooooo oooooomoooomoooooooooooooo~ommoooooooooooo ooooooo~ooooooooo ooomoooooooooooooooomooooooooooooooooooooo~ooooooooomoooooo oooooooooooooooooooooooooooooooooooooooooooooooooooomooooooo
ooo ~oooooomo~oooooooooooo~aoooooooooooooooooooooa~oaoooooo oo~mmmm~mooooooooooooooooomoooooooomooooomooooooooooooooooooooo ooooomooomooooooooomoomoooooooooomoooooooooooooooooooomooooo oooooooooooooooooooooooooooooooooooooooooooooooooooo~ooooooo
ooooomooooooooo oooooo ooooomoooooooooo o oooooooooooooooooo ..... ooo ...... ~ ..... ~doo.oo== ........ ~,mmoooooo .........
ooooooooooooooomooooooo ooooooooooooooomamammooooooooooooooo ooo~ooocoooooooooooooo~m~oooooooooooomooooooooooooooooooooooo ooo~moooooo~om~moooooaoomoomm~mooooooooooooooooooooooooooo
T = T ~ + 0 . 3 ° C
_____ ~ oooo~o o o~ o oJ ~c ooooooooooooooooooo ooommo ~ )omaAomoocooooooooooo ~oi~ o ~Oo~mmom~ ooo ooooooo ~o~o~o~oVeO oooa poOoOoOoOoOoO.~oOo~Oo.oo ..... .......... ..... ooooooo l,°2o%ooo~&,°o~d Po°o°o°mg°~°o°d'o°o°°o°o°oC6°~°~°°°°°°°°°°°°°ooooo°o°
o o~d ,c~°m°d6~o°m'],Pdo'°o=.Yo°,° o~°o~o°,m'~m°o°d P°°o°=°.'~tI~'~f'~°°°==°°'°°°°°° ~°.°d o ~"~"o~ 'o",.°o"~": o ~°o~i~d ~°..°oY" ... ooo=o, ~ ~ o # & PoOoOo.oOoOoOoOO ° oooo ooo ooo o • o o oooooooo
.... • .'. ol#.°d o o o .... ~ I ",,!~I~PL, ~.°°o°lo°o°omo°g ° oo oaa~ ~ a a m o o oooo • • oo o
aao aaaoo~oo o • ooo o • oo~mooooooo~ • • • ooo
oaoooooo ~maaa • o oa ooooo oo aa o o ~ ~ ~ ~ ' ~ . . . . . . . .
• oo oooooo aam~ o •
oo o ~'~ ~'m',: ~ oo ~ ~ o ~ o a a a°o°° oooo • o o o o~oCo ooooaa aaa o
o o • I~2~ o o o o o o ~ ~ % ° o ° E o ° ~ ° % ° ° o ° . OoOoO.=OoOoOoO,Oo9O I o .oo oooo ,=, ooo oo
aaaoooo oo • a~a ooo ooooaa • • o • o o~o°m°o~o o o • • oo • ooooooo
......
oooooooooooo o ~°o~ °' °°°°o°o%° o O.oOO ooooooooooooomo oooo oooooo • oo ~ ~ o ' O ~ o ° ~ o o o ~o~ m ~OoOoO~O.Oo'o
o ~oooooooooooaama o oooooo o o o o o m o o o o o o o ~o~o~o~o~o~o°o°o°o'o°o°.f~=o°o=o°Oo°~ o o o o o o o o o ~ o ~ o o o o o o ooomooooooooomoooaoooooooeo~aoooooooooooooooomamammoooooooom
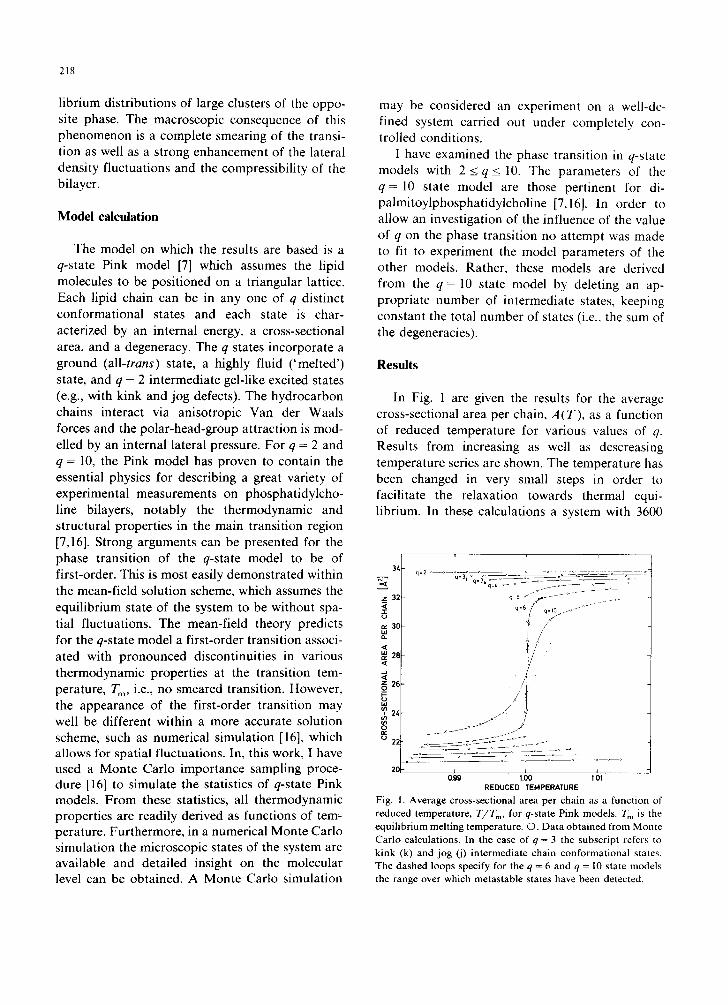
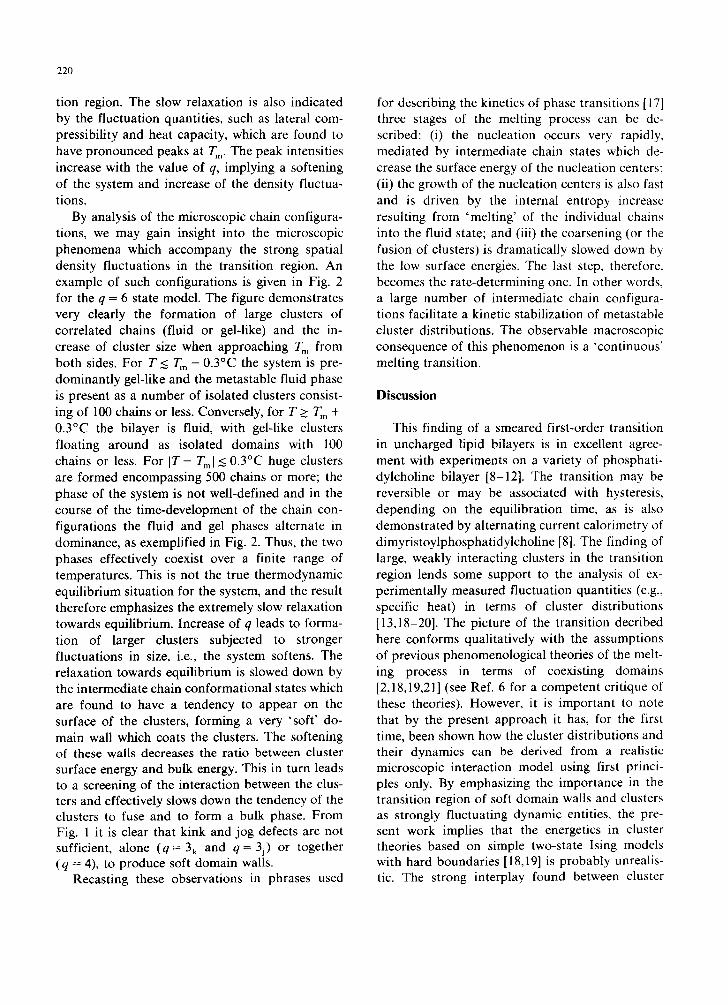
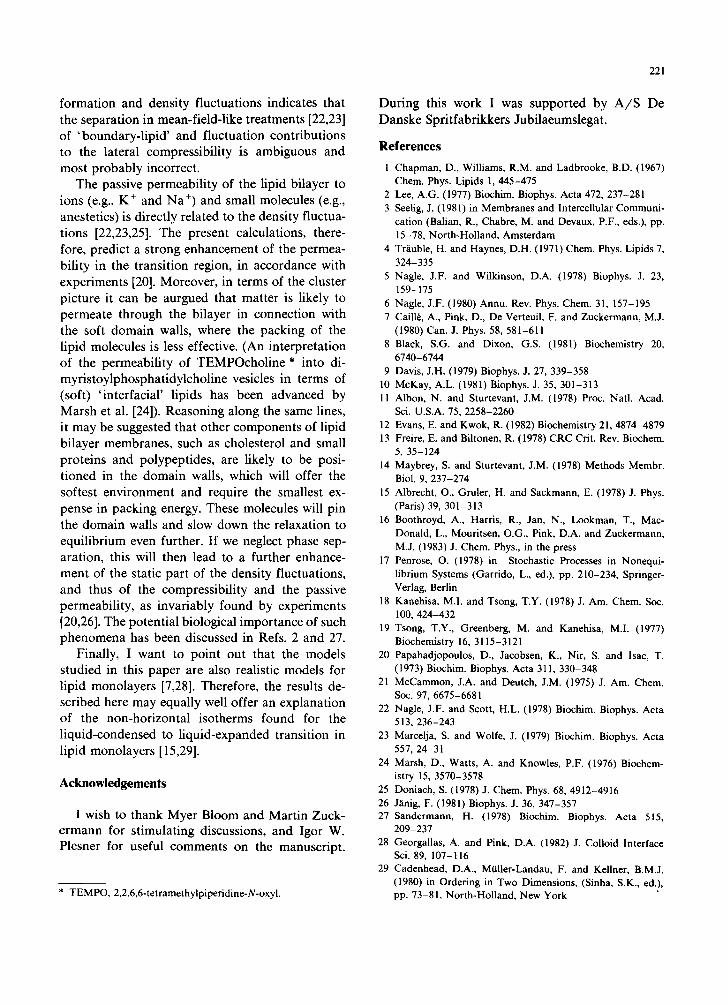
Fig. 2. Snaphots of characteristic microscopic configurations for the q = 6 s ta te P ink model . Configurations are given for temperatures immediately below, at, and immedia t e ly above the equilibrium melting temperature, T m. The system consists of 3600 lipid chains on a t r i angu la r latt ice. The lattice parameter has been scaled with the square-root of the average cross-sectional chain area to display the la teral expans ion of the bilayer during the melting process. The symbols denote the conformational states of the lipid chains: a , all-trans state; m, intermediate states; (D, fluid (melted) state.
220
tion region. The slow relaxation is also indicated by the fluctuation quantities, such as lateral com- pressibility and heat capacity, which are found to have pronounced peaks at T m. The peak intensities increase with the value of q, implying a softening of the system and increase of the density fluctua- tions.
By analysis of the microscopic chain configura- tions, we may gain insight into the microscopic phenomena which accompany the strong spatial density fluctuations in the transition region. An example of such configurations is given in Fig. 2 for the q = 6 state model. The figure demonstrates very clearly the formation of large clusters of correlated chains (fluid or gel-like) and the in- crease of cluster size when approaching T m from both sides. For T_< T m - 0.3°C the system is pre- dominantly gel-like and the metastable fluid phase is present as a number of isolated clusters consist- ing of 100 chains or less. Conversely, for T_> T m + 0.3°C the bilayer is fluid, with gel-like clusters floating around as isolated domains with 100 chains or less. For I T - Tm] ~< 0.3°C huge clusters are formed encompassing 500 chains or more; the phase of the system is not well-defined and in the course of the time-development of the chain con- figurations the fluid and gel phases alternate in dominance, as exemplified in Fig. 2. Thus, the two phases effectively coexist over a finite range of temperatures. This is not the true thermodynamic equilibrium situation for the system, and the result therefore emphasizes the extremely slow relaxation towards equilibrium. Increase of q leads to forma- tion of larger clusters subjected to stronger fluctuations in size, i.e., the system softens. The relaxation towards equilibrium is slowed down by the intermediate chain conformational states which are found to have a tendency to appear on the surface of the clusters, forming a very 'soft ' do- main wall which coats the clusters. The softening of these walls decreases the ratio between cluster surface energy and bulk energy. This in turn leads to a screening of the interaction between the clus- ters and effectively slows down the tendency of the clusters to fuse and to form a bulk phase. From Fig. 1 it is clear that kink and jog defects are not sufficient, alone ( q = 3 k and q = 3j) or together (q = 4), to produce soft domain walls.
Recasting these observations in phrases used
for describing the kinetics of phase transitions [17] three stages of the melting process can be de- scribed: (i) the nucleation occurs very rapidly, mediated by intermediate chain states which de- crease the surface energy of the nucleation centers: (ii) the growth of the nucleation centers is also fast and is driven by the internal entropy increase resulting from 'melting' of the individual chains into the fluid state; and (iii) the coarsening (or the fusion of clusters) is dramatically slowed down by the low surface energies. The last step, therefore, becomes the rate-determining one. In other words, a large number of intermediate chain configura- tions facilitate a kinetic stabilization of metastable cluster distributions. The observable macroscopic consequence of this phenomenon is a 'continuous' melting transition.
Discussion
This finding of a smeared first-order transition in uncharged lipid bilayers is in excellent agree- ment with experiments on a variety of phosphati- dylcholine bilayer [8-12]. The transition may be reversible or may be associated with hysteresis, depending on the equilibration time, as is also demonstrated by alternating current calorimetry of dimyristoylphosphatidylcholine [8]. The finding of large, weakly interacting clusters in the transition region lends some support to the analysis of ex- perimentally measured fluctuation quantities (e.g., specific heat) in terms of cluster distributions [13,18-20]. The picture of the transition decribed here conforms qualitatively with the assumptions of previous phenomenological theories of the melt- ing process in terms of coexisting domains [2,18,19,21] (see Ref. 6 for a competent critique of these theories). However, it is important to note that by the present approach it has, for the first time, been shown how the cluster distributions and their dynamics can be derived from a realistic microscopic interaction model using first princi- ples only. By emphasizing the importance in the transition region of soft domain walls and clusters as strongly fluctuating dynamic entities, the pre- sent work implies that the energetics in cluster theories based on simple two-state Ising models with hard boundaries [18,19] is probably unrealis- tic. The strong interplay found between cluster
formation and density fluctuations indicates that the separation in mean-field-like treatments [22,23] of 'boundary-lipid' and fluctuation contributions to the lateral compressibility is ambiguous and most probably incorrect.
The passive permeability of the lipid bilayer to ions (e.g., K ÷ and Na ÷) and small molecules (e.g., anestetics) is directly related to the density fluctua- tions [22,23,25]. The present calculations, there- fore, predict a strong enhancement of the permea- bility in the transition region, in accordance with experiments [20]. Moreover, in terms of the cluster picture it can be aurgued that matter is likely to permeate through the bilayer in connection with the soft domain walls, where the packing of the lipid molecules is less effective. (An interpretation of the permeability of TEMPOcholine * into di- myristoylphosphatidylcholine vesicles in terms of (soft) 'interfaciar lipids has been advanced by Marsh et al. [24]). Reasoning along the same lines, it may be suggested that other components of lipid bilayer membranes, such as cholesterol and small proteins and polypeptides, are likely to be posi- tioned in the domain walls, which will offer the softest environment and require the smallest ex- pense in packing energy. These molecules will pin the domain walls and slow down the relaxation to equilibrium even further. If we neglect phase sep- aration, this will then lead to a further enhance- ment of the static part of the density fluctuations, and thus of the compressibility and the passive permeability, as invariably found by experiments [20,26]. The potential biological importance of such phenomena has been discussed in Refs. 2 and 27.
Finally, I want to point out that the models studied in this paper are also realistic models for lipid monolayers [7,28]. Therefore, the results de- scribed here may equally well offer an explanation of the non-horizontal isotherms found for the liquid-condensed to liquid-expanded transition in lipid monolayers [15,29].
Acknowledgements
I wish to thank Myer Bloom and Martin Zuck- ermann for stimulating discussions, and Igor W. Plesner for useful comments on the manuscript.
* TEMPO, 2,2,6,6-tetramethylpiperidine-N-oxyl.
221
During this work I was supported by A/S De Danske Spritfabrikkers Jubilaeumslegat.
References
l Chapman, D., Wilhams, R.M. and Ladbrooke, B.D. (1967) Chem. Phys. Lipids l, 445-475
2 Lee, A.G. (1977) Biochim. Biophys. Acta 472, 237-281 3 Seelig, J. (1981) in Membranes and Intercellular Communi-
cation (Balian, R., Chabre, M. and Devaux, P.F., eds.), pp. 15-78, North-Holland, Amsterdam
4 Tr~iuble, H. and Haynes, D.H. (1971) Chem. Phys. Lipids 7, 324-335
5 Nagle, J.F. and Wilkinson, D.A. (1978) Biophys. J. 23, 159-175
6 Nagle, J.F. (1980) Annu. Rev. Phys. Chem. 31, 157-195 7 Caill~, A., Pink, D., De Verteuil, F. and Zuckermann, M.J.
(1980) Can. J. Phys. 58, 581-611 8 Black, S.G. and Dixon, G.S. (1981) Biochemistry 20,
6740-6744 9 Davis, J.H. (1979) Biophys. J. 27, 339-358
l0 McKay, A.L. (1981) Biophys. J. 35, 301-313 II Albon, N. and Sturtevant, J.M. (1978) Proc. Natl. Acad.
Sci. U.S.A. 75, 2258-2260 12 Evans, E. and Kwok, R. (1982) Biochemistry 21, 4874-4879 13 Freire, E. and Biltonen, R. (1978) CRC Crit. Rev. Biochem.
5, 35-124 14 Maybrey, S. and Sturtevant, J.M. (1978) Methods Membr.
Biol. 9, 237-274 15 Albrecht, O., Gruler, H. and Sackmann, E. (1978) J. Phys.
(Paris) 39, 301-313 16 Boothroyd, A., Harris, R., Jan, N., Lookman, T., Mac-
Donald, L., Mouritsen, O.G., Pink, D.A. and Zuckermann, M.J. (1983) J. Chem. Phys., in the press
17 Penrose, O. (1978) in Stochastic Processes in Nonequi- librium Systems (Garrido, L., ed.), pp. 210-234, Springer- Verlag, Berlin
18 Kanehisa, M.I. and Tsong, T.Y. (1978) J. Am. Chem. Soc. 100, 424-432
19 Tsong, T.Y., Greenberg, M. and Kanehisa, M.I. (1977) Biochemistry 16, 3115-3121
20 Papahadjopoulos, D., Jacobsen, K., Nir, S. and Isac, T. (1973) Biochim. Biophys. Acta 311,330-348
21 McCammon, J.A. and Deutch, J,M. (1975) J. Am. Chem. Soc. 97, 6675-6681
22 Nagle, J.F. and Scott, H.L. (1978) Biochim. Biophys. Acta 513, 236-243
23 Marcelja, S. and Wolfe, J. (1979) Biochim. Biophys. Acta 557, 24-31
24 Marsh, D., Watts, A. and Knowles, P.F. (1976) Biochem- istry 15, 3570-3578
25 Doniach, S. (1978) J. Chem. Phys. 68, 4912-4916 26 J~inig, F. (1981) Biophys. J. 36, 347-357 27 Sandermann, H. (1978) Biochim. Biophys. Acta 515,
209-237 28 Georgallas, A. and Pink, D.A. (1982) J. Colloid Interface
Sci. 89, 107-116 29 Cadenhead, D.A., Miiller-Landau, F. and Kellner, B.M.J.
(1980) in Ordering in Two Dimensions, (Sinha, S.K., ed.), pp, 73-81, North-Holland, New York