Embed Size (px)
Citation preview
Studies on Unemploymentand Underemploymentin Rural Pennsylvania

The research projects presented in this report were sponsored by grants from the Center for RuralPennsylvania, a legislative agency of the Pennsylvania General Assembly.
The Center for Rural Pennsylvania is a bipartisan, bicameral legislative agency that serves as aresource for rural policy within the Pennsylvania General Assembly. It was created in 1987 underAct 16, the Rural Revitalization Act, to promote and sustain the vitality of Pennsylvania’s rural andsmall communities.
Information contained in this report does not necessarily reflect the views of individual boardmembers or the Center for Rural Pennsylvania. For more information, contact the Center for RuralPennsylvania, 200 North Third St., Suite 600, Harrisburg, PA 17101, telephone (717) 787-9555, fax(717) 772-3587, email: [email protected].
Studies on Unemployment and Underemploymentin Rural Pennsylvania
Determining Policy Options for Reducing Unemploymentand Underemployment in Rural Pennsylvania
ByJill L. Findeis, Ph.D., Martin Shields, Ph.D. and Sundar Shrestha, Ph.D.
Department of Agricultural Economics and Rural Sociology, the Center for Economic and CommunityDevelopment, and the Population Research Institute, Pennsylvania State University
Assessing Rural Underemployment and Unemployment in PennsylvaniaBy
David B. Yerger, Ph.D. and Jack D. Julian, Jr., Ph.D.Department of Economics, Indiana University of Pennsylvania
March 2009
and
PrefaceUnemployment rates in rural Pennsylvania have surpassed urban rates since at least the 1970s,
according to county-level data from the state Department of Labor and Industry. Over the 10-yearperiod of 1996 to 2006, rural unemployment rates were, on average, about 1 percentage pointhigher than urban rates.
To get a deeper understanding of unemployment and take a look at the relatively unexploredproblem of underemployment in rural Pennsylvania, the Center for Rural Pennsylvania sponsoredtwo research projects in 2006.
One project, Determining Policy Options for Reducing Unemployment and Underemployment inRural Pennsylvania, was conducted by researchers from Pennsylvania State University. Thisresearch documented unemployment trends and analyzed unemployment rates in Pennsylvania’srural counties over a 30-year period. It also measured rates of underemployment for Pennsylvaniaand neighboring and nearby states with data from 1996 to 2006, and used more recent data from2005-2006 to understand selected dimensions of underemployment, such as the age and educationlevels of the underemployed, in rural Pennsylvania.
The other project, Assessing Rural Underemployment and Unemployment in Pennsylvania, wasconducted by researchers from Indiana University of Pennsylvania and focused on the forcescausing unemployment, underemployment, or withdrawals from the labor market in rural Pennsyl-vania. The research assessed how labor markets in each rural Pennsylvania county were perform-ing relative to each other, to urban Pennsylvania counties, and to carefully defined peer groups ofsimilar counties nationwide. With this approach, the researchers could get a better sense of thestrength, or weakness, of a county’s labor market along with a realistic forecast of what might beachievable.
Policy considerations for both research projects stress the importance of an educated workforceand the need for diversification in both economic strategy and occupation mix in rural Pennsylva-nia to possibly reduce both underemployment and unemployment.
More indepth results of the two projects are presented in the following pages. Copies of the fullreports are available by contacting the Center for Rural Pennsylvania.
Table of ContentsDetermining Policy Options for Reducing Unemployment andUnderemployment in Rural Pennsylvania
Assessing Rural Underemployment and Unemployment in Pennsylvania
Executive Summary ......................................................................................................................... 6Introduction ....................................................................................................................................... 7
Prior Research .............................................................................................................................. 8Goals and Objectives ..................................................................................................................... 10Methodology ................................................................................................................................... 10Results .............................................................................................................................................. 12
Unemployment in Rural Pennsylvania ................................................................................... 12Factors Influencing Unemployment Rates in Rural Pennsylvania ..................................... 14Underemployment in Rural Pennsylvania ............................................................................. 15Comparing Pennsylvania to Neighboring States .................................................................. 16Prevalence of Alternative Forms of Underemployment ....................................................... 17Prevalence of Underemployment by Specific Indicators .................................................... 18Pennsylvania Metro, Nonmetro Differences ......................................................................... 19Determining If Underemployment Is Getting Better or Worse ........................................... 19Selected Forms of Underemployment in Rural Pennsylvania ............................................. 19Determinants of Underemployment ....................................................................................... 20Measuring Selected Forms of Underemployment in Pennsylvania Counties ................... 21
Summary ......................................................................................................................................... 21Policy Considerations .................................................................................................................... 22References ....................................................................................................................................... 22
Executive Summary ....................................................................................................................... 24Introduction ..................................................................................................................................... 25Goals and Objectives ..................................................................................................................... 25“Peer Group” Methodology .......................................................................................................... 25Results .............................................................................................................................................. 26
Impact of Age on Rural Pennsylvania Counties’ Employment-to-Population Ratios ...... 26Impact of Educational Attainment on Unemployment Rates .............................................. 28Forecast of Pennsylvania County Employment .................................................................... 30Potential Changes in Pennsylvania County Labor Supply 2005 to 2015.......................... 32Underemployed Estimates by Rural County ......................................................................... 33Estimates of the Number of Core Unemployable by Rural Pennsylvania County........... 34Factors Associated with Unemployed Workers in Rural Counties ..................................... 34Characteristics Associated with Various Labor Market Outcomes ..................................... 35Forecasts of County Employment by Educational Attainment ........................................... 35
Summary ......................................................................................................................................... 36Policy Considerations .................................................................................................................... 37References ....................................................................................................................................... 38
EXECUTIVE SUMMARYThis research, conducted in 2006, assessed the problems of unemployment and underemploy-
ment in rural Pennsylvania. It documented unemployment trends and analyzed unemploymentrates in Pennsylvania’s rural counties over the past 30 years. The research also measured rates ofunderemployment for Pennsylvania and nearby states with data from 1996 to 2006. The researchused more recent data from 2005 and 2006 to understand selected dimensions of underemploy-ment in rural Pennsylvania.
The study results indicated that a remarkably persistent “unemployment gap” has existed be-tween Pennsylvania’s rural and urban counties since at least 1976. Over the past 30 years,Pennsylvania’s rural and urban unemployment trends have mirrored U.S. averages, with rural ratesbeing consistently higher. The observed rural-urban unemployment gap is statistically significant,and there were no years in which the rural-urban rates were statistically equal. This suggestsmeaningful, long-term differences in Pennsylvania’s average rural and urban unemployment rates.The results also show that it is not simply a few counties that have inflated the (higher) averagerate for rural Pennsylvania. Rather, rural unemployment was found to be a widespread problemacross all rural counties.
The results also show that all persistent unemployment counties in Pennsylvania are rural.Fortunately, not all persistent unemployment counties were “pre-destined” with respect to theirlong-term relative standing as some improved over time.
The researchers used statistical models to estimate and provide additional understanding of theeffects of social, demographic, political and economic factors on relative county unemploymentrates (relative to the state average) and changes in the rates. Growth in local employment reducedrelative unemployment, as did a more diversified economy. Results also highlight the importanceof a better educated workforce. Finally, the results show that a one-time effort to stimulate localemployment growth can reduce unemployment rates in the short term. However, this effect disap-pears over time. A one-time effort is not enough to counter the higher equilibrium unemploymentrates that are characteristic of rural counties, so a long-term strategy is needed.
The research also analyzed underemployment in Pennsylvania. Underemployment was definedto include a variety of types of labor market or economic distress including “discouraged work-ers,” the unemployed, involuntary part-time workers, and workers whose earnings are very low (ator near the poverty level). The results show that more than one in five working-age Pennsylva-nians was underemployed in the last decade. Pennsylvania residents had higher underemploymentrates than U.S. residents in every year (1996-2006). Pennsylvania’s underemployment rates rangedfrom about 20 to 25 percent over this period, and diverged the most from U.S. rates during theearly 2000s recession. This suggests that Pennsylvania residents are more likely to feel the effectsof recession, as measured by their underemployment, than neighboring and nearby states.
An assessment of how Pennsylvania has been faring relative to neighboring and nearby statesshowed that, next to West Virginia, Pennsylvania had some of the highest underemployment ratesoverall and by type of underemployment. Regardless of state, nonmetro rates were found to beconsistently higher than metro rates. Those at higher risk of underemployment included nonmetroresidents, young adults, less educated residents, minorities, and women. Pennsylvania’s rates wereholding constant even though underemployment rates were generally declining in neighboring andnearby states. At the state level, worker’s compensation was not found to contribute to the under-employment problem, but average state/local tax burden at the state level did.
Focusing on Pennsylvania’s rural counties, the results indicate that a higher degree of industrydiversity and a better educated workforce contributed to lower rates of unemployment and fewerworkers having to take part-time jobs when they really wanted full-time work. Residents of
The Center for Rural Pennsylvania 6 Studies on Unemployment and Underemployment in Rural Pennsylvania
Determining Policy Options for Reducing Unemployment andUnderemployment in Rural Pennsylvania
Studies on Unemployment and Underemployment in Rural Pennsylvania 7 The Center for Rural Pennsylvania
Pennsylvania’s more remote rural counties were more likely to be underemployed, as were thoseliving in service-dependent counties. However, industry diversity and service dependence werefound to increase rates of multiple job-holding.
Finally, the results show that most underemployed rural Pennsylvania residents live in lower-income households, demonstrating that underemployment and poverty go hand-in-hand. Further,underemployment is not concentrated solely in counties that are dealing with persistent unemploy-ment but is a more widespread problem. In many respects, the use of underemployment rather thanunemployment as an indicator of labor market distress provides a deeper understanding of thelabor market issues faced by Pennsylvania’s residents.
The study results support a development strategy of building industry diversity to reduce unem-ployment and underemployment. That is, a portfolio of smaller projects to enhance local employ-ment is more likely to be more effective than a single larger project to create employment. Strate-gies to grow employment were shown to reduce unemployment and underemployment, but theimpacts of a one-time effort to enhance local employment were found to be short-lived. Addition-ally, an educated workforce was strongly associated with lower unemployment and underemploy-ment rates. Education was found to be a strong driver of reductions in unemployment and under-employment in Pennsylvania and selected neighboring and nearby states. The study results supportthe conclusion that to be competitive in the region, Pennsylvania’s rural counties must continue tobuild the skills of their workforce.
INTRODUCTIONUnemployment, a form of labor market distress, can pose significant challenges for individuals
and families. People want jobs that provide enough hours of work and pay wages that, when takentogether, offer a family-sustaining level of income. When this doesn’t occur, underemployment istypically the problem. Although many different forms of underemployment – including unemploy-ment – exist, the result is usually the same: people find it difficult to earn enough to make endsmeet. This report summarizes research findings to determine if unemployment and underemploy-ment are worse in rural Pennsylvania than the rest of the state, and, if so, what could be done toaddress the issues.
Unemployment rate statistics show a remarkably persistent gap between Pennsylvania’s rural andurban counties since at least the mid-1970s. Although Pennsylvania’s rural and urban unemploy-ment rates have tended to move in unison with national business cycles, unemployment rates in thestate’s rural counties have always been higher than in Pennsylvania’s urban counties for at least thelast 30 years. Further, underemployment has been worse in rural Pennsylvania. This means thatthere are higher rates of labor market distress – as measured by underemployment – in the state’srural counties as compared to urban counties.
As high unemployment and underemployment are common and persistent problems in manyparts of the commonwealth, one of the most pressing policy questions is how unemployment andunderemployment can be reduced. Historically, Pennsylvania has promoted economic develop-ment programs designed to encourage job growth and retention. For example, the PennsylvaniaIndustrial Development Authority (PIDA) and Machinery and Equipment Loan Fund (MELF) arelong-standing sources of low-interest loans issued to help Pennsylvania businesses invest in jobgrowth and retention1. In addition, the state encourages job creation through a variety of taxincentives, such as Keystone Opportunity Zones, and workforce development initiatives, such asJob Ready PA. Although not typically designed for rural areas per se, these programs generallyhave targeted areas in distressed regions.
Given the importance of the unemployment and underemployment problems to the state, thisresearch first compared unemployment rates across Pennsylvania’s rural and urban counties,examining county-level trends and variability in rates. Second, it identified rural counties that have
1 See http://www.newpa.com/programDetail.aspx?id=49.
The Center for Rural Pennsylvania 8 Studies on Unemployment and Underemployment in Rural Pennsylvania
experienced persistently highrates of unemployment and theimpacts of selected social, demo-graphic, political and economicfactors on long-term unemploy-ment rates. Third, it examined theprevalence of underemploymentin Pennsylvania over the lastdecade, and compared Pennsyl-vania’s underemployment rates tothose of neighboring and nearbystates. Fourth, it compared ratesof specific forms of underem-ployment between metro andnonmetro areas2 in Pennsylvania.These forms included “discour-aged workers,” the unemployed,involuntary part-time workers,and low-wage workers. Fifth, itassessed the influence of selectedfactors on the incidence ofunderemployment and its variousforms in the commonwealth,testing if nonmetro residence initself means higher rates. Finally,using 2005 and 2006 Pennsylva-nia county-level data, it measuredselected types of labor marketdistress - specifically, involuntarypart-time employment, and use ofmultiple job-holding to increasehours and income - for Pennsyl-vania’s rural counties to find ifcounties with persistently highrates of unemployment are thesame places that face underem-ployment. Based on the results,the researchers offered policyconsiderations to address the issuesof labor market distress.
Prior ResearchEvidence that new jobs reduce
unemployment rates is surpris-ingly inconclusive, even thoughstate programs have long empha-sized job creation. Advocates ofproactive local economic devel-
opment efforts have argued thatnewly created jobs will employlocal residents, so that govern-ments should make reasonableefforts to encourage local em-ployment growth. Using datafrom 25 large MetropolitanStatistical Areas for the years1972 to 1986, Bartik (1991)found that a permanent 1 percentincrease in a metropolitan area’semployment rate reduced thearea’s long run unemploymentrate by 0.06 percent, leading tothe conclusion that “state andlocal economic developmentpolicies can achieve their goal ofsignificantly helping local work-ers and the local unemployed” (p.207).
Although job growth seems, onits face, a certain way to lowerunemployment, there has been asurprisingly large body of empiri-cal work suggesting the contrary.Skeptics of job growth as apanacea argue that labor mobilityoverwhelms any impact localemployment growth might haveon current residents. Because thebest workers are often mobile, theargument goes, nearly all jobscreated by economic develop-ment programs go to outsiders,rather than those targeted by suchprograms, usually unemployedlocal residents. Since local resi-dents often finance economicdevelopment programs, theseprograms end up being paid forby local residents, while provid-ing little relief to the unemployed.Blanchard and Katz (1992) andSummers (1986) have providedempirical support for this view.Renkow (2003) has shown thatnew rural jobs “leak” to non-resident in-commuters.
To date, there have been rela-tively few studies focusingspecifically on rural unemploy-ment, with some notable excep-tions, such as Partridge andRickman (1996), Shields (2001),Shields and Novak (2002).Partridge and Rickman (1996)examined unemployment ratedeterminants for 159 Georgiacounties for the years 1980 to1993, including several measuresof urbanization. Overall, theyfound that very rural areas do nothave “inherently different unem-ployment rates” than their urbancounterparts, and argued that“state economic developmentpolicy need not focus on enhanc-ing one type of area over theother to reduce the state unem-ployment rate” (p. 35).
Partridge and Rickman’s re-search differed from the work ofBartik (1991), Summers (1986),and Blanchard and Katz (1992) inseveral important ways. First,their model included a number ofadditional explanatory variablesbeyond employment growth toanalyze structural causes ofunemployment rate differencesacross counties. Second, theyfocused on unemployment ratelevels rather than changes. Whiletheir work helped to answer thequestion of whether faster grow-ing counties have lower unem-ployment rates, it did not addressthe key policy question ofwhether faster employmentgrowth reduces the unemploy-ment rate. When examining jobcreation as a policy for reducingunemployment, the latter questionis important.
The unemployment rate is anobvious indicator of laggingeconomic performance in ruralareas. But the labor marketproblems that people face are notlimited to unemployment alone –
2 Because of data limitations with the federal March Current Population Survey (CPS),the researchers had to use the definitions for “metro” and “nonmetro” as opposed to“urban” and “rural” for portions of the research.
Studies on Unemployment and Underemployment in Rural Pennsylvania 9 The Center for Rural Pennsylvania
underemployment can also have“detrimental impacts” on theunderemployed (Wilkins 2007)3.The problem of underemploy-ment, known to be a widespreadproblem in rural America (Findeisand Jensen, 1998), can be ex-pected to be common and persis-tent in rural Pennsylvania. Unfor-tunately, the underemploymentproblem may remain hiddenwhen policymakers focus atten-tion on unemployment alone.Understanding the overall preva-lence and dominant forms ofunderemployment can helppolicymakers see other optionsfor improving the employmentprospects of local residents.
The underemployed includeworkers facing a variety ofemployment-related problems.For example, some part-timeworkers want to work more hoursin their jobs but their employerscan’t provide the additional work.Some involuntary part-timeworkers take a second job, oreven a third job, if they can findthem, to work the equivalent offull-time. Holding multiple jobsoften requires additional transpor-tation costs, juggling of childcare, and the stress of having twoor more employers and two ormore different jobs.
The underemployed can alsoinclude workers earning low orvery low wages, putting themamong the working poor. Someeconomists argue that low-wageworkers who lack skills andtherefore have low productivity intheir jobs are not technicallyunderemployed from an eco-
nomic perspective. From apractical point-of-view, however,these are workers who could dobetter in the job market and earnhigher wages if jobs existed forwhich they could be trained.There also can be workers whoearn a family-sustaining wage butnot as much as their skills wouldcommand in another labor mar-ket. This type of underemploy-ment, often called “job mis-match,” reflects workers withskills underused by their jobs(Clogg and Sullivan, 1983). Thiscan happen when there are notenough family-sustaining jobs togo around.
Finally, the underemployed caninclude “discouraged workers,”such as those wanting to work butwho have given up trying to finda job because local jobs aresimply not available, and workerswho have unstable or erraticemployment, not by their ownchoice, but because of the jobmarket they face (Ritz, 2001).Studies also often have countedthe unemployed among theunderemployed, since unemploy-ment clearly is an important formof labor market distress4.
National and regional studieshave shown that nonmetropolitanand rural areas tend to sufferhigher rates of underemploymentthan metropolitan and urbanareas, taking all forms of under-employment into account (Lichterand Costanzo, 1987; and Jensenand Slack, 2003). Findeis andJensen (1998) and Findeis,Jensen and Wang (2000) showedthat involuntary part-time em-
ployment and low-wage employ-ment affect higher percentages ofthe workforce employed in thenonmetro U.S. Studies also haveshown that once underemployed,residents of U.S. nonmetro areasappear to have more difficultyimproving their employmentprospects – that is, moving up thejob ladder into better jobs(Jensen, Findeis, Hsu andSchachter, 1999).
Focusing on different demo-graphic groups, underemploy-ment has been shown to beespecially common among theyoung and uneducated (Findeis,1993). Since young adults re-maining in rural areas have loweraverage levels of education thanin urban areas, underemploymentamong this population is morelikely (Findeis 1993; and Findeisand Jensen, 1998). The chal-lenge, of course, is to ease thetransition of young adults fromschool to work in rural areas, toavoid the underemployment trapor at least reduce its impacts.
Underemployment rates amongracial/ethnic minorities also havetended to be higher, especiallyamong African-Americans. Slackand Jensen (2002) concluded thatminorities living in U.S. nonmetroareas are more likely to experi-ence underemployment thaneither metro central city or subur-ban minorities, but also addedthat rates among African-Ameri-cans living in nonmetro areashave declined over time. Slackand Jensen (2007) also showedthat the underemployment prob-lem has tended to decline over
3 Recent literature has also examined the issue of overemployment of the workforce, with the problem being defined as having to workmore hours than preferred. Golden and Gebreselassie (2007) found that approximately 7 percent of the U.S. workforce preferred fewerhours of work even if less work resulted in less income.4 Studies of underemployment vary in terms of defining exactly what constitutes “underemployment.” First, some frameworks and studieshave included unemployment (Clogg and Sullivan, 1983: and Lichter and Costanzo, 1987) while others have not. Second, even whenunemployment has not been included, there may be definitional differences: for example, OECD (2002) has divided underemployment intovisible and invisible (http://stats.oecd.org/glossary/detail.asp?ID=3539).
The Center for Rural Pennsylvania 10 Studies on Unemployment and Underemployment in Rural Pennsylvania
successive generations of immi-grant populations, with the firstgeneration experiencing higherrates than either the second orthird generations, which differlittle with respect to each other.This is important given that morerural places across the U.S. haverecently become home to His-panic immigrants (Kandel,2005).5
5 DeJong and Madamba (2001), testing for a potential “double disadvantage” of minority status and immigrant status, found that onlyAsians experienced this effect. They reported that Asian women were more likely to earn low incomes and be unemployed, and Asian menand women were more likely to experience mismatch of jobs to skills.6 In a study of rural, non-adjacent U.S. counties, Shields (2001) found that a county in the highest unemployment quartile one year had an83 percent chance of staying in that quartile the next year.
GOALS AND OBJECTIVESThis study was designed to provide an analysis of unemployment and underemployment in Pennsylva-
nia, paying particular attention to Pennsylvania’s rural counties. A clear understanding of unemploymentand underemployment experienced by rural Pennsylvanians today may lead to better-targeted policies andprograms to help those who participate in the labor force but continue to face often significant economicdifficulties despite their willingness to engage in hard work. The research goals were to:
• Improve policymakers’ and the public’s understanding of unemployment dynamics in rural and urbanPennsylvania.
• Improve policymakers’ understanding of the extent and relevant dimensions of Pennsylvania’s ruralunderemployment problem.
• Enhance policymakers’ understanding of the magnitude of selected forms of underemployment inPennsylvania’s rural counties.
• Determine the potential policy actions most likely to reduce high and persistent unemployment in ruralPennsylvania.
METHODOLOGYTo describe and understand unemployment in rural Pennsylvania, the researchers used county-level
unemployment data from the U.S. Bureau of Labor Statistics (1976-2005). They measured year-to-yearvariation in unemployment rates, calculated for rural and urban counties over the 1976-2005 period, toprovide an assessment of whether higher average annual unemployment rates have been widespreadacross Pennsylvania’s counties or if a few high unemployment rate counties have tended to inflate theaverages that were observed.
To further describe the data, the researchers used persistent unemployment as an indicator to identifythose counties that have been relatively hard hit by high unemployment for an extended period of time.Specifically, this indicator allowed a ranking of Pennsylvania counties over time with respect to highunemployment.
The researchers also were looking to determine if some counties were destined to always have highunemployment rates. To do so, they used another statistical analysis to determine if a county with highunemployment in a particular year would have high unemployment the next year and in subsequent years.If substantial movement or year-to-year mobility in a county’s relative unemployment rank was observed,then policy intervention may not be needed as time could remedy the problem. Conversely, if a countywith relatively high unemployment in one year was likely to have it again the next year, then there couldbe structural problems in the economy and room for policy intervention6.
Finally, studies have showndifferences in the forms of under-employment experienced by menand women (Findeis, 1993). In a2001 study, Van Ham, Mulderand Hoosmeijer concluded thathigh levels of local underemploy-ment have tended to deter womenwho are out of the labor forcefrom searching for work evenwhen they would prefer to beemployed. Similarly, the study
showed that for employed men,high rates of local underemploy-ment tended to discourage themfrom searching for better jobs.Van Ham, et al. (2001) alsoobserved that worker characteris-tics played an even stronger rolethan high levels of local under-employment in discouragingworkers from looking for work orfor better jobs.
Studies on Unemployment and Underemployment in Rural Pennsylvania 11 The Center for Rural Pennsylvania
To determine the underlyingfactors that influence unemploy-ment in rural Pennsylvania, theresearchers developed models tounderstand differences in countyunemployment rates, and annualchanges in relative unemploy-ment rates (county levels relativeto the state rate) for the 1976-2005 period.
Specifically, the researcherswere looking to understand ifemployment growth affectedunemployment rates; if industrydiversity affected unemploymentrates; if population size mattered;what effect education has; and ifspatial isolation mattered.
To determine underemploymentrates in nonmetro Pennsylvania,the researchers measured theprevalence of underemploymentusing data from the March Cur-rent Population Survey (MarchCPS) and the Labor UtilizationFramework or LUF (Lichter andCostanzo, 1987; Findeis, 1993;Findeis and Jensen, 1998; Jensenet al., 1999; Wang, 1999; Slack,2000; and Ritz, 2001). LUFstudies typically consider fourtypes of underemployment,which, taken together, comprise“economic underemployment.”The types included in this studywere:
1. Discouraged workers (alsocalled the sub-unemployed).Adults who are not working,
are not currently looking forwork, but who would like towork if they could find a job.2. Unemployed. Adults who arenot working but are activelysearching for work, and thosewho are currently on lay-off.3. Involuntary part-time work-ers. Adults who are workingless than full-time hours (35hours per week) because theyare unable to find full-timework.4. Low-income workers (the“working poor”). Adults whoselabor market earnings in theprevious year (adjusted forhours and weeks worked) areless than 125 percent of theindividual poverty threshold7. March CPS data for 1996-2006
were used to measure overallunderemployment rates forPennsylvania, nonmetro Pennsyl-vania, and selected neighboringand nearby states. The MarchCPS provided detailed data on theemployment status of a largesample of U.S. households,families, and individuals. State-level analyses were possible byusing multiple years of state dataon individuals, with the limitationthat only those individuals fromsurvey rotations 1-4 were in-cluded in the data set8.
Limitations of the March CPSare that nonmetro areas aredifferentiated not as rural areas
per se, and multiple years of datamust be used for state-levelanalyses. That is, while the use of“rural” rather than “nonmetro”would be preferable for thisstudy, the CPS data precluded theuse of strictly “rural.” Also, smallU.S. states do not have enoughobservations to derive reasonablestatistics and must be aggregatedinto state clusters for analysis.
The researchers also used theMarch CPS data to create modelsthat would answer the followingresearch questions:
• Are nonmetro residents ofPennsylvania more likely to beunderemployed than residentsin Pennsylvania’s metro centralcity and/or suburban (metronon-central city) areas9?• Does Pennsylvania have ratesof economic underemploymentcomparable to neighboring andnearby states, such as New York,Ohio, West Virginia, Virginia,New Jersey and the New En-gland cluster10?• Is the underemployment pro-blem becoming worse over time?• What social, demographic,political and economic factorsinfluence underemploymentand specific types of underem-ployment, such as discouragedworkers and the unemployed,involuntary part-time workers,and workers earning poverty ornear-poverty wages?
7 “Economic underemployment” does not include skills mismatch. The term “mismatch” is used in the underemployment literature to refer to theunderemployment of labor resources that occurs when workers take jobs that require lower skill levels than their formal training provides.8 The reason for this limitation is that individuals surveyed for the CPS are surveyed for four consecutive months (rotations 1-4), thendropped from the sample for the next 8 months, and then resurveyed again for the next four months (rotations 5-8). For example, anindividual first interviewed in March, 2007, is surveyed again in April, May and June of 2007. Then the individual is dropped from the dataset for July 2007 through February 2008, but resurveyed in March, April, May and June of 2008. The limitation to the use of rotations 1-4is to avoid double-counting of individuals between years. Thus, data from rotations 5-8 are dropped.9 The term ‘suburban’ is used in the report to indicate places defined in the U.S. Current Population Survey (CPS) as metro non-central city. TheCPS differentiates metro areas of the U.S. into two categories: central city and non-central city places. Non-metro areas represent a third categorybut are not differentiated further.10 States, such as Delaware and Maryland, were considered for the analysis but their populations are primarily metropolitan, being strongly affectedby the Washington. DC-Baltimore-New York corridor. So, states with nonmetro populations were selected for comparison to Pennsylvania. Theonly metro state included was New Jersey.
The Center for Rural Pennsylvania 12 Studies on Unemployment and Underemployment in Rural Pennsylvania
Selected Forms of Under-employment from the 2005and 2006 RuralPA-CPS
To understand the underemploy-ment problem in Pennsylvania’srural counties, the researchersused the RuralPA-CPS 2005 and2006 data sets, since the MarchCPS data cannot differentiate“rural.” The RuralPA-CPS datawere especially suitable foranalyzing types of labor marketdistress relating to part-timeemployment and particularlyinvoluntary part-time employmentand multiple job-holding. There-fore, the researchers developed amodified LUF, differentiatingindividuals into five categories:1) unemployed, 2) involuntarypart-time employed, 3) multiplejob-holder, 4) voluntary part-timeemployed, and 5) full-timeemployed.
The individual worker’s under-employment in the form ofearning a low or very low incomecannot be measured for theindividual worker with theRuralPA-CPS. This is becauseincome in this data source wascollected at the household levelwhereas the March CPS collectsincome data at multiple levels,including the individual level.However, the RuralPA-CPShousehold-level income datawere used to assess povertystatus, to determine if individualswho are underemployed live inpoverty or near poverty house-holds. “Discouraged workers”were also not measurable usingthe RuralPA-CPS.
The researchers analyzed threeissues: the socio-economiccharacteristics of Pennsylvania’srural workers who were em-ployed part-time (voluntarilyversus involuntarily), those whoheld multiple part-time jobs, and
those employed full time; whetherliving in a “rural” county made adifference; and to what extentindividual underemployment (ofthe forms analyzed here) waslinked to poverty at the house-hold level.
The researchers also measuredthe rates of particular types ofunderemployment and estimatedthe numbers of rural residentsaffected by each of the selectedunderemployment problems.
Finally, they measured under-
employment statistics for differ-ent rural counties and countyclusters in Pennsylvania. Theydeveloped GIS-based maps,which provided a visual compari-son of county-level rates ofselected types of underemploy-ment. Underemployment ratesalso were calculated and com-pared for those counties identi-fied in the report as among thetop 10 persistent unemploymentcounties in the state.
RESULTSUnemployment in Rural Pennsylvania
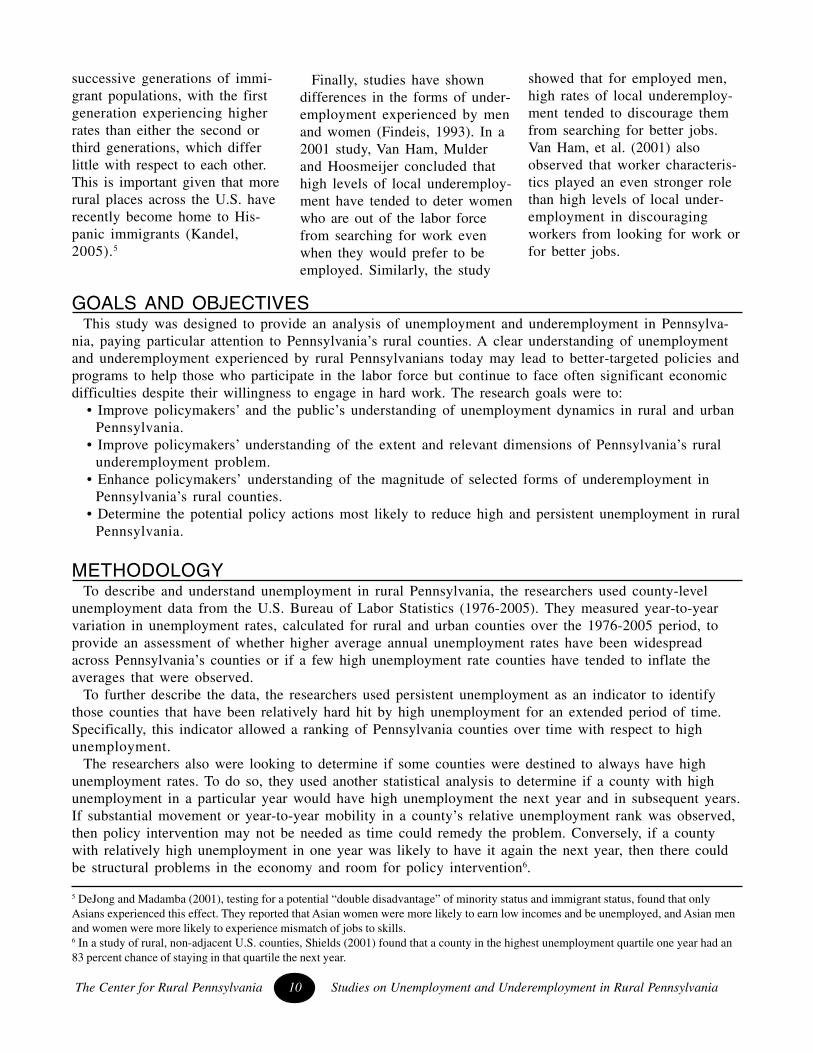
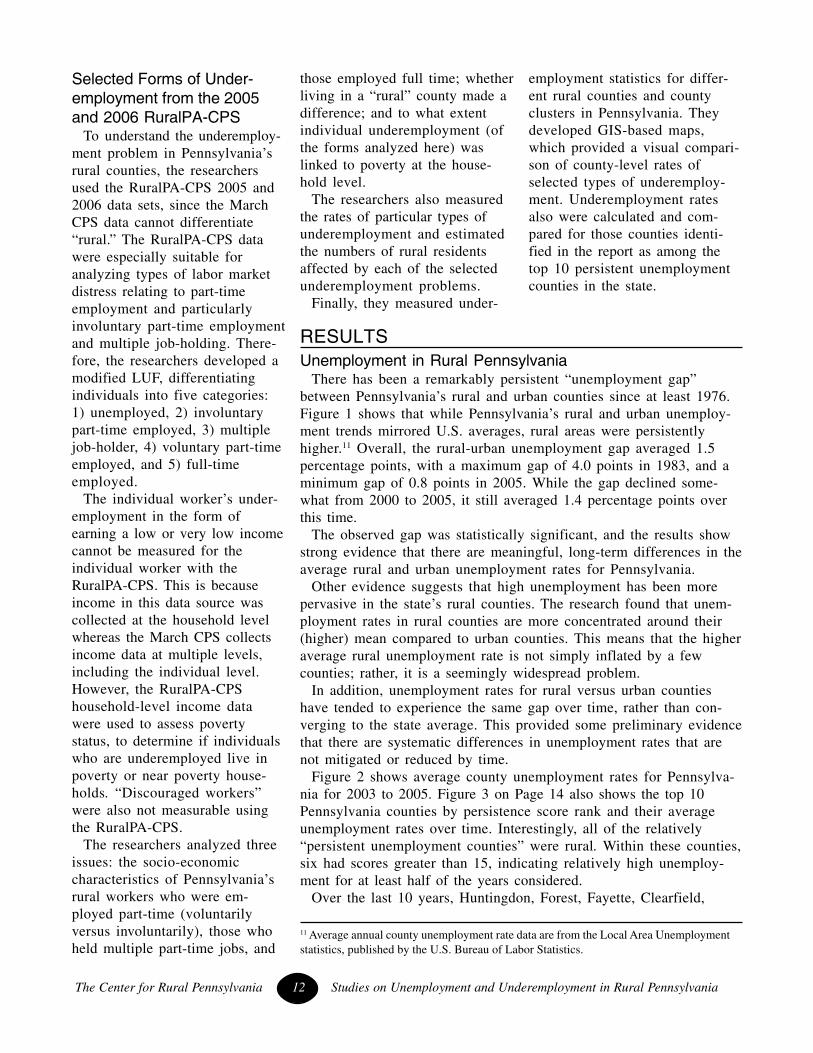
There has been a remarkably persistent “unemployment gap”between Pennsylvania’s rural and urban counties since at least 1976.Figure 1 shows that while Pennsylvania’s rural and urban unemploy-ment trends mirrored U.S. averages, rural areas were persistentlyhigher.11 Overall, the rural-urban unemployment gap averaged 1.5percentage points, with a maximum gap of 4.0 points in 1983, and aminimum gap of 0.8 points in 2005. While the gap declined some-what from 2000 to 2005, it still averaged 1.4 percentage points overthis time.
The observed gap was statistically significant, and the results showstrong evidence that there are meaningful, long-term differences in theaverage rural and urban unemployment rates for Pennsylvania.
Other evidence suggests that high unemployment has been morepervasive in the state’s rural counties. The research found that unem-ployment rates in rural counties are more concentrated around their(higher) mean compared to urban counties. This means that the higheraverage rural unemployment rate is not simply inflated by a fewcounties; rather, it is a seemingly widespread problem.
In addition, unemployment rates for rural versus urban countieshave tended to experience the same gap over time, rather than con-verging to the state average. This provided some preliminary evidencethat there are systematic differences in unemployment rates that arenot mitigated or reduced by time.
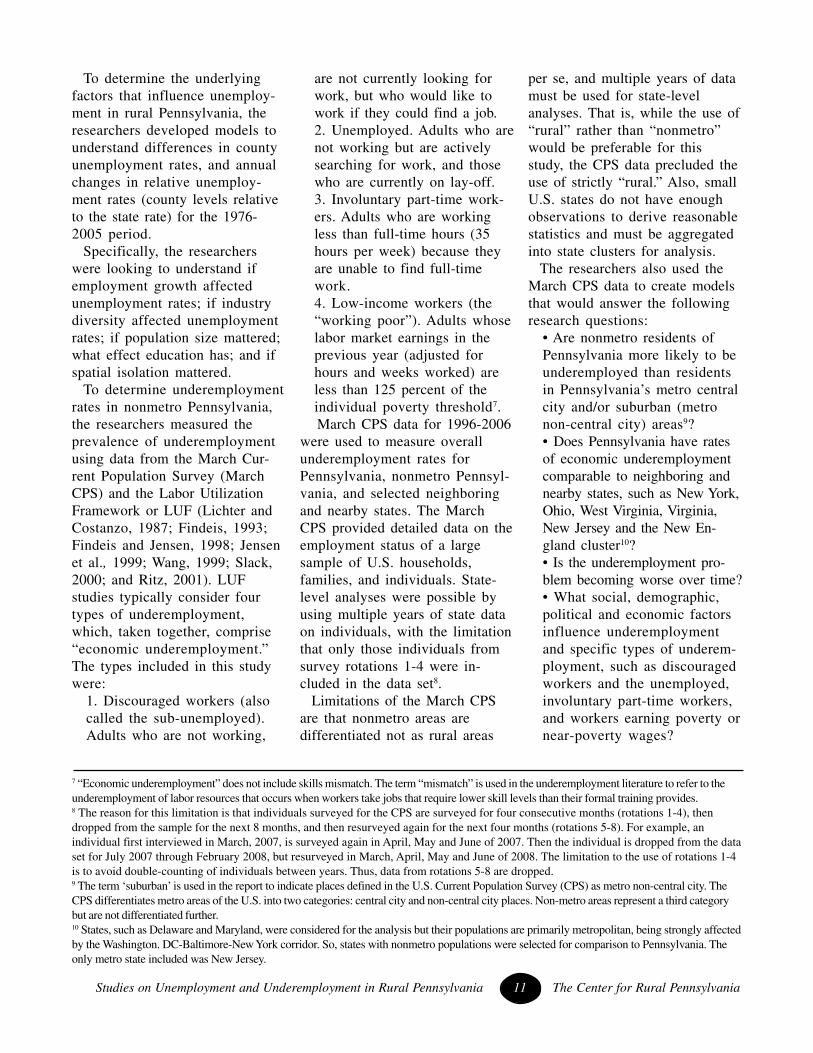
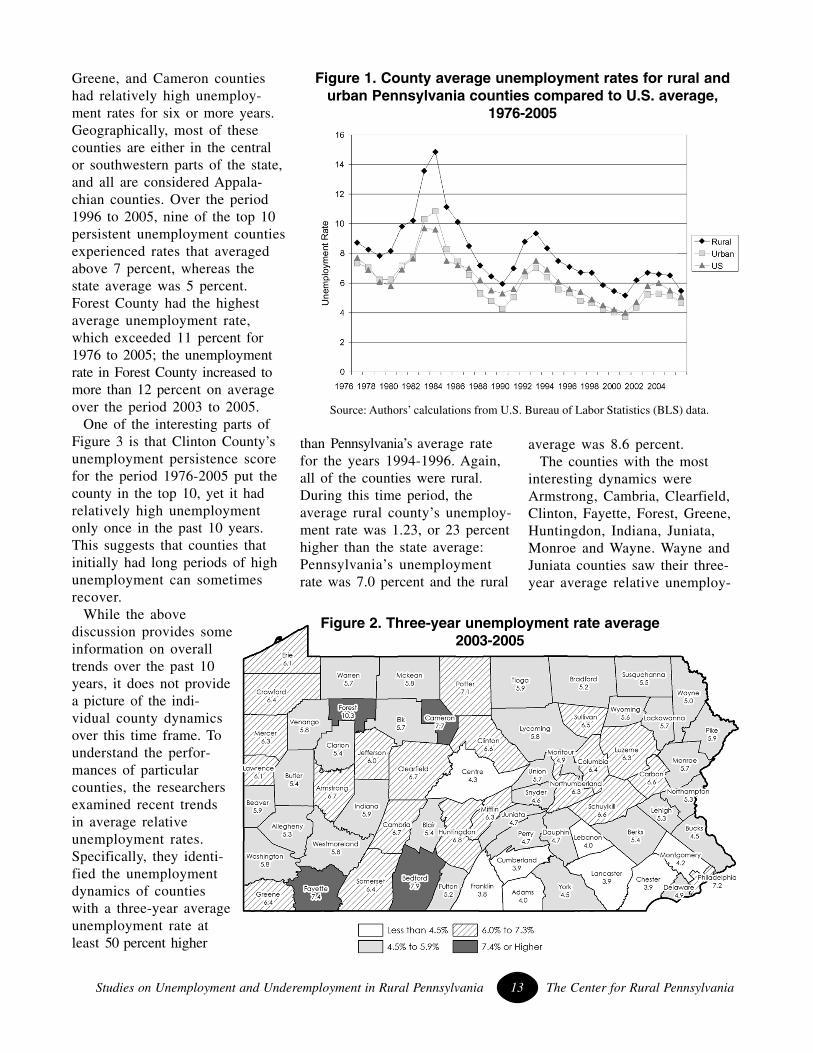
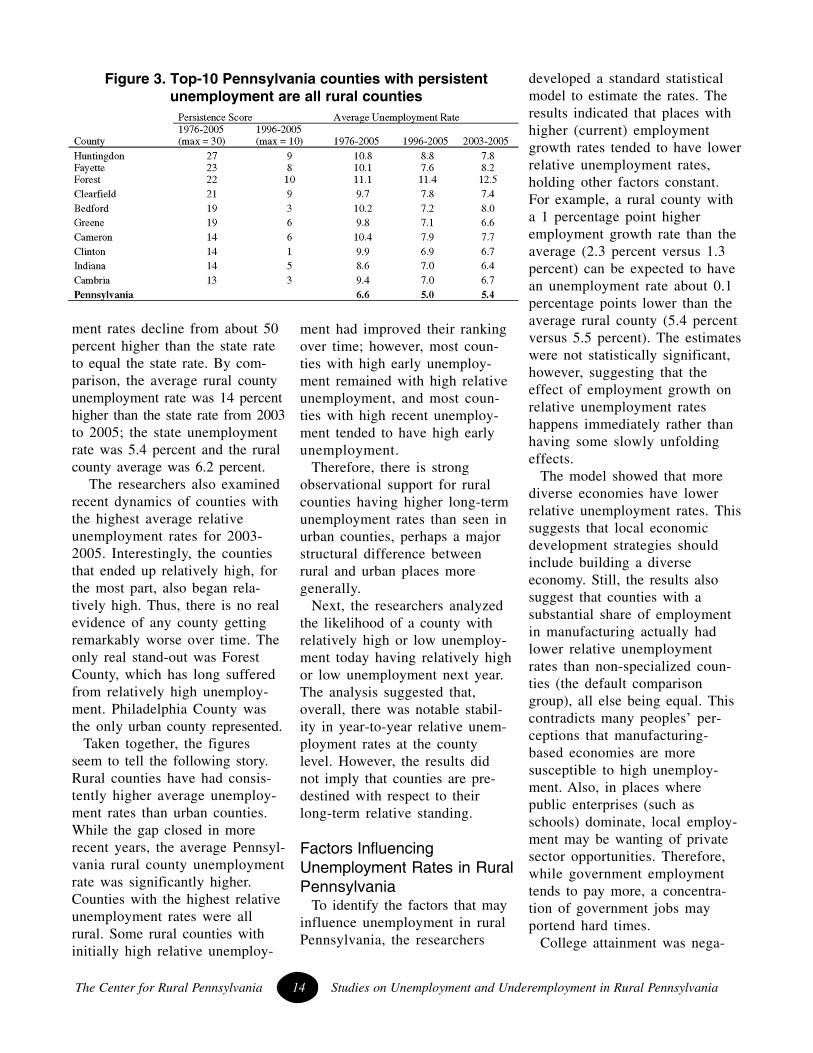
Figure 2 shows average county unemployment rates for Pennsylva-nia for 2003 to 2005. Figure 3 on Page 14 also shows the top 10Pennsylvania counties by persistence score rank and their averageunemployment rates over time. Interestingly, all of the relatively“persistent unemployment counties” were rural. Within these counties,six had scores greater than 15, indicating relatively high unemploy-ment for at least half of the years considered.
Over the last 10 years, Huntingdon, Forest, Fayette, Clearfield,
11 Average annual county unemployment rate data are from the Local Area Unemploymentstatistics, published by the U.S. Bureau of Labor Statistics.
Studies on Unemployment and Underemployment in Rural Pennsylvania 13 The Center for Rural Pennsylvania
Greene, and Cameron countieshad relatively high unemploy-ment rates for six or more years.Geographically, most of thesecounties are either in the centralor southwestern parts of the state,and all are considered Appala-chian counties. Over the period1996 to 2005, nine of the top 10persistent unemployment countiesexperienced rates that averagedabove 7 percent, whereas thestate average was 5 percent.Forest County had the highestaverage unemployment rate,which exceeded 11 percent for1976 to 2005; the unemploymentrate in Forest County increased tomore than 12 percent on averageover the period 2003 to 2005.
One of the interesting parts ofFigure 3 is that Clinton County’sunemployment persistence scorefor the period 1976-2005 put thecounty in the top 10, yet it hadrelatively high unemploymentonly once in the past 10 years.This suggests that counties thatinitially had long periods of highunemployment can sometimesrecover.
While the abovediscussion provides someinformation on overalltrends over the past 10years, it does not providea picture of the indi-vidual county dynamicsover this time frame. Tounderstand the perfor-mances of particularcounties, the researchersexamined recent trendsin average relativeunemployment rates.Specifically, they identi-fied the unemploymentdynamics of countieswith a three-year averageunemployment rate atleast 50 percent higher
Source: Authors’ calculations from U.S. Bureau of Labor Statistics (BLS) data.
Figure 1. County average unemployment rates for rural andurban Pennsylvania counties compared to U.S. average,
1976-2005
Figure 2. Three-year unemployment rate average2003-2005
than Pennsylvania’s average ratefor the years 1994-1996. Again,all of the counties were rural.During this time period, theaverage rural county’s unemploy-ment rate was 1.23, or 23 percenthigher than the state average:Pennsylvania’s unemploymentrate was 7.0 percent and the rural
average was 8.6 percent.The counties with the most
interesting dynamics wereArmstrong, Cambria, Clearfield,Clinton, Fayette, Forest, Greene,Huntingdon, Indiana, Juniata,Monroe and Wayne. Wayne andJuniata counties saw their three-year average relative unemploy-
The Center for Rural Pennsylvania 14 Studies on Unemployment and Underemployment in Rural Pennsylvania
ment rates decline from about 50percent higher than the state rateto equal the state rate. By com-parison, the average rural countyunemployment rate was 14 percenthigher than the state rate from 2003to 2005; the state unemploymentrate was 5.4 percent and the ruralcounty average was 6.2 percent.
The researchers also examinedrecent dynamics of counties withthe highest average relativeunemployment rates for 2003-2005. Interestingly, the countiesthat ended up relatively high, forthe most part, also began rela-tively high. Thus, there is no realevidence of any county gettingremarkably worse over time. Theonly real stand-out was ForestCounty, which has long sufferedfrom relatively high unemploy-ment. Philadelphia County wasthe only urban county represented.
Taken together, the figuresseem to tell the following story.Rural counties have had consis-tently higher average unemploy-ment rates than urban counties.While the gap closed in morerecent years, the average Pennsyl-vania rural county unemploymentrate was significantly higher.Counties with the highest relativeunemployment rates were allrural. Some rural counties withinitially high relative unemploy-
ment had improved their rankingover time; however, most coun-ties with high early unemploy-ment remained with high relativeunemployment, and most coun-ties with high recent unemploy-ment tended to have high earlyunemployment.
Therefore, there is strongobservational support for ruralcounties having higher long-termunemployment rates than seen inurban counties, perhaps a majorstructural difference betweenrural and urban places moregenerally.
Next, the researchers analyzedthe likelihood of a county withrelatively high or low unemploy-ment today having relatively highor low unemployment next year.The analysis suggested that,overall, there was notable stabil-ity in year-to-year relative unem-ployment rates at the countylevel. However, the results didnot imply that counties are pre-destined with respect to theirlong-term relative standing.
Factors InfluencingUnemployment Rates in RuralPennsylvania
To identify the factors that mayinfluence unemployment in ruralPennsylvania, the researchers
Figure 3. Top-10 Pennsylvania counties with persistentunemployment are all rural counties
developed a standard statisticalmodel to estimate the rates. Theresults indicated that places withhigher (current) employmentgrowth rates tended to have lowerrelative unemployment rates,holding other factors constant.For example, a rural county witha 1 percentage point higheremployment growth rate than theaverage (2.3 percent versus 1.3percent) can be expected to havean unemployment rate about 0.1percentage points lower than theaverage rural county (5.4 percentversus 5.5 percent). The estimateswere not statistically significant,however, suggesting that theeffect of employment growth onrelative unemployment rateshappens immediately rather thanhaving some slowly unfoldingeffects.
The model showed that morediverse economies have lowerrelative unemployment rates. Thissuggests that local economicdevelopment strategies shouldinclude building a diverseeconomy. Still, the results alsosuggest that counties with asubstantial share of employmentin manufacturing actually hadlower relative unemploymentrates than non-specialized coun-ties (the default comparisongroup), all else being equal. Thiscontradicts many peoples’ per-ceptions that manufacturing-based economies are moresusceptible to high unemploy-ment. Also, in places wherepublic enterprises (such asschools) dominate, local employ-ment may be wanting of privatesector opportunities. Therefore,while government employmenttends to pay more, a concentra-tion of government jobs mayportend hard times.
College attainment was nega-
Studies on Unemployment and Underemployment in Rural Pennsylvania 15 The Center for Rural Pennsylvania
tively related to relative unem-ployment rates. This finding wasconsistent with nearly all previ-ous studies suggesting the impor-tance of education in reducingunemployment. Further, twocentral factors of importance herewere “rural” and “rural non-adjacent.” Results show that, allelse being equal, relative ruralunemployment rates were higherthan urban rates, and non-adja-cent rural counties had evenhigher unemployment rates. Forexample, imagine two counties,one rural and one urban, withidentical employment growthrates, percent of college educatedworkers, industrial diversity, etc.The results reported here suggestthat rural counties will have ahigher unemployment rate, andthat it will be higher yet in ruralcounties not adjacent to urbanareas. From a policy perspective,this suggests that rural placesmay have higher unemploymentrates simply because they arerural. Thus, when thinking aboutmeasurable outcomes for ruraldevelopment policies, the targetmay not necessarily be an unem-ployment rate equal to the staterate; rather, an achievable targetmay be 1 percentage point higherthan the state rate.
Lastly, the researchers exam-ined factors influencing currentrelative unemployment rates(levels), specifically, whichfactors are most likely to reducelocal unemployment rates. Tradi-tionally, the most common policysolution has been to “increaseemployment.” However, asBlanchard and Katz (1992) haveargued, it cannot be said withcertainty how effective jobgrowth is in reducing unemploy-ment.
Therefore, the researchers took
a closer look at the assumptionunderlying many state develop-ment policies, namely that jobgrowth reduces local unemploy-ment. The goal was to examinethe long-term effects of a one-time increase in employmentgrowth (employment shock) tosee how successful such a strat-egy would be for reducing long-run rural unemployment rates inPennsylvania. In a nutshell, theresearch findings showed that anemployment shock could reduceunemployment rates for bothurban and rural counties, but onlyslightly. The researchers con-cluded that job generation poli-cies might have an impact onrural unemployment rates, but theeffect can be expected to berelatively small, and its long-termeffects are likely to be negligible.
Underemployment in RuralPennsylvania
Descriptive results, based onthe Labor Utilization Framework(LUF), showed that more thanone in five working-age residentsof Pennsylvania experiencedunderemployment in any yearover the past decade. This meansmore than 20 percent of thePennsylvania labor force, specifi-cally those who are 18 to 64years old, has experienced labormarket distress meaning they areunemployed, have given uplooking for work, are not able tofind enough hours of work, or arepaid poverty or near povertywages. The LUF measures ofunderemployment, while notinclusive of all forms of labormarket distress, show that manylabor markets in Pennsylvaniahave deficiencies and fall shortfor some of the state’s residents.
Comparing Pennsylvania’ssituation to the U.S., the research-
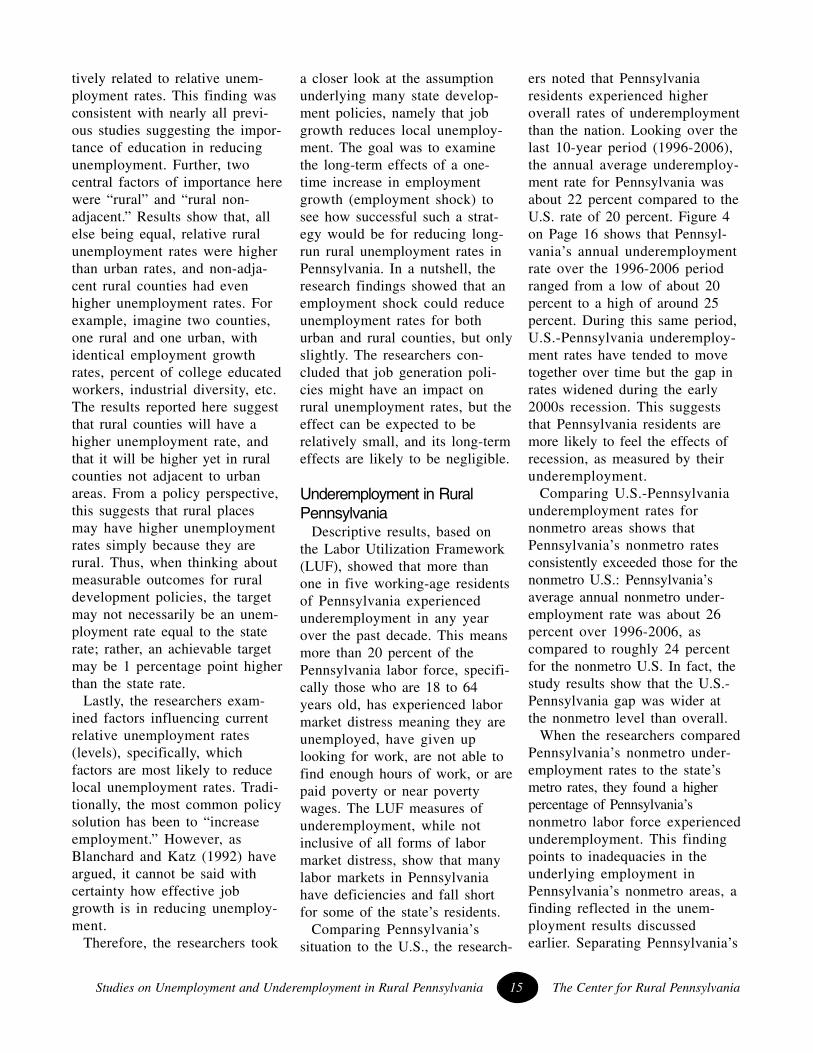
ers noted that Pennsylvaniaresidents experienced higheroverall rates of underemploymentthan the nation. Looking over thelast 10-year period (1996-2006),the annual average underemploy-ment rate for Pennsylvania wasabout 22 percent compared to theU.S. rate of 20 percent. Figure 4on Page 16 shows that Pennsyl-vania’s annual underemploymentrate over the 1996-2006 periodranged from a low of about 20percent to a high of around 25percent. During this same period,U.S.-Pennsylvania underemploy-ment rates have tended to movetogether over time but the gap inrates widened during the early2000s recession. This suggeststhat Pennsylvania residents aremore likely to feel the effects ofrecession, as measured by theirunderemployment.
Comparing U.S.-Pennsylvaniaunderemployment rates fornonmetro areas shows thatPennsylvania’s nonmetro ratesconsistently exceeded those for thenonmetro U.S.: Pennsylvania’saverage annual nonmetro under-employment rate was about 26percent over 1996-2006, ascompared to roughly 24 percentfor the nonmetro U.S. In fact, thestudy results show that the U.S.-Pennsylvania gap was wider atthe nonmetro level than overall.
When the researchers comparedPennsylvania’s nonmetro under-employment rates to the state’smetro rates, they found a higherpercentage of Pennsylvania’snonmetro labor force experiencedunderemployment. This findingpoints to inadequacies in theunderlying employment inPennsylvania’s nonmetro areas, afinding reflected in the unem-ployment results discussedearlier. Separating Pennsylvania’s
The Center for Rural Pennsylvania 16 Studies on Unemployment and Underemployment in Rural Pennsylvania
metro residents into suburban(metro non-central city) andmetro central city residents showsthat an annual average of about20 percent of Pennsylvania’ssuburban residents and 25 per-cent of central city residents wereunderemployed between 1996-2006. The comparison shows thatunderemployment rates forPennsylvania’s nonmetro andmetro central city residents arevery similar, although the typesof underemployment may differ,calling for different policies.
Comparing Pennsylvania toNeighboring States
So how does Pennsylvania fare,based on its underemploymentrates, relative to nearby states inthe region? Is the state doingbetter, worse or about the same asother states? To answer thesequestions, the researchers com-pared Pennsylvania’s rates tonearby states that also havenonmetro populations. They wereNew York, Ohio, West Virginia,Virginia, New Jersey and the NewEngland cluster of Massachusetts,Connecticut, Vermont, New
Hampshire, Maine and RhodeIsland. New Jersey was added asa metropolitan example.
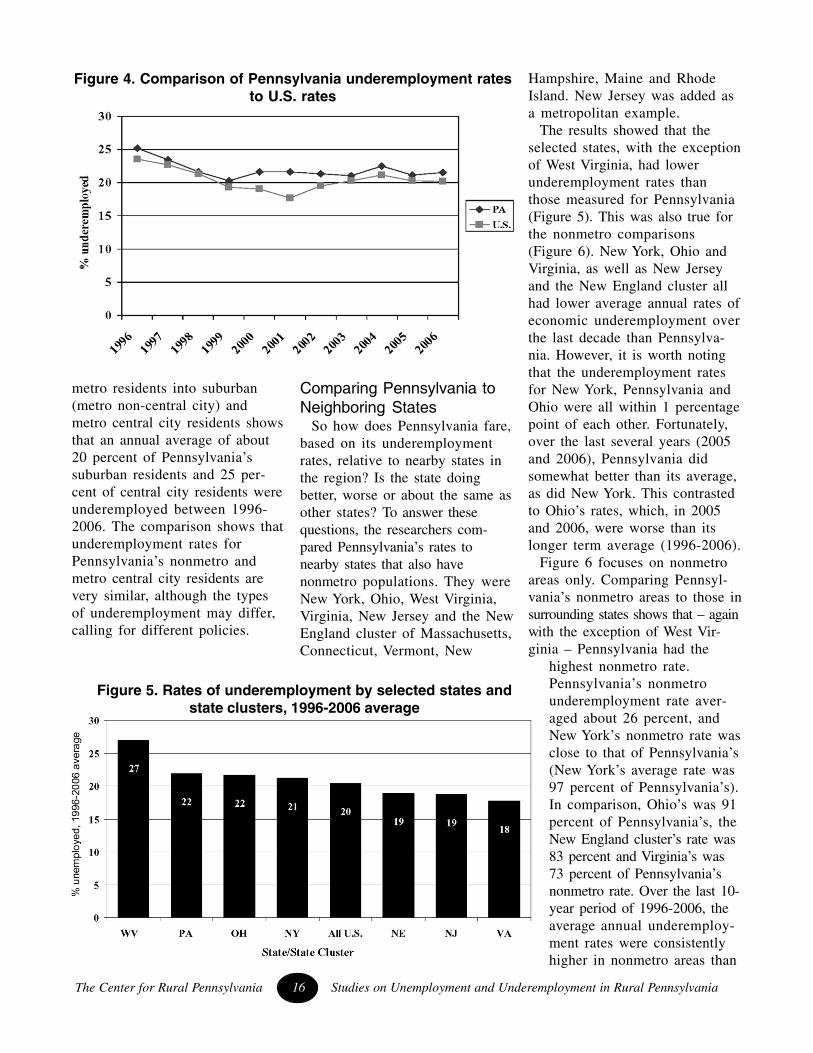
The results showed that theselected states, with the exceptionof West Virginia, had lowerunderemployment rates thanthose measured for Pennsylvania(Figure 5). This was also true forthe nonmetro comparisons(Figure 6). New York, Ohio andVirginia, as well as New Jerseyand the New England cluster allhad lower average annual rates ofeconomic underemployment overthe last decade than Pennsylva-nia. However, it is worth notingthat the underemployment ratesfor New York, Pennsylvania andOhio were all within 1 percentagepoint of each other. Fortunately,over the last several years (2005and 2006), Pennsylvania didsomewhat better than its average,as did New York. This contrastedto Ohio’s rates, which, in 2005and 2006, were worse than itslonger term average (1996-2006).
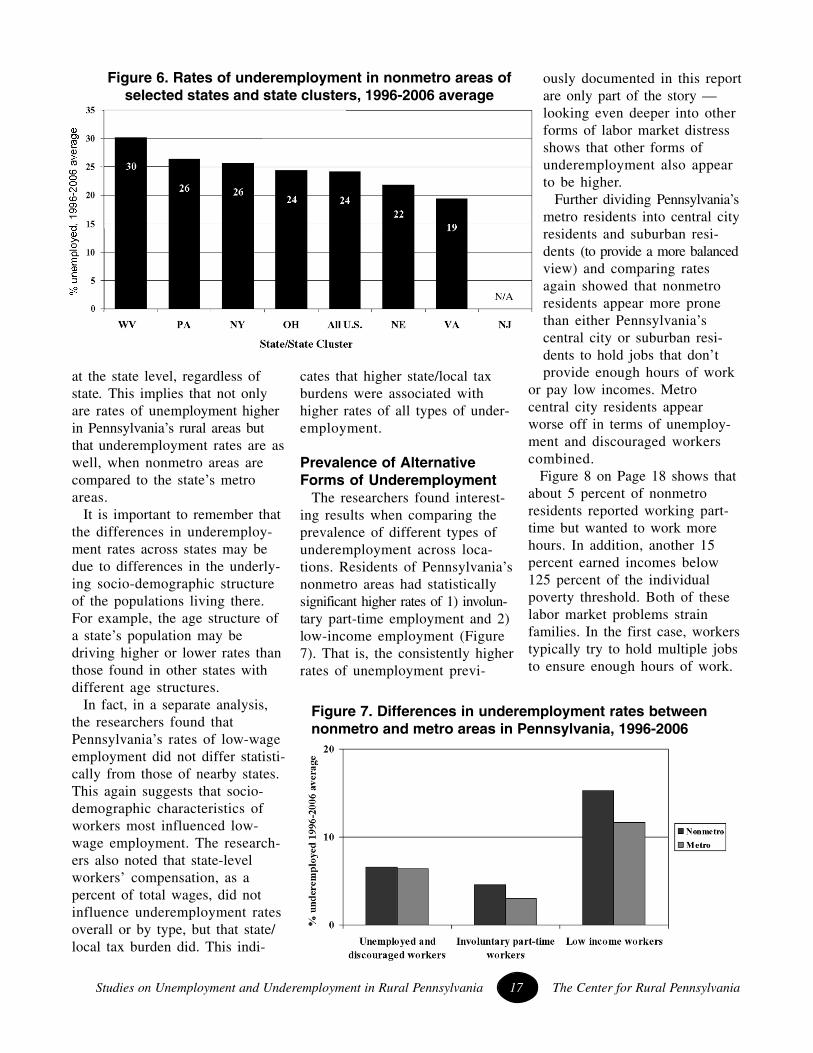
Figure 6 focuses on nonmetroareas only. Comparing Pennsyl-vania’s nonmetro areas to those insurrounding states shows that – againwith the exception of West Vir-ginia – Pennsylvania had the
highest nonmetro rate.Pennsylvania’s nonmetrounderemployment rate aver-aged about 26 percent, andNew York’s nonmetro rate wasclose to that of Pennsylvania’s(New York’s average rate was97 percent of Pennsylvania’s).In comparison, Ohio’s was 91percent of Pennsylvania’s, theNew England cluster’s rate was83 percent and Virginia’s was73 percent of Pennsylvania’snonmetro rate. Over the last 10-year period of 1996-2006, theaverage annual underemploy-ment rates were consistentlyhigher in nonmetro areas than
Figure 4. Comparison of Pennsylvania underemployment ratesto U.S. rates
Figure 5. Rates of underemployment by selected states andstate clusters, 1996-2006 average
Studies on Unemployment and Underemployment in Rural Pennsylvania 17 The Center for Rural Pennsylvania
at the state level, regardless ofstate. This implies that not onlyare rates of unemployment higherin Pennsylvania’s rural areas butthat underemployment rates are aswell, when nonmetro areas arecompared to the state’s metroareas.
It is important to remember thatthe differences in underemploy-ment rates across states may bedue to differences in the underly-ing socio-demographic structureof the populations living there.For example, the age structure ofa state’s population may bedriving higher or lower rates thanthose found in other states withdifferent age structures.
In fact, in a separate analysis,the researchers found thatPennsylvania’s rates of low-wageemployment did not differ statisti-cally from those of nearby states.This again suggests that socio-demographic characteristics ofworkers most influenced low-wage employment. The research-ers also noted that state-levelworkers’ compensation, as apercent of total wages, did notinfluence underemployment ratesoverall or by type, but that state/local tax burden did. This indi-
cates that higher state/local taxburdens were associated withhigher rates of all types of under-employment.
Prevalence of AlternativeForms of Underemployment
The researchers found interest-ing results when comparing theprevalence of different types ofunderemployment across loca-tions. Residents of Pennsylvania’snonmetro areas had statisticallysignificant higher rates of 1) involun-tary part-time employment and 2)low-income employment (Figure7). That is, the consistently higherrates of unemployment previ-
ously documented in this reportare only part of the story —looking even deeper into otherforms of labor market distressshows that other forms ofunderemployment also appearto be higher.
Further dividing Pennsylvania’smetro residents into central cityresidents and suburban resi-dents (to provide a more balancedview) and comparing ratesagain showed that nonmetroresidents appear more pronethan either Pennsylvania’scentral city or suburban resi-dents to hold jobs that don’tprovide enough hours of work
or pay low incomes. Metrocentral city residents appearworse off in terms of unemploy-ment and discouraged workerscombined.
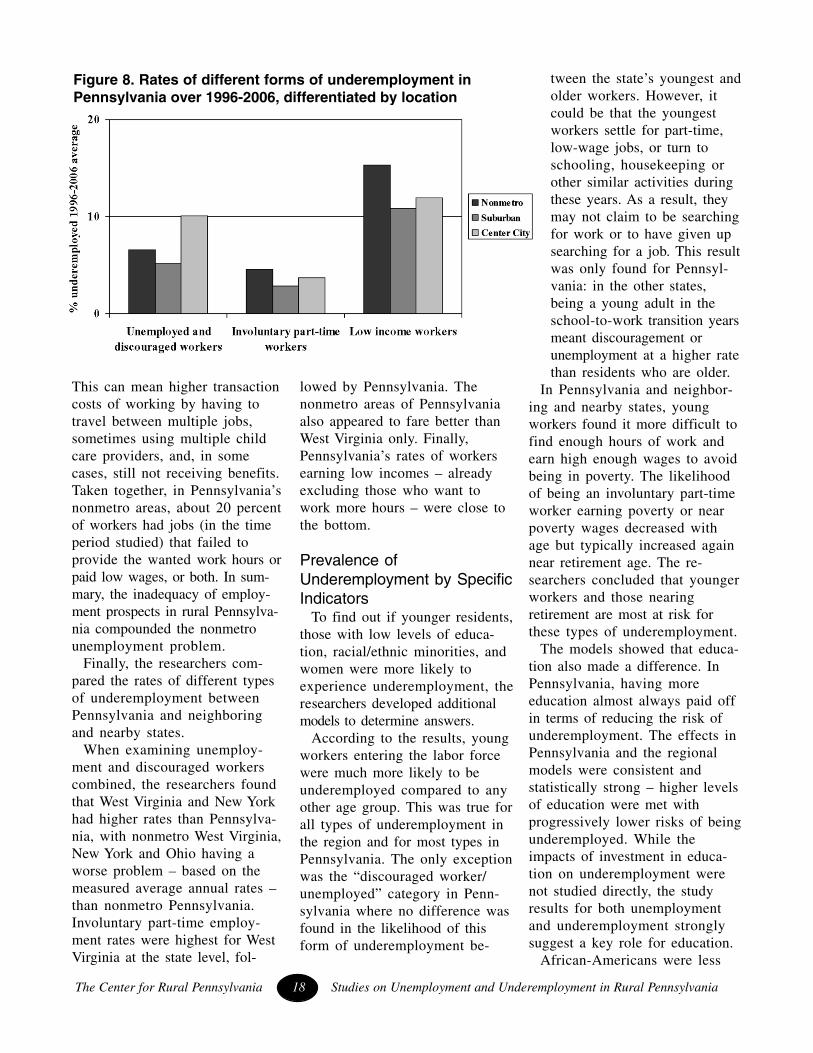
Figure 8 on Page 18 shows thatabout 5 percent of nonmetroresidents reported working part-time but wanted to work morehours. In addition, another 15percent earned incomes below125 percent of the individualpoverty threshold. Both of theselabor market problems strainfamilies. In the first case, workerstypically try to hold multiple jobsto ensure enough hours of work.
Figure 6. Rates of underemployment in nonmetro areas ofselected states and state clusters, 1996-2006 average
Figure 7. Differences in underemployment rates betweennonmetro and metro areas in Pennsylvania, 1996-2006
The Center for Rural Pennsylvania 18 Studies on Unemployment and Underemployment in Rural Pennsylvania
This can mean higher transactioncosts of working by having totravel between multiple jobs,sometimes using multiple childcare providers, and, in somecases, still not receiving benefits.Taken together, in Pennsylvania’snonmetro areas, about 20 percentof workers had jobs (in the timeperiod studied) that failed toprovide the wanted work hours orpaid low wages, or both. In sum-mary, the inadequacy of employ-ment prospects in rural Pennsylva-nia compounded the nonmetrounemployment problem.
Finally, the researchers com-pared the rates of different typesof underemployment betweenPennsylvania and neighboringand nearby states.
When examining unemploy-ment and discouraged workerscombined, the researchers foundthat West Virginia and New Yorkhad higher rates than Pennsylva-nia, with nonmetro West Virginia,New York and Ohio having aworse problem – based on themeasured average annual rates –than nonmetro Pennsylvania.Involuntary part-time employ-ment rates were highest for WestVirginia at the state level, fol-
lowed by Pennsylvania. Thenonmetro areas of Pennsylvaniaalso appeared to fare better thanWest Virginia only. Finally,Pennsylvania’s rates of workersearning low incomes – alreadyexcluding those who want towork more hours – were close tothe bottom.
Prevalence ofUnderemployment by SpecificIndicators
To find out if younger residents,those with low levels of educa-tion, racial/ethnic minorities, andwomen were more likely toexperience underemployment, theresearchers developed additionalmodels to determine answers.
According to the results, youngworkers entering the labor forcewere much more likely to beunderemployed compared to anyother age group. This was true forall types of underemployment inthe region and for most types inPennsylvania. The only exceptionwas the “discouraged worker/unemployed” category in Penn-sylvania where no difference wasfound in the likelihood of thisform of underemployment be-
tween the state’s youngest andolder workers. However, itcould be that the youngestworkers settle for part-time,low-wage jobs, or turn toschooling, housekeeping orother similar activities duringthese years. As a result, theymay not claim to be searchingfor work or to have given upsearching for a job. This resultwas only found for Pennsyl-vania: in the other states,being a young adult in theschool-to-work transition yearsmeant discouragement orunemployment at a higher ratethan residents who are older.
In Pennsylvania and neighbor-ing and nearby states, youngworkers found it more difficult tofind enough hours of work andearn high enough wages to avoidbeing in poverty. The likelihoodof being an involuntary part-timeworker earning poverty or nearpoverty wages decreased withage but typically increased againnear retirement age. The re-searchers concluded that youngerworkers and those nearingretirement are most at risk forthese types of underemployment.
The models showed that educa-tion also made a difference. InPennsylvania, having moreeducation almost always paid offin terms of reducing the risk ofunderemployment. The effects inPennsylvania and the regionalmodels were consistent andstatistically strong – higher levelsof education were met withprogressively lower risks of beingunderemployed. While theimpacts of investment in educa-tion on underemployment werenot studied directly, the studyresults for both unemploymentand underemployment stronglysuggest a key role for education.
African-Americans were less
Figure 8. Rates of different forms of underemployment inPennsylvania over 1996-2006, differentiated by location

Studies on Unemployment and Underemployment in Rural Pennsylvania 19 The Center for Rural Pennsylvania
likely to be “adequately em-ployed.” Hispanic workers alsoappeared to be at higher risk ofinvoluntary part-time employmentas compared to the white, non-Hispanic population. The “other”race/ethnicity category – prima-rily the Asian population – wasless likely than the white, non-Hispanic population to be unem-ployed or discouraged, but morelikely to earn low incomes (pov-erty or near poverty wages).
Women were generally morelikely to be underemployed thanmen, and were particularly likelyto earn poverty or near povertywages. Women of other races/ethnicities were more likely toearn low wages.
Finally, being married generallyhelped to reduce underemploy-ment risk.
Pennsylvania Metro,Nonmetro Differences
The researchers found thatresidents of nonmetro Pennsylva-nia and those living in metrocentral cities were as likely tolack success in finding enoughhours of work, all else beingequal. However, central cityresidents were less likely thannonmetro residents in Pennsylva-nia to earn poverty or nearpoverty wages. Overall, theresults showed that Pennsylva-nians living in the state’s metrocentral cities were less likely tobe underemployed, and thereforemore likely to be “adequatelyemployed,” than nonmetroPennsylvanians.
Underemployment was dis-tinctly less likely in suburbanPennsylvania than in nonmetroareas. Similar results were foundacross the region. The modelsshowed that living in nonmetroareas, as compared to the central
cities and the suburbs, was lesslikely to result in being ad-equately employed. The bottomline is that economic underem-ployment, taken overall, occurs atgreater rates in nonmetro areas ofPennsylvania than observed ineither suburban places or in thecentral cities. The models showeda consistent nonmetro underem-ployment disadvantage.
Determining IfUnderemployment Is GettingBetter or Worse
For Pennsylvania, the resultsshowed neither a time-trendincrease nor decrease; in fact,other factors appeared to accountfor the variation in rates overtime. In nearby states, however, thelikelihood of residents beingadequately employed was increas-ing, with corresponding decreasesin the risk of underemployment ofall forms.
Selected Forms ofUnderemployment in RuralPennsylvania
Focusing on the rural countiesin Pennsylvania, the researchersused the 2005-2006 RuralPA-CPSdata to understand the magnitudeof underemployment and thetypes of underemployment thatexist. The profile of who isunderemployed in Pennsylvania’srural counties was found to mirrorthe profile of the underemployedfor the state as a whole. By agegroup, the highest rates of under-employment were found amongyoung adults. About one in fiveyoung adults, aged 18 to 24 yearsold, in the rural Pennsylvanialabor force was unemployed inthe past decade. Only about 36percent held full-time jobs,meaning that about 45 percent ofyoung adults living in
Pennsylvania’s rural counties hadpart-time jobs and either wantedmore work, cobbled togetherpart-time jobs through multiplejob-holding, or wanted to workpart-time. In comparison, threeout of four rural residents in the25 to 34 age group in the laborforce were employed full-time,although wages could be low.The risk of involuntary part-timework and unemployment tendedto decline with age in ruralPennsylvania. Education playedan important role. The highestrates of full-time employment(over 80 percent) were foundamong residents with a bachelor’sdegree or more; inclusion ofvoluntary part-time workersraised the percentage to nearly 90percent or more for the besteducated who had jobs thatmatched their needs for hours ofwork.
The RuralPA-CPS data showedonly small percentages of therural population who are Hispanicor African-American, with ratesof full-time employment for thesegroups being comparable to thosefor the white, non-Hispanic ruralpopulation.
Based on the percentagesderived from low numbers ofobservations, African-Americanswere somewhat more likely to beunemployed or to be involuntarypart-time workers than the white,non-Hispanic population. His-panic workers – again with lownumbers of survey respondents –had the highest rate of full-timeemployment, the lowest rate ofunemployment, and the lowestrate of involuntary part-timework, relative to the white, non-Hispanic and African-Americanpopulation in Pennsylvania’s ruralcounties. But again, these resultswere based on low numbers of
The Center for Rural Pennsylvania 20 Studies on Unemployment and Underemployment in Rural Pennsylvania
observations, leading to cautionover their interpretation.
Rural women were more likelyto be voluntary part-time workers,involuntary part-time workers,unemployed, and hold multiplejobs than rural men in the pastdecade. The data show that about82 percent of Pennsylvania’srural men in the labor force wereemployed full-time as comparedto 63 percent of rural women.When voluntary part-time em-ployment was added to thesefigures, the total for rural menwas about 88 percent as com-pared to 80 percent for ruralwomen. Generally, women earnedlower wages and were more likelyto be in jobs that failed to providefull-time work hours.
Finally, while the researchersfound a strong relationshipbetween an individual’s underem-ployment and the householdbeing in poverty, not all of theunderemployed lived in house-holds that qualified as poor ornear poor. Results show that theunderemployed were moreheavily represented in lowerincome households but evensome higher income householdshad family members who wereunderemployed. As expected,full-time employment consistentlyincreased as household incomeincreased, showing that mostunderemployed workers were inlow income households, althoughsome were middle and even highincome. However, the percent-ages of the underemployed livingin households at 200 percent ormore of the household povertythreshold were really quite small.This comparison shows the strongassociation between underem-ployment and household poverty.
Determinants ofUnderemployment
Characteristics of the individualwere found to be importantindicators of being labor market“distressed” in Pennsylvania’srural counties, as measured byunemployment or involuntarypart-time work. Younger adultswere more likely to be distressed.Programs aimed at easing thetransition from school into theworkforce as a young adult areworthwhile, if effective. By aboutthe mid-thirties, the risk of being“distressed” declined consistentlyuntil retirement age. Educationalso was found to have a signifi-cant role in rural Pennsylvania.The study results show that allforms of education beyond highschool reduced the likelihood oflabor distress as measured byunemployment and involuntarypart-time work.
Gender, other race/ethnicity,and marital status were againshown to be important, influenc-ing the risk of unemployment andinvoluntary part-time employ-ment. When the researchersanalyzed the results for multiplejob-holding, they found thatrelatively few worker characteris-tics matter when differentiatingthose who have multiple jobsfrom those with full-time employ-ment. This means that otherfactors – quite outside of indi-vidual characteristics – influ-enced multiple job-holding.
Also, growth in county-levelemployment reduced distress asmeasured by unemployment andinvoluntary part-time employ-ment. This makes sense becausegrowth in employment contrib-utes to reducing unemployment atleast in the short run, and canalso contribute to growth in part-
time employment. Growth inlocal employment, while acommunity-level variable, mayinfluence individual outcomes.Rural counties with more industrydiversity are less likely to haveresidents either out of work orwith only a part-time job andneeding to work more hours.Lack of industry diversity alsoappears to leave workers withoutchoices – it is harder to find a joband more difficult to cope eco-nomically by taking multiple part-time jobs. Holding multiple part-time jobs appears to be a charac-teristic of places that are addingjobs and where the employmentbase is diverse, perhaps allowingfor better matches between (mul-tiple) part-time jobs.
Service dependent countieswere found to be places associ-ated with higher distress asmeasured by unemployment andinvoluntary part-time employ-ment combined, but also wereplaces more likely to have mul-tiple job-holding being under-taken as a strategy to create full-time hours of work. But again,the strategy of cobbling togethermultiple part-time jobs very oftencreates labor distress and highertransaction costs of participatingin work. Cobbling together part-time service industry jobs verylikely occurs in the same timeperiod – that is, workers go fromone job to another in the sameday or week. This is differentthan multiple job-holding thatreflects seasonal jobs woventogether over a year.
Also, the farther a rural Penn-sylvania county was from anurban area, the higher the risk ofunemployment or involuntarypart-time work. In more remoterural counties, multiple job-holding was less common.
Studies on Unemployment and Underemployment in Rural Pennsylvania 21 The Center for Rural Pennsylvania
Proximity of a rural county to anurban county reduced employ-ment distress; a strong influenceof urban proximity runs through-out the results of this study. Thestory seems to be that the fartherfrom an urban area, the higher therates of employment distress, withthe exception of multiple job-holding, which appears to bemore of an urban phenomenon orat least more likely in urban-adjacent rural counties, where theindustrial base is diverse andwhere there is dependence on theservice industry for jobs.
Measuring Selected Forms ofUnderemployment inPennsylvania Counties
The researchers also looked atselected forms of underemploy-ment by county, including invol-untary part-time work, multiplejob-holding, voluntary part-timework, and full-time employment,to find if counties with persistentunemployment rates were thesame counties that had higherrates of specific underemploy-ment. The researchers used the2005-2006 RuralPA-CPS data andderived rates for all rural coun-ties, excluding those that hadfewer than 60 observations.
Basically, they found that notall persistent unemploymentcounties had high rates of thedifferent forms of underemploy-ment – that is, unemployment andthe other forms of underemploy-ment did not necessarily go hand-in-hand. Concentrating primarilyon the rural counties with persis-tently high unemployment doesnot necessarily concentrateefforts on those counties withboth persistently high unemploy-ment and high rates of the otherforms of employment distress.
SUMMARYResults of the study show that Pennsylvania has experienced a
remarkably persistent “unemployment gap” between the state’s ruraland urban counties since at least 1976. Over the past 30 years,Pennsylvania’s rural and urban unemployment trends mirrored U.S.averages, with rural rates being consistently higher. The observedrural-urban unemployment gap is statistically significant, and there areno years in which the rural-urban rates are statistically equal. Thissuggests meaningful, long-term differences in Pennsylvania’s averagerural and urban unemployment rates. The results also show that it isnot simply a few counties that have inflated the (higher) average ratefor rural Pennsylvania. Rather, rural unemployment was found to be awidespread problem in rural counties.
The results also show that all persistent unemployment counties inPennsylvania are also rural. Fortunately, not all persistent unemploy-ment counties were “pre-destined,” with respect to their long-termrelative standing as some have improved over time.
Statistical models were estimated and provided additional under-standing of the effects of social, demographic, political and economicfactors on relative county unemployment rates (relative to the stateaverage) and changes in the rates. Growth in local employmentreduced relative unemployment, as did a more diversified economy.Results also highlighted the importance of a better educatedworkforce. Finally, the research showed that a one-time effort tostimulate local employment growth can reduce unemployment rates inthe short term but that this effect disappears over time. A one-timeeffort is not enough to counter the higher equilibrium unemploymentrates that are characteristic of rural counties – a longer-term strategy isneeded.
The research also analyzed underemployment in Pennsylvania.Results show that more than one in five working-age Pennsylvanianswas underemployed in the last decade. Pennsylvania residents hadhigher underemployment rates than U.S. residents in every year(1996-2006). Pennsylvania’s underemployment rates ranged fromabout 20 to 25 percent over this period, and diverged the most fromU.S. rates during the early 2000s recession. This suggests that Penn-sylvania residents are more likely to feel the effects of recession, asmeasured by their underemployment.
An assessment of how Pennsylvania has been faring relative tonearby states showed that, next to West Virginia, Pennsylvania hadsome of the highest underemployment rates – overall and by type ofunderemployment. Regardless of state, nonmetro rates were found tobe consistently higher than metro rates. Statistical models confirmedthat those at higher risk of underemployment included nonmetroresidents, and also young adults, less educated residents, minorities,and women. Results also show that Pennsylvania’s rates are holdingconstant even though underemployment rates are generally decliningin the region. At the state level, worker’s compensation was not foundto contribute to the underemployment problem, but average state/localtax burden at the state level did.
Focusing on Pennsylvania’s rural counties, results show that a
The Center for Rural Pennsylvania 22 Studies on Unemployment and Underemployment in Rural Pennsylvania
higher degree of industry diver-sity and a better educatedworkforce contributed to lowerrates of unemployment and fewerworkers having to take part-timejobs when they really want full-time work. Residents of Pennsyl-vania’s more remote rural coun-ties were more likely to be under-employed, as were those living inservice-dependent counties.However, industry diversity and
service dependence were foundto increase rates of multiple job-holding.
Finally, the findings show thatmost underemployed rural Penn-sylvania residents live in lower-income households. Further,underemployment is not concen-trated solely in counties in thestate that are dealing with persis-tent unemployment but is a morewidespread problem. That is,
while some of Pennsylvania’shighest unemployment countieshad higher underemploymentrates, not all do. In many re-spects, the use of underemploy-ment rather than unemploymentas an indicator of labor marketdistress provides a deeper under-standing of the labor marketissues faced by Pennsylvania’sresidents.
POLICY CONSIDERATIONSFrom a policy perspective, the researchers suggest the following.• When rural Pennsylvania counties set unemployment rate targets, they should not expect to reach the
state average; rather, their target should be at least 1 percentage point higher than the statewide average.Rural areas consistently were found to have higher unemployment rates that did not appear to match urbanunemployment rates over time. This very likely represents a structural issue that will be difficult to remedyin terms of policy interventions.
• The use of unemployment as an indicator of “labor distress” is in many respects an incomplete indica-tor of the problem. When 20 to 25 percent of the state’s labor force experiences some form of economicunderemployment, the limitation of targeting high unemployment counties misses the larger problem.Some of Pennsylvania’s rural counties experience persistent unemployment coupled with higher rates ofselected forms of underemployment. Underemployment includes unemployment, is measurable and alsoprovides a reliable indicator of “labor distress.”
• A one-time boost in employment growth should not be expected to have significant impacts on lower-ing long-term unemployment rates. This strategy tends to have impacts that are short-lived. Instead, acounty with relatively high unemployment needs to have higher employment growth rates for at leastseveral years for growth to have any real effect. This suggests an economic development strategy thatrelies on diversification: smaller investments in a portfolio of economic development projects may providemore long-term benefits than a single large project. Statewide development programs in Pennsylvania arein many instances already taking this approach. However, local communities across the state also need tochange their approach to emphasize smaller diversified investments. Further, a diversification developmentstrategy was shown to reduce the prevalence of involuntary part-time work. Diversification is likely toresult in more multiple job-holding but this represents a less severe form of underemployment – preferredto not having enough hours of work and not finding a second or third job. Study results support thestatement that investment in a variety of programs rather than reliance on the single large-scale projectworks better to reduce both unemployment and underemployment.
• Results also show the importance of an educated workforce for Pennsylvania for reducing unemploy-ment and underemployment. Pennsylvania’s counties with higher levels of education were less likely toexperience high rates of unemployment. And, higher levels of education reduced the likelihood of under-employment of almost all forms. Taken together, this evidence strongly suggests that strongly supportingeducation and knowledge-based skill development can help Pennsylvania reduce its underemploymentproblem. While the college-educated have the strongest possibility of avoiding unemployment and under-employment, associate vocational and associate academic degrees also make a difference, with associatevocational degree programs appearing to have the greater impact of the two options. The estimated modelsalso showed that those who drop out of college sometimes are at higher risk than most other groups exceptthose who have not finished high school. This points to the need to support programs that ensure that
Studies on Unemployment and Underemployment in Rural Pennsylvania 23 The Center for Rural Pennsylvania
students do not drop out prema-turely.
• Easing the transition of youngadults into the workplace shouldconstitute a major policy goal forPennsylvania. The study resultsconfirm that young adults stillcontinue to face difficulties inentering the labor market in jobsthat provide enough hours ofwork and a family-sustainingincome. Jobs that are part-time orlow-paying can be coupled withschooling beyond high school,but there appear to be significantnumbers of young adults in ruralPennsylvania who are underem-ployed in their jobs. Fortunately,this problem was shown todecline with age. This study alsoshowed that Pennsylvania’sgeneration that is nearing retire-ment was less likely to be under-employed than typically has beenthe case, based on studies ofunderemployment in otherregions of the U.S. Given this, amajor focus of policy on youngadults remaining in Pennsylvania’srural areas makes sense.
• The research findings showedthat a lower state/local tax burdenis associated with a lower likeli-hood of underemployment of alltypes, when states in the regionwere compared. At the same time,worker’s compensation, some-times believed to negativelyinfluence employers and busi-nesses in a state, did not appearto affect underemployment.
These results, coupled with astrong emphasis on diversifica-tion, education, and easingtransitions into the labor force foryoung adults, point to strategiesthat the state can use to reducePennsylvania’s rural underem-ployment and unemploymentrates in the future.
REFERENCESBartik, T. J. 1991. Who Benefits From State and Local Economic Development Policies?
Upjohn Institute, Kalamazoo, MI.
Blanchard, O. J. and L. F. Katz. 1992. “Regional Evolutions.” Brookings Papers onEconomic Activity 1, 1-75.
Clogg, C. and T. Sullivan. 1983. “Labor Force Comparisons and UnderemploymentTrends, 1969-1980.” Social Indicators Research 12(1):117-52.
Findeis, J. 1993. “Utilization of Rural Labor Resources.” In: Economic Adaptation:Alternatives for Nonmetropolitan Areas, D. Barkley (ed.). Boulder, CO: WestviewPress. pp. 49–68.
Findeis, J. and L. Jensen. 1998. “Employment Opportunities in Rural Areas: Implica-tions for Poverty in a Changing Policy Environment.” American Journal of Agricul-tural Economics 80(5):1001-08.
Findeis, J., L. Jensen, and Q. Wang. 2000. “Underemployment Prevalence and Transi-tions in the U.S. South.” Southern Rural Sociology 16:125-147.
Jensen, L., J. Findeis, W. Hsu, and J. Schachter. 1999. “Slipping Into and Out ofUnderemployment: Another Disadvantage for Nonmetropolitan Workers?” RuralSociology 64(3): 417-38.
Jensen, L. and T. Slack. 2003. “Underemployment in America: Measurement andEvidence”. American Journal of Community Psychology 32(1/2):21-31.
Kandel, W. 2005. Rural Hispanics at a Glance. Washington, DC: ERS, USDA.
Lichter, D. and J. Costanzo. 1987. “Nonmetropolitan Underemployment and Labor-Force Composition.” Rural Sociology 57(2): 151-72.
Organization for Economic Development and Co-operation (OECD). Glossary ofStatistical Terms-Underemployment Definition. http://stats.oecd.org/glossary/detail.asp?ID=3539.
Partridge, M. and D. Rickman. 1996. “County Unemployment in Georgia: The Causesand Potential Role for Economic Development Policy.” Review of Regional Studies26(1):17-39.
Renkow, M. 2003. “Employment Growth, Worker Mobility, and Rural EconomicDevelopment.” American Journal of Agricultural Economics 85(2): 503-13.
Ritz, R. 2001. “Welfare, Work, and Underemployment: An Analysis of Low-IncomeSingle Females, 1990-2000.” MS thesis, The Pennsylvania State University.
Slack, T. 2000. “Race, Ethnicity and Rural Residence: A Cohort Analysis of Underem-ployment, 1968-1997.” MS thesis, The Pennsylvania State University.
Slack, T. and L. Jensen. 2002. “Race, Ethnicity, and Underemployment inNonmetropolitan America: A 30-Year Profile.” Rural Sociology 67(2):208-233.
Slack, T. and L. Jensen. 2007. “Underemployment Across Immigrant Generations.”Social Science Research 36:1415-1430.
Shields, M. 2001. “What Explains Long-run Rural Unemployment Differentials?” Paperpresented at the Mid-Continent Regional Science Association Annual Meetings,Duluth MN, 1-2 June.
Shields, M. and J. Novak. 2002. “Another Look at the Relationship between Employ-ment Growth and Unemployment Rates in Rural Counties.” Paper presented at theSouthern Regional Science Association Annual Meetings, Arlington, VA.
Summers L. 1986. “Why is the Unemployment Rate So Very High Near Full Employ-ment.” Brookings Papers on Economic Activity 2:339-396.
Van Ham, M., C. Mulder, and P. Hooiemeijer. 2001. “Local Underemployment and theDiscouraged Worker Effect.” Urban Studies 38(10):1733-1751.
Wang, Q. 1999. “Underemployment Dynamics of Women in the United States.” MSthesis. The Pennsylvania State University.
Wilkins, R. 2007. “The Consequences of Underemployment for the Underemployed.”Journal of Industrial Relations 49(2):247-275.
The Center for Rural Pennsylvania 24 Studies on Unemployment and Underemployment in Rural Pennsylvania
Assessing Rural Underemployment and Unemploymentin Pennsylvania
EXECUTIVE SUMMARYThis 2006 research was conducted to better understand the forces causing unemployment,
underemployment, or withdrawals from the labor market in rural Pennsylvania. It assessed howlabor markets in each rural Pennsylvania county were performing relative to each other, to urbanPennsylvania counties, and to carefully defined peer groups of similar counties nationwide. Bycomparing each rural Pennsylvania county to its national peer group, the researchers could get aclearer sense of the strength, or weakness, of a county’s labor market along with a realistic forecastof what might be achievable.
The research analyzed the impact of both industrial structure and occupation mix on overall jobgrowth in rural Pennsylvania since 2001 and on the fraction of jobs in a county likely to be avail-able for college graduates versus jobs for those with high school diplomas only.
To complete the study, the researchers used county-level demographic data from the U.S. CensusBureau and labor market data from the U.S. Bureau of Labor Statistics.
After assessing employment to working-age population ratios, the researchers found that thelargest impact on a county’s employment-to-population ratio was the percentage of adults withhigh school diplomas. Consequently, government programs aimed at reducing rural high schooldrop-out rates should be regarded as important components of a rural economic developmentstrategy.
However, the research also revealed that, while rural counties within the state have relativelyhigher rates of educational attainment than their national peer group counties, Pennsylvania’s ruralcounties have, on average, higher unemployment rates than their peer groups. Lagging educationalattainment alone does not explain the higher unemployment seen in the state’s rural counties.
In terms of underemployment, the researchers looked at unrealistic expectations concerning thepercentage of the adult working-age population that could be pulled into a county’s labor forceeven under high labor demand conditions. They found that underemployment arises from morethan just lagging education distributions; inadequate labor demand also was a relevant factor.
Another measure of underused labor was the county-specific underemployment rates computedfor each of Pennsylvania’s 48 rural counties from estimates of links between underemploymentand both the education and age distribution profiles of a county. For 2004, the estimated underem-ployment rates varied from almost 3 percent to more than 10 percent. A higher share of bothyounger and older workers was associated with higher county underemployment rates. Moreproblematically, higher shares of college educated adults in a county also were associated withhigher underemployment rates. And, an analysis of RuralPA-CPS data, which is collected by theCenter for Rural Pennsylvania, found that having a college degree did not meaningfully lower theodds that a rural working person was working part-time only. Jointly, these results indicate thatmany college educated workers in rural Pennsylvania may regard themselves as underemployed.
The problem of underemployment for college graduates in rural Pennsylvania is caused, in part,by industry and occupation mixes skewed away from college graduate workers. This study createdestimates, based on occupation mix, of the fraction of jobs in each county requiring a collegedegree and found that only one rural county in the state exceeded the national average for thepercentage of jobs requiring a college degree. Moreover, 12 rural counties had estimated jobshares for college graduates that were less than 75 percent of the national average.
The researchers concluded that any meaningful improvement in rural counties’ underemploy-ment will need to include expanded labor demand in occupations favoring college-educatedworkers. This suggests that the state’s rural economic development funding programs give somepriority to business expansions that may increase the share of jobs in a county requiring collegegraduates.
Studies on Unemployment and Underemployment in Rural Pennsylvania 25 The Center for Rural Pennsylvania
INTRODUCTIONRural unemployment rates persistently have run higher than the national average for many years.
Multiple studies also have established that rural underemployment remains a long-running prob-lem. Studies by Isserman and Rephamm (1993), Hamrick (1997), and Jensen, Findeis, and Wang(1999), among others, have identified several contributing factors to higher rural unemploymentand underemployment. These factors include the declining importance of manufacturing andnatural resource sectors, lagging educational attainment in rural areas, lower levels of publicservice support than in urban areas, and geographic isolation.
State government programs to reduce rural unemployment and underemployment reflect theabove determinates of poor labor market outcomes. State economic development programs aimedat attracting or retaining employers in the state’s rural counties are addressing the job demand sideof rural labor markets. State support for education and skills training in rural areas is intended toincrease the supply of higher skilled workers in these regions, thereby improving the quality of thelabor supply in rural areas and hopefully stimulating greater demand for rural labor services.Lastly, there is a collection of government programs, such as child care assistance, disabilityassistance, and transportation services, which may eliminate barriers preventing potential workersfrom joining the labor force in rural areas.
It is not yet fully understood how the various factors contributing to rural unemployment andunderemployment interact to adversely affect rural labor markets. This lack of understandingregarding the most important determinates of rural unemployment and underemployment, and theirinteractive effects, complicates the targeting of public tax dollars on programs most likely toimprove rural labor markets.
This study used various estimates and models (Price and Wial, 2005; and Bollinger, Coomes, andBerger 2003) to explain variations across Pennsylvania counties in their estimated underemploy-ment rates by county-level age distributions, educational attainment and urban/rural status.
It also analyzed Rural Pennsylvania Current Population Survey (RuralPA-CPS) data from theCenter for Rural Pennsylvania and 2000 Census data to construct profiles of variables most closelylinked to higher rural unemployment levels. Additionally, the study assessed the performance ofeach rural Pennsylvania county versus its national peer group on several labor market outcomes toprovide estimates of the potential up-swing in employment for rural Pennsylvania counties if theirlabor market participation rates were to become among the best in their national peer group. Thestudy’s findings provide guidance to policy makers on how public program dollars may be used toimprove rural Pennsylvania labor markets. The study identified important causal factors drivingunemployment and underemployment in rural Pennsylvania and identified those rural countiesexperiencing the largest underemployment rates and/or lowest employment to working-age popula-tion rates, thereby identifying regions most likely in need of greater assistance.
GOALS AND OBJECTIVESThe research was conducted to: better understand the forces causing unemployment, underem-
ployment, or labor market withdrawals in rural Pennsylvania counties; assess how labor markets ineach rural Pennsylvania county performed relative to their national peer group of similar counties,to each other, and to urban Pennsylvania counties; and assess the impact of both industrial structureand occupation mix on overall job growth and on the fraction of jobs in the county likely to beavailable for college graduates versus jobs for those with high school diplomas only in ruralPennsylvania.
“PEER GROUP” METHODOLOGYThe various methods used for the research are discussed along with their respective results.The “peer groups” in this study were generated by the researchers as a way of benchmarking the
performance of rural Pennsylvania counties against the more than 3,100 counties in the contiguous
The Center for Rural Pennsylvania 26 Studies on Unemployment and Underemployment in Rural Pennsylvania
United States. The peer groupswere based on county classifica-tion codes designated by the U.S.Department of Agriculture’sEconomic Research Service.
The researchers used two typesof classification codes: UrbanInfluence Codes (UIC) and 2004County Typology Codes (CTC).
UIC is a measure of “populationsize, urbanization and access tolarger communities,” and CTC isa measure of economic indepen-dence.
The researchers first sorted thenational data based on UIC andthen sorted the data by CTC sothat the peer groups were based
on similarities in the counties’industrial structure and degree ofrural versus urban characteristics.Each Pennsylvania county wasplaced in one of 20 differentconstructed peer groups, eachcontaining from 53 to 222 coun-ties.
RESULTSImpact of Age on Rural Pennsylvania Counties’ Employment-to-Population Ratios
When compared against standard employment-to-population ratios for the rest of the nation, many ruralPennsylvania counties lag behind their counterparts in other states. The employment-to-population ratio iscommonly used to gauge how well a regional economy is using its potential labor force. Higher countyemployment-to-population ratios are associated with healthier local labor markets and better job opportu-nities for area residents. To assess how much of the lagging employment-to-population ratio for ruralPennsylvania can be attributed to a higher fraction of retirement age adults in rural Pennsylvania than inmany other regions, the researchers computed two different employment-to-population ratios. Thesemeasures were estimated for each of the 3,108 counties in the contiguous U.S. for each year from 1990 to2004.
The standard reported employment-to-population ratio is county employment divided by the populationage 15 years and over. The age-adjusted employment-to-population ratio is county employment dividedby the population age 15 to 64 years old. Both county employment data, from the Bureau of Labor Statis-tics, and the population numbers, from the U.S. Census, are annual averages.
According to the analysis, there has been improvement in the employment-to-population ratios for ruralPennsylvania, after adjusting for age profiles, from 1990 to 2004. However, few rural Pennsylvaniacounties rank highly on this measure nationally. Figure 1 contains the 2004 age-adjusted measures foreach Pennsylvania county ranked by their national percentile, where a 99th percentile value would meanthe county’s age-adjusted employment-to-population ratio exceeds 99 of 100 counties in the country.
Only six rural Pennsylvania counties ranked above the 70th percentile nationally: Juniata, Franklin,Adams, Bradford, Elk and Perry. The poorer performing labor markets on this measure include eightcounties ranking below the 30th percentile nationally: Union, Greene, Forest, Pike, Huntingdon, Fayette,Centre and Cambria. Of this group, Centre County’s results are skewed due to the large number of adultfull-time college students residing in the county. Moreover, Greene, Huntingdon and Union countiescontain correctional institutions contributing to their lower employment-to-population ratios.
Comparing rural Pennsylvania counties against their urban in-state counterparts also showed a lagging,but declining, gap in performance (Figure 2). Employment-to-population ratios for urban counties werelevel from 1990 to 2004 while there was improvement for rural counties on both the age-adjusted andunadjusted measures. A sense of the potential further gains in improving rural Pennsylvania labor marketoutcomes can be seen in the 2004 shortfall for rural versus urban counties. Had the average rural 2004age-adjusted employment-to-population ratios equaled the 0.75 urban average, rural Pennsylvania em-ployment would have been 108,153 larger than its actual 2004 employment of 1,597,871.
What accounts for the differences across rural and urban Pennsylvania counties in the employment-to-population ratio outcomes? Two likely forces include variations in educational attainment and age distribu-tions across counties. The most important impacts on a county’s employment-to-population ratio arehighlighted in Figure 3.
These results suggest a strong potential impact from lowering high school drop-out rates on rural Penn-sylvania labor market outcomes. The estimates indicate that for every 1 percentage point increase in theshare of a county’s adult population that is a high school graduate, there is a 0.6 percent higher employ-ment-to-population ratio for the county. That is, if two counties are identical in all respects except that
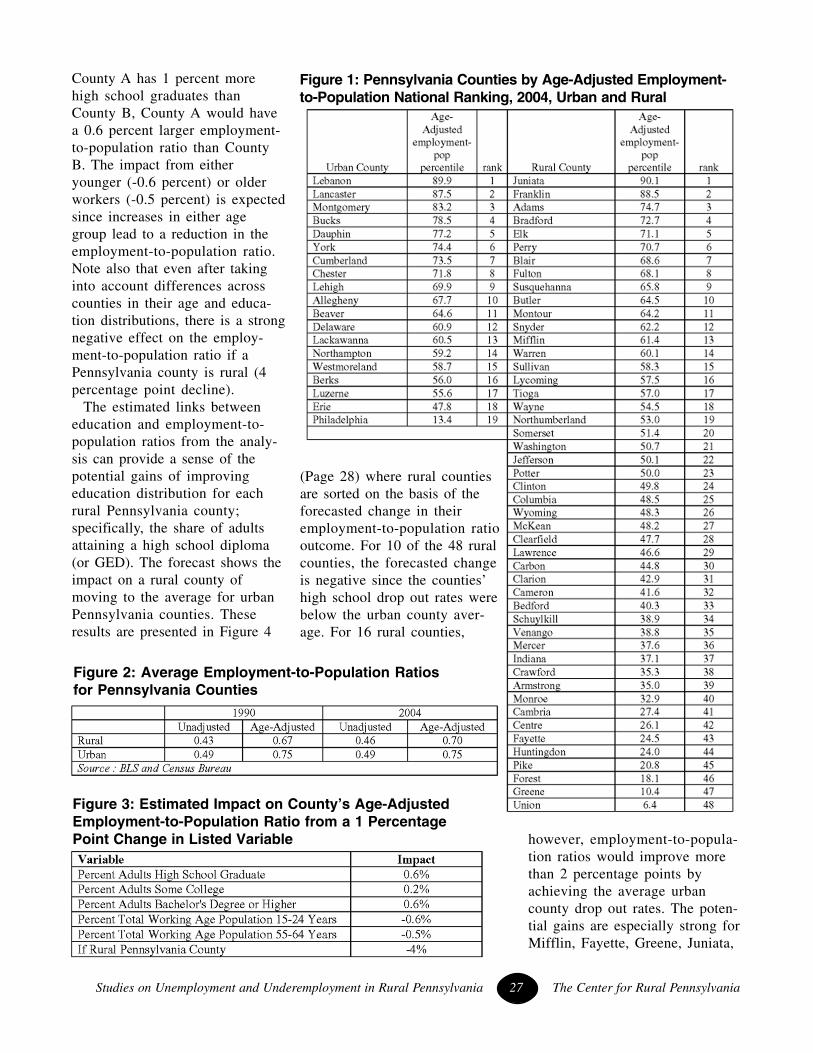
Studies on Unemployment and Underemployment in Rural Pennsylvania 27 The Center for Rural Pennsylvania
County A has 1 percent morehigh school graduates thanCounty B, County A would havea 0.6 percent larger employment-to-population ratio than CountyB. The impact from eitheryounger (-0.6 percent) or olderworkers (-0.5 percent) is expectedsince increases in either agegroup lead to a reduction in theemployment-to-population ratio.Note also that even after takinginto account differences acrosscounties in their age and educa-tion distributions, there is a strongnegative effect on the employ-ment-to-population ratio if aPennsylvania county is rural (4percentage point decline).
The estimated links betweeneducation and employment-to-population ratios from the analy-sis can provide a sense of thepotential gains of improvingeducation distribution for eachrural Pennsylvania county;specifically, the share of adultsattaining a high school diploma(or GED). The forecast shows theimpact on a rural county ofmoving to the average for urbanPennsylvania counties. Theseresults are presented in Figure 4
however, employment-to-popula-tion ratios would improve morethan 2 percentage points byachieving the average urbancounty drop out rates. The poten-tial gains are especially strong forMifflin, Fayette, Greene, Juniata,
Figure 1: Pennsylvania Counties by Age-Adjusted Employment-to-Population National Ranking, 2004, Urban and Rural
Figure 2: Average Employment-to-Population Ratiosfor Pennsylvania Counties
Figure 3: Estimated Impact on County’s Age-AdjustedEmployment-to-Population Ratio from a 1 PercentagePoint Change in Listed Variable
(Page 28) where rural countiesare sorted on the basis of theforecasted change in theiremployment-to-population ratiooutcome. For 10 of the 48 ruralcounties, the forecasted changeis negative since the counties’high school drop out rates werebelow the urban county aver-age. For 16 rural counties,
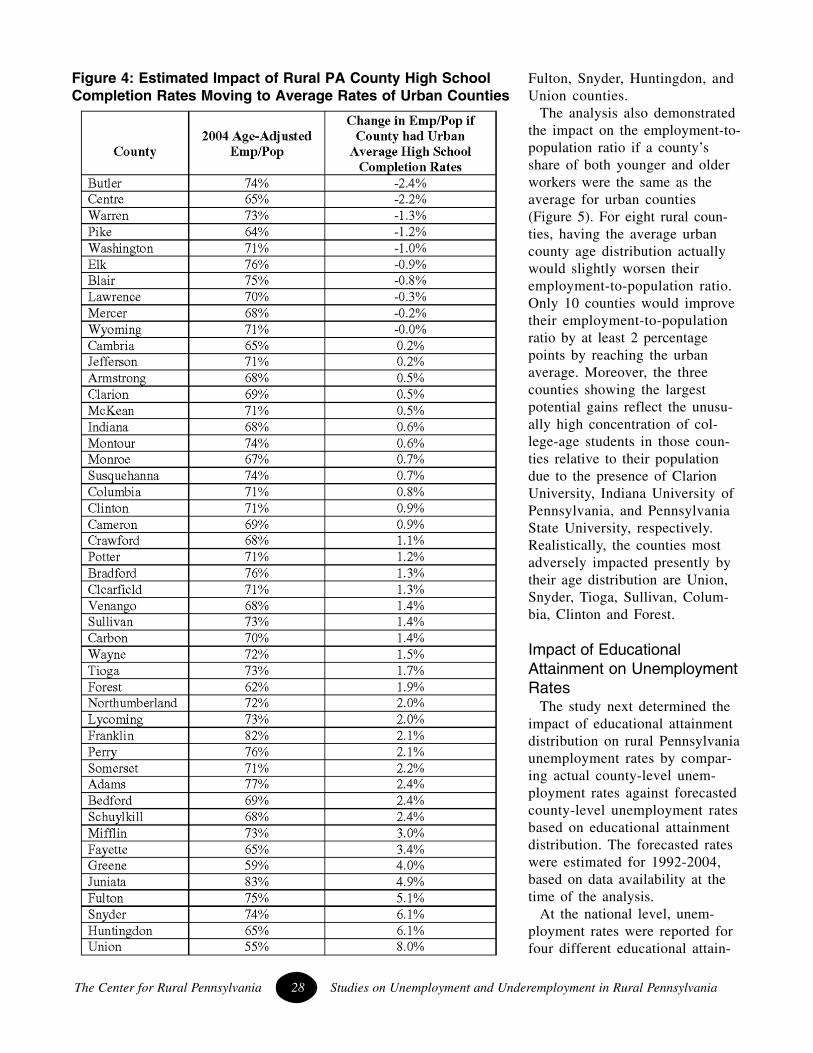
The Center for Rural Pennsylvania 28 Studies on Unemployment and Underemployment in Rural Pennsylvania
Fulton, Snyder, Huntingdon, andUnion counties.
The analysis also demonstratedthe impact on the employment-to-population ratio if a county’sshare of both younger and olderworkers were the same as theaverage for urban counties(Figure 5). For eight rural coun-ties, having the average urbancounty age distribution actuallywould slightly worsen theiremployment-to-population ratio.Only 10 counties would improvetheir employment-to-populationratio by at least 2 percentagepoints by reaching the urbanaverage. Moreover, the threecounties showing the largestpotential gains reflect the unusu-ally high concentration of col-lege-age students in those coun-ties relative to their populationdue to the presence of ClarionUniversity, Indiana University ofPennsylvania, and PennsylvaniaState University, respectively.Realistically, the counties mostadversely impacted presently bytheir age distribution are Union,Snyder, Tioga, Sullivan, Colum-bia, Clinton and Forest.
Impact of EducationalAttainment on UnemploymentRates
The study next determined theimpact of educational attainmentdistribution on rural Pennsylvaniaunemployment rates by compar-ing actual county-level unem-ployment rates against forecastedcounty-level unemployment ratesbased on educational attainmentdistribution. The forecasted rateswere estimated for 1992-2004,based on data availability at thetime of the analysis.
At the national level, unem-ployment rates were reported forfour different educational attain-
Figure 4: Estimated Impact of Rural PA County High SchoolCompletion Rates Moving to Average Rates of Urban Counties
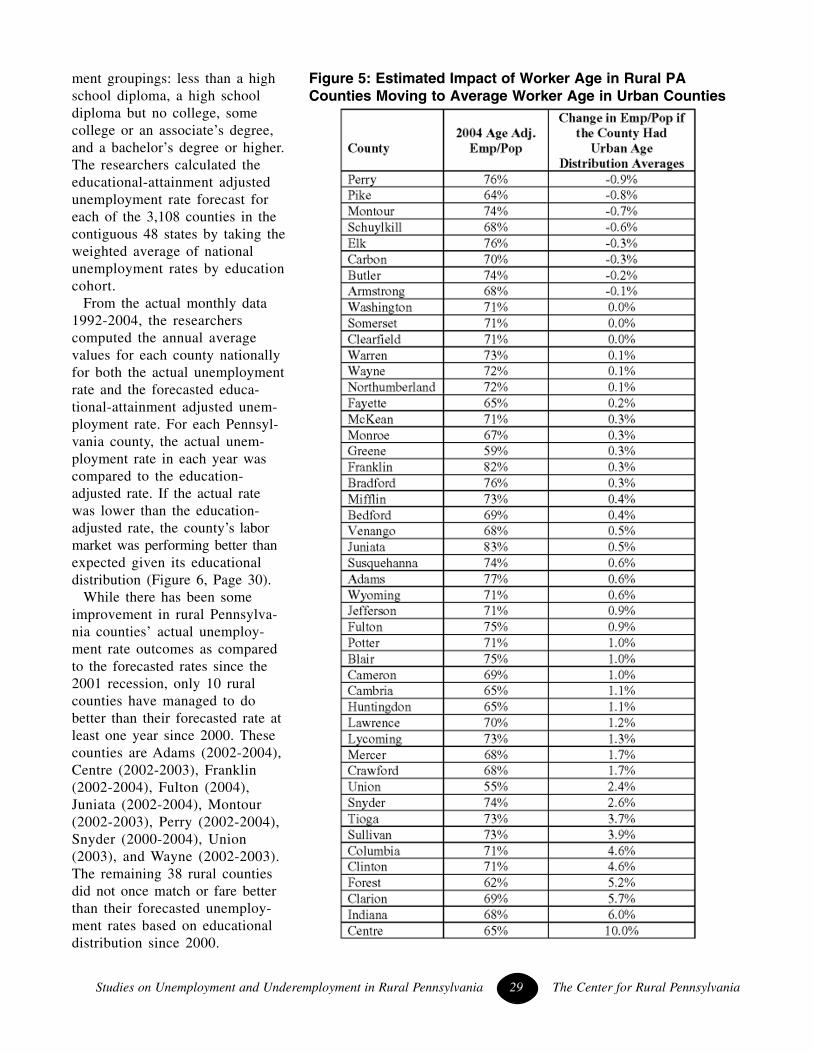
Studies on Unemployment and Underemployment in Rural Pennsylvania 29 The Center for Rural Pennsylvania
ment groupings: less than a highschool diploma, a high schooldiploma but no college, somecollege or an associate’s degree,and a bachelor’s degree or higher.The researchers calculated theeducational-attainment adjustedunemployment rate forecast foreach of the 3,108 counties in thecontiguous 48 states by taking theweighted average of nationalunemployment rates by educationcohort.
From the actual monthly data1992-2004, the researcherscomputed the annual averagevalues for each county nationallyfor both the actual unemploymentrate and the forecasted educa-tional-attainment adjusted unem-ployment rate. For each Pennsyl-vania county, the actual unem-ployment rate in each year wascompared to the education-adjusted rate. If the actual ratewas lower than the education-adjusted rate, the county’s labormarket was performing better thanexpected given its educationaldistribution (Figure 6, Page 30).
While there has been someimprovement in rural Pennsylva-nia counties’ actual unemploy-ment rate outcomes as comparedto the forecasted rates since the2001 recession, only 10 ruralcounties have managed to dobetter than their forecasted rate atleast one year since 2000. Thesecounties are Adams (2002-2004),Centre (2002-2003), Franklin(2002-2004), Fulton (2004),Juniata (2002-2004), Montour(2002-2003), Perry (2002-2004),Snyder (2000-2004), Union(2003), and Wayne (2002-2003).The remaining 38 rural countiesdid not once match or fare betterthan their forecasted unemploy-ment rates based on educationaldistribution since 2000.
Figure 5: Estimated Impact of Worker Age in Rural PACounties Moving to Average Worker Age in Urban Counties
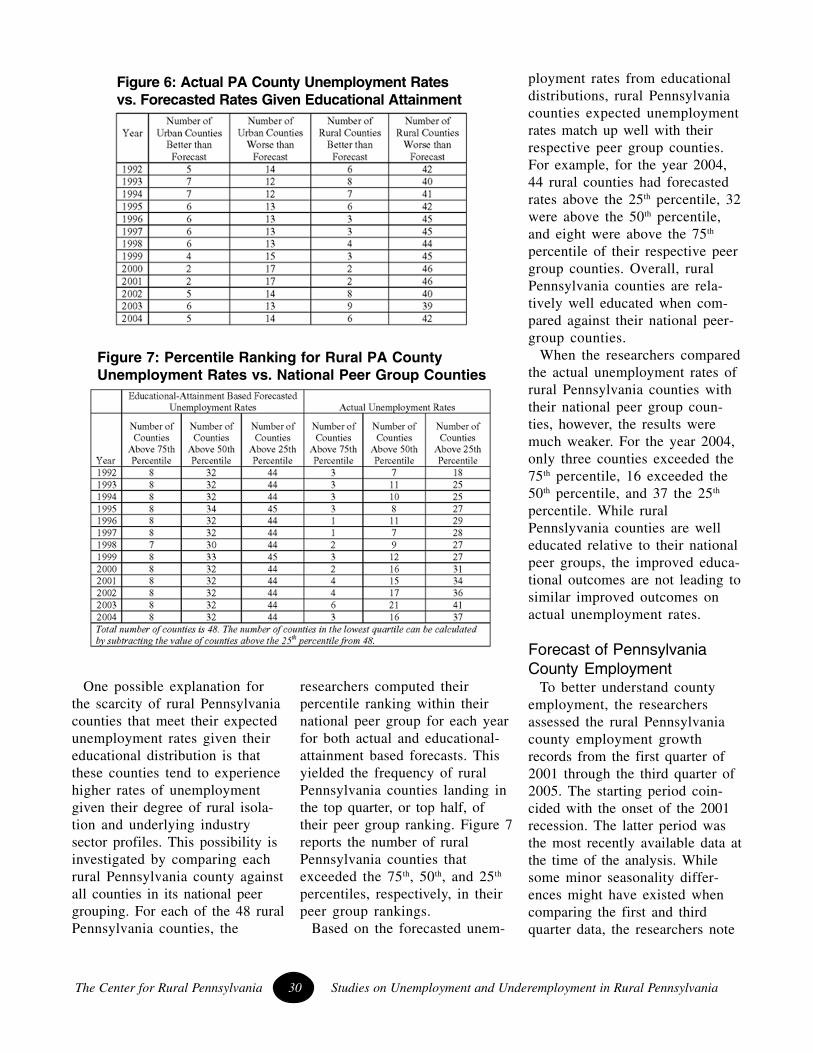
The Center for Rural Pennsylvania 30 Studies on Unemployment and Underemployment in Rural Pennsylvania
One possible explanation forthe scarcity of rural Pennsylvaniacounties that meet their expectedunemployment rates given theireducational distribution is thatthese counties tend to experiencehigher rates of unemploymentgiven their degree of rural isola-tion and underlying industrysector profiles. This possibility isinvestigated by comparing eachrural Pennsylvania county againstall counties in its national peergrouping. For each of the 48 ruralPennsylvania counties, the
researchers computed theirpercentile ranking within theirnational peer group for each yearfor both actual and educational-attainment based forecasts. Thisyielded the frequency of ruralPennsylvania counties landing inthe top quarter, or top half, oftheir peer group ranking. Figure 7reports the number of ruralPennsylvania counties thatexceeded the 75th, 50th, and 25th
percentiles, respectively, in theirpeer group rankings.
Based on the forecasted unem-
ployment rates from educationaldistributions, rural Pennsylvaniacounties expected unemploymentrates match up well with theirrespective peer group counties.For example, for the year 2004,44 rural counties had forecastedrates above the 25th percentile, 32were above the 50th percentile,and eight were above the 75th
percentile of their respective peergroup counties. Overall, ruralPennsylvania counties are rela-tively well educated when com-pared against their national peer-group counties.
When the researchers comparedthe actual unemployment rates ofrural Pennsylvania counties withtheir national peer group coun-ties, however, the results weremuch weaker. For the year 2004,only three counties exceeded the75th percentile, 16 exceeded the50th percentile, and 37 the 25th
percentile. While ruralPennslyvania counties are welleducated relative to their nationalpeer groups, the improved educa-tional outcomes are not leading tosimilar improved outcomes onactual unemployment rates.
Forecast of PennsylvaniaCounty Employment
To better understand countyemployment, the researchersassessed the rural Pennsylvaniacounty employment growthrecords from the first quarter of2001 through the third quarter of2005. The starting period coin-cided with the onset of the 2001recession. The latter period wasthe most recently available data atthe time of the analysis. Whilesome minor seasonality differ-ences might have existed whencomparing the first and thirdquarter data, the researchers note
Figure 6: Actual PA County Unemployment Ratesvs. Forecasted Rates Given Educational Attainment
Figure 7: Percentile Ranking for Rural PA CountyUnemployment Rates vs. National Peer Group Counties
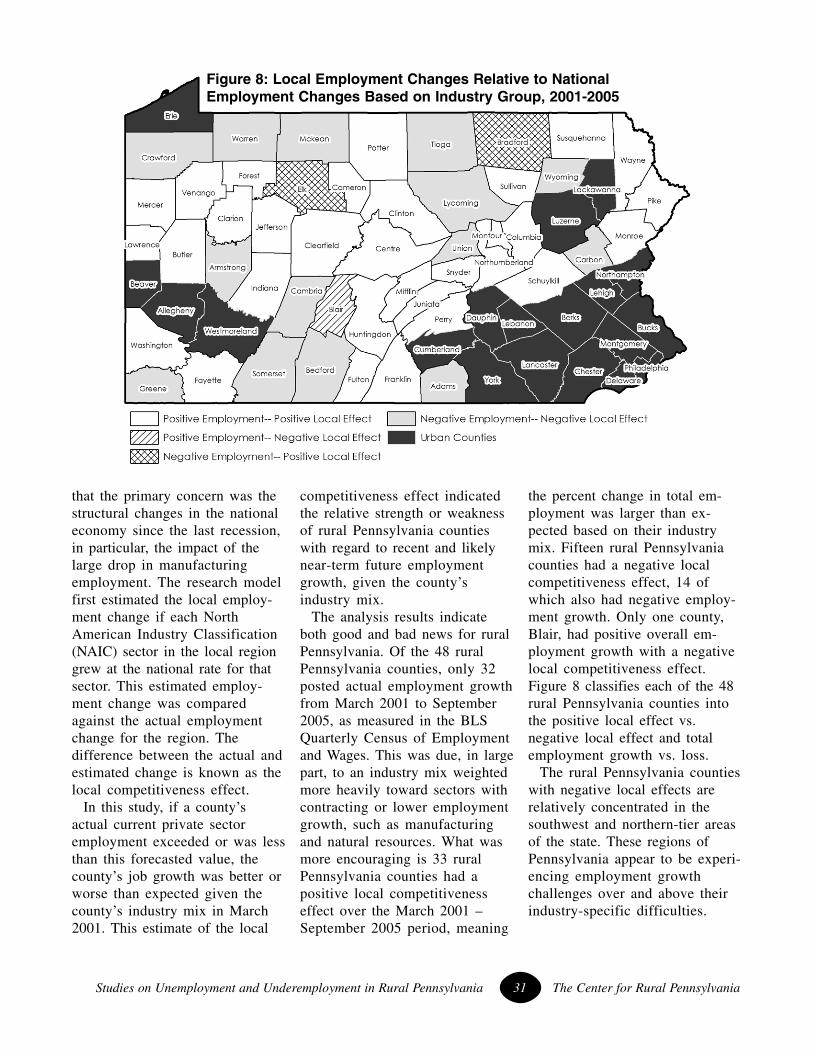
Studies on Unemployment and Underemployment in Rural Pennsylvania 31 The Center for Rural Pennsylvania
that the primary concern was thestructural changes in the nationaleconomy since the last recession,in particular, the impact of thelarge drop in manufacturingemployment. The research modelfirst estimated the local employ-ment change if each NorthAmerican Industry Classification(NAIC) sector in the local regiongrew at the national rate for thatsector. This estimated employ-ment change was comparedagainst the actual employmentchange for the region. Thedifference between the actual andestimated change is known as thelocal competitiveness effect.
In this study, if a county’sactual current private sectoremployment exceeded or was lessthan this forecasted value, thecounty’s job growth was better orworse than expected given thecounty’s industry mix in March2001. This estimate of the local
competitiveness effect indicatedthe relative strength or weaknessof rural Pennsylvania countieswith regard to recent and likelynear-term future employmentgrowth, given the county’sindustry mix.
The analysis results indicateboth good and bad news for ruralPennsylvania. Of the 48 ruralPennsylvania counties, only 32posted actual employment growthfrom March 2001 to September2005, as measured in the BLSQuarterly Census of Employmentand Wages. This was due, in largepart, to an industry mix weightedmore heavily toward sectors withcontracting or lower employmentgrowth, such as manufacturingand natural resources. What wasmore encouraging is 33 ruralPennsylvania counties had apositive local competitivenesseffect over the March 2001 –September 2005 period, meaning
the percent change in total em-ployment was larger than ex-pected based on their industrymix. Fifteen rural Pennsylvaniacounties had a negative localcompetitiveness effect, 14 ofwhich also had negative employ-ment growth. Only one county,Blair, had positive overall em-ployment growth with a negativelocal competitiveness effect.Figure 8 classifies each of the 48rural Pennsylvania counties intothe positive local effect vs.negative local effect and totalemployment growth vs. loss.
The rural Pennsylvania countieswith negative local effects arerelatively concentrated in thesouthwest and northern-tier areasof the state. These regions ofPennsylvania appear to be experi-encing employment growthchallenges over and above theirindustry-specific difficulties.
Figure 8: Local Employment Changes Relative to NationalEmployment Changes Based on Industry Group, 2001-2005
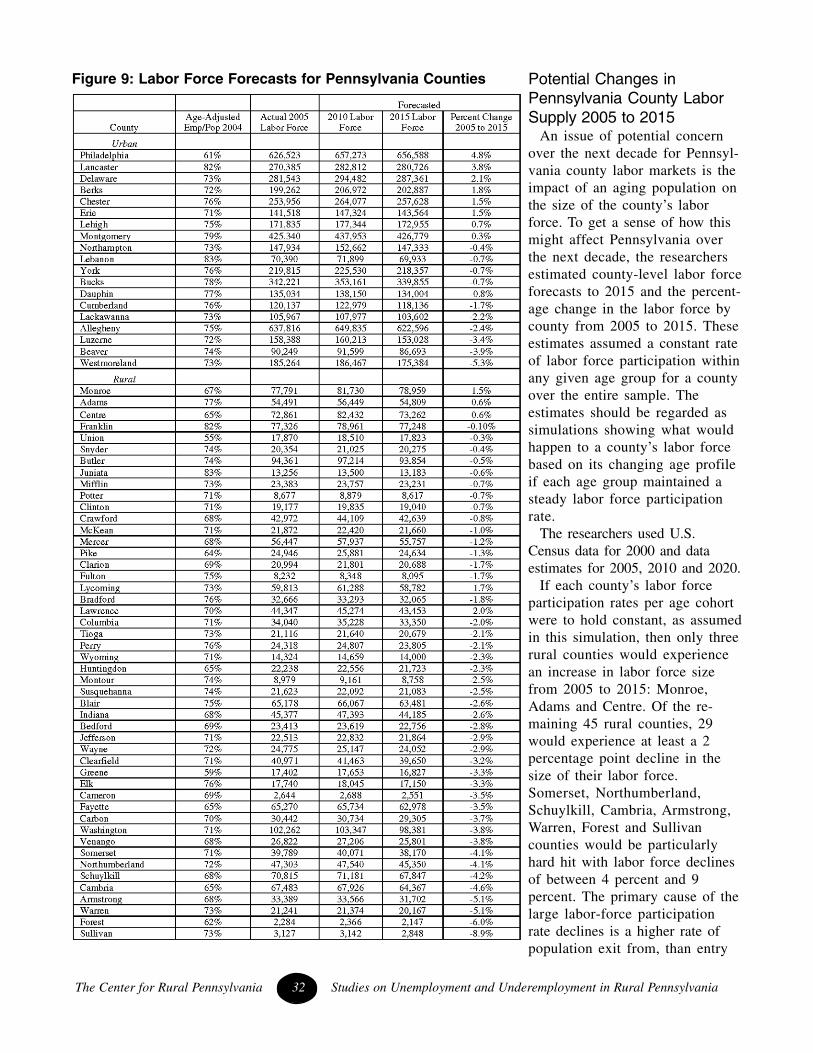
The Center for Rural Pennsylvania 32 Studies on Unemployment and Underemployment in Rural Pennsylvania
Figure 9: Labor Force Forecasts for Pennsylvania Counties Potential Changes inPennsylvania County LaborSupply 2005 to 2015
An issue of potential concernover the next decade for Pennsyl-vania county labor markets is theimpact of an aging population onthe size of the county’s laborforce. To get a sense of how thismight affect Pennsylvania overthe next decade, the researchersestimated county-level labor forceforecasts to 2015 and the percent-age change in the labor force bycounty from 2005 to 2015. Theseestimates assumed a constant rateof labor force participation withinany given age group for a countyover the entire sample. Theestimates should be regarded assimulations showing what wouldhappen to a county’s labor forcebased on its changing age profileif each age group maintained asteady labor force participationrate.
The researchers used U.S.Census data for 2000 and dataestimates for 2005, 2010 and 2020.
If each county’s labor forceparticipation rates per age cohortwere to hold constant, as assumedin this simulation, then only threerural counties would experiencean increase in labor force sizefrom 2005 to 2015: Monroe,Adams and Centre. Of the re-maining 45 rural counties, 29would experience at least a 2percentage point decline in thesize of their labor force.Somerset, Northumberland,Schuylkill, Cambria, Armstrong,Warren, Forest and Sullivancounties would be particularlyhard hit with labor force declinesof between 4 percent and 9percent. The primary cause of thelarge labor-force participationrate declines is a higher rate ofpopulation exit from, than entry
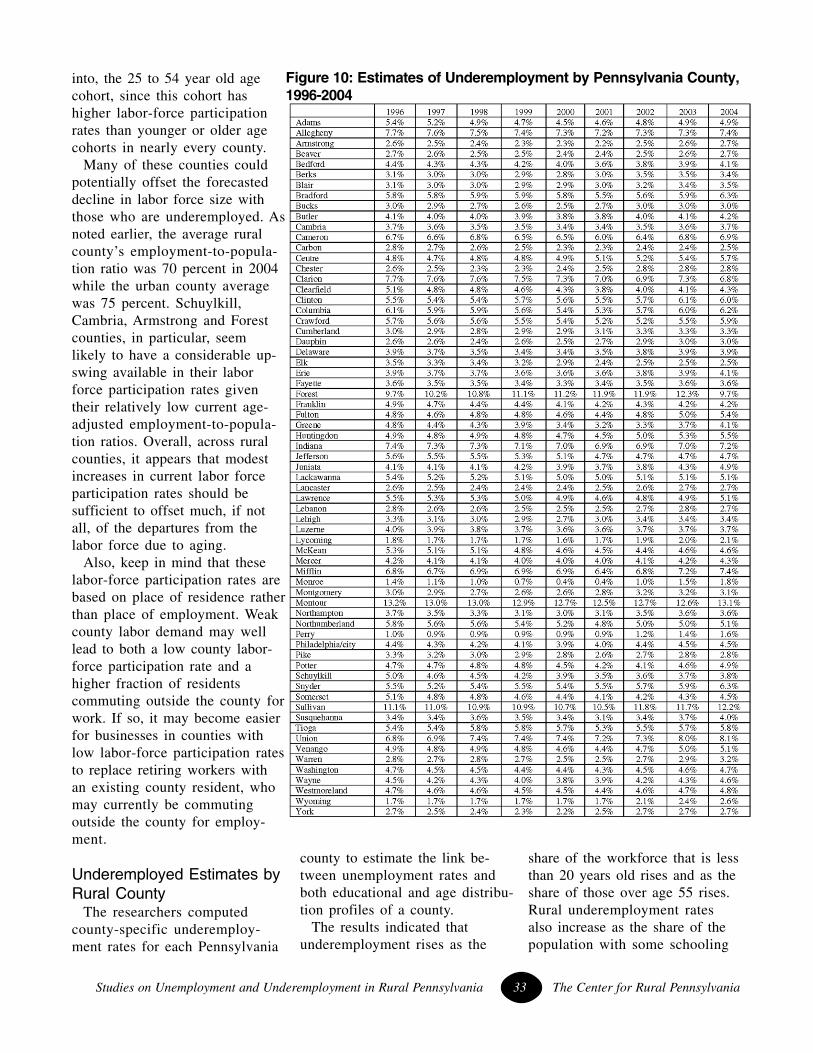
Studies on Unemployment and Underemployment in Rural Pennsylvania 33 The Center for Rural Pennsylvania
county to estimate the link be-tween unemployment rates andboth educational and age distribu-tion profiles of a county.
The results indicated thatunderemployment rises as the
share of the workforce that is lessthan 20 years old rises and as theshare of those over age 55 rises.Rural underemployment ratesalso increase as the share of thepopulation with some schooling
Figure 10: Estimates of Underemployment by Pennsylvania County,1996-2004
into, the 25 to 54 year old agecohort, since this cohort hashigher labor-force participationrates than younger or older agecohorts in nearly every county.
Many of these counties couldpotentially offset the forecasteddecline in labor force size withthose who are underemployed. Asnoted earlier, the average ruralcounty’s employment-to-popula-tion ratio was 70 percent in 2004while the urban county averagewas 75 percent. Schuylkill,Cambria, Armstrong and Forestcounties, in particular, seemlikely to have a considerable up-swing available in their laborforce participation rates giventheir relatively low current age-adjusted employment-to-popula-tion ratios. Overall, across ruralcounties, it appears that modestincreases in current labor forceparticipation rates should besufficient to offset much, if notall, of the departures from thelabor force due to aging.
Also, keep in mind that theselabor-force participation rates arebased on place of residence ratherthan place of employment. Weakcounty labor demand may welllead to both a low county labor-force participation rate and ahigher fraction of residentscommuting outside the county forwork. If so, it may become easierfor businesses in counties withlow labor-force participation ratesto replace retiring workers withan existing county resident, whomay currently be commutingoutside the county for employ-ment.
Underemployed Estimates byRural County
The researchers computedcounty-specific underemploy-ment rates for each Pennsylvania
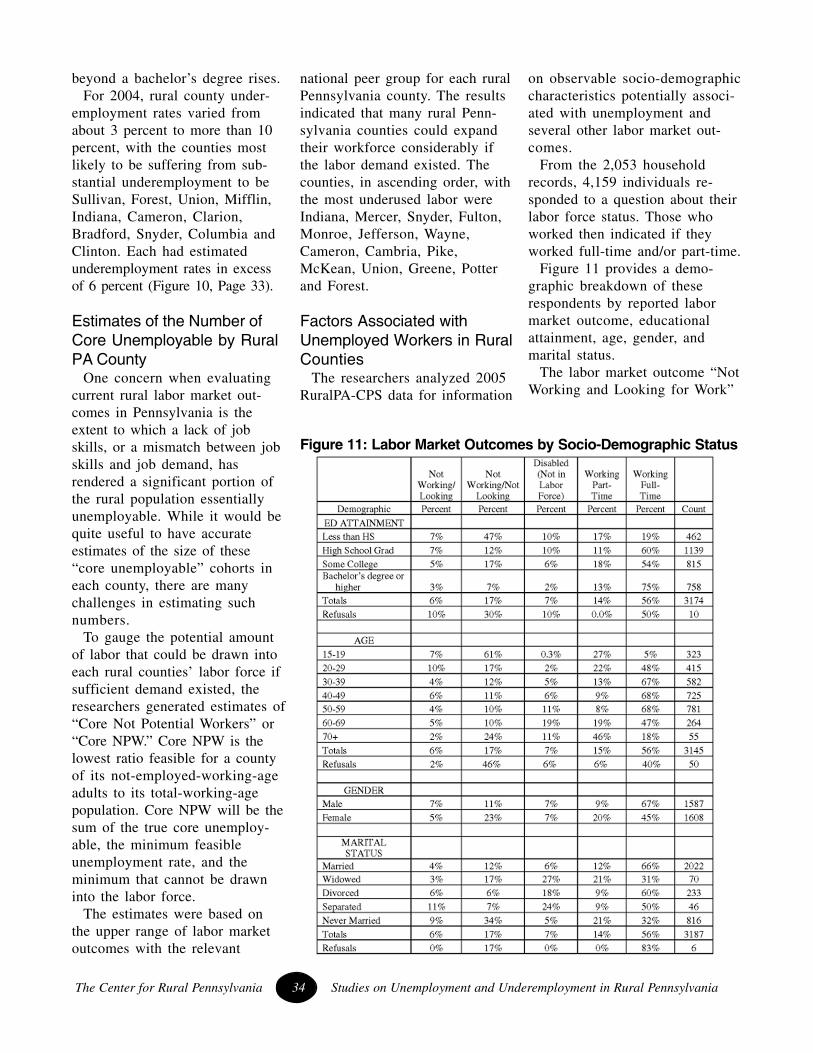
The Center for Rural Pennsylvania 34 Studies on Unemployment and Underemployment in Rural Pennsylvania
beyond a bachelor’s degree rises.For 2004, rural county under-
employment rates varied fromabout 3 percent to more than 10percent, with the counties mostlikely to be suffering from sub-stantial underemployment to beSullivan, Forest, Union, Mifflin,Indiana, Cameron, Clarion,Bradford, Snyder, Columbia andClinton. Each had estimatedunderemployment rates in excessof 6 percent (Figure 10, Page 33).
Estimates of the Number ofCore Unemployable by RuralPA County
One concern when evaluatingcurrent rural labor market out-comes in Pennsylvania is theextent to which a lack of jobskills, or a mismatch between jobskills and job demand, hasrendered a significant portion ofthe rural population essentiallyunemployable. While it would bequite useful to have accurateestimates of the size of these“core unemployable” cohorts ineach county, there are manychallenges in estimating suchnumbers.
To gauge the potential amountof labor that could be drawn intoeach rural counties’ labor force ifsufficient demand existed, theresearchers generated estimates of“Core Not Potential Workers” or“Core NPW.” Core NPW is thelowest ratio feasible for a countyof its not-employed-working-ageadults to its total-working-agepopulation. Core NPW will be thesum of the true core unemploy-able, the minimum feasibleunemployment rate, and theminimum that cannot be drawninto the labor force.
The estimates were based onthe upper range of labor marketoutcomes with the relevant
national peer group for each ruralPennsylvania county. The resultsindicated that many rural Penn-sylvania counties could expandtheir workforce considerably ifthe labor demand existed. Thecounties, in ascending order, withthe most underused labor wereIndiana, Mercer, Snyder, Fulton,Monroe, Jefferson, Wayne,Cameron, Cambria, Pike,McKean, Union, Greene, Potterand Forest.
Factors Associated withUnemployed Workers in RuralCounties
The researchers analyzed 2005RuralPA-CPS data for information
on observable socio-demographiccharacteristics potentially associ-ated with unemployment andseveral other labor market out-comes.
From the 2,053 householdrecords, 4,159 individuals re-sponded to a question about theirlabor force status. Those whoworked then indicated if theyworked full-time and/or part-time.
Figure 11 provides a demo-graphic breakdown of theserespondents by reported labormarket outcome, educationalattainment, age, gender, andmarital status.
The labor market outcome “NotWorking and Looking for Work”
Figure 11: Labor Market Outcomes by Socio-Demographic Status
Studies on Unemployment and Underemployment in Rural Pennsylvania 35 The Center for Rural Pennsylvania
is the definition of an unem-ployed worker, so the left datacolumn contains socio-demo-graphic profile information onunemployed rural Pennsylvaniaworkers.
The researchers found that,consistent with national data, aseducational attainment beyondhigh school increased, unemploy-ment rates declined. Individualswith a bachelors’ degree or higherhad unemployment rates less thanhalf of those with high schooldiplomas only. With the excep-tion of the 40-49 age range, theunemployment rate declined withage from the 20s until past 60years of age, again consistentwith national data.
The 40-49 age range unem-ployment rate spike may be adata anomaly arising from therelatively small sample of 180self-reported unemployed indi-viduals.
The male unemployment ratewas 40 percent higher than thefemale rate. This outcome maylargely reflect the higher laborforce participation rates of males.In the survey, the male laborforce participation rate was 82percent while the female laborforce participation rate was onlyabout 70 percent. Married respon-dents had unemployment ratesonly two-thirds to less than halfthe unemployment rates for allother marital status categories(except widowed, which only hadtwo reponses). Overall, theRuralPA-CPS data suggest thatrural counties with more of theirworkforce in the 30-60 year oldrange, a higher fraction of theirworkforce with more than a highschool diploma, and higher ratesof intact marital households werelikely to have lower unemploy-ment rates.
Characteristics Associatedwith Various Labor MarketOutcomes
Several results from the aboveRuralPA-CPS analysis are alsoworth noting, especially forindividuals not looking for work,out of the workforce due todisability, working part-time, andworking full-time. First, amongthose who were not working andnot looking for work, theirmovement into or out of thiscategory occurred prior to and atthe end of their prime workingage years. Also, those in thiscategory were more than twice aslikely to be female than male.
For those who were out of theworkforce due to disability, tworesults are noteworthy. First, therewas a dramatic reduction in theshare of this population as educa-tional attainment increasedbeyond the high-school-diploma-only level. Also, there was asharp jump in this populationonce the age cohort exceeded 50years.
The working part-time versusworking full-time results revealseveral relationships relevant forunderstanding characteristicsassociated with part-time work inrural Pennsylvania. The mostimportant survey outcome heresuggests underemployment maybe a meaningful problem forcollege graduates residing in ruralPennsylvania. For high-school-diploma-only individuals, almost16 percent of workers wereworking part-time. For bachelors’degree or higher individuals,about 15 percent were workingpart-time. This suggests that somecollege graduates in rural Penn-sylvania are involuntarily work-ing part-time.
The percent of part-time work-
ers falls sharply after age 30 asabout 32 percent of those aged20-29 worked part-time whileabout 16 percent of those aged30-39 worked part-time.
The percentage of those work-ing part-time continues to declinewith age until age 60: about 11percent for 40-49 year olds, 10percent for 50-59 year olds and29 percent for 60-69 year olds.There are minimal differences inthe percent of workers workingpart-time according to maritalstatus, except for those who werenever married, which includedmany younger individuals.
Forecasts of CountyEmployment by EducationalAttainment
One potential cause of under-employment for college graduatesin rural Pennsylvania is thatinsufficient demand for collegeeducated labor arises in part fromthe past and current occupationalmix in rural counties. Historically,the main industry sectors, such asagriculture, natural resources, andmanufacturing, for rural Pennsyl-vania would have had occupa-tional demands skewed awayfrom college graduates. Whileconsiderable change has occurredin recent decades in ruralPennsylvania’s industrial struc-ture, it still may be the case thatthe existing occupational mixgenerates a smaller share of totaljobs for college graduates.
The researchers merged BLSand U.S. Census data files toforecast a county’s share of jobsby educational attainment re-quirements, assuming that foreach occupational category thecounty’s distribution of jobs byeducation within the category isthe same as for national level
data. When interpreting theresults, however, the researchersrecognized that the techniquemost likely is biased towardoverestimating the demand forcollege-educated workers in ruralareas, since even within occupa-tions, rural areas are less likelythan urban areas to have the mosthighly-educated workers.
The findings indicate that ruralPennsylvania does in fact sufferfrom a serious shortfall in occu-
The Center for Rural Pennsylvania 36 Studies on Unemployment and Underemployment in Rural Pennsylvania
pations demanding collegegraduates.
Only one rural county, Centre,matched or exceeded the nationalaverage of about 29 percent ofjobs for college graduate workers.Moreover, Centre County is notrepresentative of most of ruralPennsylvania. Only five ruralcounties (Butler, Montour, Mon-roe, Pike, and Washington) hadjob demands for college gradu-ates within 90 percent of the
national average. Twenty-sevenrural Pennsylvania counties hadestimated job demands for col-lege graduates that were less than80 percent of the national aver-age. These results show that formuch of rural Pennsylvania,absent significant changes in theoccupational mix, it is unlikelythat there will be strong demandgrowth for college graduateworkers.
SUMMARYEmployment to Working-Age Population Outcomes
• Rural Pennsylvania’s employment-to-population ratio outcomes were clustered in the lower middlerange of counties nationally. Even after adjusting for the share of adult populace of retirement age, fewrural Pennsylvania counties were in the top 30 percent of counties nationally but only six were in thebottom quarter.• Rural Pennsylvania counties have closed the gap with urban Pennsylvania counties on the age-ad-justed employment-to-population ratio since 1990 but still lag by 5 percentage points.• Even after controlling for differences in educational attainment and age profiles between urban andrural Pennsylvania counties, a substantial “rural penalty” on the age-adjusted employment-to-populationratio remained.• The variable identified as having the largest positive impact on rural counties’ age-adjusted employ-ment-to-population ratios was the percentage of adults with high school diplomas. Getting students tocomplete high school improves a county’s employment rates.
Impact of Educational Attainment on Rural Unemployment Rates• Rural Pennsylvania counties have relatively higher rates of educational attainment than their peergroup counties. However, these higher rates of educational attainment have not translated into lowerunemployment rates, on average, than those of their peer group counties.• In any given year between 1992 and 2004, only between two and nine rural Pennsylvania countieshad actual unemployment rates as well as or better than forecasted, given their educational attainmentdistribution.• Based on their educational attainment levels versus their national peer groups, eight rural Pennsylvaniacounties would be in the top quarter of their peer group and 32 would be in the top half.• These findings suggest that neither lagging educational attainment nor underlying industry structurecharacteristics are sufficient to explain the higher average rates of unemployment for rural Pennsylvaniacounties.
Impact of Rural Industry Mix On Job Growth Since Last Recession• From the start of the last recession in March 2001 through September 2005, only 32 rural Pennsylva-nia counties posted employment growth as measured in the BLS Quarterly Census of Employment andWages. For many of these counties, this was due in part to their industry mix being more heavilyweighted toward industry sectors experiencing contracting employment nationally. Even after control-
ling for industry mix, however,14 rural counties with reducedemployment did worse thanforecast based on their industrymix.
Potential Changes in RuralLabor Force Size by 2015From Aging Populations
• If there were no changes ineach county’s labor forceparticipation rates by agecohort from 2005 to 2015, theincreasingly older populationprofiles for a number of ruralcounties would lead to declinesin the total size of their laborforce. These projected laborforce declines, however, maywell be offset by rising laborforce participation rates inmany of these counties as theiroverall employment to work-ing-age population ratios arebelow the state average.
Estimates of RuralUnderemployment and KeyDeterminants
• Underemployment rises as theshare of the workforce that isless than 20 years old rises andas the share that is over 55years old rises. Rural underem-
POLICY CONSIDERATIONSThis study documented that rural Pennsylvania counties suffer from labor market outcomes inferior both
to those of most urban Pennsylvania counties and to appropriately selected sets of peer group countiesnationwide.
Some of the findings of this study suggest potential policy actions on both the supply and demand sidesof rural labor markets.
For example, the findings found strong benefits to rural labor market outcomes from reducing the shareof adults with less than a high school diploma. Therefore, efforts to increase high school graduation ratesand increase GED completion rates for older individuals should be regarded as an economic developmentstrategy.
Government programs aimed at increasing the level of post-high school education across rural residents,such as expanded student loans and related education or job training subsidies, appear to generate twodifferent effects in rural labor markets. On the positive side, levels of education beyond high school
Studies on Unemployment and Underemployment in Rural Pennsylvania 37 The Center for Rural Pennsylvania
ployment rates also increase asthe share of the population withsome schooling beyond abachelor’s degree rises.
Estimating Size of “NotPotential Workers” for RuralCounties
• About 15 rural Pennsylvaniacounties within the state couldexpand their workforce consid-erably if the labor demandexisted.
Key Factors Associated WithLabor Market Outcomes inRural Pennsylvania
• The analysis found appre-ciable declines in the unem-ployment rate as educationalattainment extended beyond ahigh school diploma. Forexample, individuals holding abachelor’s degree or higher hadunemployment rates less thanhalf of those with a high schooldiploma only.• The level of education be-yond high school, however,does not impact the odds that aperson is working part-timerather than full-time. For highschool diploma-only workers,about 16 percent were working
part-time; for those with abachelor’s degree or higher,about 15 percent were workingpart-time. This result suggeststhat some college graduates inrural areas of the state areinvoluntarily working part-time.It is consistent with earlierfindings from the regressionanalysis of underemploymentthat found higher rates ofcollege graduation were associ-ated with higher rates of countyunderemployment.
Role of Occupation Mix inLabor Demand for CollegeGraduates in Rural Counties
• The multiple findings ofunderemployment in ruralcounties for college graduatescan be explained, at least inpart, by the occupational mixesfound in rural counties. Theanalysis estimated that, nation-ally, about 29 percent of jobsare associated with a bachelor’sdegree or higher. Only onerural county exceeded theaverage, and 12 counties hadestimated job shares for collegegraduates that were less than 75percent of the national average.
further reduce rural countyunemployment rates and increaseemployment-to-population ratios.Unfortunately, rising shares ofcollege educated adults in ruralcounties also was associated withhigher reported rates of underem-ployment.
Government programs intendedto reduce the degree of underem-ployment in rural counties willneed to focus on labor demandissues. The current distribution ofoccupations across rural Pennsyl-vania is skewed away from thoseoccupations that generate largershares of jobs requiringbachelor’s degrees or more. Thisstudy clearly documents that thecurrent occupation mix in manyrural counties is not well suitedfor absorbing college graduateswishing to return to or remain intheir home rural county. Sinceoccupation mixes within a regiontend to evolve slowly, this sug-gests a role for governmentintervention in supportingprojects likely to increase theshare of rural county jobs requir-ing college degrees.
This intervention could takeseveral forms. Programs thatprovide support for entrepreneur-ial start-up firms, such as busi-ness incubator support or finan-cial assistance, are one pathwayfor potentially increasing theability of rural counties to retainor attract college graduates.
Another potential means ofassistance would be givingmodest preferences in the com-petitive bidding processes forstate contracts to rural start-upfirms that are more intensivelyusing college graduates.
Lastly, the various rankings ofrural counties against one another
The Center for Rural Pennsylvania 38 Studies on Unemployment and Underemployment in Rural Pennsylvania
on the multiple measures of labormarket outcomes can be used bypolicy makers to identify thosecounties most likely to benefitfrom the discussed governmentpolicy interventions. Should
REFERENCESBollinger, C.R, P. Coomes, and M. Berger. 2003 “Measuring Underemployment at
the County Level” Working Paper.
Hamrick, K.S. 1997, “Rural Labor Markets Often Lead Urban Markets in Reces-sions and Expansions.” Rural Development Perspectives, 12(3).
Isserman, A., and T. Rephann. 1993. “Geographical and Gender Differences inLabor Force Participation: Is There an Appalachian Effect?” Growth and Change24 (Fall): 539-578.
Jensen, L., J. Findeis, Q. Wang. 1999. “Labor Supply and Underemployment in theSouthern United States.” Paper for Southern Regional Science Association, April16, 1999, Richmond, VA.
Price, M. and H. Wial. 2005. “Underemployment in Appalachia and the Rest of theUnited States, 1996-2004.” Keystone Research Center, Harrisburg, PA.
smaller-scale pilot projects beenacted, these rankings providevaluable guidance regardingwhere within rural Pennsylvaniato first concentrate the proposedproject’s resources.

The Center for Rural Pennsylvania200 North Third St., Suite 600Harrisburg, PA 17101Phone: (717) 787-9555Fax: (717) 772-3587www.ruralpa.org1P0309 – 450
Senator John R. GordnerChairman
Representative Tina PickettVice Chairman
Senator John WozniakTreasurer
Dr. Nancy FalvoClarion University
Secretary
Representative Tim Seip
Dr. Theodore R. AlterPennsylvania State University
Steve CrawfordGovernor’s Representative
Dr. Stephan J. GoetzNortheast Regional Center for Rural Development
Dr. Keith T. MillerLock Haven University
Dr. Robert F. PackUniversity of Pittsburgh
William SturgesGovernor’s Representative
The Center for Rural PennsylvaniaBoard of Directors