Embed Size (px)
Citation preview

134
6
Research DesignsiStock.com/Avalon_Studio
Copyright ©2020 by SAGE Publications, Inc. This work may not be reproduced or distributed in any form or by any means without express written permission of the publisher.
Do not
copy
, pos
t, or d
istrib
ute

Chapter 6 • Research Designs 135
Chapter OutlineOverviewLearning ObjectivesObservational Designs
Cross-sectional DesignsLongitudinal Designs
Causal DesignsNonexperimental DesignsExperimental DesignsQuasi-experimental DesignsDesign Variations
Key Points
Learning ObjectivesAfter studying Chapter 6, the reader should be able to:
• Distinguish between observational and causal research designs
• Classify causal research designs as nonexperimental, experimental, or quasi-experimental
• Draw and interpret a research design diagram
• Assess strengths and weaknesses of a research design
• Apply design variations to enhance validity and efficiency
Overview
Research is conducted for many purposes, such as
• describing one or more populations at a particular point in time,
• exploring relationships among variables,
• identifying factors that account for differences across populations,
• monitoring stability/change within and across populations over time, and
• assessing causal relationships to evaluate the impact of interventions.
Moreover, factors such as the types of research participants, timing, conditions, key variables, and resources vary widely across studies. Typically, it is not adequate simply to plan a study by choosing from a menu of designs in a book or an online source. A research design often must be custom-fit to a study’s purpose and circumstances. The way a design is structured and imple-mented directly influences the validity of results. Therefore, it is essential to understand how to combine, modify, and deploy design most effectively.
Copyright ©2020 by SAGE Publications, Inc. This work may not be reproduced or distributed in any form or by any means without express written permission of the publisher.
Do not
copy
, pos
t, or d
istrib
ute

136 Conducting Health Research
Observational DesignsObservational designs are used to observe populations under prevailing conditions to describe key characteristics and relationships. They are not appropriate for assessing cau-sality because they do not involve introducing or modifying a treatment. Thus, observa-tional design diagrams do not include an “X” symbol. The designs may include one or more populations, and one or more observation points. Observations may be compared across populations and/or within populations over time. When an observational design includes more than one group, participants are not randomly assigned to groups. They
are studied as representatives of the populations of which they already are members. A major con-cern about validity of observational designs is how well participants represent the target population(s). Random sampling procedures (Chapter 7) generally provide the most representative and trustworthy samples.
Cross-sectional DesignsCross-sectional designs collect data from or about one or more populations at one obser-
vation point (O). Although the primary focus of most cross-sectional studies is to measure participants’ current status on variables such as health knowledge and beliefs, and health-related behaviors, they may collect retrospective measures, such as health history and past behavior, as well.
Box 6.1 depicts the one-group cross-sectional design, which is the most common obser-vational design. To indicate whether participants are selected as a random or nonrandom sample, the symbols “RS” and “NR,” respectively, may be inserted to the left of the observa-tion point. Thus, the design would be represented as “RS O.” Another option is to insert a time-frame label above the observation point to indicate when data are collected. Examples of research questions that might be addressed using a cross-sectional design are as follows:
• What proportion of the children under age 6 in the Uptown community currently are not up-to-date on their immunization schedule?
• What is the current knowledge about risk factors for heart disease among African American men age 40 and older in the North Lawndale community?
Key Concept
Observational designs observe populations under prevailing conditions.
BOX 6.1: ONE-GROUP CROSS-SECTIONAL DESIGN
O
The one-group cross-sectional design often is referred to as a survey design, which is an unfortunate misnomer for three reasons. First, although survey methods (Chapter 12) often are employed with this design, a survey itself is not a research design. A survey is a method for collecting data through self-reports in a standardized format. Second, the application of survey methods is not restricted to a cross-sectional design. Third, data for a cross-sectional design may be collected by methods other than a survey, such as focus groups, unstructured interviews, nonparticipant observation, and records review.
A multiple-group cross-sectional design collects data from two or more populations at the same observation point to make comparisons across populations. Box 6.2 depicts an
Copyright ©2020 by SAGE Publications, Inc. This work may not be reproduced or distributed in any form or by any means without express written permission of the publisher.
Do not
copy
, pos
t, or d
istrib
ute

Chapter 6 • Research Designs 137
example that includes three groups/populations. The dashed horizontal line indicates par-ticipants are from different groups/populations.
BOX 6.2: MULTIPLE-GROUP CROSS-SECTIONAL DESIGN
O
- - -
O
- - -
O
BOX 6.3: TREND STUDY DESIGN
Wave 1 Wave 2 Wave 3
O
O
O
Note: Waves may also be identified by date.
Longitudinal DesignsLongitudinal designs involve collecting data from or about one or more populations at
multiple observation points, typically called “waves.” They are employed to study varia-tion in variables and relationships under prevailing conditions over a specific time period. Although it is not essential, typically observation intervals are equal, such as every six months or annually. The expected rate of change for key variables is the primary factor that determines observation points. When change is expected to occur more often, observation intervals should be relatively short, and vice versa. Longitudinal designs are expensive, time-consuming, and logistically challenging.
Trend study (sequential cross-sectional design)
A trend study design, depicted in Box 6.3, is used to monitor a population over time and obtain up-to-date profiles regarding certain characteristics, such as health status and health behaviors. Such data are useful for identifying emerging health problems and track-ing progress toward health policy objectives. An example of a research question that might be addressed using a trend study design is as follows:
Over the next five years, will the proportion of women aged 20–25 who regularly smoke cigarettes decrease, stay about the same, or increase?
A trend study design comprises a series of cross-sectional studies with separate samples selected from the same population at each observation point. In most cases, samples are
Copyright ©2020 by SAGE Publications, Inc. This work may not be reproduced or distributed in any form or by any means without express written permission of the publisher.
Do not
copy
, pos
t, or d
istrib
ute

138 Conducting Health Research
selected randomly, which generally is the preferred method. The key feature of this design is that selecting a new sample at each wave adjusts for changes in population composition between waves, such as becoming younger or older overall, owing to some members leav-ing it (e.g., out-migration or death) and others entering it (e.g., in-migration or birth). By collecting data from separate samples, the results are not vulnerable to attrition bias or a testing effect (Chapter 5). However, strategies should be employed to avoid an instrumenta-tion effect.
Box 6.4 presents an example of a trend study.
BOX 6.4: EXAMPLE OF A TREND STUDY
U.S. NATIONAL HEALTH INTERVIEW SURVEY
The National Health Interview Survey (NHIS) has been conducted annually since 1957 by the Centers for Disease Control and Prevention to monitor the health of the U.S. civilian noninstitutionalized population on a broad range of health-related topics. The surveys are conducted by trained interviewers during in-person household interviews (Chapter 12). Information is collected continuously throughout each year about approximately 87,500 individuals of all ages, from approximately 35,000 households. The data track changes in health status, health behaviors, and health care utilization. Results are analyzed to iden-tify health trends, evaluate health policies and programs, and monitor progress toward achieving national health objectives.
Source: Centers for Disease Control and Prevention. (2018e). National Health Interview Survey. Retrieved from https://www.cdc.gov/nchs/nhis/index.htm
BOX 6.5: PANEL STUDY DESIGN
Wave 1 Wave 2 Wave 3
O O O
Panel study
A panel study design comprises a series of observations from or about the same par-ticipants, called “the panel,” at multiple points, as depicted in Box 6.5. Repeated obser-vations of the same participants provide insight to the dynamics of change. For instance, while a trend study might indicate that the prevalence of engaging in regular physical activity has changed at the population level, it is difficult to specify the factors (e.g., demographic characteristics, health knowledge, and health beliefs) that might account for the change in different individuals who are observed at each point. However, panel data may be analyzed at the individual level, and the order of change among variables may be specified within the same individuals across observation points. For example, it might be observed that individuals whose knowledge changes at one point change their behavior at a subsequent point.
In particular, a panel design is useful for studying health issues over the life course as related to factors such as life events, technological developments, and policy changes.
Copyright ©2020 by SAGE Publications, Inc. This work may not be reproduced or distributed in any form or by any means without express written permission of the publisher.
Do not
copy
, pos
t, or d
istrib
ute

Chapter 6 • Research Designs 139
An example of a research question that might be addressed using a panel study design is as follows:
How does internet use for obtaining health-related information vary over the course of a calendar year? (To investigate this question, the observation intervals might be monthly.)
By collecting repeated observations from the same individuals, differences across waves are not confounded with changes in population composition as they would be for a trend study. However, a panel increasingly is likely to become unrepresentative of the population owing to several factors. First, a basic panel study design does not adjust for changes in population composition. Second, even if the population is relatively stable, the panel will age. For example, suppose the mean (arithmetic average) age of both the population and a random sample (the panel) of adults is 35 at wave 1. Five years later, the panel’s mean age would be 40 while the population’s mean age still might be 35. Third, panel studies are highly vulnerable to attrition bias (Chapter 5) when individuals are asked to partici-pate repeatedly in the same data collection activities. Moreover, loss of participants across waves presents analytical issues regarding missing data and reduces analytical power (Chapter 15). In addition to strategies described in Chapter 5 for addressing attrition, those issues may be addressed by refreshing a panel, which is called “panel maintenance,” whereby supplemental samples are selected to update a panel’s representativeness and maintain analytical power (Stafford, 2010). Panel studies also may be influenced by testing effects, called “panel conditioning,” and instrumentation effects (Chapter 5).
Box 6.6 presents an example of a panel study.
BOX 6.6: EXAMPLE OF A PANEL STUDY
NURSES’ HEALTH STUDIES
The Nurses’ Health Studies (NHS), initiated in 1976 and now in their third generation, have collected biennial data to repeatedly assess health and lifestyle factors from a total of more than 280,000 participants. In addition, data about special topics are collected from sub-groups of participants. NHS began as a prospective cohort study of 121,700 married reg-istered nurses. NHS II was launched in 1989 and enrolled 116,430 nurses; NHS3 began in 2010 and has ongoing enrollment (Bao et al., 2016). The range of lifestyle and health out-come data collected has increased over time. In addition to data collected by questionnaires, the study has collected biological specimens. Results have made significant contributions to health policy and practice, especially regarding chronic diseases in women.
Source: Nurses’ Health Study. (2018). Retrieved from http://www.nurseshealthstudy.org/
CHECK YOUR UNDERSTANDING 6.1
•• Under what conditions and for what reasons would a trend study be preferred instead of a panel study?
•• Under what conditions and for what reasons would a panel study be preferred instead of a trend study?
Copyright ©2020 by SAGE Publications, Inc. This work may not be reproduced or distributed in any form or by any means without express written permission of the publisher.
Do not
copy
, pos
t, or d
istrib
ute

140 Conducting Health Research
Causal DesignsCausal designs assess whether an independent variable (treatment) causes change in a dependent variable (outcome). This section presents three types of causal designs:
• Nonexperimental
• Experimental
• Quasi-experimental
Although nonexperimental designs are vulnerable to substantial internal valid-ity threats, they are presented under the “Causal Designs” heading for two reasons.
First, sometimes they are employed in practice set-tings, where employing an experimental or quasi- experimental design is not feasible. Second, under-standing the limitations of nonexperimental designs provides insight to the advantages of experimental and quasi-experimental designs. In general, experi-mental designs are preferred for assessing causality. Quasi-experimental designs are employed in situations where random assignment to groups is not feasible.
Nonexperimental DesignsA nonexperimental design (also called “preexperimental”) does not include a con-
trol group, or it includes a control group without random assignment and without a pretest observation point. Typically, nonexperimental designs are employed in situations where it is not feasible to include a control group or when evaluating a program that already is under way and a pretest observation is not possible.
One-group posttest-only design
Also called the “one-shot case study design,” the one-group posttest-only design is depicted in Box 6.7. Although it appears similar to the cross-sectional observational design (Box 6.1), it differs in that it includes a treatment (X) that is followed by a posttest observa-tion (O). For example, a college might require students during their first term to complete a web-based relationship abuse prevention course and then measure their knowledge, atti-tudes, and behavior related to that issue.
Key Concept
Causal designs assess whether an independent variable (treatment) causes change in a dependent variable (outcome).
BOX 6.7: ONE-GROUP POSTTEST-ONLY DESIGN
X O
This design might be appealing because five of the seven design threats to internal valid-ity (Chapter 5) do not apply, as summarized below:
• Nonequivalent groups—there is only one group.
• Attrition, testing, and instrumentation—there is only one observation point.
• Regression toward the norm—there is no pretest to select atypical participants.
Copyright ©2020 by SAGE Publications, Inc. This work may not be reproduced or distributed in any form or by any means without express written permission of the publisher.
Do not
copy
, pos
t, or d
istrib
ute

Chapter 6 • Research Designs 141
However, the design does not include a pretest observation to assess whether there is a difference in participants’ pretest versus posttest status. Also, it does not include a control group to simulate the counterfactual model (Chapter 5). Thus, this design provides no means to assess whether the treatment is effective. Moreover, it is vulner-able to history and maturation threats. For example, it would not be possible to know if students’ knowledge, attitudes, or behavior changed after completing an abuse pre-vention course. If they generally score high on such factors at the posttest observation point, it would not be known whether their status is attributable to the course or a history or maturation effect, or if that was their status prior to taking the course and it did not change.
One-group pretest–posttest design
The one-group pretest–posttest design depicted in Box 6.8 adds a pretest observation to the one-group posttest-only design. The pretest enables assessing whether participants change regarding the dependent variable after being exposed to a treatment. When ana-lyzing results for the one-group pretest–posttest design, participants are considered as serving as their own controls. The underlying logic is that the pretest observation provides an estimate of their posttest status under the counterfactual model, whereby they would not have been exposed to a treatment. That assumption is more tenable the shorter the pretest–posttest interval, during which results might be influenced by history, matura-tion, attrition, instrumentation, or regression toward the norm. However, as the pretest–posttest interval becomes shorter, the threat of a testing effect generally increases.
BOX 6.8: ONE-GROUP PRETEST–POSTTEST DESIGN
O X O
Comparing the one-group pretest–posttest design with the one-group posttest-only design provides a striking illustration of how a single modification may significantly impact a design’s internal validity. Adding one design component, a pretest observation, enhances information about the treatment group’s posttreatment change. However, it also increases the number of internal validity threats. First, the one-group posttest-only design still is vulnerable to history and maturation because there is no control group to assess poten-tial change in absence of a treatment. Moreover, adding a pretest observation extends the study period, which may exacerbate the history and maturation threats. In addition, a pretest observation makes the design vulnerable to attrition, testing, and instrumentation. If participants are selected based on atypical pretest scores, the design may be vulnerable to regression toward the norm. Without a control group, the design is not vulnerable to a nonequivalent-groups threat. However, there is no reliable means for assessing the influ-ence of the six other internal validity threats:
• History
• Maturation
• Attrition
• Testing
• Instrumentation
• Regression toward the norm
Copyright ©2020 by SAGE Publications, Inc. This work may not be reproduced or distributed in any form or by any means without express written permission of the publisher.
Do not
copy
, pos
t, or d
istrib
ute

142 Conducting Health Research
It is important to be mindful that being vulnerable to an internal validity threat does not mean the threat necessarily influences a study’s result. Nevertheless, if a threat cannot be ruled out, its potential impact always must be taken into consideration when interpreting a study’s result.
Nonequivalent-groups posttest-only design
Box 6.9 depicts the nonequivalent-groups posttest-only design, also called the “static-group comparison design” and the “ex post facto design” (derived from Latin meaning “after the fact”). In contrast with the one-group posttest-only design, this design adds a control group without random assignment. The dashed horizontal line indicates partici-pants are from different groups/populations or are different subsets of the same popula-tion. This design often compares intact groups selected based on similarity in their overall characteristics. For example, the control group for an evaluation of a relationship abuse prevention course might be students at a college where the course is not available, and that is similar in terms of factors such as student demographic characteristics and college size and location. However, without a pretest observation about relationship abuse knowledge, attitudes, and behavior, preexisting group differences on those variables could not be taken into account. Thus, it would not be possible to reliably attribute any posttest differences to treatment exposure.
BOX 6.9: NONEQUIVALENT-GROUPS POSTTEST-ONLY DESIGN
X O
- - - - - - - - - - - - - - - - - - - - - - - - - - - - - - - - - - - - - - - - - - - - - - - - -
O
CHECK YOUR UNDERSTANDING 6.2
•• The one-group pretest–posttest design may be viewed as adding a pretest observation point to the one-group posttest-only design. Explain how adding a pretest observation point
{{ enhances the one-group pretest–posttest design in comparison with the one-group posttest-only design, and
{{ introduces additional internal validity threats to the one-group pretest–posttest design. Be specific about which internal validity threats are introduced, and explain why.
The nonequivalent-groups posttest-only design is not vulnerable to attrition, testing, instrumentation, or regression to the norm because it includes only one observation point. Ironically, although the purpose for adding a control group is to assess the potential influ-ence of history and maturation, that addition actually might exacerbate those threats. That could occur if the two groups do not experience and react to history and/or maturation factors similarly. Thus, as the design’s name implies, nonequivalent groups is the main internal validity threat to this design.
Copyright ©2020 by SAGE Publications, Inc. This work may not be reproduced or distributed in any form or by any means without express written permission of the publisher.
Do not
copy
, pos
t, or d
istrib
ute

Chapter 6 • Research Designs 143
Experimental DesignsExperimental designs, sometimes called “true
experimental designs,” include two key features: a control group and random assignment. As discussed in Chapter 5, those design features address most internal validity threats and provide the strongest foundation for ruling out alternative explanations for a treatment effect.
Pretest–posttest control group design
Box 6.10 depicts the pretest–posttest control group design, which also is called the “clas-sical experimental design” and “randomized controlled trial (RCT).” It comprises two groups to which participants are randomly assigned (RA, which may be omitted as understood in some contexts). The treatment group is exposed to an experimental treatment (X), while the control group is not exposed to the treatment. The control group may be assigned to a no-treat-ment condition, an alternative-treatment condition, or a placebo condition (Chapter 5). Pretest and posttest observations (O) are made for both groups at the same time points.
Key Concept
An experimental design includes a control group and random assignment.
BOX 6.10: PRETEST–POSTTEST CONTROL GROUP DESIGN
RA O X O
RA O O
The pretest–posttest control group design generally is regarded as the gold standard causal design because it provides strong protection against internal validity threats. Random assignment (Chapter 7) minimizes initial group differences, which addresses the nonequivalent- groups threat. Moreover, although randomly assigned groups are not identical as in the counterfactual model, group differences are not systematic. Instead, they are attributable to an unbiased random process and may be taken into account by applying inferential analysis procedures (Chapter 15). Furthermore, with random assignment, any effect on the dependent variable from other internal validity threats (history, maturation, attrition, testing, instrumentation, or regression toward the norm) will be experienced similarly by all participants regardless of the condition to which they are assigned. Therefore, any post-test difference between groups is most likely attributable to a treatment effect. However, the pretest–posttest control group design is vulnerable to an interaction between testing and treatment exposure that might cause the treatment group’s posttest observation to differ from what it would be in absence of a pretest. For example, a pretest prior to completing a relationship abuse prevention course might increase students’ concern about the issue and cause treatment participants to be more attentive and responsive to the course than they would be otherwise.
Box 6.11 presents an example of a study that used a pretest–posttest control group design.
Posttest-only control group design
The simplest strategy for addressing a potential testing × treatment interaction is to omit the pretest observation and employ the posttest-only control group design, depicted in Box 6.12. Moreover, this design is less expensive, requires less time, and is logistically sim-pler than the pretest–posttest control group design. Indeed, it is the simplest experimental design, yet it is very effective.
Copyright ©2020 by SAGE Publications, Inc. This work may not be reproduced or distributed in any form or by any means without express written permission of the publisher.
Do not
copy
, pos
t, or d
istrib
ute

144 Conducting Health Research
BOX 6.11: EXAMPLE OF A PRETEST–POSTTEST CONTROL GROUP DESIGN STUDY
THE EFFECT OF A COUPLES INTERVENTION TO INCREASE BREAST CANCER SCREENING AMONG KOREAN AMERICANS
Lee et al. (2014) (see Box 4.6) employed the following pretest–posttest control group design:
6 mos. 15 mos.
RA O X O O
RA O AP O O
Couples were randomly assigned to intervention (X) or attention-placebo (AP) control conditions. The treatment and attention-placebo conditions were employed immediately following the pretest observation. Posttest observations were made at six and fifteen months postintervention.
BOX 6.12: POSTTEST-ONLY CONTROL GROUP DESIGN
RA X O
RA O
The main concern about omitting a pretest observation is that it excludes performing a randomization check to verify group similarity, such as applying a t test for differences in mean age across groups. However, a randomization check is necessary only when the number of participants is small and random variation may result in substantial group dif-ferences. The key to employing the posttest-only control group design is to include a large number of participants to increase confidence that any pretreatment differences are triv-ial (Chapter 7). Furthermore, pretreatment group differences may be taken into account by inferential analysis procedures to assess whether posttest differences are larger than expected owing to random assignment. When differences exceed that expectation, they are deemed to be statistically significant, and it may be concluded within a certain margin of error (called type I or alpha error; Chapters 7 and 15) that the difference most likely is attributable to treatment exposure.
Solomon four-group design
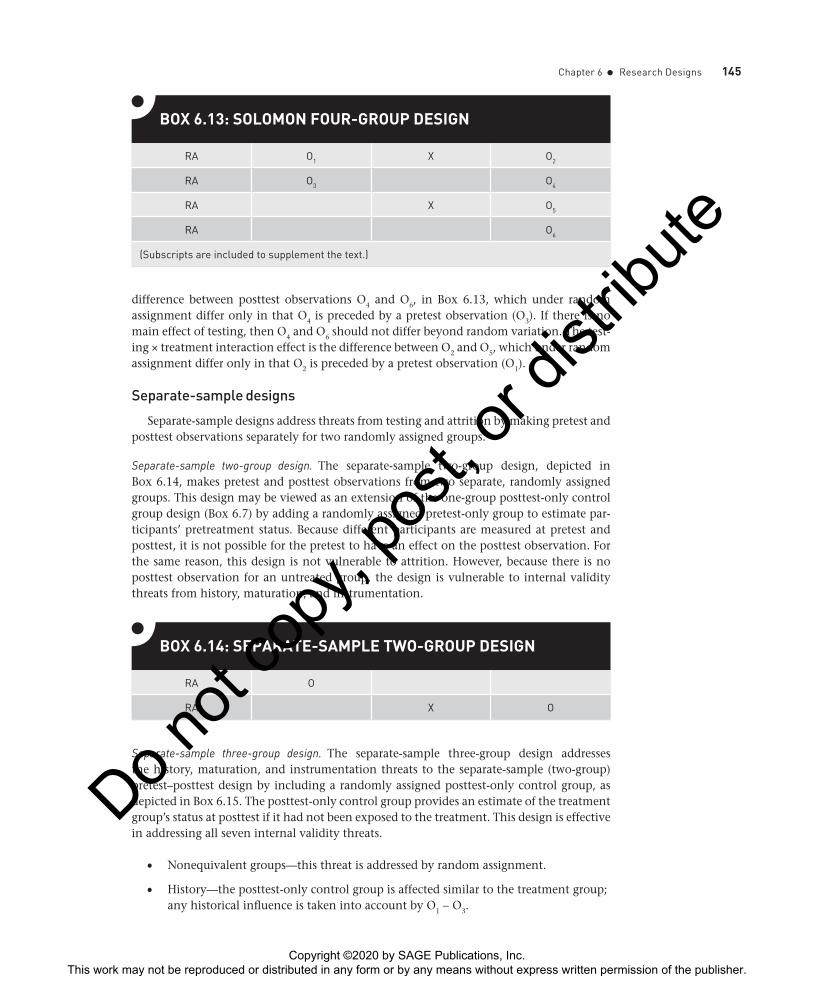
Another experimental design that addresses a potential testing × treatment interaction is the Solomon four-group design. As presented in Box 6.13, it combines the pretest–posttest control group and the posttest-only control group designs. Because the Solomon four-group design is expensive and logistically challenging to implement, it is reasonable to employ it only when it is important to assess participants’ pretreatment status on the dependent variable and the threat of a testing × treatment interaction is substantial.
This design enables measuring the testing “main effect” and the testing × treatment interaction effect. The testing main effect (without interacting with the treatment) is the
Copyright ©2020 by SAGE Publications, Inc. This work may not be reproduced or distributed in any form or by any means without express written permission of the publisher.
Do not
copy
, pos
t, or d
istrib
ute
Chapter 6 • Research Designs 145
difference between posttest observations O4 and O6, in Box 6.13, which under random assignment differ only in that O4 is preceded by a pretest observation (O3). If there is no main effect of testing, then O4 and O6 should not differ beyond random variation. The test-ing × treatment interaction effect is the difference between O2 and O5, which under random assignment differ only in that O2 is preceded by a pretest observation (O1).
Separate-sample designs
Separate-sample designs address threats from testing and attrition by making pretest and posttest observations separately for two randomly assigned groups.
Separate-sample two-group design. The separate-sample two-group design, depicted in Box 6.14, makes pretest and posttest observations from two separate, randomly assigned groups. This design may be viewed as an extension of the one-group posttest-only control group design (Box 6.7) by adding a randomly assigned pretest-only group to estimate par-ticipants’ pretreatment status. Because different participants are measured at pretest and posttest, it is not possible for the pretest to have an effect on the posttest observation. For the same reason, this design is not vulnerable to attrition. However, because there is no posttest observation for an untreated group, the design is vulnerable to internal validity threats from history, maturation, and instrumentation.
BOX 6.13: SOLOMON FOUR-GROUP DESIGN
RA O1 X O2
RA O3 O4
RA X O5
RA O6
(Subscripts are included to supplement the text.)
BOX 6.14: SEPARATE-SAMPLE TWO-GROUP DESIGN
RA O
RA X O
Separate-sample three-group design. The separate-sample three-group design addresses the history, maturation, and instrumentation threats to the separate-sample (two-group) pretest–posttest design by including a randomly assigned posttest-only control group, as depicted in Box 6.15. The posttest-only control group provides an estimate of the treatment group’s status at posttest if it had not been exposed to the treatment. This design is effective in addressing all seven internal validity threats.
• Nonequivalent groups—this threat is addressed by random assignment.
• History—the posttest-only control group is affected similar to the treatment group; any historical influence is taken into account by O1 − O3.
Copyright ©2020 by SAGE Publications, Inc. This work may not be reproduced or distributed in any form or by any means without express written permission of the publisher.
Do not
copy
, pos
t, or d
istrib
ute

146 Conducting Health Research
• Maturation—the posttest-only control group is affected similar to the treatment group; any maturational influence is taken into account by O1 − O3.
• Attrition—no group is measured more than once.
• Testing—no group is measured more than once.
• Instrumentation—the posttest-only control group is affected similar to the treatment group; any instrumentation influence is taken into account by O1 − O3.
• Regression toward the norm—if atypical participants are studied, the posttest-only control group will regress similar to the treatment group; any regression influence is taken into account by O1 − O3.
BOX 6.15: SEPARATE-SAMPLE THREE-GROUP DESIGN
RA O1
RA X O2
RA O3
Key Concept
Quasi-experimental designs assess causality when it is not feasible to employ random assignment or include a control group.
The separate-sample three-group design measures the treatment effect in two ways: O2 − O1 is the pretest–posttest difference; O2 − O3 is the posttest difference. Moreover, this design is much less expensive and more feasible to implement than the Solomon four-group design, and it is only slightly more expensive and challenging to implement than the separate-sample (two-group) pretest–posttest design.
CHECK YOUR UNDERSTANDING 6.3
•• What are the two key features of an experimental research design? Explain how each one enhances internal validity.
Quasi-experimental DesignsQuasi-experimental designs assess causality
when it is not feasible to employ random assignment or include a control group. They use other strategies to address internal validity threats and rule out alter-native explanations of a potential treatment effect. Although they are not as strong as experimental designs, they may be effective when research is con-ducted in real-world practice settings.
Nonequivalent pretest–posttest control group design
Box 6.16 depicts the nonequivalent pretest–posttest control group design. It is similar to the pretest–posttest control group design except random assignment is not employed, as is indicated by a dashed horizontal line between groups. As discussed previously, having
Copyright ©2020 by SAGE Publications, Inc. This work may not be reproduced or distributed in any form or by any means without express written permission of the publisher.
Do not
copy
, pos
t, or d
istrib
ute

Chapter 6 • Research Designs 147
nonequivalent groups renders a design vulnerable to all internal validity threats because it is difficult to determine whether posttest differences are attributable to a treatment effect or preexisting group differences. The effectiveness of this design is maximized by select-ing groups that are as similar as possible so they will experience and respond similarly to extraneous influences. In contrast with the nonequivalent-groups posttest-only design (Box 6.9), this design adds pretest observations to assess preexisting group differences.
BOX 6.16: NONEQUIVALENT PRETEST–POSTTEST CONTROL GROUP DESIGN
O X O
- - - - - - - - - - - - - - - - - - - - - - - - - - - - - - - - - - - - - - - - - - - - - - - - - - - - -
O O
BOX 6.17: NONEQUIVALENT PRETEST–POSTTEST CONTROL GROUP WITH MULTIPLE PRETESTS DESIGN
O O O X O
- - - - - - - - - - - - - - - - - - - - - - - - - - - - - - - - - - - - - - - - - - - - - - - - - - - - - - - - - - -
O O O O
When feasible, this design may be enhanced by including multiple pretest observations to describe any within-group trends in the dependent variable that might be misinterpreted as a treatment effect. Box 6.17 depicts an example of that strategy, where three pretest observation points are represented for illustrative purposes. However, adding pretest obser-vations might increase the likelihood of threats from testing, instrumentation, attrition, and regression toward the norm. In addition, it is expensive and logistically challenging.
Interrupted time-series designs
Interrupted time-series designs comprise a series of observations of the dependent variable that is interrupted by a treatment. Alternatively, such designs may be viewed as comprising both multiple pretest and posttest observations. The number and timing of observations depend on the nature of the dependent variable. A discontinuity in the pattern of a treatment group’s pretreatment status that coincides with treatment exposure most likely may be attributed to a treatment effect. Multiple pretest observations are employed to identify any pretreatment trend in the dependent variable that might be misinterpreted as a treatment effect. Multiple posttest observations assess whether a posttreatment change endures as would be expected according to the nature of the dependent variable and the conceptual approach on which the treatment is based. However, including multiple obser-vations is expensive and logistically challenging.
Box 6.18 includes three pretest and posttest observation points for illustrative purposes. The top panel depicts the one-group interrupted time-series design. As with the one-group pretest–posttest design (Box 6.8), the analysis of results for the one-group interrupted time-series design considers participants as serving as their own controls. The validity of that
Copyright ©2020 by SAGE Publications, Inc. This work may not be reproduced or distributed in any form or by any means without express written permission of the publisher.
Do not
copy
, pos
t, or d
istrib
ute

148 Conducting Health Research
approach is enhanced by monitoring participants’ pretreatment status over multiple pre-test observation points to provide a more reliable estimate of their posttest status under the counterfactual model. However, adding multiple pretest observations increases the likeli-hood of threats from testing, instrumentation, and attrition. Those threats are reduced by adding a nonequivalent control group to create the nonequivalent control group inter-rupted time-series design, which is depicted in the bottom panel of Box 6.18. Moreover, the multiple pretest observations enhance the validity of comparing the treatment group to the nonequivalent control group.
Figure 6.1 illustrates how results from the nonequivalent control group interrupted time-series design might indicate a treatment effect. Suppose alcoholic beverage consump-tion by new students at two similar colleges is assessed in terms of a risky behavior scale every week, six weeks before and after they are exposed to a responsible drinking program. During the six-week pretest observation period, risky behavior at both colleges increases similarly. However, while that trend continues among the control group, it is disrupted among the treatment group and declines during the six-week posttest period. If the one-group design were employed instead of the two-group design, results would be represented only by the treatment group trend line. Although a discontinuity still would be observed, there is less confidence in attributing the change to a treatment effect in absence of a con-trol group comparison. For instance, the discontinuity might coincide with a history effect,
BOX 6.18: INTERRUPTED TIME-SERIES DESIGNS
One-Group Interrupted Time-Series Design
O O O X O O O
Nonequivalent Control Group Interrupted Time-Series Design
O O O X O O O
- - - - - - - - - - - - - - - - - - - - - - - - - - - - - - - - - - - - - - - - -
O O O O O O
FIGURE 6.1 ● Nonequivalent Control Group Interrupted Time-Series Example
10987654321
1 2 3 4 5 6 7Week
Ris
ky B
ehav
ior
Scal
e
8 9 10 11 12 13
Treatment Group Control GroupTreatment Implementation
Copyright ©2020 by SAGE Publications, Inc. This work may not be reproduced or distributed in any form or by any means without express written permission of the publisher.
Do not
copy
, pos
t, or d
istrib
ute

Chapter 6 • Research Designs 149
such as a media report about a tragic outcome associated with alcoholic beverage consump-tion at another college.
Case-control design
Sometimes a study is conducted to identify the cause of a change in an independent variable that already has occurred. An example is to identify the cause of a disparity in the prevalence of low birth weight pregnancy outcomes across different groups of women. Another example is to assess whether a particular adverse health outcome is attributable to a supposed cause, such as whether childhood cognitive development is impaired by exposure to lead-contaminated drinking water. The case-control design often is employed in such situations, especially by epidemiologists, to identify the primary factor(s) that caused one group, called cases, to experi-ence a particular adverse outcome while a similar group, called controls, did not experience it.
The case-control design sometimes is referred to as an “analytical design.” In contrast with the causal designs discussed previously, the case-control design does not implement a treat-ment. Instead, observations (e.g., records review and/or interviews) are collected retrospec-tively to assess differential exposure to potential causal factors that might account for why a certain outcome occurred among the cases but not the controls. In addition, this design may identify factors that might be protective against an adverse outcome. That is, it may identify factors whose presence or absence might account for why controls did not experience it. As depicted in Box 6.19, the case-control design is similar to the nonequivalent groups posttest-only design (Box 6.9), except the observations are retrospective in an attempt to identify the presence and absence of factors that account for the case-control difference.
BOX 6.19: CASE-CONTROL DESIGN
Cases X O
- - - - - - - - - - - - - - - - - - - - - - - - - - - - - - - - - - - - - - - - -
Controls O
It is not feasible or ethical to randomly assign which participants will or will not experi-ence an adverse health outcome. Therefore, cases and controls are nonequivalent groups. The key to implementing a case-control design is to select cases and controls that are as similar as possible in all respects other than having been exposed to the supposed causal factor(s). Typically, participants are selected using a matching strategy (Chapter 7). Matching cases and controls is fairly straightforward when a study is focused on a single supposed cause, such as to assess the effect of exposure to lead-contaminated drinking water. However, it is challenging to specify the appropriate matching characteristics when the full range of likely causes is not identifiable in advance, such as for a study about a dis-parity in the prevalence of adverse pregnancy outcomes.
Cohort studies
Instead of studying a sample of the general population, sometimes a research question focuses on a cohort, which is a group that shares an event-based characteristic that usually is anchored at some time point, such as date of
• birth,
• entry into college,
Copyright ©2020 by SAGE Publications, Inc. This work may not be reproduced or distributed in any form or by any means without express written permission of the publisher.
Do not
copy
, pos
t, or d
istrib
ute

150 Conducting Health Research
• marriage,
• delivering first live birth,
• diagnosis, or
• retirement.
Cohorts often are employed to study patterns of relationships prospectively over rela-tively long time periods. Cohorts also are employed when it is not feasible to randomly assign participants to experience a particular event, such as an infectious disease diagnosis, because it already has occurred or it would not be ethical. In most situations, the timing of the defining event is specified as having occurred during a particular year or range of years. Observations for a cohort study may be collected prospectively or retrospectively.
Typically, a cohort study collects multiple observations from or about one or more cohorts, and may be conducted using various research designs. For example, using a panel study (Box 6.5) approach, children born during a certain year (a birth cohort) might be monitored from birth through age 20 to identify risk factors for adolescent obesity. In other situations, cohorts might be compared using a nonequivalent con-trol group approach. For example, instead of, or in addition to, assessing the effect of a responsible drinking program at one college by comparing alcoholic beverage con-sumption at a similar college, a comparison might be made at the treatment college between the treated cohort of first-year students and the preceding untreated cohort of first-year students. Using that approach, college type and location would be con-trolled more effectively by comparing cohorts at the same college. However, it would be vulnerable to a history threat. Therefore, when feasible, making both comparisons would be most effective.
CHECK YOUR UNDERSTANDING 6.4
•• Quasi-experimental research designs may be employed when it is not feasible to employ random assignment or include a control group.
•• Describe some of the strategies that quasi-experimental designs employ to address internal validity threats, and explain the logic underlying each strategy.
Design VariationsStaggered starts
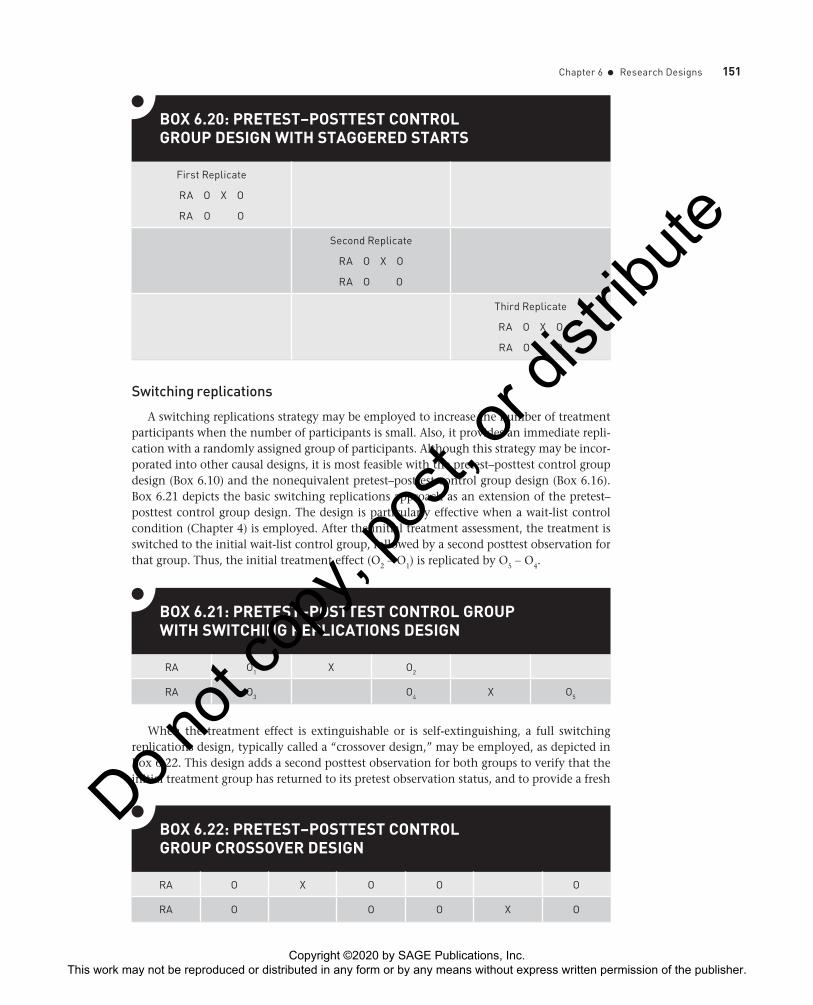
When it is anticipated that a disruptive history event (e.g., a weather-related disaster or civil unrest) might occur during the study period but it is not possible to predict its occur-rence reliably, a design may be partitioned into a series of replicates. This strategy may pre-vent an entire study from being affected by such an event. If an event is highly disruptive of a study’s conditions, the study might be suspended and restarted with any replicates that have not been initiated. Moreover, the replicates may strengthen validity by serving as sep-arate replication studies. A staggered starts strategy may be employed by randomly dividing individual participants into two or more replicate groups, or by designating intact groups of participants (e.g., all students at certain schools) as replicates that are randomly assigned to different starting points. Although staggered starts may be employed with many research designs, Box 6.20 illustrates the strategy for the pretest–posttest control group design (three replicates are depicted for illustrative purposes).
Copyright ©2020 by SAGE Publications, Inc. This work may not be reproduced or distributed in any form or by any means without express written permission of the publisher.
Do not
copy
, pos
t, or d
istrib
ute
Chapter 6 • Research Designs 151
Switching replications
A switching replications strategy may be employed to increase the number of treatment participants when the number of participants is small. Also, it provides an immediate repli-cation with a randomly assigned group of participants. Although this strategy may be incor-porated into other causal designs, it is most feasible with the pretest–posttest control group design (Box 6.10) and the nonequivalent pretest–posttest control group design (Box 6.16). Box 6.21 depicts the basic switching replications approach as an extension of the pretest–posttest control group design. The design is particularly effective when a wait-list control condition (Chapter 4) is employed. After the initial treatment assessment, the treatment is switched to the initial wait-list control group, followed by a second posttest observation for that group. Thus, the initial treatment effect (O2 − O1) is replicated by O5 − O4.
BOX 6.20: PRETEST–POSTTEST CONTROL GROUP DESIGN WITH STAGGERED STARTS
First Replicate
RA O X O
RA O O
Second Replicate
RA O X O
RA O O
Third Replicate
RA O X O
RA O O
BOX 6.21: PRETEST–POSTTEST CONTROL GROUP WITH SWITCHING REPLICATIONS DESIGN
RA O1 X O2
RA O3 O4 X O5
BOX 6.22: PRETEST–POSTTEST CONTROL GROUP CROSSOVER DESIGN
RA O X O O O
RA O O O X O
When the treatment effect is extinguishable or is self-extinguishing, a full switching replications design, typically called a “crossover design,” may be employed, as depicted in Box 6.22. This design adds a second posttest observation for both groups to verify that the initial treatment group has returned to its pretest observation status, and to provide a fresh
Copyright ©2020 by SAGE Publications, Inc. This work may not be reproduced or distributed in any form or by any means without express written permission of the publisher.
Do not
copy
, pos
t, or d
istrib
ute

152 Conducting Health Research
baseline for the initial control group. The timing of the second posttest is determined by when the initial treatment effect is expected to have been extinguished and there will be no or minimal carryover effects from treatment exposure. In some situations, it may be neces-sary to conduct more than one such posttest check. Then group conditions are switched, or participants are said to cross over, such that the initial treatment group becomes the second-round control and the initial (wait-list) control becomes the treatment group.
Counterbalancing
When a treatment includes two or more components and there is no inherent order in which they must be implemented, counterbalancing may be employed to assess the treatment order effect. Counterbalancing randomly assigns equal numbers of treatment participants to receive all components but in different order. For example, Box 6.23 depicts a counterbalanced pretest–posttest control group design for assessing a responsible drinking program for college students that includes two components, an in-person session and an online video. The first order presents the in-person session followed by viewing the online video. The second order is the reverse, viewing the online video first followed by the in-person session.
Key Points
Observational Designs
Observational designs observe one or more populations under prevailing conditions.
One-Group
Cross-Sectional Design
O
Trend Study Design
O
O
O
Panel Study Design
O O O
BOX 6.23: COUNTERBALANCED PRETEST–POSTTEST CONTROL GROUP DESIGN
RA O IP + V O
RA O V + IP O
RA O O
IP: In-person session
V: Video
CHECK YOUR UNDERSTANDING 6.5
•• What is the difference between a “crossover” design and a “counterbalanced” design?
Copyright ©2020 by SAGE Publications, Inc. This work may not be reproduced or distributed in any form or by any means without express written permission of the publisher.
Do not
copy
, pos
t, or d
istrib
ute

Chapter 6 • Research Designs 153
Nonexperimental Designs
Nonexperimental designs do not include a control group, or include a control group without random assign-
ment and a pretest observation point.
One-Group
Posttest-Only Design
X O
One-Group
Pretest–Posttest
Design
O X O
Nonequivalent-Groups
Posttest-Only Design
X O
- - - - - - - - -
O
Experimental Designs
Experimental designs address most internal validity threats by including a control group and random assignment.
Pretest–Posttest
Control Group Design
RA O X O
RA O O
Solomon
Four-Group Design
RA O X O
RA O O
RA O X O
RA O O
Separate-Sample
Three-Group Design
RA O
RA O X O
RA O O
Posttest-Only
Control Group Design
RA O X O
RA O O
Quasi-experimental Designs
Quasi-experimental designs assess causality when it is not feasible to employ random assignment or include a
control group.
Nonequivalent
Pretest–Posttest
Control Group Design
O X O
- - - - - - - - - - -
O O
One-Group
Interrupted Time-Series
Design
O O O X O O O
Nonequivalent Control Group
Interrupted Time-Series
Design
O O O X O O O
- - - - - - - - - - - - - - - - - -
O O O O O O
Copyright ©2020 by SAGE Publications, Inc. This work may not be reproduced or distributed in any form or by any means without express written permission of the publisher.
Do not
copy
, pos
t, or d
istrib
ute

154 Conducting Health Research
Design Variations
• Staggered starts
• Switching replications
• Counterbalancing
Review and Apply
1. Review the research plan you developed in the
“Review and Apply” section of Chapter 1 or 3. If
you did not do that previously, either do it now or
identify a health-related problem that interests you.
a. Briefly describe a treatment that you propose
might improve outcomes for the target
population.
b. Develop a causal research design to assess the
treatment’s effectiveness, and present your
design in a diagram.
c. Consider each potential design threat to
internal validity, and explain why it is or is not
likely to influence results from your design.
d. For each potential design threat that applies,
describe how you would address it in your
study.
e. Would you describe your study as an efficacy
or effectiveness trial? Explain why.
2. Suppose you have been asked to evaluate the
relationship abuse prevention course that was
presented as an example in this chapter. The
research plan will use a nonequivalent pretest–
posttest control group design (see Box 6.16)
to compare pretest and posttest observations
from students who complete the course and
students at a control college. The course must be
implemented during the fall semester. However,
owing to administrative reasons, it is discovered
that data may not be collected at the control
college until spring semester. It is too late to
identify and negotiate access to a substitute
control college. Thus, the research design must
be modified as depicted in the diagram below,
with only a single control group observation at
posttest.
O X O
- - - - - - - - - - - - - - - - - - - - - - - - - - - - - - -
O
In addition to nonequivalent groups, identify the inter-
nal validity threats to this modified design, and describe
how you would take them into consideration when
assessing the study’s results.
3. You have been asked to evaluate an ongoing
health education program that was initiated
two years ago. Describe the research design you
would employ, and assess its internal and external
validity.
4. A county health department in a metropolitan
area will implement a health behavior
intervention program starting six months from
now. Because of ethical and political concerns, the
program will be available to all county residents,
although it is expected that not all residents for
whom the program is appropriate will participate
in it.
a. What research design would you
recommend to evaluate the program’s impact
over the first two years during which it is
provided?
b. Explain why you recommend that design.
c. Assess the design’s internal validity.
d. Assess the design’s external validity.
Copyright ©2020 by SAGE Publications, Inc. This work may not be reproduced or distributed in any form or by any means without express written permission of the publisher.
Do not
copy
, pos
t, or d
istrib
ute

Chapter 6 • Research Designs 155
Study Further
CONSORT. (2010). The CONSORT statement. Retrieved
from http://www.consort-statement.org/ (CONSORT
stands for Consolidated Standards of Reporting Trials.)
Creswell, J. W. (2014). Research design (4th ed.). Los Angeles,
CA: Sage.
Mercer, S. L., De Vinney, B. L., Fine, L. J., Green, L. W.,
& Dougherty, D. (2007). Study designs for effective-
ness and translation research: Identifying trade-offs.
American Journal of Preventive Medicine, 33(2), 139–154.
Shadish, W. R., Cook, T. D., & Campbell, D. T. (2002).
Experimental and quasi-experimental designs for generalized
causal inference. Boston, MA: Houghton Mifflin.
Trochim, W. M. (2006). The research methods knowledge
base (2nd ed.). Available from http://www.socialresearch
methods.net/kb/
Copyright ©2020 by SAGE Publications, Inc. This work may not be reproduced or distributed in any form or by any means without express written permission of the publisher.
Do not
copy
, pos
t, or d
istrib
ute