Embed Size (px)
Citation preview


STUDSVIK NUCLEAR AB STUDSVIK/N-11/130 2012-07-02
Table of contents Page
1 General description of the LOCA apparatus 1
2 Investigating the LOCA test train device 5
2.1 Effect of thermocouple clamp and clamp design on performance, including preventing reaction with the thermocouple (TC) clamp 8
2.2 Comparing welded thermocouples to clamped thermocouples 10
2.3 Axial distribution with welded thermocouples 12
2.4 Circumfrential distribution with welded thermocouples 16
2.5 Thermocouple calibration with oxide measurements 17
2.6 Minimization of gas volume in pressure line and rodlet fabrication design 21
2.7 Verification of the LOCA apparatus performance by testing pressurized, unirradiated cladding 22
3 Investigating the bend test device 25
3.1 Determining the theoretical bending stiffness 27
3.2 Investigating the influence of fuel rod test train components 28
3.3 Benchmarking mechanical results between ANL and
Studsvik 34
4 Conclusions 36

STUDSVIK NUCLEAR AB STUDSVIK/N-11/130 1 2012-07-02
1 General description of the LOCA apparatus
Since autumn 2008, Studsvik has been designing experiments and performing work for the USNRC designed to investigate the performance of high burnup, irradiated fuel which has undergone ballooning and rupture under loss-of-coolant accident (LOCA) conditions. The LOCA research project was divided in three phases at Studsvik: design and build-up of LOCA apparatus and 4-point-bend
device; calibration and benchmarking of LOCA apparatus with out-
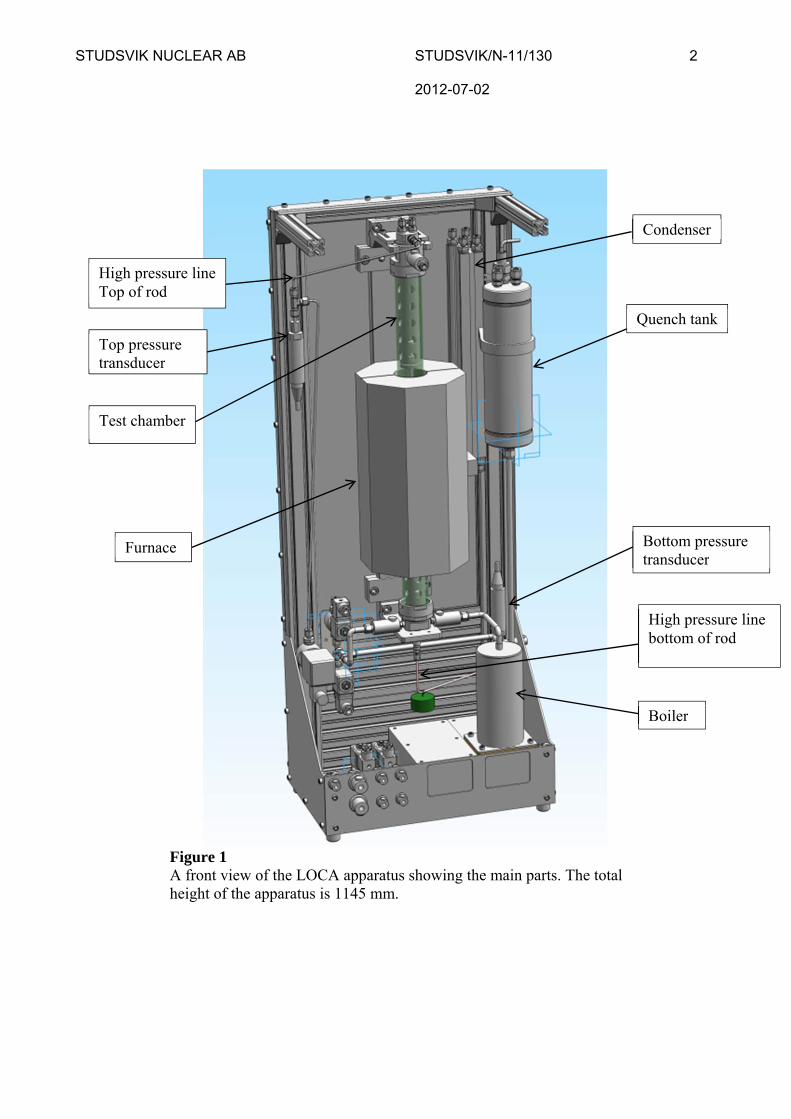
of-cell tests using as-fabricated cladding tubes; in-cell LOCA tests on high burnup PWR fuel The above-mentioned third phase is out of scope of this report. The purpose of this report is to document the experimental work which was completed in order to calibrate and benchmark the LOCA apparatus and 4-point-bend device. The calibration and benchmarking work provided the background and support necessary to develop confidence in the experimental procedures and measurements before beginning in-cell tests. The calibration and benchmarking work also provided the background and support necessary to make quantitative comparisons to similar tests run at ANL. The LOCA apparatus is designed to externally heat a 30 cm long fuel segment up to 1200 C by infra-red (IR) radiation. The test segment temperature is measured with a thermocouple attached on the rod approximately 50 mm above the axial mid plane. The test segment is pressurized with helium and placed in a quartz glass chamber in a flowing steam environment. A drawing showing the main parts of the apparatus is shown in Figure 1. Identical pressure transducers were used both at the bottom and at the top of the apparatus (Figure 1).
STUDSVIK NUCLEAR AB STUDSVIK/N-11/130 2 2012-07-02
Figure 1 A front view of the LOCA apparatus showing the main parts. The total height of the apparatus is 1145 mm.
Top pressure transducer
Bottom pressure transducer
Boiler
Quench tank
Condenser
Test chamber
Furnace
High pressure line Top of rod
High pressure line bottom of rod
STUDSVIK NUCLEAR AB STUDSVIK/N-11/130 3 2012-07-02
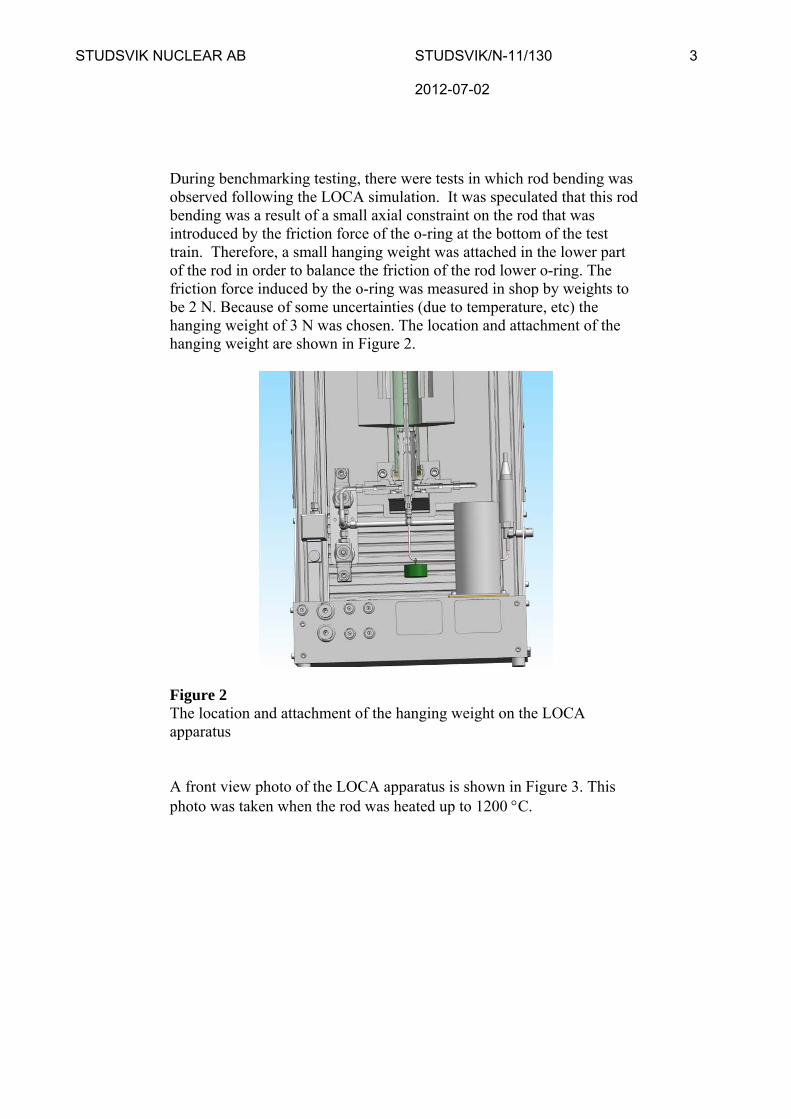
During benchmarking testing, there were tests in which rod bending was observed following the LOCA simulation. It was speculated that this rod bending was a result of a small axial constraint on the rod that was introduced by the friction force of the o-ring at the bottom of the test train. Therefore, a small hanging weight was attached in the lower part of the rod in order to balance the friction of the rod lower o-ring. The friction force induced by the o-ring was measured in shop by weights to be 2 N. Because of some uncertainties (due to temperature, etc) the hanging weight of 3 N was chosen. The location and attachment of the hanging weight are shown in Figure 2.
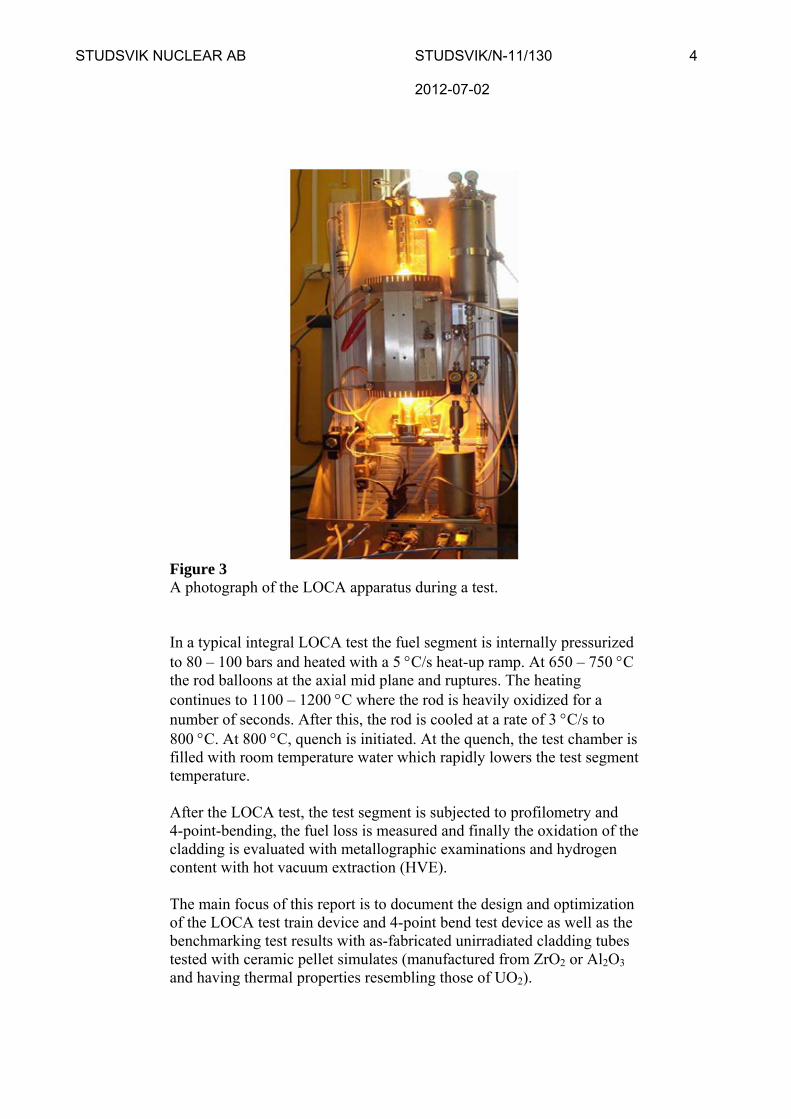
Figure 2 The location and attachment of the hanging weight on the LOCA apparatus A front view photo of the LOCA apparatus is shown in Figure 3. This photo was taken when the rod was heated up to 1200 C.
STUDSVIK NUCLEAR AB STUDSVIK/N-11/130 4 2012-07-02
Figure 3 A photograph of the LOCA apparatus during a test. In a typical integral LOCA test the fuel segment is internally pressurized to 80 – 100 bars and heated with a 5 C/s heat-up ramp. At 650 – 750 C the rod balloons at the axial mid plane and ruptures. The heating continues to 1100 – 1200 C where the rod is heavily oxidized for a number of seconds. After this, the rod is cooled at a rate of 3 C/s to 800 C. At 800 C, quench is initiated. At the quench, the test chamber is filled with room temperature water which rapidly lowers the test segment temperature. After the LOCA test, the test segment is subjected to profilometry and 4-point-bending, the fuel loss is measured and finally the oxidation of the cladding is evaluated with metallographic examinations and hydrogen content with hot vacuum extraction (HVE). The main focus of this report is to document the design and optimization of the LOCA test train device and 4-point bend test device as well as the benchmarking test results with as-fabricated unirradiated cladding tubes tested with ceramic pellet simulates (manufactured from ZrO2 or Al2O3 and having thermal properties resembling those of UO2).
STUDSVIK NUCLEAR AB STUDSVIK/N-11/130 5 2012-07-02
2 Investigating the LOCA test train device
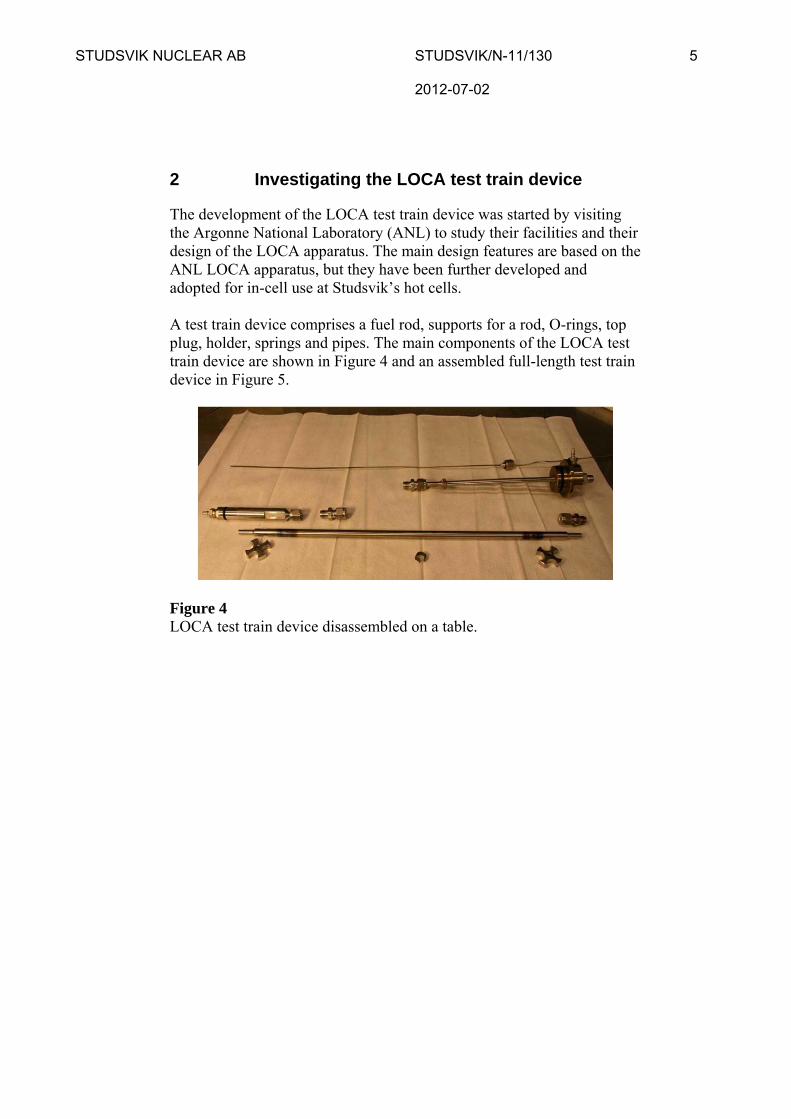
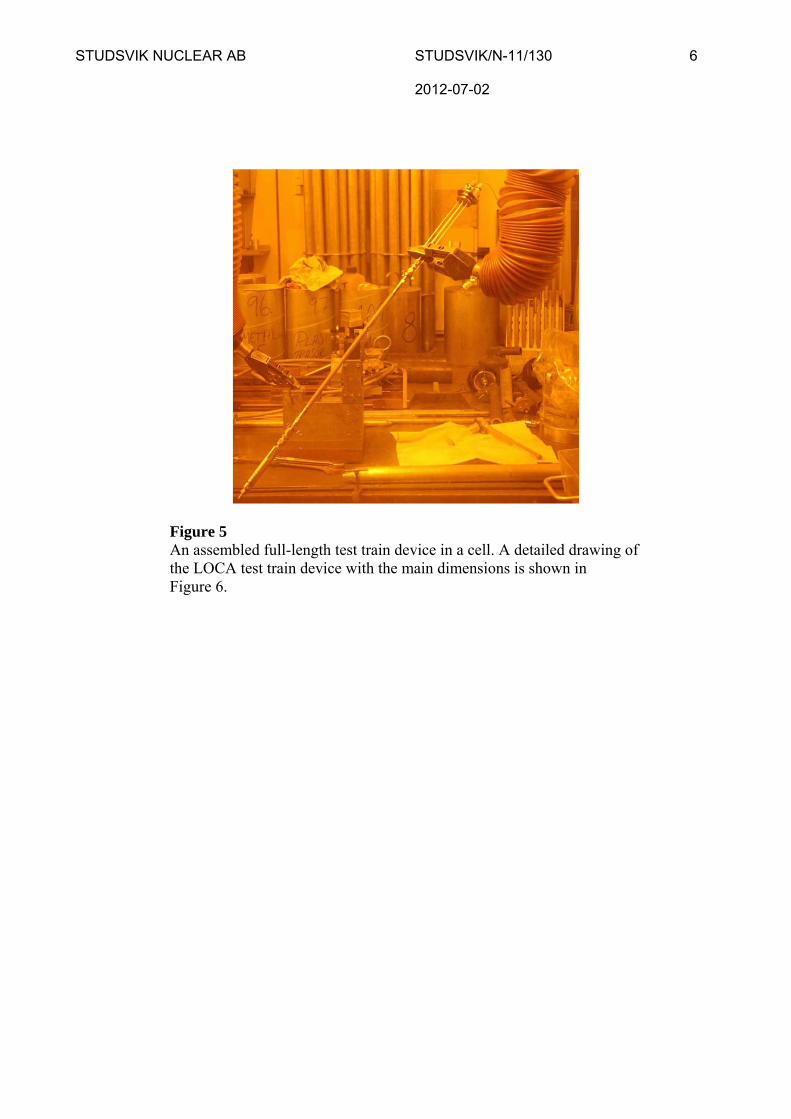
The development of the LOCA test train device was started by visiting the Argonne National Laboratory (ANL) to study their facilities and their design of the LOCA apparatus. The main design features are based on the ANL LOCA apparatus, but they have been further developed and adopted for in-cell use at Studsvik’s hot cells. A test train device comprises a fuel rod, supports for a rod, O-rings, top plug, holder, springs and pipes. The main components of the LOCA test train device are shown in Figure 4 and an assembled full-length test train device in Figure 5.
Figure 4 LOCA test train device disassembled on a table.
STUDSVIK NUCLEAR AB STUDSVIK/N-11/130 6 2012-07-02
Figure 5 An assembled full-length test train device in a cell. A detailed drawing of the LOCA test train device with the main dimensions is shown in Figure 6.
STUDSVIK NUCLEAR AB STUDSVIK/N-11/130 7 2012-07-02
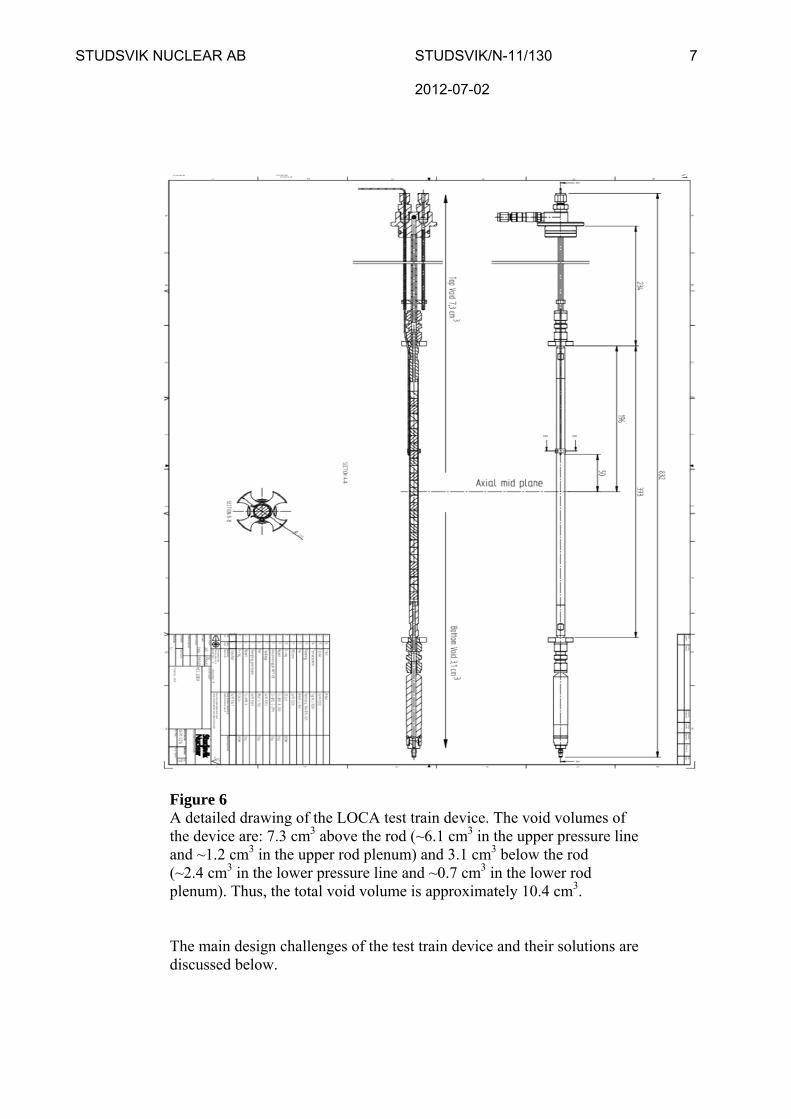
Figure 6 A detailed drawing of the LOCA test train device. The void volumes of the device are: 7.3 cm3 above the rod (~6.1 cm3 in the upper pressure line and ~1.2 cm3 in the upper rod plenum) and 3.1 cm3 below the rod (~2.4 cm3 in the lower pressure line and ~0.7 cm3 in the lower rod plenum). Thus, the total void volume is approximately 10.4 cm3. The main design challenges of the test train device and their solutions are discussed below.
STUDSVIK NUCLEAR AB STUDSVIK/N-11/130 8 2012-07-02
2.1 Effect of thermocouple clamp and clamp design on performance, including preventing reaction with the thermocouple (TC) clamp
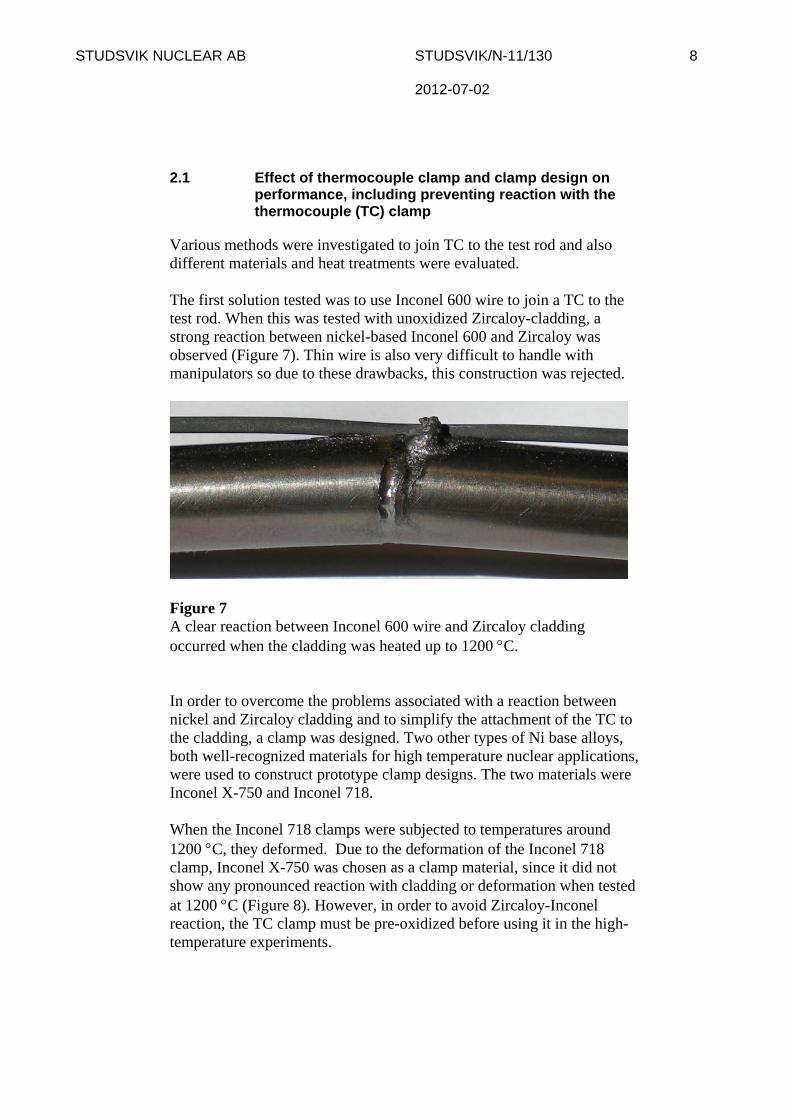
Various methods were investigated to join TC to the test rod and also different materials and heat treatments were evaluated. The first solution tested was to use Inconel 600 wire to join a TC to the test rod. When this was tested with unoxidized Zircaloy-cladding, a strong reaction between nickel-based Inconel 600 and Zircaloy was observed (Figure 7). Thin wire is also very difficult to handle with manipulators so due to these drawbacks, this construction was rejected.
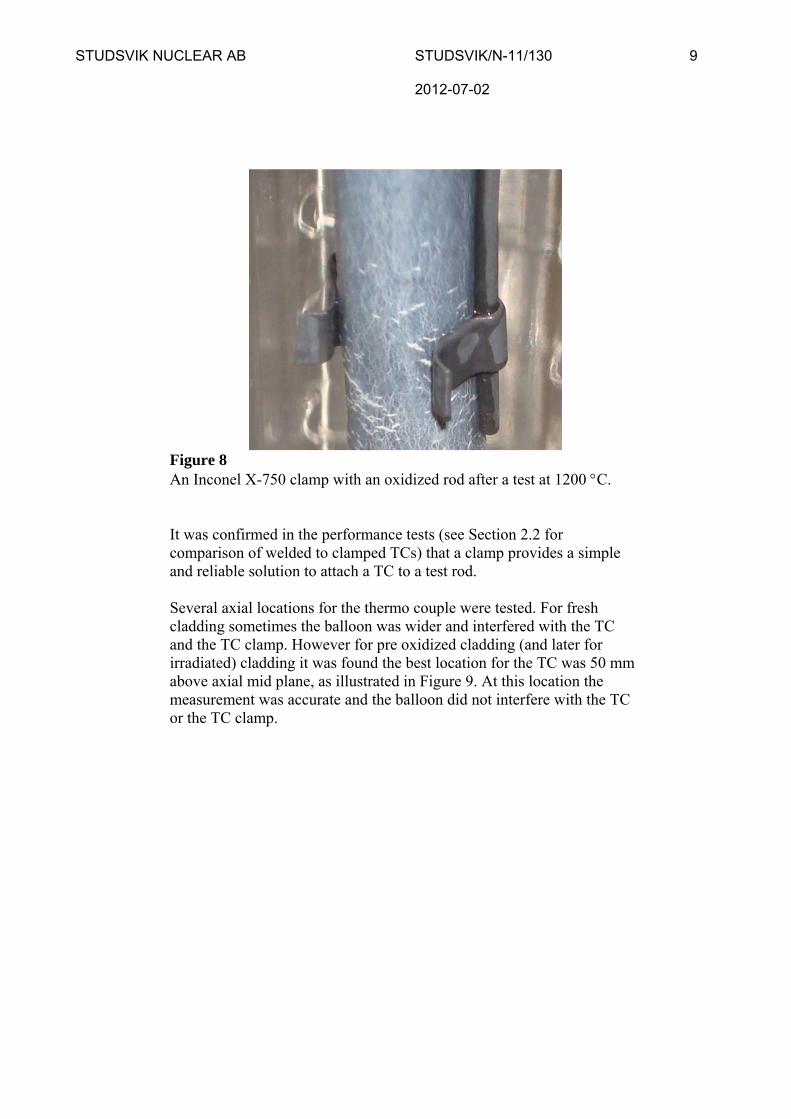
Figure 7 A clear reaction between Inconel 600 wire and Zircaloy cladding occurred when the cladding was heated up to 1200 C. In order to overcome the problems associated with a reaction between nickel and Zircaloy cladding and to simplify the attachment of the TC to the cladding, a clamp was designed. Two other types of Ni base alloys, both well-recognized materials for high temperature nuclear applications, were used to construct prototype clamp designs. The two materials were Inconel X-750 and Inconel 718. When the Inconel 718 clamps were subjected to temperatures around 1200 C, they deformed. Due to the deformation of the Inconel 718 clamp, Inconel X-750 was chosen as a clamp material, since it did not show any pronounced reaction with cladding or deformation when tested at 1200 C (Figure 8). However, in order to avoid Zircaloy-Inconel reaction, the TC clamp must be pre-oxidized before using it in the high-temperature experiments.
STUDSVIK NUCLEAR AB STUDSVIK/N-11/130 9 2012-07-02
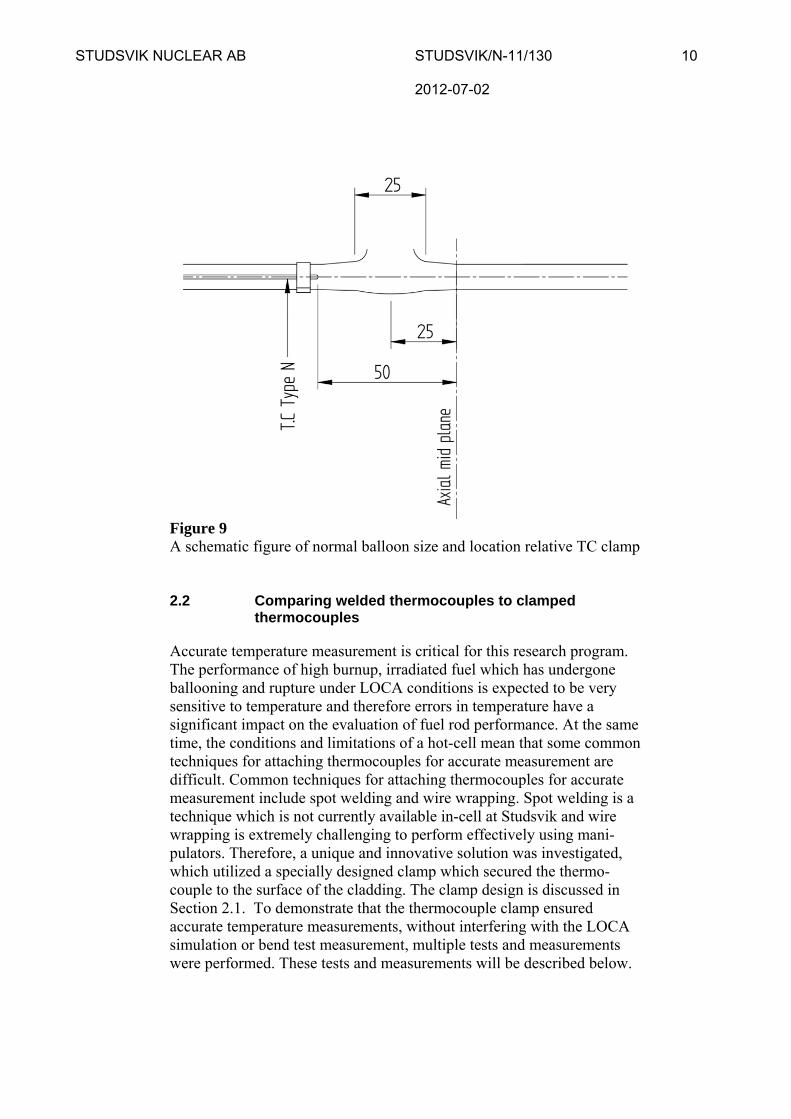
Figure 8 An Inconel X-750 clamp with an oxidized rod after a test at 1200 C. It was confirmed in the performance tests (see Section 2.2 for comparison of welded to clamped TCs) that a clamp provides a simple and reliable solution to attach a TC to a test rod. Several axial locations for the thermo couple were tested. For fresh cladding sometimes the balloon was wider and interfered with the TC and the TC clamp. However for pre oxidized cladding (and later for irradiated) cladding it was found the best location for the TC was 50 mm above axial mid plane, as illustrated in Figure 9. At this location the measurement was accurate and the balloon did not interfere with the TC or the TC clamp.
STUDSVIK NUCLEAR AB STUDSVIK/N-11/130 10 2012-07-02
Figure 9 A schematic figure of normal balloon size and location relative TC clamp 2.2 Comparing welded thermocouples to clamped
thermocouples
Accurate temperature measurement is critical for this research program. The performance of high burnup, irradiated fuel which has undergone ballooning and rupture under LOCA conditions is expected to be very sensitive to temperature and therefore errors in temperature have a significant impact on the evaluation of fuel rod performance. At the same time, the conditions and limitations of a hot-cell mean that some common techniques for attaching thermocouples for accurate measurement are difficult. Common techniques for attaching thermocouples for accurate measurement include spot welding and wire wrapping. Spot welding is a technique which is not currently available in-cell at Studsvik and wire wrapping is extremely challenging to perform effectively using mani-pulators. Therefore, a unique and innovative solution was investigated, which utilized a specially designed clamp which secured the thermo-couple to the surface of the cladding. The clamp design is discussed in Section 2.1. To demonstrate that the thermocouple clamp ensured accurate temperature measurements, without interfering with the LOCA simulation or bend test measurement, multiple tests and measurements were performed. These tests and measurements will be described below.
STUDSVIK NUCLEAR AB STUDSVIK/N-11/130 11 2012-07-02
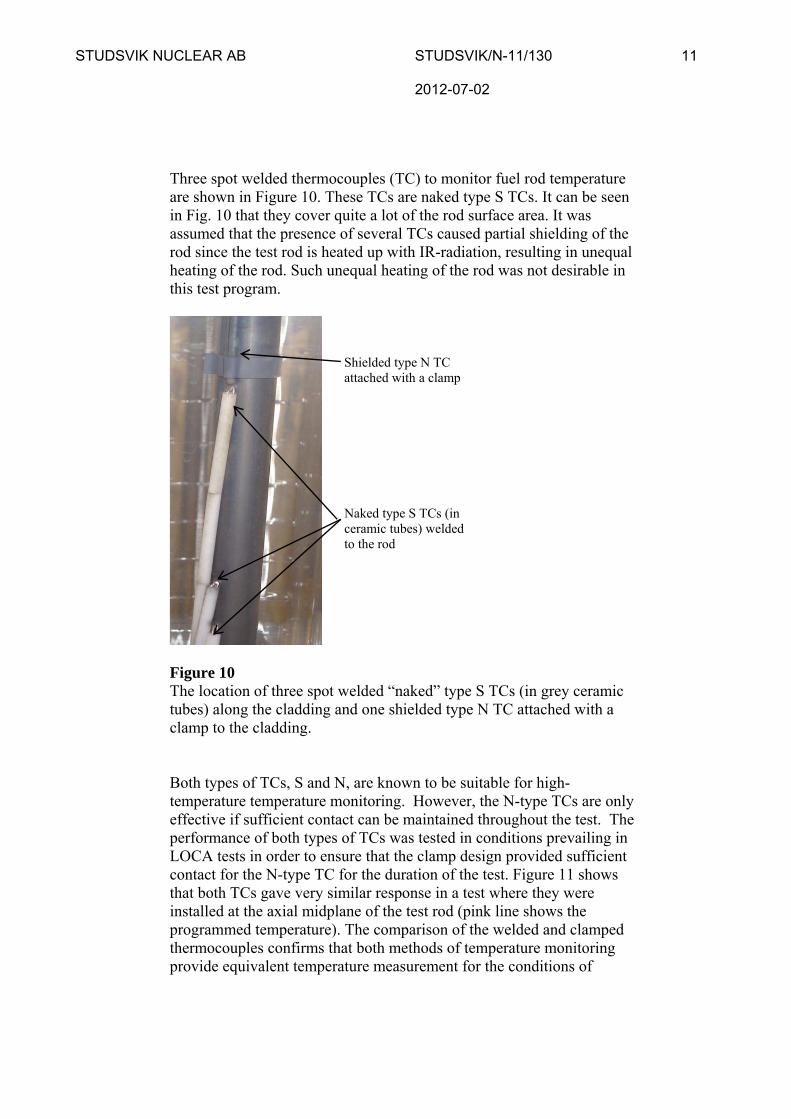
Three spot welded thermocouples (TC) to monitor fuel rod temperature are shown in Figure 10. These TCs are naked type S TCs. It can be seen in Fig. 10 that they cover quite a lot of the rod surface area. It was assumed that the presence of several TCs caused partial shielding of the rod since the test rod is heated up with IR-radiation, resulting in unequal heating of the rod. Such unequal heating of the rod was not desirable in this test program.
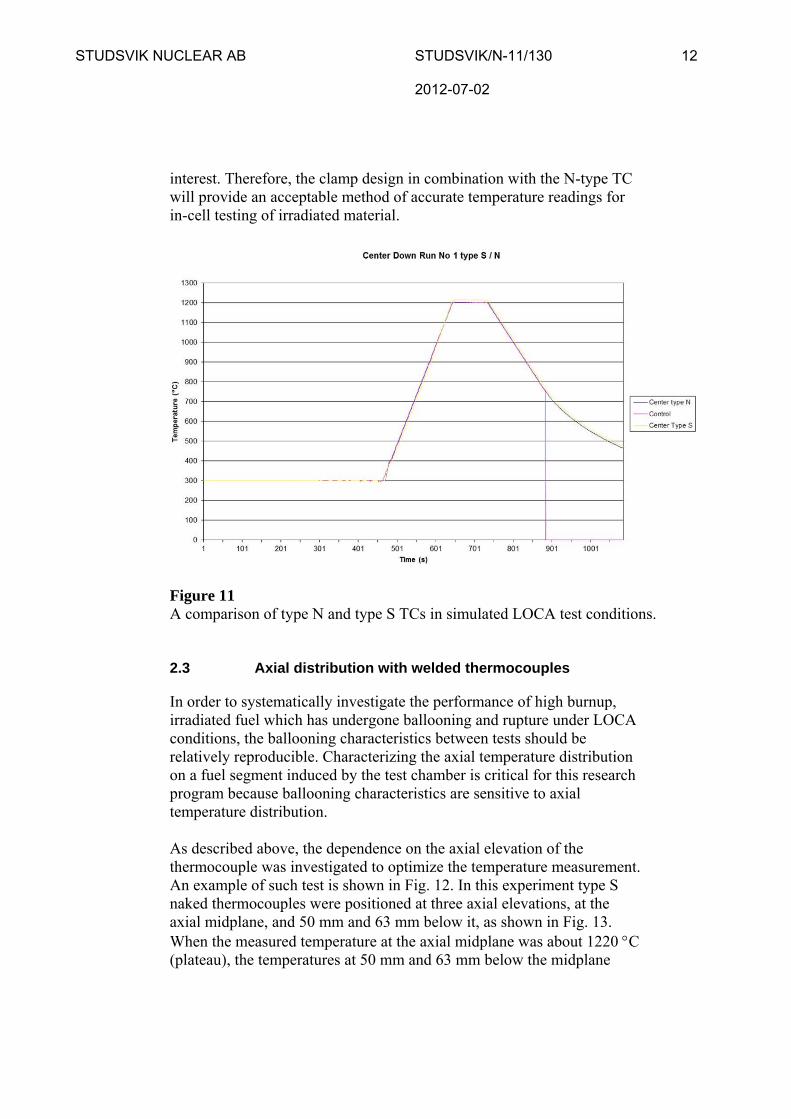
Figure 10 The location of three spot welded “naked” type S TCs (in grey ceramic tubes) along the cladding and one shielded type N TC attached with a clamp to the cladding. Both types of TCs, S and N, are known to be suitable for high-temperature temperature monitoring. However, the N-type TCs are only effective if sufficient contact can be maintained throughout the test. The performance of both types of TCs was tested in conditions prevailing in LOCA tests in order to ensure that the clamp design provided sufficient contact for the N-type TC for the duration of the test. Figure 11 shows that both TCs gave very similar response in a test where they were installed at the axial midplane of the test rod (pink line shows the programmed temperature). The comparison of the welded and clamped thermocouples confirms that both methods of temperature monitoring provide equivalent temperature measurement for the conditions of
Shielded type N TC attached with a clamp
Naked type S TCs (in ceramic tubes) welded to the rod
STUDSVIK NUCLEAR AB STUDSVIK/N-11/130 12 2012-07-02
interest. Therefore, the clamp design in combination with the N-type TC will provide an acceptable method of accurate temperature readings for in-cell testing of irradiated material.
Figure 11 A comparison of type N and type S TCs in simulated LOCA test conditions. 2.3 Axial distribution with welded thermocouples
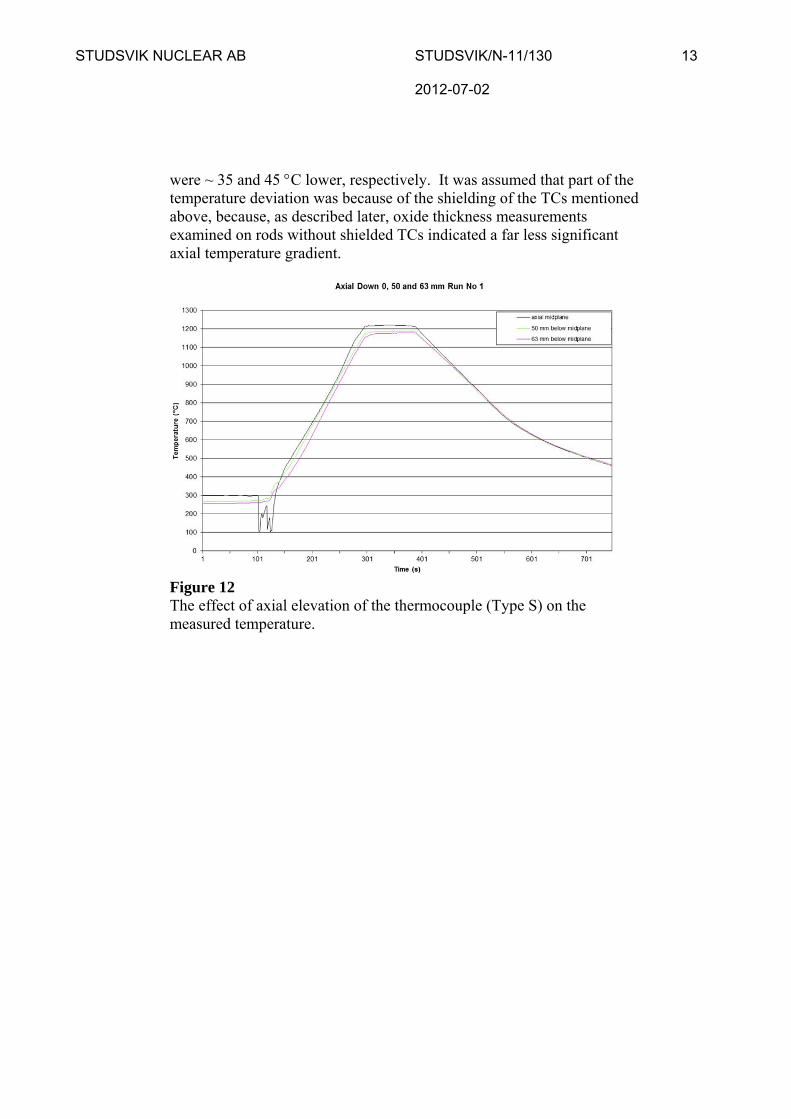
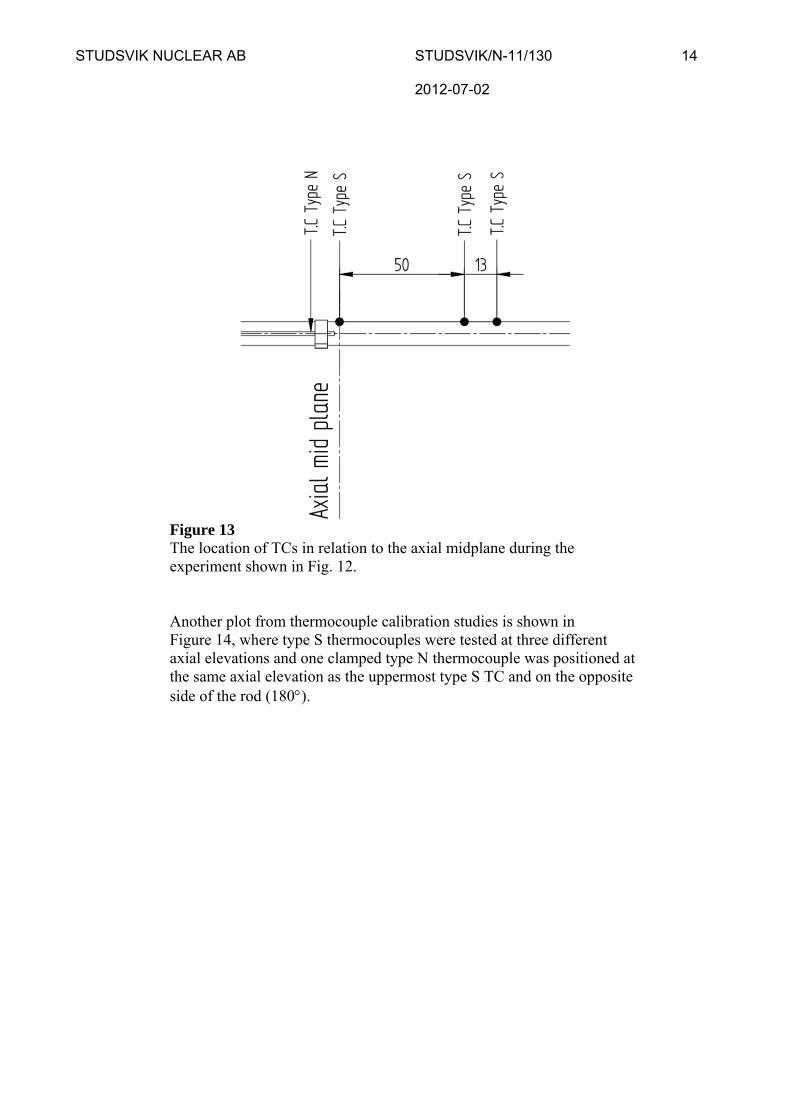
In order to systematically investigate the performance of high burnup, irradiated fuel which has undergone ballooning and rupture under LOCA conditions, the ballooning characteristics between tests should be relatively reproducible. Characterizing the axial temperature distribution on a fuel segment induced by the test chamber is critical for this research program because ballooning characteristics are sensitive to axial temperature distribution. As described above, the dependence on the axial elevation of the thermocouple was investigated to optimize the temperature measurement. An example of such test is shown in Fig. 12. In this experiment type S naked thermocouples were positioned at three axial elevations, at the axial midplane, and 50 mm and 63 mm below it, as shown in Fig. 13. When the measured temperature at the axial midplane was about 1220 C (plateau), the temperatures at 50 mm and 63 mm below the midplane
STUDSVIK NUCLEAR AB STUDSVIK/N-11/130 13 2012-07-02
were ~ 35 and 45 C lower, respectively. It was assumed that part of the temperature deviation was because of the shielding of the TCs mentioned above, because, as described later, oxide thickness measurements examined on rods without shielded TCs indicated a far less significant axial temperature gradient.
Figure 12 The effect of axial elevation of the thermocouple (Type S) on the measured temperature.
STUDSVIK NUCLEAR AB STUDSVIK/N-11/130 14 2012-07-02
Figure 13 The location of TCs in relation to the axial midplane during the experiment shown in Fig. 12. Another plot from thermocouple calibration studies is shown in Figure 14, where type S thermocouples were tested at three different axial elevations and one clamped type N thermocouple was positioned at the same axial elevation as the uppermost type S TC and on the opposite side of the rod (180).
STUDSVIK NUCLEAR AB STUDSVIK/N-11/130 15 2012-07-02
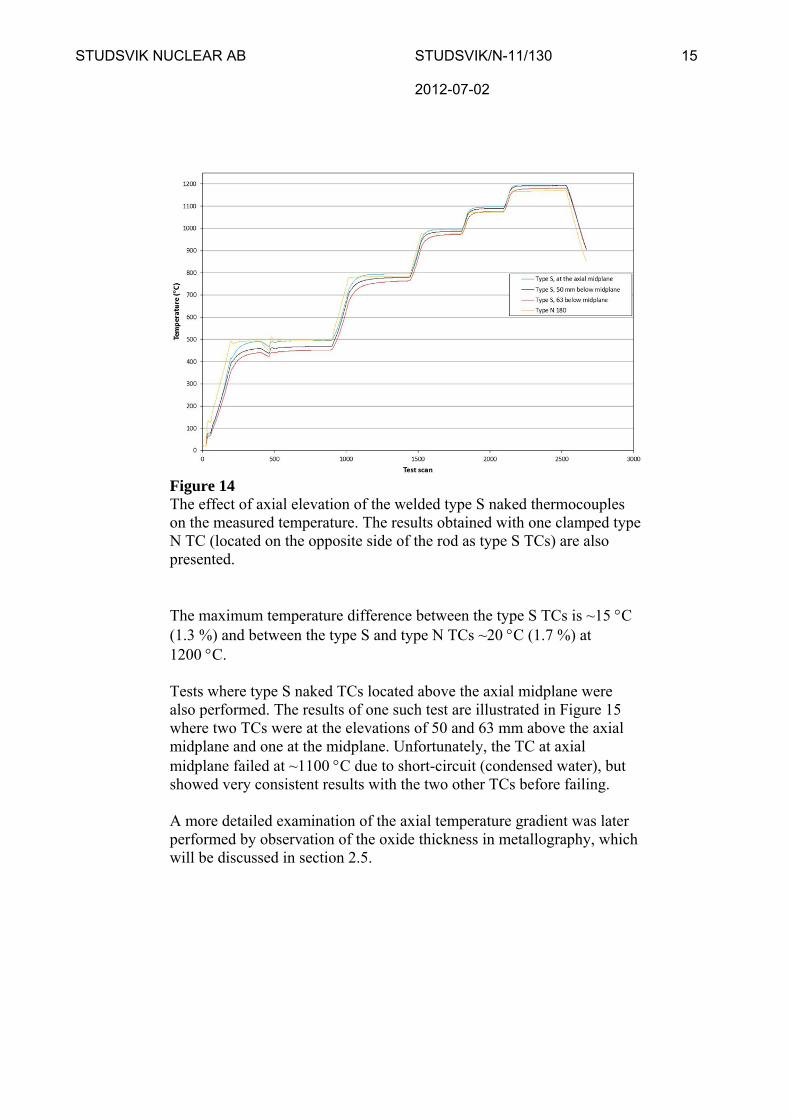
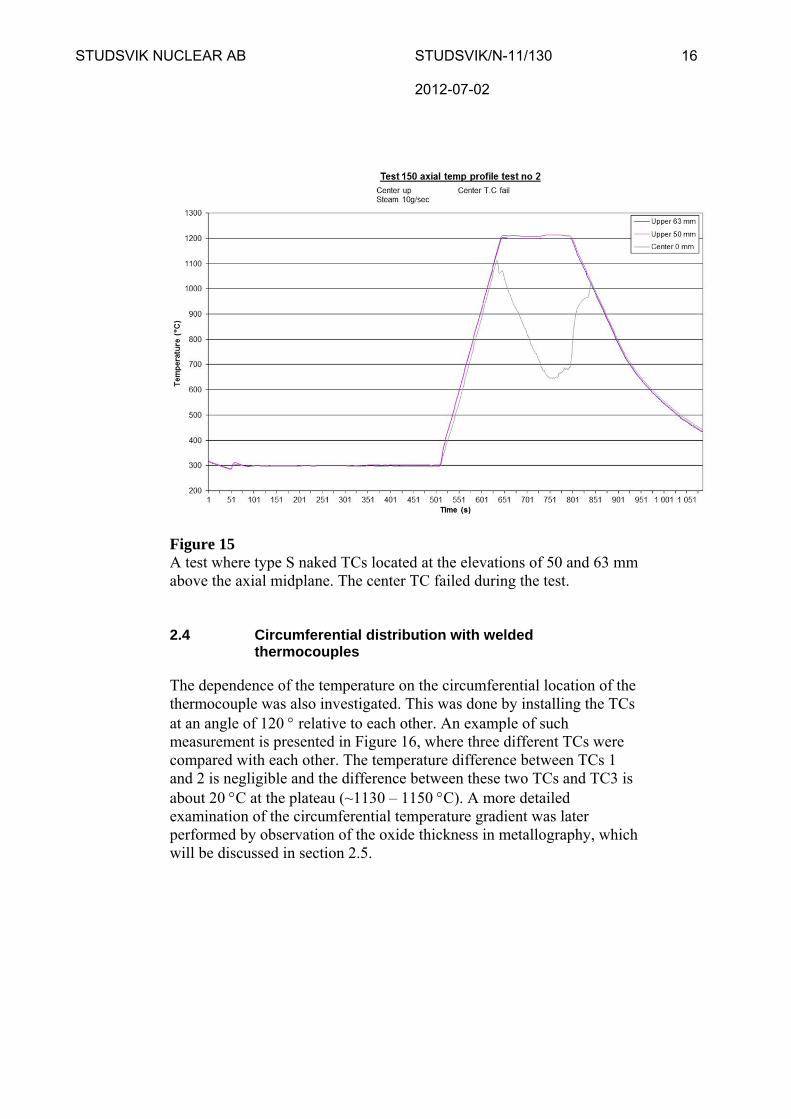
Figure 14 The effect of axial elevation of the welded type S naked thermocouples on the measured temperature. The results obtained with one clamped type N TC (located on the opposite side of the rod as type S TCs) are also presented. The maximum temperature difference between the type S TCs is ~15 C (1.3 %) and between the type S and type N TCs ~20 C (1.7 %) at 1200 C. Tests where type S naked TCs located above the axial midplane were also performed. The results of one such test are illustrated in Figure 15 where two TCs were at the elevations of 50 and 63 mm above the axial midplane and one at the midplane. Unfortunately, the TC at axial midplane failed at ~1100 C due to short-circuit (condensed water), but showed very consistent results with the two other TCs before failing. A more detailed examination of the axial temperature gradient was later performed by observation of the oxide thickness in metallography, which will be discussed in section 2.5.
STUDSVIK NUCLEAR AB STUDSVIK/N-11/130 16 2012-07-02
Figure 15 A test where type S naked TCs located at the elevations of 50 and 63 mm above the axial midplane. The center TC failed during the test. 2.4 Circumferential distribution with welded
thermocouples
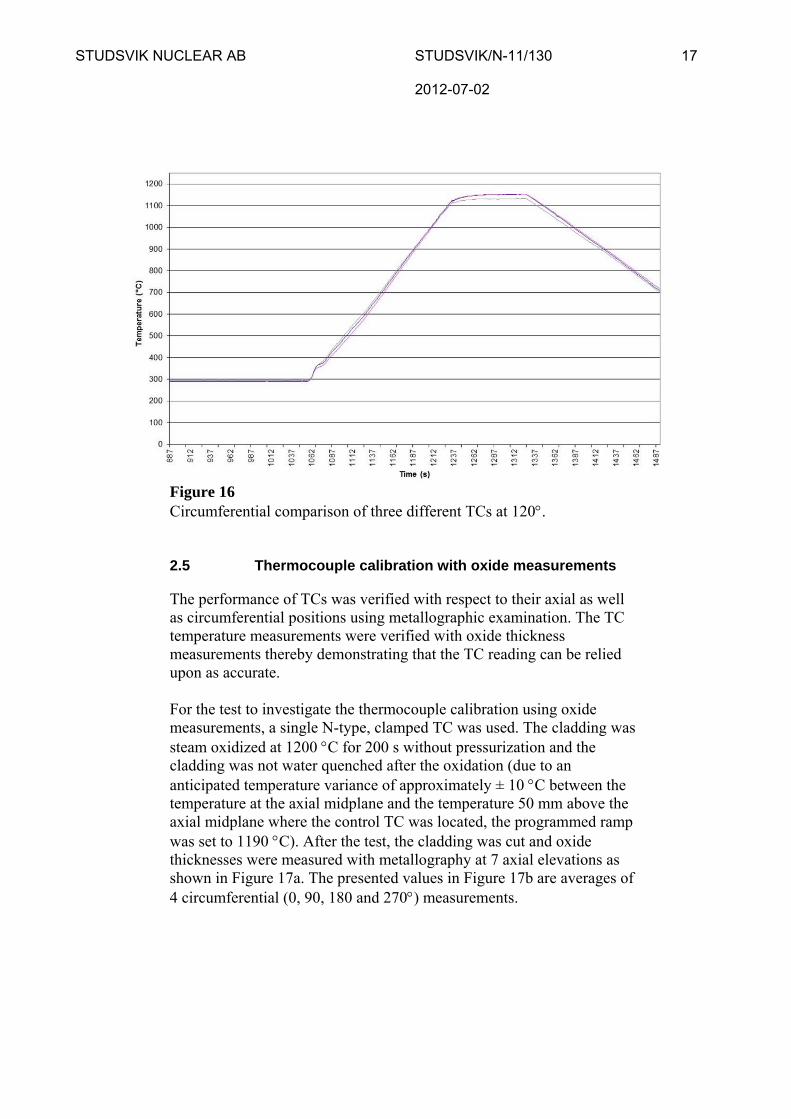
The dependence of the temperature on the circumferential location of the thermocouple was also investigated. This was done by installing the TCs at an angle of 120 relative to each other. An example of such measurement is presented in Figure 16, where three different TCs were compared with each other. The temperature difference between TCs 1 and 2 is negligible and the difference between these two TCs and TC3 is about 20 C at the plateau (~1130 – 1150 C). A more detailed examination of the circumferential temperature gradient was later performed by observation of the oxide thickness in metallography, which will be discussed in section 2.5.
STUDSVIK NUCLEAR AB STUDSVIK/N-11/130 17 2012-07-02
Figure 16 Circumferential comparison of three different TCs at 120. 2.5 Thermocouple calibration with oxide measurements
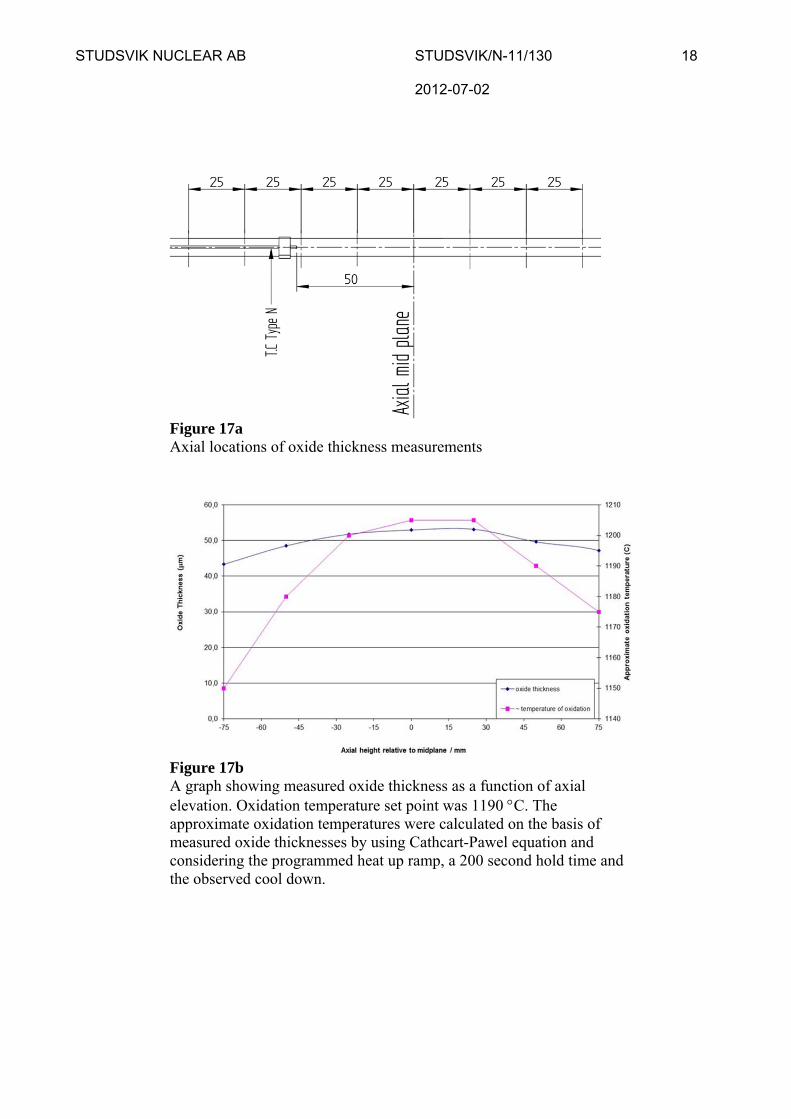
The performance of TCs was verified with respect to their axial as well as circumferential positions using metallographic examination. The TC temperature measurements were verified with oxide thickness measurements thereby demonstrating that the TC reading can be relied upon as accurate. For the test to investigate the thermocouple calibration using oxide measurements, a single N-type, clamped TC was used. The cladding was steam oxidized at 1200 C for 200 s without pressurization and the cladding was not water quenched after the oxidation (due to an anticipated temperature variance of approximately ± 10 C between the temperature at the axial midplane and the temperature 50 mm above the axial midplane where the control TC was located, the programmed ramp was set to 1190 C). After the test, the cladding was cut and oxide thicknesses were measured with metallography at 7 axial elevations as shown in Figure 17a. The presented values in Figure 17b are averages of 4 circumferential (0, 90, 180 and 270) measurements.
STUDSVIK NUCLEAR AB STUDSVIK/N-11/130 18 2012-07-02
Figure 17a Axial locations of oxide thickness measurements
Figure 17b A graph showing measured oxide thickness as a function of axial elevation. Oxidation temperature set point was 1190 C. The approximate oxidation temperatures were calculated on the basis of measured oxide thicknesses by using Cathcart-Pawel equation and considering the programmed heat up ramp, a 200 second hold time and the observed cool down.
STUDSVIK NUCLEAR AB STUDSVIK/N-11/130 19 2012-07-02
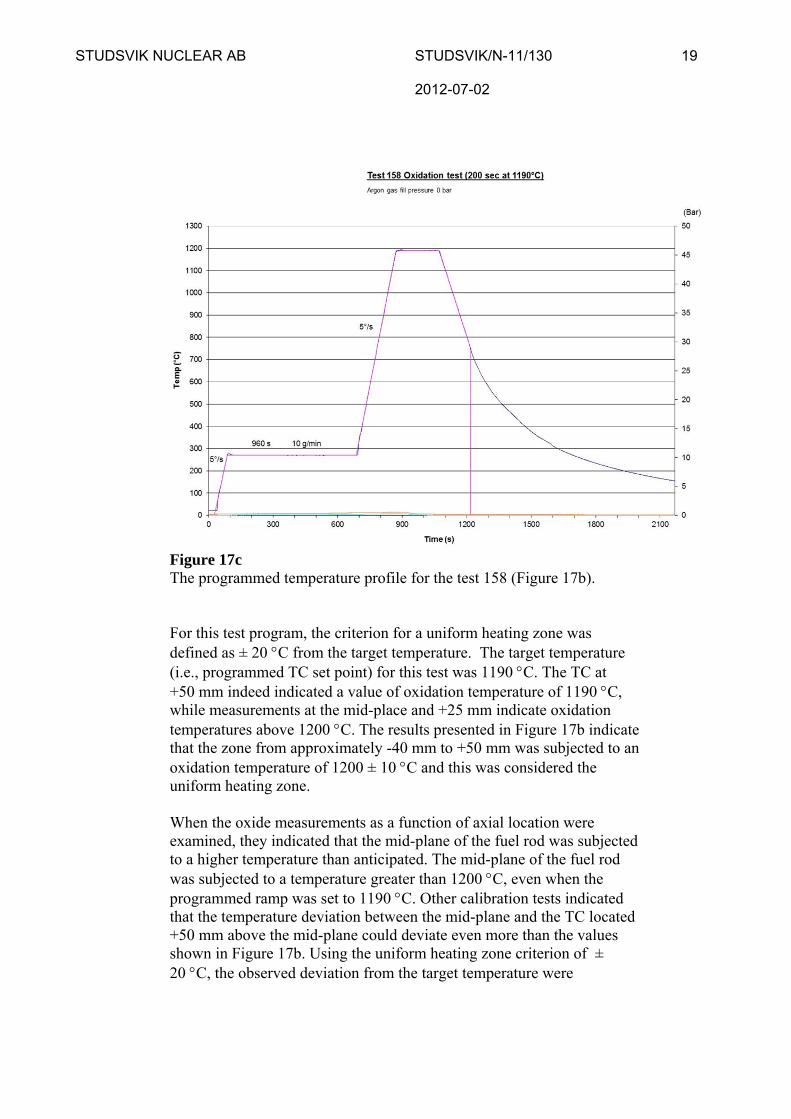
Figure 17c The programmed temperature profile for the test 158 (Figure 17b). For this test program, the criterion for a uniform heating zone was defined as ± 20 C from the target temperature. The target temperature (i.e., programmed TC set point) for this test was 1190 C. The TC at +50 mm indeed indicated a value of oxidation temperature of 1190 C, while measurements at the mid-place and +25 mm indicate oxidation temperatures above 1200 C. The results presented in Figure 17b indicate that the zone from approximately -40 mm to +50 mm was subjected to an oxidation temperature of 1200 ± 10 C and this was considered the uniform heating zone. When the oxide measurements as a function of axial location were examined, they indicated that the mid-plane of the fuel rod was subjected to a higher temperature than anticipated. The mid-plane of the fuel rod was subjected to a temperature greater than 1200 C, even when the programmed ramp was set to 1190 C. Other calibration tests indicated that the temperature deviation between the mid-plane and the TC located +50 mm above the mid-plane could deviate even more than the values shown in Figure 17b. Using the uniform heating zone criterion of ± 20 C, the observed deviation from the target temperature were
STUDSVIK NUCLEAR AB STUDSVIK/N-11/130 20 2012-07-02
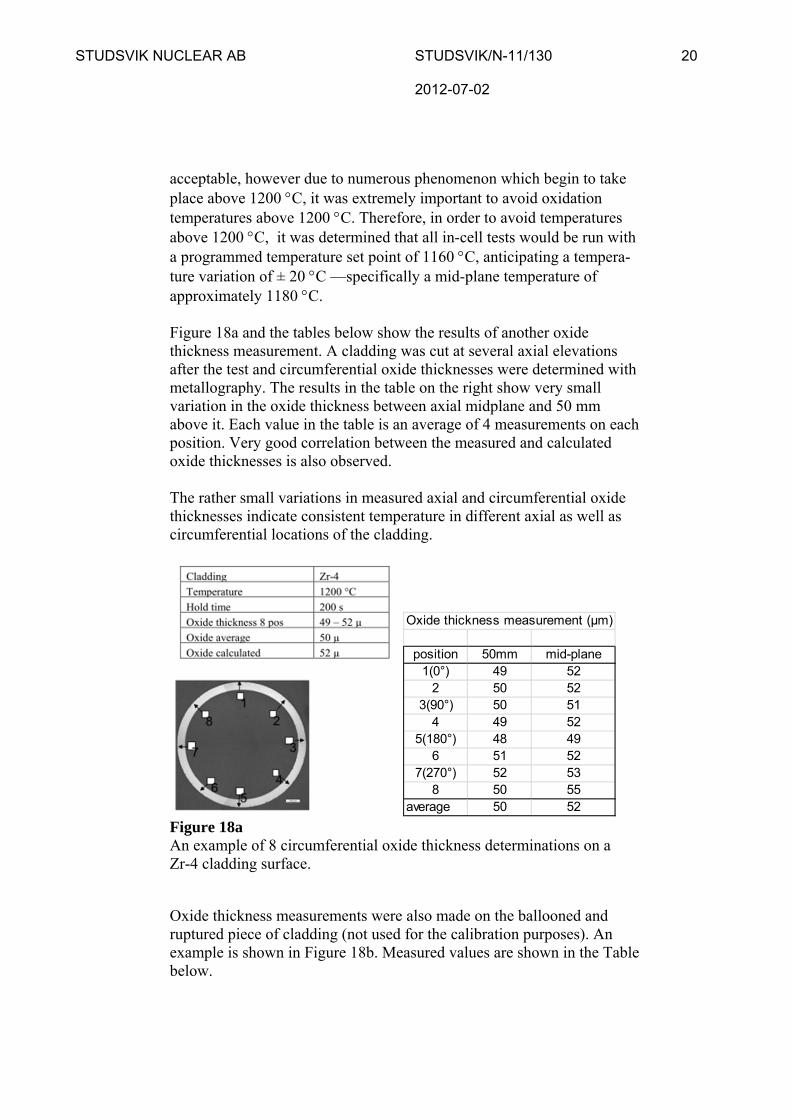
acceptable, however due to numerous phenomenon which begin to take place above 1200 C, it was extremely important to avoid oxidation temperatures above 1200 C. Therefore, in order to avoid temperatures above 1200 C, it was determined that all in-cell tests would be run with a programmed temperature set point of 1160 C, anticipating a tempera-ture variation of ± 20 C —specifically a mid-plane temperature of approximately 1180 C. Figure 18a and the tables below show the results of another oxide thickness measurement. A cladding was cut at several axial elevations after the test and circumferential oxide thicknesses were determined with metallography. The results in the table on the right show very small variation in the oxide thickness between axial midplane and 50 mm above it. Each value in the table is an average of 4 measurements on each position. Very good correlation between the measured and calculated oxide thicknesses is also observed. The rather small variations in measured axial and circumferential oxide thicknesses indicate consistent temperature in different axial as well as circumferential locations of the cladding.
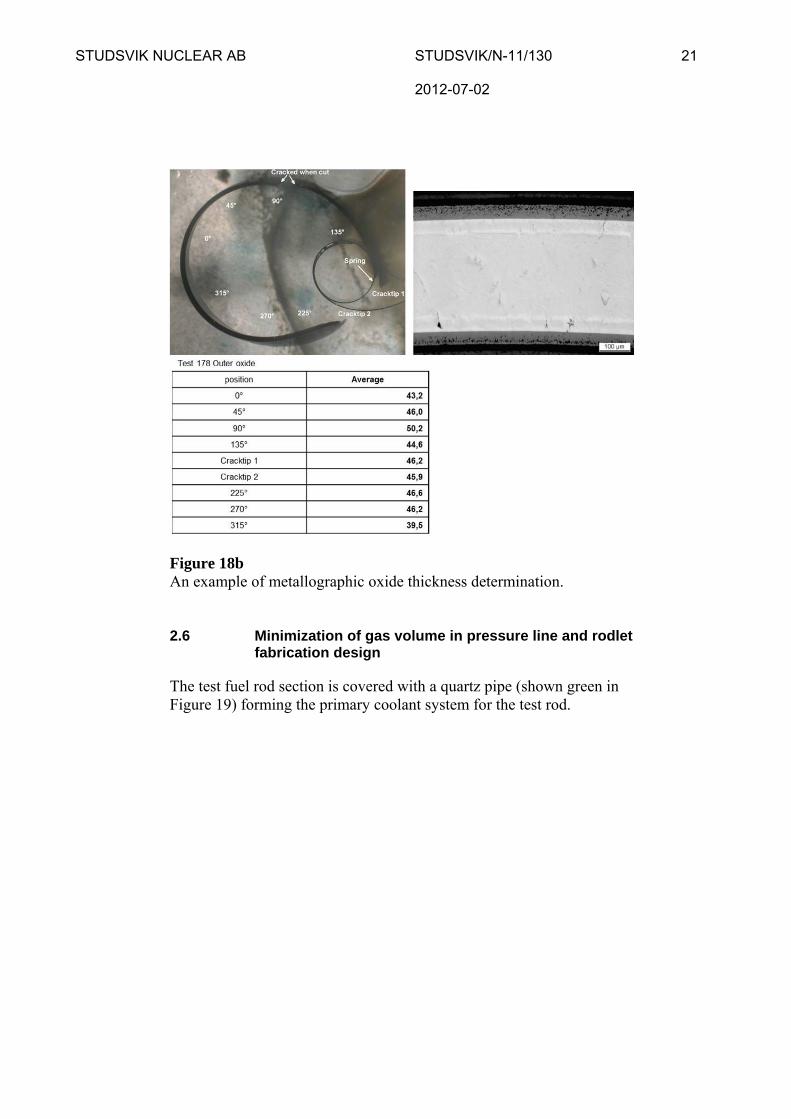
Figure 18a An example of 8 circumferential oxide thickness determinations on a Zr-4 cladding surface. Oxide thickness measurements were also made on the ballooned and ruptured piece of cladding (not used for the calibration purposes). An example is shown in Figure 18b. Measured values are shown in the Table below.
Oxide thickness measurement (µm)
position 50mm mid-plane1(0°) 49 52
2 50 523(90°) 50 51
4 49 525(180°) 48 49
6 51 527(270°) 52 53
8 50 55average 50 52
STUDSVIK NUCLEAR AB STUDSVIK/N-11/130 21 2012-07-02
Figure 18b An example of metallographic oxide thickness determination. 2.6 Minimization of gas volume in pressure line and rodlet
fabrication design
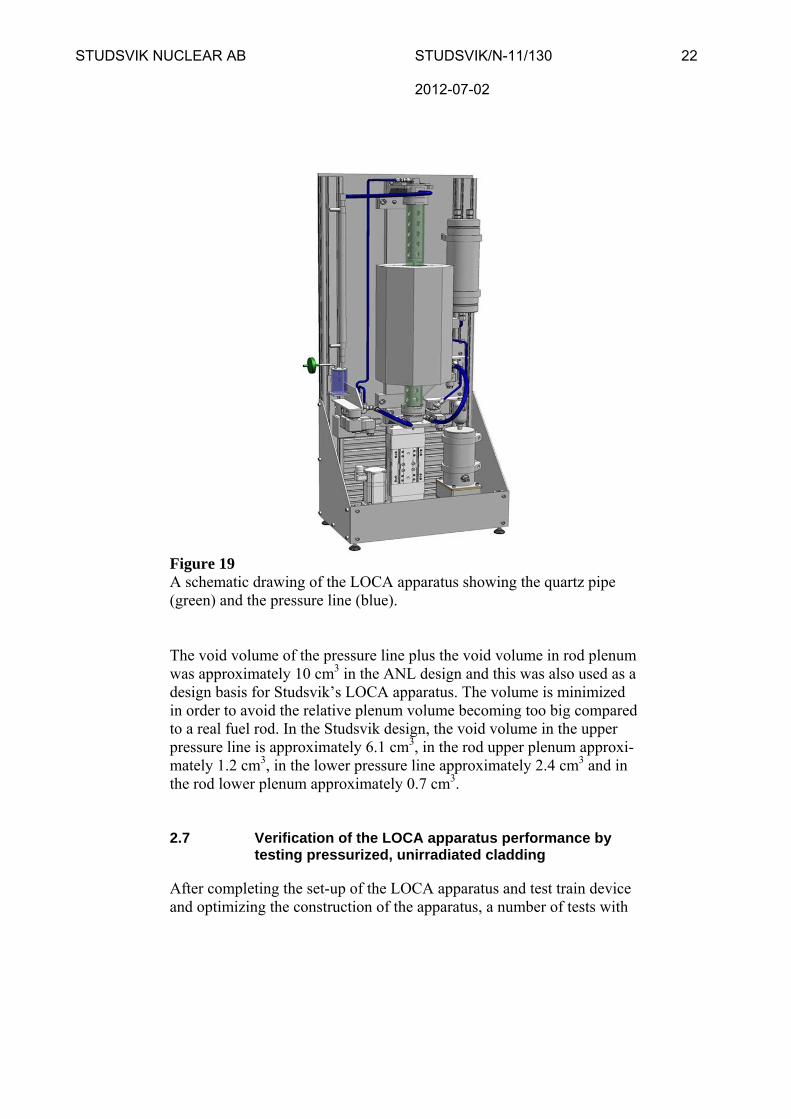
The test fuel rod section is covered with a quartz pipe (shown green in Figure 19) forming the primary coolant system for the test rod.
STUDSVIK NUCLEAR AB STUDSVIK/N-11/130 22 2012-07-02
Figure 19 A schematic drawing of the LOCA apparatus showing the quartz pipe (green) and the pressure line (blue). The void volume of the pressure line plus the void volume in rod plenum was approximately 10 cm3 in the ANL design and this was also used as a design basis for Studsvik’s LOCA apparatus. The volume is minimized in order to avoid the relative plenum volume becoming too big compared to a real fuel rod. In the Studsvik design, the void volume in the upper pressure line is approximately 6.1 cm3, in the rod upper plenum approxi-mately 1.2 cm3, in the lower pressure line approximately 2.4 cm3 and in the rod lower plenum approximately 0.7 cm3. 2.7 Verification of the LOCA apparatus performance by
testing pressurized, unirradiated cladding
After completing the set-up of the LOCA apparatus and test train device and optimizing the construction of the apparatus, a number of tests with
STUDSVIK NUCLEAR AB STUDSVIK/N-11/130 23 2012-07-02
pressurized, unirradiated cladding with ceramic pellet simulates1 were carried out to confirm the performance of the apparatus and to find out whether there were adjustments/improvements needed in the construction. The main objectives of these tests were: Confirm that ballooning can be induced at predictable
values of temperature and pressure and that the ballooning strain is reasonable.
Confirm that ballooning can be induced at a valid location. Confirm that running the whole scenario does not produce
unwanted or unexpected results (such as rod bending, early burst, quartz tube breakage, quench system failure, etc).
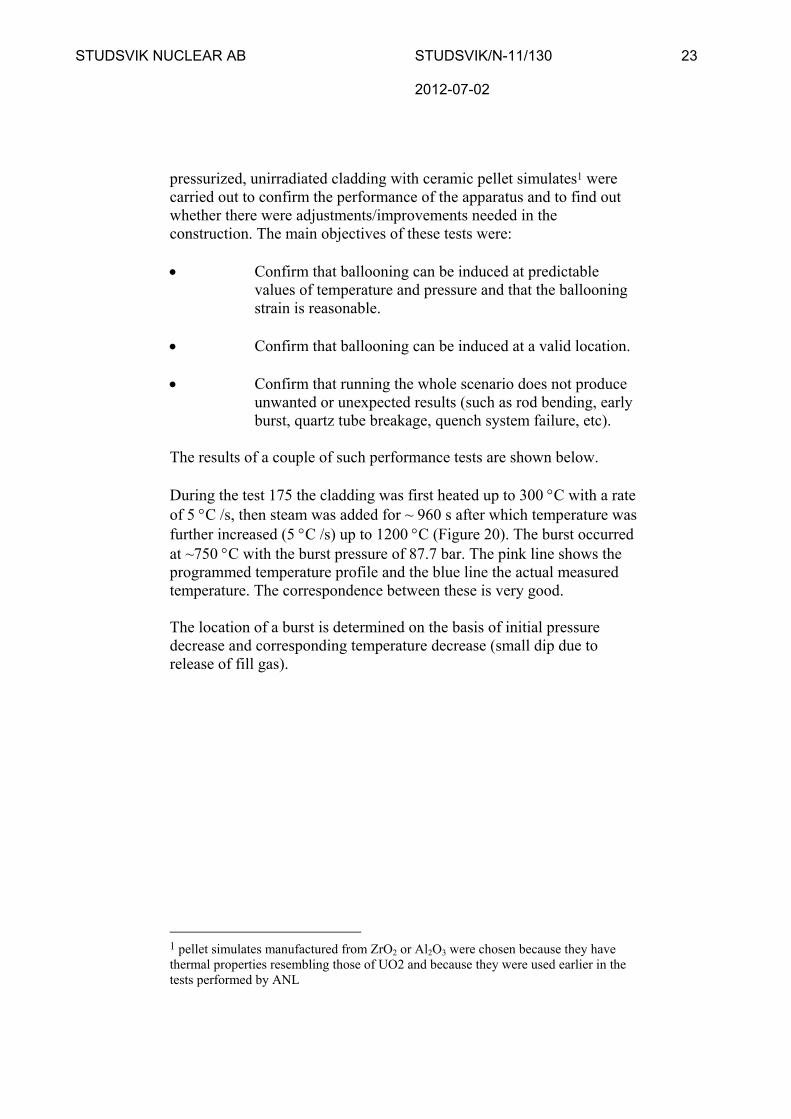
The results of a couple of such performance tests are shown below. During the test 175 the cladding was first heated up to 300 C with a rate of 5 C /s, then steam was added for ~ 960 s after which temperature was further increased (5 C /s) up to 1200 C (Figure 20). The burst occurred at ~750 C with the burst pressure of 87.7 bar. The pink line shows the programmed temperature profile and the blue line the actual measured temperature. The correspondence between these is very good. The location of a burst is determined on the basis of initial pressure decrease and corresponding temperature decrease (small dip due to release of fill gas).
1 pellet simulates manufactured from ZrO2 or Al2O3 were chosen because they have thermal properties resembling those of UO2 and because they were used earlier in the tests performed by ANL
STUDSVIK NUCLEAR AB STUDSVIK/N-11/130 24 2012-07-02
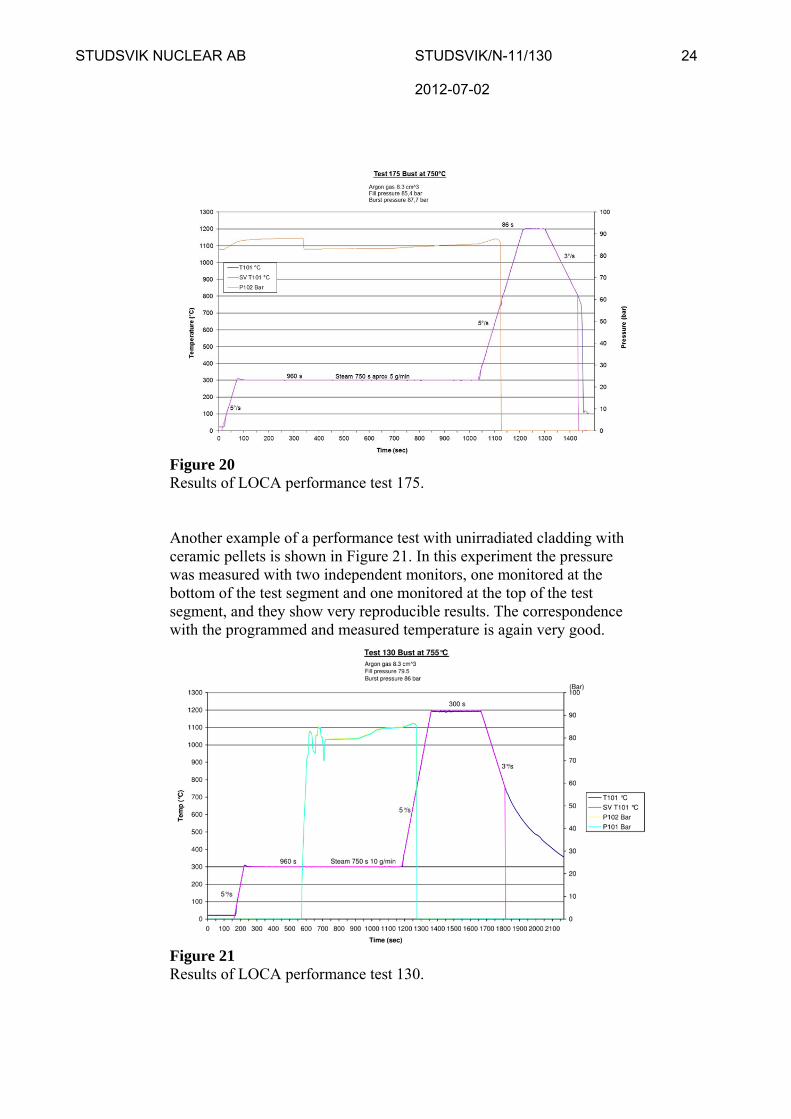
Figure 20 Results of LOCA performance test 175. Another example of a performance test with unirradiated cladding with ceramic pellets is shown in Figure 21. In this experiment the pressure was measured with two independent monitors, one monitored at the bottom of the test segment and one monitored at the top of the test segment, and they show very reproducible results. The correspondence with the programmed and measured temperature is again very good.
Figure 21 Results of LOCA performance test 130.
STUDSVIK NUCLEAR AB STUDSVIK/N-11/130 25 2012-07-02
3 Investigating the bend test device
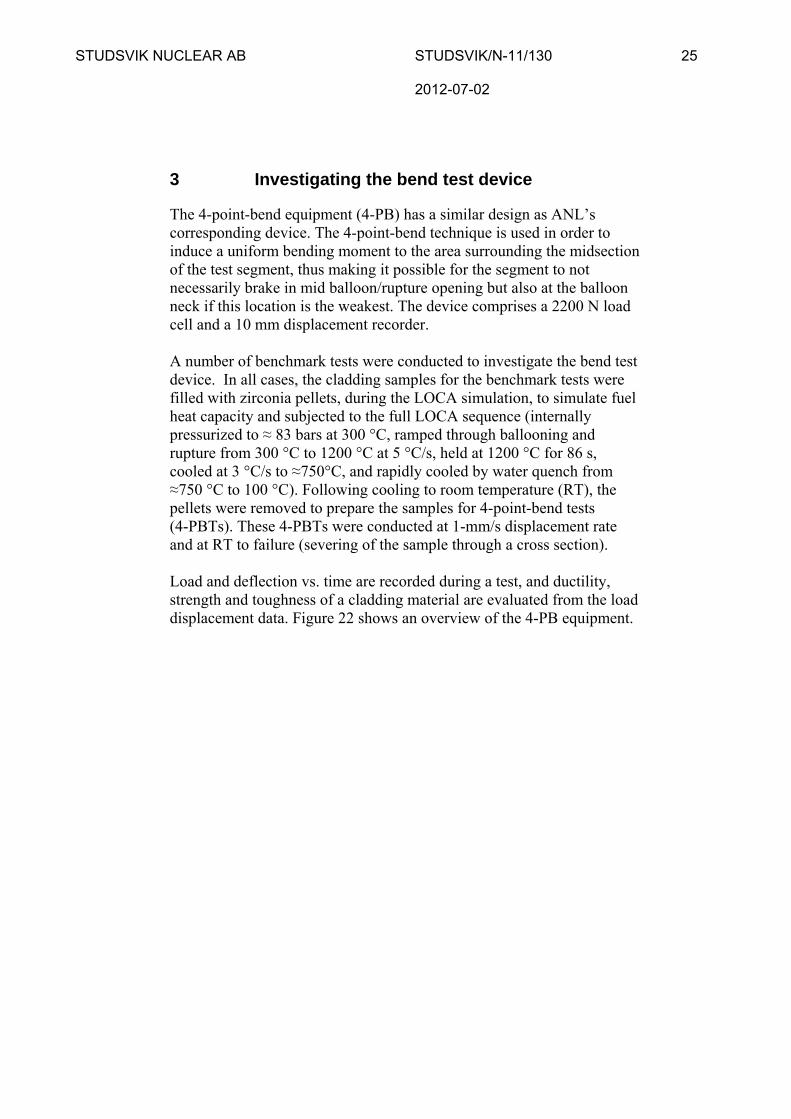
The 4-point-bend equipment (4-PB) has a similar design as ANL’s corresponding device. The 4-point-bend technique is used in order to induce a uniform bending moment to the area surrounding the midsection of the test segment, thus making it possible for the segment to not necessarily brake in mid balloon/rupture opening but also at the balloon neck if this location is the weakest. The device comprises a 2200 N load cell and a 10 mm displacement recorder. A number of benchmark tests were conducted to investigate the bend test device. In all cases, the cladding samples for the benchmark tests were filled with zirconia pellets, during the LOCA simulation, to simulate fuel heat capacity and subjected to the full LOCA sequence (internally pressurized to ≈ 83 bars at 300 °C, ramped through ballooning and rupture from 300 °C to 1200 °C at 5 °C/s, held at 1200 °C for 86 s, cooled at 3 °C/s to ≈750°C, and rapidly cooled by water quench from ≈750 °C to 100 °C). Following cooling to room temperature (RT), the pellets were removed to prepare the samples for 4-point-bend tests (4-PBTs). These 4-PBTs were conducted at 1-mm/s displacement rate and at RT to failure (severing of the sample through a cross section). Load and deflection vs. time are recorded during a test, and ductility, strength and toughness of a cladding material are evaluated from the load displacement data. Figure 22 shows an overview of the 4-PB equipment.
STUDSVIK NUCLEAR AB STUDSVIK/N-11/130 26 2012-07-02
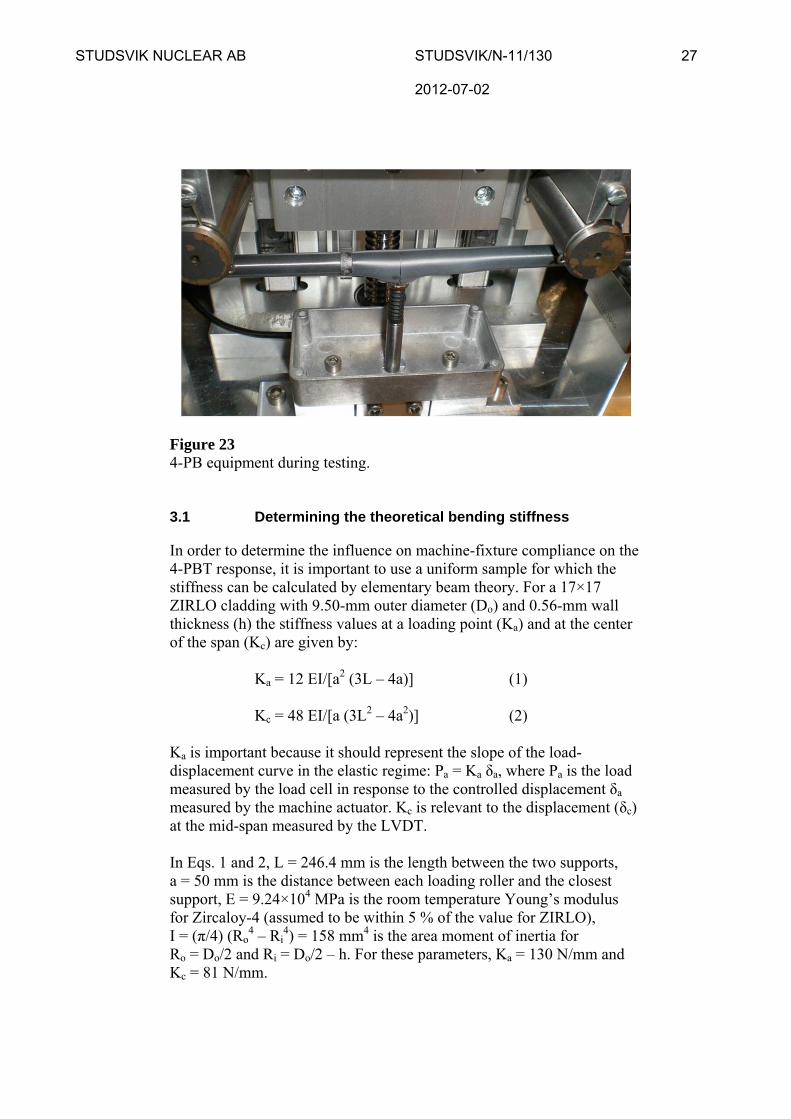
Figure 22 4-PB equipment before starting the tests. The results obtained in preliminary bend tests indicate that a typical load to break an as-received, ballooned, ruptured and then oxidized cladding material is between 150 – 400 N and a typical deflection at break between 2 – 4 mm. The location of the break may vary, e.g., with initial designs of the TC clamp, sometimes the break was located at the clamp location, but once the design was improved, the failure no longer occurred at this location. Figure 23 shows the 4-PB machine during a test where a test rod is just about to bend.
STUDSVIK NUCLEAR AB STUDSVIK/N-11/130 27 2012-07-02
Figure 23 4-PB equipment during testing. 3.1 Determining the theoretical bending stiffness
In order to determine the influence on machine-fixture compliance on the 4-PBT response, it is important to use a uniform sample for which the stiffness can be calculated by elementary beam theory. For a 17×17 ZIRLO cladding with 9.50-mm outer diameter (Do) and 0.56-mm wall thickness (h) the stiffness values at a loading point (Ka) and at the center of the span (Kc) are given by:
Ka = 12 EI/[a2 (3L – 4a)] (1) Kc = 48 EI/[a (3L2 – 4a2)] (2)
Ka is important because it should represent the slope of the load-displacement curve in the elastic regime: Pa = Ka δa, where Pa is the load measured by the load cell in response to the controlled displacement δa measured by the machine actuator. Kc is relevant to the displacement (δc) at the mid-span measured by the LVDT. In Eqs. 1 and 2, L = 246.4 mm is the length between the two supports, a = 50 mm is the distance between each loading roller and the closest support, E = 9.24×10⁴ MPa is the room temperature Young’s modulus for Zircaloy-4 (assumed to be within 5 % of the value for ZIRLO), I = (π/4) (Ro
4 – Ri4) = 158 mm4 is the area moment of inertia for
Ro = Do/2 and Ri = Do/2 – h. For these parameters, Ka = 130 N/mm and Kc = 81 N/mm.
STUDSVIK NUCLEAR AB STUDSVIK/N-11/130 28 2012-07-02
3.2 Investigating the influence of fuel rod test train components
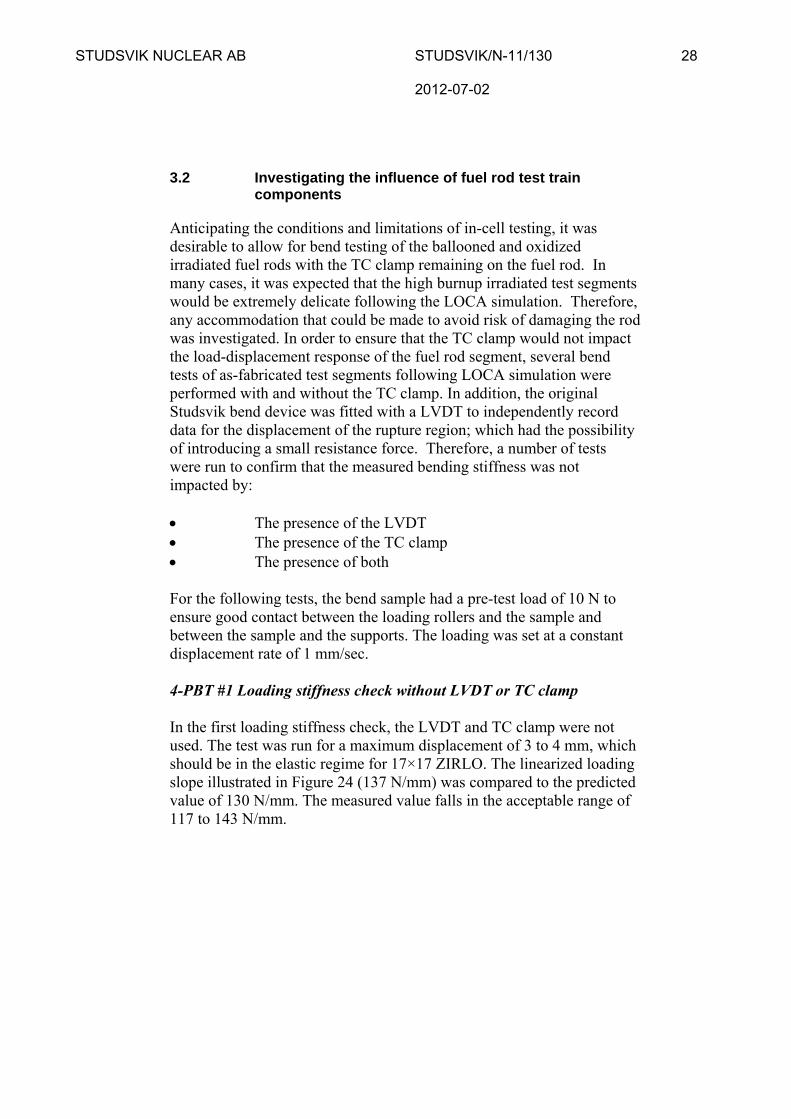
Anticipating the conditions and limitations of in-cell testing, it was desirable to allow for bend testing of the ballooned and oxidized irradiated fuel rods with the TC clamp remaining on the fuel rod. In many cases, it was expected that the high burnup irradiated test segments would be extremely delicate following the LOCA simulation. Therefore, any accommodation that could be made to avoid risk of damaging the rod was investigated. In order to ensure that the TC clamp would not impact the load-displacement response of the fuel rod segment, several bend tests of as-fabricated test segments following LOCA simulation were performed with and without the TC clamp. In addition, the original Studsvik bend device was fitted with a LVDT to independently record data for the displacement of the rupture region; which had the possibility of introducing a small resistance force. Therefore, a number of tests were run to confirm that the measured bending stiffness was not impacted by: The presence of the LVDT The presence of the TC clamp The presence of both For the following tests, the bend sample had a pre-test load of 10 N to ensure good contact between the loading rollers and the sample and between the sample and the supports. The loading was set at a constant displacement rate of 1 mm/sec. 4-PBT #1 Loading stiffness check without LVDT or TC clamp In the first loading stiffness check, the LVDT and TC clamp were not used. The test was run for a maximum displacement of 3 to 4 mm, which should be in the elastic regime for 17×17 ZIRLO. The linearized loading slope illustrated in Figure 24 (137 N/mm) was compared to the predicted value of 130 N/mm. The measured value falls in the acceptable range of 117 to 143 N/mm.
STUDSVIK NUCLEAR AB STUDSVIK/N-11/130 29 2012-07-02
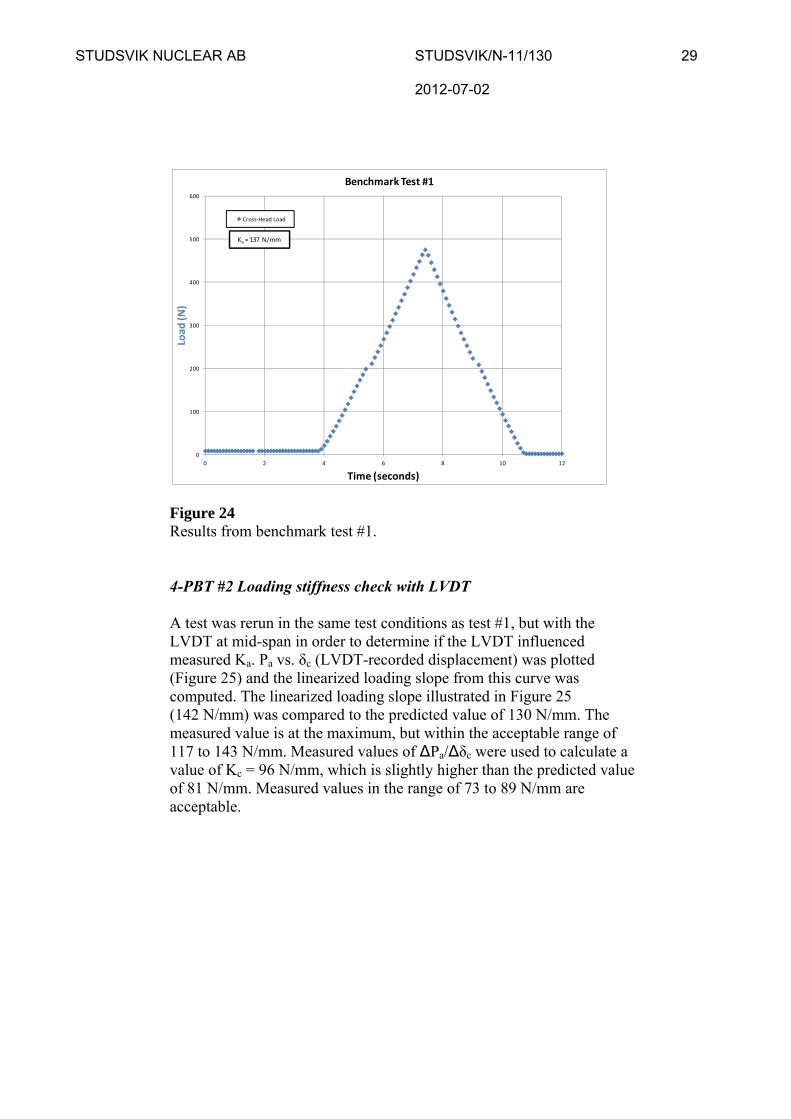
Figure 24 Results from benchmark test #1. 4-PBT #2 Loading stiffness check with LVDT A test was rerun in the same test conditions as test #1, but with the LVDT at mid-span in order to determine if the LVDT influenced measured Ka. Pa vs. δc (LVDT-recorded displacement) was plotted (Figure 25) and the linearized loading slope from this curve was computed. The linearized loading slope illustrated in Figure 25 (142 N/mm) was compared to the predicted value of 130 N/mm. The measured value is at the maximum, but within the acceptable range of 117 to 143 N/mm. Measured values of ∆Pa/∆δc were used to calculate a value of Kc = 96 N/mm, which is slightly higher than the predicted value of 81 N/mm. Measured values in the range of 73 to 89 N/mm are acceptable.
0
100
200
300
400
500
600
0 2 4 6 8 10 12
Load
(N)
Time (seconds)
Benchmark Test #1
Cross‐Head Load
Ka = 137 N/mm
STUDSVIK NUCLEAR AB STUDSVIK/N-11/130 30 2012-07-02
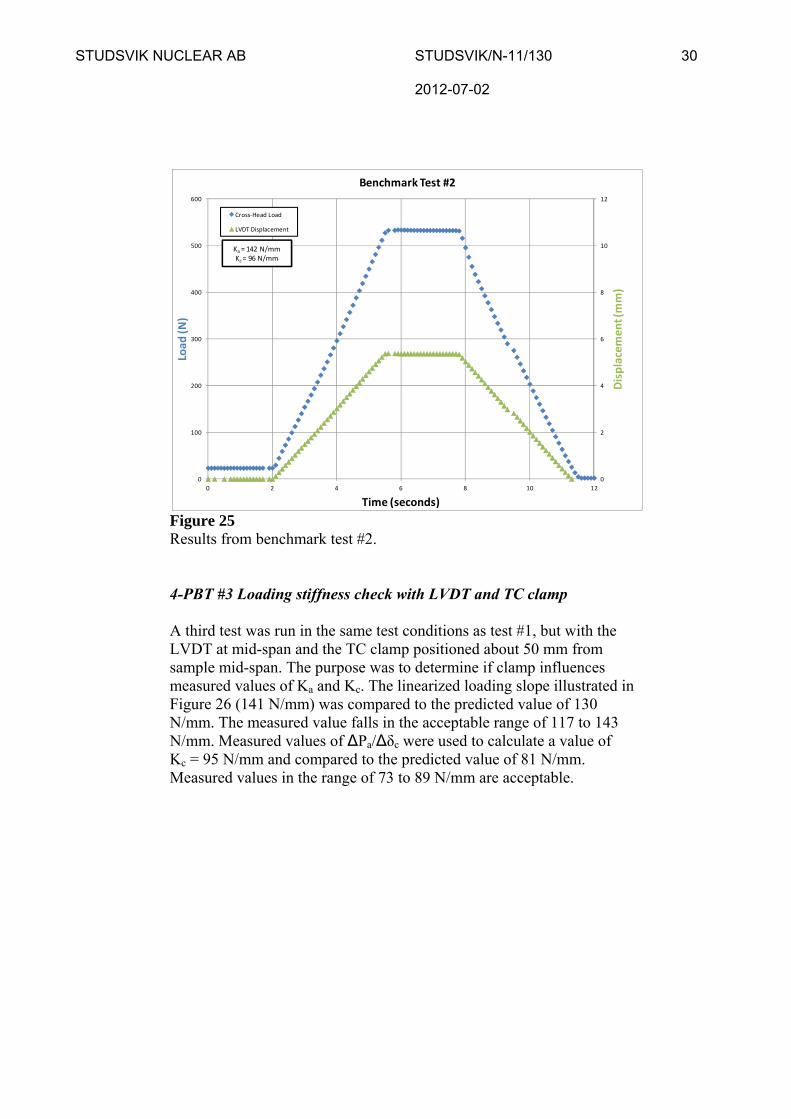
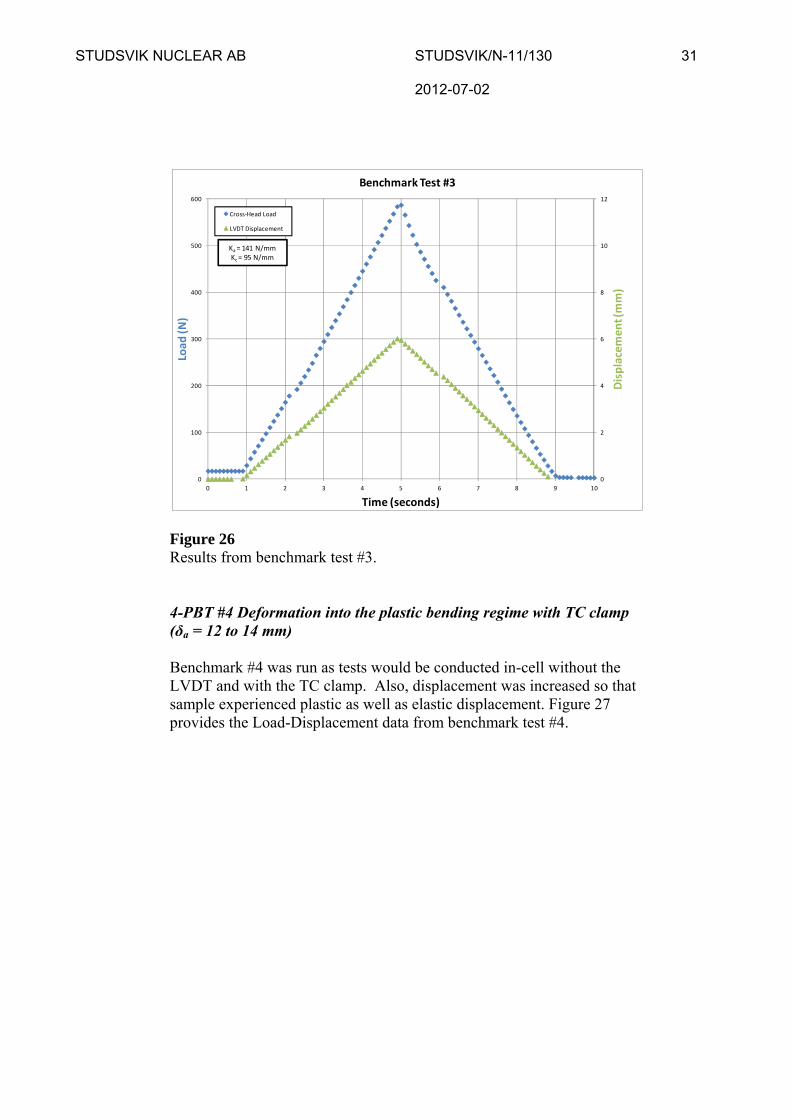
Figure 25 Results from benchmark test #2. 4-PBT #3 Loading stiffness check with LVDT and TC clamp A third test was run in the same test conditions as test #1, but with the LVDT at mid-span and the TC clamp positioned about 50 mm from sample mid-span. The purpose was to determine if clamp influences measured values of Ka and Kc. The linearized loading slope illustrated in Figure 26 (141 N/mm) was compared to the predicted value of 130 N/mm. The measured value falls in the acceptable range of 117 to 143 N/mm. Measured values of ∆Pa/∆δc were used to calculate a value of Kc = 95 N/mm and compared to the predicted value of 81 N/mm. Measured values in the range of 73 to 89 N/mm are acceptable.
0
2
4
6
8
10
12
0
100
200
300
400
500
600
0 2 4 6 8 10 12
Displacement (mm)
Load (N)
Time (seconds)
Benchmark Test #2
Cross‐Head Load
LVDT Displacement
Ka = 142 N/mmKc= 96 N/mm
STUDSVIK NUCLEAR AB STUDSVIK/N-11/130 31 2012-07-02
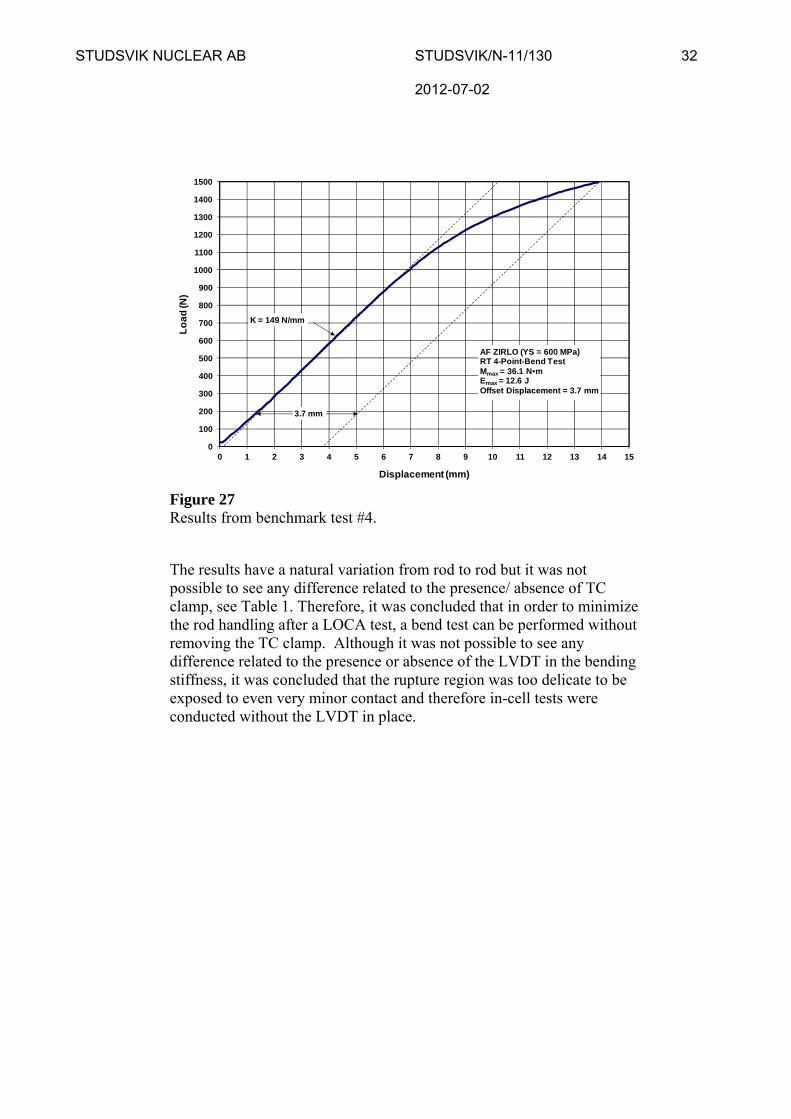
Figure 26 Results from benchmark test #3. 4-PBT #4 Deformation into the plastic bending regime with TC clamp (δa = 12 to 14 mm) Benchmark #4 was run as tests would be conducted in-cell without the LVDT and with the TC clamp. Also, displacement was increased so that sample experienced plastic as well as elastic displacement. Figure 27 provides the Load-Displacement data from benchmark test #4.
0
2
4
6
8
10
12
0
100
200
300
400
500
600
0 1 2 3 4 5 6 7 8 9 10
Displacement (mm)
Load (N)
Time (seconds)
Benchmark Test #3
Cross‐Head Load
LVDT Displacement
Ka = 141 N/mmKc= 95 N/mm
STUDSVIK NUCLEAR AB STUDSVIK/N-11/130 32 2012-07-02
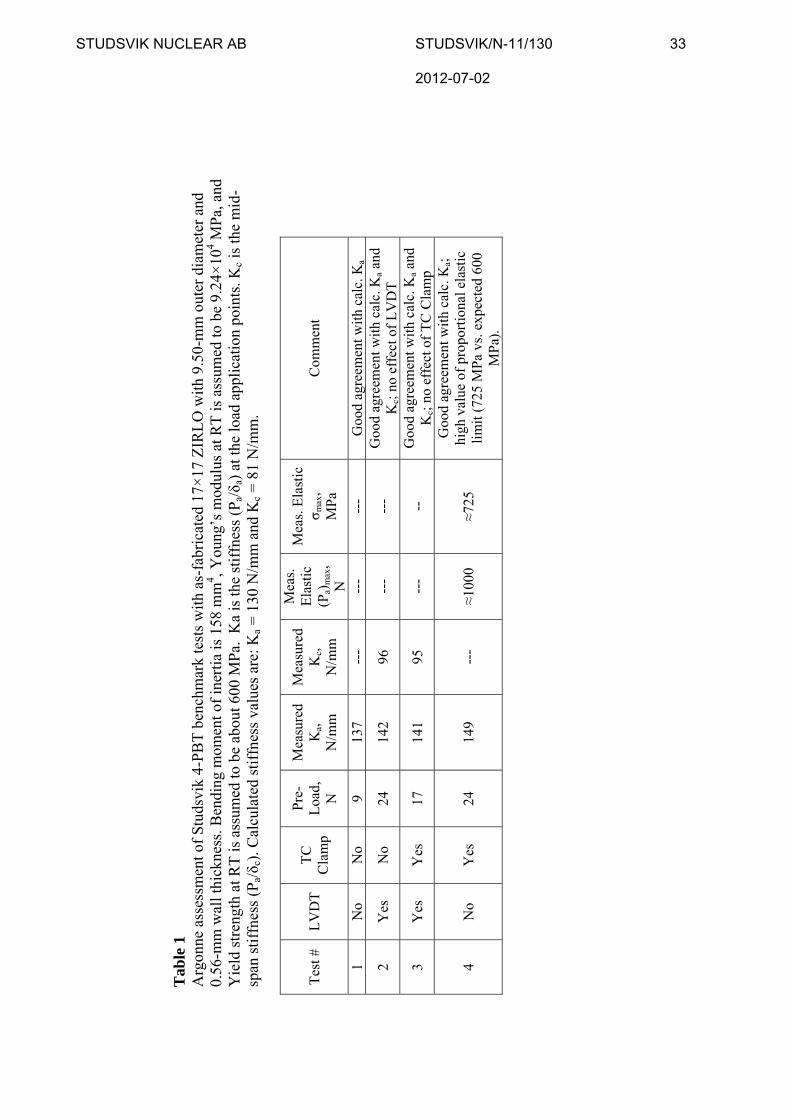
Figure 27 Results from benchmark test #4. The results have a natural variation from rod to rod but it was not possible to see any difference related to the presence/ absence of TC clamp, see Table 1. Therefore, it was concluded that in order to minimize the rod handling after a LOCA test, a bend test can be performed without removing the TC clamp. Although it was not possible to see any difference related to the presence or absence of the LVDT in the bending stiffness, it was concluded that the rupture region was too delicate to be exposed to even very minor contact and therefore in-cell tests were conducted without the LVDT in place.
0
100
200
300
400
500
600
700
800
900
1000
1100
1200
1300
1400
1500
0 1 2 3 4 5 6 7 8 9 10 11 12 13 14 15
Lo
ad
(N)
Displacement (mm)
K = 149 N/mm
3.7 mm
AF ZIRLO (YS = 600 MPa)RT 4-Point-Bend TestMmax = 36.1 N•mEmax = 12.6 JOffset Displacement = 3.7 mm
Tab
le 1
A
rgon
ne a
sses
smen
t of
Stu
dsvi
k 4-
PBT
ben
chm
ark
test
s w
ith
as-f
abri
cate
d 17
×17
ZIR
LO
wit
h 9.
50-m
m o
uter
dia
met
er a
nd
0.56
-mm
wal
l thi
ckne
ss. B
endi
ng m
omen
t of
iner
tia
is 1
58 m
m4 , Y
oung
’s m
odul
us a
t RT
is a
ssum
ed to
be
9.24
×10
4 MP
a, a
nd
Yie
ld s
tren
gth
at R
T is
ass
umed
to b
e ab
out 6
00 M
Pa.
Ka
is th
e st
iffn
ess
(Pa/δ a
) at
the
load
app
lica
tion
poi
nts.
Kc i
s th
e m
id-
span
sti
ffne
ss (
P a/δ
c). C
alcu
late
d st
iffn
ess
valu
es a
re: K
a = 1
30 N
/mm
and
Kc =
81
N/m
m.
Tes
t #
LV
DT
T
C
Cla
mp
Pre
- L
oad,
N
Mea
sure
d K
a, N
/mm
Mea
sure
d K
c, N
/mm
Mea
s.
Ela
stic
(P
a)m
ax,
N
Mea
s. E
last
ic
σ max
, M
Pa
Com
men
t
1 N
o N
o 9
137
---
---
---
Goo
d ag
reem
ent w
ith
calc
. Ka
2 Y
es
No
24
142
96
---
---
Goo
d ag
reem
ent w
ith
calc
. Ka a
nd
Kc;
no
effe
ct o
f L
VD
T
3 Y
es
Yes
17
14
1 95
--
- --
G
ood
agre
emen
t wit
h ca
lc. K
a and
K
c; n
o ef
fect
of
TC
Cla
mp
4 N
o Y
es
24
149
---
≈100
0 ≈7
25
Goo
d ag
reem
ent w
ith
calc
. Ka;
hi
gh v
alue
of
prop
ortio
nal e
last
ic
lim
it (
725
MP
a vs
. exp
ecte
d 60
0 M
Pa)
.
STUDSVIK NUCLEAR AB STUDSVIK/N-11/130 33 2012-07-02
STUDSVIK NUCLEAR AB STUDSVIK/N-11/130 34 2012-07-02
3.3 Benchmarking mechanical results between ANL and Studsvik
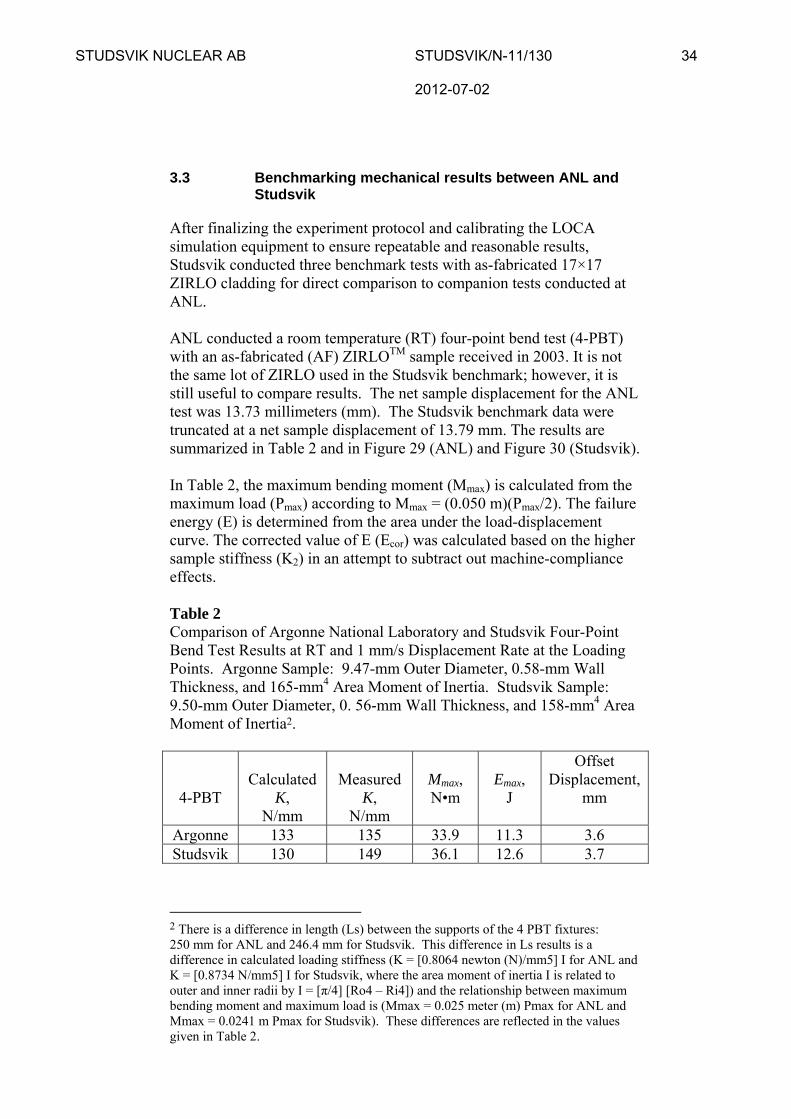
After finalizing the experiment protocol and calibrating the LOCA simulation equipment to ensure repeatable and reasonable results, Studsvik conducted three benchmark tests with as-fabricated 17×17 ZIRLO cladding for direct comparison to companion tests conducted at ANL. ANL conducted a room temperature (RT) four-point bend test (4-PBT) with an as-fabricated (AF) ZIRLOTM sample received in 2003. It is not the same lot of ZIRLO used in the Studsvik benchmark; however, it is still useful to compare results. The net sample displacement for the ANL test was 13.73 millimeters (mm). The Studsvik benchmark data were truncated at a net sample displacement of 13.79 mm. The results are summarized in Table 2 and in Figure 29 (ANL) and Figure 30 (Studsvik). In Table 2, the maximum bending moment (Mmax) is calculated from the maximum load (Pmax) according to Mmax = (0.050 m)(Pmax/2). The failure energy (E) is determined from the area under the load-displacement curve. The corrected value of E (Ecor) was calculated based on the higher sample stiffness (K2) in an attempt to subtract out machine-compliance effects. Table 2 Comparison of Argonne National Laboratory and Studsvik Four-Point Bend Test Results at RT and 1 mm/s Displacement Rate at the Loading Points. Argonne Sample: 9.47-mm Outer Diameter, 0.58-mm Wall Thickness, and 165-mm4 Area Moment of Inertia. Studsvik Sample: 9.50-mm Outer Diameter, 0. 56-mm Wall Thickness, and 158-mm4 Area Moment of Inertia2.
4-PBT
Calculated
K, N/mm
Measured
K, N/mm
Mmax, N•m
Emax,
J
Offset Displacement,
mm
Argonne 133 135 33.9 11.3 3.6 Studsvik 130 149 36.1 12.6 3.7
2 There is a difference in length (Ls) between the supports of the 4 PBT fixtures: 250 mm for ANL and 246.4 mm for Studsvik. This difference in Ls results is a difference in calculated loading stiffness (K = [0.8064 newton (N)/mm5] I for ANL and K = [0.8734 N/mm5] I for Studsvik, where the area moment of inertia I is related to outer and inner radii by I = [π/4] [Ro4 – Ri4]) and the relationship between maximum bending moment and maximum load is (Mmax = 0.025 meter (m) Pmax for ANL and Mmax = 0.0241 m Pmax for Studsvik). These differences are reflected in the values given in Table 2.

STUDSVIK NUCLEAR AB STUDSVIK/N-11/130 35 2012-07-02
Figure 28 Load-displacement curve for Argonne National Laboratory four-point bend test benchmark conducted with AF ZIRLO-2003 at RT and 1 mm/s.
Figure 29 Load-displacement curve for Studsvik four-point bend test benchmark conducted with AF ZIRLO at RT and 1 mm/s. Differences in the results are relatively small and within variation from one lot of ZIRLO to another. The comparison confirms that the 4-PBT results are consistent and therefore, the results produced at ANL and Studsvik are comparable.
0
100
200
300
400
500
600
700
800
900
1000
1100
1200
1300
1400
1500
0 1 2 3 4 5 6 7 8 9 10 11 12 13 14 15
Displacement (mm)
Lo
ad (
N)
3.6 mm
K = 135 N/mm
AF ZIRLORT 4-Point-Bend TestMmax = 33.9 N•m
Emax = 11.3 J
Offset Displacement = 3.6 mm
0
100
200
300
400
500
600
700
800
900
1000
1100
1200
1300
1400
1500
0 1 2 3 4 5 6 7 8 9 10 11 12 13 14 15
Lo
ad
(N)
Displacement (mm)
K = 149 N/mm
3.7 mm
AF ZIRLO (YS = 600 MPa)RT 4-Point-Bend TestMmax = 36.1 N•mEmax = 12.6 JOffset Displacement = 3.7 mm
STUDSVIK NUCLEAR AB STUDSVIK/N-11/130 36 2012-07-02
4 Conclusions
This report summarizes the results of the first two phases of the LOCA project Studsvik has been performing on behalf of the USNRC. The Phase I comprised the build-up of LOCA apparatus and 4-point-bend equipment. The object of the Phase II was to benchmark the LOCA apparatus with out-of-cell tests using as-fabricated Zircaloy-4 and ZIRLO cladding tubes. The first step of the LOCA programme was started in late 2008 by visiting ANL’s facilities to study their LOCA equipment. By the end of 2009, the LOCA apparatus and control system at Studsvik were completed, adjusted and tested for out of cell testing. Also temperature calibrations and benchmarking with ANL results were performed. Several out-of-cell tests with unirradiated cladding material were performed and the performance of the LOCA apparatus was verified and improved to optimize the performance of the apparatus in the real LOCA tests with fuelled claddings. In addition to the LOCA apparatus, the 4-point-bend equipment was designed and built to measure load-displacement properties of the tested cladding materials. The work completed in Phase I and II characterized the temperature distribution and other critical conditions of the LOCA simulation equipment. The work also confirmed that the LOCA simulation equipment was able to induce repeatable and predictable ballooning and rupture behaviour. In addition, the measurements of temperature and pressure of the LOCA simulation equipment were determined to be valid and accurate. Finally, the four-point bend equipment at Studsvik was determined to measure values similar to those measured at ANL on companion material, thereby allowing for the comparison of data between the two laboratories.