Embed Size (px)
Citation preview
1
Department of Pesticide Regulation Environmental Monitoring Branch
1001 I Street Sacramento, CA 95812
STUDY 269 (FY2014-2015). Ambient and Mitigation Monitoring in Urban Areas in Northern California
Michael P. Ensminger
July 2014
I. INTRODUCTION The California Department of Pesticide Regulation’s (CDPR) Surface Water Protection Program (SWPP) has been monitoring urban pesticide runoff at numerous sampling sites since 2008 (He, 2008). A major portion of this work has been to determine the pesticides in urban runoff in targeted monitoring in northern and southern California. In this work, 32 different pesticides have been detected, with bifenthrin, imidacloprid, fipronil, 2,4-D, dicamba, triclopyr, and diuron being most frequent detections. Of these, bifenthrin and fipronil are of most concern to aquatic organisms; their detections frequently exceed US EPA aquatic life benchmarks (Ensminger et al., 2013). With this monitoring, the SWPP has established several long term monitoring sites in northern and southern California. Long term monitoring sites allow for determining temporal and spatial pesticide runoff trends. For example, it has long been known that Orange County has a much higher detection frequency of fipronil than in other areas of the state, and recently it has been noticed that concentrations of bifenthrin in water samples have decreased during dry weather monitoring in some northern California sampling sites (Ensminger and Kelly, 2011; Ensminger and Budd, 2014). Additional monitoring at these long term monitoring sites will help determine other pesticide runoff trends. However, spatial distribution of CDPR’s sampling sites has been limited to two main areas: Sacramento area and Orange County. Specifically for northern California urban monitoring in FY 2014-2015, additional monitoring sites in the Sacramento and in the San Francisco Bay area will widen the spatial distribution. These sites will be used to determine the extent of pesticide runoff into ecologically sensitive areas (Sacramento River, San Francisco Bay) from specific watersheds. A second major undertaking for the SWPP has been to measure the effectiveness of best management practices implemented by local municipalities to mitigate urban runoff. Municipalities in California are charged with developing and implementing a storm water management plan to reduce the discharge of pollutants (including pesticides) to the “maximum extent practicable” (Cal/EPA, 2014). Such programs include outreach and education, as well as best management practices to curtail runoff. Outreach programs have been developed to increase consumer awareness (Sacramento Stormwater Quality Partnership, 2012; UC IPM Online, 2013; Our Water – Our World, 2014), but success of these programs to reduce pesticide runoff is unknown. On the other hand, best management practices as constructed wetlands have good potential to reduce pesticide runoff and their efficacy has been documented (Budd, 2011). The city of Folsom, California requires new development projects to minimize stormwater runoff by integrating stormwater quality treatment controls into the design of the project (City of Folsom,
2
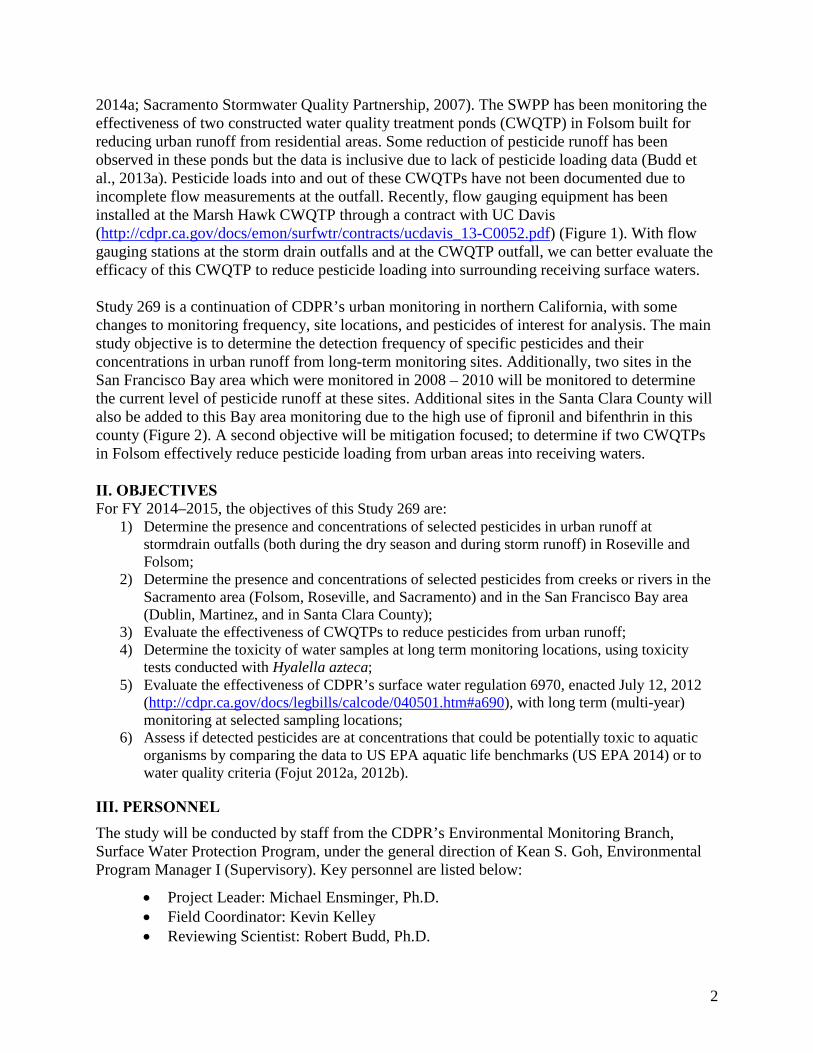
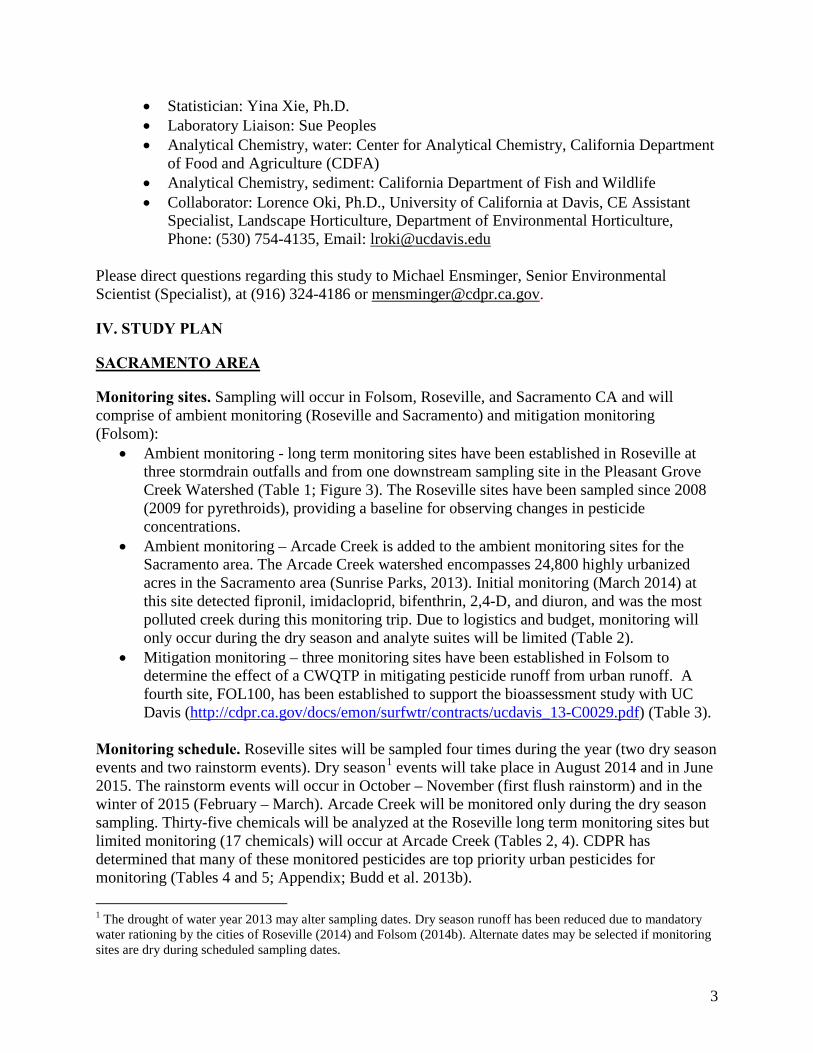
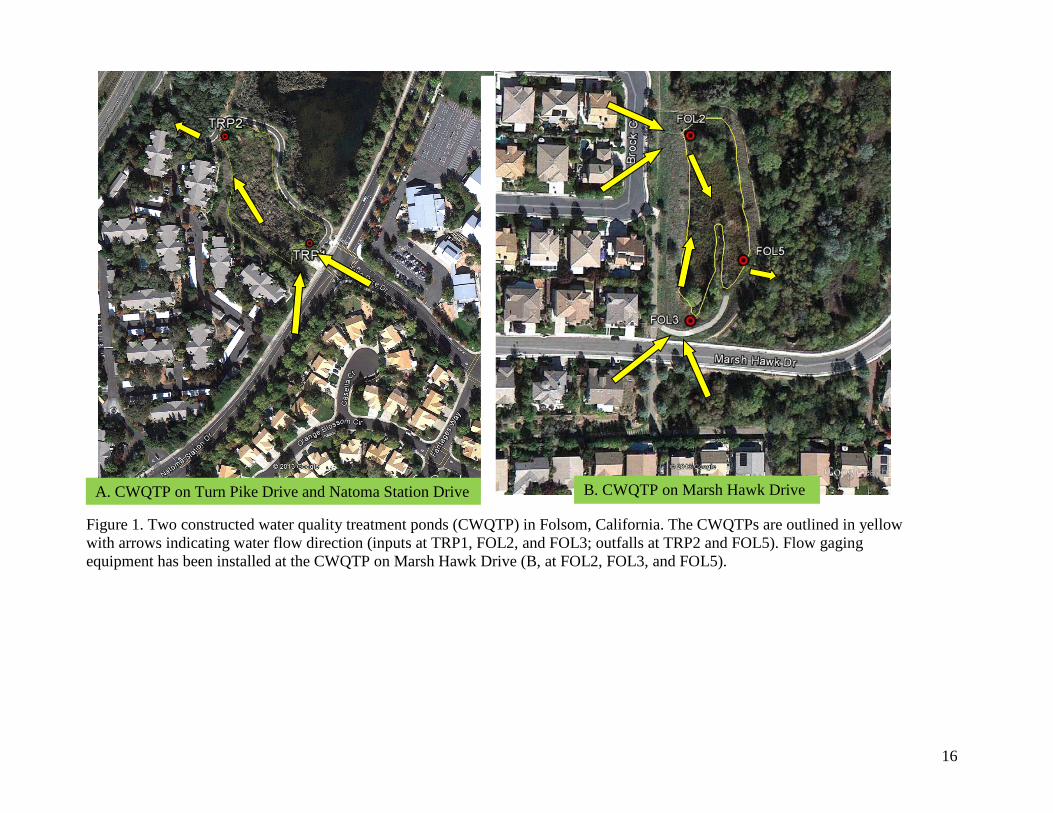
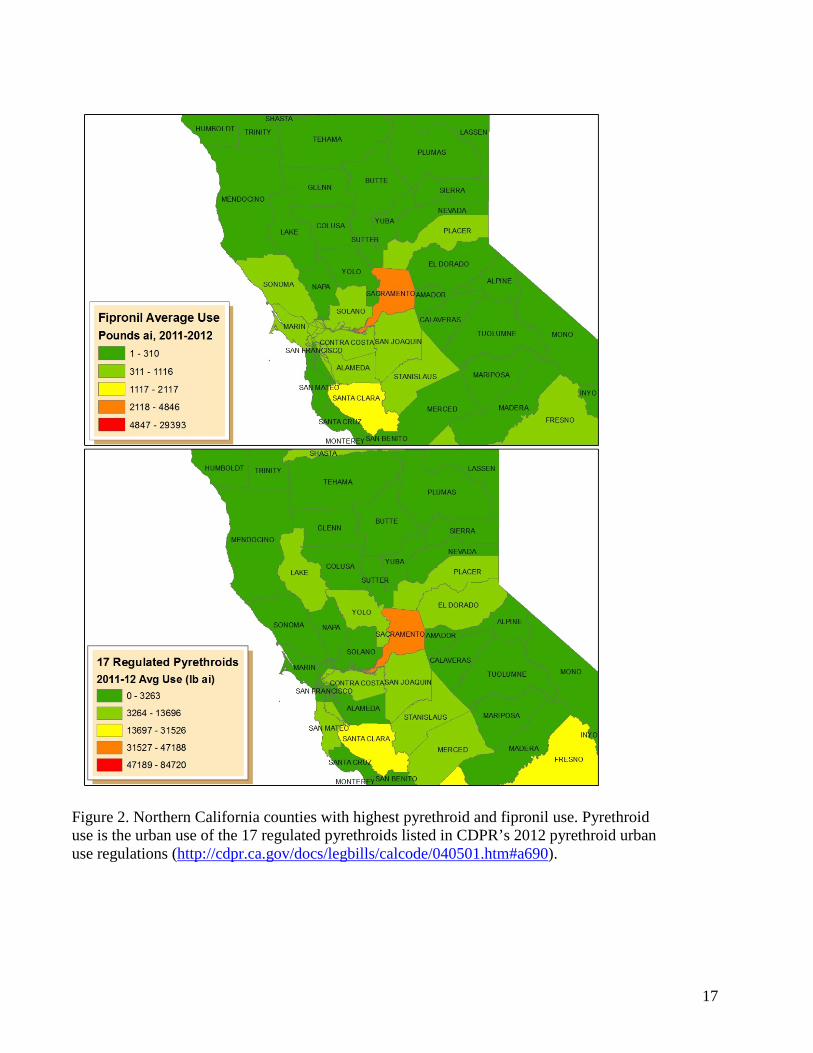
2014a; Sacramento Stormwater Quality Partnership, 2007). The SWPP has been monitoring the effectiveness of two constructed water quality treatment ponds (CWQTP) in Folsom built for reducing urban runoff from residential areas. Some reduction of pesticide runoff has been observed in these ponds but the data is inclusive due to lack of pesticide loading data (Budd et al., 2013a). Pesticide loads into and out of these CWQTPs have not been documented due to incomplete flow measurements at the outfall. Recently, flow gauging equipment has been installed at the Marsh Hawk CWQTP through a contract with UC Davis (http://cdpr.ca.gov/docs/emon/surfwtr/contracts/ucdavis_13-C0052.pdf) (Figure 1). With flow gauging stations at the storm drain outfalls and at the CWQTP outfall, we can better evaluate the efficacy of this CWQTP to reduce pesticide loading into surrounding receiving surface waters. Study 269 is a continuation of CDPR’s urban monitoring in northern California, with some changes to monitoring frequency, site locations, and pesticides of interest for analysis. The main study objective is to determine the detection frequency of specific pesticides and their concentrations in urban runoff from long-term monitoring sites. Additionally, two sites in the San Francisco Bay area which were monitored in 2008 – 2010 will be monitored to determine the current level of pesticide runoff at these sites. Additional sites in the Santa Clara County will also be added to this Bay area monitoring due to the high use of fipronil and bifenthrin in this county (Figure 2). A second objective will be mitigation focused; to determine if two CWQTPs in Folsom effectively reduce pesticide loading from urban areas into receiving waters. II. OBJECTIVES For FY 2014–2015, the objectives of this Study 269 are:
1) Determine the presence and concentrations of selected pesticides in urban runoff at stormdrain outfalls (both during the dry season and during storm runoff) in Roseville and Folsom;
2) Determine the presence and concentrations of selected pesticides from creeks or rivers in the Sacramento area (Folsom, Roseville, and Sacramento) and in the San Francisco Bay area (Dublin, Martinez, and in Santa Clara County);
3) Evaluate the effectiveness of CWQTPs to reduce pesticides from urban runoff; 4) Determine the toxicity of water samples at long term monitoring locations, using toxicity
tests conducted with Hyalella azteca; 5) Evaluate the effectiveness of CDPR’s surface water regulation 6970, enacted July 12, 2012
(http://cdpr.ca.gov/docs/legbills/calcode/040501.htm#a690), with long term (multi-year) monitoring at selected sampling locations;
6) Assess if detected pesticides are at concentrations that could be potentially toxic to aquatic organisms by comparing the data to US EPA aquatic life benchmarks (US EPA 2014) or to water quality criteria (Fojut 2012a, 2012b).
III. PERSONNEL The study will be conducted by staff from the CDPR’s Environmental Monitoring Branch, Surface Water Protection Program, under the general direction of Kean S. Goh, Environmental Program Manager I (Supervisory). Key personnel are listed below:
• Project Leader: Michael Ensminger, Ph.D. • Field Coordinator: Kevin Kelley • Reviewing Scientist: Robert Budd, Ph.D.
3
• Statistician: Yina Xie, Ph.D. • Laboratory Liaison: Sue Peoples • Analytical Chemistry, water: Center for Analytical Chemistry, California Department
of Food and Agriculture (CDFA) • Analytical Chemistry, sediment: California Department of Fish and Wildlife • Collaborator: Lorence Oki, Ph.D., University of California at Davis, CE Assistant
Specialist, Landscape Horticulture, Department of Environmental Horticulture, Phone: (530) 754-4135, Email: [email protected]
Please direct questions regarding this study to Michael Ensminger, Senior Environmental Scientist (Specialist), at (916) 324-4186 or [email protected].
IV. STUDY PLAN
SACRAMENTO AREA
Monitoring sites. Sampling will occur in Folsom, Roseville, and Sacramento CA and will comprise of ambient monitoring (Roseville and Sacramento) and mitigation monitoring (Folsom):
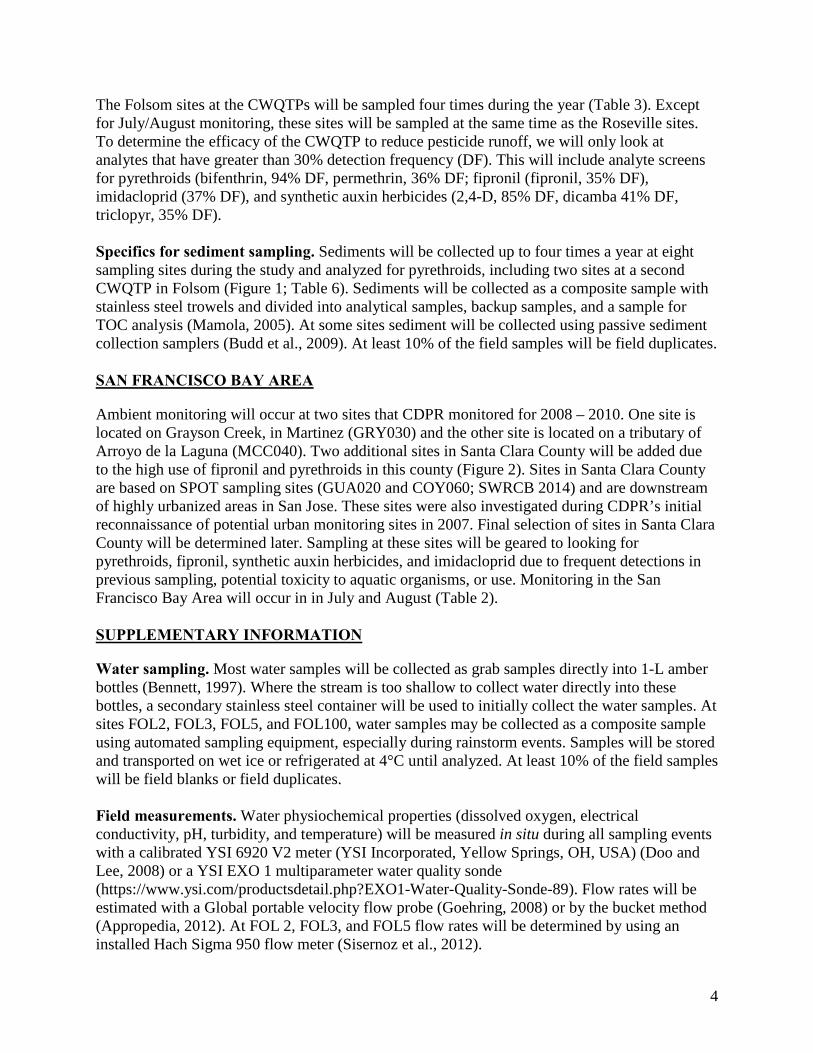
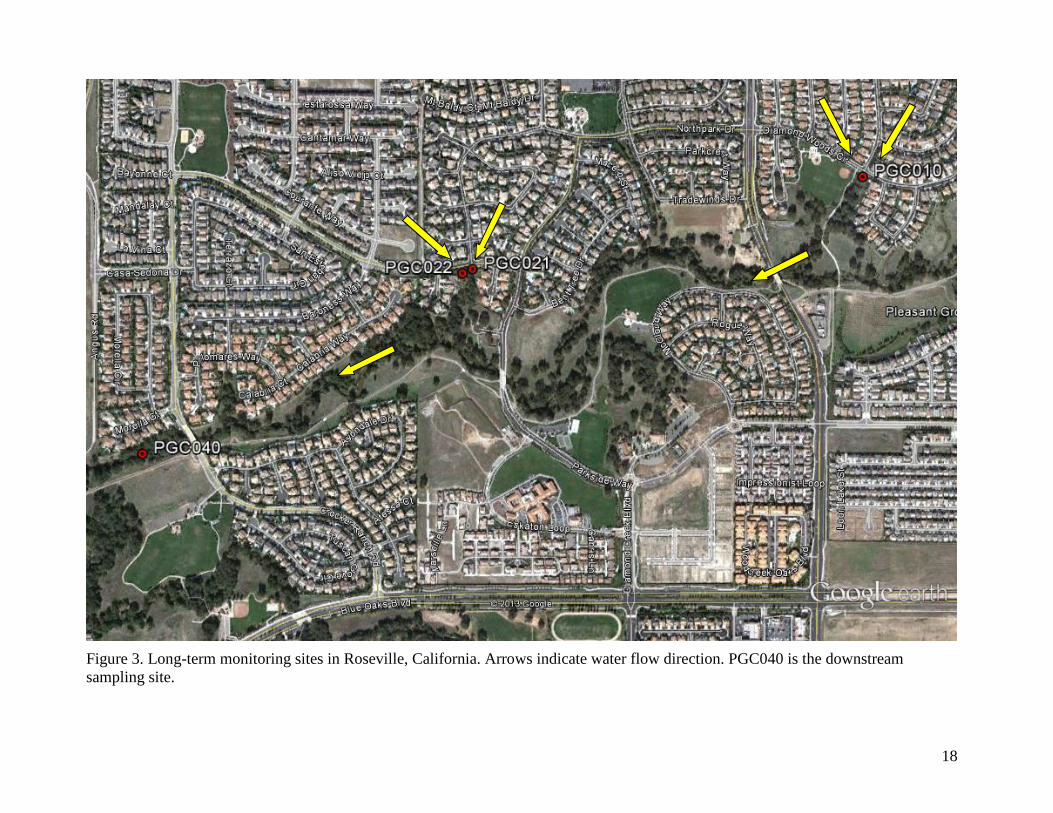
• Ambient monitoring - long term monitoring sites have been established in Roseville at three stormdrain outfalls and from one downstream sampling site in the Pleasant Grove Creek Watershed (Table 1; Figure 3). The Roseville sites have been sampled since 2008 (2009 for pyrethroids), providing a baseline for observing changes in pesticide concentrations.
• Ambient monitoring – Arcade Creek is added to the ambient monitoring sites for the Sacramento area. The Arcade Creek watershed encompasses 24,800 highly urbanized acres in the Sacramento area (Sunrise Parks, 2013). Initial monitoring (March 2014) at this site detected fipronil, imidacloprid, bifenthrin, 2,4-D, and diuron, and was the most polluted creek during this monitoring trip. Due to logistics and budget, monitoring will only occur during the dry season and analyte suites will be limited (Table 2).
• Mitigation monitoring – three monitoring sites have been established in Folsom to determine the effect of a CWQTP in mitigating pesticide runoff from urban runoff. A fourth site, FOL100, has been established to support the bioassessment study with UC Davis (http://cdpr.ca.gov/docs/emon/surfwtr/contracts/ucdavis_13-C0029.pdf) (Table 3).
Monitoring schedule. Roseville sites will be sampled four times during the year (two dry season events and two rainstorm events). Dry season1 events will take place in August 2014 and in June 2015. The rainstorm events will occur in October – November (first flush rainstorm) and in the winter of 2015 (February – March). Arcade Creek will be monitored only during the dry season sampling. Thirty-five chemicals will be analyzed at the Roseville long term monitoring sites but limited monitoring (17 chemicals) will occur at Arcade Creek (Tables 2, 4). CDPR has determined that many of these monitored pesticides are top priority urban pesticides for monitoring (Tables 4 and 5; Appendix; Budd et al. 2013b). 1 The drought of water year 2013 may alter sampling dates. Dry season runoff has been reduced due to mandatory water rationing by the cities of Roseville (2014) and Folsom (2014b). Alternate dates may be selected if monitoring sites are dry during scheduled sampling dates.
4
The Folsom sites at the CWQTPs will be sampled four times during the year (Table 3). Except for July/August monitoring, these sites will be sampled at the same time as the Roseville sites. To determine the efficacy of the CWQTP to reduce pesticide runoff, we will only look at analytes that have greater than 30% detection frequency (DF). This will include analyte screens for pyrethroids (bifenthrin, 94% DF, permethrin, 36% DF; fipronil (fipronil, 35% DF), imidacloprid (37% DF), and synthetic auxin herbicides (2,4-D, 85% DF, dicamba 41% DF, triclopyr, 35% DF). Specifics for sediment sampling. Sediments will be collected up to four times a year at eight sampling sites during the study and analyzed for pyrethroids, including two sites at a second CWQTP in Folsom (Figure 1; Table 6). Sediments will be collected as a composite sample with stainless steel trowels and divided into analytical samples, backup samples, and a sample for TOC analysis (Mamola, 2005). At some sites sediment will be collected using passive sediment collection samplers (Budd et al., 2009). At least 10% of the field samples will be field duplicates. SAN FRANCISCO BAY AREA
Ambient monitoring will occur at two sites that CDPR monitored for 2008 – 2010. One site is located on Grayson Creek, in Martinez (GRY030) and the other site is located on a tributary of Arroyo de la Laguna (MCC040). Two additional sites in Santa Clara County will be added due to the high use of fipronil and pyrethroids in this county (Figure 2). Sites in Santa Clara County are based on SPOT sampling sites (GUA020 and COY060; SWRCB 2014) and are downstream of highly urbanized areas in San Jose. These sites were also investigated during CDPR’s initial reconnaissance of potential urban monitoring sites in 2007. Final selection of sites in Santa Clara County will be determined later. Sampling at these sites will be geared to looking for pyrethroids, fipronil, synthetic auxin herbicides, and imidacloprid due to frequent detections in previous sampling, potential toxicity to aquatic organisms, or use. Monitoring in the San Francisco Bay Area will occur in in July and August (Table 2). SUPPLEMENTARY INFORMATION
Water sampling. Most water samples will be collected as grab samples directly into 1-L amber bottles (Bennett, 1997). Where the stream is too shallow to collect water directly into these bottles, a secondary stainless steel container will be used to initially collect the water samples. At sites FOL2, FOL3, FOL5, and FOL100, water samples may be collected as a composite sample using automated sampling equipment, especially during rainstorm events. Samples will be stored and transported on wet ice or refrigerated at 4°C until analyzed. At least 10% of the field samples will be field blanks or field duplicates. Field measurements. Water physiochemical properties (dissolved oxygen, electrical conductivity, pH, turbidity, and temperature) will be measured in situ during all sampling events with a calibrated YSI 6920 V2 meter (YSI Incorporated, Yellow Springs, OH, USA) (Doo and Lee, 2008) or a YSI EXO 1 multiparameter water quality sonde (https://www.ysi.com/productsdetail.php?EXO1-Water-Quality-Sonde-89). Flow rates will be estimated with a Global portable velocity flow probe (Goehring, 2008) or by the bucket method (Appropedia, 2012). At FOL 2, FOL3, and FOL5 flow rates will be determined by using an installed Hach Sigma 950 flow meter (Sisernoz et al., 2012).

5
Sample Transport. CDPR staff will transport samples following the procedures outlined in CDPR SOP QAQC004.01 (Jones, 1999). A chain-of-custody record will be completed and accompany each sample. Organic carbon and suspended sediment analysis. CDPR staff will analyze water and sediment samples for total organic carbon (TOC) using a TOC-V CSH/CNS analyzer (Shimadzu Corporation, Kyoto, Japan) (Ensminger and Goh, 2011; Ensminger, 2013a). Water samples will also be analyzed for suspended sediment (Lisker and Goh, 2010; Ensminger, 2013b). Toxicity sampling. During some of the monitoring, water will be collected from a subset of the sampling sites and sent to the University of Davis, Aquatic Health Program, to be tested for toxicity to Hyalella azteca. The Roseville long term monitoring sites will be the main focus for toxicity testing. Modifications for FY14 -15. The current sampling plan is an extension of urban monitoring in Northern California conducted during fiscal years 2010-2014 (for details of previous sampling protocols, see http://www.cdpr.ca.gov/docs/emon/pubs/protocol.htm for Study 269). The sampling and analysis schedule is similar to that for FY 13-14, with a few notable modifications (Table 7).
V. CHEMICAL ANALYSIS The Center for Analytical Chemistry, California Department of Food and Agriculture, Sacramento, CA (CDFA) will conduct the pesticide analysis for water samples. CDFA will analyze eight different analyte groups which will include 35 pesticides and degradates (Table 4). The California Department of Fish and Wildlife (CDFW) will conduct pesticide analyses for eight pyrethroids in sediment (Table 5). Laboratory QA/QC will follow CDPR guidelines and will consist of laboratory blanks, matrix spikes, matrix spike duplicates, surrogate spikes, and blind spikes (Segawa, 1995). Laboratory blanks and matrix spikes will be included in each extraction set.
VI. DATA ANALYSIS All data generated by this project will be entered to a Microsoft Office Access database that holds field information, field measurements, and laboratory analytical data. All ambient monitoring analytical data will also be uploaded into the CDPR Surface Water Database (http://cdpr.ca.gov/docs/emon/surfwtr/surfdata.htm). Initial analysis of urban monitoring data (Ensminger et al., 2013) has determined that the data is heavily skewed and does not follow a normal distribution, even with logarithm transformation. The non-normal structure posits a violation of the normality assumption of the commonly-used parametric procedures (tests based on the estimate of mean and standard deviation). Although some parametric procedures may be robust to the normality assumption, the use of these procedures on non-normal data will still lead to bias and low power. In addition, the sample data is highly censored and substitution of non-detections can result in inaccuracy of estimate and test result (Helsel, 2012, pp. 1-10). Moreover, the reporting limit (RL) for a given chemical can vary over time or differ between the chemical labs, which results in multiple RLs involved in the data. The presence of non-detections and multiple RLs limits the application of some widely-used
6
parametric procedures, such as analysis of variance (ANOVA) and t-tests. While some other parametric procedures, such as the censored regression by using maximum likelihood estimate (MLE), are capable of handling censored data with multiple RLs, the validity of their results depends on the selection of correct distribution. In other words, the procedure is not distribution free and may lose power if the data does not follow a specific distribution. In order to appropriately address the aforementioned characteristics of the sample data, a more generic and distribution-free approach, non-parametric statistics, will be used in this study. Helsel (2012) illustrated the application of non-parametric procedures to skewed and censored environmental data. We will primarily reference his book as a general guideline for data analysis of this study. The data will be analyzed by using R statistical program (http://www.r-project.org/), the Nondetects And Data Analysis for environmental data (NADA) package for R (http://cran.r-project.org/web/packages/NADA/NADA.pdf), and/or Minitab (http://www.minitab.com/en-us/). Based on the study objectives, preliminary analysis, and data availability, we propose the following statistical procedures for data analysis (Table 8): 1) Explanatory data analysis will be performed to summarize the characteristics of the sample
data. Urban monitoring data has been collected since 2008 for a variety of analytes (i.e., fipronil, 2,4-D, etc.; Tables 4 and 5) at multiple locations (i.e., Folsom, Roseville, Sacramento, and San Francisco Bay; Table 1) with different site types (i.e., stormdrain outfalls and receiving water), and between different seasons (i.e., dry and wet seasons). Plots, such as boxplots, histograms, probability plots, and empirical distribution functions, will be produced to explore any potential patterns implied by the data;
2) Hypothesis tests will be conducted to compare the concentration between groups of interest. For example, we will test whether or not there is significant difference in concentration between the dry and wet season, or between the different locations. Non-parametric procedures will be used to compute the statistics for hypothesis test. For data with multiple reporting limits, it will be censored at the highest limit before proceeding if the test procedure allows only one RL;
3) Trend analysis will be included to depict the change in concentration over time. We are specifically interested in determining the effectiveness of CDPR regulation 6970 which went into effect July 19, 2012 to mitigate pyrethroid contamination in urban waters. The ambient monitoring data from the Roseville sites and from FOL2 and FOL3 will be used. For the trend analysis, we will use Akritas-Thenil-Sen non-parametric regression which regresses the censored concentration on time, or the Kaplan-Meier method, which tests the effects of year, month and location by developing a mixed linear model between the censored concentration and the spatial-temporal factors.
Finally, we will attempt to develop statistical models to assess the factors potentially impacting pesticide concentration in surface water. One possible attempt is to develop a logistic regression model to estimate and predict the likelihood of detection or exceedance. The response variable will be the probability of the concentration being greater than or equal to the RLs or the toxicity benchmark. A series of explanatory variables will be examined, including: rainfall, field measurements (e.g., flow rate, pH, water TOC, sediment TOC, and TSS), number of households drains water into the storm drain outfall/creek, residential density (percent of impervious areas),
7
season, year, regulation, and so on. Further literature review will be conducted to identify possible explanatory variables in favor of the model.
VII. TIMETABLE Field Sampling: July 2014 – June 2015 Chemical Analysis: July 2014 – December 2015 Summary Report: March 2016
VIII. LABORATORY BUDGET The cost for the CDFA chemical analyses of water samples for mitigation monitoring is $44,820 (Table 3). Approximately $20,000 will be supplemented with funding through SWPP’s Mitigation BCP. (R. Budd, personal communication). The additional $24,820 to support mitigation monitoring (including the bioassessment support at FOL100) will be taken from the northern California ambient monitoring budget2. Ambient monitoring costs for chemical analysis of water samples by CDFA are $115,980; the total cost of the northern California monitoring (less $20,000 from the Mitigation BCP) will be approximately $140,800 (Tables 2 and 3). For CDFW chemical analysis (sediment samples), the total cost is $16,150 (Table 6). All costs are estimated and include field QC sample analysis (field blanks and field duplicates) but not laboratory QC.
IX. LITERATURE CITED Appropedia. 2012. How to measure stream flow rate.
http://www.appropedia.org/How_to_measure_stream_flow_rate. Accessed 26 June 2013. Bennett, K. 1997. California Department of Pesticide Regulation SOP FSWA002.00: Conducting surface water
monitoring for pesticides. http://www.cdpr.ca.gov/docs/emon/pubs/sops/fswa002.pdf. Accessed on 8 July 2013.
Budd, R., A. O'Geen, K. S. Goh, S. Bondarenko, J. Gan. 2009. Efficacy of constructed wetlands in pesticide removal from tailwaters in the Central Valley, California. Environmental Science and Technology 43: 2925-2930.
Budd, R. 2011 Use of Constructed wetlands as a best management practice to reduce pesticide loads. Budd, R., M. Ensminger, E. Kanawi, K. Goh. 2013a. Using water quality ponds to mitigate pesticides in urban
runoff. http://www.cdpr.ca.gov/docs/emon/surfwtr/swposters/norcal_setac_2013_poster_budd.pdf. Accessed 19 June 2013.
Budd, R., X. Deng, M. Ensminger, K. Starner, and Y. Luo. 2013b. Method for Prioritizing Urban Pesticides for Monitoring California’s Urban Surface Waters. http://cdpr.ca.gov/docs/emon/pubs/ehapreps/analysis_memos/budd_et_al_2013.pdf. Accessed 26 June 2013.
Cal/EPA. 2014. Storm water program. http://www.waterboards.ca.gov/water_issues/programs/stormwater/municipal.shtml Accessed 20 May 2014.
CCWD (Contra Costa Water District). 2014. http://www.ccwater.com/. Assessed 5 June 2014. City of Folsom. 2014a. Stormwater. http://www.folsom.ca.us/depts/admin/stormwater/default.asp#How Does Water
Pollution Occur. Accessed 19 May 2014. City of Folsom. 2014b. Water restrictions.
http://www.folsom.ca.us/news/displaynews.asp?NewsID=1028&TargetID=1. Assessed 5 June 2014. City of Roseville. 2014. Water efficiency.
https://www.roseville.ca.us/eu/water_utility/water_efficiency/default.asp. Assessed 5 June 2014.
2Total for FY 2013-14 was $140,310 (http://cdpr.ca.gov/docs/emon/pubs/protocol/study269protocol2013_14.pdf)
8
Doo, S. & He, L-M. 2008. California Department of Pesticide Regulation SOP EQWA010.00: Calibration, field measurement, cleaning, and storage of the YSI 6920 V2-2 multiparameter sonde. http://www.cdpr.ca.gov/docs/emon/pubs/sops/eqwa010.pdf. Assessed 27 June 2013.
DSRSD (Dublin San Ramon Services District. 2014. Drought Watch. http://www.dsrsd.com/news_and_event/droughtwatch.html. Assessed 5 June 2014.
Ensminger, M. and K.S. Goh. 2011. Total organic carbon analysis for sediment samples. https://www.youtube.com/watch?v=G8plNBgyHF8&list=PL6E5EB26821530A26&index=3. Assessed 12 June 2011.
Ensminger, M. and K. Kelley. 2011. Monitoring urban pesticide runoff in California 2008 - 2009 http://cdpr.ca.gov/docs/emon/pubs/ehapreps/study_249_ensminger.pdf. Assessed 11 June 2014.
Ensminger, M. 2013a. Analysis of whole sample suspended sediments in water http://cdpr.ca.gov/docs/emon/pubs/sops/meth01000.pdf. Assessed 12 June 2014.
Ensminger, M. 2013b. Water TOC analysis using the Shimadzu TOC-VCSN and ASI-V autosampler. http://cdpr.ca.gov/docs/emon/pubs/sops/meth01100.pdf. Assessed 12 June 2014.
Ensminger, M. P., R. Budd, K. C. Kelley, and K.S. Goh. 2013. Pesticide occurrence and aquatic benchmark exceedances in urban surface waters and sediments in three urban areas of California, USA, 2008-2011. Environ. Monit. Assess. 185: 3697-3710.
Ensminger, M. and R. Budd. 2014. Pyrethroid detections in urban surface waters post regulations. http://cdpr.ca.gov/docs/emon/surfwtr/presentations/ensminger_2014_jan_13_pyrethroid_trends.pdf. Accessed 19 May 2014.
Fojut, T. J., Palumbo, A. J., Tjeerdema, R. S. 2012a. Aquatic life water quality criteria derived via the UC Davis method: II Pyrethroid Insecticides. In R.S. Tjeerdema (Ed.), Aquatic life water quality criteria for selected pesticides (pp. 51-103). Reviews of Environmental Contamination and Toxicology 216, doi:10.1007/978-1-4614-2260-0_3
Fojut, T. J., Palumbo, A. J., Tjeerdema, R. S. 2012b. Aquatic life water quality criteria derived via the UC Davis method: III. Diuron. In R.S. Tjeerdema (Ed.), Aquatic life water quality criteria for selected pesticides (pp. 105-141). Reviews of Environmental Contamination and Toxicology 216, doi:10.1007/978-1-4614-2260-0_3
Goehring, M. 2008. California Department of Pesticide Regulation SOP FSWA014.00: Instructions for the use of the Global FP101 and FP201 flow probe for estimating velocity in wadable streams. http://www.cdpr.ca.gov/docs/emon/pubs/sops/fswa01401.pdf. Accessed 27 June 2013.
He, L. 2008. Study 249. Statewide urban pesticide use and water quality monitoring. http://www.cdpr.ca.gov/docs/emon/pubs/ehapreps/protocol/study249protocol.pdf Accessed 19 June 2013.
Jones, D. 1999. California Department of Pesticide Regulation SOP QAQC004.01: Transporting, packaging, and shipping samples from the field to the warehouse or laboratory. http://www.cdpr.ca.gov/docs/emon/pubs/sops/qaqc0401.pdf. Accessed 26 June 2013.
Helsel, D. R. (2012). Statistics for censored environmental data using Minitab® and R. 2nd ed. Hoboken, NJ: John Wiley & Sons, Inc.
Lisker, E. and K.S. Goh. 2010. Total suspended solids analysis. https://www.youtube.com/watch?v=bs0I-jkZ658&index=4&list=PL6E5EB26821530A26. Assessed 12 June 2014.
Mamola, M. 2005. California Department of Pesticide Regulation SOP FSWA016.00: Collecting sediment samples for pesticide analysis. http://www.cdpr.ca.gov/docs/emon/pubs/sops/fswa016.pdf. Accessed on 8 July 2013.
Our Water – Our World. 2014. http://ourwaterourworld.com/Home.aspx. Assessed 27 May 2014 Santa Clara Valley Water District. 2014. Water Conservation. http://www.valleywater.org/programs/waterconservation.aspx. Assessed 5 June 2014.
Sacramento Stormwater Quality Partnership. 2007. Stormwater Quality Design Manual for Sacramento and South Placer Regions http://www.beriverfriendly.net/newdevelopment/stormwaterqualitydesignmanual/. Accessed 19 May 2014.
Sacramento stormwater quality partnership. 2012. Pesticides. http://www.beriverfriendly.net/pesticides/. Accessed 27 May 2014.
SCVWD (Santa Clara Valley Water District). 2014. Water Conservation. http://www.valleywater.org/programs/waterconservation.aspx. Assessed 5 June 2014.
9
Segawa, R. 1995. California Department of Pesticide Regulation SOP QAQC001.00: Chemistry laboratory quality control. http://www.cdpr.ca.gov/docs/emon/pubs/sops/qaqc001.pdf. Assessed 8 July 2013.
Sisneroz, J., Q. Xiao, L.R. Oki, B.J. Pitton, D.L. Haver, T. J. Majcherek, R.L. Mazalewski, and M. Ensminger. 2012. Automated sampling of storm runoff from residential areas. http://cdpr.ca.gov/docs/emon/surfwtr/swposters/auto_sampling_residential_areas.pdf. Accessed 26 June 2013.
SWRCB 2014. Swamp. http://www.waterboards.ca.gov/water_issues/programs/swamp/reports.shtml#spot. Accessed 27 May 2014.
Sunrise Parks. 2013. Arcade Creek Park Preserve. http://sunriseparks.com/arcade-creek-park-preserve/. Assessed 9 June 2014.
UC IPM Online. 2013. Urban pesticides and water quality. http://www.ipm.ucdavis.edu/WATER/U/index.html. Accessed 27 May 2014
U.S. Environmental Protection Agency 2014. Office of Pesticide Programs. Aquatic life benchmarks. http://www.epa.gov/oppefed1/ecorisk_ders/aquatic_life_benchmark.htm. Accessed 28 May 2014.
10
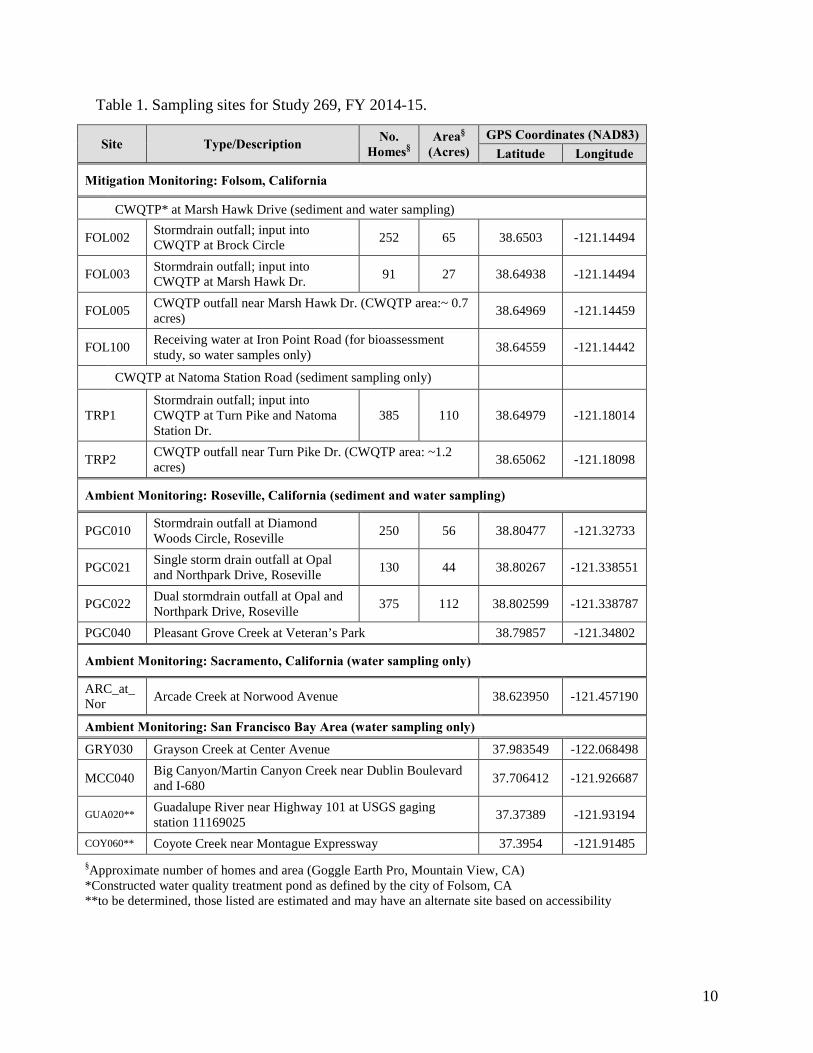
Table 1. Sampling sites for Study 269, FY 2014-15.
Site Type/Description No. Homes§
Area§ (Acres)
GPS Coordinates (NAD83) Latitude Longitude
Mitigation Monitoring: Folsom, California
CWQTP* at Marsh Hawk Drive (sediment and water sampling)
FOL002 Stormdrain outfall; input into CWQTP at Brock Circle 252 65 38.6503 -121.14494
FOL003 Stormdrain outfall; input into CWQTP at Marsh Hawk Dr. 91 27 38.64938 -121.14494
FOL005 CWQTP outfall near Marsh Hawk Dr. (CWQTP area:~ 0.7 acres) 38.64969 -121.14459
FOL100 Receiving water at Iron Point Road (for bioassessment study, so water samples only) 38.64559 -121.14442
CWQTP at Natoma Station Road (sediment sampling only)
TRP1 Stormdrain outfall; input into CWQTP at Turn Pike and Natoma Station Dr.
385 110 38.64979 -121.18014
TRP2 CWQTP outfall near Turn Pike Dr. (CWQTP area: ~1.2 acres) 38.65062 -121.18098
Ambient Monitoring: Roseville, California (sediment and water sampling)
PGC010 Stormdrain outfall at Diamond Woods Circle, Roseville 250 56 38.80477 -121.32733
PGC021 Single storm drain outfall at Opal and Northpark Drive, Roseville 130 44 38.80267 -121.338551
PGC022 Dual stormdrain outfall at Opal and Northpark Drive, Roseville 375 112 38.802599 -121.338787
PGC040 Pleasant Grove Creek at Veteran’s Park 38.79857 -121.34802
Ambient Monitoring: Sacramento, California (water sampling only)
ARC_at_ Nor Arcade Creek at Norwood Avenue 38.623950 -121.457190
Ambient Monitoring: San Francisco Bay Area (water sampling only)
GRY030 Grayson Creek at Center Avenue 37.983549 -122.068498
MCC040 Big Canyon/Martin Canyon Creek near Dublin Boulevard and I-680 37.706412 -121.926687
GUA020** Guadalupe River near Highway 101 at USGS gaging station 11169025 37.37389 -121.93194
COY060** Coyote Creek near Montague Expressway 37.3954 -121.91485 §Approximate number of homes and area (Goggle Earth Pro, Mountain View, CA) *Constructed water quality treatment pond as defined by the city of Folsom, CA **to be determined, those listed are estimated and may have an alternate site based on accessibility
11
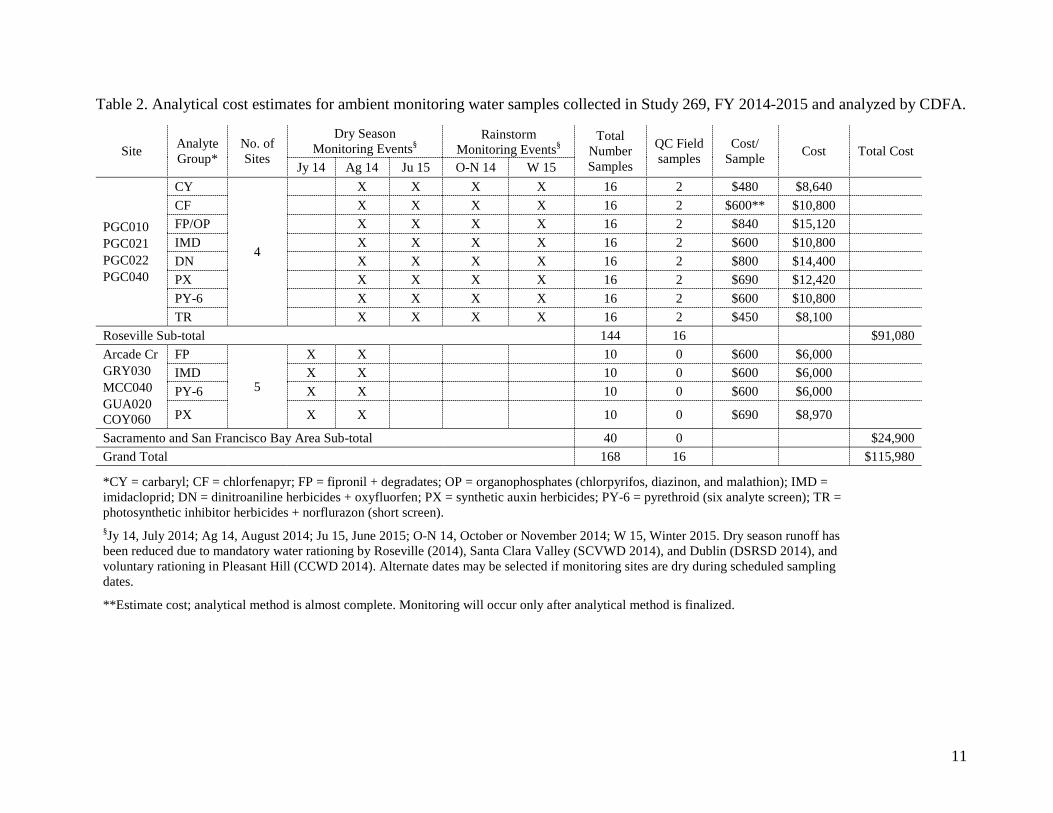
Table 2. Analytical cost estimates for ambient monitoring water samples collected in Study 269, FY 2014-2015 and analyzed by CDFA.
Site Analyte Group*
No. of Sites
Dry Season Monitoring Events§
Rainstorm Monitoring Events§
Total Number Samples
QC Field samples
Cost/ Sample Cost Total Cost
Jy 14 Ag 14 Ju 15 O-N 14 W 15
PGC010 PGC021 PGC022 PGC040
CY
4
X X X X 16 2 $480 $8,640 CF X X X X 16 2 $600** $10,800 FP/OP X X X X 16 2 $840 $15,120 IMD X X X X 16 2 $600 $10,800 DN X X X X 16 2 $800 $14,400 PX X X X X 16 2 $690 $12,420 PY-6 X X X X 16 2 $600 $10,800 TR X X X X 16 2 $450 $8,100
Roseville Sub-total 144 16 $91,080 Arcade Cr GRY030 MCC040 GUA020 COY060
FP
5
X X 10 0 $600 $6,000 IMD X X 10 0 $600 $6,000 PY-6 X X 10 0 $600 $6,000
PX X X 10 0 $690 $8,970
Sacramento and San Francisco Bay Area Sub-total 40 0 $24,900 Grand Total 168 16 $115,980
*CY = carbaryl; CF = chlorfenapyr; FP = fipronil + degradates; OP = organophosphates (chlorpyrifos, diazinon, and malathion); IMD = imidacloprid; DN = dinitroaniline herbicides + oxyfluorfen; PX = synthetic auxin herbicides; PY-6 = pyrethroid (six analyte screen); TR = photosynthetic inhibitor herbicides + norflurazon (short screen). §Jy 14, July 2014; Ag 14, August 2014; Ju 15, June 2015; O-N 14, October or November 2014; W 15, Winter 2015. Dry season runoff has been reduced due to mandatory water rationing by Roseville (2014), Santa Clara Valley (SCVWD 2014), and Dublin (DSRSD 2014), and voluntary rationing in Pleasant Hill (CCWD 2014). Alternate dates may be selected if monitoring sites are dry during scheduled sampling dates.
**Estimate cost; analytical method is almost complete. Monitoring will occur only after analytical method is finalized.
12
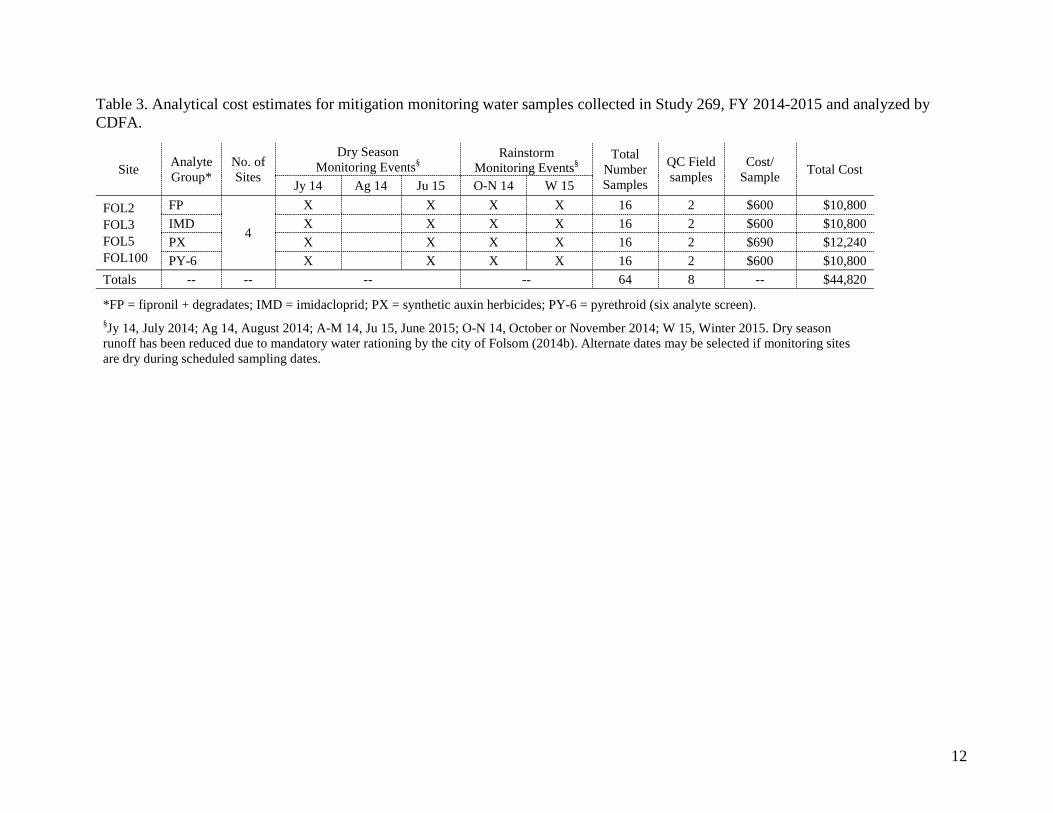
Table 3. Analytical cost estimates for mitigation monitoring water samples collected in Study 269, FY 2014-2015 and analyzed by CDFA.
Site Analyte Group*
No. of Sites
Dry Season Monitoring Events§
Rainstorm Monitoring Events§
Total Number Samples
QC Field samples
Cost/ Sample Total Cost
Jy 14 Ag 14 Ju 15 O-N 14 W 15
FOL2 FOL3 FOL5 FOL100
FP
4
X X X X 16 2 $600 $10,800 IMD X X X X 16 2 $600 $10,800 PX X X X X 16 2 $690 $12,240 PY-6 X X X X 16 2 $600 $10,800
Totals -- -- -- -- 64 8 -- $44,820
*FP = fipronil + degradates; IMD = imidacloprid; PX = synthetic auxin herbicides; PY-6 = pyrethroid (six analyte screen). §Jy 14, July 2014; Ag 14, August 2014; A-M 14, Ju 15, June 2015; O-N 14, October or November 2014; W 15, Winter 2015. Dry season runoff has been reduced due to mandatory water rationing by the city of Folsom (2014b). Alternate dates may be selected if monitoring sites are dry during scheduled sampling dates.

13
Table 4. Chemical analysis of pesticides in the northern California urban monitoring Study 269. The California Department of Food and Agriculture (CDFA) will analyze all water samples. Specific methods can be found at http://www.cdpr.ca.gov/docs/emon/pubs/em_methd_main.htm.
Pesticide Analyte Screen (Method ID)
Method Detection Limit (μg L-1)
Reporting Limit (μg L-1)
Carbaryl* Carbaryl (CY) (EMON-SM11.3) 0.0111 0.05
Chlorfenapyr* (not yet available) tbd 0.1 Fipronil*
Fipronil (FP) + Organophosphate (OP) (EMON-SM 05-013)
0.004 0.05 Fipronil sulfide 0.003 0.05 Fipronil sulfone 0.005 0.05 Fipronil desulfinyl 0.003 0.05 Fipronil desulfinyl amide 0.005 0.05 Fipronil amide 0.005 0.05 Diazinon 0.0012 0.01 Chlorpyrifos* 0.0079 0.01 Malathion* 0.0117 0.04 Imidacloprid* Imidacloprid (IMD) 0.0101 0.05 Bifenthrin* Pyrethroid (PY-6)
(EMON-SM 05-022)
0.00176 0.005 Cyfluthrin* 0.00173 0.015 Cypermethrin* 0.00175 0.015 Deltamethrin/Tralomethrin* 0.00177 0.005 Lambda-cyhalothrin* 0.00115 0.015 Permethrin cis* 0.00352 0.015 Permethrin trans* 0.00768 0.015 Benfluralin Dinitroaniline (DN)
(EMON-SM-05-006) 0.012 0.05
Ethalfluralin 0.015 0.05 Oryzalin* 0.021 0.05 Oxyfluorfen* 0.0101 0.05 Pendimethalin* 0.012 0.05 Prodiamine* 0.0124 0.05 Trifluralin 0.0144 0.05 Bromacil* Photosynthetic Inhibitor
Herbicides and Norflorazon (TR) (EMON-SM-62.9)
0.031 0.05 Diuron* 0.022 0.05 Hexazionone* 0.04 0.05 Norflorazon 0.019 0.05 Prometon 0.016 0.05 Simazine 0.013 0.05 2,4-D*
Synthetic Auxin Herbicides (PX)
EMON-SM-05-012)
0.015 0.05 Dicamba 0.017 0.05 MCPA 0.022 0.05 Triclopyr* 0.020 0.05
*Listed in CDPR’s top 35 pesticides with highest priority for urban monitoring (Budd et al. 2013b).
14
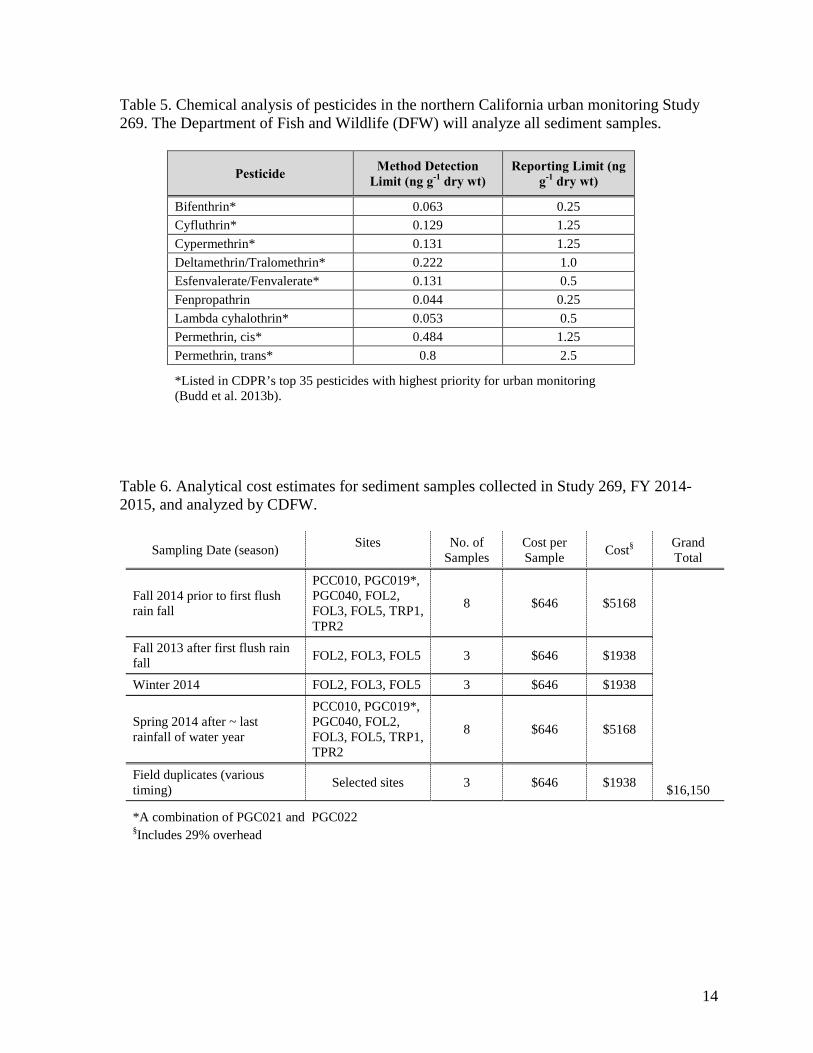
Table 5. Chemical analysis of pesticides in the northern California urban monitoring Study 269. The Department of Fish and Wildlife (DFW) will analyze all sediment samples.
Pesticide Method Detection Limit (ng g-1 dry wt)
Reporting Limit (ng g-1 dry wt)
Bifenthrin* 0.063 0.25 Cyfluthrin* 0.129 1.25 Cypermethrin* 0.131 1.25 Deltamethrin/Tralomethrin* 0.222 1.0 Esfenvalerate/Fenvalerate* 0.131 0.5 Fenpropathrin 0.044 0.25 Lambda cyhalothrin* 0.053 0.5 Permethrin, cis* 0.484 1.25 Permethrin, trans* 0.8 2.5
*Listed in CDPR’s top 35 pesticides with highest priority for urban monitoring (Budd et al. 2013b).
Table 6. Analytical cost estimates for sediment samples collected in Study 269, FY 2014-2015, and analyzed by CDFW.
Sampling Date (season) Sites No. of Samples
Cost per Sample Cost§ Grand
Total
Fall 2014 prior to first flush rain fall
PCC010, PGC019*, PGC040, FOL2, FOL3, FOL5, TRP1, TPR2
8 $646 $5168
$16,150
Fall 2013 after first flush rain fall FOL2, FOL3, FOL5 3 $646 $1938
Winter 2014 FOL2, FOL3, FOL5 3 $646 $1938
Spring 2014 after ~ last rainfall of water year
PCC010, PGC019*, PGC040, FOL2, FOL3, FOL5, TRP1, TPR2
8 $646 $5168
Field duplicates (various timing) Selected sites 3 $646 $1938
*A combination of PGC021 and PGC022 §Includes 29% overhead
15
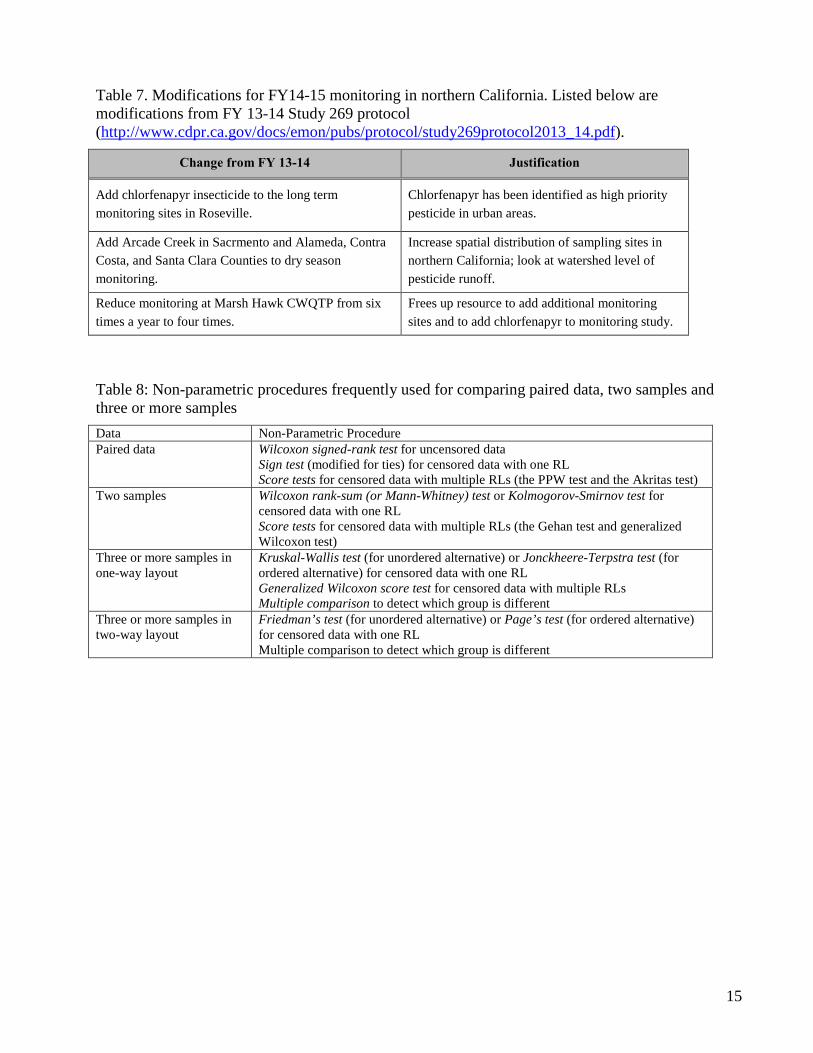
Table 7. Modifications for FY14-15 monitoring in northern California. Listed below are modifications from FY 13-14 Study 269 protocol (http://www.cdpr.ca.gov/docs/emon/pubs/protocol/study269protocol2013_14.pdf).
Change from FY 13-14 Justification
Add chlorfenapyr insecticide to the long term monitoring sites in Roseville.
Chlorfenapyr has been identified as high priority pesticide in urban areas.
Add Arcade Creek in Sacrmento and Alameda, Contra Costa, and Santa Clara Counties to dry season monitoring.
Increase spatial distribution of sampling sites in northern California; look at watershed level of pesticide runoff.
Reduce monitoring at Marsh Hawk CWQTP from six times a year to four times.
Frees up resource to add additional monitoring sites and to add chlorfenapyr to monitoring study.
Table 8: Non-parametric procedures frequently used for comparing paired data, two samples and three or more samples Data Non-Parametric Procedure Paired data Wilcoxon signed-rank test for uncensored data
Sign test (modified for ties) for censored data with one RL Score tests for censored data with multiple RLs (the PPW test and the Akritas test)
Two samples Wilcoxon rank-sum (or Mann-Whitney) test or Kolmogorov-Smirnov test for censored data with one RL Score tests for censored data with multiple RLs (the Gehan test and generalized Wilcoxon test)
Three or more samples in one-way layout
Kruskal-Wallis test (for unordered alternative) or Jonckheere-Terpstra test (for ordered alternative) for censored data with one RL Generalized Wilcoxon score test for censored data with multiple RLs Multiple comparison to detect which group is different
Three or more samples in two-way layout
Friedman’s test (for unordered alternative) or Page’s test (for ordered alternative) for censored data with one RL Multiple comparison to detect which group is different
16
w
Figure 1. Two constructed water quality treatment ponds (CWQTP) in Folsom, California. The CWQTPs are outlined in yellow with arrows indicating water flow direction (inputs at TRP1, FOL2, and FOL3; outfalls at TRP2 and FOL5). Flow gaging equipment has been installed at the CWQTP on Marsh Hawk Drive (B, at FOL2, FOL3, and FOL5).
A. CWQTP on Turn Pike Drive and Natoma Station Drive B. CWQTP on Marsh Hawk Drive
17
Figure 2. Northern California counties with highest pyrethroid and fipronil use. Pyrethroid use is the urban use of the 17 regulated pyrethroids listed in CDPR’s 2012 pyrethroid urban use regulations (http://cdpr.ca.gov/docs/legbills/calcode/040501.htm#a690).
18
Figure 3. Long-term monitoring sites in Roseville, California. Arrows indicate water flow direction. PGC040 is the downstream sampling site.
19
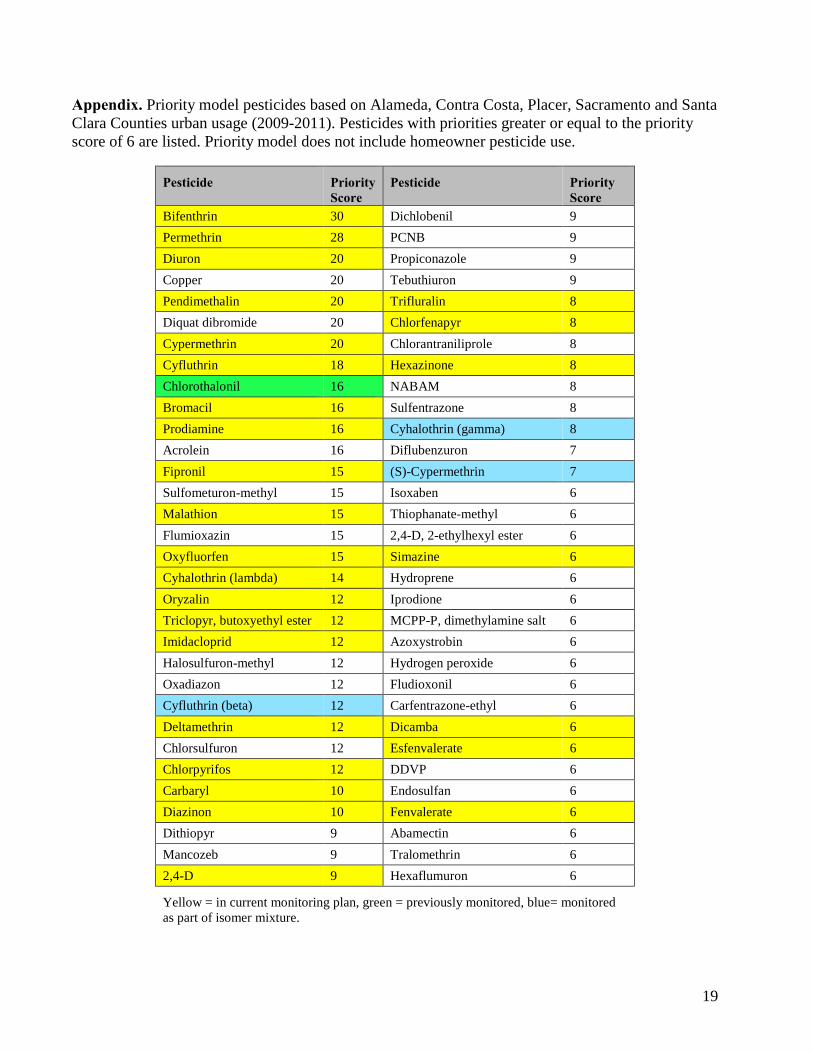
Appendix. Priority model pesticides based on Alameda, Contra Costa, Placer, Sacramento and Santa Clara Counties urban usage (2009-2011). Pesticides with priorities greater or equal to the priority score of 6 are listed. Priority model does not include homeowner pesticide use.
Pesticide Priority Score
Pesticide Priority Score
Bifenthrin 30 Dichlobenil 9 Permethrin 28 PCNB 9 Diuron 20 Propiconazole 9 Copper 20 Tebuthiuron 9 Pendimethalin 20 Trifluralin 8 Diquat dibromide 20 Chlorfenapyr 8 Cypermethrin 20 Chlorantraniliprole 8 Cyfluthrin 18 Hexazinone 8 Chlorothalonil 16 NABAM 8 Bromacil 16 Sulfentrazone 8 Prodiamine 16 Cyhalothrin (gamma) 8 Acrolein 16 Diflubenzuron 7 Fipronil 15 (S)-Cypermethrin 7 Sulfometuron-methyl 15 Isoxaben 6 Malathion 15 Thiophanate-methyl 6 Flumioxazin 15 2,4-D, 2-ethylhexyl ester 6 Oxyfluorfen 15 Simazine 6 Cyhalothrin (lambda) 14 Hydroprene 6 Oryzalin 12 Iprodione 6 Triclopyr, butoxyethyl ester 12 MCPP-P, dimethylamine salt 6 Imidacloprid 12 Azoxystrobin 6 Halosulfuron-methyl 12 Hydrogen peroxide 6 Oxadiazon 12 Fludioxonil 6 Cyfluthrin (beta) 12 Carfentrazone-ethyl 6 Deltamethrin 12 Dicamba 6 Chlorsulfuron 12 Esfenvalerate 6 Chlorpyrifos 12 DDVP 6 Carbaryl 10 Endosulfan 6 Diazinon 10 Fenvalerate 6 Dithiopyr 9 Abamectin 6 Mancozeb 9 Tralomethrin 6 2,4-D 9 Hexaflumuron 6
Yellow = in current monitoring plan, green = previously monitored, blue= monitored as part of isomer mixture.