Embed Size (px)
Citation preview

STUDY 4590u
2008 ENERGY CONSERVATION, EFFICIENCY, AND DEMAND RESPONSE
UNITED ILLUMINATING COMPANY OVER-SAMPLE
January 2009
Prepared by:
Abt SRBI, Inc.
275 Seventh Avenue, Suite 2700New York, New York 10001
(212) 779-7700
7431 College ParkwayFort Myers, Florida 33907
(239) 278-4044
and
Research into Action, Inc.
P. O. Box 12312Portland, Oregon, 97212
(503) 287-9136

Table of Contents
Executive Summary 1
Methodology 3
Attitudes toward Saving Energy 4
Change in Approach to Energy Use 8
Attitudes toward Information Sources 10
Energy-Saving Behaviors 12
Appliances and Energy Efficiency 21
Awareness of the ENERGY STAR® Logo 27
Purchases of Energy-Using Equipment and the Impact of the ENERGY STAR Logo 34
Interest in Energy-Efficient Products and Services 42
Home Energy Audits 53
Energy Suppliers 57
Smart Meters 61
Saving Money versus Comfort 63
Climate Change 64
U.S. Energy Situation 67
Amount of Electricity Used in Home 69
Demographic and Residence Characteristics 70
Appendix: Questionnaire 73
2008 Energy Conservation, Efficiency, and Demand Response – United Illuminating Over-sample
Executive Summary
Abt SRBI, Inc., and Research Into Action, Inc. conducted the multi-client study 2008 Energy Conservation, Efficiency, and Demand Response to provide insight into the attitudes and behaviors of residential consumers with respect to energy conservation and efficiency. This is the fourth such joint biennial survey conducted by SRBI and Research into Action.
For the 2008 survey, 800 interviews were conducted in November and December 2008 with a nationally-representative sample of randomly selected households. Following completion of the national survey in December 2008, 100 interviews were also conducted with end-use consumers in the United Illuminating service area.
There were some statistically significant differences between the UI over-sample respondents and those in the national survey:
Attitudes toward Saving Energy. Seventy-two percent of UI respondents say that they look for products that are good for the environment, compared with 86 percent nationally. Only 64 percent of UI respondents agree that people should try to use less energy to reduce the need for new power plants, while 79 percent of respondents nationally agree with this statement. But more UI than national respondents agree that there is an energy crisis in the U.S. (89 percent compared with 85 percent).
Obstacles to Saving Energy. When asked about obstacles to saving energy in their home, 16 percent of UI respondents mentioned the construction of their home, a statistically-significant difference from eight percent in the national survey.
Energy-saving Behaviors. UI respondents are significantly less likely than their national counterparts to change their heating/cooling filter annually (57 percent), close heating and cooling ducts in unused rooms (42 percent), and to seal heating and cooling ducts (34 percent). UI respondents are also significantly more likely than respondents nationally to perform annual maintenance on their HVAC system (84 percent compared with 75 percent).
Purchasing Appliances and Accessories. When asked where they would go first if they were searching for energy-efficient appliances or accessories, UI sample respondents’ most common response was to an appliance store (34 percent, a statistically-significant difference from 16 percent in the national survey). Twenty-one percent would go to a department store and 15 percent to the internet. Only nine percent would go to a home improvement store, a statistically-significant difference from 30 percent in the national survey.
ENERGY STAR Awareness. Overall, 80 percent of UI respondents are aware of ENERGY STAR, a statistically-significant difference from 68 percent nationally.
CFLs. As in the national sample, the most common place to purchases CFLs was at a home improvement store. However, 16 percent of UI respondents said they purchased their CFLs from a utility company, a statistically-significant difference from four percent nationally.
Seriousness of the Energy Situation. Seventy-nine percent of UI respondents believe that the energy situation in the United States is very serious, a statistically-significant difference from 63 percent nationally.
1

2008 Energy Conservation, Efficiency, and Demand Response – United Illuminating Over-sample
Customer Satisfaction. Sixteen percent of UI respondents said they are extremely satisfied with their electric utility, a statistically-significant difference from 31 percent in the national survey. Twenty-five percent said they were somewhat satisfied, a statistically- significant difference from 40 percent in the national survey.
Electricity generation. Twenty-seven percent of UI respondents erroneously believe that the company generates their electricity. This is significantly less than 41 percent nationally.
Customer Characteristics. Compared with respondents nationally, 37 percent of those in the UI over-sample heat their homes with fuel oil, a statistically significant difference from seven percent nationally. Also, 32 percent of UI respondents have average monthly energy bills exceeding $250, a statistically significant difference from 14 percent nationally.
2

2008 Energy Conservation, Efficiency, and Demand Response – United Illuminating Over-sample
Methodology
Abt SRBI, Inc., and Research into Action, Inc., conducted the multi-client study 2008 Energy Conservation, Efficiency and Demand Response to provide insight into the attitudes and behaviors of residential consumers regarding the use of energy in their homes. This is the fourth in a series of biennial surveys conducted by Abt SRBI and Research into Action in 2002, 2004, 2006, and now 2008 to identify trends in attitudes and behaviors related to energy conservation and efficiency in the residential sector.
Project sponsors provided input into the questionnaire. Question topics included the following:
attitudes about energy conservation and efficiency; current energy-saving behavior; motivations for saving energy; interest in energy-efficient products and services; ENERGY STAR® awareness; opinions about current energy suppliers; and residence and demographic characteristics.
A nationally representative random-digit dial sample was selected for the survey. A total of 801 interviews were completed November 21 through December 8, 2008, with an average length of 22 minutes.
In addition, an over-sample of 100 United Illuminating (UI) customers was completed between December 16 and 23, 2008, with an average interview length of 23 minutes. The sample for the survey was conducted using random-digit dialing based on zip codes in the UI service territory. A screening question was also used at the beginning of the survey to ensure that a UI customer was being interviewed. As in the national survey, up to five attempts were made to interview each sampled household. The survey sponsor was not identified in either the national survey or the UI over-sample.
The cooperation rate for the United Illuminating sample was 70 percent, compared with 62 percent for the national survey. The cooperation rate is determined by dividing the total number of attempted contacts (including answering machines, callbacks, refusals, and language and health problems) by the number of completions.
The margin of error for the national survey is plus or minus 3.5 percent, while the margin of error for the UI over-sample is plus or minus 9.8 percent, both at the 95 percent confidence level. A difference of plus or minus 10 percent between the national survey and UI over-sample is statistically significant at the 95 percent confidence level.
Percentages illustrated in the graphics and tables and discussed in the text are usually based on all responses to the survey, but some questions were asked only of some respondents and the percentages were accordingly calculated using these bases. The base for each percentage is shown with each graph or table. Differences among sub-groups are discussed only when statistically significant.
3

2008 Energy Conservation, Efficiency, and Demand Response – United Illuminating Over-sample
Attitudes toward Saving Energy
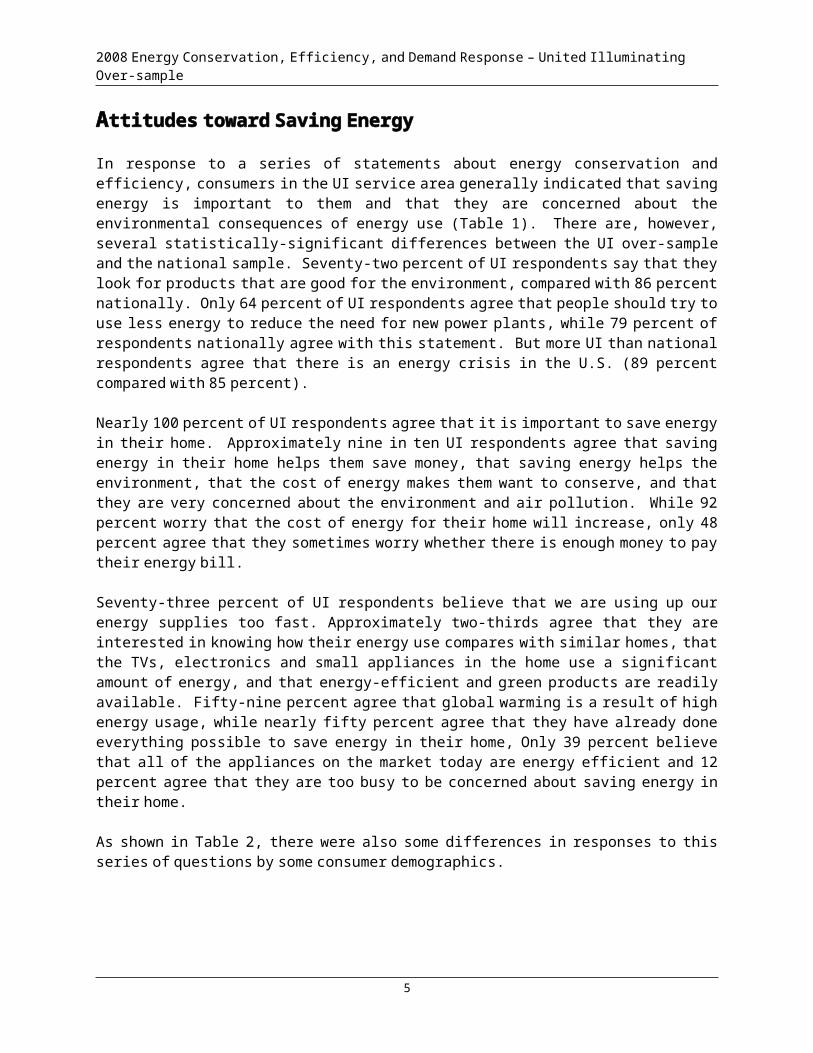
In response to a series of statements about energy conservation and efficiency, consumers in the UI service area generally indicated that saving energy is important to them and that they are concerned about the environmental consequences of energy use (Table 1). There are, however, several statistically-significant differences between the UI over-sample and the national sample. Seventy-two percent of UI respondents say that they look for products that are good for the environment, compared with 86 percent nationally. Only 64 percent of UI respondents agree that people should try to use less energy to reduce the need for new power plants, while 79 percent of respondents nationally agree with this statement. But more UI than national respondents agree that there is an energy crisis in the U.S. (89 percent compared with 85 percent).
Nearly 100 percent of UI respondents agree that it is important to save energy in their home. Approximately nine in ten UI respondents agree that saving energy in their home helps them save money, that saving energy helps the environment, that the cost of energy makes them want to conserve, and that they are very concerned about the environment and air pollution. While 92 percent worry that the cost of energy for their home will increase, only 48 percent agree that they sometimes worry whether there is enough money to pay their energy bill.
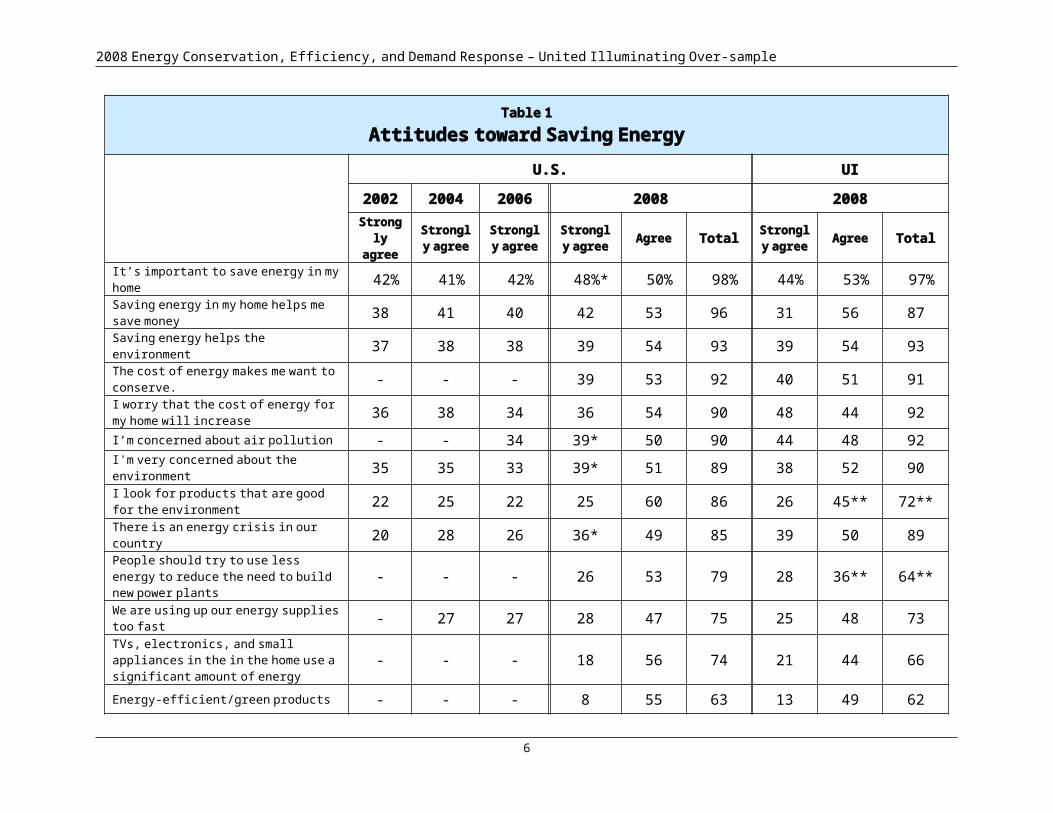
Seventy-three percent of UI respondents believe that we are using up our energy supplies too fast. Approximately two-thirds agree that they are interested in knowing how their energy use compares with similar homes, that the TVs, electronics and small appliances in the home use a significant amount of energy, and that energy-efficient and green products are readily available. Fifty-nine percent agree that global warming is a result of high energy usage, while nearly fifty percent agree that they have already done everything possible to save energy in their home, Only 39 percent believe that all of the appliances on the market today are energy efficient and 12 percent agree that they are too busy to be concerned about saving energy in their home.
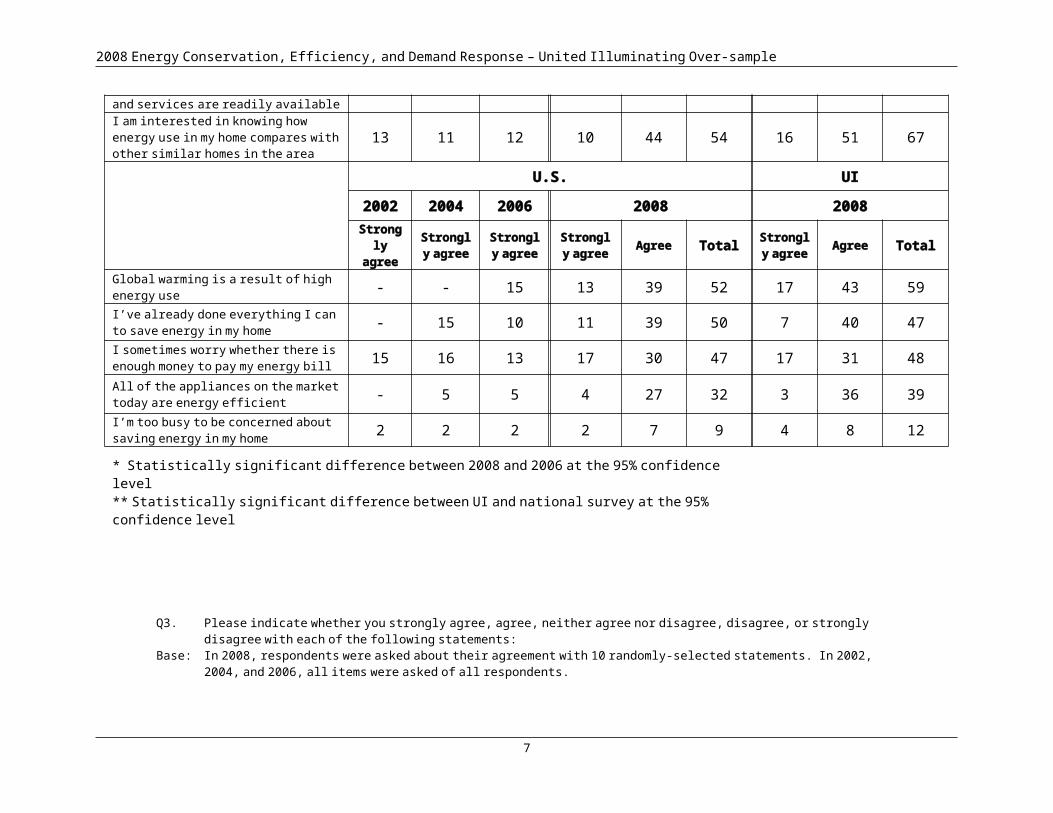
As shown in Table 2, there were also some differences in responses to this series of questions by some consumer demographics.
4
2008 Energy Conservation, Efficiency, and Demand Response – United Illuminating Over-sample
Table 1Attitudes toward Saving Energy
U.S. UI
2002 2004 2006 2008 2008Strongly
agreeStrongly
agreeStrongly
agreeStrongly
agree Agree Total Strongly agree Agree Total
It’s important to save energy in my home 42% 41% 42% 48%* 50% 98% 44% 53% 97%Saving energy in my home helps me save money 38 41 40 42 53 96 31 56 87
Saving energy helps the environment 37 38 38 39 54 93 39 54 93The cost of energy makes me want to conserve. - - - 39 53 92 40 51 91
I worry that the cost of energy for my home will increase 36 38 34 36 54 90 48 44 92
I’m concerned about air pollution - - 34 39* 50 90 44 48 92I'm very concerned about the environment 35 35 33 39* 51 89 38 52 90I look for products that are good for the environment 22 25 22 25 60 86 26 45** 72**
There is an energy crisis in our country 20 28 26 36* 49 85 39 50 89People should try to use less energy to reduce the need to build new power plants - - - 26 53 79 28 36** 64**
We are using up our energy supplies too fast - 27 27 28 47 75 25 48 73
TVs, electronics, and small appliances in the in the home use a significant amount of energy
- - - 18 56 74 21 44 66
Energy-efficient/green products and services are readily available - - - 8 55 63 13 49 62I am interested in knowing how energy use in my home compares with other similar homes in the area
13 11 12 10 44 54 16 51 67
U.S. UI
5
2008 Energy Conservation, Efficiency, and Demand Response – United Illuminating Over-sample
2002 2004 2006 2008 2008Strongly
agreeStrongly
agreeStrongly
agreeStrongly
agree Agree Total Strongly agree Agree Total
Global warming is a result of high energy use - - 15 13 39 52 17 43 59
I’ve already done everything I can to save energy in my home - 15 10 11 39 50 7 40 47
I sometimes worry whether there is enough money to pay my energy bill 15 16 13 17 30 47 17 31 48
All of the appliances on the market today are energy efficient - 5 5 4 27 32 3 36 39
I’m too busy to be concerned about saving energy in my home 2 2 2 2 7 9 4 8 12
* Statistically significant difference between 2008 and 2006 at the 95% confidence level** Statistically significant difference between UI and national survey at the 95% confidence level
6
Q3. Please indicate whether you strongly agree, agree, neither agree nor disagree, disagree, or strongly disagree with each of the following statements:
Base: In 2008, respondents were asked about their agreement with 10 randomly-selected statements. In 2002, 2004, and 2006, all items were asked of all respondents.
2008 Energy Conservation, Efficiency, and Demand Response - United Illuminating Over-sample
Table 2Attitudes toward Saving Energy among Market Segments
United Illuminating Respondents
Attitude/Opinion Market Segment(s) Significantly Most Likely to Agree
It’s important to save energy in my home Have home internet access
Saving energy in my home helps me save money
Always try to save energy; completely or mostly convinced of global warming
Saving energy helps the environment Average monthly energy bill of $200 or more
I worry that the cost of energy for my home will increase
I'm very concerned about the environmentHave home internet access; completely or mostly convinced of global warming; always try to save energy; average monthly energy bill of $200 or more
I’m too busy to be concerned about saving energy in my home* Women
I look for products that are good for the environment
I’m concerned about air pollution Heat with natural gas
There is an energy crisis in our country Women
I sometimes worry whether there is enough money to pay my energy bill Less than a college degree
I am interested in knowing how energy use in my home compares with other similar homes in the area
All of the appliances on the market today are energy efficient High school degree or less
I’ve already done everything I can to save energy in my home Always try to save energy
We are using up our energy supplies too fast Always try to save energy
Global warming is a result of high energy use
Attitude/Opinion
Energy-efficient/green products and services are readily available. Men
The cost of energy makes me want to conserve. Used more energy in the past year; convinced of global warming
TVs, electronics, and small appliances in the in the home use a significant amount of energy.
People should try to use less energy to reduce the need to build new power plants. Completely or mostly convinced of global warming
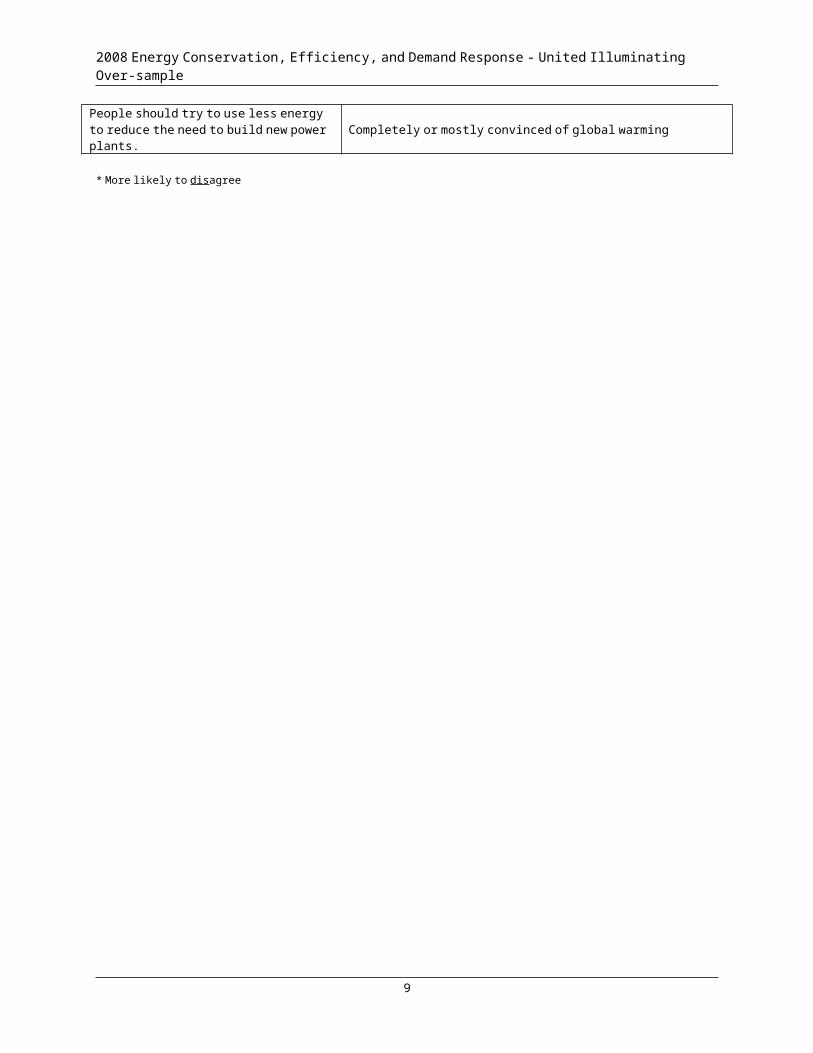
* More likely to disagree
7
2008 Energy Conservation, Efficiency, and Demand Response - United Illuminating Over-sample
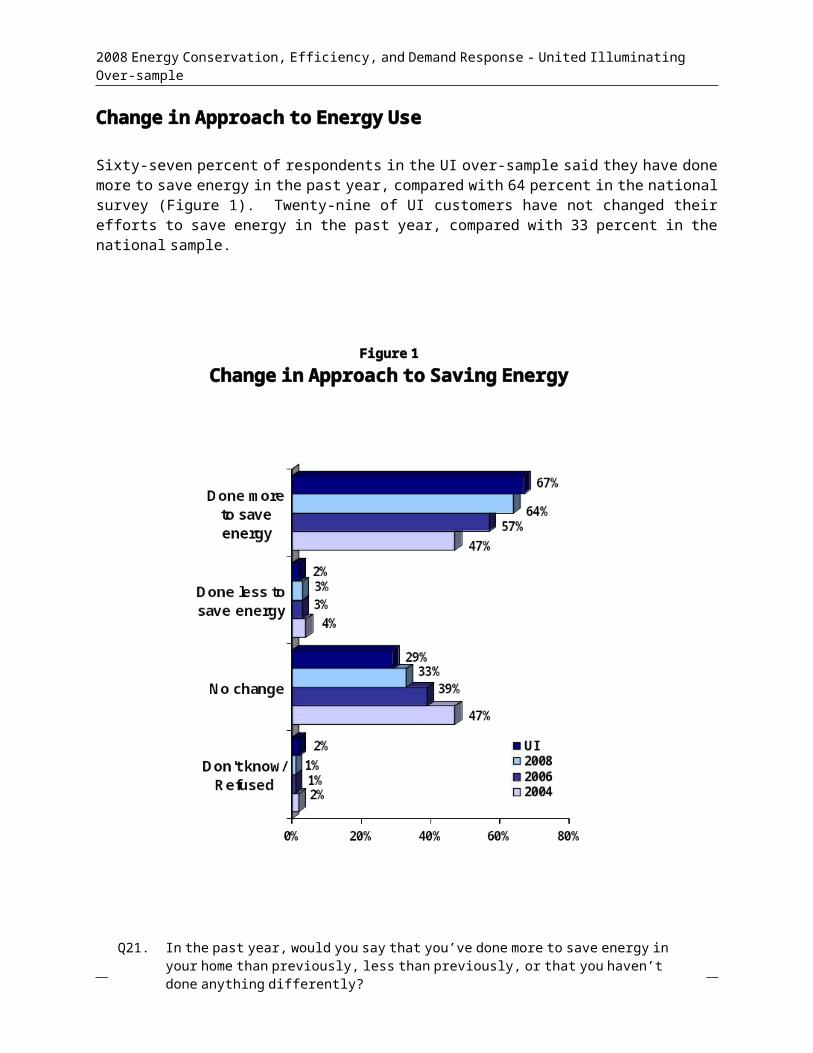
Change in Approach to Energy Use
Sixty-seven percent of respondents in the UI over-sample said they have done more to save energy in the past year, compared with 64 percent in the national survey (Figure 1). Twenty-nine of UI customers have not changed their efforts to save energy in the past year, compared with 33 percent in the national sample.
8
Figure 1Change in Approach to Saving Energy
Q21. In the past year, would you say that you’ve done more to save energy in your home than previously, less than previously, or that you haven’t done anything differently?
Base: All respondents, national n = 801, UI n = 100
2008 Energy Conservation, Efficiency, and Demand Response - United Illuminating Over-sample
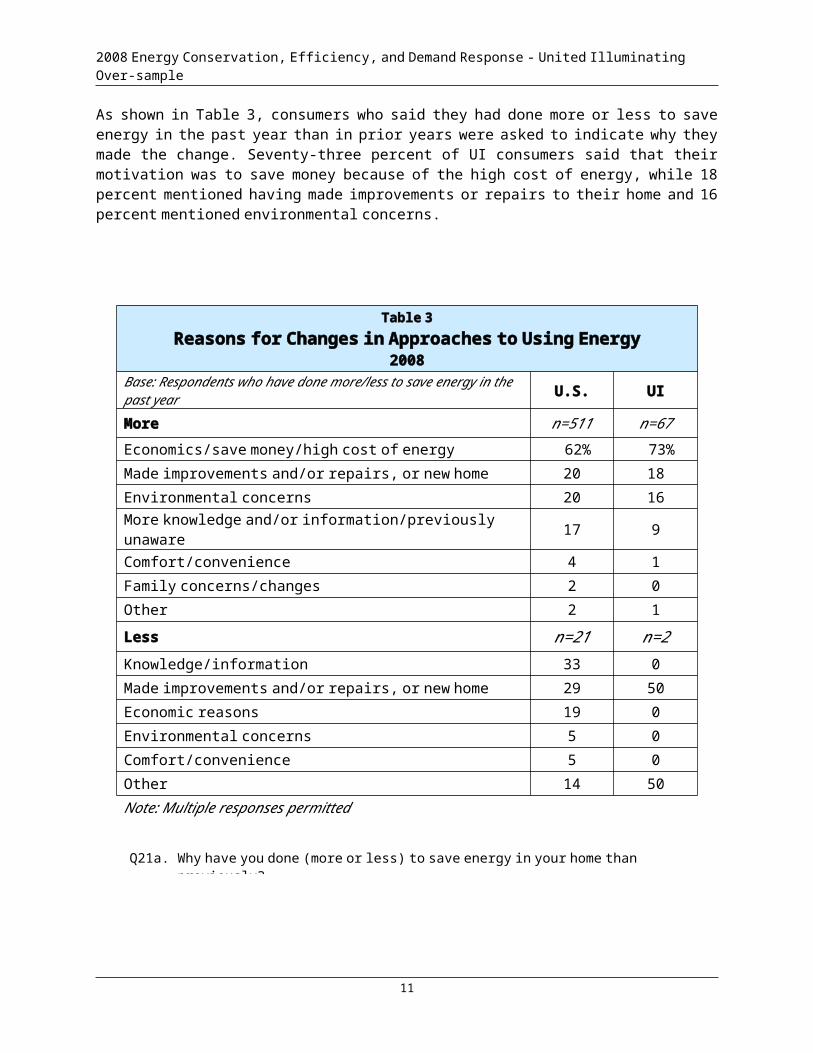
As shown in Table 3, consumers who said they had done more or less to save energy in the past year than in prior years were asked to indicate why they made the change. Seventy-three percent of UI consumers said that their motivation was to save money because of the high cost of energy, while 18 percent mentioned having made improvements or repairs to their home and 16 percent mentioned environmental concerns.
Table 3Reasons for Changes in Approaches to Using Energy
2008
Base: Respondents who have done more/less to save energy in the past year U.S. UI
More n=511 n=67
Economics/save money/high cost of energy 62% 73%
Made improvements and/or repairs, or new home 20 18
Environmental concerns 20 16
More knowledge and/or information/previously unaware 17 9
Comfort/convenience 4 1
Family concerns/changes 2 0
Other 2 1
Less n=21 n=2
Knowledge/information 33 0
Made improvements and/or repairs, or new home 29 50
Economic reasons 19 0
Environmental concerns 5 0
Comfort/convenience 5 0
Other 14 50
Note: Multiple responses permitted
9
Q21a. Why have you done (more or less) to save energy in your home than previously?
2008 Energy Conservation, Efficiency, and Demand Response - United Illuminating Over-sample
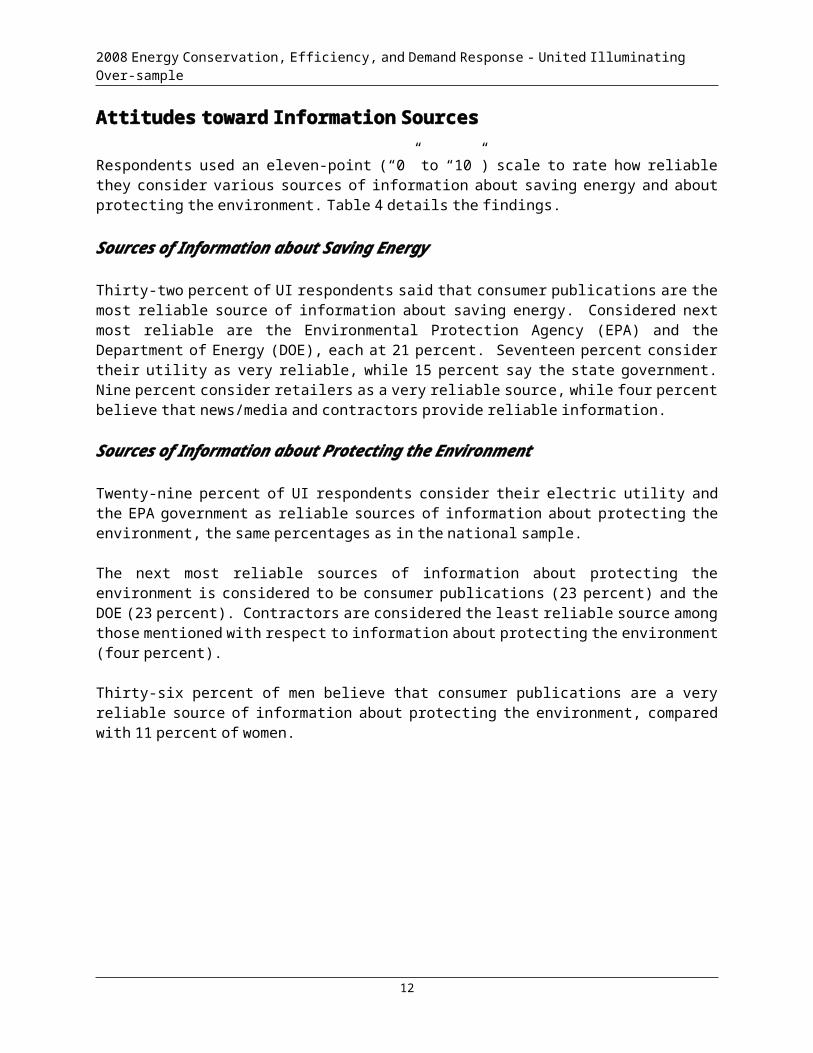
Attitudes toward Information Sources
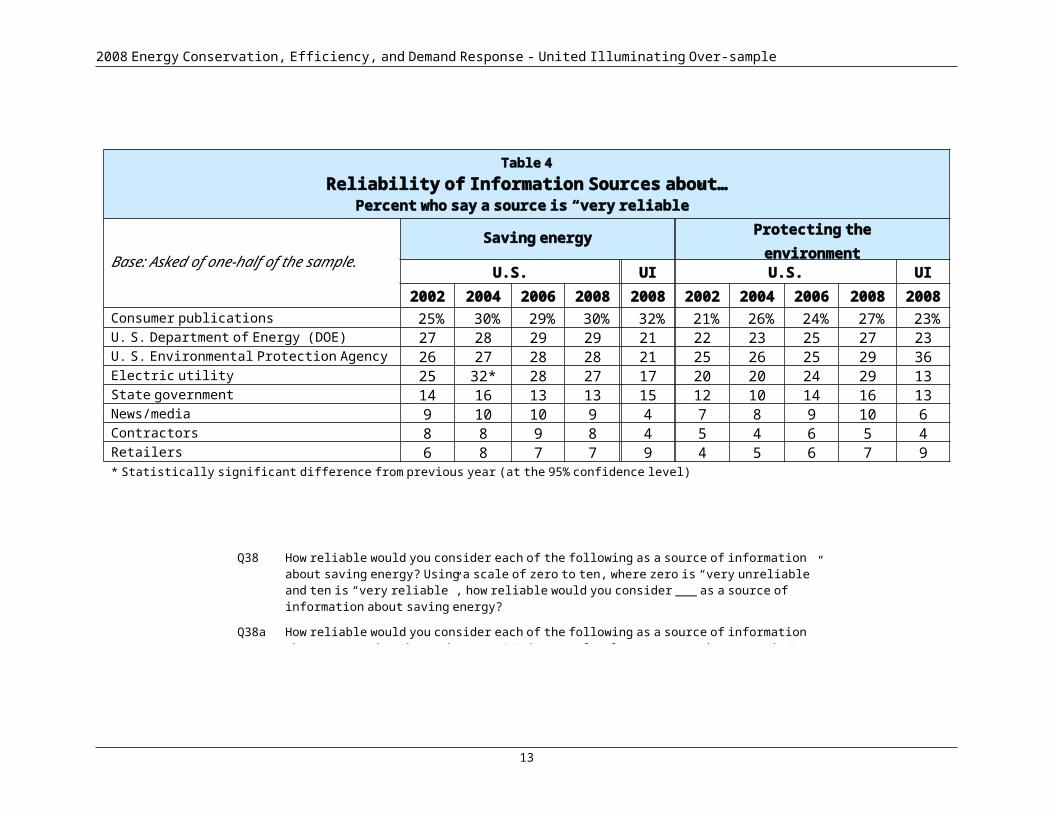
Respondents used an eleven-point (“0” to “10”) scale to rate how reliable they consider various sources of information about saving energy and about protecting the environment. Table 4 details the findings.
Sources of Information about Saving Energy
Thirty-two percent of UI respondents said that consumer publications are the most reliable source of information about saving energy. Considered next most reliable are the Environmental Protection Agency (EPA) and the Department of Energy (DOE), each at 21 percent. Seventeen percent consider their utility as very reliable, while 15 percent say the state government. Nine percent consider retailers as a very reliable source, while four percent believe that news/media and contractors provide reliable information.
Sources of Information about Protecting the Environment
Twenty-nine percent of UI respondents consider their electric utility and the EPA government as reliable sources of information about protecting the environment, the same percentages as in the national sample.
The next most reliable sources of information about protecting the environment is considered to be consumer publications (23 percent) and the DOE (23 percent). Contractors are considered the least reliable source among those mentioned with respect to information about protecting the environment (four percent).
Thirty-six percent of men believe that consumer publications are a very reliable source of information about protecting the environment, compared with 11 percent of women.
10
2008 Energy Conservation, Efficiency, and Demand Response - United Illuminating Over-sample
Table 4Reliability of Information Sources about…
Percent who say a source is “very reliable”
Base: Asked of one-half of the sample.Saving energy Protecting the
environmentU.S. UI U.S. UI
2002 2004 2006 2008 2008 2002 2004 2006 2008 2008Consumer publications 25% 30% 29% 30% 32% 21% 26% 24% 27% 23%U. S. Department of Energy (DOE) 27 28 29 29 21 22 23 25 27 23U. S. Environmental Protection Agency (EPA) 26 27 28 28 21 25 26 25 29 36Electric utility 25 32* 28 27 17 20 20 24 29 13State government 14 16 13 13 15 12 10 14 16 13News/media 9 10 10 9 4 7 8 9 10 6Contractors 8 8 9 8 4 5 4 6 5 4Retailers 6 8 7 7 9 4 5 6 7 9* Statistically significant difference from previous year (at the 95% confidence level)
11
Q38 How reliable would you consider each of the following as a source of information about saving energy? Using a scale of zero to ten, where zero is “very unreliable” and ten is “very reliable”, how reliable would you consider ___ as a source of information about saving energy?
Q38a How reliable would you consider each of the following as a source of information about protecting the environment? Using a scale of zero to ten, where zero is “very unreliable” and ten is “very reliable”, how reliable would you consider ___ as a source of information about saving energy?
2008 Energy Conservation, Efficiency, and Demand Response - United Illuminating Over-sample
Energy-Saving BehaviorsIntention to Save Energy
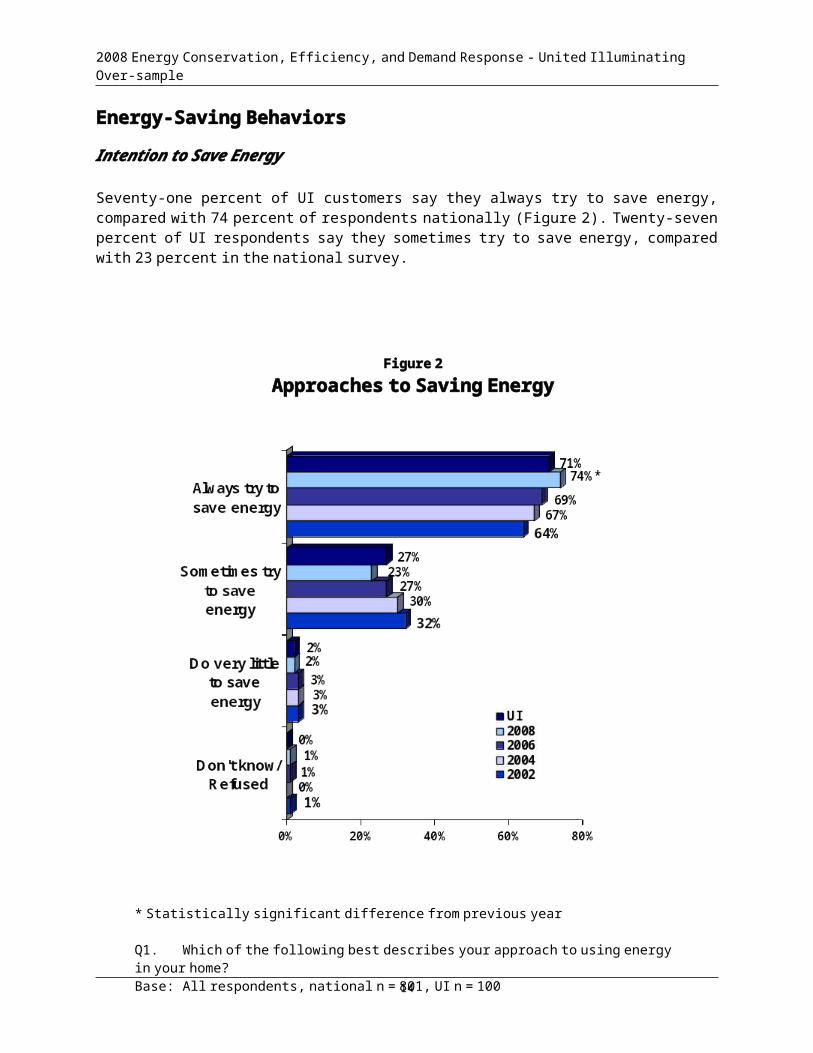
Seventy-one percent of UI customers say they always try to save energy, compared with 74 percent of respondents nationally (Figure 2). Twenty-seven percent of UI respondents say they sometimes try to save energy, compared with 23 percent in the national survey.
12
Figure 2Approaches to Saving Energy
* Statistically significant difference from previous year
Q1. Which of the following best describes your approach to using energy in your home?Base: All respondents, national n = 801, UI n = 100
2008 Energy Conservation, Efficiency, and Demand Response - United Illuminating Over-sample
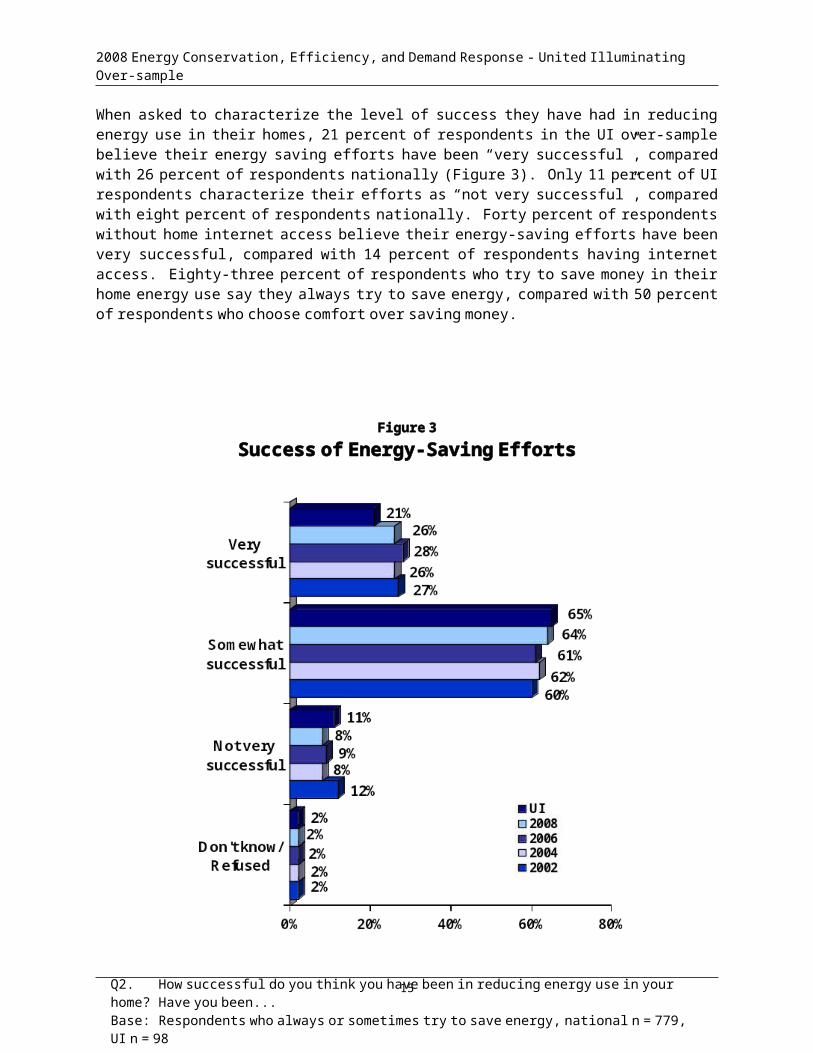
When asked to characterize the level of success they have had in reducing energy use in their homes, 21 percent of respondents in the UI over-sample believe their energy saving efforts have been “very successful”, compared with 26 percent of respondents nationally (Figure 3). Only 11 percent of UI respondents characterize their efforts as “not very successful”, compared with eight percent of respondents nationally. Forty percent of respondents without home internet access believe their energy-saving efforts have been very successful, compared with 14 percent of respondents having internet access. Eighty-three percent of respondents who try to save money in their home energy use say they always try to save energy, compared with 50 percent of respondents who choose comfort over saving money.
13
Figure 3Success of Energy-Saving Efforts
Q2. How successful do you think you have been in reducing energy use in your home? Have you been...
Base: Respondents who always or sometimes try to save energy, national n = 779, UI n = 98
2008 Energy Conservation, Efficiency, and Demand Response - United Illuminating Over-sample
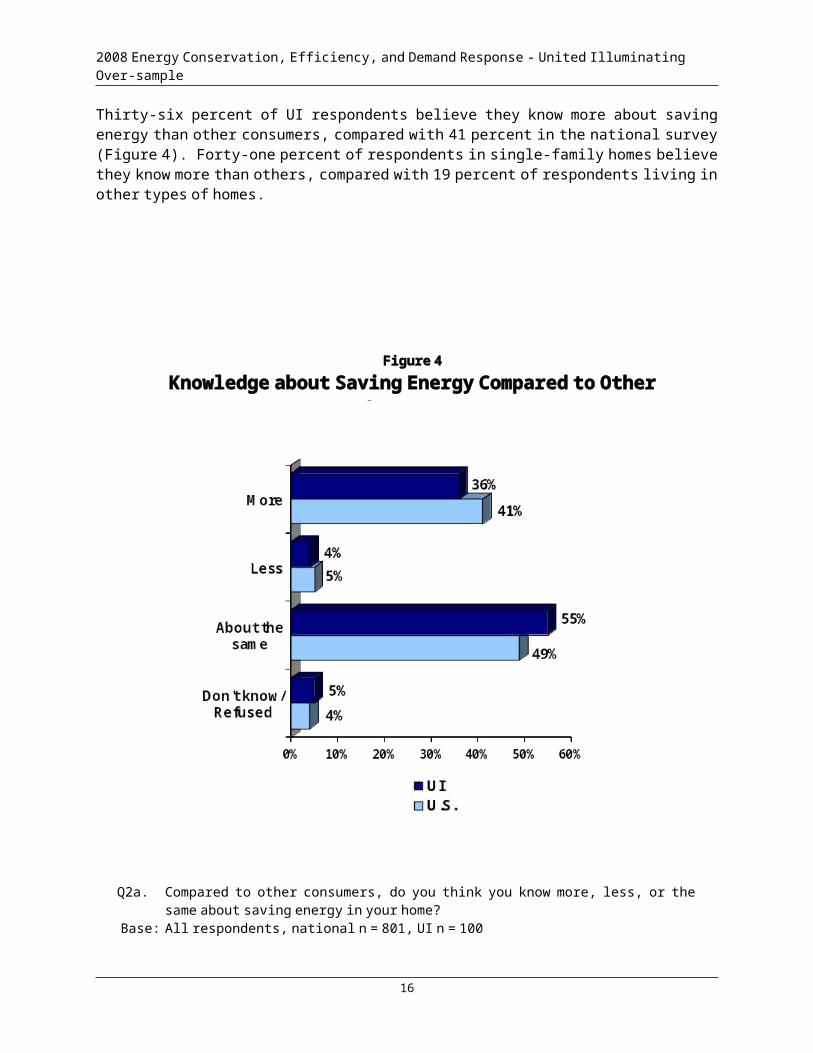
Thirty-six percent of UI respondents believe they know more about saving energy than other consumers, compared with 41 percent in the national survey (Figure 4). Forty-one percent of respondents in single-family homes believe they know more than others, compared with 19 percent of respondents living in other types of homes.
14
Figure 4Knowledge about Saving Energy Compared to Other Consumers
Q2a. Compared to other consumers, do you think you know more, less, or the same about saving energy in your home?
Base: All respondents, national n = 801, UI n = 100
2008 Energy Conservation, Efficiency, and Demand Response - United Illuminating Over-sample
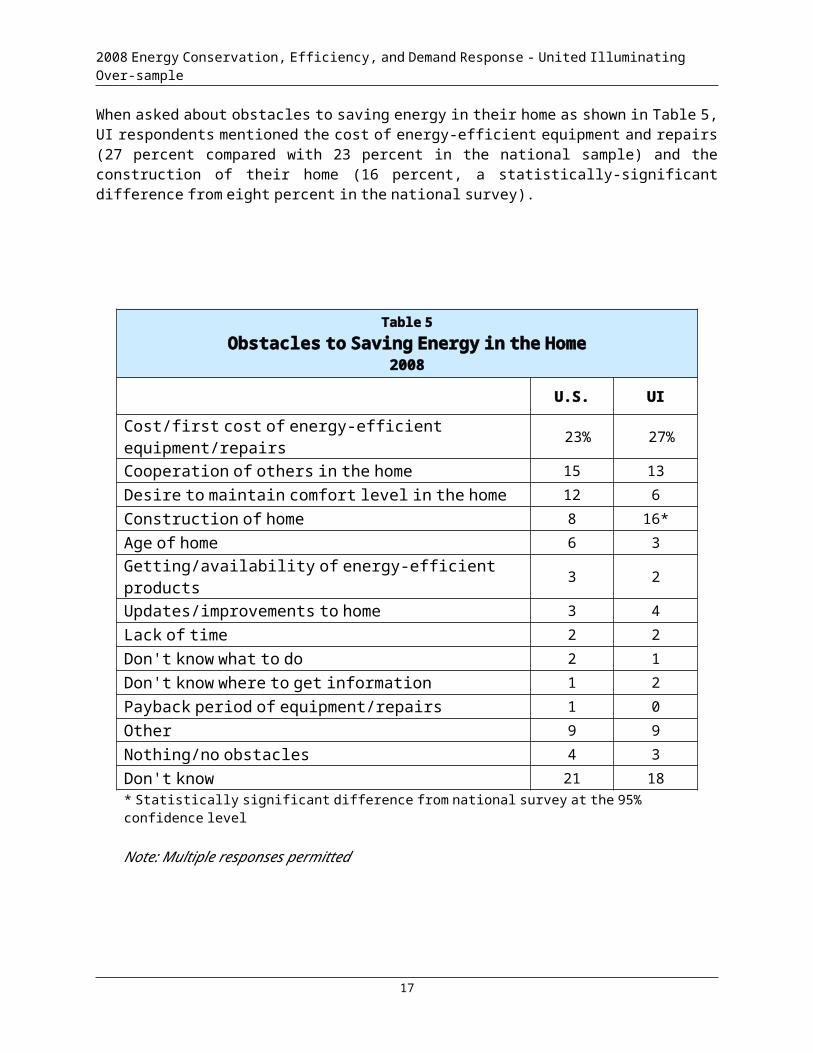
When asked about obstacles to saving energy in their home as shown in Table 5, UI respondents mentioned the cost of energy-efficient equipment and repairs (27 percent compared with 23 percent in the national sample) and the construction of their home (16 percent, a statistically-significant difference from eight percent in the national survey).
Table 5Obstacles to Saving Energy in the Home
2008
U.S. UI
Cost/first cost of energy-efficient equipment/repairs 23% 27%
Cooperation of others in the home 15 13
Desire to maintain comfort level in the home 12 6
Construction of home 8 16*
Age of home 6 3
Getting/availability of energy-efficient products 3 2
Updates/improvements to home 3 4
Lack of time 2 2
Don't know what to do 2 1
Don't know where to get information 1 2
Payback period of equipment/repairs 1 0
Other 9 9
Nothing/no obstacles 4 3
Don't know 21 18
* Statistically significant difference from national survey at the 95% confidence level
Note: Multiple responses permitted
15
Q3aa. What are some of the obstacles that you currently face in trying to save energy in your home?
Base: Respondents who always or sometimes try to save energy, national n = 779, UI n = 98
2008 Energy Conservation, Efficiency, and Demand Response - United Illuminating Over-sample
Current Specific Energy Conservation and Efficiency Behavior
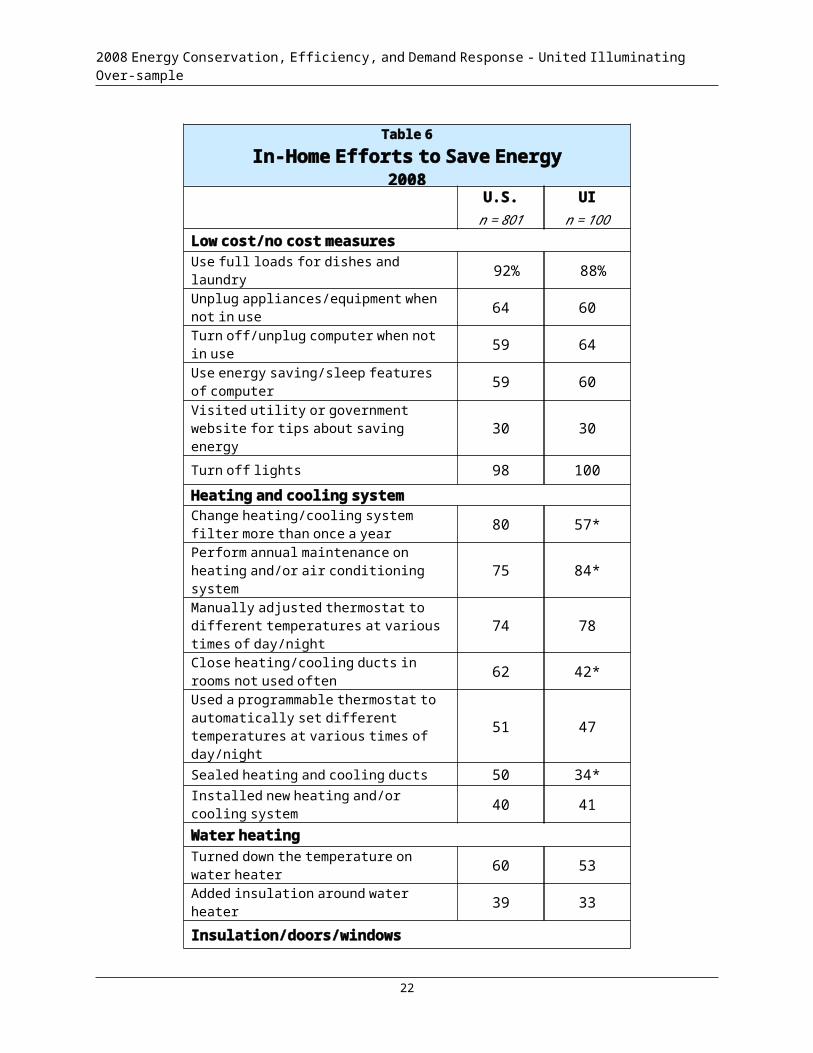
Respondents were asked about various actions they may have taken to reduce energy use in their homes. Their responses are detailed in Table 6 and discussed in the text by measure.
Low-Cost/No-Cost Measures
As in the national survey, the most commonly undertaken low- or no-cost measures to save energy reported by UI respondents are turning off the lights (100 percent) and doing full loads of laundry or dishes (88 percent). Six in ten UI respondents unplug computers, appliances and other equipment when not in use and use the energy-saving sleep features of their computer Thirty percent have visited a utility website for tips about saving energy.
More likely to use the energy-saving sleep features of their computer are men, respondents with a post-graduate degree, respondents aware of ENERGY STAR, and those in households with occupants under 18 years of age. Respondents with annual incomes of $70,000 or more are less likely than other respondents to unplug appliances and equipment when not in use, while those who always try to save energy are more likely to unplug appliances and other equipment when not in use. Respondents aware of ENERGY STAR and who have used more energy in the past year are more likely than those unaware to use full loads for dishes and laundry. Seventy-three percent of respondents who have had a home energy audit have visited a utility or government website for information about saving energy, compared with 22 percent of respondents without an audit.
Heating and Cooling System
UI respondents are significantly less likely than their national counterparts to change their heating/cooling filter annually (57 percent), close heating and cooling ducts in unused rooms (42 percent), and to seal heating and cooling ducts (34 percent). These differences from the national survey may reflect the heating systems in use in the UI service territory, where ductwork is less common than in other sections of the country.
UI respondents are significantly more likely than respondents nationally to perform annual maintenance on their HVAC system (84 percent compared with 75 percent). Seventy-eight percent of UI respondents manually adjust their thermostat, 47 percent use a programmable thermostat, and 41 percent have installed in a new HVAC system.
Respondents with annual incomes of $70,000 or more and homeowners are more likely than other respondents to have sealed heating and cooling ducts in their home. Those who are completely or mostly convinced of global warming are more likely than those who are somewhat or unconvinced to have closed ducts in rooms that are not often used. Forty-nine percent of homeowners have installed a new heating or cooling system, compared with 17 percent of renters. Ninety-one percent of homeowners perform annual maintenance on their HVAC system, compared with 61 percent of renters. More likely than other respondents to have adjusted their thermostat manually are respondents who always try to save energy and have used more energy in the past year.
Water Heating
16
2008 Energy Conservation, Efficiency, and Demand Response - United Illuminating Over-sample
Fifty-three percent of respondents in the UI over-sample have turned down the temperature on their water heater, while 33 percent have added water heater insulation. In comparison, 60 percent of respondents nationally have turned down the temperature on their water heater and 39 percent have added water heater insulation.
Sixty-seven percent of women in the UI sample say that they have turned down the temperature on their water heater, compared with 37 percent of men. Sixty-one percent of respondents in single-family homes have reduced their water heater temperature, compared with 33 percent of respondents in other types of residences. Sixty-one percent of respondents who always try to save energy have turned down the temperature on their water heater, compared with 37 percent who sometimes try to save energy.
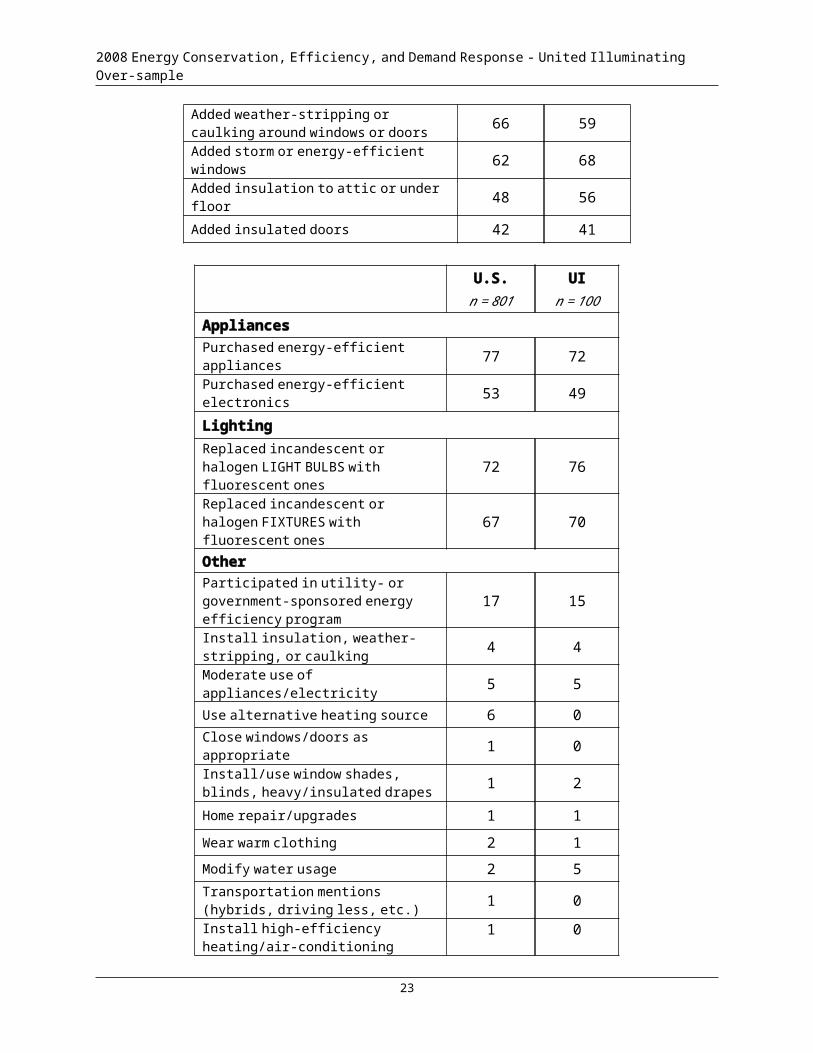
Insulation/Doors/Windows
Respondents in the UI over-sample have undertaken measures related to insulation, doors, and windows at levels approximating those in the national survey. Sixty-eight percent have added storm or energy-efficient windows, while 59 percent of respondents have added weather-stripping or caulking. Fifty-six percent have added floor or attic insulation and 41 percent have added insulated doors to their home.
Respondents with incomes under $30,000 are less likely to have added storm or energy efficiency windows than higher income respondents. Homeowners in single-family homes are more likely to have added floor or attic insulation, energy-efficient windows, and weather-stripping or caulking than respondents living in other types of residences. Respondents who always try to save energy are more likely to have added weather-stripping or caulking, compared with those who sometimes try to save energy (68 percent compared with 41 percent).
Appliances, Lighting, and Other Measures
Seventy-two percent of UI respondents have purchased energy-efficiency appliances and 49 percent have bought energy-efficient electronics. Approximately seven in ten respondents have replaced incandescent or halogen fixtures with fluorescent fixtures and replaced incandescent or halogen light bulbs with fluorescents. Fifteen percent have participated in a utility or government sponsored energy-efficiency program.
More likely than other respondents to have purchased energy-efficient appliances are respondents with post-graduate degrees, having internet access, and who always try to save energy. Homeowners and respondents with three or more occupants are also more likely than others to have purchased energy-efficient appliances. There is also a positive relationship between the purchase of energy-efficient appliances and household income.
Homeowners in single-family homes and those who are aware of ENERGY STAR are more likely than other respondents to have replaced incandescent or halogen fixtures with fluorescent fixtures and to have purchased fluorescent bulbs, as are respondents with internet access. There is also a positive association between the purchase of fluorescent light bulbs and respondent income.
17
2008 Energy Conservation, Efficiency, and Demand Response - United Illuminating Over-sample
Table 6In-Home Efforts to Save Energy
2008U.S.
n = 801UI
n = 100
Low cost/no cost measures
Use full loads for dishes and laundry 92% 88%Unplug appliances/equipment when not in use 64 60
Turn off/unplug computer when not in use 59 64
Use energy saving/sleep features of computer 59 60
Visited utility or government website for tips about saving energy 30 30
Turn off lights 98 100
Heating and cooling systemChange heating/cooling system filter more than once a year 80 57*
Perform annual maintenance on heating and/or air conditioning system 75 84*
Manually adjusted thermostat to different temperatures at various times of day/night 74 78
Close heating/cooling ducts in rooms not used often 62 42*
Used a programmable thermostat to automatically set different temperatures at various times of day/night
51 47
Sealed heating and cooling ducts 50 34*Installed new heating and/or cooling system 40 41Water heatingTurned down the temperature on water heater 60 53
Added insulation around water heater 39 33
Insulation/doors/windowsAdded weather-stripping or caulking around windows or doors 66 59
Added storm or energy-efficient windows 62 68
Added insulation to attic or under floor 48 56
Added insulated doors 42 41
18
2008 Energy Conservation, Efficiency, and Demand Response - United Illuminating Over-sample
U.S.n = 801
UIn = 100
Appliances
Purchased energy-efficient appliances 77 72
Purchased energy-efficient electronics 53 49
LightingReplaced incandescent or halogen LIGHT BULBS with fluorescent ones 72 76
Replaced incandescent or halogen FIXTURES with fluorescent ones 67 70
OtherParticipated in utility- or government-sponsored energy efficiency program 17 15Install insulation, weather-stripping, or caulking 4 4
Moderate use of appliances/electricity 5 5
Use alternative heating source 6 0
Close windows/doors as appropriate 1 0Install/use window shades, blinds, heavy/insulated drapes 1 2
Home repair/upgrades 1 1
Wear warm clothing 2 1
Modify water usage 2 5Transportation mentions (hybrids, driving less, etc.) 1 0Install high-efficiency heating/air-conditioning system 1 0
Set thermostat for efficiency 3 5
Other 2 2
*Statistically significant difference from 2008 national survey at the 95% confidence level
19
Q4. Please tell me if you have done any of the following to save energy in your home.
2008 Energy Conservation, Efficiency, and Demand Response – United Illuminating Over-sample
Results of Energy Conservation Behavior
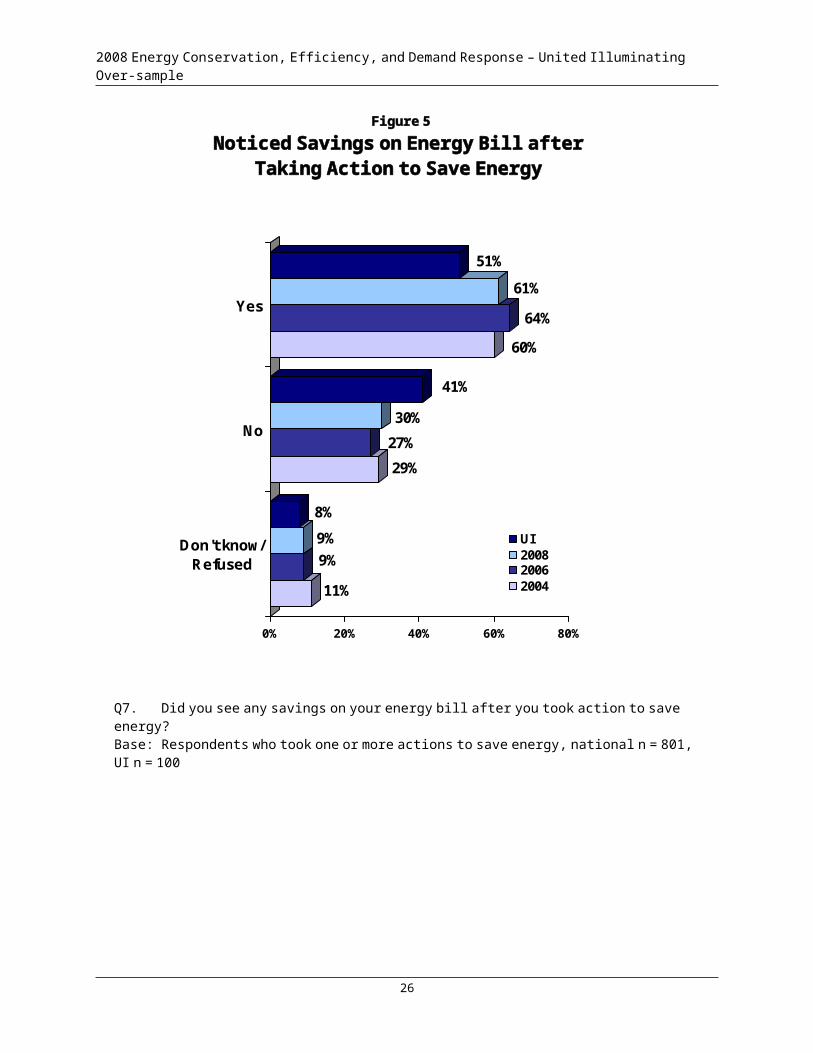
Fifty-one percent of UI respondents who took action to save energy subsequently noticed a difference on their energy bill, compared with 61 percent nationally (Figure 5). More likely than other respondents to have noticed savings are respondents in single-family homes and with three or more occupants in the home.
20
Figure 5Noticed Savings on Energy Bill after
Taking Action to Save Energy
11%
9%9%8%
29%27%30%
41%
60%
64%
61%
51%
0% 20% 40% 60% 80%
Don't know/Refused
No
Yes
UI200820062004
Q7. Did you see any savings on your energy bill after you took action to save energy?Base: Respondents who took one or more actions to save energy, national n = 801, UI n = 100
2008 Energy Conservation, Efficiency, and Demand Response – United Illuminating Over-sample
Appliances and Energy Efficiency
Decision-Making Factors in Purchasing Appliances
Respondents used an eleven-point scale, where “zero” is not at all important and “10” is very important, to rate the importance of a series of factors they consider when making a decision about purchasing an appliance or other energy-using equipment. Respondents rating multiple factors as very important (i.e. factors rated as “9” or “10”) were then asked to select which of these factors is most important. The results from these questions are provided in Table 7.
Four factors emerged as most important to UI respondents in the appliance purchase decision:
How long a product will last (26 percent of UI respondents, compared to 17 percent in the national sample);
The purchase price of the equipment or appliance was most important (14 percent of UI respondents, compared to 22 percent in the national survey);
The cost to run an appliance or equipment over its lifetime is the most important factor (14 percent of UI respondents, compared to 10 percent in the national survey); and
How much energy the appliance or equipment uses is most important (12 percent of UI respondents, compared to nine percent in the national survey).
The remaining items asked about in the survey with respect to appliance decision-making were considered “most important” by five percent or less of UI respondents, although from 54 to 83 percent of respondents initially characterized these factors “very important”. Particularly notable was that 83 percent of UI respondents said that the ENERGY STAR logo is “very important” (significantly above the level of 60 percent nationally), but only two percent of UI respondents characterized appliance energy usage as the most important factor in their decision.
21
2008 Energy Conservation, Efficiency, and Demand Response – United Illuminating Over-sample
Table 7Importance of Specified Factors in Making a DecisionAbout an Appliance or Other Energy-Using Equipment
Percent rating as “Very” or “Somewhat Important”
Mostimportant*
U.S UI U.S. UI
2004 2006 2008 2008 2004 2006 2008 2008Purchase price of appliance or equipment 76% 82% 83% 79% 14% 16% 22% 14%
How long the product will last 93 94 94 85 19 19 17 26Cost to run the appliance or equipment over its lifetime 75 80 78 77 11 12 10 14
How much energy the appliance or equipment uses 79 80 84 85 8 6 9 12
Warranties/guarantees for the appliance or equipment 77 83 81 81 5 8 7 2
Someone you trust recommended the product 68 70 75 68 3 5 5 5
Product is better for the environment 73 78 77 81 3 4 5 0
Type of fuel used by the appliance or equipment 72 75 74 77 4 6 3 5
Product features, such as color, size, and options 66 69 67 68 6 5 3 2
Brand name 51 59 59 66 2 3 3 0Presence of the ENERGY STAR logo 55 57 60 83** 1 2 3 2
Product helps reduce global warming - - 65 77 - - 3 5
Immediate availability of the appliance or equipment 71 72 78 73 3 3 2 5
Appearance of the appliance or equipment 63 69 68 70 4 3 2 5
Payback period for the appliance or equipment - - 55 54 - - 2 0
* Of those with multiple mentions as “very important” ** Statistically significant difference from 2008 national survey at the 95% confidence level
22
Q31. Generally, in making a decision about purchasing an appliance or other energy-using equipment, how important is each of the following factors on a scale of zero to ten, where zero is “not at all important” and ten is “very important”:
Base: Asked of one-half of sample, national n = 410, UI n = 41
Q31a. Of the features you said were very important, which of the following is most important?Base: Asked of one-half of sample, national n = 410, UI n = 41

2008 Energy Conservation, Efficiency, and Demand Response – United Illuminating Over-sample
Vendor Choice for Appliance Purchases
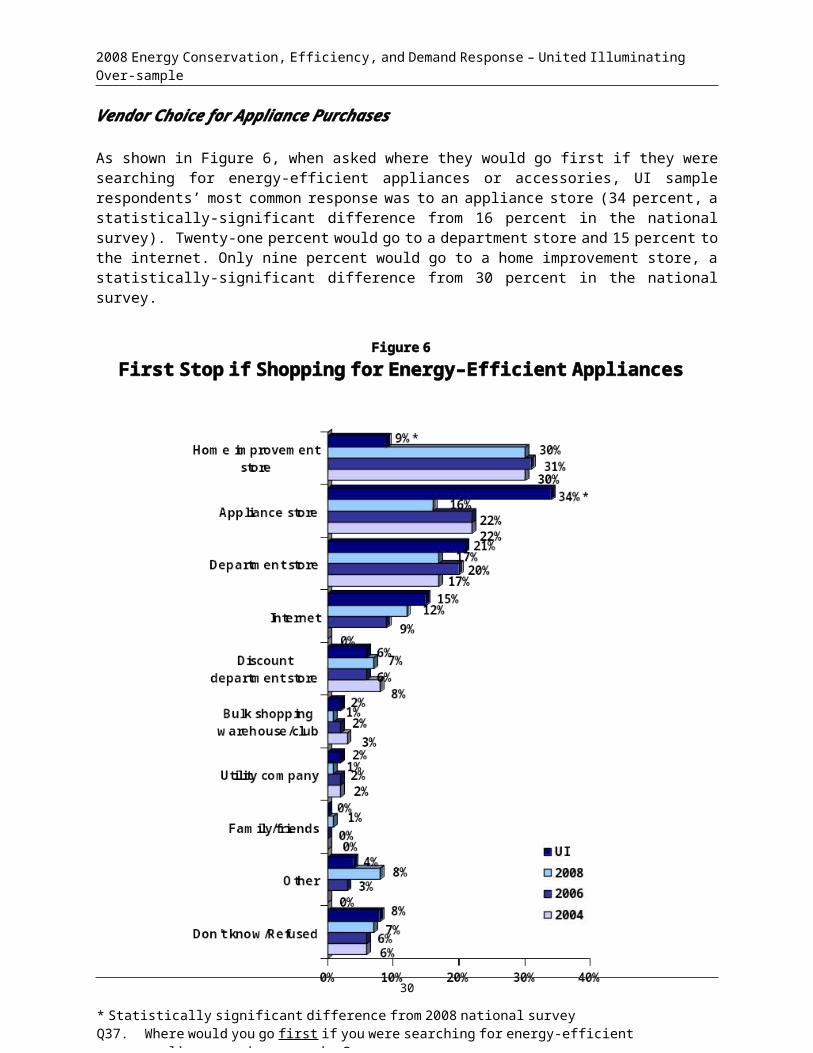
As shown in Figure 6, when asked where they would go first if they were searching for energy-efficient appliances or accessories, UI sample respondents’ most common response was to an appliance store (34 percent, a statistically-significant difference from 16 percent in the national survey). Twenty-one percent would go to a department store and 15 percent to the internet. Only nine percent would go to a home improvement store, a statistically-significant difference from 30 percent in the national survey.
23
* Statistically significant difference from 2008 national surveyQ37. Where would you go first if you were searching for energy-efficient appliances and accessories?Base: Asked of one-half of sample, national n = 391, UI n = 53
Figure 6First Stop if Shopping for Energy–Efficient Appliances
2008 Energy Conservation, Efficiency, and Demand Response – United Illuminating Over-sample
Consideration of Energy-Efficiency in Appliance Purchases
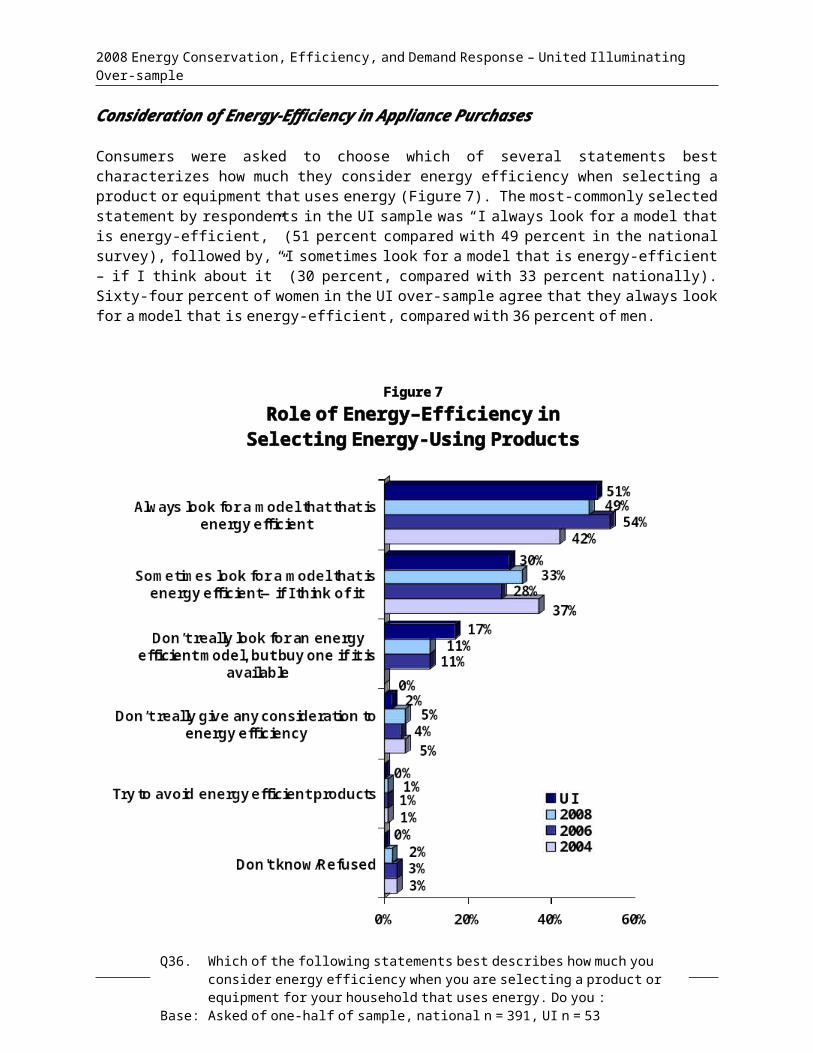
Consumers were asked to choose which of several statements best characterizes how much they consider energy efficiency when selecting a product or equipment that uses energy (Figure 7). The most-commonly selected statement by respondents in the UI sample was “I always look for a model that is energy-efficient,” (51 percent compared with 49 percent in the national survey), followed by, “I sometimes look for a model that is energy-efficient – if I think about it” (30 percent, compared with 33 percent nationally). Sixty-four percent of women in the UI over-sample agree that they always look for a model that is energy-efficient, compared with 36 percent of men.
24
Figure 7Role of Energy–Efficiency in
Selecting Energy-Using Products
Q36. Which of the following statements best describes how much you consider energy efficiency when you are selecting a product or equipment for your household that uses energy. Do you :
Base: Asked of one-half of sample, national n = 391, UI n = 53
2008 Energy Conservation, Efficiency, and Demand Response – United Illuminating Over-sample
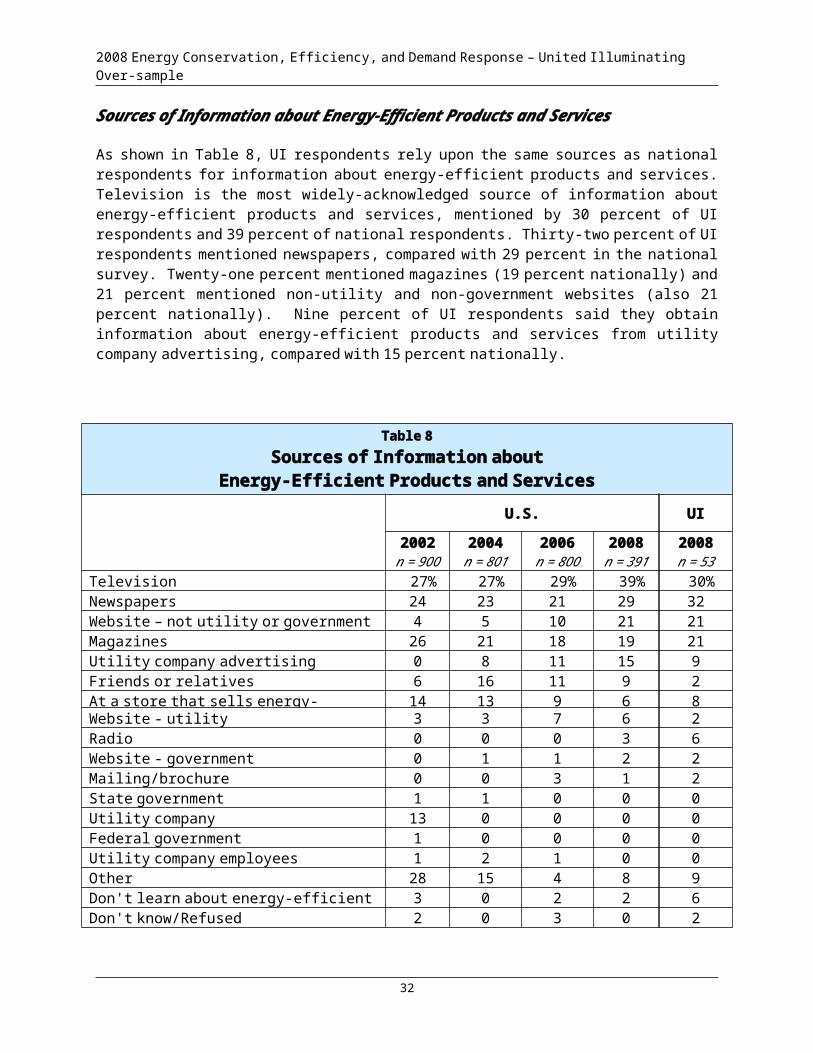
Sources of Information about Energy-Efficient Products and Services
As shown in Table 8, UI respondents rely upon the same sources as national respondents for information about energy-efficient products and services. Television is the most widely-acknowledged source of information about energy-efficient products and services, mentioned by 30 percent of UI respondents and 39 percent of national respondents. Thirty-two percent of UI respondents mentioned newspapers, compared with 29 percent in the national survey. Twenty-one percent mentioned magazines (19 percent nationally) and 21 percent mentioned non-utility and non-government websites (also 21 percent nationally). Nine percent of UI respondents said they obtain information about energy-efficient products and services from utility company advertising, compared with 15 percent nationally.
Table 8Sources of Information about
Energy-Efficient Products and Services
U.S. UI
2002n = 900
2004n = 801
2006n = 800
2008n = 391
2008n = 53
Television 27% 27% 29% 39% 30%Newspapers 24 23 21 29 32Website – not utility or government 4 5 10 21 21Magazines 26 21 18 19 21Utility company advertising 0 8 11 15 9Friends or relatives 6 16 11 9 2At a store that sells energy-efficient products 14 13 9 6 8Website - utility 3 3 7 6 2Radio 0 0 0 3 6Website - government 0 1 1 2 2Mailing/brochure 0 0 3 1 2State government 1 1 0 0 0Utility company 13 0 0 0 0Federal government 1 0 0 0 0Utility company employees 1 2 1 0 0Other 28 15 4 8 9Don't learn about energy-efficient products 3 0 2 2 6Don't know/Refused 2 0 3 0 2
25
Q19. How do you typically learn about energy-efficient products and services? Base: In 2008, one-half of the national and UI samples was asked this question. In 2002,
2004, and 2006, all national respondents were asked.
Note: Multiple responses permitted
2008 Energy Conservation, Efficiency, and Demand Response – United Illuminating Over-sample
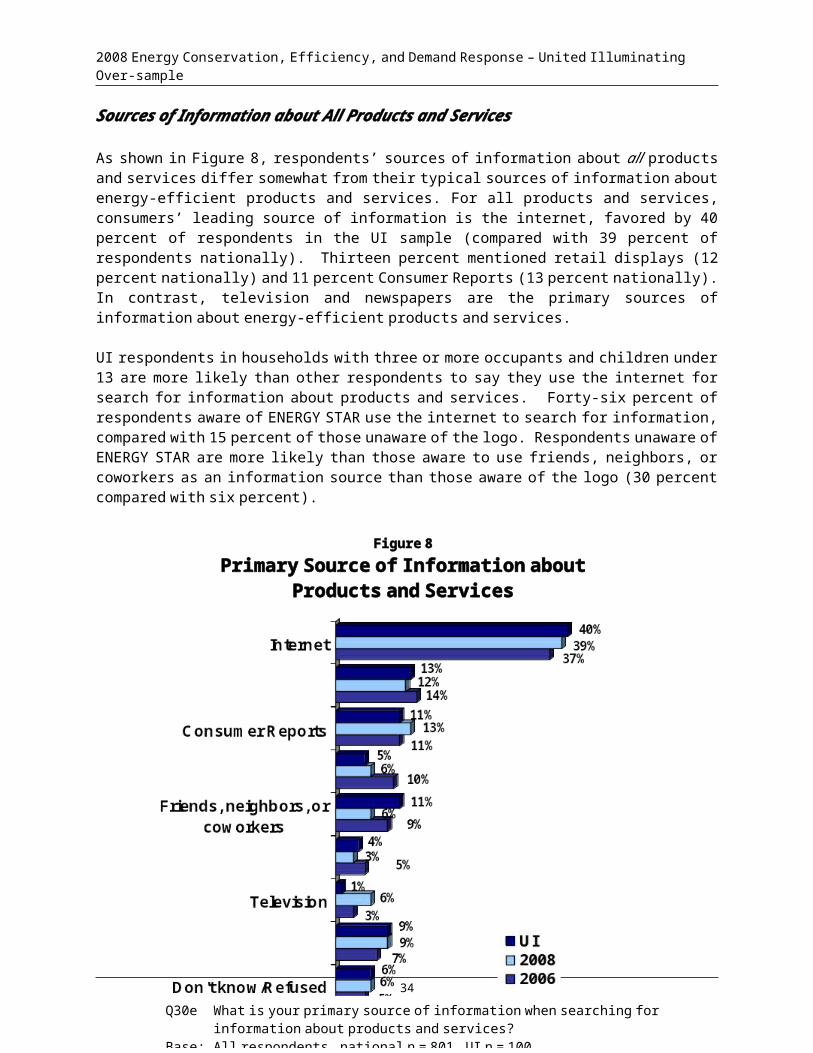
Sources of Information about All Products and Services
As shown in Figure 8, respondents’ sources of information about all products and services differ somewhat from their typical sources of information about energy-efficient products and services. For all products and services, consumers’ leading source of information is the internet, favored by 40 percent of respondents in the UI sample (compared with 39 percent of respondents nationally). Thirteen percent mentioned retail displays (12 percent nationally) and 11 percent Consumer Reports (13 percent nationally). In contrast, television and newspapers are the primary sources of information about energy-efficient products and services.
UI respondents in households with three or more occupants and children under 13 are more likely than other respondents to say they use the internet for search for information about products and services. Forty-six percent of respondents aware of ENERGY STAR use the internet to search for information, compared with 15 percent of those unaware of the logo. Respondents unaware of ENERGY STAR are more likely than those aware to use friends, neighbors, or coworkers as an information source than those aware of the logo (30 percent compared with six percent).
26
Figure 8Primary Source of Information about
Products and Services
Q30e What is your primary source of information when searching for information about products and services?
Base: All respondents, national n = 801, UI n = 100
2008 Energy Conservation, Efficiency, and Demand Response – United Illuminating Over-sample
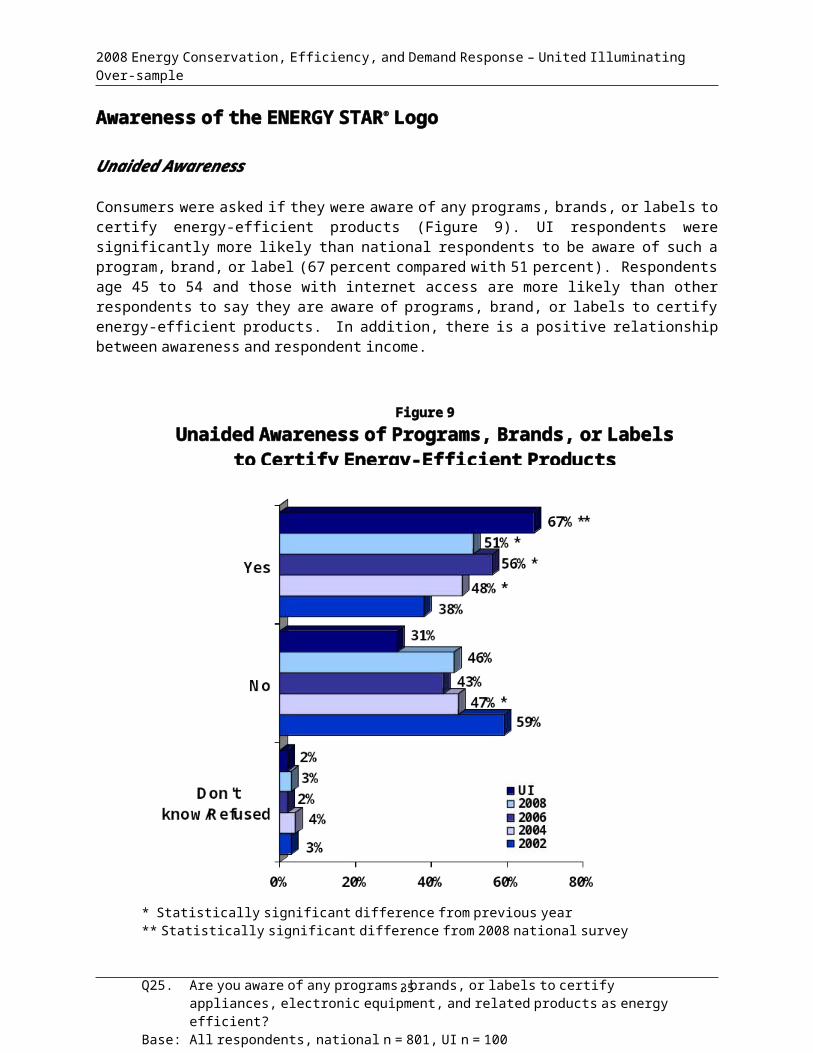
Awareness of the ENERGY STAR® Logo
Unaided Awareness
Consumers were asked if they were aware of any programs, brands, or labels to certify energy-efficient products (Figure 9). UI respondents were significantly more likely than national respondents to be aware of such a program, brand, or label (67 percent compared with 51 percent). Respondents age 45 to 54 and those with internet access are more likely than other respondents to say they are aware of programs, brand, or labels to certify energy-efficient products. In addition, there is a positive relationship between awareness and respondent income.
27
Figure 9Unaided Awareness of Programs, Brands, or Labels
to Certify Energy-Efficient Products
* Statistically significant difference from previous year** Statistically significant difference from 2008 national survey
Q25. Are you aware of any programs, brands, or labels to certify appliances, electronic equipment, and related products as energy efficient?
Base: All respondents, national n = 801, UI n = 100
2008 Energy Conservation, Efficiency, and Demand Response – United Illuminating Over-sample
Respondents who said they are aware of any programs, brands, or labels that certify energy-efficient products were asked, in an open-ended format, for its name. This line of questioning elicits “unaided” awareness, as respondents must recall the program, brand, or logo without any prompting. As shown in Table 9, ENERGY STAR was by far the most commonly recalled brand. Twenty-seven percent of UI respondents were able to mention ENERGY STAR by name, compared with 20 percent in the national survey.
Table 9Energy-Efficiency Programs, Brands, or Labels
Mentioned by Respondents (Unaided Awareness)
Base: All respondents
U.S. UI
2002n = 900
2004n = 801
2006n = 800
2008n = 801
2008n = 100
ENERGY STAR 6% 14%* 18% 20% 27%Energy Guide 1 3 1 1 1Energy $mart 0 1 0 0 0energy right 0 0 0 0 0Energy efficiency ratings/tags 0 0 6 4 9Good Cents 0 1 0 0 0Sears/Kenmore 2 0 2 3 4GE/General Electric 2 0 4 5 9Whirlpool 2 0 0 1 2Maytag 1 0 0 1 3Frigidaire 1 0 0 0 0Green/Green Star 0 0 2Other 8 13 8 5 4Don’t know/Refused 15 17 20 16 16
* Statistically significant difference from previous year
28
Q25a. What programs, brands, or labels have you heard of?
Note: Multiple responses permitted.
2008 Energy Conservation, Efficiency, and Demand Response – United Illuminating Over-sample
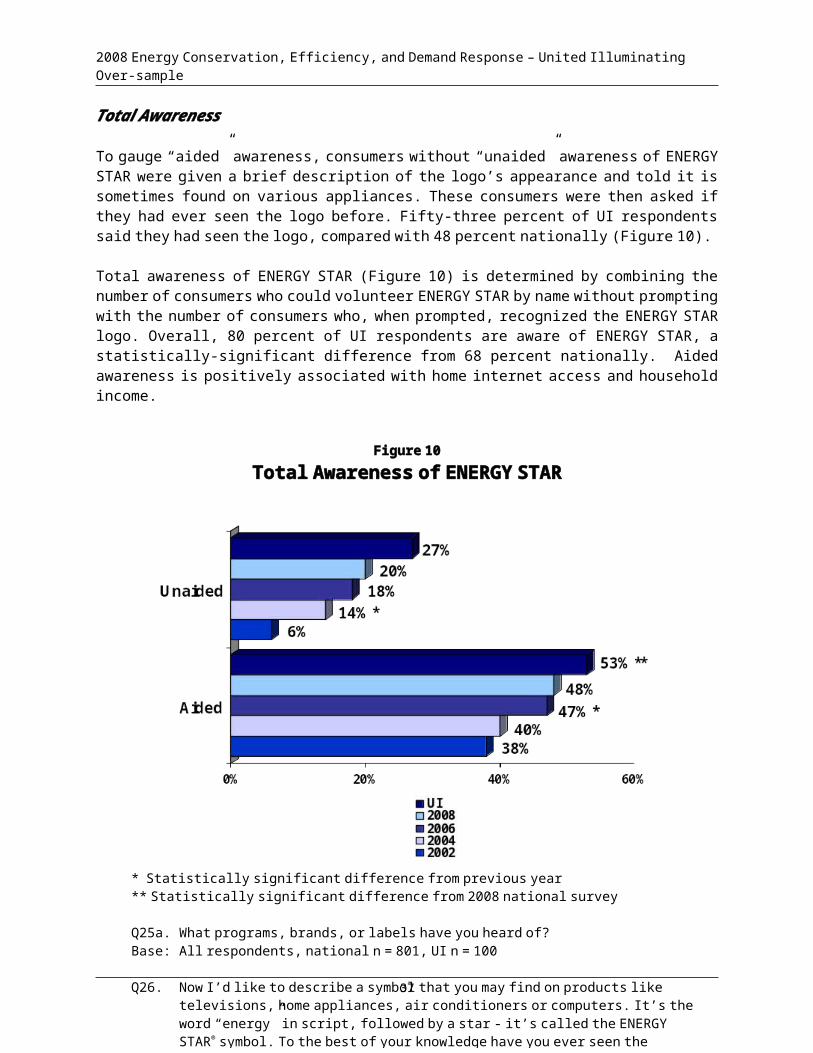
Total Awareness
To gauge “aided” awareness, consumers without “unaided” awareness of ENERGY STAR were given a brief description of the logo’s appearance and told it is sometimes found on various appliances. These consumers were then asked if they had ever seen the logo before. Fifty-three percent of UI respondents said they had seen the logo, compared with 48 percent nationally (Figure 10).
Total awareness of ENERGY STAR (Figure 10) is determined by combining the number of consumers who could volunteer ENERGY STAR by name without prompting with the number of consumers who, when prompted, recognized the ENERGY STAR logo. Overall, 80 percent of UI respondents are aware of ENERGY STAR, a statistically-significant difference from 68 percent nationally. Aided awareness is positively associated with home internet access and household income.
29
Figure 10Total Awareness of ENERGY STAR
* Statistically significant difference from previous year** Statistically significant difference from 2008 national survey
Q25a. What programs, brands, or labels have you heard of?Base: All respondents, national n = 801, UI n = 100
Q26. Now I’d like to describe a symbol that you may find on products like televisions, home appliances, air conditioners or computers. It’s the word “energy” in script, followed by a star - it’s called the ENERGY STAR® symbol. To the best of your knowledge have you ever seen the symbol?
Base: Respondents who did not mention ENERGY STAR®, national n = 642, UI n = 73

2008 Energy Conservation, Efficiency, and Demand Response – United Illuminating Over-sample
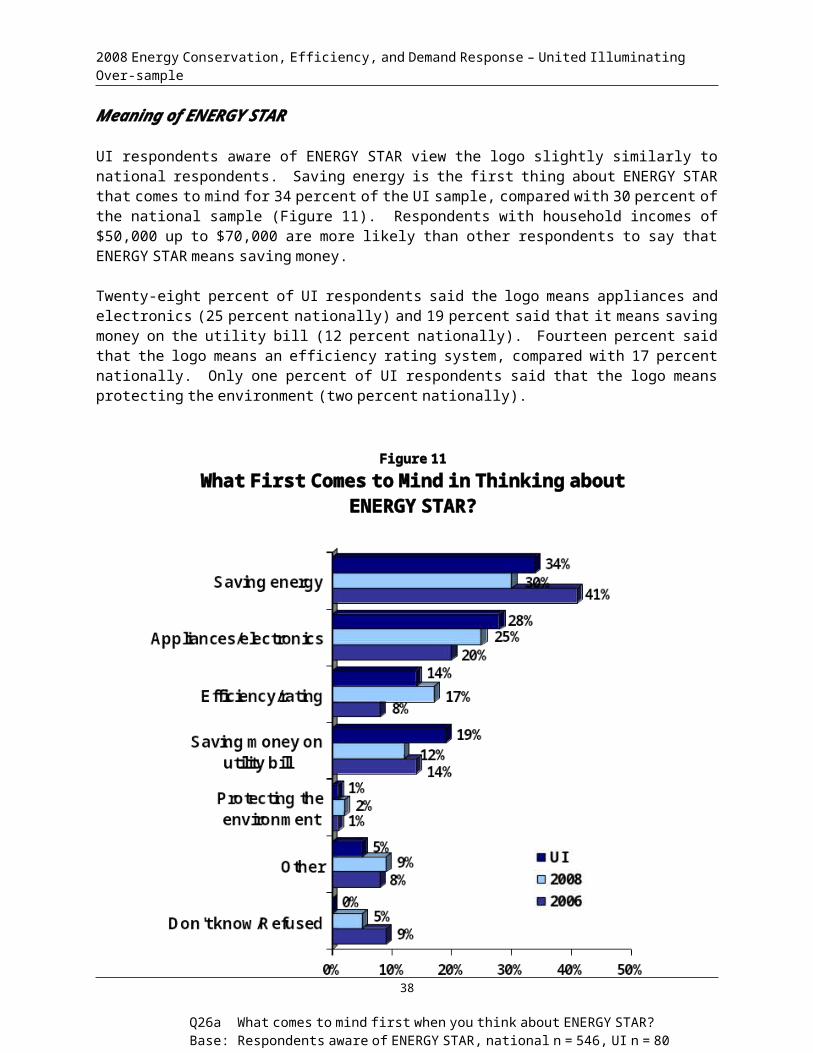
Meaning of ENERGY STAR
UI respondents aware of ENERGY STAR view the logo slightly similarly to national respondents. Saving energy is the first thing about ENERGY STAR that comes to mind for 34 percent of the UI sample, compared with 30 percent of the national sample (Figure 11). Respondents with household incomes of $50,000 up to $70,000 are more likely than other respondents to say that ENERGY STAR means saving money.
Twenty-eight percent of UI respondents said the logo means appliances and electronics (25 percent nationally) and 19 percent said that it means saving money on the utility bill (12 percent nationally). Fourteen percent said that the logo means an efficiency rating system, compared with 17 percent nationally. Only one percent of UI respondents said that the logo means protecting the environment (two percent nationally).
30
Figure 11What First Comes to Mind in Thinking about
ENERGY STAR?
Q26a What comes to mind first when you think about ENERGY STAR?Base: Respondents aware of ENERGY STAR, national n = 546, UI n = 80

2008 Energy Conservation, Efficiency, and Demand Response – United Illuminating Over-sample
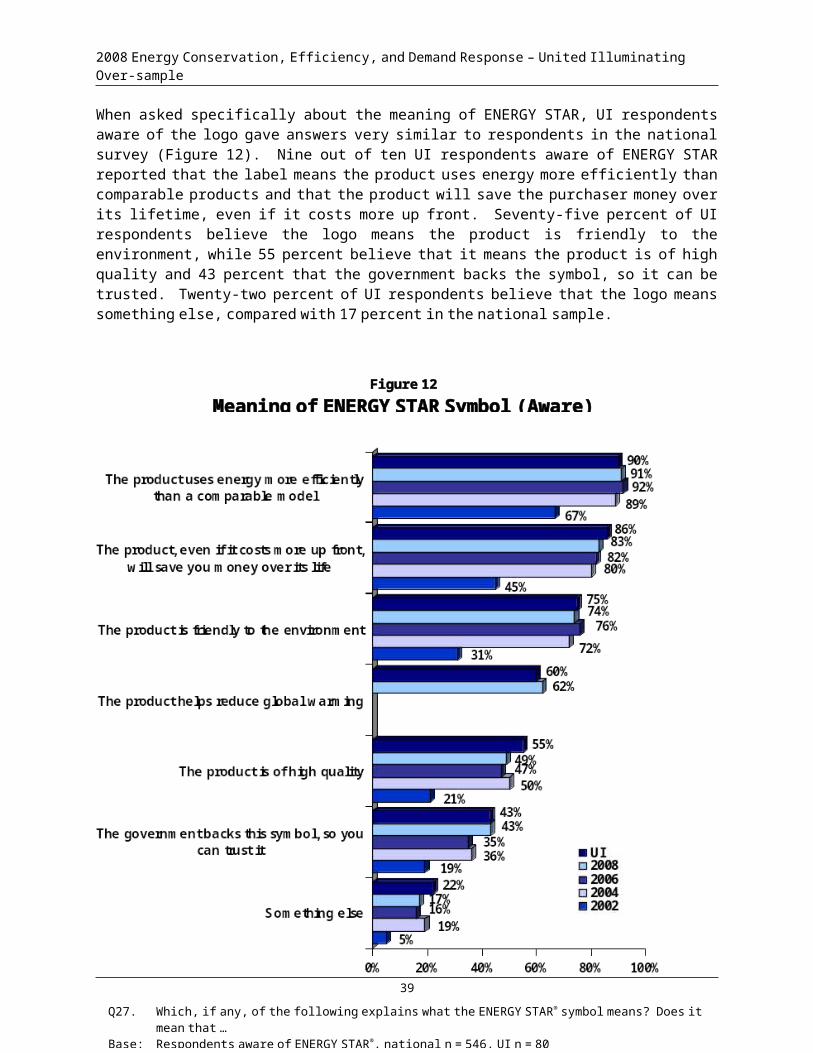
When asked specifically about the meaning of ENERGY STAR, UI respondents aware of the logo gave answers very similar to respondents in the national survey (Figure 12). Nine out of ten UI respondents aware of ENERGY STAR reported that the label means the product uses energy more efficiently than comparable products and that the product will save the purchaser money over its lifetime, even if it costs more up front. Seventy-five percent of UI respondents believe the logo means the product is friendly to the environment, while 55 percent believe that it means the product is of high quality and 43 percent that the government backs the symbol, so it can be trusted. Twenty-two percent of UI respondents believe that the logo means something else, compared with 17 percent in the national sample.
31
Q27. Which, if any, of the following explains what the ENERGY STAR® symbol means? Does it mean that …Base: Respondents aware of ENERGY STAR®, national n = 546, UI n = 80Note: Multiple responses permitted.
Figure 12Meaning of ENERGY STAR Symbol (Aware)
2008 Energy Conservation, Efficiency, and Demand Response – United Illuminating Over-sample
Sponsorship of ENERGY STAR
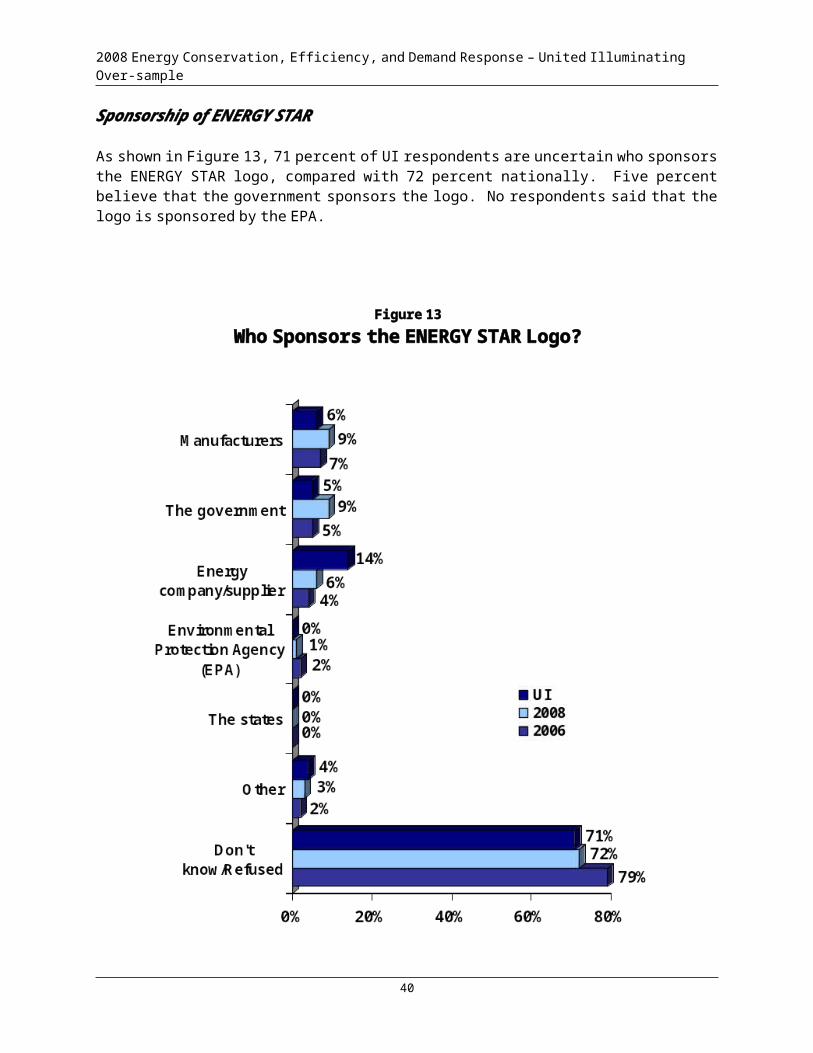
As shown in Figure 13, 71 percent of UI respondents are uncertain who sponsors the ENERGY STAR logo, compared with 72 percent nationally. Five percent believe that the government sponsors the logo. No respondents said that the logo is sponsored by the EPA.
32
Figure 13Who Sponsors the ENERGY STAR Logo?
Q26b Who sponsors the ENERGY STAR® logo?Base: Respondents aware of ENERGY STAR®, national n = 546, UI n = 80
2008 Energy Conservation, Efficiency, and Demand Response – United Illuminating Over-sample
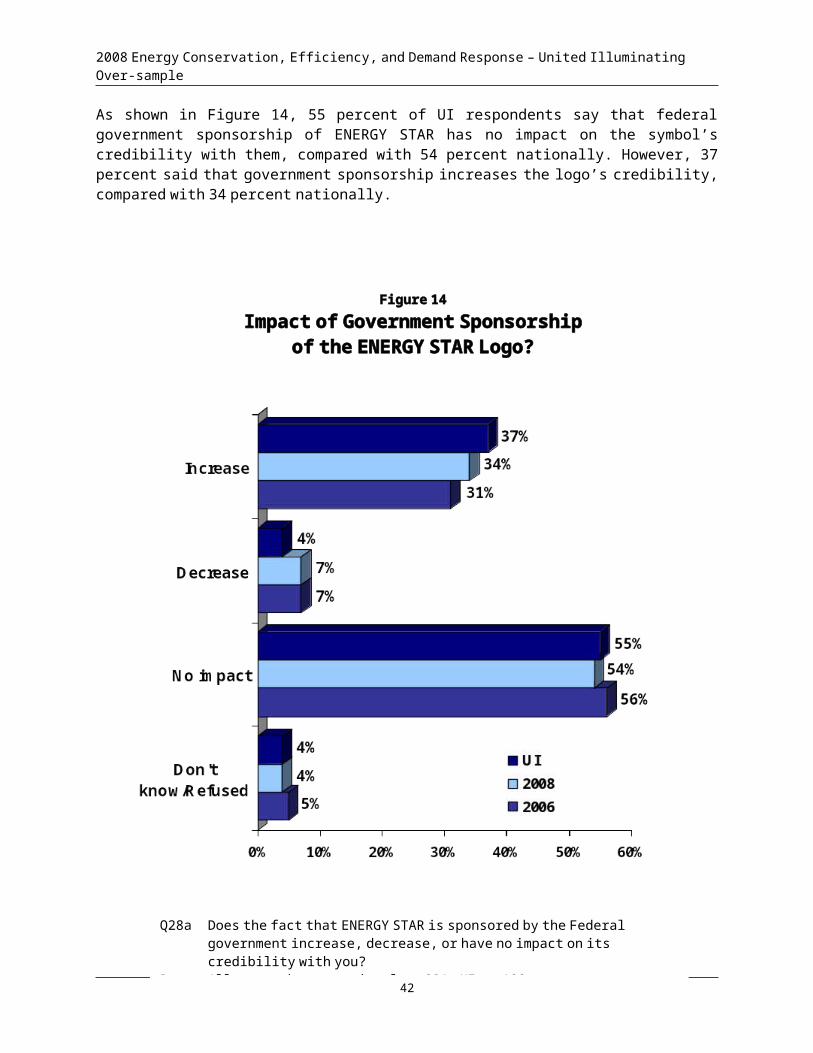
As shown in Figure 14, 55 percent of UI respondents say that federal government sponsorship of ENERGY STAR has no impact on the symbol’s credibility with them, compared with 54 percent nationally. However, 37 percent said that government sponsorship increases the logo’s credibility, compared with 34 percent nationally.
33
Figure 14Impact of Government Sponsorship
of the ENERGY STAR Logo?
Q28a Does the fact that ENERGY STAR is sponsored by the Federal government increase, decrease, or have no impact on its credibility with you?
Base: All respondents, national n = 801, UI n = 100
2008 Energy Conservation, Efficiency, and Demand Response – United Illuminating Over-sample
Purchases of Energy-Using Equipment and the Impact of the ENERGY STAR Logo
Energy-Using Products Purchased in the Past Year
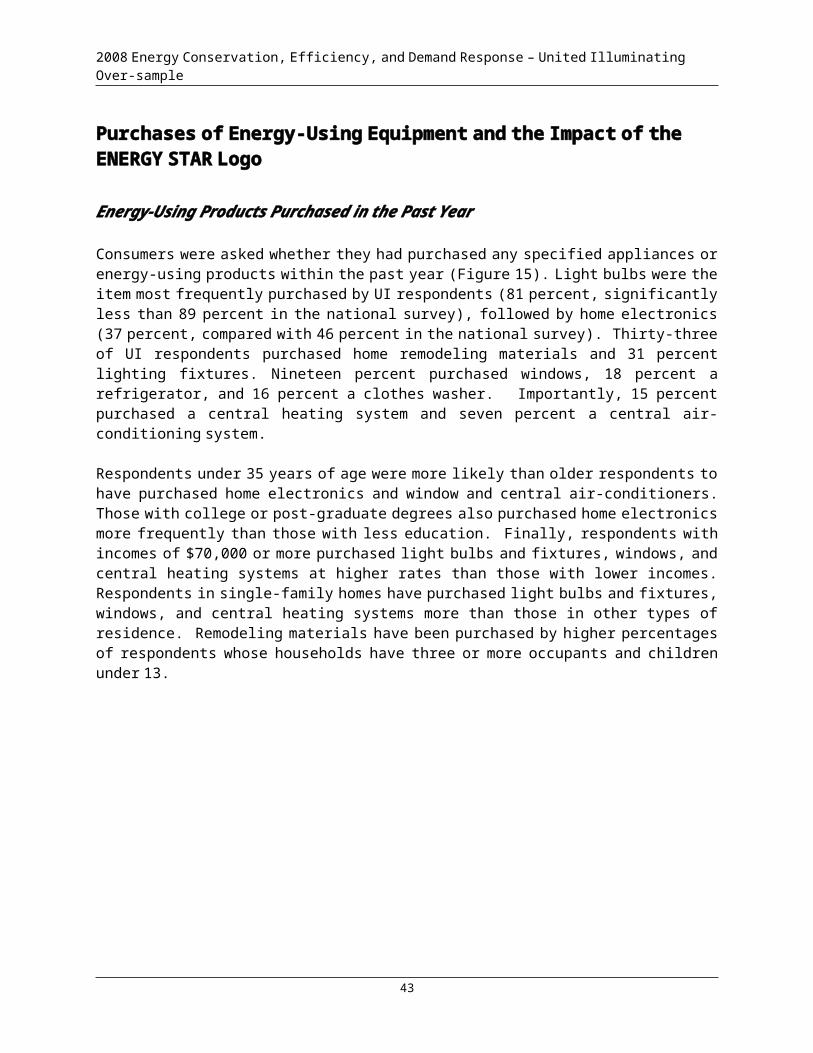
Consumers were asked whether they had purchased any specified appliances or energy-using products within the past year (Figure 15). Light bulbs were the item most frequently purchased by UI respondents (81 percent, significantly less than 89 percent in the national survey), followed by home electronics (37 percent, compared with 46 percent in the national survey). Thirty-three of UI respondents purchased home remodeling materials and 31 percent lighting fixtures. Nineteen percent purchased windows, 18 percent a refrigerator, and 16 percent a clothes washer. Importantly, 15 percent purchased a central heating system and seven percent a central air-conditioning system.
Respondents under 35 years of age were more likely than older respondents to have purchased home electronics and window and central air-conditioners. Those with college or post-graduate degrees also purchased home electronics more frequently than those with less education. Finally, respondents with incomes of $70,000 or more purchased light bulbs and fixtures, windows, and central heating systems at higher rates than those with lower incomes. Respondents in single-family homes have purchased light bulbs and fixtures, windows, and central heating systems more than those in other types of residence. Remodeling materials have been purchased by higher percentages of respondents whose households have three or more occupants and children under 13.
34
2008 Energy Conservation, Efficiency, and Demand Response – United Illuminating Over-sample
35
Figure 15Appliances and Energy Using Equipment
Purchased in the Past Year
* Statistically significant difference from previous year** Statistically significant difference from 2008 national survey
Q29. In the past year, have you purchased any of the following items for your home?Base: All respondents, national n = 801, UI n = 100Note: Multiple responses permitted.
2008 Energy Conservation, Efficiency, and Demand Response – United Illuminating Over-sample
ENERGY STAR Products Purchased in the Past Year
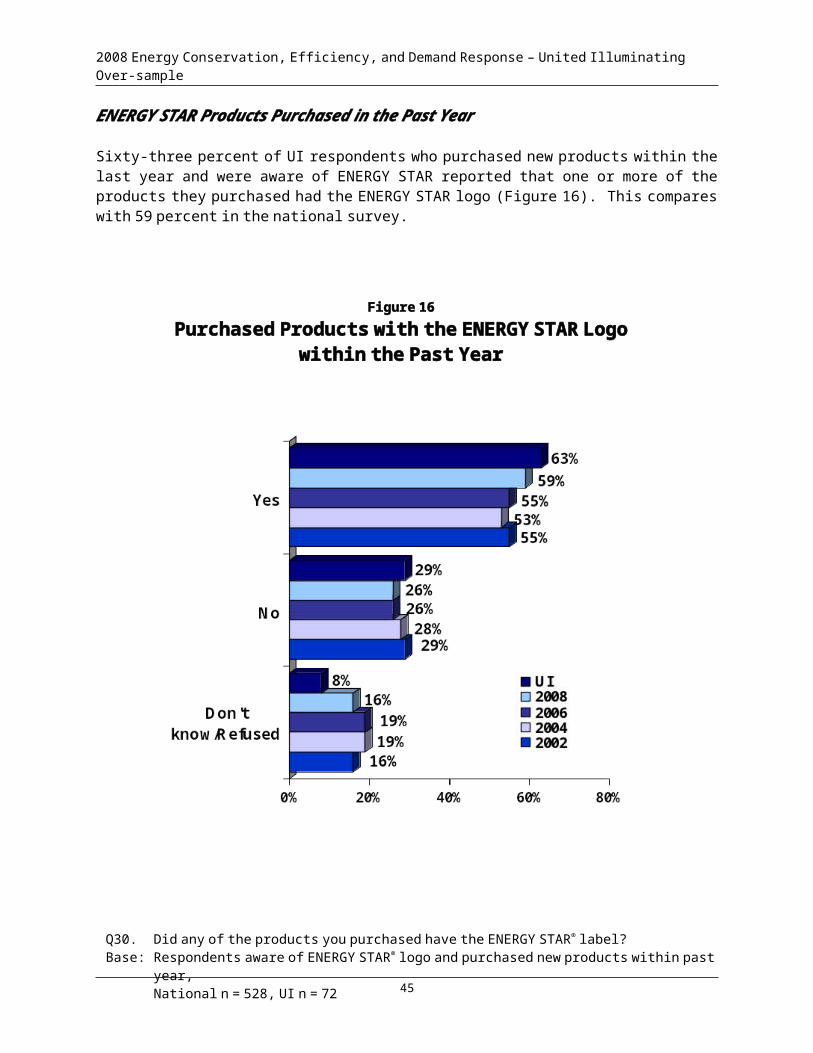
Sixty-three percent of UI respondents who purchased new products within the last year and were aware of ENERGY STAR reported that one or more of the products they purchased had the ENERGY STAR logo (Figure 16). This compares with 59 percent in the national survey.
36
Figure 16Purchased Products with the ENERGY STAR Logo
within the Past Year
Q30. Did any of the products you purchased have the ENERGY STAR® label? Base: Respondents aware of ENERGY STAR® logo and purchased new products within past year,
National n = 528, UI n = 72
2008 Energy Conservation, Efficiency, and Demand Response – United Illuminating Over-sample
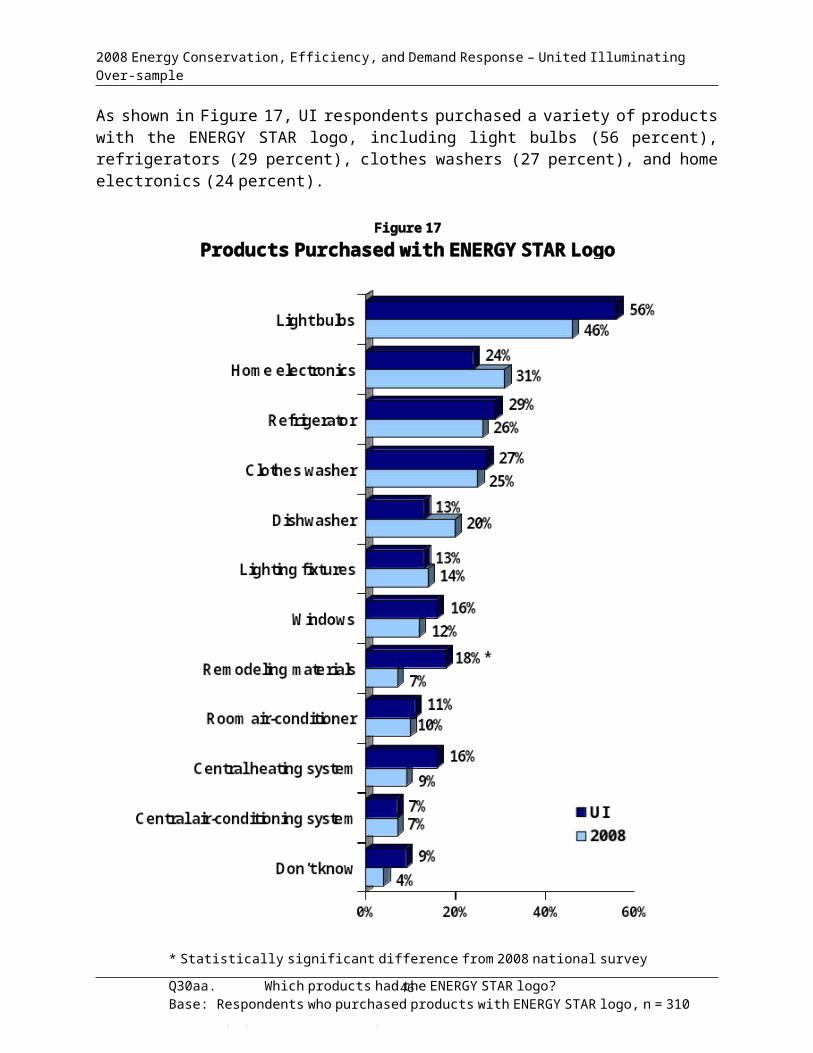
As shown in Figure 17, UI respondents purchased a variety of products with the ENERGY STAR logo, including light bulbs (56 percent), refrigerators (29 percent), clothes washers (27 percent), and home electronics (24 percent).
37
Figure 17Products Purchased with ENERGY STAR Logo
* Statistically significant difference from 2008 national survey
Q30aa. Which products had the ENERGY STAR logo?Base: Respondents who purchased products with ENERGY STAR logo, n = 310
Note: Multiple responses permitted.

2008 Energy Conservation, Efficiency, and Demand Response – United Illuminating Over-sample
Influences on Product Purchases
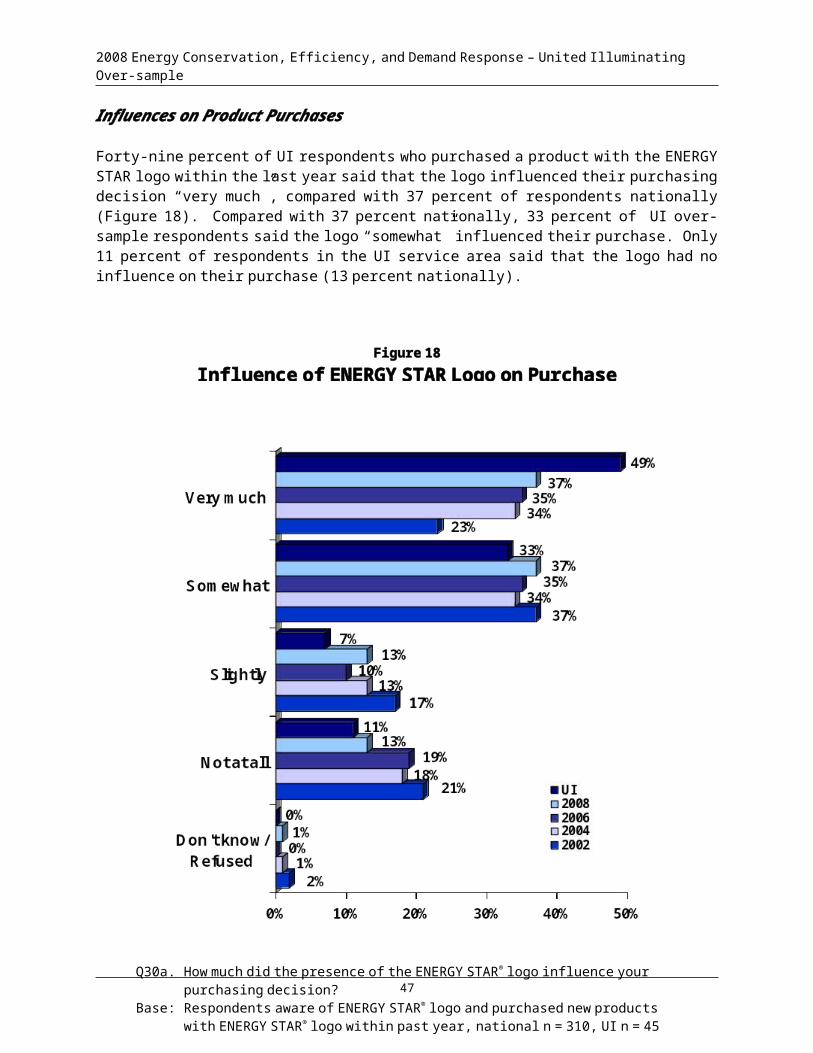
Forty-nine percent of UI respondents who purchased a product with the ENERGY STAR logo within the last year said that the logo influenced their purchasing decision “very much”, compared with 37 percent of respondents nationally (Figure 18). Compared with 37 percent nationally, 33 percent of UI over-sample respondents said the logo “somewhat” influenced their purchase. Only 11 percent of respondents in the UI service area said that the logo had no influence on their purchase (13 percent nationally).
38
Figure 18Influence of ENERGY STAR Logo on Purchase
Q30a. How much did the presence of the ENERGY STAR® logo influence your purchasing decision?
Base: Respondents aware of ENERGY STAR® logo and purchased new products with ENERGY STAR® logo within past year, national n = 310, UI n = 45
2008 Energy Conservation, Efficiency, and Demand Response – United Illuminating Over-sample
Respondents who did not purchase products with the ENERGY STAR logo were asked about the importance of energy efficiency in their purchase. As shown in Figure 19, 29 percent of UI respondents said that energy efficiency was “very important” in their purchase, while 48 percent said that it was “somewhat important”. This compares with 25 and 43 percent, respectively, in the national survey.
39
Figure 19Importance of Energy Efficiency in Influencing Purchase
Q30bb. How important was the energy efficiency of the products you purchases in influencing your decision?
Base: Respondents who did not purchase products with the ENERGY STAR label, national n = 136, UI n = 21
2008 Energy Conservation, Efficiency, and Demand Response – United Illuminating Over-sample
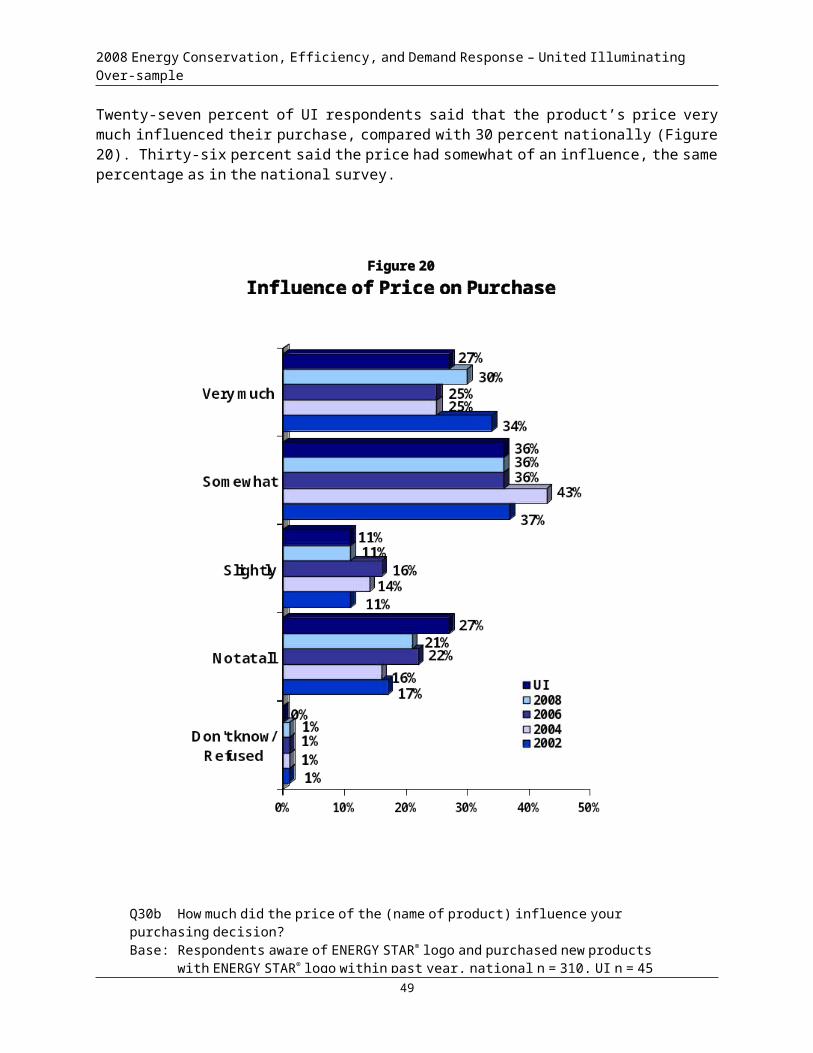
Twenty-seven percent of UI respondents said that the product’s price very much influenced their purchase, compared with 30 percent nationally (Figure 20). Thirty-six percent said the price had somewhat of an influence, the same percentage as in the national survey.
40
Figure 20Influence of Price on Purchase
Q30b How much did the price of the (name of product) influence your purchasing decision?Base: Respondents aware of ENERGY STAR® logo and purchased new products with
ENERGY STAR® logo within past year, national n = 310, UI n = 45
2008 Energy Conservation, Efficiency, and Demand Response – United Illuminating Over-sample
Likelihood to Purchase Additional ENERGY STAR Products
UI respondents who reported having purchased a product with the ENERGY STAR logo within the last year were asked how likely they would be to purchase another ENERGY STAR product in the future (Figure 21). Seventy-six percent reported they would be very likely to do so, with another 22 percent saying they would be somewhat likely to do so. This compares with 70 percent and 26 percent, respectively, in the national survey. Overall, UI respondents are slightly more likely than national respondents to say they would purchase another item with the ENERGY STAR logo.
41
Figure 21Likelihood to Purchase another Item with the ENERGY STAR Logo
in the Future
Q30c. In the future, how likely are you to purchase an item with the ENERGY STAR® logo?Base: Respondents aware of ENERGY STAR® logo and purchased new products with
ENERGY STAR® logo within past year, national n = 310, UI n = 45
2008 Energy Conservation, Efficiency, and Demand Response – United Illuminating Over-sample
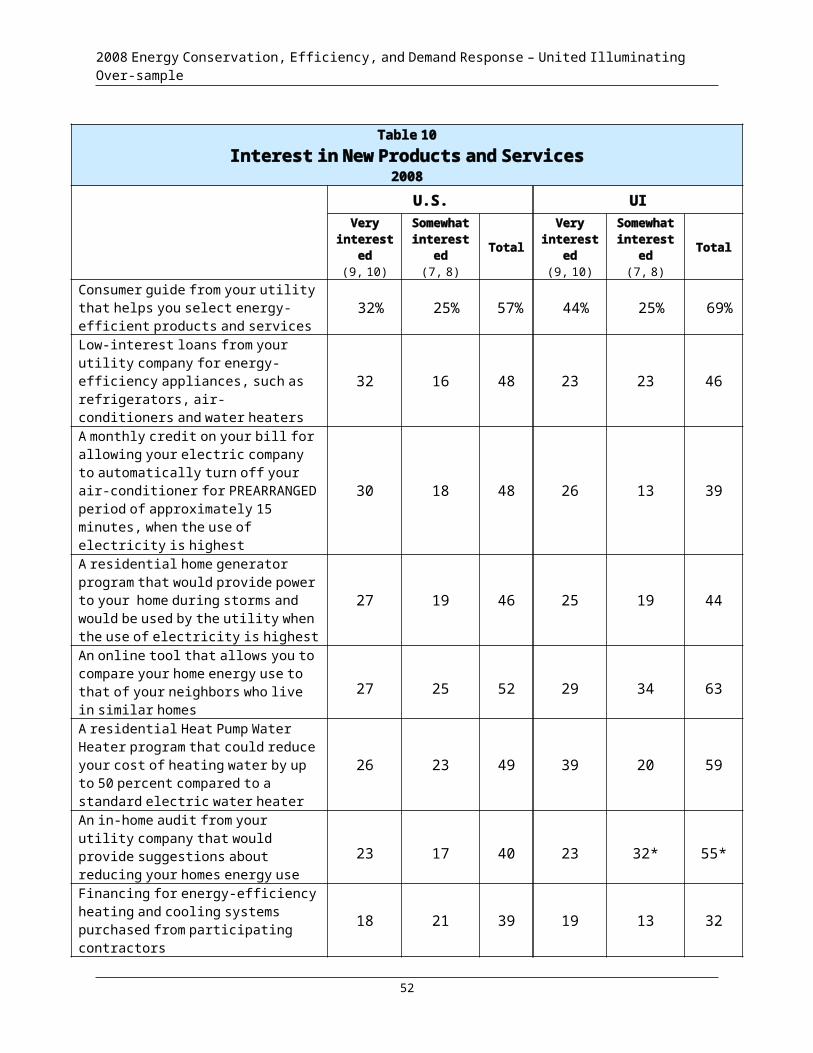
Interest in Energy-Efficient Products and Services
Using a scale of zero to 10, respondents in the UI over-sample were asked to indicate their interest in a series of energy-related products and services (Table 10). With a rating of 9 or 10 on the scale considered “very interested”, 44 percent of respondents said they would be very interested in a consumer guide from the utility to help them select energy-efficiency products and services, and 39 percent of respondents would be very interested in a residential heat pump water heater program.
Twenty-nine percent would be very interested in an online tool that would allow them to compare their home energy usage to that of their neighbors living in similar homes. Forty-three percent of women are interested in the online tool, compared with 14 percent of men.
Approximately one-quarter said they are very interested in low-interest loans for the purchase of energy–efficient products, air-conditioning cycling, a residential home generator program, and an in-home energy audit. Thirty-eight percent of respondents who are interested in saving money on their energy bill are very interested in the home generator program, compared with only seven percent who choose comfort over savings. Similarly, 32 percent of respondents who are interested in saving money on their energy bill are very interested in a home energy audit, compared with only nine percent who choose comfort over savings. Respondents under age 35 are more interested in a home energy audit than older respondents.
One in five respondents would be interested in financing of energy-efficient heating and cooling systems; 32 percent of women are very interested in financing, compared with no men in the UI sample.
42
2008 Energy Conservation, Efficiency, and Demand Response – United Illuminating Over-sample
Table 10Interest in New Products and Services
2008
U.S. UIVery
interested(9, 10)
Somewhat interested
(7, 8)Total
Very interested
(9, 10)
Somewhat interested
(7, 8)Total
Consumer guide from your utility that helps you select energy-efficient products and services
32% 25% 57% 44% 25% 69%
Low-interest loans from your utility company for energy-efficiency appliances, such as refrigerators, air-conditioners and water heaters
32 16 48 23 23 46
A monthly credit on your bill for allowing your electric company to automatically turn off your air-conditioner for PREARRANGED period of approximately 15 minutes, when the use of electricity is highest
30 18 48 26 13 39
A residential home generator program that would provide power to your home during storms and would be used by the utility when the use of electricity is highest
27 19 46 25 19 44
An online tool that allows you to compare your home energy use to that of your neighbors who live in similar homes
27 25 52 29 34 63
A residential Heat Pump Water Heater program that could reduce your cost of heating water by up to 50 percent compared to a standard electric water heater
26 23 49 39 20 59
An in-home audit from your utility company that would provide suggestions about reducing your homes energy use
23 17 40 23 32* 55*
Financing for energy-efficiency heating and cooling systems purchased from participating contractors
18 21 39 19 13 32
* Statistically significant difference from 2008 national survey
43
Q23. How interested would you be in purchasing or using the following products and services? On a scale from zero to ten, where zero means “not at all interested” and ten means “very interested”, how interested would you be in the following? If you already have used this product from you utility company, just let me know.
2008 Energy Conservation, Efficiency, and Demand Response – United Illuminating Over-sample
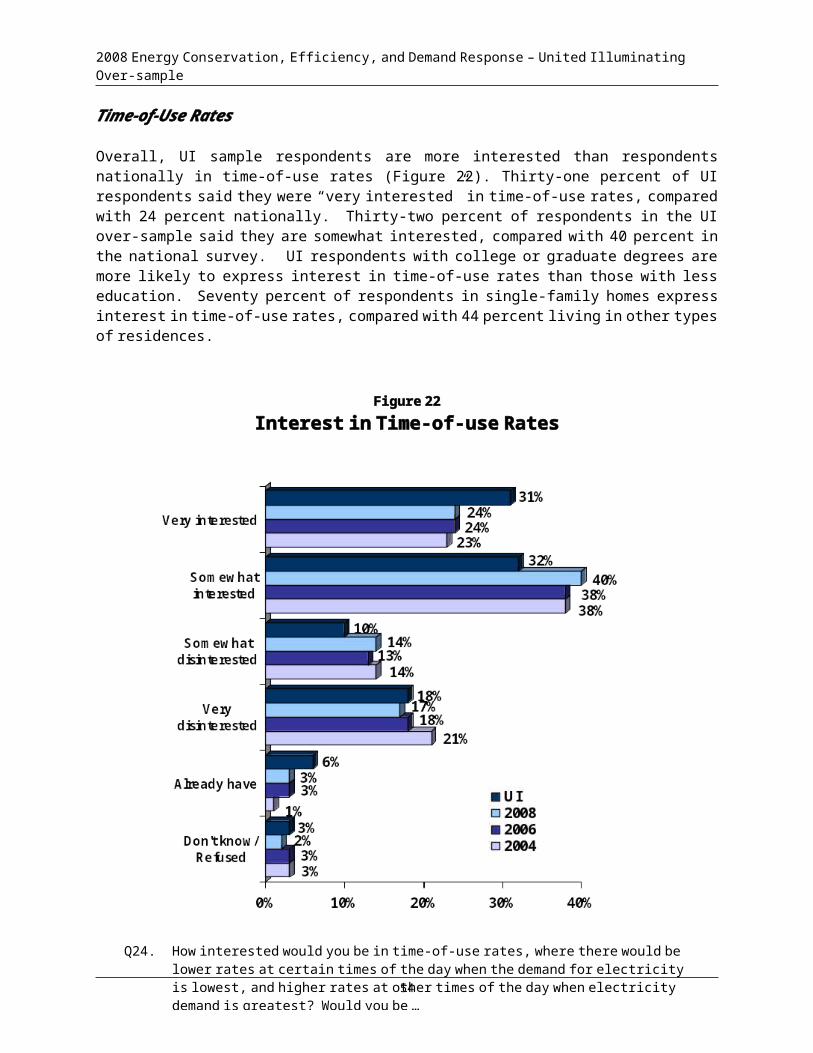
Time-of-Use Rates
Overall, UI sample respondents are more interested than respondents nationally in time-of-use rates (Figure 22). Thirty-one percent of UI respondents said they were “very interested” in time-of-use rates, compared with 24 percent nationally. Thirty-two percent of respondents in the UI over-sample said they are somewhat interested, compared with 40 percent in the national survey. UI respondents with college or graduate degrees are more likely to express interest in time-of-use rates than those with less education. Seventy percent of respondents in single-family homes express interest in time-of-use rates, compared with 44 percent living in other types of residences.
44
Figure 22Interest in Time-of-use Rates
Q24. How interested would you be in time-of-use rates, where there would be lower rates at certain times of the day when the demand for electricity is lowest, and higher rates at other times of the day when electricity demand is greatest? Would you be …
Base: All respondents, national n = 801, UI n = 100
2008 Energy Conservation, Efficiency, and Demand Response – United Illuminating Over-sample
Figure 23 shows that 67 percent of UI respondents reported they could change the time of day they use appliances and other equipment either “a lot” (29 percent) or to “some extent” (38 percent). Seventy-two percent of homeowners say they could change the times they use their appliances, compared with 44 percent of respondents living in other types of residences. Also, 78 percent of respondents who are interested in saving money on their energy bill say they have the ability to change the time that they use their appliances and equipment, compared with 53 who prefer the comfort of their home to saving money. Also more likely than other respondents to say they could change the time of use of their appliances are those aware of ENERGY STAR, who always try to save energy, and are completely or mostly convinced of global warming.
45
Figure 23Ability to Change Time of Using
Appliances and Other Equipment
* Statistically significant difference from previous year
Q24a. To what extent could you (do you) change the time of use for your appliances and other equipment to take advantage of time-of-use rates?
Base: All respondents, national n = 801, UI n = 100

2008 Energy Conservation, Efficiency, and Demand Response – United Illuminating Over-sample
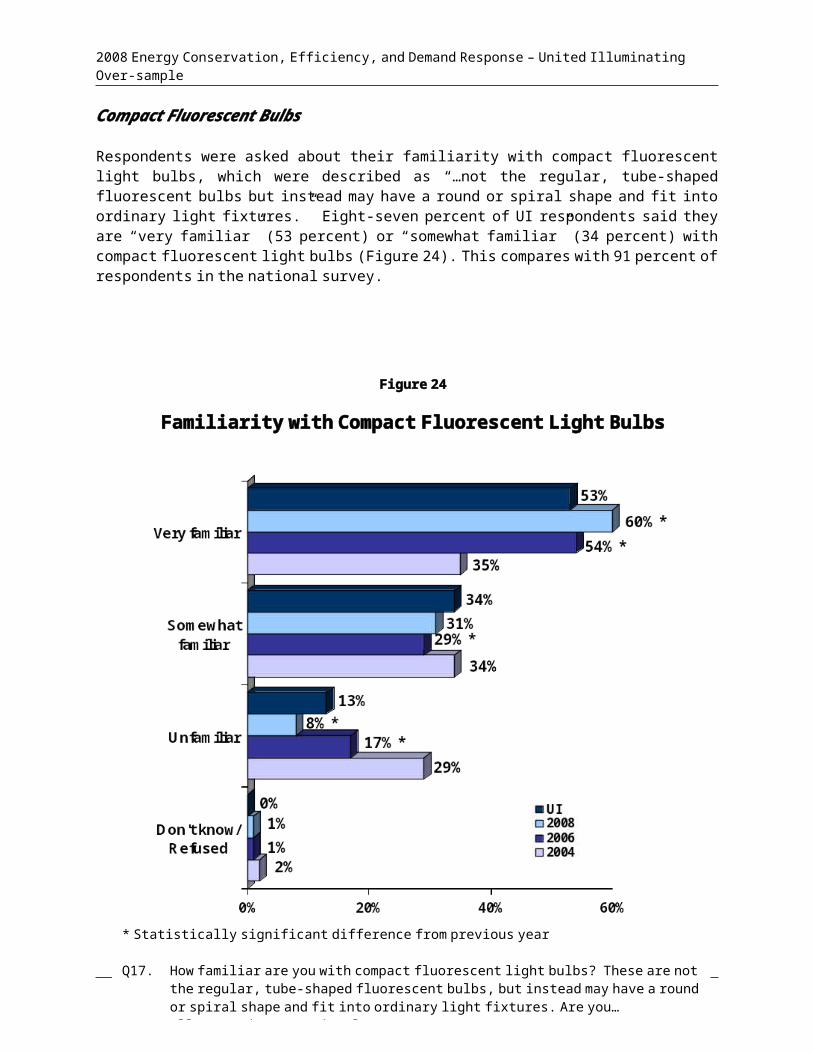
Compact Fluorescent Bulbs
Respondents were asked about their familiarity with compact fluorescent light bulbs, which were described as “…not the regular, tube-shaped fluorescent bulbs but instead may have a round or spiral shape and fit into ordinary light fixtures.” Eight-seven percent of UI respondents said they are “very familiar” (53 percent) or “somewhat familiar” (34 percent) with compact fluorescent light bulbs (Figure 24). This compares with 91 percent of respondents in the national survey.
46
Figure 24
Familiarity with Compact Fluorescent Light Bulbs
* Statistically significant difference from previous year
Q17. How familiar are you with compact fluorescent light bulbs? These are not the regular, tube-shaped fluorescent bulbs, but instead may have a round or spiral shape and fit into ordinary light fixtures. Are you…
Base: All respondents, national n = 801, UI n = 100
2008 Energy Conservation, Efficiency, and Demand Response – United Illuminating Over-sample
UI respondents who reported being somewhat or very familiar with CFLs were asked whether they had any of the bulbs in their homes. A large majority (89 percent) of those familiar with CFLs reported having them in their homes (Figure 25). This compares with 84 percent in the national sample. Among UI respondents, 95 percent of respondents over age 45 have CFLs in their home, compared with 71 percent of respondents who are under age 35 and 69 percent who are age 35 to 44.
47
Figure 25Have Compact Fluorescent Light Bulbs?
* Statistically significant difference from previous year
Q17a. Do you have any compact fluorescent bulbs in your home? Base: Respondents somewhat or very familiar with compact fluorescent bulbs,
National n = 725, UI n = 87
2008 Energy Conservation, Efficiency, and Demand Response – United Illuminating Over-sample
As shown in Figure 26, two percent of UI respondents with CFLs have one or two CFLs, compared with 10 percent nationally. Seventeen percent have three or four (compared with 10 percent nationally), 14 percent have five or six (compared with 19 percent nationally), and 22 percent have 7 to 10 (compared with 22 percent nationally). Thirty-eight percent have more than 10 CFLS, compared with 37 percent nationally. On average, both UI and national respondents have 11.2 CFLs installed in their home.
48
Figure 26Number of Compact Fluorescent Light Bulbs
Q17a1 How many do you have?Base: Respondents with compact fluorescent bulbs, national n = 612, UI n = 77
2008 Energy Conservation, Efficiency, and Demand Response – United Illuminating Over-sample
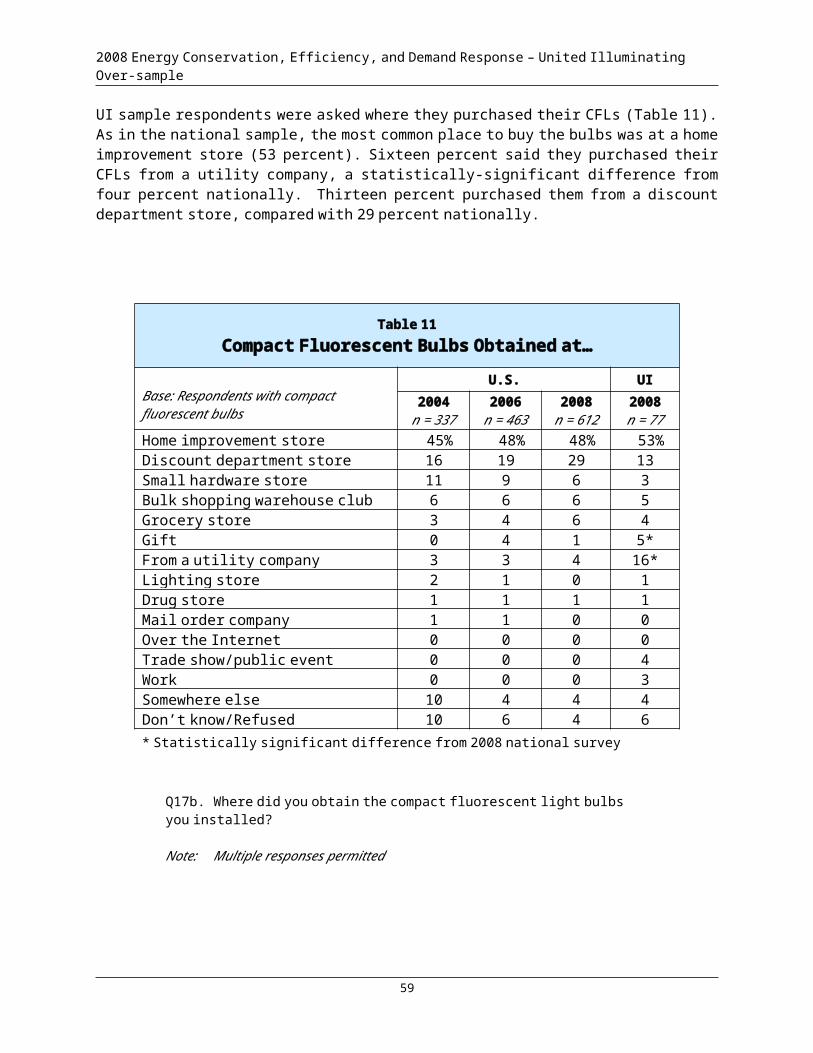
UI sample respondents were asked where they purchased their CFLs (Table 11). As in the national sample, the most common place to buy the bulbs was at a home improvement store (53 percent). Sixteen percent said they purchased their CFLs from a utility company, a statistically-significant difference from four percent nationally. Thirteen percent purchased them from a discount department store, compared with 29 percent nationally.
Table 11Compact Fluorescent Bulbs Obtained at…
Base: Respondents with compact fluorescent bulbs
U.S. UI2004
n = 3372006
n = 4632008
n = 6122008
n = 77Home improvement store 45% 48% 48% 53%Discount department store 16 19 29 13Small hardware store 11 9 6 3Bulk shopping warehouse club 6 6 6 5Grocery store 3 4 6 4Gift 0 4 1 5*From a utility company 3 3 4 16*Lighting store 2 1 0 1Drug store 1 1 1 1Mail order company 1 1 0 0Over the Internet 0 0 0 0Trade show/public event 0 0 0 4Work 0 0 0 3Somewhere else 10 4 4 4Don’t know/Refused 10 6 4 6* Statistically significant difference from 2008 national survey
49
Q17b. Where did you obtain the compact fluorescent light bulbs you installed?
Note: Multiple responses permitted

2008 Energy Conservation, Efficiency, and Demand Response – United Illuminating Over-sample
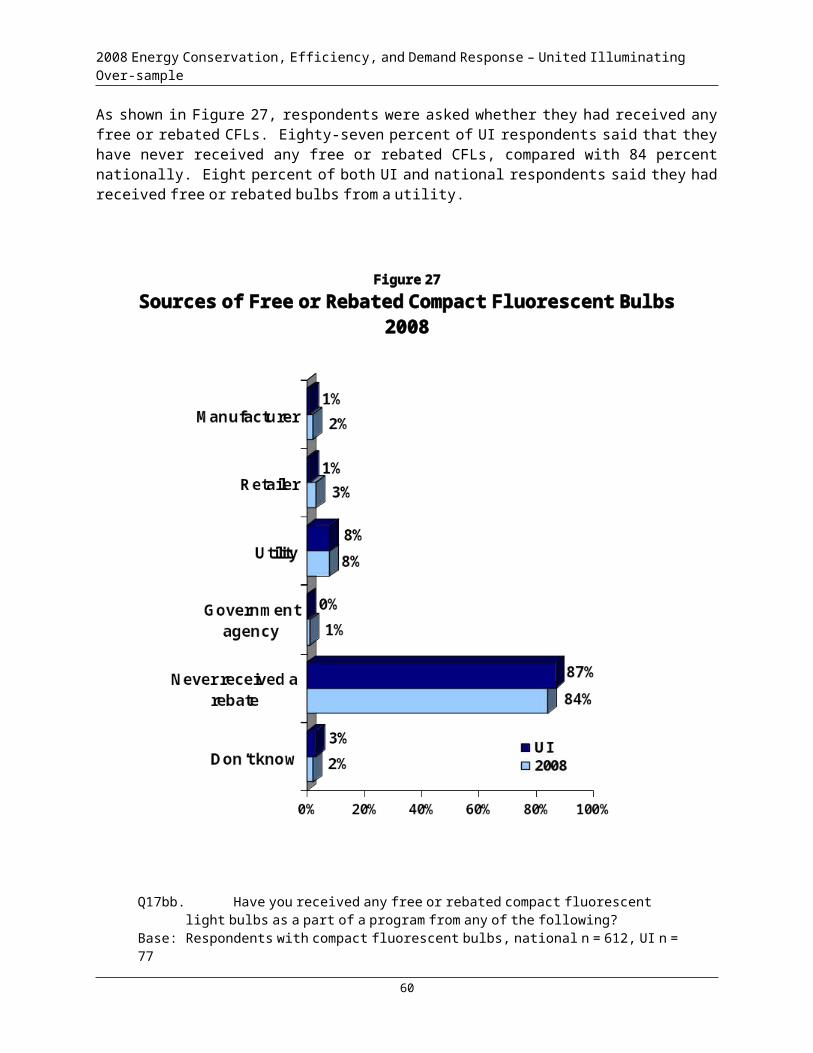
As shown in Figure 27, respondents were asked whether they had received any free or rebated CFLs. Eighty-seven percent of UI respondents said that they have never received any free or rebated CFLs, compared with 84 percent nationally. Eight percent of both UI and national respondents said they had received free or rebated bulbs from a utility.
50
Figure 27Sources of Free or Rebated Compact Fluorescent Bulbs
2008
Q17bb. Have you received any free or rebated compact fluorescent light bulbs as a part of a program from any of the following?
Base: Respondents with compact fluorescent bulbs, national n = 612, UI n = 77
Note: Multiple responses permitted
2008 Energy Conservation, Efficiency, and Demand Response – United Illuminating Over-sample
A majority (62 percent) of UI sample respondents who had purchased CFLs said they are “very likely” to purchase additional bulbs (Figure 28). Twenty-three percent said they are “somewhat likely” to do so. In the national survey, 68 percent of respondents said they are “very likely” and 23 percent “somewhat likely” to purchase additional CFLs.
51
Figure 28Likelihood to Purchase Additional
Compact Fluorescent Bulbs
Q17c. How likely are you to purchase additional compact fluorescent light bulbs for your home?
Base: Respondents with compact fluorescent light bulbs, national n = 612, UI n = 77

2008 Energy Conservation, Efficiency, and Demand Response – United Illuminating Over-sample
The nine UI respondents who had not purchased CFLs were asked where they would go first if they were looking for energy-efficient lighting products (Table 12). Again, home improvement stores were mentioned by the most UI respondents (67 percent).
Table 12First Stop if Looking for Energy-Efficient
Lighting Products
Base: Respondents without compact fluorescent bulbs
U.S. UI
2004n = 214
2006n = 192
2008n = 110
2008n = 9
Home improvement store 51% 58% 42% 67%Discount department store 26 17 23 11Small hardware store 8 10 15 0Lighting store 3 3 2 0Over the Internet 2 2 3 0From a utility company 0 2 2 0Grocery store 2 1 2 11Bulk shopping warehouse club 1 1 5 0Drug store 1 1 0 0Mail order company 1 1 0 0Somewhere else 2 1 4 0Don’t know/Refused 3 4 4 11
52
Q18. Where would you go first if you were searching for energy efficient lighting products such as compact fluorescent light bulbs? Would you go to a …
2008 Energy Conservation, Efficiency, and Demand Response – United Illuminating Over-sample
Home Energy Audits
Fifteen percent of UI respondents have had a home energy audit, compared with 14 percent in the national sample (Figure 29). Eighty-seven percent of these were onsite audits (Figure 30), and 73 percent of the respondents who have had a home energy audit said that they have implemented audit recommendations (Figure 31).
53
Figure 29Had a Home Energy Audit?
2%2%2%
1%0%
84%87%88%
85%85%
15%11%11%
14%15%
0% 20% 40% 60% 80% 100%
Don't know/Refused
No
Yes
UI2008200620042002
Q15. Have you ever had any type of energy audit for your home?Base: All respondents, national n = 801, UI n = 100
2008 Energy Conservation, Efficiency, and Demand Response – United Illuminating Over-sample
54
Q15a. What kind of audit was it? Was it…Base: Respondents who have had an energy audit, national n =111, UI n = 15
Figure 30Type of Home Energy Audit
2008 Energy Conservation, Efficiency, and Demand Response – United Illuminating Over-sample
55
Figure 31Implemented Energy Audit Recommendations?
Q15b. Did you implement any of the recommendations from the audit?Base: Respondents who have had an energy audit, national n = 111, UI n = 15
2008 Energy Conservation, Efficiency, and Demand Response – United Illuminating Over-sample
As shown in Figure 32, the most-commonly implemented audit recommendation was the installation of CFLs (73 percent) followed by the resealing of foundation leaks (64 percent) and the installation of a low-flow shower head (55 percent). Forty-five percent of UI respondents said they had added insulation after their home was audited.
56
Figure 32Audit Recommendations Implemented
Q15c. Which of the following recommendations did you implement?Base: Respondents who had an energy audit and implemented recommendations,
national n = 91, UI n = 11

2008 Energy Conservation, Efficiency, and Demand Response – United Illuminating Over-sample
Energy Suppliers
Overall Satisfaction
Respondents used an eleven-point (“zero” to “10”) scale to rate overall satisfaction with their electric utility. Sixteen percent of UI respondents said they are extremely satisfied (“9” or “10” on the scale), a statistically-significant difference from 31 percent in the national survey (Figure 33). Twenty-five percent said they were somewhat satisfied (“7” or “8” on the scale), a statistically- significant difference from 40 percent in the national survey. Respondents in one- and two- person households are more satisfied than those in households with three or more occupants.
57
Figure 33Overall Satisfaction with Electric Utility
Q39. On a scale of zero to ten, where zero means “extremely dissatisfied” and 10 means “extremely satisfied”, how satisfied are you with your electric company?
Base: All respondents, national n = 801, UI n = 100
2008 Energy Conservation, Efficiency, and Demand Response – United Illuminating Over-sample
Performance in Specific Areas
Respondents also used an eleven-point scale to rate the performance of their electric utility in three specific areas: providing information about ways to save energy in their home, actively promoting energy efficiency programs, and providing new products and services (Table 13).
Fifty percent of UI respondents said their electric utility does an excellent (21 percent) or good (29 percent) job of providing information about ways to save energy in their home. This compares with 59 percent in the national survey, where 25 percent of respondents said “excellent” and 34 percent said “good”. Forty-two percent of respondents without internet access agree that their utility company does an excellent job of proving information about ways to save energy, compared with 13 percent of respondents having internet access.
Forty-five percent of UI sample respondents indicated that their utility does an excellent (18 percent) or good (27 percent) job of actively promoting energy-efficiency programs. This compares with 50 percent overall in the national survey.
And finally, 25 percent of UI respondents say that their utility does an excellent (11 percent) or good (14 percent) job of providing new products and services, compared with 35 percent nationally.
Respondents who are very satisfied with UI are more satisfied with UI’s performance in these three areas than respondents who are somewhat satisfied or dissatisfied overall.
58

2008 Energy Conservation, Efficiency, and Demand Response – United Illuminating Over-sample
Table 13Rating of Electric Utility On …
Base: All respondents
U.S. UI2004
n = 8012006
n = 8002008
n = 8012008
n = 100
Excellent Good Total Excellent Good Total Excellent Good Total Excellent Good Total
Providing information about ways to save energy in your home
27% 29% 56% 22% 32% 54% 25%* 34% 59%* 21% 29% 50%
Actively promoting energy efficiency programs
22 25 47 17 28 45 21 29 50* 18 27 45
Providing new products and services 14 22 36 13 18 31 13 22 35 11 14 25
* Statistically significant difference from prior year.
59
Q40. On a scale of zero to ten, where zero means “very poor” and 10 means “excellent”, how would you rate your electric utility company on …

2008 Energy Conservation, Efficiency, and Demand Response – United Illuminating Over-sample
As shown in Figure 34, 27 percent of UI respondents said that their local utility generates their electricity, significantly less than 41 percent nationally. Thirty-two percent of UI respondents are uncertain, below the level of 39 percent in the national survey.
60
Figure 34Does Your Local Utility Generate Your Energy?
* Statistically significant difference from 2008 national survey
Q41. Do you know if your local electric utility generates the energy that you use?Base: All respondents, national n = 801, UI n = 100
2008 Energy Conservation, Efficiency, and Demand Response – United Illuminating Over-sample
Smart Meters
Fourteen percent of UI respondents say that a smart meter has been installed in their home, compared with 11 percent nationally (Figure 35).
61
Figure 35Home Equipped with Electric Smart Meter?
Q24b. Is your home equipped with an electric Smart Meter? This is an advanced electric meter that records when energy is used and automatically sends this information to your utility each day rather than being read once a month by a meter reader and allows customers to take advantage of programs such as time-of-use rates.
Base: All respondents, national n = 801, UI n = 100
2008 Energy Conservation, Efficiency, and Demand Response – United Illuminating Over-sample
Twelve percent of UI respondents are “very interested” and 15 percent are “somewhat interested” in having a smart meter installed at their home (Figure 36). This compares with 19 and 17 percent, respectively, in the national survey. UI respondents with household incomes of $70,000 or more are more interested in having a smart meter installed than those with lesser incomes.
62
Figure 36Interest in Having a Smart Meter Installed at Home
4%
1%
40%
42%
21%
27%
17%
15%
19%
12%
0% 10% 20% 30% 40% 50%
Don'tknow/Refused
Not at allinterested (0 - 3)
Not veryinterested (4 - 6)
Somewhatinterested (7 - 8)
Very interested(9 - 10)
UI2008
Q24bb. How interested would you be in having a smart meter installed at your home? Please use a scale from zero to ten, where zero means “not at all interested” and ten means “very interested”
Base: Respondents without a Smart Meter, national n = 618, UI n = 74
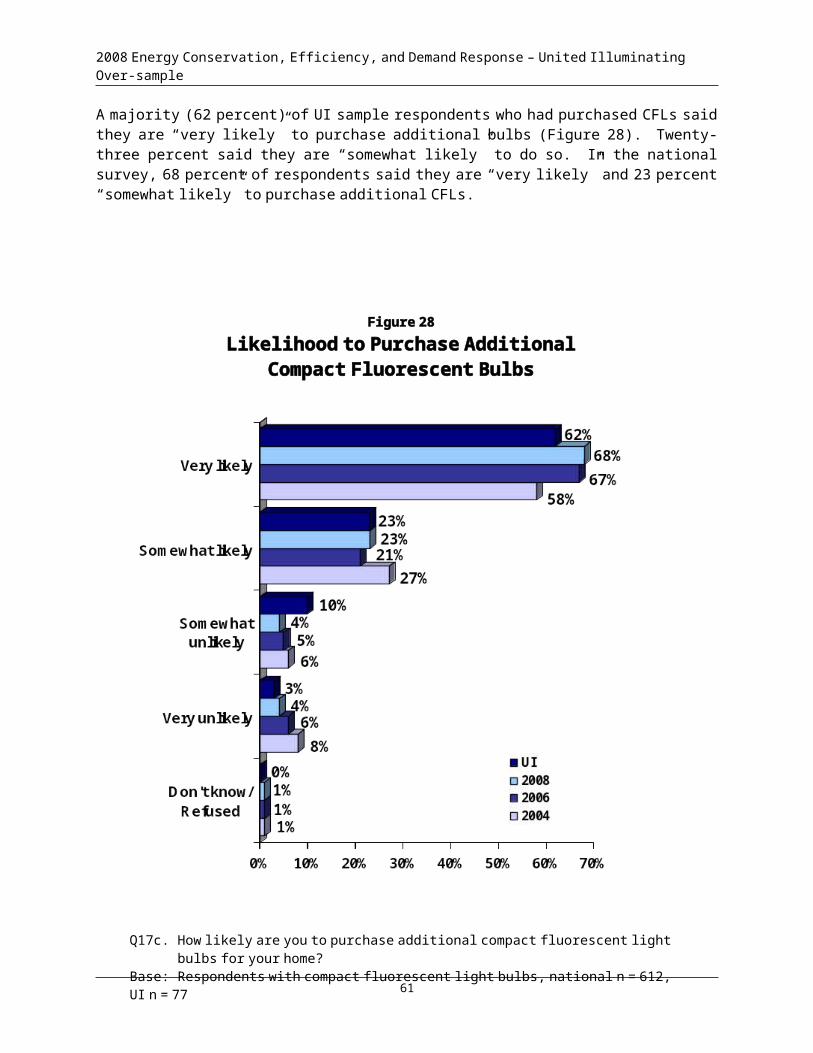
2008 Energy Conservation, Efficiency, and Demand Response – United Illuminating Over-sample
Saving Money versus Comfort
Fifty-four percent of UI respondent chose saving money on their energy bill over the comfort of their home, compared with 46 percent nationally (Figure 37). Sixty-three percent of respondents who always try to save energy in their home choose saving money over comfort, compared with 33 percent who sometimes try to save energy. Also, 63 percent of respondents who are completely or mostly convinced of global warming prefer saving money over comfort, compared with 54 percent who are somewhat convinced. Respondents under age 55 are more interested in saving money on their energy bill than in the comfort of their home, while the reverse is true for respondents age 55 and over.
63
Figure 37Preference for Saving Money on the Energy Bill or
Comfort Level of the Home
Q7a. If you had a choice between saving money on your energy bill and the comfort level of your home, which would you choose?
Base: All respondents, national n = 801, UI n = 100
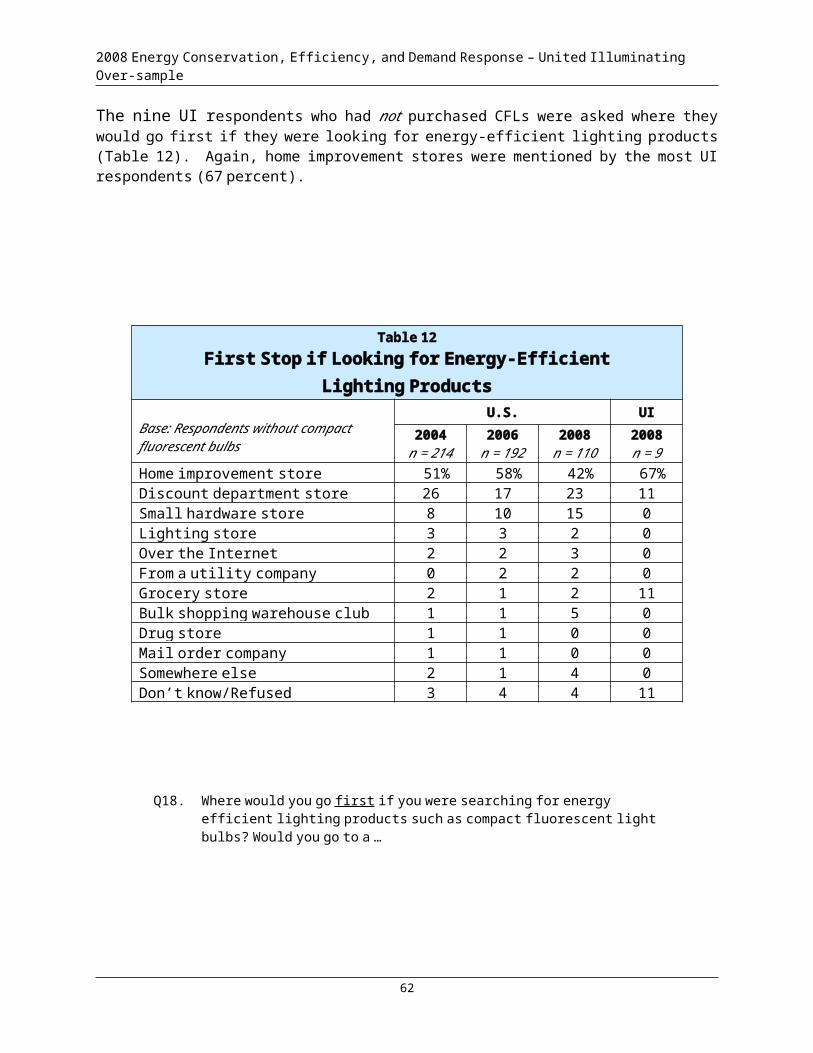
2008 Energy Conservation, Efficiency, and Demand Response – United Illuminating Over-sample
Climate Change
As shown in Figure 38, 40 percent of UI respondents are convinced that climate change is occurring, 17 percent are mostly convinced, and 28 percent are somewhat convinced. Only 15 percent are unconvinced that climate change is occurring, compared with 20 percent in the national survey. One hundred percent of UI respondents who prefer saving money on their energy bill are convinced that climate change is happening, compared with 74 percent who choose comfort over saving money.
64
Figure 38Convinced Climate Change is Happening?
Q42. How convinced are you that global warming or climate change is happening?Base: Asked of one-half of sample, national n = 410, UI n = 47

2008 Energy Conservation, Efficiency, and Demand Response – United Illuminating Over-sample
When UI respondents were asked how they would advise a friend to reduce his or her impact on climate change, 28 percent would suggest use of alternative energy sources and 20 percent would suggest a change in their mode of transportation (Table 14).
Table 14The One Thing to Advise a Friend to do
to Reduce Global Warming2008
U.S. UI
Use alternative energy source 21% 28%
Change means of transportation 20 20
Make improvements or repairs 15 15Reduce/create less pollution/other environmental mentions 10 8
Conservation, awareness, other mentions 16 15
Don't know / no answer 25 18
65
Q43. There is a lot of talk about things people can do to reduce their contribution to global warming. If a friend of yours wanted to do the most effective thing, and had the money to do anything, what ONE thing would you advise your friend to do?
Base: Respondents who believe global warming is happening, national n = 322, UI n = 40
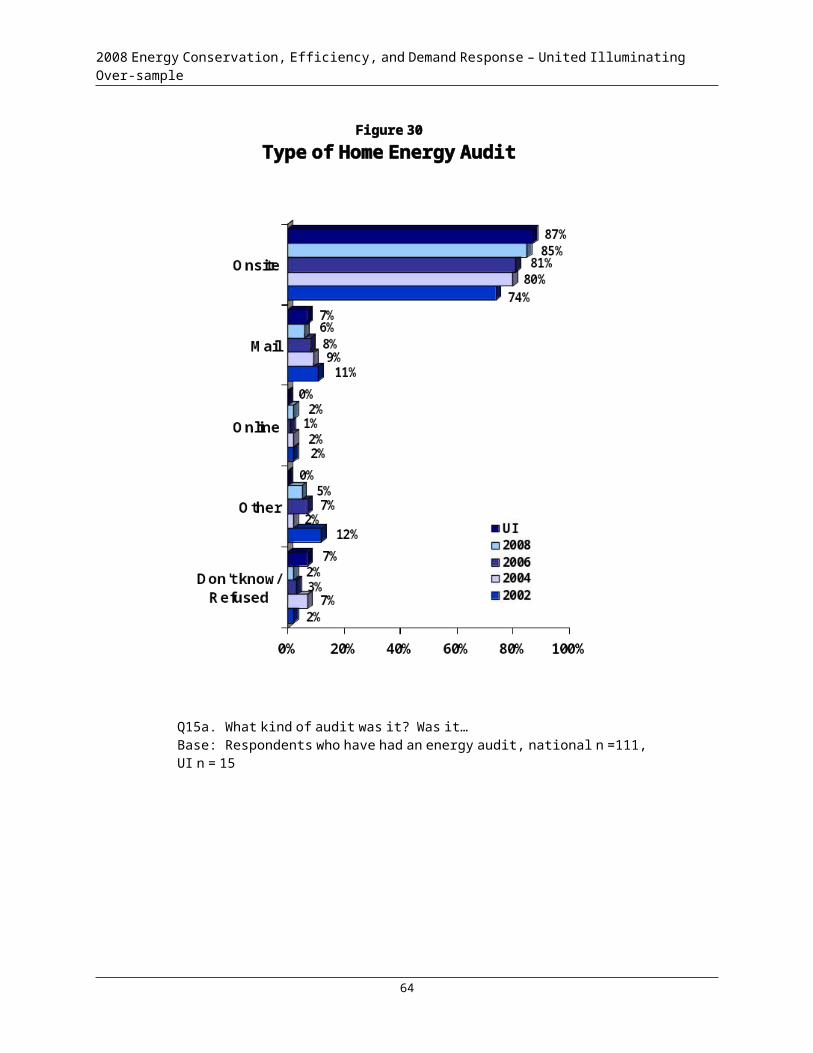
2008 Energy Conservation, Efficiency, and Demand Response – United Illuminating Over-sample
Forty-five percent of UI respondents said that the issue of global warming is extremely important to them personally and 26 percent that it is somewhat important (Figure 39).
66
Figure 39Personal Importance of Global Warming
1%
0%
16%
13%
19%
17%
28%
26%
36%
45%
0% 10% 20% 30% 40% 50%
Don'tknow/Refused
Not at allimportant (0 - 3)
Not veryimportant (4 - 6)
Somewhatimportant (7 - 8)
Extremelyimportant (9 - 10)
UI2008
Q44. How important is the issue of global warming to you personally? Please use a scale of 0 to 10, where 0 is “not at all important” and 10 is “extremely important”
Base: Asked of one-half of sample, national n = 410, UI n = 47
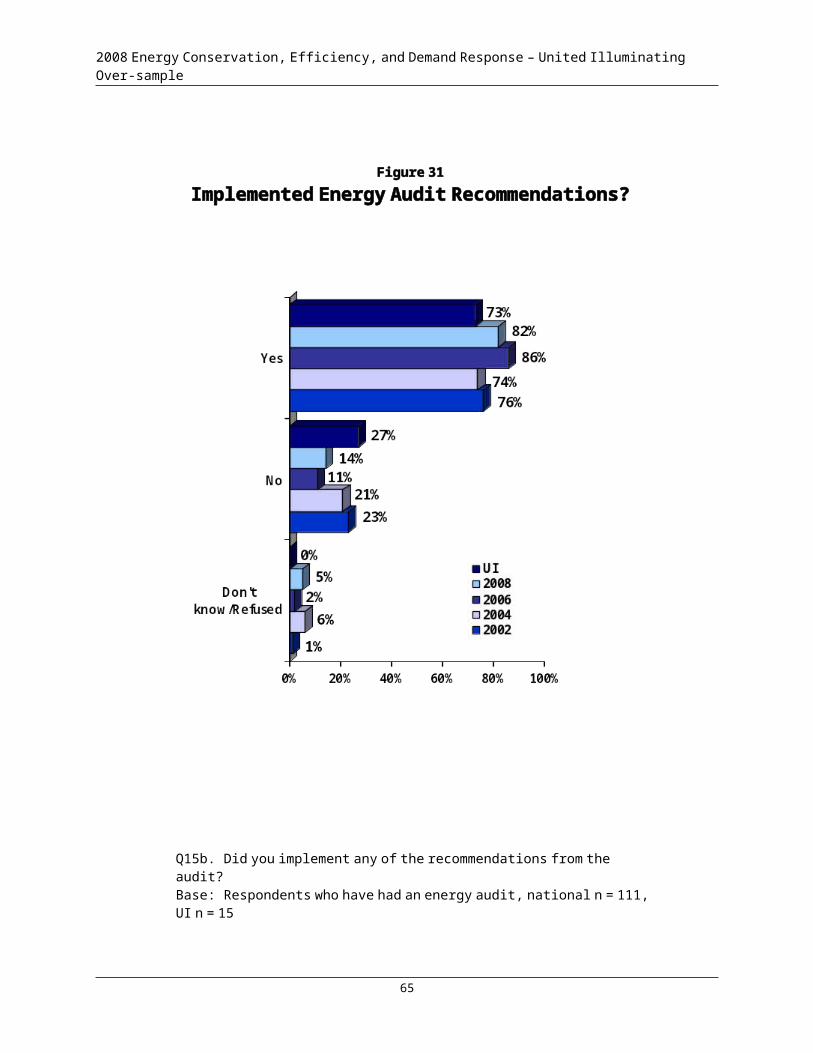
2008 Energy Conservation, Efficiency, and Demand Response – United Illuminating Over-sample
U.S. Energy Situation
As shown in Figure 40, 79 percent of UI respondents believe that the energy situation in the United States is very serious, a statistically-significant difference from 63 percent nationally. Eighty-five percent of respondents without children under 13 in their home believe that the energy situation is very serious, compared with 58 percent having children under 13.
67
Figure 40Seriousness of Energy Situation in United States
* Statistically significant difference from 2008 national survey
Q45. How serious is the energy situation is in the United States? Base: Asked of one-half of sample, national n = 391, UI n = 53

2008 Energy Conservation, Efficiency, and Demand Response – United Illuminating Over-sample
As shown in Figure 41, 53 percent of UI respondents say that the energy situation is extremely important to them personally (compared with 49 percent nationally) and 30 percent that it is somewhat important (the same percentage as nationally). Sixty-five percent of respondents who always try to save energy say that the energy situation is personally important to them, compared with 17 percent who sometimes try to save energy.
68
Figure 41Personal Importance of the Energy Situation
Q46. How important is the energy situation to you personally? Please use a scale of 0 to 10, where 0 is “not at all important” and 10 is “extremely important”
Base: Asked of one-half of sample, national n = 391, UI n = 53

2008 Energy Conservation, Efficiency, and Demand Response – United Illuminating Over-sample
Amount of Electricity Used in Home
As shown in Figure 42, 15 percent of UI respondents say they are using a lot more electricity in their home than five years ago. Twelve percent say they are using a little more, a statistically significant difference from 26 percent nationally. Overall, 51 percent of UI respondents say they are using a lot or a little less than five years ago, compared with 49 percent of respondents nationally.
69
Figure 42Amount of Electricity Used in Home
Compared with Five Years Ago
Q D5b. Compared to 5 years ago, do you think your home uses [amount of electricity]:Base: Respondents who have lived in their home more than 5 years,
national n = 573, UI n = 74
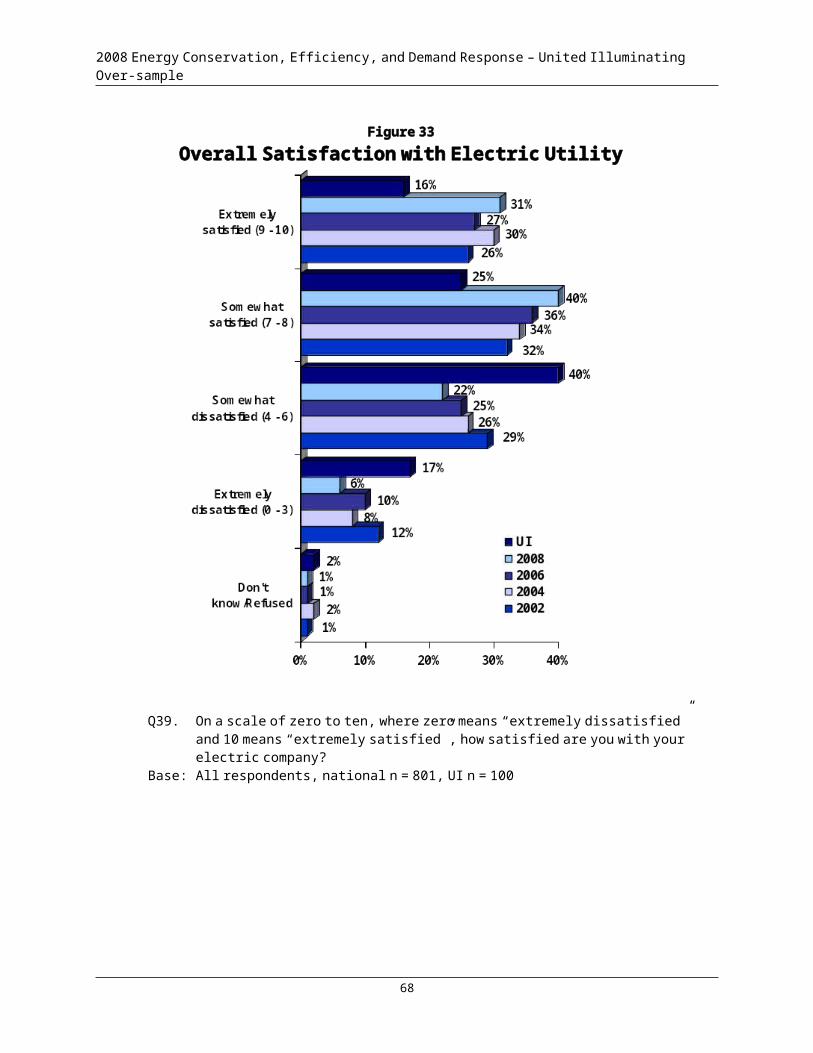
2008 Energy Conservation, Efficiency, and Demand Response – United Illuminating Over-sample
Demographic and Residence CharacteristicsIn Table 15, demographics and residence characteristics are shown for the UI over-sample and the national sample. Statistically-significant differences in demographic and residence characteristics between the UI and national samples are indicated with asterisks: these differences relate to the higher percentage of respondents using fuel oil for home heating and having higher monthly energy bills, compared with respondents nationally.
Table 15Demographic Characteristics
Base: All respondents
U.S. UI
2002n = 900
2004n = 801
2006n = 800
2008n = 801
2008n = 100
Home OwnershipOwn 75% 79% 84% 83% 78%Rent 23 19 15 16 18Don’t know/Refused 1 1 1 1 4Housing Structure TypeSingle family 73 79 82 81 64**Duplex 6 6 3 4 4Building with 3 or more units 14 10 9 10 22**Mobile/manufactured home 4 3 4 4 1Other 2 1 2 1 6Don’t know/Refused 0 1 1 1 3Length of Time in Current HomeLess than 5 years 28 23Five years or more 72 74Don’t know/ Refused 1 3Main Energy Source for Home HeatingNatural gas 46 45 46 44 48Electricity 34 34 32 34 10**Fuel oil 8 8 8 7 37**LP gas 5 5 6 7 1**Other 6 6 6 7 1Don’t know/Refused 3 3 2 1 3Average Monthly Energy BillLess than $50 7 5 5 3$50 up to $100 27 23 21 13$100 up to $150 26 26 26 12$150 up to $200 16 18 18 26**$200 up to $250 6 9 8 9$250 or more 9 14 14 32**Don’t know/Refused 9 6 6 5
70
2008 Energy Conservation, Efficiency, and Demand Response – United Illuminating Over-sample
U.S. UI
2002n = 900
2004n = 801
2006n = 800
2008n = 801
2008n = 100
Internet AccessYes 70 77 78 72No 30 23 21 26Number of OccupantsOne 18 23 19 19 21Two 33 35 40 42 40Three 19 17 18 15 15Four 19 14 14 14 10Five or more 11 10 8 9 10Don’t know/Refused 1 2 1 1 4Number of Occupants under 18None 50 42 58 65 75One 20 14 25 18 9Two 19 12 13 13 11Three or more 11 8 4 3 5Don’t know/Refused 1 0 1 1 0Respondent AgeUnder 35 21 17 12 8 935 – 44 23 18 19 14 1345 – 54 19 22 22 21 1955 – 64 16 17 20 24 2065 or over 17 21 24 28 31Refused 3 6 3 4 8Education LevelHigh school or less 25 25 23 26 27Some college or post high school training
33 26 31 27 26College graduate 24 26 27 28 20Postgraduate work or degree 18 17 17 17 23Refused 1 6 2 2 4RaceWhite 83 84 84 83 78African-American 6 5 7 7 8Asian 1 2 1 2 0American Indian 1 1 1 0 0Other 6 4 5 5 8Refused 3 4 3 4 6Hispanic or Latino DescentYes 6 5 5 4 5No 92 91 92 92 90
71
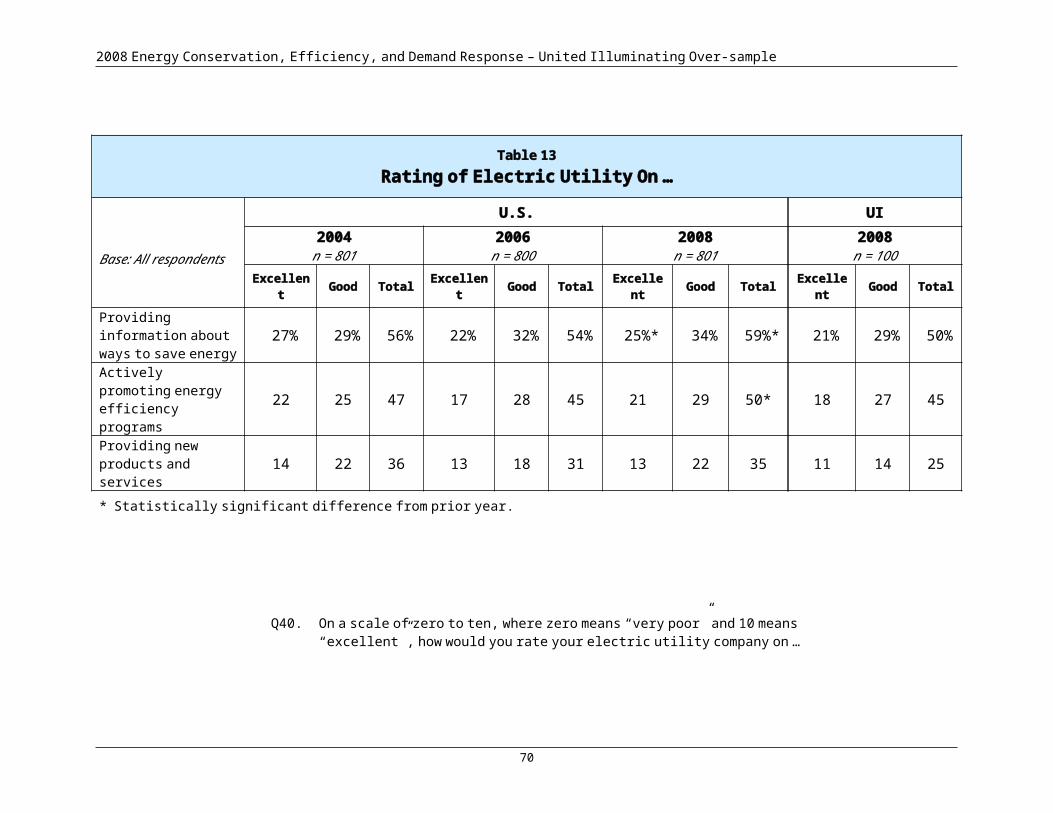
2008 Energy Conservation, Efficiency, and Demand Response – United Illuminating Over-sample
U.S. UI
2002n = 900
2004n = 801
2006n = 800
2008n = 801
2008n = 100
IncomeUp to $20,000 15 13 12 12 10$20,000 up to $30,000 13 10 11 11 9$30,000 up to $40,000 13 12 11 10 10$40,000 up to $50,000 11 8 10 9 9$50,000 up to $60,000 10 8 10 9 8$60,000 up to $70,000 7 6 6 6 8$70,000 up to $80,000 4 5 6 6 3$80,000 or more 14 17 22 22 27Don’t know/Refused 14 20 10 13 16
72

2008 Energy Conservation, Efficiency, and Demand Response – United Illuminating Over-sample
Appendix:
Questionnaire
73
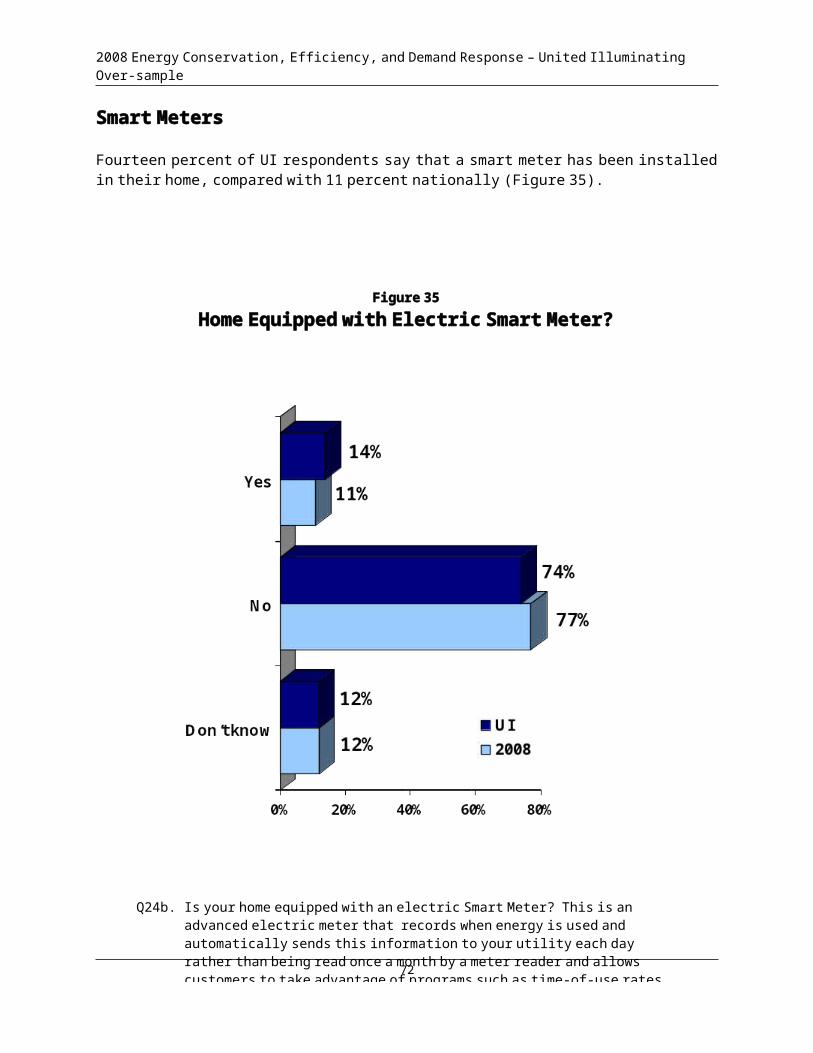
2008 Energy Conservation, Efficiency, and Demand Response – United Illuminating Over-sample
Abt SRBI RESEARCH INTO ACTION, INC.725 SEVENTH AVENUE, SUITE 2700 P. O. BOX 12312NEW YORK, NEW YORK 10001 PORTLAND, OREGON 97212
Questionnaire
2008 Energy Conservation, Efficiency, and Demand Response Study 4590u – 12/15/08
Sample Point Number: ______________
Interviewer:_________________________________________ Date: ______________________
Telephone Number: _______________________________________________________________
State ___________
NOTE: “DON’T KNOW” AND “REFUSED” WILL BE ADDED AS CATEGORIES TO ALL QUESTIONS WHEN THE QUESTIONNAIRE IS PROGRAMMED FOR COMPUTER-ASSISTED TELEPHONE INTERVIEWING (CATI).
Hello, I'm __________________ from SRBI, a national research organization. We are conducting a nationwide study to help several energy companies and government agencies understand customer attitudes about energy. This is not a sales call. May I speak with the person, or one of the persons, responsible for making energy-related decisions in your household? (REPEAT INTRODUCTION IF NECESSARY)
SC1. First, could you please tell me the name of the company that provides electricity to your home?
1. United Illuminating (UI) CONTINUE 2. Other SCREEN OUT
Attitudes about Energy Conservation and Efficiency
1. Which of the following best describes your approach to using energy in your home:
1. I do very little to save energy, 2. I sometimes try to save energy, or 3. I always try to save energy in my home.
2. (IF QUESTION 1 = 2 or 3) How successful do you think you have been in reducing energy use in your home? Have you been
1. Very successful2. Somewhat successful3. Not very successful
74

2008 Energy Conservation, Efficiency, and Demand Response – United Illuminating Over-sample
2a. Compared to other consumers, do you think you know more, less, or the same about saving energy in your home?
1. More2. Less3. About the same
3. Please indicate whether you strongly agree, agree, neither agree nor disagree, disagree, or strongly disagree with each of the following statements: (ROTATE. ASK EACH RESPONDENT ABOUT 10 RANDOMLY-SELECTED STATEMENTS )
Strongly Neither agree Strongly Agree Agree nor disagree Disagree Disagree
a. It’s important to save energy in my home. 1 2 3 4 5
b. Saving energy helps the environment. 1 2 3 4 5
c. I’m concerned about air pollution. 1 2 3 4 5
d. All of the appliances on the market today are 1 2 3 4 5 energy-efficient.
e. There is an energy crisis in our country. 1 2 3 4 5
f. I sometimes worry whether there is enough 1 2 3 4 5 money to pay my energy bill.
g. I’m too busy to be concerned about saving 1 2 3 4 5 energy in my home.
h. I am interested in knowing how energy use in 1 2 3 4 5 my home compares with other similar homes in the area.
i. I look for products that are good for the 1 2 3 4 5 environment.
j. I’m very concerned about the environment. 1 2 3 4 5
k. Saving energy in my home helps me save money 1 2 3 4 5 l. I worry that the cost of energy for my home will 1 2 3 4 5 increase.
m. I’ve already done everything I can to save 1 2 3 4 5 energy in my home.
n. We are using up our energy supplies too fast. 1 2 3 4 5
o. Global warming is a result of high energy use. 1 2 3 4 5
75
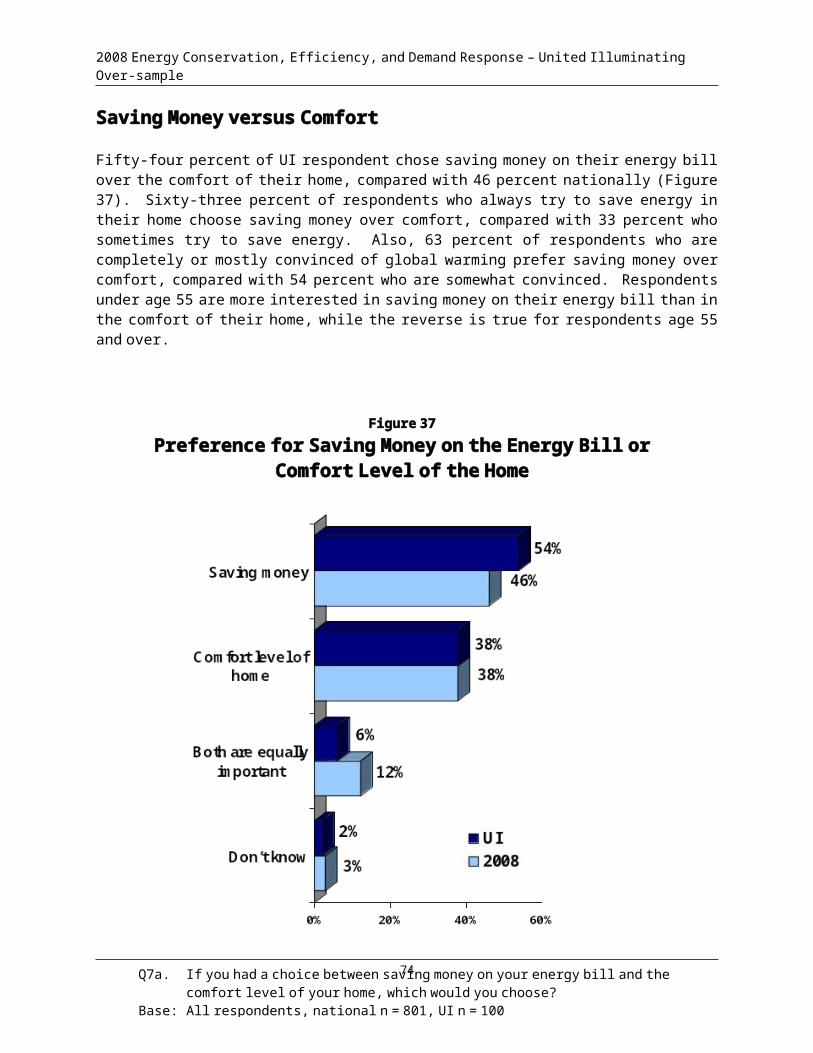
2008 Energy Conservation, Efficiency, and Demand Response – United Illuminating Over-sample
p. Deleted 1 2 3 4 5
q. I am always looking for new ways to save 1 2 3 4 5 energy in my home.
r. Using less energy at home will help increase 1 2 3 4 5 the energy security of our country.
s. Energy-efficient/green products and services are 1 2 3 4 5 readily available. t. The cost of energy makes me want to conserve. 1 2 3 4 5
u. TVs, electronics, and small appliances in the 1 2 3 4 5 in the home use a significant amount of energy.
v. People should try to use less energy to reduce the 1 2 3 4 5 need to build new power plants.
3aa. (IF Q1 = 2 OR 3 ) What are some of the obstacles that you currently face in trying to save energy in your home? (DO NOT READ. MULTIPLE RECORD).
1. Cooperation of others in the home2. Construction of home (cathedral ceilings, multiple floors, skylights, etc.)3. Cost/ first cost of energy-efficient equipment/repairs4. Payback period of equipment/repairs5. Desire to maintain comfort level in the home6. Age of home7. Lack of time8. Don’t know what to do9. Don’t know where to get information10. Other (specify) ___________________
Current Energy Conservation and Efficiency Behavior
4. Please tell me if you have done any of the following to save energy in your home: (READ LIST AND ASK YES OR NO FOR EACH)
Low-cost/no-cost measures:a. Used full loads for dishes and laundry
b. Turn off or unplug computer when not in use c. Use energy saving/sleep features of computer d. Visited a utility or government website for tips about saving energy dd. Turn off lights ddd. Unplug appliances and equipment when not in use
76
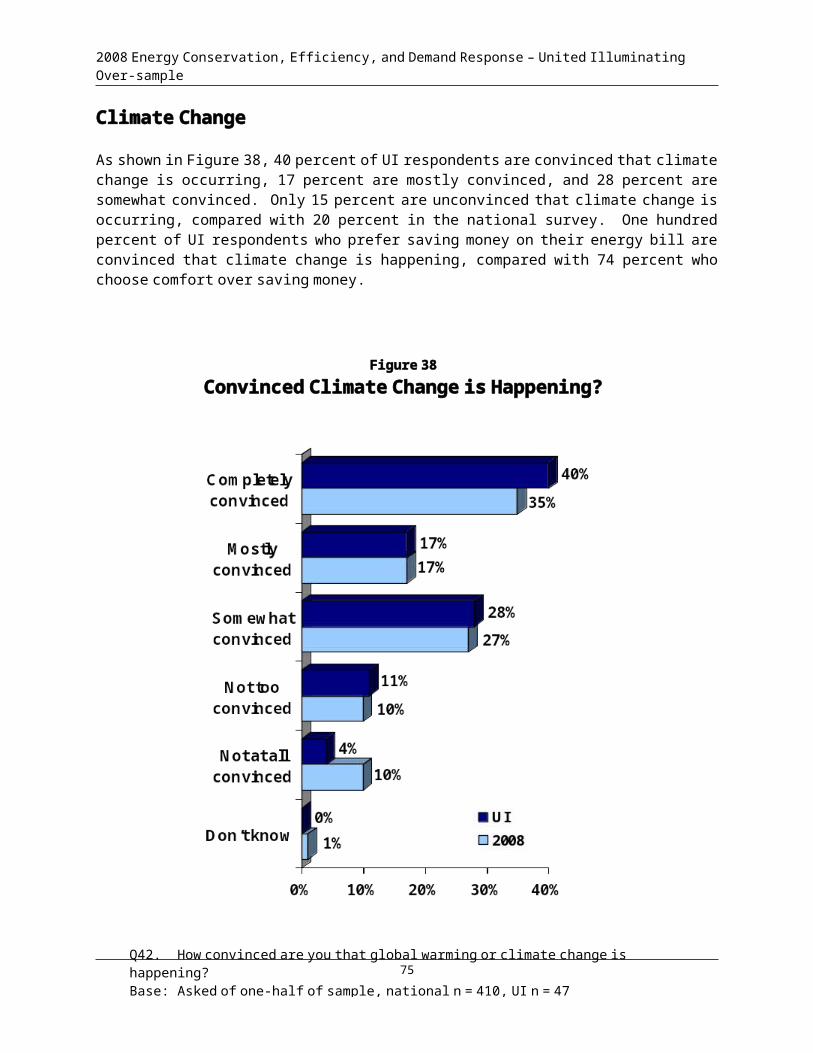
2008 Energy Conservation, Efficiency, and Demand Response – United Illuminating Over-sample
Heating and cooling system:e. Change the filter for your heating/cooling system more than once a yearf. Install new heating and/or cooling system g. Seal heating and cooling ductsgg. Close heating and cooling ducts in rooms that aren’t used oftenh. Deletedi. Deletedj. Perform annual maintenance on/have a tune-up of your heating and/or air-conditioning systemjj. Used a programmable thermostat to automatically set different temperatures at various times of the day or nightjjj. Manually adjusted the thermostat to set different temperatures at various times of the day or night
Water heating:k. Added insulation around your water heater l. Turned down the temperature on your water heater
Insulation/doors/windowsm. Added insulation to your attic or under your floorn. Added insulated doors o. Added storm or energy efficient windowsp. Added weather-stripping or caulking around windows or doors
Appliances:
q. Purchased energy-efficient appliances qq. Purchased energy-efficient electronics
Lighting
r. Replaced incandescent or halogen FIXTURES with fluorescent ones rr. Replaced incandescent or halogen LIGHT BULBS with fluorescent ones
Other:
s. Participate in utility or government- sponsored energy efficiency programs t. Anything else that you have done to save energy in your home? (specify) ________
5. DELETED
6. DELETED
7. (If TAKEN ANY STEPS TO SAVE ENERGY IN QUESTION 4) Did you see any savings on your energy bill after you took action to save energy?
1 Yes2 No
77
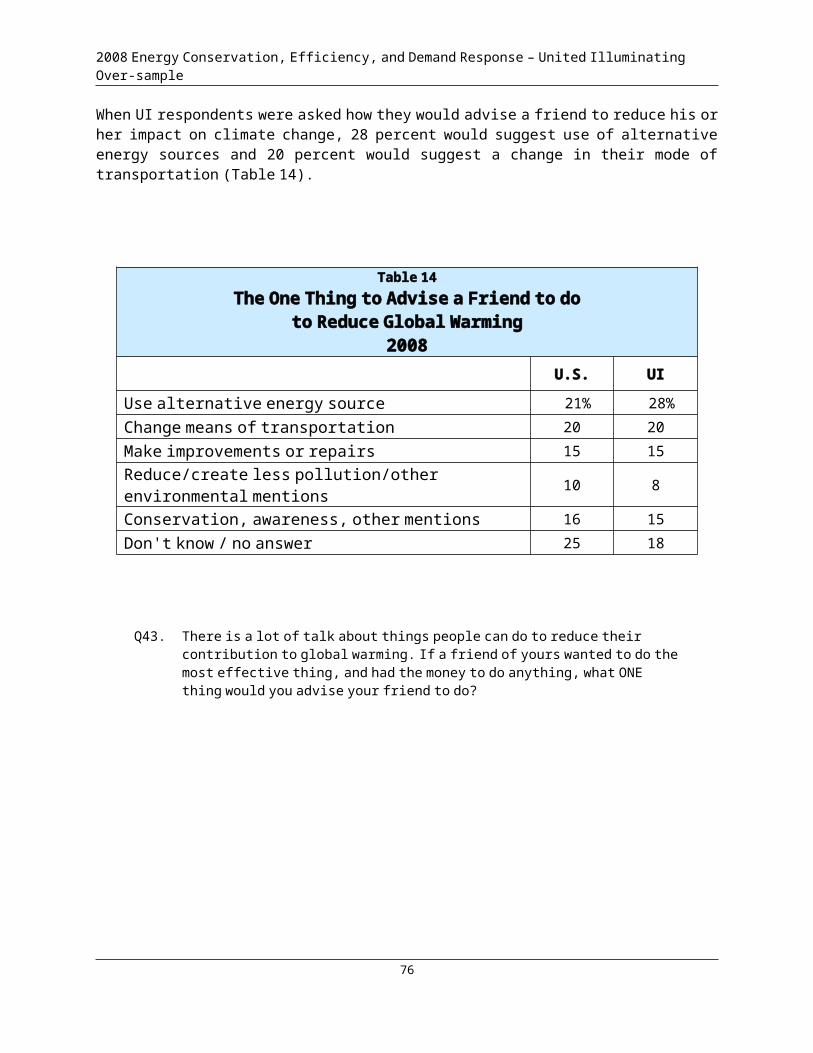
2008 Energy Conservation, Efficiency, and Demand Response – United Illuminating Over-sample
7a. If you had a choice between saving money on your energy bill and the comfort level of your home, which would you choose?
1. Saving money, 2. Comfort level of your 3. (VOL) Both are equally important
8. Deleted
8a. Deleted
9. Deleted
10. Deleted
11. Deleted 11a. Deleted 12. Deleted
13. Deleted
14. Deleted
15. Have you ever had any type of energy audit for your home?
1. Yes2. No
15a. (IF QUESTION 15 = 1) What kind of audit was it? Was it…
1. An on-site audit where someone came to your home2. An audit that you completed and mailed in3. An online audit that you completed on the computer, or4. Some other type of audit (specify___________)
15b. (IF QUESTION 15 = 1) Did you implement any of the recommendations from the audit?
1. Yes2. No
15c. (IF QUESTION 15b = 1) Which of the following recommendations did you implement? (ROTATE)
a. Change your heating and cooling system? b. Add insulation to your home? c. Seal leaks in the foundation of your home? d. Install compact fluorescent light bulbs (CFLs)? e. Improve your duct system?
78

2008 Energy Conservation, Efficiency, and Demand Response – United Illuminating Over-sample
f. Install a low-flow shower head? g. Anything else (Specify)? h. (VOL) Nothing
16. Deleted
16a. Deleted
16b. Deleted
16c. Deleted
17. How familiar are you with compact fluorescent light bulbs (CLFs)? These are not the regular, tube- shaped fluorescent bulbs, but instead may have a round, spiral, or twisty shape and fit into ordinary light fixtures. Are you
1 Very familiar2 Somewhat familiar, or3 Unfamiliar with compact fluorescent light bulbs
17a. (IF QUESTION 17 = 1 OR 2) Do you have any compact fluorescent bulbs in your home?
1 Yes -> 17a1. How many do you have? ______________ (Number)2 No
17b . (IF QUESTION 17a = 1) Where did you obtain the compact fluorescent light bulbs you installed? (DO NOT READ. RECORD ALL MENTIONS)
1. Grocery store2. Discount department store (for example, WalMart)3. Home improvement store (for example, Lowes, Home Depot)4. Small hardware store5. Bulk shopping warehouse/club (for example, Sam’s, Costco) 6. Drug store (Walgreen’s, CVS, Rite Aid)7. Lighting store8. Over the Internet9. Mail order10. From a utility company11. Other (specify) ______________12. Don’t know13. Refused14. Gift, someone gave them to me15. Bargain or dollar store
79
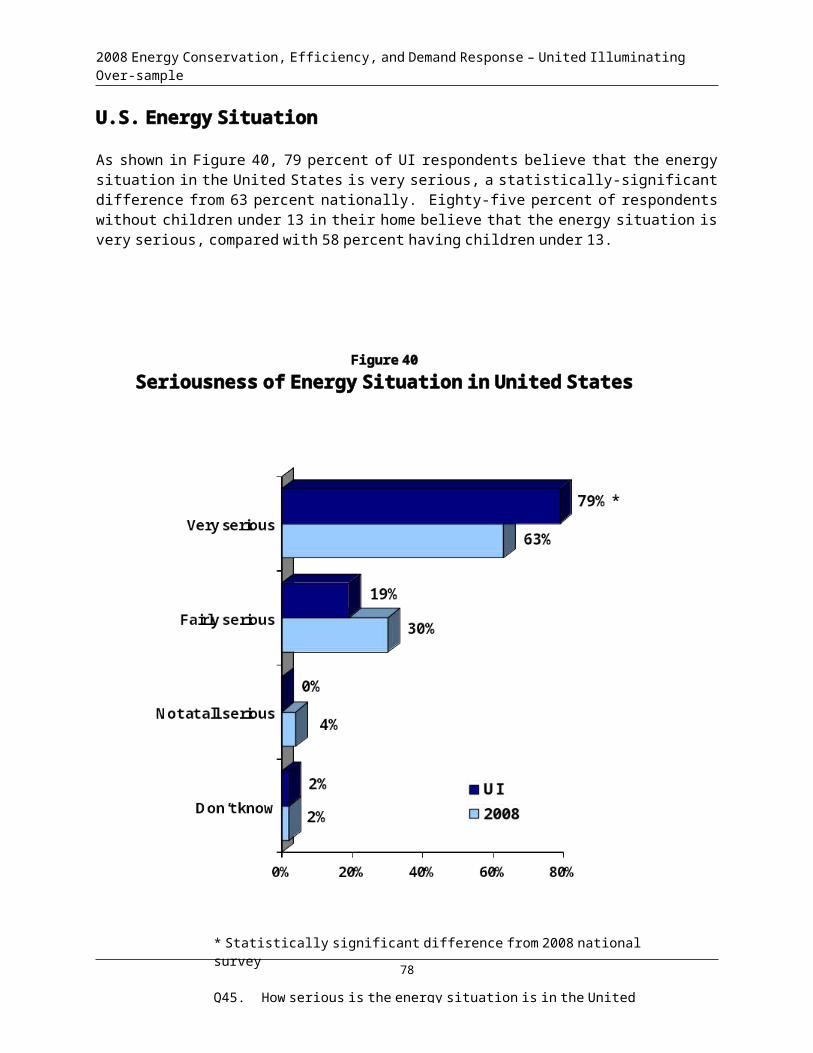
2008 Energy Conservation, Efficiency, and Demand Response – United Illuminating Over-sample
17bb. (IF QUESTION 17a = 1) Have you received any free or rebated compact fluorescent light bulbs as a part of a program from any of the following? (MULTIPLE RESPONSES PERMITTED)
1. Manufacturer?2. Retailer?3. Utility?, or4. Government agency?
17c. (IF QUESTION 17a = 1) How likely are you to purchase additional compact fluorescent light bulbs for your home?
1. Very likely2. Somewhat likely3. Somewhat unlikely4. Very unlikely
17d. (IF QUESTION 17c = 3 or 4) Why are you unlikely to purchase additional compact fluorescent light bulbs? (RECORD ALL MENTIONS. DO NOT READ)
1. Too expensive2. Did not see any savings from using them3. Do not fit in lighting fixtures I have4. Cannot find them in stores5. Not bright enough6. Burned out too quickly7. Concerned abut mercury8. Concerned about disposal9. Other (specify) 10. Don’t know11. Refused12. Takes too long to come up to full brightness13. Don’t need more/have enough14. Dislike the quality of the lighting
18. (IF QUESTION 17a = 2) Where would you go first if you were searching for energy efficient lighting products such as compact fluorescent light bulbs? (DO NOT READ. SINGLE RECORD)
1. Grocery store2. Discount department store (for example, Wal-Mart)3. Home improvement store (for example, Lowes, Home Depot)4. Small hardware store5. Bulk shopping warehouse/club (for example, Sam’s, Costco) 6. Drug store (Walgreen’s, CVS, Rite Aid)7. Lighting store8. Over the Internet9. Mail order10. From a utility company11. Other (specify) ______________
80
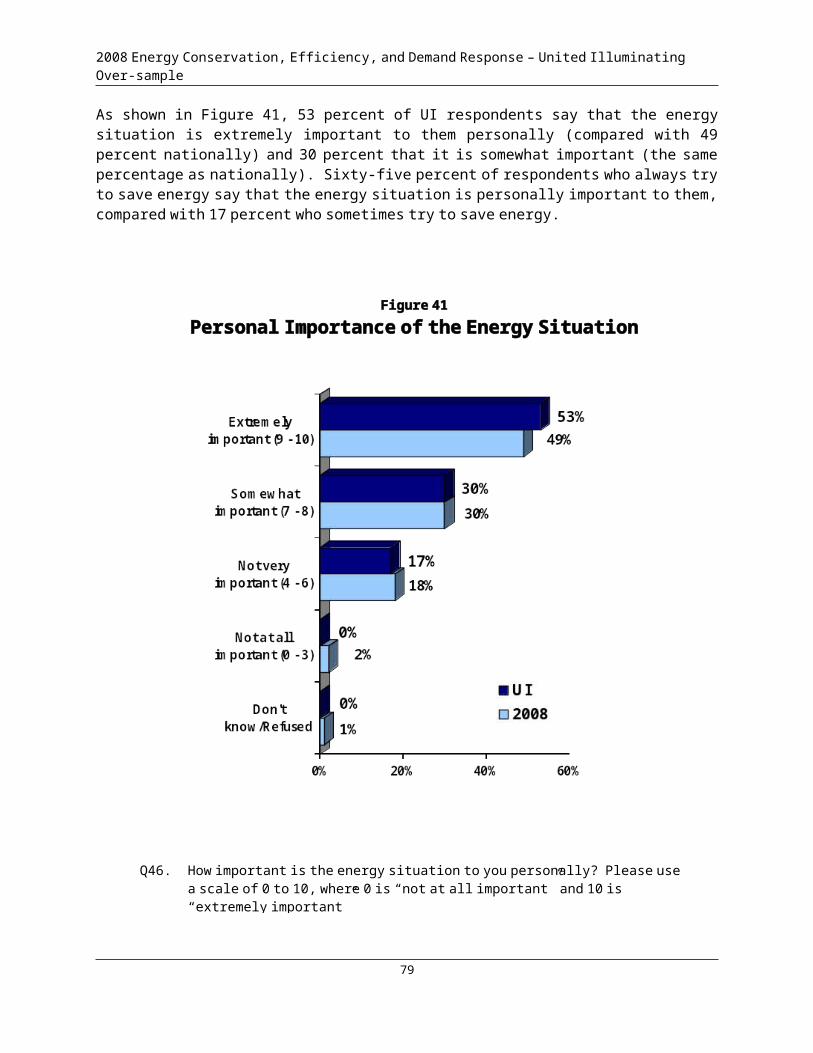
2008 Energy Conservation, Efficiency, and Demand Response – United Illuminating Over-sample
19. (SPLIT HALF. FORM 2) How do you typically learn about energy efficient products and services? (RECORD ALL MENTIONS. DO NOT READ)
1. Television2. Magazines3. Newspapers 4. At a store that sells energy efficient products5. State government6. Federal government 7. Utility company website8. Utility company employees9. Utility company advertising10. Friends or relatives11. Website - utility12. Website - government13. Website – other (non-utility or government) 14. Other (specify) _____________15. Don’t learn about energy efficiency products
Motivations for Energy Conservation and Efficiency
20. Delete. These items were used in the past to create a self-efficacy index for analytical purposes, but seem less important this year because of the number of additions we are making to the survey.
21. In the past year, would you say that you’ve done more to save energy in your home than previously, less than previously, or that you haven’t done anything differently?
1 More2 Less3 No change
21a. (IF QUESTION 21 = 1 OR 2) Why have you done (more or less) to save energy in your home than previously? (RECORD RESPONSE).
Energy-Efficient Products and Services
22. Deleted. .
23. NO RANDOM ROTATION. ASK ALL THE FOLLOWING 8 ITEMS: a, c, h, j, k, q, r, and v How interested would you be in purchasing or using the following products and services? On a scale from zero to ten, where zero means “not at all interested” and ten means “very interested”, how interested would you be in the following. If you already have used this product, just let me know. How interested would you be in the following: 0 1 2 3 4 5 6 7 8 9 10 (Code 13: already use)
81

2008 Energy Conservation, Efficiency, and Demand Response – United Illuminating Over-sample
a. Low-interest loans from your utility company for energy-efficient appliances, such as refrigerators, air-conditioners and water heaters.
b. Rebates on the purchase price of new or additional insulation for your home.
bb, Rebates on the purchase price of new energy-efficient appliances such as furnaces, water heaters, or air-conditioners
c. A monthly credit on your bill for allowing your electric company to automatically turn off your air-conditioner for PREARRANGED periods of approximately 15 minutes, when the use of electricity is highest
d. A monthly credit on your bill for allowing your electric company to automatically turn off your electric water heater for PREARRANGED periods of approximately 15 minutes, when the use of electricity is highest
e. Renewable or green energy generated from sources such as sun, wind, and landfill gas f. A listing of local quality contractors who are certified by a national organization to provide quality home energy improvement services
g. New home design assistance from your utility, which would help you design efficiency into a new home from the start and save money on your monthly energy bills.
h. Financing for energy-efficient heating and cooling systems purchased from participating contractors.
i. Deleted
j. Consumer guide from you utility that helps you select energy- efficient products and services
k. A residential home generator program that would provide power to your home during storms and would be used by the utility when the use of electricity is highest
l. c- Information or educational materials from your utility about ways to save energy in your home.
m. c- A free programmable thermostat and advice on how to set it to save money on your monthly electric bill
n. Deleted
o. Deleted
p. Deleted
q.. A residential Heat Pump Water Heater program that could reduce your cost of heating water by up to 50 percent compared to a standard electric water heater.
82
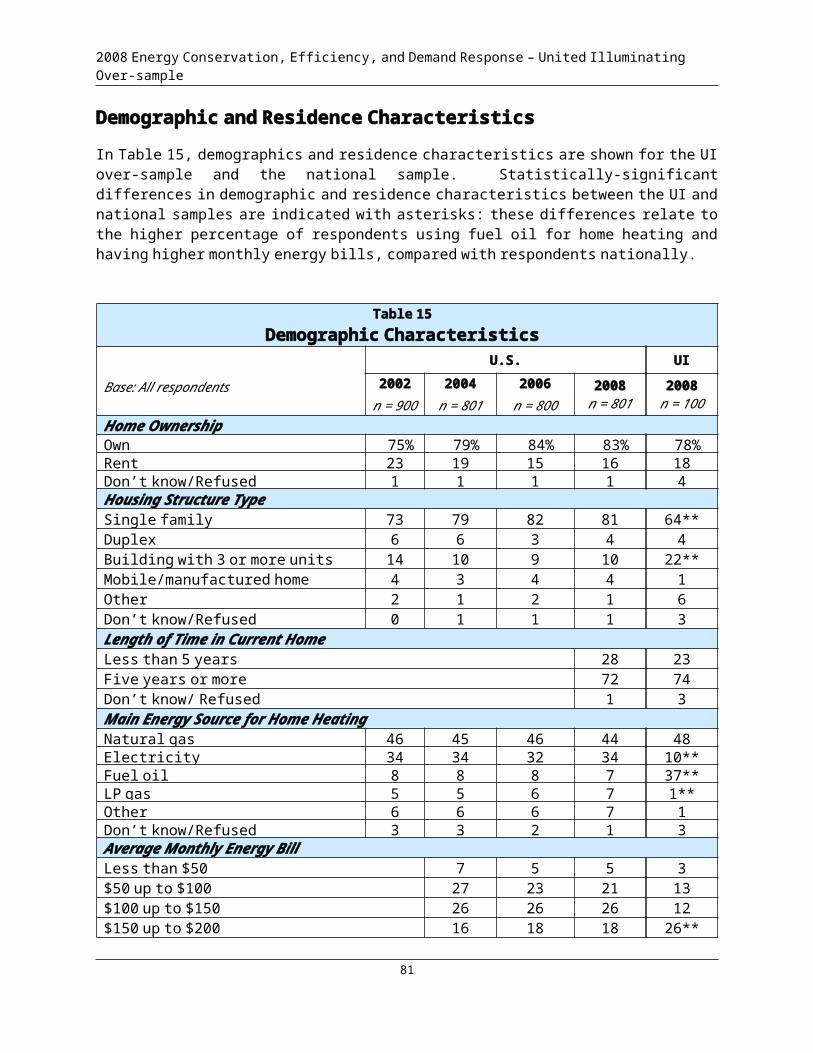
2008 Energy Conservation, Efficiency, and Demand Response – United Illuminating Over-sample
r. An online tool that allows you to compare your home energy use to that of your neighbors who live in similar homes s. Light fixtures that are designed specifically for and work only with energy-efficient light bulbs.
t. A program that would pay your cash to let your electric company remove any old, inefficient extra refrigerators or freezers from your property.
u. Coupons to help pay for the purchase of compact fluorescent light bulbs
v. An in-home audit from your utility company that would provide suggestions about reducing your home’s energy use
24. How interested would you be in time-of-use rates, where there would be lower rates at certain times of the day when the use of electricity is lowest, and higher rates at other times of the day when the use of electricity is greatest? Would you be
1. Very interested2. Somewhat interested3. Somewhat disinterested, or4. Very disinterested in time-of-use rates, or do you5. Already have time-of-use rates
24a. To what extent could you (“do you” if Q24 = 5) change the time you use your appliances and other equipment to take advantage of time-of-use rates, which would mean lower rates when the use of electricity is lowest and higher rates at other times of the day when the use of electricity is greatest?
1 A lot2 Some3 A little, or4 Not at all
24b. (ASK ALL) Is your home equipped with an electric Smart Meter? This is an advanced electric meter that records when energy is used and automatically sends this information to your utility each day rather than being read once a month by a meter reader and allows customers to take advantage of programs such as time-of-use rates..
1. Yes2. No
24bb. (IF Q24b = 2) How interested would you be in having a smart meter installed at your home? Please Use a scale from zero to ten, where zero means “not at all interested” and ten means “very interested”,
.................................0 1 2 3 4 5 6 7 8 9 10.................................................................
Energy Star®
25. Are you aware of any programs, brands, or labels to certify appliances, electronic equipment, and related products as energy efficient?
83
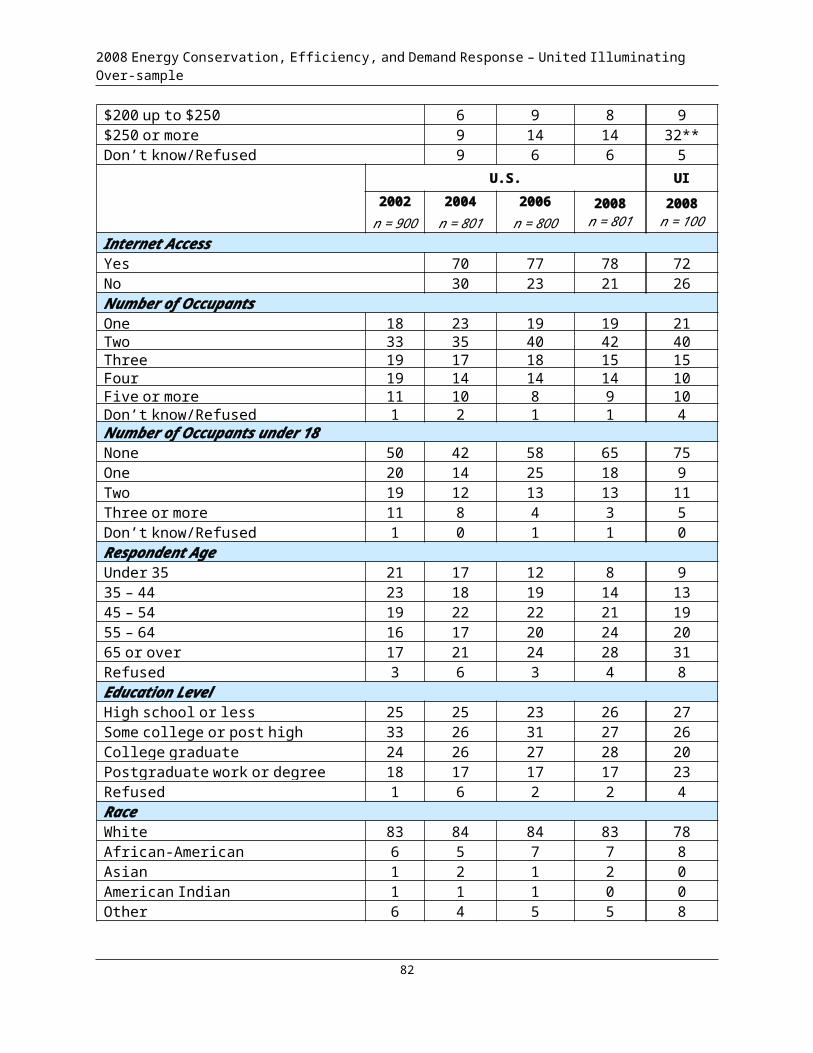
2008 Energy Conservation, Efficiency, and Demand Response – United Illuminating Over-sample
1. Yes2. No
25a.(IF QUESTION 25 = 1) What programs, brands, or labels have you heard of? (RECORD. DO NOT READ )
1. Energy Star2. Energy $mart3. Energy Guide 4. Energy Right5. Good Cents6. Other (record) 7. Don’t know8. Refused9. General Electric (GE)10. Sears/Kenore
26. (IF DO NOT MENTION ENERGY STAR IN QUESTION 25a) Now I’d like to describe a symbol that you may find on products like televisions, home appliances, air conditioners or computers. It’s the word “energy” in script, followed by a star - it’s called the Energy Star symbol. To the best of your knowledge have you ever seen the symbol?
1. Yes2. No -> Go to Question 26 3. Don’t know -> Go to Question 26
26a. (IF MENTION ENERGY STAR IN QUESTION 25a OR QUESTION 26 = 1) What comes to mind first when you think about ENERGY STAR? (DO NOT READ. RECORD ONE RESPONSE)
1. Saving energy2. Saving money on the utility bill3. Protecting the environment4. Other (RECORD) ________________5. Don’t know6. Refused7. Appliances/electronics8. Efficiency rating
26b. (IF MENTION ENERGY STAR IN QUESTION 25a OR QUESTION 26 = 1) Who sponsors the ENERGY STAR logo? (DO NOT READ. RECORD RESPONSE)
1. The government2. Environmental Protection Agency (EPA)3. The states4. Manufacturers 5. Other (SPECIFY)______________6. Don’t know7. Refused8. Electric utility
84
2008 Energy Conservation, Efficiency, and Demand Response – United Illuminating Over-sample
27. (IF MENTION ENERGY STAR IN QUESTION 25a OR QUESTION 26 = 1) Which, if any, of the following explains what the Energy Star symbol means? Does it mean that …
a. The product uses energy more efficiently than a comparable model. Yes Nob. The product, even if it costs more up front, will save you money over its life. Yes Noc. The government backs this symbol, so you can trust it. Yes Nod. The product is friendly to the environment. Yes Noe. The product is of high quality, OR Yes Nof. Does it mean something else? [SPECIFY] Yes Nog. Don’t know [DO NOT READ] Yes Noh. The product helps reduce global warming Yes No
28. (SPLIT HALF. ASK ONE HALF IF QUESTION 25A NE 1 AND QUESTION 26 = 2 or 3) Imagine that you could create a symbol called Energy Star and it would be seen on products like air conditioners, televisions and computers. Which, if any, of the following should the symbol represent? Should it mean that …
a. The product uses energy more efficiently than a comparable model. Yes Nob. The product, even if it costs more up front, will save you money over its life. Yes Noc. The government backs this symbol, so you can trust it. Yes Nod. The product is friendly to the environment. Yes Noe. The product is of high quality, OR Yes Nof. Does it mean something else? [SPECIFY] Yes Nog. Don’t know [DO NOT READ] Yes Noh. The product helps reduce global warming Yes No
28a. Does the fact that ENERGY STAR is sponsored by the Federal government increase, decrease, or have no impact on its credibility with you?
1. Increase2. Decrease3. No impact
29. (ASK ALL) In the past year, have you purchased any of the following new items for your home:
a. Clothes washer? Yes No b. Dishwasher? Yes No c. Refrigerator? Yes No d. Room air-conditioner? Yes No e. Central heating system? Yes No f. Central air-conditioning system? Yes No g. Light bulbs? Yes No h. Lighting fixtures? Yes No i. Home electronics? Yes Noj. Remodeling materials for your home? Yes No k. Windows? Yes No
85
2008 Energy Conservation, Efficiency, and Demand Response – United Illuminating Over-sample
30. (IF YES TO ONE OR MORE ITEMS IN QUESTION 29 AND (IF QUESTION 25a = 1 OR QUESTION 26 = 1)) Did any of the products you purchased have the Energy Star label?
1. Yes2. No
30aa. (IF YES TO QUESTION 30) Which products you purchased had the Energy Star logo? (READ IN LIST OF PRODUCTS PURCHASED FROM QUESTION 29. MULTIPLE RESPONSES PERMITTED)
30a. (IF QUESTION 30 = 1) How much did the presence of the Energy Star logo influence your purchasing decision?
1. Very much2. Somewhat3. Slightly4. Not at all5. Don’t know6. Refused7. (VOL) It is assumed or expected
30bb. (IF Q30 = 2) How important was the energy efficiency of the products you purchases in influencing your decision? Was it …
1. Very important2. Somewhat important3. Somewhat unimportant, or4. Very unimportant
30b. (IF QUESTION 30 = 1) FOR THE ITEM PURCHASED IN QUESTION 29 OR A RANDOMLY- SELECTED ITEM IF MORE THAN ONE IN QUESTION 29) How much did the price of the ____________ influence your purchasing decision?
1. Very much2. Somewhat3. Slightly4. Not at all
30c. (IF QUESTION 30 = 1) In the future, how likely are you to purchase an item with the Energy Star logo?
1. Very likely2. Somewhat likely3. Somewhat unlikely4. Very unlikely
30d. (IF QUESTION 30c = 3 or 4) Why are you unlikely to purchase another item with the Energy Star logo? (RECORD)
86
2008 Energy Conservation, Efficiency, and Demand Response – United Illuminating Over-sample
30e. (ASK ALL) What is your primary source of information when searching for information about products and services? (DO NOT READ. ACCEPT ONE RESPONSE AND RECORD)
1. The internet2. Newspapers3. Magazines4. Consumer Reports5. Friends, neighbors, or coworkers6. Retail displays7. Other (specify)8. Don’t know9. Refused10. Television
31. (ASK ONE-HALF OF THE RESPONDENTS (FORM 1) ) Generally, in making a decision about purchasing an appliance or other energy-using equipment, how important is each of the following factors on a scale of zero to ten, where zero is “not at all important” and ten is “very important”: (ROTATE)
a. Purchase price of the appliance or equipment 0 1 2 3 4 5 6 7 8 9 10
b. Operating cost to run the appliance or equipment over 0 1 2 3 4 5 6 7 8 9 10 its lifetime
c. Brand name 0 1 2 3 4 5 6 7 8 9 10
d. Product features, such as color, size, and options. 0 1 2 3 4 5 6 7 8 9 10
e. Immediate availability of the appliance or equipment 0 1 2 3 4 5 6 7 8 9 10
f. Appearance of the appliance or equipment 0 1 2 3 4 5 6 7 8 9 10
g. How much energy the appliance or equipment uses 0 1 2 3 4 5 6 7 8 9 10
h. The product is better for the environment 0 1 2 3 4 5 6 7 8 9 10
i. Type of fuel used by the appliance or equipment 0 1 2 3 4 5 6 7 8 9 10
j. How long the product will last 0 1 2 3 4 5 6 7 8 9 10
k. Warranties/guarantees for the appliance or equipment 0 1 2 3 4 5 6 7 8 9 10
l. Presence of the Energy Star logo 0 1 2 3 4 5 6 7 8 9 10
m. Someone you trust recommended the product 0 1 2 3 4 5 6 7 8 9 10
n. The payback period for the appliance or equipment 0 1 2 3 4 5 6 7 8 9 10
o, The product helps reduce global warming 0 1 2 3 4 5 6 7 8 9 10
87
2008 Energy Conservation, Efficiency, and Demand Response – United Illuminating Over-sample
31a. (FORM 1 - IF ANSWERED QUESTION 31) Of the features you said were very important, which of the following is most important: (LIST OF FEATURES RATED 9 OR 10 IN QUESTION 31). Was it …
32. DELETED
33. DELETED
34. DELETED
35. DELETED
36. (SPLIT HALF. FORM 2) Which of the following statements best describes how much you consider energy efficiency when you are selecting a product or equipment for your household that uses energy. Do you :
1. Always look for a model that that is energy efficient2. Sometimes look for a model that is energy efficient—if I think of it3. Don’t really look for an energy efficient model, but buy one if it is available4. Don’t really give any consideration to energy efficiency5. Try to avoid energy efficient products
37. (SPLIT HALF. FORM 2) Where would you go first if you were searching for energy efficient appliances and accessories? (DO NOT READ. RECORD ONE RESPONSE).
1. Discount department store (for example, WalMart)2. Home improvement store (for example, Lowes, Home Depot)3. Bulk shopping warehouse/club (for example, Sam’s, Costco) 4. Appliance store (local, Best Buy)5. Department store (Sears) 6. From a utility company 7. Other (specify) ______________8. Don’t know9. Refused10. Yellow pages/phone book11. Family/friends.
37a. Delete
38. (SPLIT-HALF. FORM 1) How reliable would you consider each of the following as a source of information about saving energy? Using a scale of zero to ten, where zero is “very unreliable” and ten is “very reliable”, how reliable would you consider ___ as a source of information about saving energy: (ROTATE CHOICES)
38a. (SPLIT-HALF. FORM 2): How reliable would you consider each of the following as a source of information about protecting the environment? Using a scale of zero to ten, where zero is “very unreliable” and ten is “very reliable”, how reliable would you consider ___ as a source of information about protecting the environment: (ROTATE CHOICES)
88

2008 Energy Conservation, Efficiency, and Demand Response – United Illuminating Over-sample
U. S. Environmental Protection Agency (EPA) 0 1 2 3 4 5 6 7 8 9 10
U. S. Department of Energy (DOE) 0 1 2 3 4 5 6 7 8 9 10
State government 0 1 2 3 4 5 6 7 8 9 10
Your electric utility company 0 1 2 3 4 5 6 7 8 9 10
Contractors 0 1 2 3 4 5 6 7 8 9 10
Retailers 0 1 2 3 4 5 6 7 8 9 10
Consumer publications 0 1 2 3 4 5 6 7 8 9 10
News/media 0 1 2 3 4 5 6 7 8 9 10
Current Energy Bill and Suppliers39. On a scale of zero to ten, where zero means “extremely dissatisfied” and 10 means “extremely satisfied”, how satisfied are you with your electric company?
0 1 2 3 4 5 6 7 8 9 10
40. On a scale of zero to ten, where zero means “very poor” and 10 means “excellent”, how would you rate your electric utility company on … (ROTATE)
a. Providing new products and services 0 1 2 3 4 5 6 7 8 9 10
b. Actively promoting energy-efficiency programs 0 1 2 3 4 5 6 7 8 9 10
c. Providing information about ways to save energy 0 1 2 3 4 5 6 7 8 9 10 in your home
41. Do you know if your local electric utility generates the energy that you use?
1. Yes, they generate my electricity 2. No, they do not generate my electricity
Global Warming and the Energy Situation
42. (SPLIT HALF. FORM 1) How convinced are you that global warming or climate change is happening—would you say you are:
1. Completely convinced2. Mostly convinced
89
2008 Energy Conservation, Efficiency, and Demand Response – United Illuminating Over-sample
3. Somewhat convinced4 Not too convinced SKIP TO Q445 Not at all convinced SKIP TO Q44 8 Don’t know SKIP TO Q449. Refused SKIP TO Q44
43. (IF Q42 = 1, 2, OR 3) There is a lot of talk about things people can do to reduce their contribution to global warming. If a friend of yours wanted to do the most effective thing, and had the money to do anything, what ONE thing would you advise your friend to do? (RECORD RESPONSE)
44. (SPLIT HALF. FORM 1) How important is the issue of global warming to you personally? Please use a scale of 0 to 10, where 0 is “not at all important” and 10 is “extremely important”.
0 1 2 3 4 5 6 7 8 9 10
45. (SPLIT HALF. FORM 2) How serious is the energy situation is in the United States? Would you say it is::
1. Very serious2. Fairly serious, or3. Not at all serious
46. (SPLIT HALF. FORM 2) How important is the energy situation to you personally? Please use a scale of 0 to 10, where 0 is “not at all important” and 10 is “extremely important”.
0 1 2 3 4 5 6 7 8 9 10
Demographic Characteristics
And now I have a few questions just for classification purposes:
D1. What is the main energy source you use for heating your home?
1. Electricity2. Natural gas3. Liquid propane gas (LPG)4. Fuel oil5. Other
D2. On average, how much is your monthly bill for all types of energy you use in your home, including electricity, natural gas, LPG, fuel oil, and any other fuels. Your best estimate is fine. Do your monthly home energy bills average
1. Less than $50 per month2. $50 up to $100 per month
90
2008 Energy Conservation, Efficiency, and Demand Response – United Illuminating Over-sample
3. $100 up to $150 per month4. $150 up to $200 per month5. $200 up to $250 per month6. $250 or more per month
D3. Do you currently have Internet access at home or work?
1. Yes2. No
D4. Do you own or rent your home?
1. Own/buying2. Rent
D5. Is your residence located in a
1. Single family home2. Duplex3. Building with three or more units4. Mobile or manufactured home5. Other
D5a. How long have you lived in your current home. Is it
1.Less than five years, or2.Five years or more
D5b. (IF QD5a = 2) Compared to 5 years ago, do you think your home uses:1. A lot more electricity2. A little more electricity3. A little less electricity4. A lot less electricity5. Don’t know
D6. How many people, including yourself, usually live in your household?
_______________
D6a . Of all the people in your household, how many are
Less than 13 years of age? _________________ 13 to 18 years of age? _________________
D6b. Delete
D7. In what year were you born?
91
2008 Energy Conservation, Efficiency, and Demand Response – United Illuminating Over-sample
19 _ _ (ENTER LAST TWO DIGITS)
D8. Which of the following best describes your education:
1. High school or less 2. Some college or post-high school training3. College graduate4. Post graduate work or degree
D9. Do you consider yourself:
1. White2. African-American3. Asian4. American Indian, or5. A member of another race
D10. Are you of Hispanic or Latino descent?
1. Yes2. No
D11. For classification purposes only, which of the following categories best describes your 2007 household income before taxes? Just stop me when I get to the right category...(READ LIST)
1. Up to $20,000 2. $20,000 up to $30,0003. $30,000 up to $40,000 4. $40,000 up to $50,000 5. $50,000 up to $60,0006. $60,000 up to $70,0007. $70,000 up to $80,0008. $80,000 up to $100,0009. $100,000 up to $120,00010. $120,000 or more
D12. GENDER (RECORD, DO NOT ASK)
1. Male2. Female
Those are all the questions I have. Thank you for your cooperation, and have a very nice evening (day).
92