Embed Size (px)
Citation preview

Mathematical Statistics
Stockholm University
Study 33: Analysing a cross-over study.
Statistical work and challenges related to
planning, conducting and analysing a
clinical trial with cross-over design.
Lovisa Berggren
Examensarbete 2012:2

Postal address:Mathematical StatisticsDept. of MathematicsStockholm UniversitySE-106 91 StockholmSweden
Internet:http://www.math.su.se/matstat
Mathematical StatisticsStockholm UniversityExamensarbete 2012:2,http://www.math.su.se/matstat
Study 33: Analysing a cross-over study.
Statistical work and challenges related to
planning, conducting and analysing a clinical
trial with cross-over design.
Lovisa Berggren∗
April 2012
Abstract
Conducting a trial according to Good Clinical practice requiresinput from a statistician (ICH, E9 http://www.ich.org/ ). The statis-tician plays an important role in the study throw the different stagesof the study: Study planning, study conduction, study analysis andstudy reporting. This report will describe the author’s statistical con-tribution during the conduction of a clinical trial named study 33.This study has been published, see section 7: Appendix 1, but thepublished paper have a clinical focus and will therefore not fully ac-count of the statistical work in the study. Therefore the report alsocontains more general and more detailed sections describing relevantstatistical aspects. Study 33 was carried out as a double blinded, ran-domized crossover study in healthy volunteers with the primary objec-tive:“The primary objective for this study will be to compare sedation,one hour after first dose in each period, between qutiapine immediaterelease formulation (SEROQUEL R©) and qutiapine extended releaseformulation (SEROQUEL XR R©) during initial dose escalation.”Thecrossover design, where all patients receive both treatment options,allows a within patient comparison. But it also introduces statisticalchallenges such as period effect and possible interaction between treat-ment and period. This report describes how these risks were handledin study 33. Furthermore this report includes the results from study33 as presented in a publication of study 33 (section 7).
∗Postal address: Mathematical Statistics, Stockholm University, SE-106 91, Sweden.E-mail:lollo ok.hotmail.com. Supervisor: Rolf Sundberg.

Acknowledgements: I would like to express my gratitude to all those who gave me the possibility to complete this thesis. I want to thank AstraZeneca providing me with the opportunity to write this thesis based on my work for them and based on their data.
A special thanks to my supervisor Professor R Sundberg from Stockholms University, Stockholm Sweden whose help and advises helped me in writing of this thesis.
My former colleagues from AstraZeneca who supported me in my research and my work. I want to thank them for all their help, support, interest and valuable hints. Especially I am obliged to J Szamosi, J Häggström, H Eriksson and M Åström.
Page 2 of 19
Page 3 of 19
Contents 1. Introduction ..................................................................................................................................... 5
2. Clinical trail ..................................................................................................................................... 6
2.1 What is a clinical trial? ............................................................................................................ 6
2.2 Study planning ......................................................................................................................... 6
2.2.1 Study conduction ............................................................................................................. 7
2.2.2 Study analysis and interpretation ..................................................................................... 8
2.3 Aim of study 33 ....................................................................................................................... 9
2.3.1 What is Seroquel®? ......................................................................................................... 9
2.3.2 Rational for conducting study 33 .................................................................................... 9
2.3.3 Study objectives .............................................................................................................. 9
2.3.4 Study design .................................................................................................................. 10
Figure 1 ................................................................................................................................................. 11
2.3.5 Study 33 publication ...................................................................................................... 12
3. Statistical methods and considerations .......................................................................................... 12
3.1 Sample size calculations ........................................................................................................ 12
3.2 Statistical methods ................................................................................................................. 13
3.2.1 Analysis of primary objectives ...................................................................................... 13
3.2.2 Statistical analysis of secondary objectives ................................................................... 13
3.3 Statistical considerations ....................................................................................................... 13
3.3.1 Period effect .................................................................................................................. 14
3.3.2 Interaction between treatment and period ..................................................................... 14
4. Results ........................................................................................................................................... 16
4.1 Summary of main efficacy results ......................................................................................... 16
4.2 Statistical considerations ....................................................................................................... 16
5. Discussion and conclusions ........................................................................................................... 17

Page 4 of 19
5.1 Study design .......................................................................................................................... 17
5.2 Study results .......................................................................................................................... 17
5.3 Concluding remarks .............................................................................................................. 17
6. List of references ........................................................................................................................... 19
7. Appendix 1: Self-Reported Sedation Profile of Immediate-ReleaseQuetiapine Fumarate Compared With Extended-Release Quetiapine Fumarate During Dose Initiation: A Randomized, Double-Blind, Crossover Study in Healthy Adult Subjects...........................................................20
Page 5 of 19
1. Introduction The main purpose of this report is to describe the statistical work that was carried out for study 33 (section 3, 4.2, 5 and 7) Furthermore, the report has the ambition to give a more general introduction to clinical trials and how they are conducted (section 2). Thus, section 2‐6 are intended to provide a suitable background to reading the Study 33 article (section 7). The result from study 33 was presented in a publication, Self‐Reported Sedation Profile of Immediate‐ReleaseQuetiapine Fumarate Compared With Extended‐Release Quetiapine Fumarate During Dose Initiation: A Randomize Double‐Blind, Crossover Study in Healthy Adult Subjects a copy is found as section 7. My role in study 33 was to act as the study statistician during the planning, conduction and analysis phases of the study, described in more details in section 2. For the publication, my main responsibility was to provide the analyses of study data and together with the other authors to participate in the interpretations of the results. My role also included to provide advises, comments and performing review of numbers, conclusions and text the publication. To write a publication is a true team effort where the statistician plays a key role. All information, numbers and conclusions other than found in the publication are my own responsibility. AstraZeneca and Stockholm’s University cannot be hold accountable for the content of this report.
Page 6 of 19
2. Clinical trail
2.1 What is a clinical trial? Clinical trials are a crucial part in all medical drug development. The purpose of a clinical trial is to assess efficacy, safety or mechanisms associated with a new or established drug in humans. All clinical trials are closely regulated by the medical authorities around the world. The main focus is to perform the clinical trial in the most ethical, safe and scientific way possible. This is ensured by conducting the study in line with the guidelines and regulations provided by Good Clinical Practice (GCP). The most commonly used GCP‐system is the one defined by International Committee of Harmonisation (ICH, http://www.ich.org/ ), the ICH committee consists of the regulatory authorities and pharmaceutical industry of Europe, Japan and the US. In order to be compliant with GCP the statistician plays an important role all the way from study planning and designing to analyzing the study and to the final interpretation and conclusion of the results (ICH E9, http://www.ich.org/). This section will describe in short the different steps in a clinical trial from a statistician’s perspective.
2.2 Study planning A clinical study is designed to answer a specific unresolved clinically important question (the main purpose), this is the primary objective of the study . The primary objective is assessed by measuring and evaluating one or more primary endpoints and is often expressed in terms of reduced mortality or other measures of efficacy, always in comparison with standard care or placebo. To support the primary objective the study often also includes different secondary objectives. Sometimes the clinical endpoints are differences in certain laboratory variables or in caring procedures. Such endpoints are regarded as surrogate endpoints as they might not alter the clinical course even if the changes are theoretically favourable and might explain the results.
There are several designs possible to answer the clinical question. They might be regarded in a hierarchical order with the large multicenter, placebo controlled, randomized, and double blinded study regarded as the most conclusive. Certain questions are not possible to answer with such design. It is not always possible to perform blinding procedures due to obvious differences in preparation, colour, immediate effects etc. Lower levels of evidence originate from less rigorously designed studies like cohort studies and case series. From a statistical point of view, large metadata studies of published data and case reports or register studies might provide a good clinical background for the study planning, but are usually (with very few exceptions for extremely rare indications) not considered as studies providing conclusive evidence for a submission. In addition this is a globally rapidly evolving field of gaining knowledge of actual effects in every day practice and adherence to guidelines. Such studies are called effectivity studies, as opposed to efficacy studies, and provide useful information for already approved drugs. Another good source for post marketing data is data base studies, they are necessary to show overall health effects in the general population and the effect change over time. Thus, the appropriate design chosen must always depend on the clinical question posed and the development state of the drug.
All the study objectives need to be specified and the primary outcome defined prior to the study is started. In addition the analyses planed for the primary outcome should also be pre –specified. Often are pre‐specified subgroups included in the design. The randomization, concealment and blinding
Page 7 of 19
procedures must all be thoroughly documented. Exclusion and inclusion criteria must be precisely defined. In this way the design must ensure the integrity of the analyses and minimize the risks of different biases and over interpretation. In order for the study results to be considered valid the preplanning of the design, conduction and end points appropriately of the study needs to be properly documented. Also, all statistical methods to be used to analyze the results should be defined and described in detail in advance. An important part of the statistical planning is the power calculation. The sample size needed to gain the pre specified answers must be thoroughly calculated. The power calculation is based on an assumption of the expected results. This assumption might be derived from previous studies and laboratory results or from meta analyses of literature.
Today, larger clinical trials are often registered in different open official data bases (i e www.clinicaltrails.gov) in order to evaluate publication biases and interrupted studies. Similarly, the design of some large trails is presented as a scientific paper of its own. In this way the conduct and planning of the trail is fully translucent. Also, this approach is a guarantee against scientific fraud. However, for confidentiality reasons this approach is not always possible in commercially sponsored trails. In all phases of this complicated planning process statistical expertise is fundamental.
Also, all clinical trials must have an ethical approval from an official ethical national or regional board before starting. The application for ethical approval must contain all relevant aspects of the trail: the study plan, risks and benefits for the patient and the patient information form. It must clearly be stated that consent to participate in the trail is completely voluntary and that denied consent will not affect care in general. In most cases written informed consent is mandatory.
At AstraZeneca Pharmaceutical Company there are two main documents outlining the design and analyses planed for a study: the Study Design Concept (SDC) and the Clinical Study Protocol (CSP). The SDC is a first high‐level overview used in the initial planning phase of the study. The CSP is a more detailed documentation of the study and how it will be performed. Designing a study will start with creating a SDC and the CSP will then be created based on the concept outlined in the CSP. This CSP needs to be approved by the regulating authorities in the countries where the study will be preformed. All study related procedures then need to be strictly conducted according to the protocol. Deviations from the protocol need to be reported and documented in the study report as a protocol violation. Any major changes in the protocol after the finalized will be provided in an amendment. The amendment, outlining the changes, needs to be submitted to the appropriate authorities for approval.
The statistician is closely involved in the work of developing both the SDC and the CSP, especially the sample size estimation and the statistical analysis plan (SAP). The SAP can be either a part of the CSP or a document on its own (depending on the size and complexity of the study) and includes detailed information about how study data will be handled and analysed.
2.2.1 Study conduction After the planning phase of the study the next phase, study conduction, will follow. Patients or healthy volunteers (from now on referred to as subjects) will be recruited at the centres selected for the study. The selection will be done according to the selection criteria specified in the CSP. The subject will be informed about the study, the investigational product, possible risks and benefits. The
Page 8 of 19
subject must sign an informed consent form before entering the study. No study procedures may be started before the informed consent has been signed. Large clinical studies usually require a large number of sites in order to facilitate the recruitment of the subjects in a timely manner. As the external validity requires multiple centres in different countries as well as a large number of subjects, the logistic challenges are demanding. This makes the coordination complicated and requires dedicated and close monitoring.
The subject will then be started on study treatment including the investigational drug and if applicable placebo or active controls depending on study design (see more about study designs in section1.3.4).
In larger trails there is often an additional safety measure with an independent safety monitoring board, with the task to stop the trail if intermediary analyses or monitoring of adverse events show significant inferiority of study intervention.
The progress of the study in the individual subject will be documented in a specific Case Report Form (CRF). Usually, the CRF includes all relevant background information concerning the subject, demographic information (age, baseline height, baseline weight, sex, race etc), different safety parameters (vital signs, weight, laboratory findings, adverse event information etc) as well as dose information. In studies designed to measure efficacy endpoints it is also the means to capture effect information. The CRF information will be the source data for all the analyses performed within the study framework. After completion of study the information captured in the CRFs will be entered in a database.
2.2.2 Study analysis and interpretation After completion of the study the analysis and result interpretation will start. Data will be analysed per protocol or according to the intention to treat principle. The intention to treat principle means that the patient always is analysed in the stratum allocated even if he or she interrupted the treatment or received the wrong treatment or in any other way did not fulfil the protocol. Per protocol means that only patients fulfilling the protocol in each stratum will be analysed. The intention to treat principle will create the most reliable clinical results and is not biased for drop‐outs or protocol violations. However in laboratory settings with specific questions the per protocol is to prefer. Ideally, these two principles coincide.
The statistician is (according to AstraZeneca procedures) responsible for creating the output as well as contributing to the interpretation of the results. Results from the study will be reported in the clinical study report (CSR) as well as in publications (if applicable). The main findings in the study will be made public this way. Other results will be kept as data on file and is not available publicly. These unpublished results cannot be discussed and scrutinized in the scientific society, but are readily available upon request from authorities and if applicable included in submissions. For study 33 an abbreviated CSR was used since the main goal was to present the results in a publication (see the publication in section 7) other data will be referred to as data on file.
Page 9 of 19
2.3 Aim of study 33
2.3.1 What is Seroquel®? The active substance of Seroquel® is qutiapine, a dibenzothiazepine derivate. It is a classified as an atypical antidepressant and antipsychotic medication. The mechanism of action is inhibition of the dopamine2 ‐receptor in the central nervous system. . It was first approved for treatment of schizophrenia (United states food and drug administration, FDA www.fda.gov , in 1997) and bipolar disorders (the treatment of acute manic episodes, FDA in 2004, and depressive episodes, FDA in 2006). In addition qutiapine was recently approved for major depressive disorder (FDA, in 2009) as an add‐on treatment to first line antidepressants. There are two different approved oral formulations of the drug, Seroquel (immediate release formulation) and Seroquel XR (extended release formulation).
2.3.2 Rational for conducting study 33 The most commonly reported adverse drug reaction for qutiapine includes somnolence and sedation. Besides having dopamin2receptor inhibitory activity, qutiapine has high affinity to the histamine H1 receptor site. This interaction might explain the sedative effect. The safety and tolerability profile is similar between the two formulations of qutapine, but it has been observed that the commonly reported adverse event of initial sedation varies by formulation. The study hypothesis is that the intensity of sedation follows the plasma concentration time curve for each formulation, immediate release vs extended release. Hypothesizing that earlier and higher peak concentration increases somnolence.
In study 33 healthy volunteers were selected in order to determine if the extended release formulation of qutiapine causes a different sedation pattern then immediate release formulation of qutiapine when given at a starting dose of 50 mg in the morning.
2.3.3 Study objectives Primary objective for study 33 (as described in the CSP) was:
“The primary objective for this study will be to compare sedation, one hour after first dose in each period, between qutiapine immediate release formulation (SEROQUEL®) and qutiapine extended release formulation (SEROQUEL XR®) during initial dose escalation.”
The secondary objectives for study 33 (as described in the CSP) were:
• To characterize the difference in sedation profile for qutiapine IR and XR over the period of initial dose escalation as measured by the Visual Analog Scale. The sedation profile includes measures such as maximum intensity of somnolence, time to maximum intensity of somnolence, and area under the curve (AUC) over the following time periods after dose: 0 to 4 hours, 8 to 14 hours, 0 to 24 hours, on all dosing days.
Page 10 of 19
• To characterize the pharmacokinetics of qutiapine and one of its metabolites (neuroqutiapine) on Day 5 over an 11 hour interval by measuring Cmax, tmax and AUC0‐t.
• To explore the relationship between systematic exposure to qutiapine and one of its metabolites (neuroqutiapine) and measures of sedation
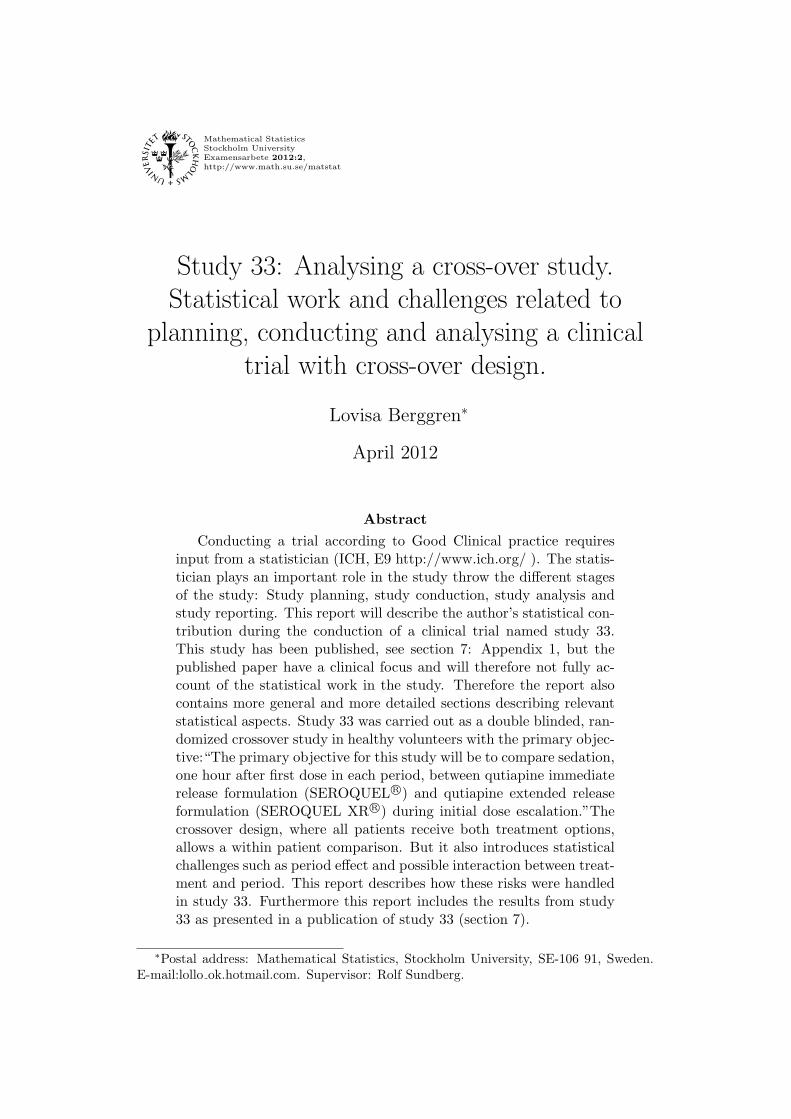
2.3.4 Study design Study 33 was a phase I, double blind, double‐dummy, randomized, 2‐period crossover study conducted in one center in the United States (US). The study is conducted in healthy volunteers. A crossover study is a special form of a controlled double blind randomized trial. In a controlled double blind randomized parallel group trial the subject will be randomized to one of two or more treatment arms. After randomization the patient will receive the randomized treatment in a double blind setting (both the subject and the investigator is blinded, the subjects ID and the treatment will not be linked together until after the end of the study when all results are unblinded in order to be analysed). The crossover design is similar but instead of randomizing the subject to one treatment the subject will be randomized to a treatment sequence. The treatment sequence consists of one or more treatments applied in a fixed sequence of periods. Study 33 was a two‐period crossover were the subjects were either randomized to sequence AB (Seroquel IR followed by Seroquel XR) or sequence BA (Seroquel XR followed by Seroquel IR). In order to keep the blinding the study used double dummy. This means that the patients received two sets of tablets each day one set of active Seroquel tablets (IR or XR) and one set of placebo tablets matching IR or XR. The active tablet and the matching placebo tablet is then switched for the second part of the study. In the end the subject will have received active tablets for both Seroquel IR and XR as well as placebo tablets matching both Seroquel IR and XR. The major benefit of the crossover design is that it will allow within patient comparison, which is not possible in a conventional parallel group design. In addition a crossover design usually requires a smaller sample size in order to reliably estimate the magnitude of the treatment effect. However there are a number of disadvantages with a crossover design (Clinical trials‐ A Practical Approach, Stuart J Pocock). One of the major issues with the crossover design is that the patient needs to be part of the study long enough for the switch between treatment periods. Therefore crossover designs are primarily suitable for short term studies. Since somnolence is known primarily to be a short term risk with Seroquel the objective of study 33 was to look at sedation during the initial dose titration. Thus, the short term nature of the study is compatible with the crossover approach. Another issue with crossover trails is the stability of the disease. The disease state might fluctuate over time irrespective of treatment given. Also, it is important that normal within patient variability is small and does not change over time and that the disease symptoms are stable over study periods. This is a prerequisite for within patient comparisons and the cross over design. In our study we measured Seroquels sedative effect in healthy volunteers. Therefore we did not have to account for disease fluctuations. However, there was still a risk of carry over effect from one period to another. This was addressed by including a wash out period of 6 days between the two periods (see figure 1).
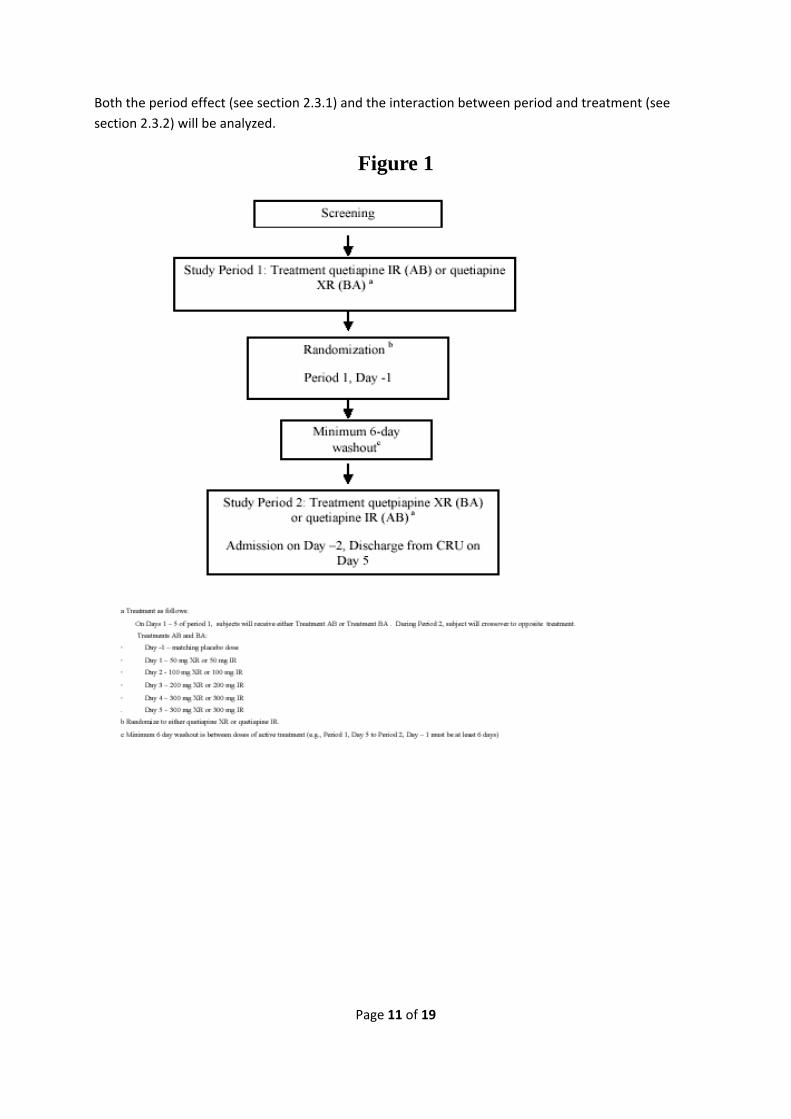
Both the period effect (see section 2.3.1) and the interaction between period and treatment (see section 2.3.2) will be analyzed.
Figure 1
Page 11 of 19
Page 12 of 19
2.3.5 Study 33 publication The result of study 33 was presented in a publication, see section 7, as well as in a Clinical Study Report (AstraZeneca data on file).
3. Statistical methods and considerations
3.1 Sample size calculations The sample size calculation was performed as described in the CSP, (see below) The hypothesis to be tested was:
H0 : VASDIFF = 0
versus
H1 : VASDIFF ≠ 0
The estimate of the delta and standard deviation (SD) is based on data from 2 healthy volunteer crossover studies (D1448C00008 and D1448C00013) evaluating tolerability of the XR formulation which utilized the Bond‐Lader VAS scale for Alert‐Drowsy assessment. Based on the pharmacokinetic profile for IR and XR and on the VAS data in studies D1448C00008 and D1448C00013, the magnitude of difference between IR and XR at 1 hour post the first 50 mg dose is estimated to be 10 mm. This was estimated based on an estimation of peak sedation from the above studies. for quetiapine XR. The maximum observed difference between XR and placebo occurred at the 8 AM assessment (11 hours after dosing) and the expected level of sedation at peak concentration (6 hours after dosing) was estimated. For the quetiapine IR formulation this was multiplied by 2 to account for expected differences due to the know differences in Cmax for the 2 formulations. This calculation resulted in an estimated level of sedation at peak for quietiapine IR of approximately 16.6 mm. Since it is expected that the 1‐hour VAS assessment for quetiapine IR may not be at peak (average time to peak is 90 minutes) and the 1‐hour VAS assessment for quetiapine XR may not be at placebo level, a difference of 10 mm was considered to be a reasonable approximation to the expected difference between the two treatments at 1 hour after dosing. This was used as the delta for calculation of sample size. The estimate of variability, to be conservative, was taken as the maximum SD from the 11‐ hour evaluation in the 2 studies, which was 22.2. Sample size was estimated for a 2‐sided t‐test at a = 0.05 with 90% Power assuming delta =
Page 13 of 19
10 mm and SD = 22.2 mm. It was assumed that about 10% of subjects would not complete the entire study and thus not included in the primary analysis set (i.e. the PP analysis set), so the sample size was set at 60 to ensure at least 52 fully evaluable subjects. The sample for a 2‐sided t‐test was calculated using Kraemer, (1987):
2 ⁄
For the crossover design we only need ½ the sample size since one subject will contribute to both arms. This gives us (Kraemer 1987):
⁄
3.2 Statistical methods
3.2.1 Analysis of primary objectives The statistical analyses preformed on the primary objective (as described in the CSP): The primary objective is to compare the sedative effect, as measured by the Bond‐Lader Visual Analogue Scale (VAS), of IR and XR 1 hour after dose administration at the first dosing day (i.e. Day 1) of each period. Denote the VAS value on IR by VASIR and the corresponding value for XR by VASXR. For each patient the difference between VASXR and VASIR will be calculated (VASXR‐VASIR=VASDIFF). The hypothesis that VASDIFF=0 will be tested by means of the Student’s paired t‐test and a p‐value less than, or equal to, 0.0500 will be regarded statistically significant. As a robustness analysis the hypothesis will be tested by means of the Wilcoxon signed rank test as well. This analysis approach makes two main assumptions (in addition to the normality assumption for the Student’s paired t‐test): no period effect and no treatment‐period interaction. These assumptions will be tested using the methods presented in Pocock (1983). If the period effect is significant (i.e. the p‐value is less than or equal to 0.0500) the test presented above will be adjusted in order to take the period effect into consideration (Pocock, 1983). If the interaction between treatment and period is significant (i.e. the p‐value is less than or equal to 0.0500) only the first period will be used.
3.2.2 Statistical analysis of secondary objectives Secondary objectives will be analysed according to the same principal as for the primary objective described above except for the robustness analyze and the test for period effect and the test of treatment period interaction.
3.3 Statistical considerations As described in section 2.2.1 the relatively straightforward analysis of the primary objective makes two main assumptions, no period effect and no treatment‐period interactions. The sections 2.3.1 and 2.3.2 describes how these effects was analysed and handled in study 33.

Page 14 of 19
3.3.1 Period effect As discussed earlier the crossover design is only feasible in a setting where the condition of interest, in this case the sedation, remains stable during the study. If the condition changes during the study it will affect the results. The level of somnolence or sedation is naturally not stable over hours or days. Therefore it is very important to test for period effect. The treatment effect in study 33 was examined by comparing the mean differences for the two treatment orders and test it with a t‐test (under the hypotheses that the difference is equal to 0, no period effect) with n(A‐B)+n(B‐A)‐1 degrees of freedom. The test statistic t can be ulated as: calc
Where VASDIFF(A‐B) is the mean difference in VAS score after A – mean difference in VAS score after B. The SD(A‐B) is the standard deviation of the difference and n(A‐B) is the number of patients in the treatment sequence A followed by B. The same parameters but with a subscript B‐A donates the mean difference, standard deviation and numbers of patients for the sequence B followed by A.
If the period effect test is non‐significant we use statistic (as described in section the test 2.2.1):
Where the mean difference (VASDIFF) and standard deviation of the difference (SD) is calculated based on the difference between Seroquel XR and Seroquel IR regardless of treatment sequence.
If the period effect test is significant there is evidence for a period effect and we need to adjust the results according to Pocock (1983). Th ves us the modified test statistic: is gi slightly
Note that VASDIFF=(VASDIFF(A‐B)‐ VAS(B‐A))/2 if the number of patients are the same (e.i. the two equations above are equivalent). Caution should still be made when interpreting the results since the presence of a period effect can have a medical meaning that will not be captured in the adjusted test of the primary objective.
3.3.2 Interaction between treatment and period The study design for study 33 included a 6 day washout between the two treatment periods. The purpose of the washout period was to minimize the risk of a carryover of the drug effect from the drug in period 1 into period 2. Still there might be a carryover effect present or other interactions between period and treatment. Therefore a test of interaction between treatment and period was preformed.
Page 15 of 19
The interaction between treatment and period was examined by comparing the mean within patient with means between the arms. The me ithin patient means calculated as: an w can be
, , ,
2
Where VASafter A in arm (A‐B), corresponds to the VAS score after treatment A for patient i in arm A‐B. This gives the mean over patient means:
∑ ,
Comparison between the two treatm arms perf with a two‐sample t‐test (Pocock (1983)): ents ormed
If a treatment‐period effect is present it is hard to interpret such an interaction but one common reason is the carry‐over effect. If a significant interaction is found Pocock (1983) recommend to abandon the planed within patient analyse and instead analyse the between patient comparison using the first period only. This is the same approach as described for this study in section 2.2.1.
It is also important to note in the interpretation of the results that the test for treatment‐period effect described above has low sensitivity. Especially for small crossover trials one may fail to detect an interaction even if present.
Page 16 of 19
4. Results The main results from study 33 are described in the published paper Self‐Reported Sedation Profile of Immediate‐Release Quetiapine Fumarate Compared With Extended‐Release Quetiapine Fumarate During Dose Initiation: A Randomized, Double‐Blind, Crossover Study in Healthy Adult Subjects (Clinical Therapeutics Volume 31, Number 3, March 2009), see section 7 for the full article.
Results not included in the publication are not yet public (AstraZeneca data on file) and therefore not included here.
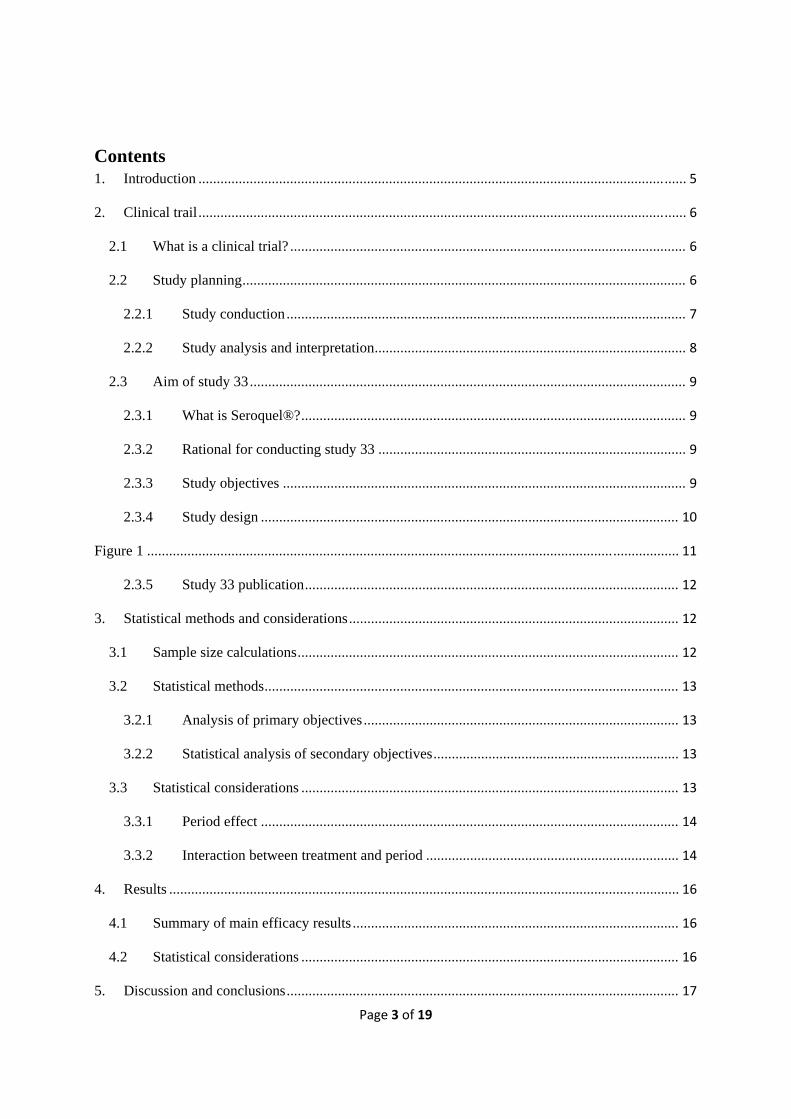
4.1 Summary of main efficacy results Sixty‐three subjects was enrolled and received at least one dose of study medication and fifty‐eight subjects was eligible for the per‐protocol population that was used in the efficacy analyze. The difference in VAS one hour after first dose on day 1, a significant greater intensity of sedation with quetiapine IR then with quetiapine XR (mean VAS score, 33.2 vs 11.3, respectively; P<0.001). The difference was also significant at 1.5, and 2 hours after dosing (P<0.001) and at 3 hours after dosing (P<0.01); on day 2 at 1 hour after dosing (P<0.01), at 1.5 and 2 hour after dosing (P<0.001) and at 3, 4, and 5 hours after dosing (P<0.001) ; on day 3 at 0.5 an 1 hour after dosing (P<0.05), at 1.5, 2, 3, and 4 hours after dosing (P<0.001), and at 5 and 6 hours after dosing (P<0.05); on day 4 at 1 hour after dosing (P<0.01), at 1.5, 2, 3, and 4 hours after dosing (P<0.001), and at 5 hours after dosing (P<0.01); and on day 5 at 1.5, 2, and 3 hours after dosing (P<0.001), and at 4 hours after dosing (P<0.05). Figures and more details can be found in section 7.
4.2 Statistical considerations The test of period effect and of interaction between treatment and period was conducted according to the analysis described in section 2.3.1 and 2.3.2. The result of the analysis was not statistically significant (AstraZeneca, data on file) on the pre‐specified significance level of 0.05. It is still important to note, for the interpretation of the results, that the test for interaction between treatment and period has a low sensitivity and one may fail to detect an interaction even if present.
The robustness analysis (for more details see section 2.2.1) of the primary hypothesis confirmed the results of the primary analyze (AstraZeneca, data on file).
No correction for multiplicity was done.
Page 17 of 19
5. Discussion and conclusions
5.1 Study design All study designs have their specific advantages and disadvantages. The choice of design is highly dependent on the scientific question to be answered. The crossover design was chosen for study 33 primarily to address the between subject variability in sedation. Due to studying healthy volunteers and thus controlling for the setting and the specific design of the study (including a washout period to minimize carry‐over effect) the risk of period effect and carry‐over effect could be minimized (see section 3.2 for more details). However conducting the study in healthy volunteers induces inevitable bias in the translation of the study results to patients for which qutiapine IR and XR are approved. The possibility of a difference in sedation profile and tolerability between healthy volunteers and a patient population cannot be neglected and further studies are needed to assess the clinical validity of the results in the present study.
Furthermore the study was only designed to investigate sedative effects (as measured by the VAS scale) and not quality of sleep, ability to perform tasks, impact on disease state or other related consequences of sedation that might have significance in the clinical setting. This limits the direct clinical application of the study. Larger studies with patients are needed to evaluate the clinical impact of qutiapine induced sedation. In such studies additional measures of sedation and its consequences can be included.
To conclude, the design of study 33 was appropriate given the scope of the study. To further characterize the sedation profiles of qutiapine IR and XR in the clinical setting, additional studies are needed.
5.2 Study results Study 33 was designed to compare sedation profiles between qutiapine IR and qutiapine XR during initial dose escalation in healthy subjects. The results of the study showed a statistically significant difference in sedation (VAS score) 1 hour after first dose on day one and subsequent separation between the sedation profiles (based on VAS scores) as described in the publication (section 7) and in section 3.1.
5.3 Concluding remarks No statistical correction for multiple calculations was performed for secondary endpoints or additional time points (not covered by the primary analysis). Bonferroni or other corrections might be used for this purpose. Therefore caution should be taken when interpreting the results. Significant p‐values might be due to chance as multiple different variables and time points are analysed independently. However, the result seems to be consistent between different study days and over other types of measurements (i.e. number of patients at sleep and VAS categorical shifters). These consistent clinical observations support the interpretation of the results.
In order to gain more knowledge concerning the sedative profile of quitiapine IR and qutiapine XR a larger clinical study in patients was needed. Subsequently, a clinical study along these intentions has

Page 18 of 19
been performed. This study was designed as a controlled two armed double blinded study to compare sedation during the initial dose titration between Seroquel IR and Seroquel XR in bipolar depression patients (http://clinicaltrials.gov/ct2/show/record/NCT00926393 ).

Page 19 of 19
6. List of references Clinical trials.gov homepage, study NCT00926393 http://clinicaltrials.gov/ct2/show/record/NCT00926393
FDA homepage www.fda.gov
International Committee of Harmonisation (ICH) homepage http://www.ich.org/
Kraemer, H.C. and Theimann, S. (1987). How many subjects? Statistical power analysis in research. Newbury Park, CA: Sage
Stuart J. Pocock (1984). Clinical Trials‐ a practical approach. John Wiley & Sons Ltd.
Clinical Therapeutics/Volume 31, Number 3, 2009
Self-Reported Sedation Profile of Immediate-ReleaseQuetiapine Fumarate Compared With Extended-ReleaseQuetiapine Fumarate During Dose Initiation: A Randomized,Double-Blind, Crossover Study in Healthy Adult Subjects
Catherine Datto, MD, MS1; Lovisa Berggren, MSc2;Jitendra B. Patel, PhD1; andHans Eriksson, MD, PhD, MBA1
lAstraZeneca Pharmaceuticals) Wilmington) Delaware; and 2AstraZeneca R&D) Sodertdlje) Sweden
ABSTRACTObjectives: The primary study objective was to as
sess the time course and intensity of sedation after administration of immediate-release (IR) and extendedrelease (XR) quetiapine fumarate in healthy subjectsduring dose initiation. The tolerability of the 2 formulations was also evaluated.
Methods: This was a randomized, double-blind,double-dummy, 2-period crossover study in healthyadult (age 18-50 years) subjects. It employed thedose-initiation schedule used in studies of the 2 quetiapine formulations in patients with bipolar depression: 50 mg on day 1, 100 mg on day 2, 200 mg onday 3, and 300 mg on days 4 and 5. Doses were administered in the morning. The primary end point wasthe level of sedation 1 hour after dosing on day 1, asrated by subjects using a visual analog scale (VAS)ranging from 0 = alert to 100 = drowsy. SecondaryVAS end points included sedation over a 14-hour period on day 1, and on days 2 through 5. Blood wasdrawn on day 5 of both periods for determination ofplasma drug concentrations by a liquid chromatography method with tandem mass-spectrometric detection. Adverse events (AEs) were recorded throughoutthe study.
Results: Sixty-three subjects were enrolled in thestudy, comprising the safety population. The perprotocol population consisted of 58 subjects (79.0%male, 21.0% female; 67.2% black, 24.1 % white; meanage, 31.8 years; mean weight, 80.7 kg). One hour afterdosing on day 1, sedation was significantly greater withquetiapine IR than with quetiapine XR (mean VASscore, 33.2 vs 11.3, respectively; P < 0.001). There wereno significant differences in sedation between formulations at 7 hours after dosing (64.5 and 53.6), 8 hoursafter dosing (46.9 and 50.8), or 14 hours after dosing
492
(both, 12.7). On day 1, numerically more subjects hada VAS score>75 (substantial sedation) 1 hour after dosing in the quetiapine IR group than in the quetiapineXR group (14 vs 4 subjects). On day 5, the mean(95% CI) quetiapine Cmax for the IR and XR formulations was 689.19 (605.83-784.02) and 381.70(341.40-426.76) ng/mL; the mean AUCO_11 was2835.89 (2517.92-3194.02) and 2515.21 (2281.762772.55) ng' hlmL; and the median Tmax was 2.0 and5.0 hours. The incidence of any AEs was 21.7% withquetiapine IR and 9.8% with quetiapine XR.
Conclusion: In these healthy subjects, quetiapineXR was associated with a lower intensity of selfreported sedation compared with quetiapine IR.ClinicalTrials.gov Identifier: NCT00702676; AstraZenecaclinicaltrials.com Identifier: D1443C00033. (ClinTher. 2009;31:492-502) © 2009 Excerpta Medica Inc.
Key words: bipolar depression, atypical antipsychotic, extended release, quetiapine, sedation.
INTRODUCTIONBipolar disorder is a highly prevalent, chronic, recurrent, and disabling condition. 1 Although there are several well-established pharmacotherapies for the treatment of bipolar mania,2,3 there is little evidence tosupport the efficacy of agents for the treatment of bipolar depression.3,4 Current options include combination olanzapine-fluoxetine, lithium, valproate, lamotrigine, quetiapine, and the combination of an anti-
Accepted for publication February 10, 2009.
Express Track online publication March 13,2009.doi:1 0.1 016/j.c1 inthera.2009.03.0020149-2918/$ - see front matter
© 2009 Excerpta Medica Inc. All rights reserved.
Volume 31 Number 3
depressant (eg, selective serotonin reuptake inhibitor,serotonin-norepinephrine reuptake inhibitor) and amood stabilizer.5
Quetiapine fumarate is the only approved monotherapy for bipolar depression and the only atypicalantipsychotic approved as monotherapy for the treatment of both poles of this disorder. Both the immediaterelease (IR) and extended-release (XR) formulationsof quetiapine are approved for the treatment ofschizophrenia, bipolar mania, and bipolar depressionin the United States and several European countries.In the United States, quetiapine IR and quetiapine XRare approved as adjunctive treatment to lithium ordivalproex for the maintenance treatment of bipolar Idisorder. 6,7 Evidence from 5 published studies supports the efficacy of the 2 quetiapine formulations inbipolar depression. 8-13
Whereas the IR formulation provides rapid drugrelease, quetiapine XR is formulated to provide gradual release of quetiapine. At equivalent total daily doses, quetiapine IR given twice daily and quetiapine XRgiven once daily have similar AUCO_24 and t 1l2 values.However, the Tmax is longer with quetiapine XR dosedonce daily than with quetiapine IR dosed twice daily(~6.0 vs ~1.5 hours, respectively); this, along withgradual drug release over the day, produces a smoother pharmacokinetic profile with quetiapine XR, allowing attainment of more stable plasma concentrations than with quetiapine IR.14
Examination of tolerability data from the quetiapineXR clinical trial program,13,15-18 including adverseevents (AEs) and longitudinal laboratory data, and indirect comparison with the quetiapine IR database (N =
25,359) suggests that the overall tolerability profile ofquetiapine XR, including events related to sedation, isconsistent with that of quetiapine IR for each indicationstudied. The occurrence of AEs related to sedation during clinical trials is a relatively crude measure of the sedation that may occur during treatment, particularlyduring dose initiation. The first scheduled postbaselinevisit in clinical studies often occurs at week 1, and anyinformation regarding AEs is likely to be less detailedthan if it had been recorded daily. Also, there are methodologic difficulties associated with formal comparisons of patients treated during separate clinical trialprograms (eg, possible bias due to timing and geographic location), which may be considered "nonrandomized" cohorts. In countries where quetiapine XR is currently licensed, observations from clinical practice
March 2009
C. Datto et al.
suggest that there may be some tolerability differencesbetween quetiapine IR and quetiapine XR, particularlywith respect to the onset and characteristics of sedation.These differences may be important, as registrationstudies do not generally capture tolerability variables ona daily basis, and evidence of a drug's tolerability isbased largely on AE reporting. It is also possible thatthere may be meaningful differences between the XRformulations of some drugs compared with the corresponding IR formulation in terms of tolerability; forexample, less nausea and dizziness were reported withvenlafaxine XR than with venlafaxine IR.19
This study (AstraZeneca clinical trial numberD1443C00033) examined the time course and intensityof self-reported sedation with quetiapine IR and quetiapine XR during dose initiation in healthy adult subjects, using the approved dose-initiation schedule forpatients with a depressive episode associated withbipolar disorder. 6,7 The hypothesis was that the timecourse and intensity of sedation would correspond tothe pharmacokinetic profiles of the 2 formulations.The tolerability of quetiapine IR and quetiapine XR wasalso evaluated.
SUBJECTS AND METHODSSubjects
The study included healthy men and women aged18 to 50 years. Other key inclusion criteria wereweight ::::50 kg and normal findings (or deviationsfrom normal that were not considered clinically significant by the investigator) on a complete physicalexamination that included vital signs, clinicallaboratory tests, and an electrocardiogram. Subjects wereexcluded if they had (or had a history of) neurologic,hematologic, psychiatric, gastrointestinal, hepatic,pulmonary, cardiovascular, or renal disease, or another condition known to interfere with the absorption, distribution, metabolism, or excretion of drugs.Other exclusions were a history of significant alcohol,drug, or substance abuse within the past year; use ofprescription medication for an acute or chronic medical condition within 4 weeks of the first day of period 1 (day 1); and receipt of an investigational drugwithin 4 weeks of day 1. Pregnant or lactating womenwere also excluded. Use of drugs that induce or inhibitthe cytochrome P450 3A4 isozyme was not permittedwithin 4 weeks of day 1, and use of over-the-countermedications (with the exception of acetaminophen)was not permitted within 7 days of day 1.
493
Clinical Therapeutics
Study Design and TreatmentThis randomized, double-blind, double-dummy,
2-period crossover study was conducted at a singlecenter in the United States. The dose-initiation schedules were those approved for quetiapine IR and quetiapine XR in bipolar depression. 6,7 A computerizedscheme was used to randomize subjects to treatmentsequence AB or BA. Subjects initiated treatment witheither quetiapine IR or quetiapine XR, given as a single dose in the morning (with ~240 mL of water), inthe following order: 50 mg on day 1, 100 mg on day 2,200 mg on day 3, and 300 mg on days 4 and 5. Medication was given in the morning to enable accurate assessment of the intensity and time courseof sedation. Each treatment period lasted 7 days and6 nights. After a washout period of at least 6 days,subjects were switched to the alternative formulationand repeated the treatment sequence. A matching placebo was used to maintain blinding. Compliance wasassessed by supervised administration of study medication, including inspection of the oral cavity andhands. In each period, subjects were admitted to thestudy center on day -2 and discharged on day 5. Alight breakfast was served ~1 hour before dosing onall study days.
Written informed consent was obtained from allsubjects. The study was performed in accordance withthe ethical principles of the Declaration of Helsinki20
and the Good Clinical Practice guidelines,21 applicableregulatory requirements, and the AstraZeneca policyon bioethics and human biological samples. Local institutional review board approval was obtained.
Study End Points and AssessmentsSedation
To evaluate the primary end point-the intensityof sedation with the 2 quetiapine formulations 1 hourafter administration on the first day of dosing(day l)-subjects rated their level of alertness using a100-mm visual analog scale (VAS), with responsesranging from 0 = alert to 100 = drowsy. Such selfreported rating scales of sedation may be used inclinical practice, as well as in clinical trials. 22 Secondary VAS end points included sedation over a 14-hourperiod on day 1, and on days 2 through 5. The 14-hourtime point was chosen as reasonable for a "late evening" assessment and was expected to provide information pertinent to levels of sedation that might occurin the morning in actual use.
494
Subjects were given standardized verbal instructions for completing the VAS. Each day from day -1through day 4 of both study periods, they were tocomplete the VAS before dosing and at 0.5, 1, 1.5, 2,3,4,5,6, 7, 8, 11, and 14 hours after dosing. On day 5,subjects completed the VAS before dosing and at 0.5,1, 1.5,2,3,4,5,6, 7, 8, and 11 hours after dosing.Mean VAS scores were calculated at each time pointon each day. If a subject was asleep at the time of ascheduled assessment, the VAS score was recorded as100. To facilitate comparisons and add clinical relevance, VAS scores were categorized as >75 (substantial sedation), 50-75 (marked sedation), 25-49 (moderate sedation), and <25 (alert).
Pharmacokinetics ofQuetiapine and NorquetiapineThe pharmacokinetics of quetiapine and norquetia
pine, the major active metabolite of quetiapine in humans, were characterized over an 11-hour period onday 5 (although steady state would not have beenachieved).
Blood was drawn by individual venipuncture orthrough an indwelling catheter for determination ofplasma concentrations before dosing and at 0.5, 1,1.5,2,3,4,5,6, 7, 8, and 11 hours after dosing onday 5 of each study period. Venous blood samples(2 mL) were collected into K2EDTA spray-coatedtubes; for samples obtained from a catheter, the first1 mL of blood was discarded, and the catheter wasflushed with 2 mL of normal saline after sampling tokeep it patent. Blood samples were placed on ice andcentrifuged (10 minutes at 1500g) within 30 minutesof collection; the resulting plasma was frozen at or below -70°C within 15 minutes of plasma preparationand kept frozen until transported to the laboratory.
Plasma drug concentrations of quetiapine weredetermined by Bioanalytical Systems, Inc. (West Lafayette, Indiana), using fully validated bioanalytic methods. In brief, quetiapine was extracted from humanplasma by liquid/liquid extraction at alkaline pH withmethyltert-butyl ether using isotope-labeled internalstandards for each analyte; the organic layer was collected and evaporated to dryness, and the residue wasreconstituted with an ammonium formate buffer. Thesamples were injected into a liquid chromatographysystem with tandem mass-spectrometric detection(LC-MS/MS) multiplexed with 2 Luna C18 columns(Phenomenex, Inc., Torrance, California) usmg ammonium formate/methanol mobile phases.
Volume 31 Number 3
The Cmax' Tmax' and AUCO_11 were determined forquetiapine. Plasma concentrations of norquetiapinewere also determined using liquid extraction and LCMS/MS methodology, and the same pharmacokineticparameters were determined as for quetiapine.
Adverse EventsAEs, whether spontaneously reported by subjects,
elicited by open questioning, or observed by studypersonnel, were assessed and recorded throughout thestudy. Because sedation was assessed using the VAS, itwas not recorded as an AE.
A full physical examination was conducted atscreening and at the end of the study. At screening andon days -2, -1, and 5 of both study periods, bloodpressure and heart rate were recorded (preferably before administration of any scheduled dose) after thesubject had been seated for at least 5 minutes. Clinicalchemistry tests (nonfasting creatinine, bilirubin, glucose, and thyroid function) and hematology tests (hemoglobin, platelet count, and complete blood count)were performed at screening and at day -2 of the firststudy period and day 5 of the second study period.
Statistical AnalysisBased on the pharmacokinetic profiles of quetia
pine IR and quetiapine XR and VAS data from previous unpublished studies in healthy subjects, the magnitude of difference between quetiapine IR andquetiapine XR at 1 hour after dosing on day 1 wasestimated to be 10 mm. The sample size was estimated for a 2-sided t test at a = 0.05 with 90% power, assuming (5 = 10 mm and SD = 22.2 mm. It was assumedthat ~ 10% of subjects would not complete the entirestudy, so the sample size was set at 60 to ensure atleast 52 fully evaluable subjects.
The primary analytic set, which was used for allanalyses, was the per-protocol (PP) population, whichconsisted of all subjects who completed both periodsand thus provided information for both formulationsof quetiapine. Results of the 2 study periods werepooled, allowing direct intrasubject comparison of thetolerability of quetiapine IR and quetiapine XR.
The paired t test was used to analyze the primaryand secondary objectives related to sedation. A P value0:;0.05 was considered statistically significant. 23 TheWilcoxon signed rank test was also used as a measureof the robustness of the primary objective. No correction was made for multiplicity.
March 2009
C. Datto et al.
Pharmacokinetic parameters were derived by noncompartmental methods using WinNonlin Enterpriseedition version 4.1 (Pharsight Corporation, MountainView, California) and summarized using descriptivestatistics. Cmax and AUCO_t were summarized usinggeometric means (95% CIs). Tmax was recorded as amedian (range). AUCO_t was calculated using the linear trapezoidal rule. For the comparison of the quetiapine IR and XR formulations, geometric mean ratios(90% CIs) for Cmax and AUCO_t were determined(with the IR formulation as the reference) using amixed-effect model, with treatment sequence, treatment period, and treatment as fixed effects andsubject nested in sequence as a random effect. Logtransformed AUCO_11 and Cmax were analyzed usingan analysis-of-variance model; least squares means(95% CI) were calculated for each treatment group,and the geometric mean ratios (90% CIs) were calculated for the difference between treatment groups.The least squares means and corresponding CIs wereantilog-transferred back to the original scale to obtainthe geometric means and CIs for each treatment groupand the geometric mean ratios and 90% CIs for thedifference between treatment groups. Statistical analyses were performed using SAS version 9.1 (SAS Institute Inc., Cary, North Carolina).
AEs were analyzed in the safety population (thosewho received at least 1 dose of study medication) using descriptive statistics.
RESULTSSixty-three subjects were enrolled and received at least1 dose of medication (safety population). Four subjects decided to discontinue the study, and 1 discontinued for personal reasons. Thus, the PP populationconsisted of 58 subjects (79.0% male, 21.0% female;67.2% black, 24.1% white; mean age, 31.8 years;mean weight, 80.7 kg).
SedationOn day -1, when no active drug was given, mean
VAS scores for sedation over 14 hours ranged from0.9 to 25.2. One hour after dosing on day 1, VASscores indicated a significantly greater intensity ofsedation with quetiapine IR than with quetiapine XR(mean VAS score, 33.2 vs 11.3, respectively; P < 0.001)(Figure 1). The difference in mean VAS scores betweentreatments was significant on day 1 at 1, 1.5, and2 hours after dosing (P < 0.001) and at 3 hours after
495

Clinical Therapeutics
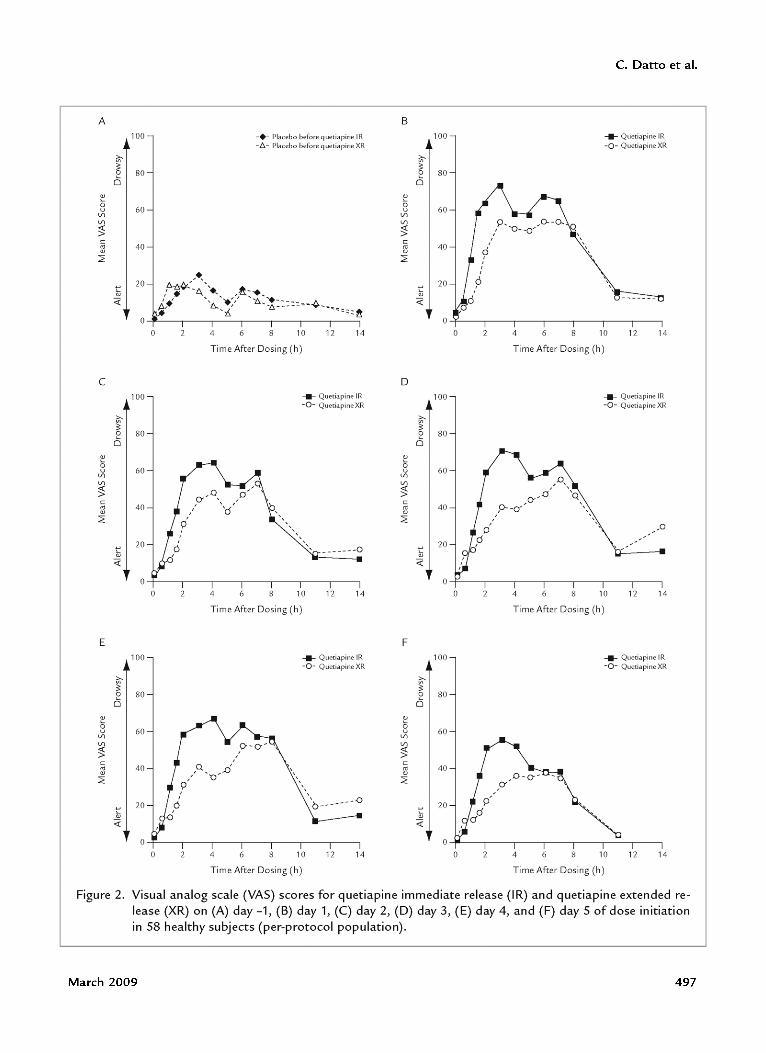
dosing (P < 0.01); on day 2 at 1 hour after dosing(P < 0.01), at 1.5 and 2 hours after dosing (P < 0.001),and at 3, 4, and 5 hours after dosing (P < 0.05); onday 3 at 0.5 and 1 hour after dosing (P < 0.05), at 1.5,2, 3, and 4 hours after dosing (P < 0.001), and at5 and 6 hours after dosing (P < 0.05); on day 4 at1 hour after dosing (P < 0.01), at 1.5, 2, 3, and4 hours after dosing (P < 0.001), and at 5 hours afterdosing (P < 0.01); and on day 5 at 1.5,2, and 3 hoursafter dosing (P < 0.001) and at 4 hours after dosing(P < 0.05) (Figure 2).
The mean reported intensity of sedation was numerically greater with quetiapine IR than with quetiapineXR over 7 hours after dosing on day 1 (mean VASscores at 7 hours, 64.5 and 53.6, respectively); the intensity of sedation on day 1 did not differ significantly between formulations at 8 (46.9 and 50.8), 11 (15.8 and12.8), and 14 (both, 12.7) hours after dosing (Figure 2).A similar pattern was seen on each subsequent day.
On day 1, the highest mean VAS score was 73.0with quetiapine IR (observed 3 hours after dosing)and 53.9 with quetiapine XR (observed 3 and 6 hoursafter dosing). On day 5, the highest VAS scores werea respective 56.6 (3 hours after dosing) and 37.8
(6 hours after dosing). Consistent with these results,the mean area under the VAS score-time curve foreach day suggested more overall sedation with quetiapine IR than with quetiapine XR, with significantdifferences between formulations on days 1 (P =
0.004),3 (P < 0.001),4 (P = 0.029), and 5 (P = 0.001)(Table I).
No relationship was found between the level ofsedation and the dose during dose initiation with either quetiapine formulation, as indicated by similararea under the VAS score-time curve values on days 1to 4 (50- to 300-mg doses).
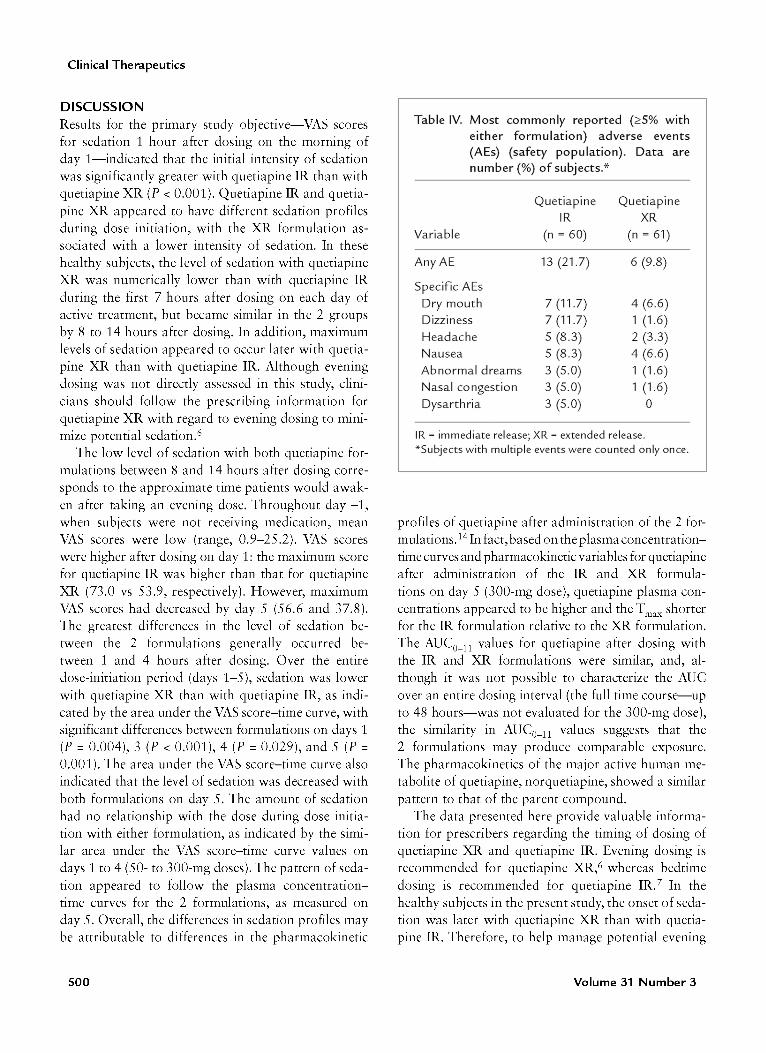
On day 1, numerically more subjects had a VASscore >75 (substantial sedation) 1 hour after dosingin the quetiapine IR group than in the quetiapineXR group (14 vs 4 subjects, respectively) (Table II).Of the 52 subjects who had a VAS score <25 (alert)1 hour after dosing with quetiapine XR on day 1,15 (28.8%) had a VAS score ::::50 (marked sedation)1 hour after dosing with quetiapine IR on day 1. Ofthe 36 subjects who had a VAS score <25 at 1 hourafter dosing with quetiapine IR on day 1,2 (5.6%)had a VAS score ::::50 at 1 hour after dosing withquetiapine XR on day 1.
• Quetiapine IRo Quetiapine XR
100
>-'"~t'
0 80
OJ.....0u 60
\I)
\I)
~cro 40OJ
~
20....~
'"«0
Before Dosing 1 Hour After Dosing
Figure 1. Visual analog scale (VAS) scores for quetiapine immediate release (IR) and quetiapine extended release (XR) before dosing and 1 hour after dosing on the first day of active medication in 58 healthysubjects (per-protocol population). *p < 0.001 versus quetiapine IR, paired t test.
496 Volume 31 Number 3
C. Datto et al.
A B100 -+- Placebo before quetiapine IR
-6,- Placebo before quetiapine XR100 ... Quetiapine IR
-0- Quetiapine XR
80 80
O+--,---,--,-----r---,--r------,
,,,.----141210864o
20
60
40
'"ou
V)
V)
~c
'"'":::E
1412108642oo
20
60
40
'"ou
V)
V)
~c
'"'":::E
Time After Dosing (h) Time After Dosing (h)
c o100
~:;:o 80o
~ Quetiapine IR-0- Quetiapine XR
100
~:;:o 80o
..... Quetiapine IR-0- Quetiapine XR
'"ou
V)
V)
~c
'"'":::E
60
40
20 _______0
'"ou
V)
V)
~c
'"'":::E
60
40
20
/),0-,0' "Q
Q.. ," ,, -0 ,
0' ,
,6
o-t----,----r--r--,----,----,---, O-f----,----r--r--,----,----,---,o 2 4 6 8 10 12 14 o 4 6 8 10 12 14
Time After Dosing (h) Time After Dosing (h)
E F100 ... Quetiapine IR
-0- Quetiapine XR100 ___ Quetjapine IR
-0- Quetiapine XR
80 80
141210862oO-lA---,----r--r--,---,---,---,
20
40
60'"ou
V)
V)
~c
'"'":::E
1412108642oO-F---,---,--,-----r---,--r------,
20
40
60'"ou
V)
V)
~c
'"'":::E
Time After Dosing (h) Time After Dosing (h)
Figure 2. Visual analog scale (VAS) scores for quetiapine immediate release (I R) and q uetiapine extended release (XR) on (A) day -1, (B) day 1, (C) day 2, (D) day 3, (E) day 4, and (F) day 5 of dose initiationin 58 healthy subjects (per-protocol population).
March 2009 497
Clinical Therapeutics
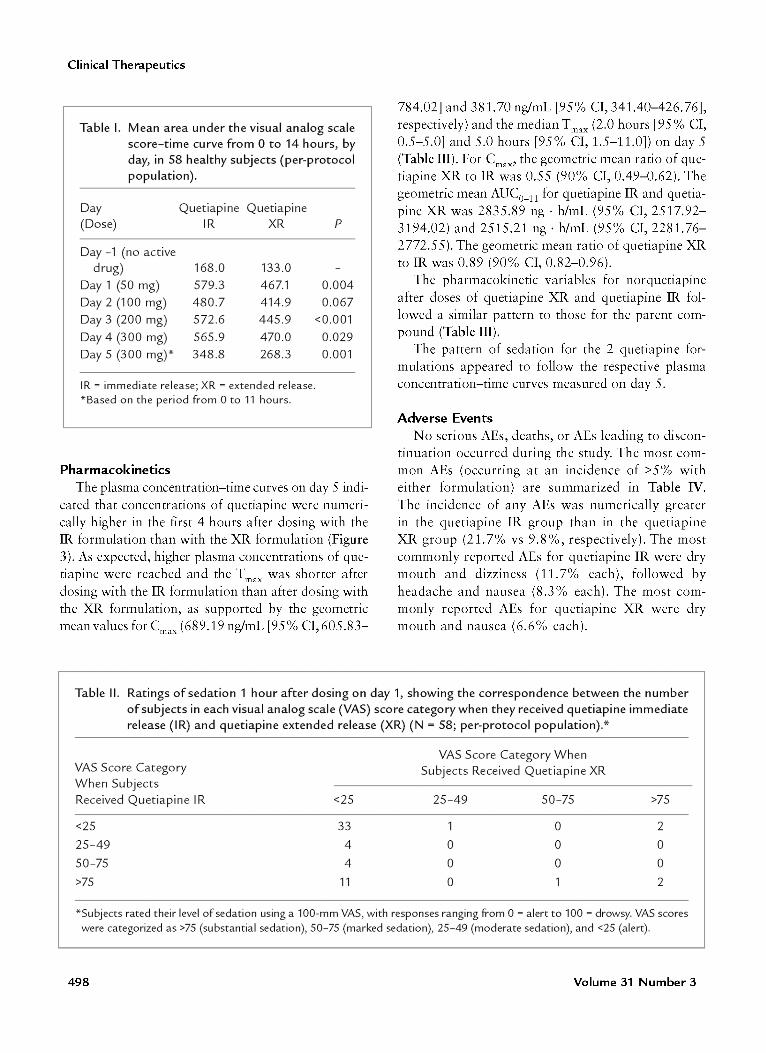
IR ~ immediate release; XR ~ extended release.*Based on the period from 0 to 11 hours.
Table I. Mean area under the visual analog scalescore-time curve from 0 to 14 hours, byday, in 58 healthy subjects (per-protocolpopulation).
Quetiapine QuetiapineIR XR
Day(Dose)
Day -1 (no activedrug)
Day 1 (50 mg)Day 2 (100 mg)Day 3 (200 mg)Day 4 (300 mg)Day 5 (300 mg)*
168.0579.3480.7572.6565.9348.8
133.0467.1414.9445.9470.0268.3
p
0.0040.067
<0.0010.0290.001
784.02] and 381.70 nglmL [95% CI,341.40-426.76],respectively) and the median Tmax (2.0 hours [95% CI,0.5-5.0] and 5.0 hours [95% CI, 1.5-11.0]) on day 5(Table III). For Cmax' the geometric mean ratio of quetiapine XR to IR was 0.55 (90% CI, 0.49-0.62). Thegeometric mean AUCO_11 for quetiapine IR and quetiapine XR was 2835.89 ng . hlmL (95% CI,2517.923194.02) and 2515.21 ng' hlmL (95% CI,2281.762772.55). The geometric mean ratio of quetiapine XRto IR was 0.89 (90% CI,0.82-0.96).
The pharmacokinetic variables for norquetiapineafter doses of quetiapine XR and quetiapine IR followed a similar pattern to those for the parent compound (Table III).
The pattern of sedation for the 2 quetiapine formulations appeared to follow the respective plasmaconcentration-time curves measured on day 5.
PharmacokineticsThe plasma concentration-time curves on day 5 indi
cated that concentrations of quetiapine were numerically higher in the first 4 hours after dosing with theIR formulation than with the XR formulation (Figure3). As expected, higher plasma concentrations of quetiapine were reached and the Tmax was shorter afterdosing with the IR formulation than after dosing withthe XR formulation, as supported by the geometricmean values for Cmax (689.19 nglmL [95% CI,605.83-
Adverse EventsNo serious AEs, deaths, or AEs leading to discon
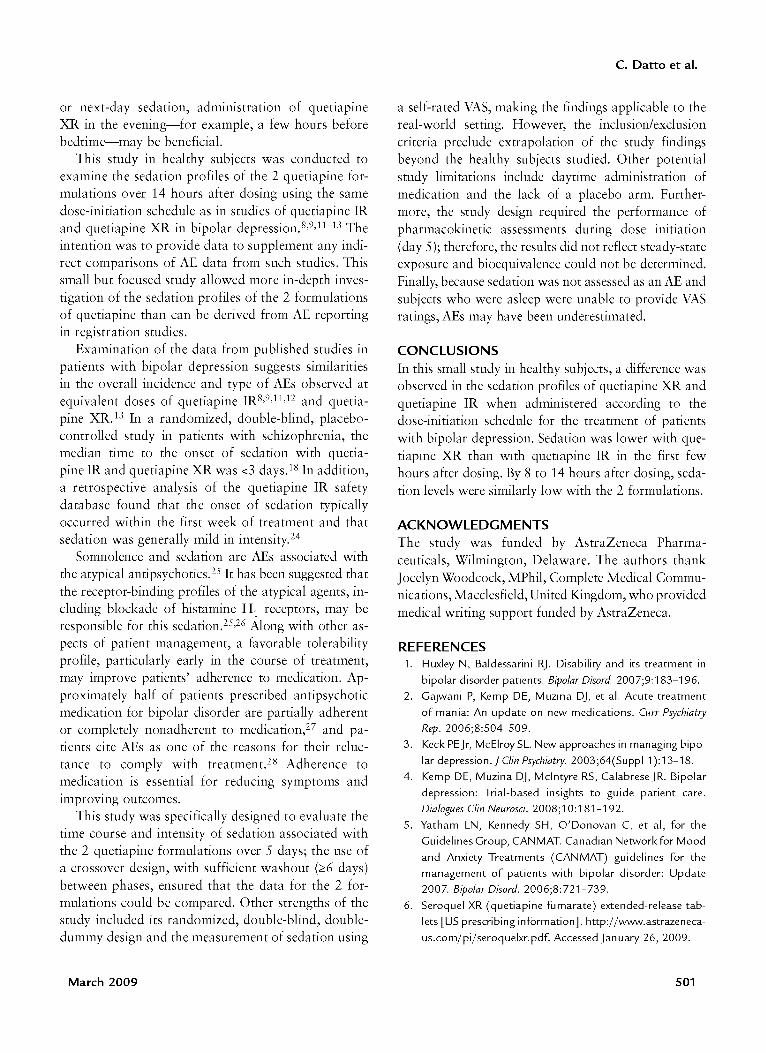
tinuation occurred during the study. The most common AEs (occurring at an incidence of ::::5% witheither formulation) are summarized in Table IV.The incidence of any AEs was numerically greaterin the quetiapine IR group than in the quetiapineXR group (21.7% vs 9.8%, respectively). The mostcommonly reported AEs for quetiapine IR were drymouth and dizziness (11. 7% each), followed byheadache and nausea (8.3 % each). The most commonly reported AEs for quetiapine XR were drymouth and nausea (6.6% each).
Table II. Ratings of sedation 1 hour after dosing on day 1, showing the correspondence between the numberof subjects in each visual analog scale (VAS) score category when they received quetiapine immediaterelease (IR) and quetiapine extended release (XR) (N = 58; per-protocol population).*
VAS Score Category WhenVAS Score Category Subjects Received Quetiapine XRWhen SubjectsReceived Quetiapine IR <25 25-49 50-75 >75
<25 33 1 0 2
25-49 4 0 0 050-75 4 0 0 0
>75 11 0 1 2
*Subjects rated their level of sedation using a 100-mm VAS, with responses ranging from 0 = alert to 100 = drowsy. VAS scoreswere categorized as >75 (substantial sedation), 50-75 (marked sedation), 25-49 (moderate sedation), and <25 (alert).
498 Volume 31 Number 3

C. Datto et al.
... Quetiapine IR-0- Quetiapine XR
12108
'0'''-0" - ---0
.. _-- .... _-- .....'" '- -----0
6
Time (h)
42
"",,0''-
Js'J::J'
:::?600
Ebo sooc'-"c0·u("lj 400........c<J)uc0 300
U("lj
EIII
200~Q...
<J)c
.0...100("lj
·u<J):::J0' 0
0
Figure 3. Plasma concentration-time curves for quetiapine on day 5 after administration of the quetiapineimmediate-release (IR) and quetiapine extended-release (XR) formulations (day 1, SO mg; day 2, 100 mg;day 3, 200 mg; days 4 and 5, 300 mg) in healthy subjects (per-protocol population).
Table III. Pharmacokinetic parameters of quetiapine and norquetiapine on day 5 after administration of thequetiapine immediate-release (IR) and quetiapine extended-release (XR) formulations in 58 healthysubjects (per-protocol population).
AnalytejParameter
Quetiapine IR,Geometric Mean
(95% CI)
Quetiapine XR,Geometric Mean
(95% CI)
Geometric Mean Ratio,XRjlR
(90% CI)*
QuetiapineCmax ' ngjmLAUCO_11 ' ng . hjmLTmax' ht
689.19 (605.83-784.02)2835.89 (2517.92-3194.02)
2.0 (0.5-5.0)
381.70 (341.40-426.76)2515.21 (2281.76-2772.55)
5.0 (1.5-11.0)
0.55 (0.49-0.62)0.89 (0.82-0.96)
NorquetiapineCmax ' ngjmLAUCO_11 ' ng . hjmLTmax' ht
153.47 (137.94-170.74)1074.42 (985.29-1171.62)
3.0 (1.0-8.0)
107.69 (99.65-116.38)880.22 (820.27-944.55)
6.0 (3.0-11.0)
0.70 (0.66-0.75)0.82 (0.78-0.86)
"For comparison of quetiapine XR and IR, geometric mean ratios ofCmax and AUCO_t
and 90% Cis were determined (withIR as the reference) using a mixed-effect model with treatment sequence, treatment period, and treatment as fixed effects, and subject nested in sequence as a random effect.
t Median (range).
March 2009 499
Clinical Therapeutics
DISCUSSIONResults for the primary study objective-VAS scoresfor sedation 1 hour after dosing on the morning ofday 1-indicated that the initial intensity of sedationwas significantly greater with quetiapine IR than withquetiapine XR (P < 0.001). Quetiapine IR and quetiapine XR appeared to have different sedation profilesduring dose initiation, with the XR formulation associated with a lower intensity of sedation. In thesehealthy subjects, the level of sedation with quetiapineXR was numerically lower than with quetiapine IRduring the first 7 hours after dosing on each day ofactive treatment, but became similar in the 2 groupsby 8 to 14 hours after dosing. In addition, maximumlevels of sedation appeared to occur later with quetiapine XR than with quetiapine IR. Although eveningdosing was not directly assessed in this study, clinicians should follow the prescribing information forquetiapine XR with regard to evening dosing to minimize potential sedation.6
The low level of sedation with both quetiapine formulations between 8 and 14 hours after dosing corresponds to the approximate time patients would awaken after taking an evening dose. Throughout day -1,when subjects were not receiving medication, meanVAS scores were low (range, 0.9-25.2). VAS scoreswere higher after dosing on day 1: the maximum scorefor quetiapine IR was higher than that for quetiapineXR (73.0 vs 53.9, respectively). However, maximumVAS scores had decreased by day 5 (56.6 and 37.8).The greatest differences in the level of sedation between the 2 formulations generally occurred between 1 and 4 hours after dosing. Over the entiredose-initiation period (days 1-5), sedation was lowerwith quetiapine XR than with quetiapine IR, as indicated by the area under the VAS score-time curve, withsignificant differences between formulations on days 1(P = 0.004),3 (P < 0.001), 4 (P = 0.029), and 5 (P =
0.001). The area under the VAS score-time curve alsoindicated that the level of sedation was decreased withboth formulations on day 5. The amount of sedationhad no relationship with the dose during dose initiation with either formulation, as indicated by the similar area under the VAS score-time curve values ondays 1 to 4 (50- to 300-mg doses). The pattern of sedation appeared to follow the plasma concentrationtime curves for the 2 formulations, as measured onday 5. Overall, the differences in sedation profiles maybe attributable to differences in the pharmacokinetic
500
Table IV. Most commonly reported (~S% witheither formulation) adverse events(AEs) (safety population). Data arenumber (%) of subjects.*
Quetiapine QuetiapineIR XR
Variable (n = 60) (n = 61)
AnyAE 13 (21.7) 6 (9.8)
Specific AEsDry mouth 7(11.7) 4 (6.6)Dizziness 7 (11.7) 1 (1.6)Headache 5 (8.3) 2 (3.3)Nausea 5 (8.3) 4 (6.6)Abnormal dreams 3 (5.0) 1 (1.6)Nasal congestion 3 (5.0) 1 (1.6)Dysarthria 3 (5.0) 0
IR ~ immediate release; XR ~ extended release.*Subjects with multiple events were counted only once.
profiles of quetiapine after administration of the 2 formulations. 14 In fact, based on the plasma concentrationtime curves and pharmacokinetic variables for quetiapineafter administration of the IR and XR formulations on day 5 (300-mg dose), quetiapine plasma concentrations appeared to be higher and the Tmax shorterfor the IR formulation relative to the XR formulation.The AUCO_11 values for quetiapine after dosing withthe IR and XR formulations were similar, and, although it was not possible to characterize the AUCover an entire dosing interval (the full time course-upto 48 hours-was not evaluated for the 300-mg dose),the similarity in AUCO_11 values suggests that the2 formulations may produce comparable exposure.The pharmacokinetics of the major active human metabolite of quetiapine, norquetiapine, showed a similarpattern to that of the parent compound.
The data presented here provide valuable information for prescribers regarding the timing of dosing ofquetiapine XR and quetiapine IR. Evening dosing isrecommended for quetiapine XR,6 whereas bedtimedosing is recommended for quetiapine IR.7 In thehealthy subjects in the present study, the onset of sedation was later with quetiapine XR than with quetiapine IR. Therefore, to help manage potential evening
Volume 31 Number 3
or next-day sedation, administration of quetiapineXR in the evening-for example, a few hours beforebedtime-may be beneficial.
This study in healthy subjects was conducted toexamine the sedation profiles of the 2 quetiapine formulations over 14 hours after dosing using the samedose-initiation schedule as in studies of quetiapine IRand quetiapine XR in bipolar depression. 8,9,11-13 Theintention was to provide data to supplement any indirect comparisons of AE data from such studies. Thissmall but focused study allowed more in-depth investigation of the sedation profiles of the 2 formulationsof quetiapine than can be derived from AE reportingin registration studies.
Examination of the data from published studies inpatients with bipolar depression suggests similaritiesin the overall incidence and type of AEs observed atequivalent doses of quetiapine IR8,9,11,12 and quetiapine XR.13 In a randomized, double-blind, placebocontrolled study in patients with schizophrenia, themedian time to the onset of sedation with quetiapine IR and quetiapine XR was <3 days.18 In addition,a retrospective analysis of the quetiapine IR safetydatabase found that the onset of sedation typicallyoccurred within the first week of treatment and thatsedation was generally mild in intensity.24
Somnolence and sedation are AEs associated withthe atypical antipsychotics.25 It has been suggested thatthe receptor-binding profiles of the atypical agents, including blockade of histamine Hi receptors, may beresponsible for this sedation.25,26 Along with other aspects of patient management, a favorable tolerabilityprofile, particularly early in the course of treatment,may improve patients' adherence to medication. Approximately half of patients prescribed antipsychoticmedication for bipolar disorder are partially adherentor completely nonadherent to medication,27 and patients cite AEs as one of the reasons for their reluctance to comply with treatment.28 Adherence tomedication is essential for reducing symptoms andimproving outcomes.
This study was specifically designed to evaluate thetime course and intensity of sedation associated withthe 2 quetiapine formulations over 5 days; the use ofa crossover design, with sufficient washout (:;:6 days)between phases, ensured that the data for the 2 formulations could be compared. Other strengths of thestudy included its randomized, double-blind, doubledummy design and the measurement of sedation using
March 2009
C. Datto et al.
a self-rated VAS, making the findings applicable to thereal-world setting. However, the inclusion/exclusioncriteria preclude extrapolation of the study findingsbeyond the healthy subjects studied. Other potentialstudy limitations include daytime administration ofmedication and the lack of a placebo arm. Furthermore, the study design required the performance ofpharmacokinetic assessments during dose initiation(day 5); therefore, the results did not reflect steady-stateexposure and bioequivalence could not be determined.Finally, because sedation was not assessed as an AE andsubjects who were asleep were unable to provide VASratings, AEs may have been underestimated.
CONCLUSIONSIn this small study in healthy subjects, a difference wasobserved in the sedation profiles of quetiapine XR andquetiapine IR when administered according to thedose-initiation schedule for the treatment of patientswith bipolar depression. Sedation was lower with quetiapine XR than with quetiapine IR in the first fewhours after dosing. By 8 to 14 hours after dosing, sedation levels were similarly low with the 2 formulations.
ACKNOWLEDGMENTSThe study was funded by AstraZeneca Pharmaceuticals, Wilmington, Delaware. The authors thankJocelyn Woodcock, MPhil, Complete Medical Communications, Macclesfield, United Kingdom, who providedmedical writing support funded by AstraZeneca.
REFERENCES1. Huxley N, Baldessarini RJ. Disability and its treatment in
bipolar disorder patients. Bipolar Disord. 2007;9:183-196.
2. Gajwani P, Kemp DE, Muzina Dj, et al. Acute treatment
of mania: An update on new medications. Curr Psychiatry
Rep. 2006;8:504-509.
3. Keck PEjr, McElroy SL. New approaches in managing bipo
lar depression.} Clin Psychiatry. 2003;64(Suppl 1):13-18.
4. Kemp DE, Muzina Dj, Mcintyre RS, CalabresejR. Bipolar
depression: Trial-based insights to guide patient care.
Dialogues Clin Neurosci. 2008; 10:181-192.
5. Yatham LN, Kennedy SH, O'Donovan C, et ai, for the
Guidelines Group, CAN MAT. Canadian Network for Mood
and Anxiety Treatments (CAN MAT) guidelines for the
management of patients with bipolar disorder: Update
2007. Bipolar Disord. 2006;8: 721-739.
6. Seroquel XR (quetiapine fumarate) extended-release tab
lets [US prescribing information]. http://www.astrazeneca
us.com/pi/seroquelxr.pdf. Accessed january 26, 2009.
501
Address correspondence to: Catherine Datto, MD, MS, AstraZenecaPharmaceuticals, 1800 Concord Pike, Wilmington, DE 19850. E-mail:[email protected]
Clinical Therapeutics
7. Seroquel (quetiapine fumarate) [US
prescribing information]. http://WV\oW1.
astrazeneca-u s. comj pij seroq ue I.
pdf. Accessed january 26, 2009.
8. Calabrese jR, Keck PE, Macfadden
W, et al. A randomized, double
blind, placebo-controlled trial of
quetiapine in the treatment ofbipo
lar lor II depression. AmJ Psychiatry.
2005; 162:1351-1360.
9. Thase ME, Macfadden W, Weisler
RH, et ai, for the BOLDER II Study
Group. Efficacy ofquetiapine mono
therapy in bipolar I and II depres
sion: A double-blind, placebo
controlled study (the BOLDER II
study) [published correction appears
in J Clin Psychopharmacol. 2007;27:
51].J Clin Psychopharmacol. 2006;26:
600-609.
10. Weisler RH, Calabrese jR, Thase
ME, et al. Efficacy of quetiapine
monotherapy for the treatment of
depressive episodes in bipolar I dis
order: A post hoc analysis of com
bined results from 2 double-blind,
randomized, placebo-controlled
studies. J Clin Psychiatry. 2008;69:
769-782.
11. McElroy S, Young AH, Carlsson A, et
al. A double-blind, placebo-controlled
study with acute and continuation
phase of quetiapine and paroxetine
in adults with bipolar depression
(EMBOLDEN II). Bipolar Disord. 2008;
10(Suppl 1):59. Abstract.
12. Young AH, McElroy S, Chang W,
et al. A double-blind, placebo
controlled study with acute and con
tinuation phase of quetiapine and
lithium in adults with bipolar depres
sion (EMBOLDEN 1).lntJ Neuropsycho
pharmacol. 2008;11 :187. Abstract.
13. Suppes T, Datto C, Minkwitz M, et
al. Effectiveness of the extended re
lease formulation of quetiapine as
monotherapy for the treatment of
acute bipolar depression. Poster
presented at: 48th Annual New
Clinical Drug Evaluation Meeting;
May 27-30, 2008; Phoenix, Ariz.
14. Figueroa C, Brecher M, Hamer
Maansson jE, Winter H. Pharma-
cokinetic profiles of extended re
lease quetiapine fu marate compared
with quetiapine immediate release.
Prog Neuropsychopharmacol Bioi Psy
chiatry. 2009;33: 199-204.
15. Ganesan S, Agambaram V, Rander
ee F, et al. Switching from other
antipsychotics to once-daily extend
ed release quetiapine fumarate in
patients with schizophrenia. Curr
Med Res Opin. 2008;24:21-32.
16. Moller jH, johnson S, Mateva T, et
al. Evaluation of the feasibility of
switching from immediate releasequetiapine to extended release que
tiapine fumarate In stable outpa
tients with schizophrenia. Int Clin
Psychopharmacol. 2008;23:95-105.
17. Peuskens j, Trivedi jK, Malyarov S,
et al. Prevention of schizophrenia
relapse with extended release que
tiapine fumarate dosed once daily:
A randomized placebo-controlled
trial in clinically stable patients. Psy
chiatry. 2007;4:34-50.
18. Kahn RS, Schulz SC, Palazov VD, et
ai, for the Study 132 Investigators.
Efficacy and tolerability of once
daily extended release quetiapine
fumarate in acute schizophrenia: A
randomized, double-blind, placebo
controlled study. J Clin Psychiatry.
2007;68:832-842.
19. Entsuah R, Chitra R. A benefit-risk
analysis of once-daily venlafaxine ex
tended release (XR) and venlafaxine
immediate release (IR) In outpa
tients with major depression. Psy
chopharmacol Bull. 1997;33:671-676.
20. World Medical Association Decla
ration of Helsinki. Ethical Principles
for Medical Research Involving Hu-
man Su bjects. http://www.wma.
netjejpolicyjb3.htm. Accessedjanu
ary 28,2009.21. International Conference on Har
monisation of Technical Require
ments for Registration of Pharma
ceuticals for Human Use (ICH)
adopts Consolidated Guideline onGood Clinical Practice in the Con
duct of Clinical Trials on Medi
cinal Products for Human Use.
Int Dig Health Legis. 1997;48:231
234.
22. Bond A, Lader M. The use of ana
logue scales in rating subjective feel
ings. BrJMedPsychol. 1974;47:211
218.
23. Pocock SJ. Clinical Trials: A Practical
Approach. Chichester, UK: john Wi
ley & Sons Ltd; 1983.24. Goldstein j. Tolerance to somno
lence with quetiapine: A review of
the evidence. World J Bioi Psych.
2005;6(Suppl 1 ):280. PO-021.
25. Miller DD. Atypical antipsychotics:
Sleep, sedation, and efficacy. Prim
Care Companion J Clin Psychiatry.
2004;6(Suppl 2):3-7.
26. Kane jM, SharifZA. Atypical antipsy
chotics: Sedation versus efficacy.J Clin
Psychiatry. 2008;69(Suppl 1): 18-31.
27. Sajatovic M, Valenstein M, Blow FC,et al. Treatment adherence with an
tipsychotic medications in bipolar
disorder. BipolarDisord. 2006;8:232
241.
28. Fleck DE, Keck PE jr, Corey KB,
Strakowski SM. Factors associatedwith medication adherence in Afri
can American and white patients
with bipolar disorder. J Clin Psychia
try. 2005;66:646-652.
502 Volume 31 Number 3


![Cross sectional study.pptx [Read-Only]...Descriptive cross-sectional study Analytic cross-sectional study Repeated cross-sectional study 7 Descriptive Collected number of cases and](https://img.pdfslide.net/doc/110x75/5f0c07f77e708231d43368fd/cross-sectional-studypptx-read-only-descriptive-cross-sectional-study-analytic.jpg)