Embed Size (px)
Citation preview

Accounting
Study & Master
Elsabé Conradie • Derek Kirsch • Mandy Moyce
Grade 11Teacher’s Guide

University Printing House, Cambridge Cb2 8bs, United Kingdom
One Liberty Plaza, 20th Floor, New York, NY 10006, UsA
477 Williamstown Road, Port Melbourne, viC 3207, Australia
314–321, 3rd Floor, Plot 3, splendor Forum, Jasola District Centre, New Delhi – 110025, india
79 Anson Road, #06–04/06, singapore 079906
The Water Club, beach Road, Granger bay, Cape Town 8005, south Africa
Cambridge University Press is part of the University of Cambridge. it furthers the University’s mission by disseminating knowledge in the pursuit of education, learning and research at the highest international levels of excellence.
www.cambridge.org information on this title: www.cambridge.org/9781107380844
© Cambridge University Press 2012, 2020
This publication is in copyright. subject to statutory exception and to the provisions of relevant collective licensing agreements, no reproduction of any part may take place without the written permission of Cambridge University Press.
First published 2012
Reprinted 20 1
Editor: Christine de Nobrega, Neall FourieTypesetter: brink Publishing & Design, ikhala Graphics…………………………………………………………………………………………………notice to teachersThe photocopy masters in this publication may be photocopied free of charge for classroom use within the school or institution which purchases the publication. Worksheets and copies of them remain in the copyright of Cambridge University Press and such copies may not be distributed or used in any way outside the purchasing institution.…………………………………………………………………………………………………if you want to know more about this book or any other Cambridge University Press publication, phone us at +27 21 4127800, fax us at +27 21 419-8418 or send an e-mail to [email protected]
Updated 20202
isbN 978-1-107-38084-4

Section 1 Introduction 1Section 2 Planning 9 Annual Teaching Plan 9 Daily Teaching Plan 10
Section 3 Assessment tasks 21 1. Presentations/reports 21 2. Tests 37 3. Projects 58 4. Examinations 63 5. Case studies 105
Section 4 Notes/tips for teachers 121
Section 5 Solutions to activities 133 Chapter 1: Ethics 133 Chapter 2: Internal controls and audit processes 137 Chapter 3: Reconciliations – Bank reconciliations 141 Chapter 4: Reconciliations – Creditors reconciliations 156 Chapter 5: Fixed assets 159 Chapter 6: Partnerships – Accounting concepts and final accounts 188 Chapter 7: Partnerships – Financial statements 212 Chapter 8: Partnerships – Interpretation of financial statements 234 Chapter 9: Financial accounting of non-profit organisations – Clubs 247 Chapter 10: Cost Accounting 277 Chapter 11: Budgeting 304 Chapter 12: Inventory systems 317 Chapter 13: Value-added tax (VAT) 335 Chapter 14: Revision activities 341
Section 6 Moderation templates 371
Section 7 Answer sheet templates 379
Contents


1
Section 1
introduction
1. Subject objectivesIt is essential that learners be made aware of the importance of Accounting and its relevant application in modern-day career choices where entrepreneurial skills are so vitally important. There should also be a concerted effort to nurture an interest and passion for this subject in every learner.
Every learner should have their individual talents and abilities taken into account so that this interest may be developed to each one’s own full potential.
When teaching this subject, the following objectives should be achieved:• Tolinkthelearners’priorknowledgetothenewsubjectcontentthrough
progression• Toapproachthecontentinameaningfulmannerwithsufficientreference
to real-life situations• Topresentthecontentinsuchawaythatlearnersunderstandthecontent,
rather than just memorise subject matter• Touseavarietyof presentationstrategies• Tokeepregularcontroloverwrittenworkandtoensurethatmeaningful
evaluations take place• Toprovideregularhomeworktaskssothatlearnerscanconsolidateand
revise their work in this manner.
Moreover, it is our aim to convey to learners the knowledge and skills that will provide an appropriate basis from which to build a successful career or continue their studies in this subject area, so these three practice books are adequate.
2. Books and portfolios2.1 Practice booksWe recommend that learners should acquire the following practice books for Grade 11 Accounting:• AGeneralLedger• Aneight-columnjournal• Athree-columnCashBook.An Exercise Book is available in which all the columns for each activity are already drawn, and which will save considerable time, but not all learners will be able to afford this, so these three practice books are adequate.
2.2 Learner portfoliosAB4envelopewillservethepurposeof alearner’sportfolioverywell.Ittakes up very little space in the classroom, is inexpensive and ensures that the assessment tasks of every learner are available for moderation in class in an ordered manner. The following information needs to appear on front of the envelope: name and surname of the learner; grade and section; learning area and grade; and subject teacher.

2 s e c t i o n 1 • i n t r o d u c t i o n
The portfolio also needs to contain the following divisions:• Content/interventionpagewithstatementof authenticity• Controltests• Examinations• Casestudies/presentations• Project• Informalassessments.
2.3 intervention with learnersIf a learner is repeatedly performing poorly or is creating problems, his or her parents or caregivers need to be contacted. Any interaction with the parents should be via letter or telephone. A record needs to be kept of all interaction and has to be forwarded to the relevant grade supervisor.
You should try to be available for extra classes for at least one hour per week – carefully record this as learner intervention.
The portfolios should never leave the classroom – the same applies to the worksheets once they have been placed in the portfolio. After every test or CASSactivity,thelearnerinterventionsheet(frontpageof theportfolio)needs to be sent to the parents for signature – this is to keep parents continually informed of the learner’s marks. Any intervention with the parent/learnershouldalsoberecordedonthissheet,if theparentshouldvisit you during a parent evening.
2.4 teacher portfoliosThis portfolio should contain the following:• Frontpagewithrelevantinformation• Tableof contents• Subjectguidelines• Teachertimetable• Marksheets(thefollowinginformationhastobeindicated:subject/
learning area, grade, learner’s name and marks, date of completion for formaltask,assessmentsheet/subjectof task/maximummarkthatcanbeachieved)
• Assessmentprogrammes• Annualanddailyteachingplans• Proof of moderation(internalandexternal)• Policydocuments(NCS,NPA,Progressionandpromotionrequirements)• Sectionsforthefollowing: Accounting:Controltests,examinations,casestudies,writtenreports,
projects, informal assessments The assessment matrix for both the exam paper and the marking
memorandum should be included with each section.• Learnerinformationandinteractionwithparents/intervention• Departmentalinformationandcirculars(ContinuousAssessment
GuidelinesdocumentandLearningAreas/Subjectguidelines)• Memorandaof subjectmeetings.
3s e c t i o n 1 • i n t r o d u c t i o n
3. What is Accounting?From CAPS documentAccounting focuses on measuring performance and processing and communicating financial information about economic sectors. The discipline ensures that principles such as ethical behaviour, transparency and accountability are adhered to. It deals with the logical, systematic and accurate selection and recording of financial information and transactions, as well as the compilation, analysis, interpretation and communication of financial statements and managerial reports for use by interested parties.The subject encompasses accounting knowledge, skills and values with the focus on the financial accounting, managerial accounting and auditing fields. These fields cover a broad spectrum of accounting concepts and skills to prepare learners for a variety of career opportunities.
The table below indicates the main topics in the Accounting curriculum.
topic
1. Accounting concepts (terminology, definitions, double entry, and so on)
2. GAAP principles
3. Bookkeeping (source documents, journals, ledgers, trial Balances, and so on)
4. Accounting Equation
5. Final accounts and financial statements (including adjustments and ratios)
6. Salaries and wages
7. Value-added tax (VAt)
8. reconciliations (bank, debtors and creditors)
9. cost accounting (manufacturing, and so on)
10. Budgeting
11. indigenous bookkeeping (Grade 10 only)
12. Fixed assets
13. inventory
14. Ethics
15. internal control and internal auditing
4. The purpose of AccountingFrom CAPS documentAccounting learners will be able to:• record,analyseandinterpretfinancialandotherrelevantdatainorderto
make informed decisions• presentand/orcommunicatefinancialinformationeffectivelybyusing
GenerallyAcceptedAccountingPractices(GAAP)inlinewithcurrentdevelopments and legislation
• developanddemonstrateanunderstandingof fundamentalaccountingconcepts
• relateskills,knowledgeandvaluestoreal-lifesituationsinordertoensurethe balance between theory and practice, in order to enter the world of workand/ortomovetohighereducation,andtoencourageself-development

4 s e c t i o n 1 • i n t r o d u c t i o n
• organiseandmanagetheirownfinancesandactivitiesresponsibly and effectively
• applyprinciplestosolveproblemsinajudiciousandsystematicmannerinfamiliar and unfamiliar situations, thus developing the ability to identify and solve problems in the context of the various fields of Accounting
• developcritical,logicalandanalyticalabilitiesandthoughtprocessestoenable learners to apply skills to current and new situations
• developthefollowingcharacteristics:– ethical behaviour– sound judgement– thoroughness– orderliness– accuracy– neatness
• dealconfidentlywiththedemandsof anaccountingoccupationmanuallyand/orelectronically.
5. Time allocation for Accounting on the timetableFrom CAPS documentTheteachingtimeforAccountingis4hoursperweekpergradeonthetimetable, that is, for Grades 10, 11 and 12.
6. Requirements to offer Accounting as a subjectFrom CAPS documentIt is the responsibility of the school to provide the resources needed to offer Accounting as a subject.
6.1 Each learner should have: 6.1.1 A textbook 6.1.2 Accounting stationery or the Exercise Book 6.1.3 A calculator.
6.2 The teacher should have: 6.2.1 A variety of textbooks to be used as references 6.2.2 Policies,forexampleasummaryof theKingCodeIV 6.2.3 A partnership agreement 6.2.4 Legislation,forexampleCompaniesActNo.71of 2008 6.2.5 Codesof professionalbodies,forexampleSAICAandSAIPA
Codes 6.2.6 SARSbrochures 6.2.7 Bankbrochures 6.2.8 AccesstoacomputerandtheInternet. 6.2.9 Access to business reports and published financial statements
4

5s e c t i o n 1 • i n t r o d u c t i o n
7. Overview and progression of topics
toPic Grade 10 Grade 11 Grade 12
indigenous bookkeeping systems
comparison of bookkeeping systems of the informal and formal sectors
none none
ethics code of ethics and basic principles of ethics for businesses
identification and analysis of ethical behaviour applicable to financial environments with reference to accountability, transparency and sustainability
• Roleofprofessionalbodiesforaccountants
• Disciplinaryandpunitivemeasures for non-compliance with code of conduct
• Policiesgoverningethicalbehaviour, viz. King code iii
• Basicprinciplesofthecompanies Act
GAAP principles Applicable to sole traders Applicable to partnerships and non-profit organisations (clubs)
Applicable to companies
internal control Basic internal control processes demonstration of knowledge of internal audit processes, viz. division of duties, documentation, physical controls and internal audit
• Applicationofinternalcontroland internal audit processes in a business environment
• Understandingofthedifferencebetween the roles of internal and external auditors
Accounting concepts
concepts related to sole traders concepts related to partnerships and clubs
concepts related to companies and manufacturers
Bookkeeping Bookkeeping process for sole traders
unique entries and accounts for partnerships and clubs
unique entries and accounts for companies
reconciliations Preparation of debtors and creditors lists to reconcile with the debtors and creditors control accounts
Preparation of reconciliation statements by reconciling to bank and creditors statements
Analysis and interpretation of bank, debtors and creditors reconciliations and age analysis
Accounting equation
Analysis of transactions of sole traders
Analysis of transactions of partnerships and clubs
Analysis of transactions of companies
Value-added tax concepts of Value-added tax calculations of Value-added tax Ledger accounts of value-added tax
Salaries and wages
Explanation, calculation and recording of salary and wage scales, payments in the journals and posts to the ledger
none none
Fixed assets calculation and recording of depreciation
recording of acquisition and disposal of fixed assets
interpretation and reporting on movement, valuation and control of fixed assets
inventory Perpetual inventory system, concepts and entries in books
Explanationofthedifferencesbetween perpetual and periodic stock systems• Recordingoftransactionsusing
periodic inventory system
Validation and valuation of inventories using perpetual and periodic stock systems:• Specificidentification(ofcost
price per unit)• First-inFirst-out(FIFO)• Weightedaverage
Final accounts and financial statements
• Preparationoffinalaccountsofsole traders
• Preparation,analysisandinterpretation of financial statements of sole traders
• Preparationoffinalaccountsofpartnerships
• Preparation,analysisandinterpretation of financial statements of partnerships
• PreparationofStatementofreceipts and Payments for clubs
• Preparationofthefinancialstatements of clubs
• Differencesinfinancialstatements of partnerships and clubs
• Preparationoffinalaccountsofcompanies
• Preparation,analysisandinterpretation of financial statements of companies
cost accounting cost concepts and basic calculations
cost calculations and ledger accounts
Preparation, presentation, analysis and interpretation of Production cost Statement and unit costs
Budgeting Budget concepts Preparation and presentation of cash budgets and Projected income Statements of sole traders
Analysis, interpretation and comparison of cash budgets and Projected income Statements of sole traders and companies

6 s e c t i o n 1 • i n t r o d u c t i o n
8. What is assessment?From CAPS documentAssessment is a continuous planned process of identifying, gathering and interpreting information about the performance of learners, using various forms of assessment.
Assessment should be both formal and informal. In both cases, regular feedback should be provided to learners that enhance their learning experience.
8.1 informal assessmentInformal assessment is a daily monitoring of a learner’s progress. This is done through observations, discussions, practical demonstrations, learner-teacher conferences, informal classroom interactions, and so on. Informal assessment does not need to be recorded and learners or teachers can mark these assessment tasks.
Informal assessment is very important for learners to learn and reflect on their own performance and for teachers to identify learners who need support in certain areas of the work completed. Informal assessment tasks are in italics in theDailyTeachingPlaninSection 2: Planning of this Teacher’s Guide.
8.2 Formal assessmentAll assessment tasks that make up a formal programme of assessment for the yearareregardedasformalassessment.Formalassessmenttasksaremarkedand formally recorded by the teacher for progression and certification purposes. All formal assessment tasks are subject to moderation.
Aprogrammeof assessmentshouldbeincludedintheTeacher’sPortfolio.
Grade 11 programme of assessment
Term 1 Term 2 Term 3 Term 4
Form
of a
sses
smen
t
Wri
tten
repo
rt
test
Proj
ect
Mid
year
exa
min
atio
n
Pres
enta
tion
test
Year
-mar
k
Fina
l exa
min
atio
n
tota
l
Marks 50 100 marks;
1½ hours
50 300 (2 papers, 150 marks
each; 2 hours each)
50 100 marks;
1½ hours
300 (2 papers, 150 marks
each; 2 hours each)
convert to a mark out of:
10
( 50 __ 5 )
20
( 100 ___ 5 )
20
( 50 ___ 2.5 )
20
( 300 ___ 15 )
10
( 50 __ 5 )
20
( 100 ___ 5 )100 300 400
term weighting 25 75 25 75 25 75
8.3 Forms of assessmentDifferentformsof assessmentshouldbeusedasformalassessmenttasksduring the year.

7s e c t i o n 1 • i n t r o d u c t i o n
Information regarding types of formal assessment tasks and when each shouldbecompletedareunderlinedintheDailyTeachingPlaninSection 2: Planning of this Teacher’s Guide.
Examples of formal assessment tasks are provided in Section 3: Assessment in this Teacher’s Guide.
The following are examples of different forms of assessment.
8.3.1 Presentation
Presentationscanbewrittenororal,buttheremustbeevidenceof thepresentation. All criteria used to assess the presentation must be discussed with the learners prior to the commencement of the presentation. Where the resources are available, the use of electronic presentations should be encouraged.
8.3.2 Written report
A report is generally the written evidence of a survey, analysis or investigation. This will usually be shorter than a project and is specific as to thetopic.Forexample,abusinesshascometoyouforadviceonwhetherthebusiness is experiencing liquidity problems. Often it implies consulting with an expert for advice on some problem – therefore it links very closely with problem-solving.
8.3.3 case study
Learnersarepresentedwithareal-lifesituation,problemorincidentthatrelates to a particular topic. They are expected to assume a particular role in articulating the position. They draw on their own experience, the experience of peersorpriorlearningtointerpret,analyseandsolvetheproblem(s).
Newspaperarticles,magazinearticles,televisionorradiopresentationsprovideforexcellentcasestudies.Learnersreadand/orlisten,digesttheinformation and then make informed decisions. Questions can be from lower order – direct quotes from the article – to higher order, when they are asked toanalysecommentsandpossiblymakesuggestions.Casestudiesareaverygood way of keeping the subject up to date and relevant.
8.3.4 test
Two tests, written under controlled conditions, are prescribed for Grade 11. These tests should adhere to the following.• Testsarecompletedbyalllearnersinthesamegradeonthesameday.• Alllearnerswritethesametest.• Thetestsarecompletedunderexaminationconditions.• Questionscomplywithyear-endexaminationstandards.• Wherethereismorethanoneteacher,agreementisreachedonthescope,
as well as the date and time of the test.• Durationof eachof thesetestsisatleastoneandahalf hoursfor
100 marks.• Testscoverthedifferentcognitivelevels,asinthecaseof examinations.• Testsalsoinclude“problem-solving”skills.• Testscoverarangeof integratedtopics,asdeterminedbythework
schedule and assessment plan.
The two tests should be written in Terms 1 and 3.

8 s e c t i o n 1 • i n t r o d u c t i o n
8.3.5 Project
The project is mandatory and only one project is recommended per year. When preparing a project, consider the following minimum requirements.• Learnersaregiventhenecessaryguidancepriortocommencementof the
project and progress is monitored.• Certainaspectsof theprojectarecompletedinclasstoenableteachersto
monitor progress.• Allcriteriausedtoassessprojectarediscussedwithlearners.• Generally,projectsaregivenalongerperiodof timetocompleteasthey
involve some sort of research, consolidation and selection of relevant information and the preparation of a written document as evidence.
• Oftenprojectscaninvolvesolvingsomeformof problem.• Researchmayformpartof theproject–theprojectisevidenceof the
researchconducted.However,thismaynotalwaysbethecase.Forexample, the computerised accounting programme will not involve research but rather develop skills.
We suggest that the project is dealt with towards the end of the first term and handed in for submission during the second term.
8.3.6 examination
Examinations are dealt with extensively in Section 2: Planning of this Teacher’s Guide. However, here is some basic essential information with regards to examinations.
Problem-solving
Approximately 10% of all examinations should address problem-solving questions using critical and creative thinking. These include real-life problems within the context of the Accounting curriculum. The problem-solving questionsmustcoverarangeof cognitiveskills(asdiscussedinStep 5of How to set up an examination paper – Section 3: Assessment tasks).“Surface”problem-solving questions might involve recall or comprehension skills on familiarscenarios,while“deep”problem-solvingquestionswillgenerallyinvolve creative solutions in new and unfamiliar scenarios, all falling within the ambit of the Accounting curriculum.
While ratios and analysis can form very interesting problem-solving questions, the topic of problem-solving goes a lot further and should be integrated into all aspects of the curriculum as learners develop the skills to applytheknowledgeacquired.
Herearesomeguidelinesfordealingwith“deep”problem-solvingquestions.• Learnersidentifyproblemsfromtheaccountinginformationprovided.• Learnersquotetherelevantinformationtosupporttheiropinionsonthe
problems.• Learnersprovidevalidandappropriatesolutions.

9
Section 2
planning
s e c t i o n 2 • P l a n n i n g
Accounting Grade 11 Summary of Annual Teaching Plan
teRM
1
Wee
k 1
Wee
k 2
Wee
k 3
Wee
k 4
Wee
k 5
Wee
k 6
Wee
k 7
Wee
k 8
Wee
k 9
Wee
k 10
Topi
cRe
conc
iliat
ions
: Ban
k an
d Cr
edito
rsFi
xed
asse
ts: A
cqui
sitio
n an
d di
spos
alPa
rtne
rshi
ps: A
djus
tmen
ts, l
edge
r, Ac
coun
ting
Equa
tion,
Fina
l Acc
ount
s
Inte
grat
e In
tern
al c
ontr
ol a
nd e
thic
s with
all
the
topi
cs
Asse
ssm
ent
Writ
ten
repo
rt (F
ixed
ass
ets)
See
page
32
of th
is Te
ache
r’s G
uide
Test
on
Term
1 w
ork
See
page
38
of th
is Te
ache
r’s G
uide
teRM
2
Wee
k 1
Wee
k 2
Wee
k 3
Wee
k 4
Wee
k 5
Wee
k 6
Wee
k 7
Wee
k 8
Wee
k 9
Wee
k 10
Topi
cPa
rtne
rshi
ps: F
inan
cial
stat
emen
tsPa
rtne
rshi
ps: A
naly
sis a
nd
inte
rpre
tatio
n of
stat
emen
tsCo
st A
ccou
ntin
g (M
anuf
actu
ring)
Ledg
er
Mid
year
exa
min
atio
n
Inte
grat
e In
tern
al c
ontr
ol a
nd e
thic
s with
all
the
topi
cs
Asse
ssm
ent
Proj
ect (
Budg
ets)
See
page
s 59
and
61 o
f thi
s Tea
cher
’s G
uide
Mid
year
exa
min
atio
n
teRM
3
Wee
k 1
Wee
k 2
Wee
k 3
Wee
k 4
Wee
k 5
Wee
k 6
Wee
k 7
Wee
k 8
Wee
k 9
Wee
k 10
Topi
cBu
dget
ing:
Pro
ject
ed In
com
e St
atem
ent,
debt
ors c
olle
ctio
n an
d cr
edito
rs p
aym
ents
, Cas
h Bu
dget
sIn
vent
ory
syst
emCl
ubs:
Conc
epts
, Led
ger,
Stat
emen
t of R
ecei
pts a
nd
Paym
ents
Revi
sion
Inte
grat
e In
tern
al c
ontr
ol a
nd e
thic
s with
all
the
topi
cs
Asse
ssm
ent
Pres
enta
tion
(Bud
gets
or M
anuf
actu
ring)
See
page
s 23
and
30 o
f thi
s Tea
cher
’s G
uide
Test
on
Term
3 w
ork
See
page
49
of th
is Te
ache
r’s G
uide
teRM
4
Wee
k 1
Wee
k 2
Wee
k 3
Wee
k 4
Wee
k 5
Wee
k 6
Wee
k 7
Wee
k 8
Wee
k 9
Wee
k 10
Topi
cVa
lue-
adde
d ta
x (V
AT)
Revi
sion
and
exam
inat
ion
prep
arat
ion
Fina
l exa
min
atio
n
Inte
grat
e In
tern
al c
ontr
ol a
nd e
thic
s with
all
the
topi
cs
Asse
ssm
ent
Fina
l exa
min
atio
n
See
page
67
of th
is Te
ache
r’s G
uide
(Pap
ers 1
and
2)

10 s e c t i o n 2 • P l a n n i n g
Grade 11 AccountingDaily Teaching Plan
teRM 1Week 1 (Reconciliations)
Period 1 Internal controls and audit
Bank reconciliation
Talk about internal control, risk management and fundamental elements of internal control. Include internal audits and the internal audit procedure relating to cash.
Homework: Activity 3.1 and Case study on bank reconciliation pp.40–46
Textbook Chapter 2 pp.16–30
Textbook Chapter 3 pp.40–46
PowerPoint® presentation
Period 2 Bank reconciliation
Mark Activity 3.1.
Talk about internal controls for cash, p.50.
Do example in class pp.52–57.
Homework: Activity 3.2 p.58
Textbook Chapter 3 pp.40–60
PowerPoint® presentation
Period 3 Bank reconciliation
Mark Activity 3.2.
Do Activity 3.3 in class p.56.
Homework: Activities 3.4 and 3.5 p.63
Textbook Chapter 3 pp.58–66
PowerPoint® presentation
Period 4 Bank reconciliation
Mark Activities 3.4 and 3.5.
Do example in class p.67.
Homework: Activity 3.6 p.71
Textbook Chapter 3 pp.63–74
PowerPoint® presentation
Week 2 (Reconciliations)
Period 1 Bank reconciliation
Mark Activity 3.6.
Do Activity 3.7 in class p.71.
Homework: Activity 3.9 p.86
Textbook Chapter 3 pp.71–87
PowerPoint® presentation
Period 2 Bank reconciliation
Mark Activity 3.9.
Homework: Activity 3.10 p.87
Textbook Chapter 3 pp.78–89
PowerPoint® presentation
Period 3 Bank reconciliation
Mark Activity 3.10.
Homework: Activity 3.8 p.74
Textbook Chapter 3 pp.78–89
PowerPoint® presentation
Period 4 Bank reconciliation
Mark Activity 3.8.
Do Activity 3.11 in class p.85.
Homework: Activities 3.12 and 3.13 p.90
Textbook Chapter 3 pp.90–93
PowerPoint® presentation
Week 3 (Reconciliations)
Period 1 Bank reconciliation
Mark Activities 3.12 and 3.13.
Do Activity 3.14 in class p.91.
Textbook Chapter 3 pp.90–95
PowerPoint® presentation
Period 2 Bank reconciliation
Do informal assessment 3.1 on p.96 or informal assessment 3.2 on p.99 in class and mark. identify learners that need support with bank reconciliations.
Textbook Chapter 3 p.96
PowerPoint® presentation
Period 3 Internal controls and audit over creditors
Creditors reconciliation
Discuss internal controls and internal audit of credit purchases and creditors, as well as the risks involved with credit purchases.
Discuss possible mistakes and omissions.
Do example on pp.108–110 in class using PowerPoint® presentation.
Homework: Activities 4.1 p.110 and 4.2 p.111
Textbook Chapter 2 pp.28, 30
Textbook Chapter 4 pp.102–111
PowerPoint® presentation
Period 4 Creditors reconciliation
Mark Activities 4.1 and 4.4.
Homework: Activity 4.3 p.113
Textbook Chapter 4 pp.110–113
PowerPoint® presentation
11s e c t i o n 2 • P l a n n i n g
Week 4 (Reconciliations/Fixed assets)
Period 1 Creditors reconciliation
Mark Activity 4.3.
Do example in class p.113.
Homework: Activity 4.4 p.116
Textbook Chapter 4 pp.113–117
PowerPoint® presentation
Period 2 Creditors reconciliation
Mark Activity 4.4.
Homework: Activity 4.5 p.117
Textbook Chapter 4 pp.116–118
PowerPoint® presentation
Period 3 Creditors reconciliation
Mark Activity 4.5.
Homework: Activity 4.6 p.119
Textbook Chapter 4 pp.117–120
PowerPoint® presentation
Period 4 Internal controls and audit of fixed assets
Calculating depreciation
Discuss the role of the fixed assets manager on p.122, the asset register and methods of depreciation.
Homework: Activities 5.1 p.127 and 5.2 p.128
Textbook Chapter 5 pp.122–128
PowerPoint® presentation
Week 5 (Fixed assets)
Period 1 Entering depreciation in ledger
Note for fixed assets
Mark Activities 5.1 and 5.2.
Do Activity 5.3 in class p.128.
Homework: Activities 5.4 p.129 and 5.5 p.130
Textbook Chapter 5 pp.127–130
PowerPoint® presentation
Period 2 Asset disposal at the beginning of year
Mark Activities 5.4 and 5.5.
Discuss the recording of fully depreciated fixed assets.
Homework: Activity 5.6 p.131
Textbook Chapter 5 pp.129–131
PowerPoint® presentation
Period 3 Asset disposal at the beginning of year
Mark Activity 5.6.
Discuss example in class pp.132–136.
Do Activity 5.7 in class p.137.
Homework: Activity 5.10 p.139
Textbook Chapter 5 pp.132–139
PowerPoint® presentation
Period 4 Asset disposal at the end of a financial year
Mark Activity 5.10.
Discuss examples in class pp.139–143.
Do Activity 5.11 in class p.143.
Homework: Activity 5.12 p.144
Textbook Chapter 5 pp.139–145
PowerPoint® presentation
Week 6 (Fixed assets)
Period 1 Asset disposal during the financial year
Mark Activity 5.12.
Discuss example in class p.146.
Do Activity 5.14 in class p.151.
Homework: Activity 5.15 p.152
Textbook Chapter 5 pp.145–152
PowerPoint® presentation
Period 2 Asset disposal during the financial year
Mark Activity 5.15.
Discuss example in class pp.152–154.
Do Activity 5.16 in class p.154.
Homework: Activity 5.17 p.155
Textbook Chapter 5 pp.152–155
PowerPoint® presentation
Period 3 Fixed assets assessment task 1: Report on fixed assets
Mark Activity 5.17.
Homework: Activity 5.18 p.156
Textbook Chapter 5 pp.155–156
PowerPoint® presentation
Period 4 Fixed assets Mark Activity 5.18.
Homework: Activity 5.19 p.157
Textbook Chapter 5 pp.156–157
PowerPoint® presentation

12 s e c t i o n 2 • P l a n n i n g
Week 7 (Fixed assets/partnerships)
Period 1 Fixed assets Mark Activity 5.19.
Do informal assessment 5.1 on p.159 and mark. identify learners that need support with asset disposal.
Textbook Chapter 5 pp.157–159
PowerPoint® presentation
Period 2 Fixed assets – Note for fixed assets
Discuss example p.160.
Do Activity 5.20 in class p.161.
Homework: Activity 5.21 p.162
Textbook Chapter 5 pp.160–162
PowerPoint® presentation
Period 3 Fixed assets Mark Activity 5.21.
Do informal assessment 5.2 on p.163.
Homework: Activity 5.22 p.164
Textbook Chapter 5 pp.162–163
PowerPoint® presentation
Period 4 Partnerships – theory
Mark Activity 5.22.
Discuss partnerships: types, advantages, disadvantages etc. pp.166–172.
Do Activity 6.1 in class p.172.
Textbook Chapter 6 pp.164–172
PowerPoint® presentation
Week 8 (partnerships)
Period 1 Partnerships – ledger accounts
Discuss ledger accounts unique to a partnership on pp.172–181.
Do example in class pp.182–186.
Homework: Activity 6.2 p.186
Textbook Chapter 6 pp.172–187
PowerPoint® presentation
Period 2 Partnerships – ledger accounts
Mark Activity 6.2. Discuss problem areas.
Do Activity 6.3 in class p.187.
Homework: Activity 6.4 p.188
Textbook Chapter 6 pp.186–188
PowerPoint® presentation
Period 3 Partnerships – ledger accounts
Mark Activity 6.4.
Do Activity 6.5 in class p.189.
Homework: Activity 6.6 p.190
Textbook Chapter 6 pp.188–190
PowerPoint® presentation
Period 4 Partnerships – ledger accounts
Mark Activity 6.6.
Do informal assessment 6.1 on pp.190–191 in class.
Textbook Chapter 6 p.190
PowerPoint® presentation
Week 9 (partnerships)
Period 1 Partnerships – ledger accounts
Mark informal assessment 6.1 on pp.190–191. identify learners who need support with ledger accounts of partnerships.
Homework: Activity 6.7 p.191
Textbook Chapter 6 pp.190–191
PowerPoint® presentation
Period 2 Partnerships – ledger accounts
Mark Activity 6.7.
Do Activity 6.8 in class p.192.
Homework: Activity 6.9 p.192
Textbook Chapter 6 pp.191–193
PowerPoint® presentation
Period 3 Partnerships – GAAP principles and adjustments
Mark Activity 6.9.
Discuss GAAP principles pp.193–195
Discuss adjustments done in Grade 10 pp.196–198.
Do example in class pp.199–200.
Do Activity 6.10 in class pp.201–202.
Explain provision for bad debts p.202.
Do example in class p.203.
Homework: Activity 6.11 p.204
Textbook Chapter 6 pp.193–204
PowerPoint® presentation
Period 4 Provision for bad debts
Mark Activity 6.11.
Do example in class p.205.
Do Activity 6.12 in class p.206.
Homework: Activity 6.13 p.208
Textbook Chapter 6 pp.205–208
PowerPoint® presentation
Week 10 (partnerships)
Period 1 Provision for bad debts
Mark Activity 6.13.
Do Activity 6.14 in class p.209.
Hand out assessment task 3: Research project. Discuss the marking rubric and project in class. project to be handed in during term 2.
Textbook Chapter 6 pp.206–210
PowerPoint® presentation

13s e c t i o n 2 • P l a n n i n g
Period 2 Interest capitalised
Discuss interest capitalised on pp.210–217.
Homework: Activity 6.15 p.217
Textbook Chapter 6 pp.210–217
PowerPoint® presentation
Period 3 Partnerships – closing transfers and final accounts
Mark Activity 6.15.
Discuss closing transfers and final accounts p.218.
Homework: Activity 6.16 p.219
Textbook Chapter 6 pp.218–220
PowerPoint® presentation
Period 4 Reversal of adjustments
Mark Activity 6.16.
Discuss reversal of adjustments p.221.
Do example in class pp.221–223.
Do Activity 6.17 in class p.225.
Textbook Chapter 6 pp.221–226
PowerPoint® presentation
assessment task 2
Write control test during March test series – 100 marks / 1 1 __ 2 hours – on reconciliations, fixed assets and partnership ledger accounts – see section on assessment tasks for an example.
term 1: Formal assessment
Report: Fixed assets (Task 1) 50 marks
Control test (Task 2) 100 marks
teRM 2Week 1 (partnerships)
Period 1 Partnership – financial statements
Discuss the need for financial statements etc. pp.228–230.
Do example of financial statements in class pp.230–237.
Homework: Activity 7.1 p.237 Income Statement
Textbook Chapter 7 pp.228–237
PowerPoint® presentation
Period 2 Partnership – financial statements
Mark Activity 7.1 Income Statement.
Do Balance Sheet in class p.234.
Homework: Activity 7.2 p.237
Textbook Chapter 7 pp.234–237
PowerPoint® presentation
Period 3 Partnership – financial statements
Mark Activity 7.2.
Homework: Activity 7.3 p.240
Textbook Chapter 7 pp.238–240
PowerPoint® presentation
Period 4 Partnership – financial statements
Mark Activity 7.3.
Homework: Activity 7.4 p.242 General Ledger and Income Statement
Textbook Chapter 7 pp.241–243
PowerPoint® presentation
Week 2 (partnerships)
Period 1 Partnership – financial statements
assessment task 3: Discuss progress
Mark Activity 7.4 General Ledger and Income Statement.
Homework: Activity 7.4 p.243 Balance Sheet
Textbook Chapter 7 pp.243–245
PowerPoint® presentation
Period 2 Partnership – financial statements
Mark Activity 7.4 Balance Sheet.
Homework: Activity 7.5 p.245
Textbook Chapter 7 pp.245–247
PowerPoint® presentation
Period 3 Partnership – financial statements
Mark Activity 7.5.
Homework: Activity 7.6 p.248
Textbook Chapter 7 pp.248–250
PowerPoint® presentation
Period 4 Partnership – financial statements
Mark Activity 7.6.
Homework: Activity 7.7 p.251
Textbook Chapter 7 pp.251–253
PowerPoint® presentation

14 s e c t i o n 2 • P l a n n i n g
Week 3 (partnerships)
Period 1 Partnership – financial statements
Mark Activity 7.7.
Do informal assessment 7.1 on p.253 in class and mark. identify learners that need support.
Textbook Chapter 7 pp.253–254
PowerPoint® presentation
Period 2 Partnerships – analysis and interpretation
Discuss users of financial statements, and the analysis and interpretation of financial statements pp.260–266.
Do example in class p.267.
Homework: Activity 8.1 p.275
Textbook Chapter 8 pp.260–277
PowerPoint® presentation
Period 3 Partnerships – analysis and interpretation
Mark Activity 8.1. Discuss problem areas.
Homework: Activity 8.2 p.277
Textbook Chapter 8 pp.277–278
PowerPoint® presentation
Period 4 Partnerships – analysis and interpretation
Mark Activity 8.2. Discuss problem areas.
Homework: Activity 8.3 p.278
Textbook Chapter 8 pp.278–279
PowerPoint® presentation
Week 4 (partnerships)
Period 1 Partnerships – analysis and interpretation
Hand in assessment task 3: Research project
Mark Activity 8.3. Discuss problem areas.
Homework: Activity 8.4 p.279
Textbook Chapter 8 pp.279–282
PowerPoint® presentation
Period 2 Partnerships – analysis and interpretation
Mark Activity 8.4. Discuss problem areas.
Homework: Activity 8.5 p.282
Textbook Chapter 8 pp.282–283
PowerPoint® presentation
Period 3 Partnerships – analysis and interpretation
Mark Activity 8.5. Discuss problem areas.
Homework: Activity 8.6 p.284
Textbook Chapter 8 pp.284–285
PowerPoint® presentation
Period 4 Partnerships – analysis and interpretation
Mark Activity 8.6.
Homework: Activity 8.7 p.287
Textbook Chapter 8 pp.287–288
PowerPoint® presentation
Week 5 (partnerships)
Period 1 Partnerships – analysis and interpretation
Mark Activity 8.7. Discuss problem areas. Textbook Chapter 8 pp.287–288
PowerPoint® presentation
Period 2 Partnerships – analysis and interpretation
Do informal assessment 8.1 on p.286 in class and mark. identify learners that need support.
Textbook Chapter 8 p.286
PowerPoint® presentation
Week 6 (cost accounting)
Period 1 Cost accounting – theory
Discuss theory of cost accounting pp.338–340.
Do Activity 10.1 in class orally p.340.
Do example in class p.342.
Homework: Activity 10.2 p.343
Textbook Chapter 10 pp.338–343
PowerPoint® presentation
Period 2 Cost accounting – break-even analysis
Mark Activity 10.2.
Discuss fixed and variable costs pp.343–345.
Do Activity 10.3 in class orally p.346.
Homework: Activities 10.4 and 10.5 p.348
Textbook Chapter 10 pp.343–348
PowerPoint® presentation
Period 3 Cost accounting – break even analysis
Mark Activities 10.4 and 10.5.
Discuss break-even analysis p.348.
Do example in class pp.348–349.
Homework: Activity 10.6 p.350
assessment task 5: go on a field trip to a local factory. Hand out report assignment.
Textbook Chapter 10 pp.348–350
PowerPoint® presentation

15s e c t i o n 2 • P l a n n i n g
Period 4 Cost accounting – break even analysis
Mark Activity 10.6.
Do Activity 10.7 in class p.350.
Homework: Activities 10.8 p.350 and 10.9 p.351
Textbook Chapter 10 pp.350–351
PowerPoint® presentation
Week 7 (cost accounting)
Period 1 Cost accounting – break-even analysis
Manufacturing accounts
Mark Activities 10.8 and 10.9.
Discuss manufacturing accounts pp.352–355.
Do example in class pp.355–357.
Homework: Activity 10.10 p.358
Textbook Chapter 10 pp.352–358
PowerPoint® presentation
Period 2 Cost accounting – manufacturing accounts
Mark Activity 10.10.
Homework: Activity 10.11 p.359
Textbook Chapter 10 p.359
PowerPoint® presentation
Period 3 Cost accounting – manufacturing accounts
Mark Activity 10.11.
Discuss Cost of Sales account p.360.
Homework: Activity 10.12 p.361
Textbook Chapter 10 pp.360–361
PowerPoint® presentation
Period 4 Cost accounting – manufacturing accounts
Mark Activity 10.12.
Discuss closing transfers pp.361–362.
Do example in class pp.363–370.
Do Activity 10.13 in class p.373.
Homework: Activity 10.14 p.375
Textbook Chapter 10 pp.363–377
PowerPoint® presentation
Week 8 (cost accounting)
Period 1 Cost accounting – manufacturing accounts
Mark Activity 10.14
Homework: Activity 10.15 p.369
assessment task 5: Hand in assignment – report on manufacturing.
Textbook Chapter 10 pp.377–378
PowerPoint® presentation
Period 2 Cost accounting – manufacturing accounts
Mark Activity 10.15.
Homework: Activity 10.16 p.380
Textbook Chapter 10 pp.380–381
PowerPoint® presentation
Period 3 Cost accounting – manufacturing accounts
Mark Activity 10.16.
Discuss ethics and internal control and auditing with regards to manufacturing pp.385–392.
Homework: Activity 10.17 p.381
Textbook Chapter 10 pp.385–392
PowerPoint® presentation
Period 4 Cost accounting
Mark Activity 10.17.
Do informal assessment 10.1 on p.384 in class and mark. Identify learners that need support.
Textbook Chapter 10 pp.384–385
PowerPoint® presentation
Revision Hand out revision activities and solutions forlearners to do in preparation for the examination.
Textbook Chapter 14pp.492–511
Weeks 9–10
papeR 1: Discipline 1Financial reporting and evaluation150 marks (2 hours)
papeR 2: Discipline 2Managerial accounting and internal control 150 marks (2 hours)
term 2: Formal assessment
Research project (Task 3) 50 marks
Mid-year examination – two papers of 2 hours each on two separate days (Task 4)
300 marks

16 s e c t i o n 2 • P l a n n i n g
teRM 3Week 1 (Budgeting)
Period 1 Cash Budget Discuss the importance of budgets p.394.
Do Activities 11.1 p.394 and 11.2 p.397 in class.
Homework: Activity 11.3 p.398
Textbook Chapter 11 pp.394–398
PowerPoint® presentation
Period 2 Cash Budget
Debtors collection schedule
Creditors payments schedule
Mark Activity 11.3.
Discuss debtors collection and creditors payments schedules p.399.
Do example on pp.399–400.
Homework: Activity 11.4 p.401
Textbook Chapter 11 pp.399–401
PowerPoint® presentation
Period 3 Debtors collection schedule
Creditors payments schedule
Mark Activity 11.4.
Do Activity 11.5 in class p.401.
Homework: Activity 11.6 p.403
Textbook Chapter 11 pp.401–403
PowerPoint® presentation
Period 4 Debtors collection schedule
Creditors payments schedule
Mark Activity 11.6.
Do Activity 11.7 in class p.403.
Textbook Chapter 11 p.403
PowerPoint® presentation
Week 2 (Budgeting)
Period 1 Cash Budget Do example of Cash Budget pp.404–405.
Homework: Activity 11.8 p.406
Textbook Chapter 11 pp.404–407
PowerPoint® presentation
Period 2 Cash Budget Mark Activity 11.8.
Homework: 11.9 p.407
Textbook Chapter 11 p.407
PowerPoint® presentation
Period 3 Cash Budget Mark Activity 11.9.
Discuss replenishing of stock p.408.
Do Activity 11.10 in class p.409.
Homework: Activity 11.11 p.410
Textbook Chapter 11 pp.408–411
PowerPoint® presentation
Period 4 Cash Budget Mark Activity 11.11.
Homework: Activity 11.12 p.411
Textbook Chapter 11 pp.411–412
PowerPoint® presentation
Week 3 (Budgeting)
Period 1 Cash Budget
Projected Income Statement
Mark Activity 11.12.
Discuss Projected Income Statement and example pp.412–415.
Homework: Activity 11.13 p.416
Textbook Chapter 11 pp.412–417
PowerPoint® presentation
Period 2 Projected Income Statement
Mark Activity 11.13.
Homework: Activity 11.14 p.417
Textbook Chapter 11 pp.417–418
PowerPoint® presentation
Period 3 Projected Income Statement
Ethics and internal controls
Mark Activity 11.14.
Discuss ethical challenges and internal control and audit pp.420–424
Textbook Chapter 11 pp.420–424
PowerPoint® presentation
Period 4 Budgets Do informal assessment 11.1 on p.425 and mark. Identify learners that need support with budgets.
Textbook Chapter 11 pp.425–426
PowerPoint® presentation

17s e c t i o n 2 • P l a n n i n g
Week 4 (inventory systems)
Period 1 Inventory systems
Internal controls and audit
Discuss internal controls and audit over inventory p.33.
Discuss inventory systems and stock validation pp.428–432.
Do Activity 12.1 in class p.433.
Homework: Activities 12.2 p.433 and 12.3 p.434
Textbook Chapter 2 p.33 and Chapter 12 pp.428–434
PowerPoint® presentation
Period 2 Inventory systems
Mark Activities 12.2 and 12.3.
Do Activity 12.4 in class pp.434–436.
Homework: Activity 12.5 p.436
Textbook Chapter 12 pp.433–438
PowerPoint® presentation
Period 3 Inventory systems
Mark Activity 12.5.
Discuss ledger accounts pp.438–441.
Homework: Activity 12.6 p.441
Textbook Chapter 12 pp.438–442
PowerPoint® presentation
Period 4 Inventory systems
Mark Activity 12.6.
Do Activity 12.7 in class p.444.
Homework: Activity 12.8 p.445
Textbook Chapter 12 pp.443–446
PowerPoint® presentation
Week 5 (inventory systems)
Period 1 Inventory systems
Mark Activity 12.8.
Discuss year-end closing transfers pp.446–448.
Do example in class pp.448–451.
Homework: Activity 12.9 p.452
Textbook Chapter 12 pp.446–454
PowerPoint® presentation
Period 2 Inventory systems
Mark Activity 12.9.
Homework: Activity 12.10 p.454
Textbook Chapter 12 p.454
PowerPoint® presentation
Period 3 Inventory systems
Mark Activity 12.10.
Homework: Activity 12.11 p.455
Textbook Chapter 12 p.455
PowerPoint® presentation
Period 4 Inventory systems
Mark Activity 12.11.
Homework: Activity 12.12 p.456
Textbook Chapter 12 pp.456–457
PowerPoint® presentation
Week 6 (inventory systems)
Period 1 Inventory systems
Mark Activity 12.12.
Homework: Activities 12.13 p.457 and 12.14 p.458
Textbook Chapter 12 pp.457–458
PowerPoint® presentation
Period 2 Inventory systems
Mark Activities 12.13 and 12.14.
Homework: Informal assessment 12.1 p.459 or 12.2 p.460
Textbook Chapter 12 pp.459–460
PowerPoint® presentation
Period 3 Inventory systems
Ethics, internal controls and audit
Do informal assessment 12.1 or 12.2 on p.459/460 and mark. Identify learners that need support with inventory systems.
Discuss ethics, internal control and audit Chapter 1–2.
Textbook Chapter 12 pp.459–460
PowerPoint® presentation
Period 4 Ethics, internal controls and audit
Discuss ethics, risks, internal control and audit Chapter 1–2.
Textbook Chapters 1–2
PowerPoint® presentation

18 s e c t i o n 2 • P l a n n i n g
Week 7 (clubs)
Period 1 Clubs Discuss theory of clubs pp.290–294. Textbook Chapter 9 pp.290–294
PowerPoint® presentation
Period 2 Clubs – Analysis Cash Book
Do example of Analysis Cash Book in class p.294.
Homework: Activity 9.1 p.296
Textbook Chapter 9 pp.294–297
PowerPoint® presentation
Period 3 Clubs – Analysis Cash Book
Mark Activity 9.1. Discuss problem areas.
Homework: Activity 9.2 p.298
Textbook Chapter 9 pp.298–299
PowerPoint® presentation
Period 4 Clubs – Analysis Cash Book
Mark Activity 9.2. Discuss problem areas.
Do example of Membership Fees account in class p.300.
Homework: Activity 9.3 p.301
Textbook Chapter 9 pp.300–301
PowerPoint® presentation
Week 8 (clubs)
Period 1 Clubs – Membership Fees account
Mark Activity 9.3.
Do Activity 9.4 in class p.302.
Homework: Activities 9.5 p.302 and 9.6 p.303
Textbook Chapter 9 pp.302–303
PowerPoint® presentation
Period 2 Clubs – Statement of Receipts and Payments
Mark Activities 9.5 and 9.6.
Do example of Statement of Receipts and Payments in class p.304.
Homework: Activity 9.7 p.306
Textbook Chapter 9 pp.304–307
PowerPoint® presentation
Period 3 Clubs Mark Activity 9.7. Discuss problem areas.
Homework: Activity 9.8 p.307
Textbook Chapter 9 pp.307–309
PowerPoint® presentation
Period 4 Clubs Mark Activity 9.8. Discuss problem areas.
Homework: Activity 9.9 p.309
Textbook Chapter 9 pp.309–310
PowerPoint® presentation
Week 9–10 (Revision)
Period 1 Revision Revision according to the need of the learners Textbook Chapter 14
Period 2 Revision Revision according to the need of the learners Textbook Chapter 14
Period 3 Revision Revision according to the need of the learners Textbook Chapter 14
Period 4 Revision Revision according to the need of the learners Textbook Chapter 14
assessment task 6
This should be done towards the end of the third term (September test series)
Control test – 1½ hours/100 marks – Cost accounting, budgeting or inventory systems
term 3: Formal assessment
Presentation (budgets) (Task 5) 50 marks
Control test (Task 6) 100 marks

19s e c t i o n 2 • P l a n n i n g
teRM 4Week 1 (Vat)
Period 1 VAT Discuss basic principles of VAT pp.462–470.
Homework: Activity 13.1 p.471
Textbook Chapter 13 pp.462–471
Period 2 VAT Mark Activity 13.1.
Discuss VAT calculations pp.471–475.
Do Activity 13.2 in class p.475.
Homework: Activity 13.3 p.475
Textbook Chapter 13 pp.471–475
Period 3 VAT Mark Activity 13.3.
Do Activity 13.4 in class p.475.
Homework: Activity 13.5 p.476
Textbook Chapter 13 pp.475–477
Period 4 VAT Mark Activity 13.5.
Discuss further principles of VAT pp.478–481.
Homework: Activity 13.6 p.482
Textbook Chapter 13 pp.478–482
Week 2 (Vat)
Period 1 VAT Mark Activity 13.6.
Discuss tax invoices pp.483–485.
Homework: Activity 13.7 p.485
Textbook Chapter 13 pp.483–485
Period 2 VAT Mark Activity 13.7.
Discuss VAT adjustments pp.478–483.
Homework: Activities 13.8 p.492; 13.9 p.492, 13.10 p.493, 13.11 p.493
Textbook Chapter 13 pp.486–494
Period 3 VAT
Ethics, internal controls and auditing
Mark Activities 13.8–13.11.
Discuss ethics and do Case study 13.1 in class orally pp.494–496.
Discuss risks, internal controls and auditing of VAT pp.497–500.
Textbook Chapter 13 pp.497–500
Period 4 VAT Do informal assessment 13.1 on p.500 and mark. Identify learners that need support with VAT calculations.
Textbook Chapter 13 p.500
Week 3 (Revision exercises)
Period 1 Revision exercises
Bank reconciliation Textbook Chapter 14 pp.502–506
Period 2 Revision exercises
Creditors reconciliation Textbook Chapter 14 pp.506–507
Period 3 Revision exercises
Fixed assets Textbook Chapter 14 pp.508–511
Period 4 Revision exercises
Partnership – accounts in General Ledger Textbook Chapter 14 pp.512–513
Week 4 (Revision exercises)
Period 1 Revision exercises
Partnerships – financial statements Textbook Chapter 14 pp.514–516
Period 2 Revision exercises
Partnerships – financial statements Textbook Chapter 14 pp.514–516
Period 3 Revision exercises
Partnerships – analysis and interpretation of financial statements
Textbook Chapter 14 pp.516–517
Period 4 Revision exercises
Clubs Textbook Chapter 14 pp.517–522
Week 5 (Revision exercises)
Period 1 Revision exercises
Cost accounting Textbook Chapter 14 pp.522–524
Period 2 Revision exercises
Budgets Textbook Chapter 14 pp.525–529

20 s e c t i o n 2 • P l a n n i n g
Period 3 Revision exercises
Inventory systems Textbook Chapter 14 pp.529–532
Period 4 Revision exercises
VAT Textbook Chapter 14 pp.532–534
Week 6 (Revision exercises)
Period 1 Revision exercises
Work out exemplar papers Teacher’s Guide/ Exemplar papers from departmentPeriod 2 Revision
exercisesWork out exemplar papers
Period 3 Revision exercises
Work out exemplar papers
Period 4 Revision exercises
Work out exemplar papers
Weeks 7–9
assessment task 7
papeR 1: Discipline 1Financial reporting and evaluation150 marks (2 hours)
papeR 2: Discipline 2Managerial accounting and internal control 150 marks (2 hours)
term 4: Formal assessment
End-of-year examination – two papers of 2 hours each on two separate days (Task 7)
300 marks

21
Section 3
aSSeSSment taSkS
s e c t i o n 3 • a s s e s s m e n t ta s k s
1. PreSentationS/rePortS
PresentationPresentations can be written or oral, but there must be evidence of the presentation. All criteria used to assess the presentation must be discussed with the learners prior to the commencement of the presentation. Where the resources are available, use of electronic presentations should be encouraged.
We suggest, however, that the teacher use a marking rubric to assess the presentation.
Written reportA report is generally the written evidence of a survey, analysis or investigation. This will usually be shorter than a project and is specific to the topic, for example, a business has come to you for advice on whether the business is experiencing liquidity problems. Often it implies consulting with an expert for advice on some problem – therefore it links very closely with problem-solving.
Learners can also be asked to write a report after a field trip, for example after visiting a local factory.
Suggestions• Theseassessmenttasksshouldbedoneinthefirstandthirdterm.• Learnerscanbedividedingroupsof twoorthree,oritcanbedone
individually.• Theteachershoulddiscusstherequirementsandmarkingrubricwiththe
learners when handing out the task.• Learnerscancompletethepresentation/reportathome,buttheteacher
should monitor their progress.• Theminimumtotalforthepresentation/reportshouldbe50marks.

22 s e c t i o n 3 • a s s e s s m e n t ta s k s
To the teacher:Included in this file are the following two assessment tasks:
1. Written report on fixed assets This report should be done in the first term, but only after the learners
have covered the section on fixed assets. It should be done in class individually, but learners can use their Learner’s Book for reference.
2. Presentation on budgeting and Cost Accounting This is a wonderful assessment task as it gives the learners a lot more
insight into the manufacturing process and helps them bring theory and practice together. Once they have done this assessment task, the manufacturing accounts and calculations make sense because now they have pictures in their minds of what raw material and work-in-progress looks like.
Learners love to go on a field trip and this can actually be done in an hour, if you have a factory close to your school.
Give the assessment task to the learners before they go on the field trip and let them decide beforehand who is going to ask which questions, so that they can gather all the information. This should be done in the third term – it can be done before or while they are busy with this section.

23s e c t i o n 3 • a s s e s s m e n t ta s k s
Assessment task: Presentation (to be done in Term 3) To be handed out to the learners
Budgeting and cost accountingmarks: 50 time: 6 hours
Your uncle owns a business called Nice ‘n Cool Suppliers that manufactures solar-powered fans. The business currently supplies fans to a number of stores across South Africa. Your uncle recently returned from a trade fair in America and has been approached by an American company that is interested inordering4000fanspermonth,startinginMarch2016.Youruncleisveryexcited but is not too sure if it will be worth his while financially. He has asked you to help him decide whether to go ahead and accept the order.
HehasalreadypreparedaCashBudgetforthenextthreemonths(MarchtoMay2016)fortheSouthAfricanmarket(thisexcludestheorderfromAmerica).YourunclewouldlikeyoutoprepareaCashBudgetforthenextthree months, which includes the overseas order. He is also particularly interested in what his options are for managing potential cash-flow problems, what the break-even point will be and the risks associated with taking on the order from America. He intends to make a decision regarding the new order, based on the information you provide.
information
The Cash Budget excluding the order from America:
nice ‘n cool Supplierscash Budget for the period 1 march 2016 to 31 may 2016
mar 2016 apr 2016 may 2016
receiPtS
Cash sales 140 000 148 000 162 000
Cash from debtors 150 000 155 000 140 000
Interest on fixed deposit (500 000 × 8% × ¼) – 10 000 –
totaL receiPtS 290 000 313 000 302 000
PaYmentS
Cash purchases of raw materials 21 000 22 200 24 300
Payments to creditors for raw materials 69 750 63 000 66 600
Production operating expenses 42 000 42 000 42 000
Production salaries 55 000 55 000 55 000
manager's salary 15 000 15 000 15 000
Rent 18 000 18 000 18 000
Fixed deposit – – 250 000
totaL PaYmentS 220 750 215 200 470 900
CasH sURPLUs/DeFICIt 69 250 97 800 (168 900)
BaLanCe at BeGInnInG OF mOntH 123 800 193 050 290 850
caSH on HanD at enD oF montH 193 050 290 850 121 950
actual Budgeted
Jan Feb mar apr may
sales 300 000 310 000 280 000 296 000 324 000
Purchase of raw materials 90 000 93 000 84 000 88 800 97 200

24 s e c t i o n 3 • a s s e s s m e n t ta s k s
the following information relates to the budget above: • ThebusinesssellsthefanstolocalretailersatR120each.• Thebusinessmaintainsafixedstockbaseof rawmaterials.Inotherwords,
at the end of each month the business buys an amount of raw materials equal to the amount used in the goods that were sold during that month.
• Thebusinessemploystenfactoryworkers,whoworkdirectlyintheproductionof thefans,atasalaryof R5500eachpermonth.
the following information relates to the order from america: • Yourunclewillneedtoemployafurthereightfactoryworkerstoworkon
theproductionline.Theywilleachbepaidthesamemonthlysalaryof R5500.• Anadditionalsupervisorwillhavetobeemployedatasalaryof R10000
per month. • Thesupplierof therawmaterialshasconfirmedthathewillbeableto
supply all the raw materials necessary to fulfil the order from America. He hasalsoagreedtogivea5%tradediscountonthetotalpurchasesif theorderexceedsR125000permonth.Thepaymenttermswillbethesameas they are at present.
• Youwillneedtorentextraspaceinordertoproducetheadditionalfansatacostof R12000permonth.
• Itisestimatedthattheproductionoperatingexpenseswillincreaseby30%per month.
• ItwillcostNice‘nCoolSuppliersR20perfantotransportthemtoAmericaplusanadditionalchargeof R4perfanforinsurance.
• ThecompanyinAmericaispreparedtopayUS$20foreachfanandwillsettletheiraccountwithin60days.
• Extramachinerywillhavetobebought(forcash)atacostof R600000.• Inordertofinancethepurchaseof theextramachinery,Nice‘nCool
Suppliersintendstotakeoutaloanatthebeginningof Marchtothevalueof 80%of thecostof themachinery,ataninterestrateof 18%perannum.Theloanwillneedtoberepaidin12equalmonthlyinstalmentsstartingon31March2016.
requiredComplete the following in the form of a written presentation:
1.CompleteaCashBudgetforthethree-monthperiodfortheAmericanorderonly.AssumethatproductionwillstartinMarch2016.Youcanuseanexchangerateof US$1=R8.
2.DrawupacombinedCashBudgetshowingtheamountsforlocalproduction plus the American order.
3.ThecombinedCashBudgetindicatesthatthebusinesswillencountercash-flowproblemsinMarchandApril2016.Provideyourunclewithsome advice by outlining various options that he could consider to overcome this cash-flow problem.
4.Determinethebreak-evenpointfortheproductionoverthethree-monthperiodMarchtoMay2016for:• theSouthAfricanmarket• theAmericanorder.
5.Basedonthebudgetsthatyouhavepreparedandyourbreak-evenpoint calculations, advise your uncle as to whether he should accept the American order or not.
6.Drawatableinwhichyououtlinesomeof therisksassociatedwith the order from America and provide recommendations for controlling these risks.
25s e c t i o n 3 • a s s e s s m e n t ta s k s
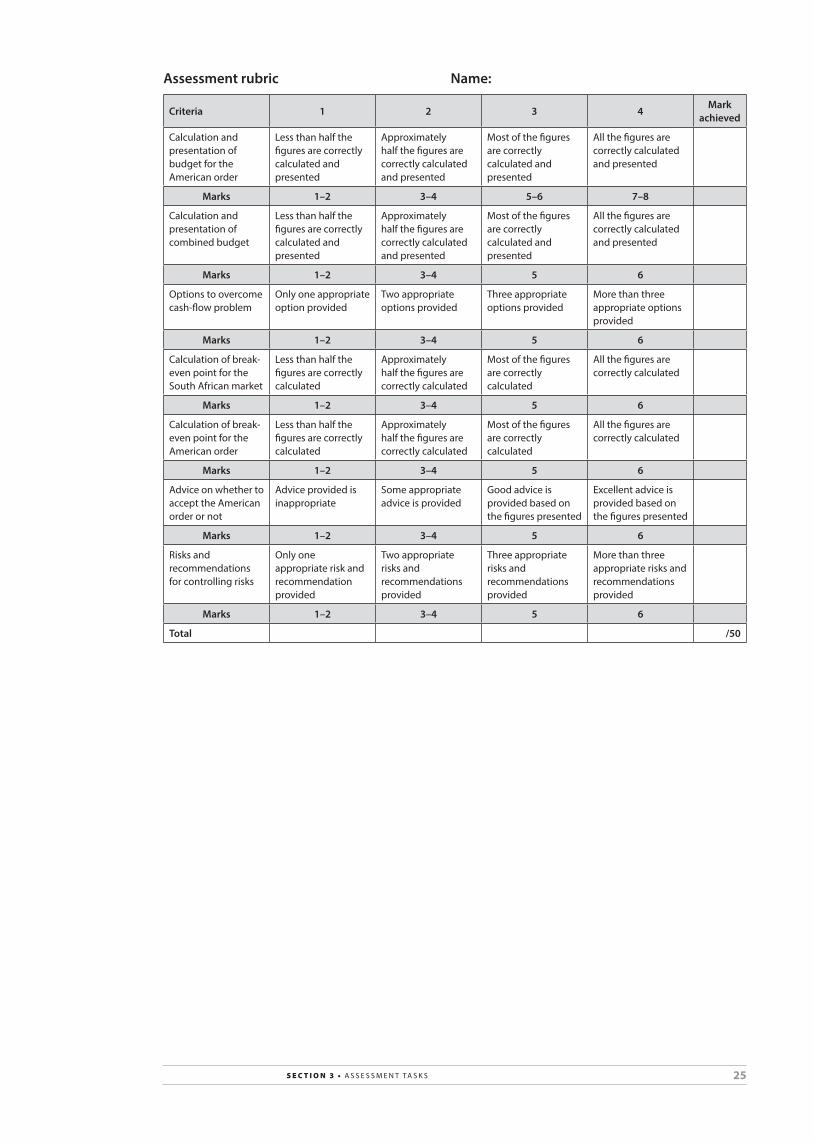
assessment rubric name:
criteria 1 2 3 4mark
achieved
Calculation and presentation of budget for the american order
Less than half the figures are correctly calculated and presented
approximately half the figures are correctly calculated and presented
most of the figures are correctly calculated and presented
all the figures are correctly calculated and presented
marks 1–2 3–4 5–6 7–8
Calculation and presentation of combined budget
Less than half the figures are correctly calculated and presented
approximately half the figures are correctly calculated and presented
most of the figures are correctly calculated and presented
all the figures are correctly calculated and presented
marks 1–2 3–4 5 6
Options to overcome cash-flow problem
Only one appropriate option provided
two appropriate options provided
three appropriate options provided
more than three appropriate options provided
marks 1–2 3–4 5 6
Calculation of break-even point for the south african market
Less than half the figures are correctly calculated
approximately half the figures are correctly calculated
most of the figures are correctly calculated
all the figures are correctly calculated
marks 1–2 3–4 5 6
Calculation of break-even point for the american order
Less than half the figures are correctly calculated
approximately half the figures are correctly calculated
most of the figures are correctly calculated
all the figures are correctly calculated
marks 1–2 3–4 5 6
advice on whether to accept the american order or not
advice provided is inappropriate
some appropriate advice is provided
Good advice is provided based on the figures presented
excellent advice is provided based on the figures presented
marks 1–2 3–4 5 6
Risks and recommendations for controlling risks
Only one appropriate risk and recommendation provided
two appropriate risks and recommendations provided
three appropriate risks and recommendations provided
more than three appropriate risks and recommendations provided
marks 1–2 3–4 5 6
total /50

26 s e c t i o n 3 • a s s e s s m e n t ta s k s
Possible answers For teacher’s reference
1. cash Budget for the american order only:
nice ‘n cool Supplierscash Budget for the period 1 march 2016 to 31 may 2016
mar 2016 apr 2016 may 2016
receiPtS
Cash sales – – –
Cash from debtors [($20 × R8) × 4 000] – – 640 000
Loan (600 000 × 80%) 480 000 – –
totaL receiPtS 480 000 – 640 000
PaYmentS
Cash purchases of raw materials (136 800 × 25%) 34 200 34 200 34 200
Payments to creditors for raw materials (136 800 × 75%) – 102 600 102 600
Production operating expenses (42 000 × 30%) 12 600 12 600 12 600
Production salaries (5 500 × 8) 44 000 44 000 44 000
manager's salary 10 000 10 000 10 000
Rent 12 000 12 000 12 000
transport and insurance [(20 + 4) × 4 000] 96 000 96 000 96 000
machinery 600 000 – –
Loan instalments (480 000 ÷ 12) 40 000 40 000 40 000
Interest on loan 7 200 6 600 6 000
totaL PaYmentS 856 000 358 000 357 400
CasH sURPLUs/DeFICIt (376 000) (358 000) 282 600
BaLanCe at BeGInnInG OF mOntH (376 000) (734 000)
caSH on HanD at enD oF montH (376 000) (734 000) (451 400)
calculations• Cash sales: All sales to America are on credit.• Cash from debtors:SalesforMarch2016willbereceivedinMay2016.• Raw materials:
– Rawmaterialsasapercentageof sales
=R90000 ________ R300000 or R93000 ________ R310000 or R84000 ________ R280000etc.=30%
– Cost of raw materials per unit =R120×30%=R36
– Cost of raw materials per month =(R36×4000)×95%=R144000×95%=R136800
– %of rawmaterialspurchasedforcash
=R21000 _______ R84000 or R22200 _______ R88800 or R24300 _______ R97200=25%
– The supplier of raw materials is paid in the month following the purchase.
27s e c t i o n 3 • a s s e s s m e n t ta s k s
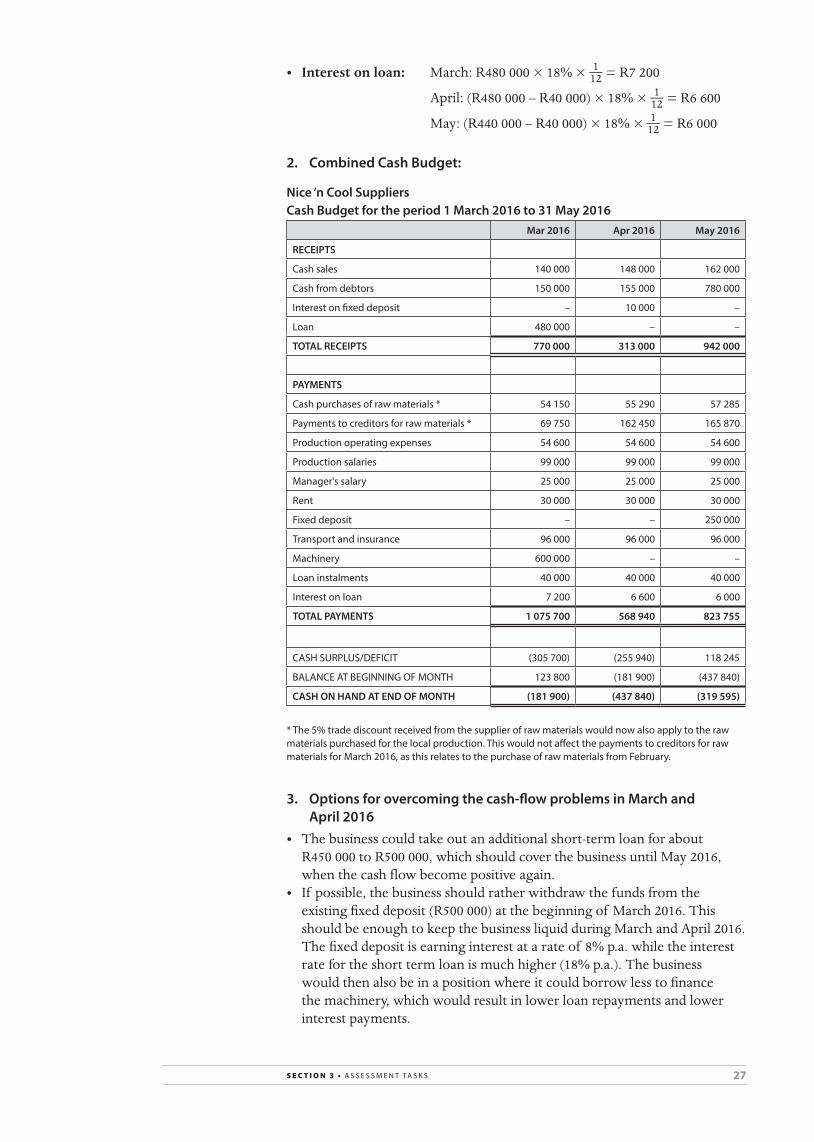
• Interest on loan: March:R480000×18%×1 __ 12 =R7200
April:(R480000–R40000)×18%×1 __ 12 =R6600
May:(R440000–R40000)×18%×1 __ 12 =R6000
2. combined cash Budget:
nice ‘n cool Supplierscash Budget for the period 1 march 2016 to 31 may 2016
mar 2016 apr 2016 may 2016
receiPtS
Cash sales 140 000 148 000 162 000
Cash from debtors 150 000 155 000 780 000
Interest on fixed deposit – 10 000 –
Loan 480 000 – –
totaL receiPtS 770 000 313 000 942 000
PaYmentS
Cash purchases of raw materials * 54 150 55 290 57 285
Payments to creditors for raw materials * 69 750 162 450 165 870
Production operating expenses 54 600 54 600 54 600
Production salaries 99 000 99 000 99 000
manager's salary 25 000 25 000 25 000
Rent 30 000 30 000 30 000
Fixed deposit – – 250 000
transport and insurance 96 000 96 000 96 000
machinery 600 000 – –
Loan instalments 40 000 40 000 40 000
Interest on loan 7 200 6 600 6 000
totaL PaYmentS 1 075 700 568 940 823 755
CasH sURPLUs/DeFICIt (305 700) (255 940) 118 245
BaLanCe at BeGInnInG OF mOntH 123 800 (181 900) (437 840)
caSH on HanD at enD oF montH (181 900) (437 840) (319 595)
* the 5% trade discount received from the supplier of raw materials would now also apply to the raw materials purchased for the local production. this would not affect the payments to creditors for raw materials for march 2016, as this relates to the purchase of raw materials from February.
3. options for overcoming the cash-flow problems in march and
april 2016• Thebusinesscouldtakeoutanadditionalshort-termloanforabout
R450000toR500000,whichshouldcoverthebusinessuntilMay2016,when the cash flow become positive again.
• If possible,thebusinessshouldratherwithdrawthefundsfromtheexistingfixeddeposit(R500000)atthebeginningof March2016.ThisshouldbeenoughtokeepthebusinessliquidduringMarchandApril2016.Thefixeddepositisearninginterestatarateof 8%p.a.whiletheinterestratefortheshorttermloanismuchhigher(18%p.a.).Thebusinesswould then also be in a position where it could borrow less to finance the machinery, which would result in lower loan repayments and lower interest payments.

28 s e c t i o n 3 • a s s e s s m e n t ta s k s
• Thebusinesscouldrequestanoverdraftfacilityfromitsbankof aboutR450000toR500000forashorttermof aboutthreemonths.If thebusinesstakesthisoptionthenitshouldnottransfertheR250000tothefixeddepositinMay,butratherusethisamounttoreducetheoverdraft.The business should then be able to pay off the overdraft by the end of June2016,whenitreceivesthesecondpaymentfromAmerica.
• ThebusinessmaybeabletohiretheextramachineryforthefirstfewmonthsandthenpurchasethemachineryinMayorJune2016,onceitsliquidity is more favourable.
4. Break-even point for the production for march to may 2016
• South African market
Totalsales=R280000+296000+324000=R900000
Totalvariablecost=Rawmaterials+Productionsalaries =(R84000+88800+97200)+(R55000×3) =R270000+165000 =R435000
Totalfixedcost=Productionoperatingexpenses+Manager’ssalary+Rent =(R42000+15000+18000)×3 =R75000×3 =R225000
Totalnumberof unitsold=R900000 ________ R120 =R7500
Variablecostperunit=R435000 ________ 7500 =R58,00
Contribution=Sellingpriceperunit–Variablecostperunit =R120–58 =R62
Break-evenpoint=Total fixed costs ___________ Contribution =R225000 ________ R62 ≈3629units
• American market
Totalvariablecost=Rawmaterials+Productionsalaries+Transport&insurance =(R136800+44000+96000)×3 =R276800×3 =R830400
Totalfixedcost=Productionoperatingexpenses+Manager’ssalary+Rent =(R12600+10000+12000)×3 =R34600×3 =R103800
Totalnumberof unitsold=4000×3=12000
Variablecostperunit=R830400 ________ 12000 =R69,20

29s e c t i o n 3 • a s s e s s m e n t ta s k s
Contribution=Sellingpriceperunit–Variablecostperunit =R160,00–69,20 =R90,80
Break-evenpoint=Total fixed costs ___________ Contribution =R103800 ________ R90,80 ≈1143units
5. advice on whether to accept the american order or not• IwouldadvisemyuncletoaccepttheorderfromAmerica.• Itmaycausecash-flowproblemsinitially,yetitshouldgeneratea
positive cash flow from the third month onwards. • Thebreak-evenpointisverylow,soaslongastheorderisguaranteed
for a reasonable number months, it should be a very profitable deal.• Heshouldconsidertherisksoutlinedinthetablebelowandtakethe
necessary steps to protect his business against these risks.• Thefansaresolar-poweredandthususesustainableenergy.Consumers
in a country like America are becoming increasingly conscious about purchasing environmentally friendly products, so there is also good potential for growth in this market.
6. risks associated with the american order and recommendations for controlling the risks
Risk Recommendation for controlling the risk
exchange rate fluctuations
this risk can be controlled by taking out insurance cover against a decrease in the exchange rate.
However, there is a healthy profit margin and even if the exchange rate was to decrease to R7 to Us$1 it would still be profitable.
this could also work in the business’s favour if the exchange rate increases.
Goods damaged or lost in transit
this risk can be controlled by insuring the goods (this has already been included in the budget).
Increased transport and insurance costs
this risk could be controlled through a clause in the purchase agreement, which could provide that the business may increase the selling price should these cost increase beyond a certain amount. However, the american company would have to agree to this.
Currently the transport and insurance only cost R24 per unit, so even if these costs increased by 50%, there is still ample margin to cover the additional R12 per unit cost.
Cancellation of the order
this risk could be controlled through a clause in the purchase agreement, which could provide that the american company is committed to the monthly order for a predetermined period.
Due to the high profit margin, this period would only have to be three or four months for nice ‘n Cool suppliers to cover their costs and make some profit.
the business should also consider negotiating a cancellation clause in their lease agreement for the extra factory space and should also deal with this issue in their employment contracts with the additional factory workers and supervisor.

30 s e c t i o n 3 • a s s e s s m e n t ta s k s
Assessment task: Written report (to be done in Term 3)To be handed out to the learners
manufacturing / cost accountingmarks: 50
Visit a local factory in your town. Then write a detailed report, including the following information:
1. Background on business1.1 Whichtypeof businessformisthebusiness(soleenterprise,
partnership,CCorcompany)?1.2 Howlonghasthisfactorybeeninthemanufacturingbusiness?1.3 DothecheapimportsfromChinaandothercountriesaffectthe
business?(textileindustries).
2. Human Resources2.1 Howmanyemployeesdoesyourbusinesshaveandwhatarethe
differentpostdescriptions(responsibilities)?2.2 Whichlabourparty(union)dotheworkersbelongtoandwhy?
3. Ethical 3.1 Whatdoesthemanagementof thebusinessdotoencourageethical
behaviouramongitsemployees?3.2 HowoftendoesthebusinesspayVATtoSARS?
4. Productivity 4.1 Whatdoyoudotoincreaseproductivity?4.2 Doyouhaveanycontrolmeasureinplacetopreventthewastageof
rawmaterials?
5. Explanation of costs in manufacturing5.1 Giveexamplesof directcostsinthemanufacturingprocessat
the factory.5.2 Givetwoexamplesof indirectmaterialcostsatthefactory.5.3 Giveafurthertwoexamplesof manufacturingoverheads.
6. Cost calculations How does your business determine the cost price of one article for a
quotation,suchasarainjacket?Giveacompleteexplanationandshowallthe calculations, up to the selling price of the article.
7. Floor plan of the factory Drawaflowdiagramof themanufacturingprocessof aproductinthe
factory.Isthelayoutof thefactoryeffective,inyouropinion?
inStrUctionS:1.Thereportshouldincludeanintroductionandconclusion.2.Thelengthshouldbetwotothreepages.
Due date: …………………………………………

31s e c t i o n 3 • a s s e s s m e n t ta s k s
assessment rubric name:Criteria 1 2 3 4 5–6 Mark
achieved
Background on business
Identify some key factors
Identify key factors
Identify and show understanding of key factors
show an in-depth understanding of factors
show an in-depth understanding of factors based on thorough research
Human resources Identify some factors
Posts and labour union mentioned
Different posts and labour union described
Different posts and labour union described. show understanding
Different posts excellent described. show in-depth understanding of labour unions
report on ethical conduct and Vat
Basic understanding
Reasonable understanding
a complete report and understanding
report on productivity and internal control over raw material
Identify some key factors
Identify key factors
Identify and show understanding of key factors
show an in-depth understanding of factors
show an in-depth understanding of factors based on thorough research
explanation of costs in manufacturing
Have trouble giving examples
Basic understanding of different cost concepts
Reasonable understanding of cost concepts and mostly correct examples given
Good understanding of cost concepts and correct examples given
excellent understanding of cost concepts and complete and correct examples given and explained
cost calculations – determine the selling price of an article
struggle to give layout on how to determine selling price of product
Basic understanding on cost calculations of product
Reasonable understanding on cost calculations of product. Calculations mostly correct
Good understanding on cost calculations of product. Calculations correct
excellent understanding and layout on cost calculations of product. Calculations correct
Flow diagram of factory layout and comments
Incomplete flow diagram
Basic flow diagram
Reasonable flow diagram with comments
Complete flow diagram with comments
excellent and complete flow diagram with comments that show insight
introduction and conclusion
Basic satisfactory Good excellent
Quality of task Basic report satisfactory report
Good report excellent report. Uses pictures, graphs or tables
total: /50
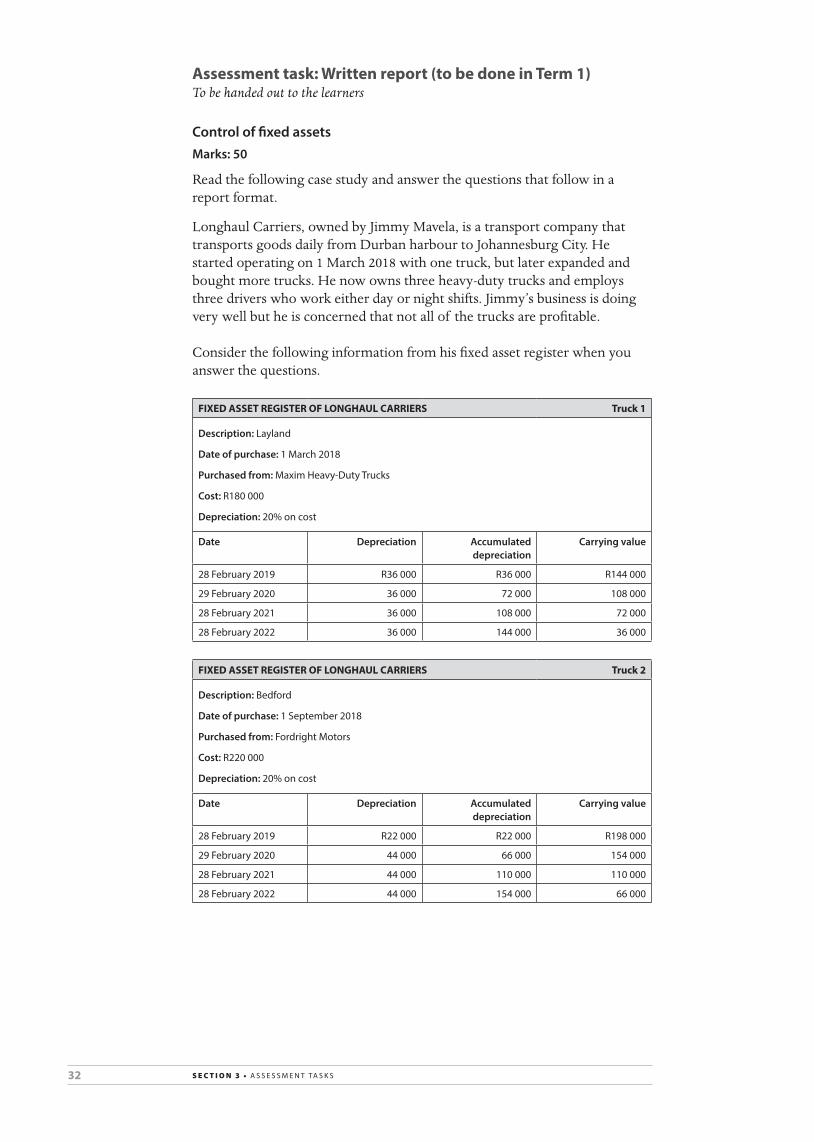
32 s e c t i o n 3 • a s s e s s m e n t ta s k s
Assessment task: Written report (to be done in Term 1)To be handed out to the learners
control of fixed assetsmarks: 50
Readthefollowingcasestudyandanswerthequestionsthatfollowina report format.
LonghaulCarriers,ownedbyJimmyMavela,isatransportcompanythattransportsgoodsdailyfromDurbanharbourtoJohannesburgCity.Hestartedoperatingon1March2018withonetruck,butlaterexpandedandbought more trucks. He now owns three heavy-duty trucks and employs three drivers who work either day or night shifts. Jimmy’s business is doing very well but he is concerned that not all of the trucks are profitable.
Consider the following information from his fixed asset register when you answer the questions.
FIXED ASSET REGISTER OF LONGHAUL CARRIERS Truck 1
Description: Layland
Date of purchase: 1 march 2018
Purchased from: maxim Heavy-Duty trucks
cost: R180 000
Depreciation: 20% on cost
Date Depreciation accumulated depreciation
carrying value
28 February 2019 R36 000 R36 000 R144 000
29 February 2020 36 000 72 000 108 000
28 February 2021 36 000 108 000 72 000
28 February 2022 36 000 144 000 36 000
FIXED ASSET REGISTER OF LONGHAUL CARRIERS Truck 2
Description: Bedford
Date of purchase: 1 september 2018
Purchased from: Fordright motors
cost: R220 000
Depreciation: 20% on cost
Date Depreciation accumulated depreciation
carrying value
28 February 2019 R22 000 R22 000 R198 000
29 February 2020 44 000 66 000 154 000
28 February 2021 44 000 110 000 110 000
28 February 2022 44 000 154 000 66 000

33s e c t i o n 3 • a s s e s s m e n t ta s k s
TANGIBLE ASSET REGISTER OF LONGHAUL CARRIERS Truck 3
Description: scannia
Date of purchase: 1 July 2020
Purchased from: Benzhigh trucking
cost: R300 000
Depreciation: 20% on cost
Date Depreciation accumulated depreciation
carrying value
28 February 2021 R40 000 R40 000 R260 000
28 February 2022 60 000 100 000 200 000
additional informationTruck 1 Truck 2 Truck 3
name of driver Sibusizwe mike Xholani
average number of round trips made per week
4 7 6
average number of hours each round trip takes
15 10 13
Drivers remuneration per round trip
R500 R450 R550
Income earned per round trip
R3 500 R4 250 R3 150
average fuel and maintenance costs per round trip
R1 000 R1 650 R1 300
Fuel and maintenance costs per kilometre
R1,67 R2,75 R2,17
Questions
1.Thedriverscarryafullloadof goodstoJohannesburgbutreturnemptytoDurban.Arethedriversreceivingafairremuneration(wage)forworkdone?Motivatebyusingcalculations.
2.IsJimmybeingfairtowardshisdriverswithregardstonumberof hoursworkedandaretheyreceivingafairremuneration?Motivatebyusingcalculations.
(Find out what the required number of hours is as laid down by the Departmentof LabourintheBasicConditionsof EmploymentAct.)
3.WhatcanJimmydotomaximisetheearningpotentialoneachtrip?
4. Consider the information above. Jimmy wants to know which truck is least profitable. Compile a report on the three trucks, quoting amounts in your report. Advise Jimmy as to which truck is least profitable and make recommendations on how to improve this.
5.WhatadvicewouldyougiveJimmysothathecanmaintaineffectivecontroloverhistrucksinthefuture?

34 s e c t i o n 3 • a s s e s s m e n t ta s k s
assessment rubric for written reportTo be handed out to the learners
criteria 1 2 3 4 mark achieved
the drivers carry a full load of goods to Johannesburg but return empty to Durban. are the drivers receiving a fair remuneration (wage) for work done? motivate by using calculations.
no concise reason give
a decision given but lacks conclusive evidence to support
a decision is made but not totally comprehensive decisions given
a clear decision given that is backed up by substantive information
marks 2 4 6 8
is Jimmy being fair towards his drivers with regards to the number of hours worked?
Fails to discuss the numbers of hours but makes comparisons between drivers
aspects of the numbers of hours of the three drivers are discussed, but no calculations made
Discusses the three drivers motivated by using calculations on number of hours
excellent decision showing great insight into the number of hours for each driver
marks 2 4 6 8
What can Jimmy do to maximise the earning potential on each trip?
Fails to explain the what Jimmy can do
Gives sound advice but only touches on aspects of what Jimmy can do
Good discussion on what Jimmy can do
excellent discussion on what Jimmy can do
marks 2 4 6 8
advise Jimmy as to which truck is least profitable and make recommendations on how to improve this.
Poor advice and recommendations given, indicates very little understanding of how to improve profitability
aspects of good advice and recommendations given but lacks the understanding of how to improve profitability
Good advice and recommendations given and indicates an understanding of how to improve profitability
excellent advice and recommendations given which indicates a good understanding of how to improve profitability
marks 4 8 12 16
What advice would you give Jimmy so that he can maintain effective control over his trucks in the future?
Poor advice given indicates very little understanding of the control of the trucks
aspects of good advice given indicates a lack of understanding of the control of the trucks
Good advice given indicates a good understanding of the control of the trucks
excellent advice given which indicates a good understanding of the control of the trucks
marks 2 4 6 10
total /50

35s e c t i o n 3 • a s s e s s m e n t ta s k s
Possible answersFor teacher’s reference
1.ConsideringthattheyonlycarryaloadtoJohannesburg,Jimmyisonlyearning an income for a one-way trip. However, their remuneration is for a round trip and they are not being compensated enough. They earn too little.
Truck 1 Truck 2 Truck 3
name of driver Sibusizwe mike Xholani
Remuneration × number of trips
R500 × 4 trips R450 × 7 R550 × 6
total remuneration R2 000 R3 150 R3 300
rate per hour R33,33 R45,00 R63,46
2.No,theirworkinghoursaretoolong.Theyshouldonlybeworking 40hoursperweek.Jimmyisnottreatinghisdriversfairly.
Truck 1 Truck 2 Truck 3
name of driver Sibusizwe mike Xholani
average number of round trips made per week
4 7 6
average number of hours each round trip takes
15 10 13
number of hours per week 60 hours 70 hours 52 hours
3.JimmycannegotiatewithJohannesburg-basedcompanieswhoperhapswanttheirgoodstransportedtoDurbanorsurroundingareas,sothatthedrivers carry cargo on their way back as well.
4. Truck 1: Possible answers:• Lowrunningcosts(fuelandmaintenance):R1,67perkm• Hisfuelandmaintenancecostspertripisquitelow(R1000).Heis
efficient but not effective.• Heistakinglongertodoaroundtrip(15hours)soisdrivingslowly.• Helooksafterhistruckandthereforethemaintenancecostsarelow.• Mucholdertruck,Jimmyshouldbehappywithitscondition.
Truck 2: Possible answers:• Highrunningcosts(fuelandmaintenance):R2,75perkm.Oldertruck,
almost fully depreciated.• Receivesthemostincomepertrip.• Isdoingmoretripsthananyotherdriverandisthusspeeding.This
impacts on his fuel and maintenance costs per trip.• ThistruckearnsthemostrevenueforthebusinessbutJimmymustbe
careful because the driver could get speeding fines and abuse the truck.• Mikeisbeingpaidtheleastof thethreedriversyetisworkingthehardest.
Truck 3: Possible answers:• Probablythemostefficienttruck.Runningcosts(fueland
maintenance):R2,17perkm.Thetruckisnew.• Thedriverisdoingafairamountof tripswithingoodtime.• Hisfuelandmaintenancecostsaremoderatebutheisbringinginthe
least income per trip.• Thistruckisbeingunder-utilised.Thisdriverispaidthemost.

36 s e c t i o n 3 • a s s e s s m e n t ta s k s
5.• Don’tallowdriverstousethetrucksoutsideof businessworkinghours.• Noprivateuse.• Monitorthefuelusageanddeterminewhytherearevaryingcostsin
fuel and maintenance costs.• Investigatethetimetakentomakeatrip.Whyaresomedriversmaking
moretripsinashorterspaceof time?• Investigatewhetherdriversareabusingthetrucksbydrivingtoofast.• Considertakingoutamaintenanceplanonthenewtruck.• Tradeinoldertruckswheretheirrunningcostsarehigh.
note to teacherForquestions4and5,acceptanyappropriateansweraslongasitisbackedup with amounts and a logical argument.

37s e c t i o n 3 • a s s e s s m e n t ta s k s
2. TesTs
Two tests, written under controlled conditions, are prescribed for Grade 11. These tests should adhere to the following:• Allclassesinthesamegradecompletethetestsonthesameday.• Alllearnerswritethesametestandcompletethemunderexamination
conditions.• Questionsmustcomplywithyear-endexaminationstandards.• Wherethereismorethanoneteacher,agreementmustbereachedonthe
scope,aswellasthedateandtimeof thetest.• Durationof eachof thesetestsshouldbeoneandahalf hours.• Totalforthetestsshouldbe100marks.• Testsshouldcoverthedifferentcognitivelevelsasinexaminations.• Testsshouldalsoincludeproblem-solvingquestions.• Testshouldcoverarangeof integratedtopics.• ThetwotestsshouldbewritteninTerms1and3.
Thetestsshouldcoversomeof thefollowingtopics:
Controlled test 1 – Term 1:• Reconciliations–bankreconciliationandcreditorsreconciliation• Fixedassets–assetdisposal• Partnership–ledgeraccounts• Ethics• GAAP• Internalcontrolovercash,creditorsandassets
Controlled test 2 – Term 3:• Ethics• GAAP• Internalcontrol• Budgeting• Inventorysystems–periodic• Clubs

38 s e c t i o n 3 • a s s e s s m e n t ta s k s
Assessment task: Controlled test 1Fixed assets and Bank reconciliation
Accounting Total: 100 marksGrade 11 Time: 1½ hoursDate: March
ActiveSportShopsellssportsclothingandequipment,andtheownerisAnkeMalan.Thebusiness’sfinancialyearends28February.
Question 1 (60 marks: 54 minutes)
Completethefollowinginformationwithregardstotheassetsof ActiveSportShop,fortheperiod1March2019to29February2020.
Required
1.Calculatethebalanceof Accumulated Depreciation on Vehicles on 1March2019. (7)1.2PreparethefollowingaccountsintheGeneralLedger:
1.2.1Accumulateddepreciationonequipment (17)1.2.2Assetdisposal (9)
1.3Preparethenoteforfixedassetsinthefinancialstatementsfor theyearended29February2020. (23)
1.4Ankeisconcernedthatthemarketingrepresentativeusesthe vehicleoverweekendsforpersonalgainandisputtingalotof mileageonthecar.Nametwocontrolmeasuresshecanputin placetopreventthis. (4)
Information
On1March2019thefollowingbalancesappearedinthebooksof ActiveSportShop:
Fol. Debit Credit
Balance sheet accounts
Land and buildings 450 000 00
Vehicles 160 000 00
equipment 68 000 00
accumulated depreciation on vehicles ?
accumulated depreciation on equipment 21 000 00
Depreciationiscalculatedasfollows:• 20%perannumonvehiclesonthediminishedbalance• 15%perannumonequipmentonthecostprice.
Accumulated depreciation on vehicles:Vehicles consist of the following:• ToyotaVenturepurchasedon1September2016forR60000–usedfor
deliverypurposes• ToyotaTazzpurchasedon1March2017forR100000–usedbythe
marketingrepresentativeAlldepreciationonvehicleswasbroughtuptodateupto28February2019.

39s e c t i o n 3 • a s s e s s m e n t ta s k s
Transactions for the year:201901Jun Astoreroomwasbuiltatatotalcostof R80000.31Oct SoldoneprintertoanemployeeforR300cash.Thecostpriceof the
printerwasR2600andaccumulateddepreciationon1March2019amountedtoR1200.
01NovPurchaseanewprinterforcash,R3000.
Question 2 (40 marks: 36 minutes)
ActiveSportShophasabankaccountwithNBOBank.
Required
2.1 Dotheadditionalentriesinthecashjournalsof ActiveSportShop on30June2020. (24)
2.2PrepareandbalancetheBankaccountintheGeneralLedger. (5)2.3PreparetheBankReconciliationStatementon30June2020. (11)
Information
Active sport shop Bank Reconciliation statement on 31 May 2020
Fol. Debit Credit
Credit balance according to bank statement 874 00
Credit outstanding deposit 2 620 00
Debit cheques not presented for payment:
no. 187 340 00
no. 304 1 560 00
no. 305 2 649 00
Credit balance according to Bank account 1 055 00
Thetotalsof thebankcolumnsintheCashJournalson31May2020,beforedoing the additional entries:
Cash Receipts Journal Cash Payments JournalBank R24932 Bank R29200
Acomparisonof theCashJournalsandtheBankReconciliationStatementwiththeJunebankstatementrevealedthefollowingdifferences:• Thefollowingitemsappearedonlyinthebankstatement:interestonbank
overdraft,R128;servicefees,R56;cashhandlinglevy,R34.• Of thechequesoutstandingon31May2020,chequenumbers187and305
werestilloutstandingon30June2020.– Chequeno.187hadbeenissuedtoDKCycleClubasadonationon
4December2019.– Chequeno.305hadbeenissuedtoABFurnishersforequipmentthat
stillneedtobedeliveredandwasdated1July2020.• Thedepositof R2620outstandingon31May2020wascreditedonthe
bankstatementon1June2020.• Adepositof R3080madeon30June2020didnotappearontheJune
bankstatement.• Achequeinfavourof KCDistributors,acreditor,hadbeenrecorded
incorrectlyintheCPJasR1590insteadof R1950.Theadjustmentfortheerrormustbemade.

40 s e c t i o n 3 • a s s e s s m e n t ta s k s
• Achequedrawnbyadebtor,PPienaar,forR500insettlementof debtof R520,hasbeendishonouredbythebankduetoinsufficientfunds.
• Chequeno.403(dated28June2020)forR800andchequeno.404(dated30June2020)forR372,drawnbythebusinessduringJune2020,hadnotbeenpresentedforpayment.
• Astoporderpaymentwasmadebythebankinfavourof StarInsurersforR580forthebusiness’sinsurance.
• Atenant,LJoubert,haddepositedherJulyrentof R1000directlyintothebankaccount.
• Thebankstatementreflectedanoverdrawnbalanceof R4900on 30June2020.

41s e c t i o n 3 • a s s e s s m e n t ta s k s
Assessment task: Controlled test 1 Answer SheetFixed assets and Bank reconciliation
Accounting Total: 100 marksGrade 11 Time: 1½ hoursDate: March
Question 1 (60 marks: 54 minutes)
1.1 Calculate the balance of Accumulated Depreciation on Vehicles on 1 march 2019
time line: toyota Venture
time line: tazz
Balance on 1 march 2009
7
1.2.1 General Ledger of Active sport shop
Accumulated Depreciation on equipment
Date Details Fol. Amount Date Details Fol. Amount
17

42 s e c t i o n 3 • a s s e s s m e n t ta s k s
1.2.2 Asset Disposal
Date Details Fol. Amount Date Details Fol. Amount
9
CALCULATIONsCalculations: Depreciation on equipment
Calculations: Depreciation on vehicles on 29 February 2020
1.3
NOTes TO THe FINANCIAL sTATeMeNTs AT
FIXeD / TANGIBLe AsseTs
Land and buildings Vehicles equipment
Carrying value at beginning of year
Cost
accumulated depreciation
movements
additions
Disposals at carrying value
Depreciation
Carrying value at end of year
Cost
accumulated depreciation
23

43s e c t i o n 3 • a s s e s s m e n t ta s k s
1.4Nametwocontrolmeasuresshecanputinplacetopreventthis.
4
Question 2 (40 marks: 36 minutes)
2.1Cash Receipts Journal of Active sport shop for June 2020 CRJDoc. no. Day Details Fol. Bank
sundry accounts
Amount Details
30 Totals
Cash Payments Journal of Active sport shop for June 2020 CPJDoc. no. Day Name of payee Fol. Bank
Debtorscontrol
sundry accountsAmount Details
30 Totals
24

44 s e c t i o n 3 • a s s e s s m e n t ta s k s
2.2 General Ledger of Active sport shop
Dr Bank account Cr
Date Details Fol. Amount Date Details Fol. Amount
5
2.3Active sport shop Bank Reconciliation statement on 30 June 2020
Fol. Debit Credit
11

45s e c t i o n 3 • a s s e s s m e n t ta s k s
Assessment task: Controlled test 1 MemorandumFixed assets and Bank reconciliation
Accounting Total: 100 marksGrade 11 Time: 1½ hoursDate: March
Question 1 (60 marks: 54 minutes)
1.1 Calculate the balance of Accumulated Depreciation on Vehicles on 1 march 2009
time line: toyota Venture
01/09/16 28/02/17 28/02/18 28/02/19
R60 000 × 20% × 6 ___ 12
= R6 000 ✓
R54 000 × 20%
= R10 800 ✓
R43 200 x 20%
= R8 640 ✓
time line: tazz
01/03/17 28/02/18 28/02/19
R100 000 × 20%
= R20 000 ✓
R80 000 × 20%
= R16 000 ✓
Balance on 1 march 2019
R6 000 + 10 800 + 8 640 + 20 000 + 16 000 = R61 440 ✓✓
7
1.2.1 General Ledger of Active sport shop
Accumulated Depreciation on equipment
Date Details Fol. Amount Date Details Fol. Amount
2019 Oct 31 asset disposal ✓ ✓✓✓ 1 460 00
2019 mar 01 Balance b/d ✓ 21 000 00
Balance c/d ✓ 19 800 00 Oct 31 Depreciation ✓ ✓✓ 260 00
21 260 00 21 260 00
nov 01 Balance b/d ✓ 19 800 00
2020 Feb ✓ 29 Depreciation ✓ ✓✓✓✓ 9 960 00
✓ 29 760 00
17

46 s e c t i o n 3 • a s s e s s m e n t ta s k s
1.2.2 Asset Disposal
Date Details Fol. Amount Date Details Fol. Amount
2019 Oct 31 equipment ✓ ✓ 2 600 00
2019 Oct 31
accum. Deprec. on equipment ✓ ✓ 1 460 00
Bank ✓ ✓ 300 00
Loss with asset disposal ✓ ✓✓ 840 00
2 600 00 2 600 00
9
CALCULATIONs
Calculations: Depreciation on equipment
Soldequipment
R2600×15%×8 __ 12=R260
Oldequipment
(R68000–2600)×15%=R9810
Newequipment
R3000×15%×4 __ 12=R150
Calculations: Depreciation on vehicles on 29 February 2020
R98560×20%=R19712
1.3ACTIVe sPORT sHOPNOTes TO THe FINANCIAL sTATeMeNTs AT 30 JUNe 2020FIXeD / TANGIBLe AsseTs
Land and buildings Vehicles equipment
Carrying value at beginning of year 450 000 ✓ 98 560 ✓ 47 000
Cost ✓ 450 000 ✓ 160 000 ✓ 68 000
accumulated depreciation ✓ (61 440) ✓ (21 000)
movements
additions ✓ 80 000 ✓ 3 000
Disposals at carrying value ✓✓ (1 140)
Depreciation ✓✓ (19 712) ✓✓ (10 220)
Carrying value at end of year 530 000 ✓ 78 848 ✓ 38 640
Cost ✓ 530 000 ✓ 160 000 ✓✓ 68 400
accumulated depreciation ✓ (81 152) ✓ (29 760)
23

47s e c t i o n 3 • a s s e s s m e n t ta s k s
1.4Nametwocontrolmeasuresshecanputinplacetopreventthis.
The person driving the car should keep a log book and write down
the kilometres and destination. ✓✓
The car should rather be parked on the business premises
over weekends. ✓✓
The driver should sign a contract that the car will only be used for
work purposes. ✓✓
(two marks ×2)
4
Question 2 (40 marks: 36 minutes)
2.1Cash Receipts Journal of Active sport shop for June 2020 CRJDoc. no. Day Details Fol. Bank
sundry accounts
Amount Details
30 totals ✓ 24 932 00
BsDk Cycle Club (cheque stale) ✓ 340 00 ✓ 340 00 Donation ✓
Bs L. Joubert ✓ 1 000 00 ✓ 1 000 00 Rent income ✓
2 600 00
(7)
Cash Payments Journal of Active sport shop for June 2020 CPJDoc. no. Day Name of payee Fol. Bank
Debtorscontrol
sundry accountsAmount Details
30 totals ✓ 29 200 00
Bs nBO Bank ✓ 128 00 ✓ 128 00Interest on overdraft ✓
nBO Bank ✓ 90 00 ✓ 90 00 Bank charges ✓kC Distributors (cheque incorrect) ✓✓ 360 00 ✓ 360 00
Creditors Control ✓
P Pienaar (Cheque dishonoured) ✓ 500 00 ✓✓ 500 00star Insurers ✓ 580 00 ✓ 580 00 Insurance ✓
30 858 00
(17)
24

48 s e c t i o n 3 • a s s e s s m e n t ta s k s
2.2 General Ledger of Active sport shop
Dr Bank account Cr
Date Details Fol. Amount Date Details Fol. Amount
2020 Jun 30 total receipts CRJ ✓ 26 272 00
2020 Jun 01 Balance ✓ 1 055 00
Balance c/d ✓ 5 641 00 30 total payments CPJ ✓ 30 858 00
31 913 00 31 913 00
2020 Jul 01 Balance b/d ✓ 5 641 00
5
2.3Active sport shop Bank Reconciliation statement on 30 June 2020
Fol. Debit Credit
Debit balance according to bank statement ✓✓ 4 900 00
Credit outstanding deposit ✓✓ 3 080 00
Debit cheques not presented for payment:
no. 305 ✓✓ 2 649 00
no. 403 ✓✓ 800 00
no. 404 ✓✓ 372 00
Credit balance according to Bank account ✓ 5 641 00
8 721 00 8 721 00
11

49s e c t i o n 3 • a s s e s s m e n t ta s k s
Assessment task: Control test 2 – SeptemberInventory systems and Budgeting
Accounting Total: 100 marksGrade 11 Time: 1½ hours[For learner]
Question 1 [45 marks; 25 minutes]
Inventory systemsThefollowinginformationappliestoRozanneTraders,withownerRozanneCunningham.Theyuseamarkupof 50%oncostpriceandkeeptheirbooksaccordingtotheperiodicinventorysystem.
Required:
1.PreparethefollowingaccountsintheGeneralLedgeron28February2020.Balance/closeoff theaccountson28February2020,theendof theAccountingPeriod.1.1 Purchases (13)1.2 Tradingaccount (16)
2.RozanneTradersuseamark-uppercentageof 50%oncostwhendeterminingthesellingpriceof theirgoods.2.1 Calculatetheactualmark-uppercentageachievedduring
theperiod. (6)2.2 GivetwopossiblereasonswhyRozannedidnotachievehergoal
of a50%mark-uppercentage. (4)2.3 GiveRozannethreestepsshecanusetoauditpurchases,to
ensurethattheyarecorrectlyrecorded. (6)
Information:
extract from the Pre-adjustment Trial Balance on 28 February 2020:trading stock (1 march 2019) R104 200
Purchases R846 120
sales R1 231 358
Debtors allowances R8 790
Creditors allowances R16 020
Carriage on purchases R8 970
Delivery costs to customers R3 870
Adjustments and additional information: • Stockwithacostpriceof R2420wasdonatedtoalocalold-agehomeon
23February2020,buthasnotyetbeenrecorded. • TwoinvoicesreceivedfromSpeedyTransporton28February2020werenot
recordedinthebooks:– StockdeliveredtoRozanneTraders,R690– Goodsdeliveredtocustomers,R380
• On26February2020,theownertookgoodsforherownuseatcost.However,thetemporarybookkeeperdebitedDrawingsandcreditedSaleswiththesellingpriceof R1335.Correcttheerror.
• Aphysicalstocktakeshowsthevalueof stockonhandon28February2020asR97500.

50 s e c t i o n 3 • a s s e s s m e n t ta s k s
Question 2 [55 marks; 32 minutes]
BudgetingYouareprovidedwiththeinformationrelatingtoZoëTraders.
Required
2.1 PreparetheDebtorsCollectionScheduleforJulyandAugust2019. (13)2.2 PreparetheCashBudgetforJulyandAugust2019. (42)
Information
• Balancesasat30June2019:Capital R500 000
Loan: DJC Bank (12% interest p.a) R60 000
Bank (overdraft) R24 560
• Salesmonth total sales Cash sales Credit sales
may (actual) 180 000 72 000 108 000
June (actual) 168 000 67 200 100 800
July (forecast) 192 000 76 800 115 200
august (forecast) 210 000 ? ?
– 60%of allsaleswerecreditsales.– Averagedebtorscollectionsareexpectedtobeasfollows:– 25%arecollectedduringthemonthof sale.Debtorspayingduringthe
transactionmonthgeta3%discount.– 60%arecollectedinthemonthafterthesale.– 15%arecollectedinthesecondmonthafterthetransactionmonth.
• Purchases– Thebusinessusesamarkupof 50%oncost.– Tradingstockiskeptataconstantlevel.– Purchasesreplacesalesinthesamemonth.– 60%of allpurchasesareoncredit.– Creditorsarepaidafter30days(themonthaftertransactionmonth).– 40%of purchasesareforcash.
• Rentincome– The business leases part of the building to a tenant for storage. – Rentincomeforthepreviousfinancialyear,1July2018to30June2019,
amountedtoR10480.– Rentincreasesby10%on1Augustof everyyear.
• Capital– TheownerwillincreasehercapitalcontributionwithR150000on
1August2019.• Fixedassets
– DepreciationamountstoR3000permonth.– On1July2019,theoldvehiclewillbetradedinforR35000.– Anewvehiclewillbepurchasedonthesamedate,foracostof R180000.– Adepositof R30000willbepaidon1July2019.– Thebalancewillbepaidin23equalmonthlyinstalments,starting
1August2019.

51s e c t i o n 3 • a s s e s s m e n t ta s k s
• Loanandinterestontheloan– Theloanisrepaidinequalannualinstalmentsof R20000on1Augustof
everyyear.– Interestonloaniscalculatedat12%p.a.andpaidmonthly.
• Salariesandwages– Salariesandwagesforthepreviousfinancialyear,1July2018to30June2019
amountedtoR396000.– Employeeswillreceiveanincreaseof 7%onsalariesandwageson
1August2019.• Othersundryexpenses
– Othersundryexpensespayable,willremainconstantatR5000permonth.

52 s e c t i o n 3 • a s s e s s m e n t ta s k s
Assessment task: Control test 2 – SeptemberInventory systems and Budgeting
Accounting Total: 100 marksGrade 11 Time: 1½ hoursAnswer sheet
Question 1 [45 marks; 25 minutes]
Inventory systems
1.1 General Ledger of Rozanne Traders
Dr Purchases N2 Cr
Date Details Fol. Amount Date Details Fol. Amount
13
Dr Trading Account F1 Cr
Date Details Fol. Amount Date Details Fol. Amount
16
1.2.1 Calculatetheactualmark-uppercentageachievedduringtheperiod.
Cost price =
Percentage profit mark-up
6

53s e c t i o n 3 • a s s e s s m e n t ta s k s
1.2.2 GivetwopossiblereasonswhyRozannedidnotachievehergoalof a50%mark-uppercentage.
4
1.2.3 GiveRozannethreestepsshecanusetoauditpurchases,toensurethattheyarecorrectlyrecorded.
6
Question 2 [55 marks; 32 minutes]
Budgeting
2.1
DeBTORs COLLeCTION sCHeDULeCredit sales July August
13
Calculationforrentincome:
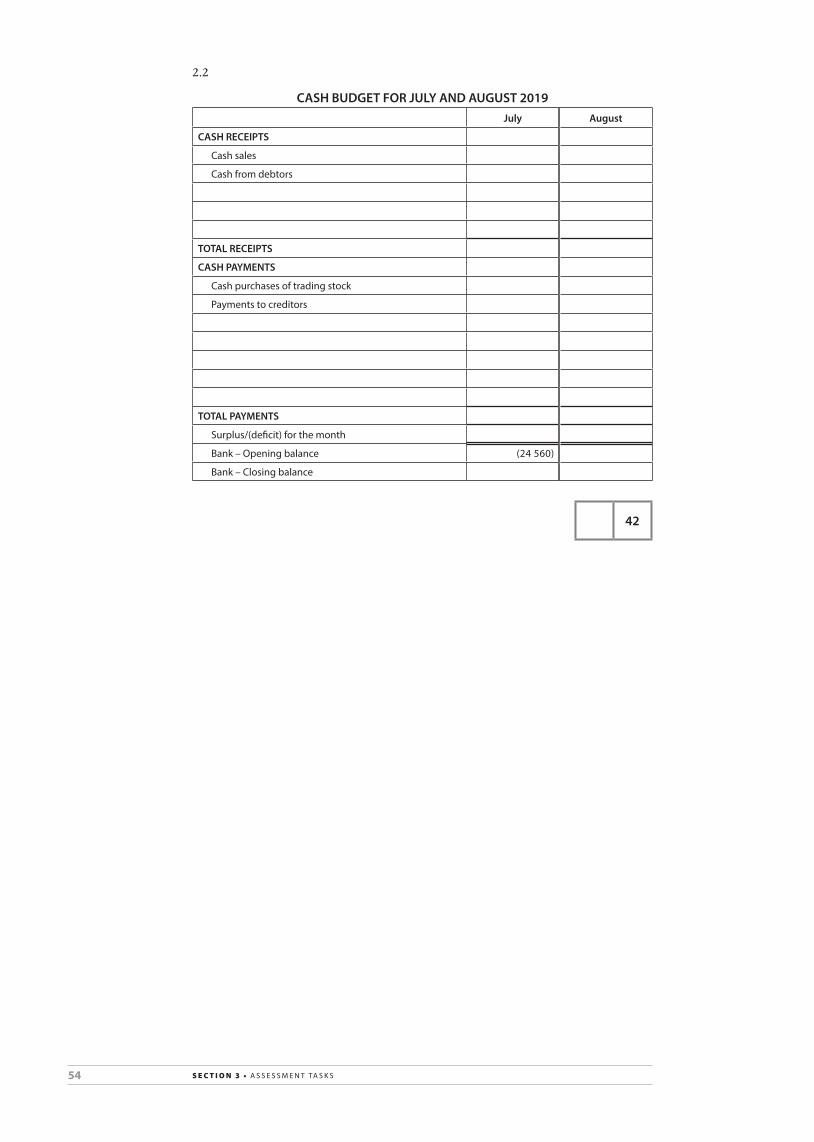
54 s e c t i o n 3 • a s s e s s m e n t ta s k s
2.2
CAsH BUDGeT FOR JULY AND AUGUsT 2019July August
CAsH ReCeIPTs
Cash sales
Cash from debtors
TOTAL ReCeIPTs
CAsH PAYMeNTs
Cash purchases of trading stock
Payments to creditors
TOTAL PAYMeNTs
surplus/(deficit) for the month
Bank – Opening balance (24 560)
Bank – Closing balance
42

55s e c t i o n 3 • a s s e s s m e n t ta s k s
Assessment task: Control test 2 – SeptemberInventory systems and Budgeting
Accounting Total: 100 marksGrade 11 Time: 1½ hoursMarking memorandum
Question 1 [45 marks; 25 minutes]
Inventory systems
1.1 General Ledger of Rozanne Traders
Dr Purchases N2 Cr
Date Details Fol. Amount Date Details Fol. Amount
2019 Feb Balance b/d ✓ 846 120 00
2019 Feb 28 Creditors allowances ✓ CaJ ✓✓16 020 00
Donations ✓ GJ ✓✓2 420 00
Drawings ✓ GJ ✓✓✓ 890 00
trading account ✓ GJ ✓826 790 00
846 120 00 846 120 00
13
Dr Trading Account F1 Cr
Date Details Fol. Amount Date Details Fol. Amount
2019 Feb 28 Opening stock ✓ GJ ✓ 104 200 00
2019 Feb 28
sales (1 231 358 – 1 335 – 8 790) ✓ GJ
✓✓✓ 1 221 233 00
Purchases ✓✓ GJ 826 790 00 Closing stock ✓ GJ ✓ 97 500 00
Carriage on purchases (8 970 + 690) ✓ GJ ✓✓✓ 9 660 00
Profit and loss account ✓✓ GJ
1 318 733 00 1 318 733 00
16
1.2.1 Calculatetheactualmark-uppercentageachievedduringtheperiod.
Cost price = R1222568–379418=R843150✓✓✓
OR Cost price = R104200+826790+9660–97500=R843150Percentage profit mark-up
378083✓
______ 843150✓ ×100 ___ 1
=44,8%✓ 6
1.2.2 GivetwopossiblereasonswhyRozannedidnotachievehergoalof a50%mark-uppercentage.
4
Control over stock is not satisfactory – mistakes are made when the stock is counted or entered in the books.Goods may have been stolen.Selling goods at a lower profit mark-up.Any acceptable answer (2 × 2)

56 s e c t i o n 3 • a s s e s s m e n t ta s k s
1.2.3 GiveRozannethreestepsshecanusetoauditpurchases,toensurethattheyarecorrectlyrecorded.
6
Give Rozanne three steps she can use to audit purchases, to ensure that they are correctly recorded.Check that the total for purchases in the General Ledger agrees with the total in the journals.Select purchases from the journals and verify these against the source documents.Check whether the source documents agree with delivery notes and prices.Any acceptable answer (3 × 2)
Question 2 [55 marks; 32 minutes]
Budgeting
2.1
DeBTORs COLLeCTION sCHeDULeCredit sales July August
may 108 000 × 15% ✓✓ 16 200
June 100 800 × 60% ✓✓ 60 480
June 100 800 × 15% ✓✓ 15 120
July 115 200 × 25% × 97% ✓✓ 27 936
July 115 200 × 60% ✓✓ 69 120
august 210 000 × 60% × 25% × 97% ✓✓✓ 30 555
104 616 114 795
13
Calculationforrentincome:
r+11(r× 110 ___ 100 )=10480
13,1r=10480
r=800
r × 110 ___ 100 =880

57s e c t i o n 3 • a s s e s s m e n t ta s k s
2.2
CAsH BUDGeT FOR JULY AND AUGUsT 2019July August
CAsH ReCeIPTs
Cash sales ✓ 76 800 ✓✓ 84 000
Cash from debtors (✓) 104 616 (✓) 114 795
Rent income ✓✓✓ 880 (✓✓) 968
Capital ✓ 150 000
no entry for asset disposal – as it was traded in (–1 if entered)
TOTAL ReCeIPTs 182 296 349 763
CAsH PAYMeNTs
Cash purchases of trading stock (192 000 × 100 ___ 150 × 40%) and (210 000 × 100 ___ 150 × 40%) ✓✓✓ 51 200 ✓✓ 56 000
Payments to creditors (168 000 × 100 ___ 150 × 60%) and
(19 2000 × 100 ___ 150 × 60%) ✓✓✓ 67 200 ✓✓✓ 76 800
Purchase of vehicle (180 000 – 30 000 – 35 000) ____________________ 23 ✓ 30 000 ✓✓✓ 5 000
Loan payment ✓ 20 000
Interest on loan (60 000 × 12% × 1 __ 12 ) and
(40 000 × 12% × 1 __ 12 ) ✓✓ 600 ✓✓ 400
salaries and wages ✓✓ 33 000 ✓✓ 35 310
sundry expenses ✓ 5 000 ✓ 5 000
TOTAL PAYMeNTs 187 000 198 510
surplus/(deficit) for the month (✓) (4 704) (✓) 151 253
Bank – Opening balance (24 560) (✓) (29 264)
Bank – Closing balance (✓) (29 264) (✓) 121 989
42

58 s e c t i o n 3 • a s s e s s m e n t ta s k s
3. projects
The project is mandatory and only one project is recommended. When preparing a project, consider the following minimum requirements:• Learnersshouldbegiventhenecessaryguidancepriortocommencement
of theprojectandprogressmustbemonitored.• Aspectsof theprojectshouldbecompletedinclasstoenabletheteacher
to monitor progress.• Allcriteriausedtoassessaprojectmustbediscussedwiththelearners.• Generally,projectsaregivenalongerperiodof timeastheyinvolvesome
sortof research,consolidationandselectionof relevantinformation,andthepreparationof awrittendocumentasevidence.
• Oftenprojectscanbearoundsomeformof problem.• Researchmayformpartof theproject–theprojectisevidenceof the
researchconducted.However,thisisnotalwaysthecase.Forexample,thecomputerisedaccountingprogrammewillnotinvolveresearchbutratherdevelopskills.
Suggestions• Theprojectshouldbehandedoutanddiscussedwithlearnerstowards
the end of the first term.• Projectsaretobehandedinduringthesecondterm.• Theteachershouldmonitorprogressduringtheterm.
Notes to teacherEventhoughbudgetsareonlycoveredinthethirdterm,theprojectonbudgetscanbedoneinthesecondterm.Itisaninterestingwayforthelearnerstofindoutmoreaboutthistopicthemselves.ThisisaveryusefulandpracticaltaskandIhaveoftenhadparentsthankingmeaftertheirchildrendidthistask,asitmakesthemrealisehowexpensiveitistostudyandthattheycanactuallygetabursaryif theworkhard.Option2getsthemthinkingonwhattheywanttodoafterschoolandwhattheiroptionsare.
Handoutbothoptionstothelearnersandletthemchoosewhichonetheywant to use.
ThistaskshouldbehandedoutanddiscussedwiththelearnersinTerm1, tobehandedinduringtheTerm2.Itcanbedoneinconjunctionwith LifeOrientation.
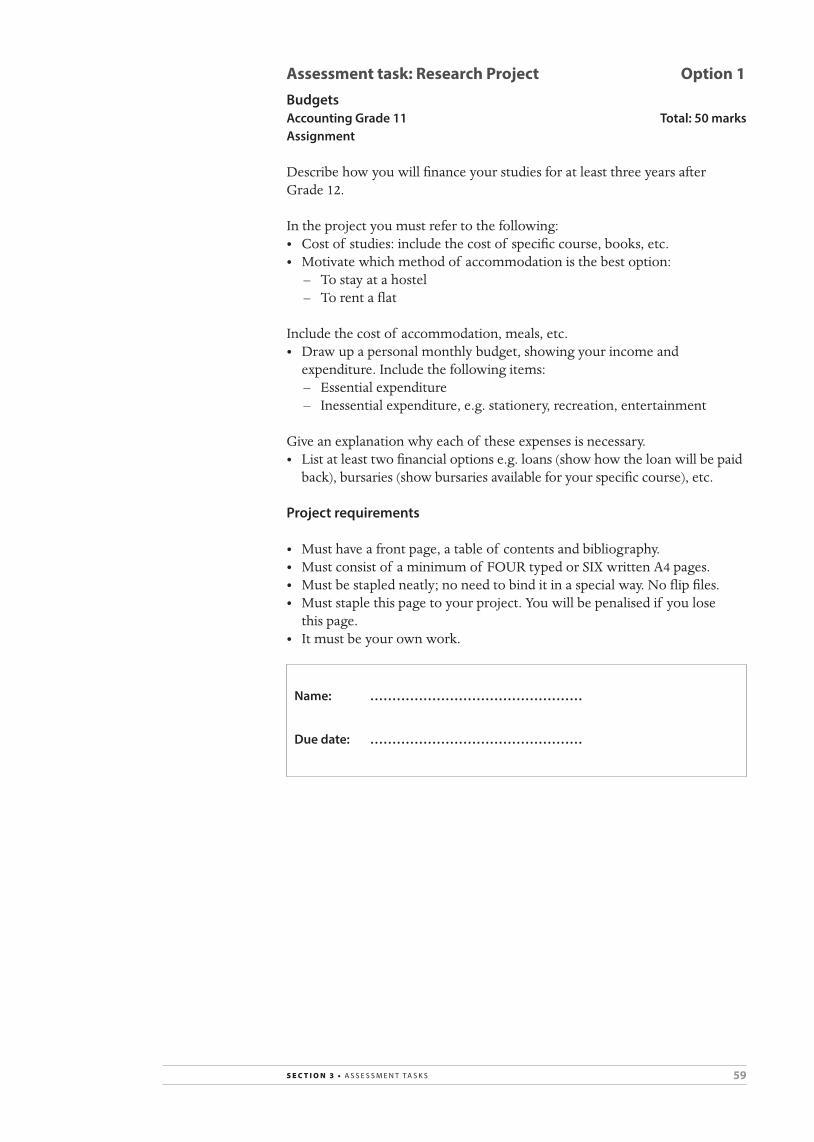
59s e c t i o n 3 • a s s e s s m e n t ta s k s
Assessment task: Research Project Option 1BudgetsAccounting Grade 11 total: 50 marksAssignment
Describehowyouwillfinanceyourstudiesforatleastthreeyearsafter Grade12.
Intheprojectyoumustrefertothefollowing:• Costof studies:includethecostof specificcourse,books,etc.• Motivatewhichmethodof accommodationisthebestoption:
– Tostayatahostel– Torentaflat
Includethecostof accommodation,meals,etc.• Drawupapersonalmonthlybudget,showingyourincomeand
expenditure.Includethefollowingitems:– Essentialexpenditure– Inessentialexpenditure,e.g.stationery,recreation,entertainment
Giveanexplanationwhyeachof theseexpensesisnecessary.• Listatleasttwofinancialoptionse.g.loans(showhowtheloanwillbepaid
back),bursaries(showbursariesavailableforyourspecificcourse),etc.
project requirements
• Musthaveafrontpage,atableof contentsandbibliography.• Mustconsistof aminimumof FOURtypedorSIXwrittenA4pages.• Mustbestapledneatly;noneedtobinditinaspecialway.Noflipfiles.• Muststaplethispagetoyourproject.Youwillbepenalisedif youlose
this page.• Itmustbeyourownwork.
Name: …………………………………………
Due date: …………………………………………
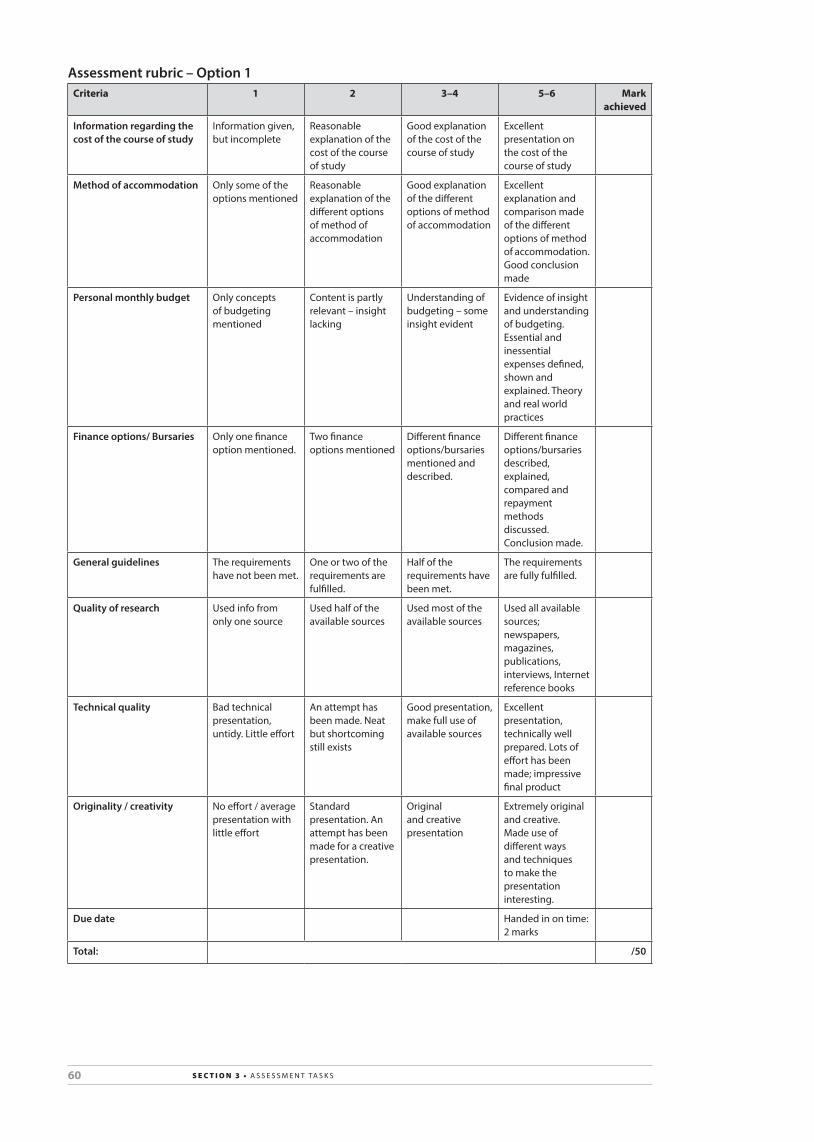
60 s e c t i o n 3 • a s s e s s m e n t ta s k s
Assessment rubric – option 1Criteria 1 2 3–4 5–6 Mark
achieved
Information regarding the cost of the course of study
Information given, but incomplete
Reasonable explanation of the cost of the course of study
Good explanation of the cost of the course of study
excellent presentation on the cost of the course of study
Method of accommodation Only some of the options mentioned
Reasonable explanation of the different options of method of accommodation
Good explanation of the different options of method of accommodation
excellent explanation and comparison made of the different options of method of accommodation. Good conclusion made
personal monthly budget Only concepts of budgeting mentioned
Content is partly relevant – insight lacking
Understanding of budgeting – some insight evident
evidence of insight and understanding of budgeting. essential and inessential expenses defined, shown and explained. theory and real world practices
Finance options/ Bursaries Only one finance option mentioned.
two finance options mentioned
Different finance options/bursaries mentioned and described.
Different finance options/bursaries described, explained, compared and repayment methods discussed. Conclusion made.
General guidelines the requirements have not been met.
One or two of the requirements are fulfilled.
Half of the requirements have been met.
the requirements are fully fulfilled.
Quality of research Used info from only one source
Used half of the available sources
Used most of the available sources
Used all available sources; newspapers, magazines, publications, interviews, Internet reference books
technical quality Bad technical presentation, untidy. Little effort
an attempt has been made. neat but shortcoming still exists
Good presentation, make full use of available sources
excellent presentation, technically well prepared. Lots of effort has been made; impressive final product
originality / creativity no effort / average presentation with little effort
standard presentation. an attempt has been made for a creative presentation.
Original and creative presentation
extremely original and creative. made use of different ways and techniques to make the presentation interesting.
Due date Handed in on time: 2 marks
total: /50

61s e c t i o n 3 • a s s e s s m e n t ta s k s
Assessment task: Research Project Option 2Budgets
Accounting Grade 11 total: 50 marksAssignment
Youareanindependentyoungindividuallivingonyourown.
Findajobinthelocalnewspaperthatyouthinkyoumightobtainwhenyouleaveschool/university/college.Notethesalaryandwhetherthereisacompany pension scheme.• Usealistof currenttaxtablestofindoutwhatyouwouldhavetopayin
taxeachmonth.• YouneedtoresearchtheDepartmentof Labourtoascertainwhatyour
statutorydeductionswouldbe.• If thejobdoesordoesnotprovideapensionfund,findoutwhatother
waysyoucanprovideforyourretirement.
required
• Makeoutapersonalmonthlybudget,showingyourincomeandexpenditure.Includethefollowingitems:
Netincome,essentialexpenditure,inessentialexpenditure,savings• Explainthemeaningof theabove-mentioneditems.• Alsoexplaininfullwhyyouhavechosentoplanyourbudgetinthisway.
Describehowbudgetingandfinancialplanningcanhelpyoumakebetteruse of your income.
• If youhavechosentosaveorinvest,calculateorindicatewhatyoursavingsorinvestmentwillbeworthafter20years.
• Youcouldillustrateyouressentialandnon-essentialexpenditurewithbarcharts.
• Includetheadvertisementinyourproject.
project requirements
• Musthaveafrontpage,atableof contentsandbibliography.• Mustconsistof aminimumof FOURtypedorSIXwrittenA4pages.• Mustbestapledneatly;noneedtobinditinaspecialway.Noflipfiles.• Muststaplethispagetoyourproject.Youwillbepenalisedif youlose
this page.• Itmustbeyourown work.
Name: …………………………………………
Due date: …………………………………………

62 s e c t i o n 3 • a s s e s s m e n t ta s k s
Assessment rubric – option 2Criteria 1 2 3 4–5 Mark
achieved
General guidelines the requirements have not been met. no introduction. Handed in late.
One or two of the requirements are fulfilled. Little effort made in introducing the topic. Handed in two days late.
Half of the requirements have been met. an adequate explanation given. Handed in one day late.
the requirements are fully fulfilled. a brief synopsis of project given, type of job, job description, salary, pension fund. Handed in on time.
calculation of net income
Only net amount is reflected
a tax and statutory deductions are evident
Correct tax deduction and evidence of some statutory deductions taken into account in calculations
Correct tax deduction and evidence of all statutory deductions taken into account in calculations
essential expenditure no mention made Only 1 or 2 essential items mentioned
Only essential items chosen is mentioned
a detailed explanation given of essential items chosen and why it is important
Inessential expenditure no mention made Only 1 or 2 inessential items mentioned
Only inessential items chosen is mentioned
a detailed explanation given of inessential items chosen and why it is important
savings no mention made Only an explanation given on savings
an explanation given why savings are important
a detail explanation given why savings are important, stressing sa policy on savings
Budgeting and financial planning
Only concepts of budgeting and financial planning mentioned
Content is partly relevant – insight lacking
Understanding of budgeting and financial planning – some insight evident
evidence of insight and understanding of budgeting and the importance of financial planning. theory and real world practices.
calculations of savings or investment
no calculation given
Only amount worth in 20 years time given
Partly correct calculation done
Correct calculation – what will be worth in 20 years time
Quality of research and content
Used info from only one source Partly copied directly from sources; insight lacking
Used half of the available sources Relevant content shows good insight, area of research well covered.
Used most of the available sources Relevant and well researched presentation; demonstrates good insight
Used all available sources; newspapers, magazines, publications, interviews, Internet reference books. In-depth presentation pertaining to real world practice; shown of insight into relationship between subject theory and real world practice
technical quality Bad technical presentation, untidy. Little effort
an attempt has been made. neat but shortcomings still exist
Good presentation, make full use of available sources
excellent presentation, technically well prepared. Lots of effort has been made; impressive final product
Due date.Handed in:
more than 2 days late
2 days late 1 day late on time
total: /50

63s e c t i o n 3 • a s s e s s m e n t ta s k s
4. Examinations
Step-by-step process on how to set up an examination paper
step 1 Know the total value of the examination paper:
For mid-year examinationsnumber of papers time allocation marks topics
Grade 10 1 2½ hours 200 marks In proportion to time devoted to each topic (as indicated in the work schedule)
Grade 11 2 2 hours each 150 marks each
Grade 12 2 2 hours each 150 marks each
For trial examination (Grade 12 only)number of papers time allocation marks topics
Grade 12 2 2 hours each 150 marks each Full scope
Final examinationnumber of papers time allocation marks topics
Grade 10 2 2 hours each 150 marks each Full scope externally setGrade 11 2 2 hours each 150 marks each
Grade 12 2 2 hours each 150 marks each
step 2 Know the content that is stipulated for the grade you are setting the examination paper for:
Content stipulated specifically for the grade 80%
Content stipulated in previous grades, which impacts on the assessment of subsequent grades
20%
For example, when setting a Grade 11 examination paper, 80% must be examined on Grade 11 work and the other 20% on Grade 10 work (only the work that impacts on Grade 11).
step 3 The Accounting topics, previously in three fields, namely Financial accounting, Managerial Accounting and Managing resources, have been consolidated into two broad disciplines.
Discipline Covers topics relating to: Broad content covered: Weighting
1 external stakeholders Recording, reporting and evaluation of financial
Information and corporate governance
50%
2 Internal accounting processes manufacturing, forecasting, as well internal auditing, and control
50%

64 s e c t i o n 3 • a s s e s s m e n t ta s k s
Content covered in each paper.
Examination guidelines for:
GRaDE 11: PaPER 1 (Discipline 1)
Recording, Reporting and Evaluation of Financial information and Corporate Governance
1 Concepts relating to a partnership
2 Concepts relating to GaaP
3 Ledger accounts for a partnership; and the interpretation thereof
4 Financial accounting of non-profit organisations (clubs) (not examinable)
5 accounting equation for a partnership
6 adjustments and Final accounts for a partnership; trial Balances
7 Income statement (statement of Comprehensive Income) for a partnership
8 Balance sheet (statement of Financial Position) and notes for a partnership
9 analysis and interpretation of the financial statements of a partnership *
10 Valuation of fixed assets, including additions, depreciation and disposal
11 Periodic and perpetual stock systems – concepts and reporting
12 ethical behaviour in financial environments* Financial indicators for Financial Reporting:
Gross profit on sales; Gross profit on cost of sales; net profit on sales; Operating expenses on sales; Operating profit on sales; Current ratio; acid-test ratio; stock turnover rate; stock holding period; average debtors collection period; average creditors payment period; solvency ratio; Return on Partners’ equity
Examination guidelines for:
GRaDE 11: PaPER 2 (Discipline 2)
manufacturing, Forecasting and internal auditing and Control
1 Preparation of bank and creditors reconciliations
2 Value-added tax (Vat) calculations
3 manufacturing concepts
4 Cost accounting – ledger accounts
5 Calculation of unit costs and break-even point
6 Preparation of Cash Budget for a sole trader
7 Preparation of Projected Income statement for a sole trader
8application of internal control and audit processes: cash, fixed assets, inventories, debtors, creditors, income and expenses (including salaries/wages) and including financial indicators #
9 Valuation of fixed assets, including depreciation and asset disposal
10 Periodic and perpetual inventory systems – concepts, recording and control
11 ethical behaviour in financial environments# Financial indicators for internal control:
Gross profit on cost of sales; net profit on sales; Operating expenses on sales; Operating profit on sales; stock turnover rate; stock holding period; average debtors collection period; average creditors payment period
Please note that while some of the topics are examined independently, topics such as Ethics and Internal Controls must be integrated throughout.
step 4 Determine which topics can be examined independently, and then determine the nature of each question; in other words, should it be factual, data response, critical evaluation, problem solving, application of knowledge, real-life situations, etc.

65s e c t i o n 3 • a s s e s s m e n t ta s k s
step 5 Consider the cognitive levels when setting questions. Your examination paper must cater for a range of cognitive levels and learner abilities as shown below:
Cognitive level skill Percentage of examination paper
knowledge and comprehension
Basic thinking skills
• Factualrecall
• Low-levelcomprehension
• Low-levelapplication
30% of the paper
application and analysis
moderately high thinking skills
• Moreadvancedapplication
• Interpretation
• Low-levelanalysis
40% of the paper
synthesis and evaluation
Higher order thinking skills
• Advancedanalyticalskills
• Evaluation
• Creativeproblem-solving
30% of the paper
An average of 10% of all examination papers should address problem-solving questions using critical and creative thinking.
step 6 Use the following table to help you set your examination paper according to the different cognitive levels. Fill in the marks to make up the range of abilities.
Question Low medium High
Q1
Q2
Q3
Q4
Q5
total mark
Desired mark 30% = 45 marks 40% = 60 marks 30% = 45 marks
step 7 Decide on the structure of each question according to the above cognitive level requirements. Your question should contain there “action” words.
Knowledge Comprehension application analysis synthesis Evaluation
Define
Identify
Demonstrate
List
name
explain
Distinguish
Interpret
Draw up
Construct
Post
Prepare
Calculate
Determine
apply
Compare
analyse
Interpret
Do
Report on
Discuss
Compare
advise
Comment
Recommend
motivate
step 8 Draw up the question and the memorandum simultaneously. Once you memorandum is complete, compile an answer book for the examination paper.

66 s e c t i o n 3 • a s s e s s m e n t ta s k s
step 9 Have the question and memorandum moderated before you have it printed. Ensure that the mark allocation for each question is correct, that there is enough space for the answers and that the numbering agrees with the examination paper.
Use the following table to assist you in ensuring that your examination paper was set according to the guidelines as in the CAPS document:
Paper 1Question Q1 Q2 Q3 Q4 Q5
topic marks marks marks marks marks
Concepts relating to a partnership
Concepts relating to GaaP
Ledger accounts of a partnership; and the interpretation thereof
Financial accounting of non-profit organisations (clubs) (not examinable)
accounting equation of a partnership
adjustments and Final accounts of a partnership; trial Balances
Income statement (statement of Comprehensive Income) of a partnership
Balance sheet (statement of Financial Position) and notes of a partnership
analysis and interpretation of financial statements of a partnership*
Valuation of fixed assets, including additions, depreciation and disposal
Periodic and perpetual stock systems – concepts and reporting
ethical behaviour in financial environments
tOtaL
/150
Paper 2
Question Q1 Q2 Q3 Q4 Q5
topic marks marks marks marks marks
Preparation of bank and creditors reconciliations
Value-added tax (Vat) calculations
manufacturing concepts
Cost accounting – ledger accounts
Calculation of unit costs and break-even point
Preparation of Cash Budget for a sole trader
Preparation of Projected Income statement for a sole trader
application of internal control and audit processes
Valuation of fixed assets, including depreciation and asset disposal
Periodic and perpetual inventory systems
ethical behaviour in financial environments
tOtaL
/150

67s e c t i o n 3 • a s s e s s m e n t ta s k s
November examination: Paper 1
accounting total: 150 marksGrade 11 time: 2 hours[For the learner]
instRUCtions anD inFoRmation1. You are provided with a question paper and an Answer booklet.2. The paper comprises THREE compulsory questions. Answer ALL these
questions.3. Use the formats provided in order to reflect your answer.4. Workings must be shown in order to achieve part-marks.5. You must attempt to comply with the suggested time allocations.6. Non-programmable calculators may be used.7. You may use a dark pencil or blue/black ink to answer the questions.
Question 1: 86 marks; 69 minutes
the topic of the question is: the learning outcomes covered are:
• Financial statements of a partnership and asset disposal
• Define and explain accounting concepts. • to record the information of a
partnership within the context of the accounting cycle
• Prepare the Final accounts and Financial statements of a partnership
• transactions in regards with the perpetual inventory system
Question 2: 45 marks; 36 minutes
the topic of the question is: the learning outcomes covered are:
• Interpretation of Financial statements • Ledger accounts of a partnership • Interpretation of the Financial statements
of a partnership
Question 3: 19 marks; 15 minutes
the topic of the question is: the learning outcomes covered are:
• Inventory systems • Comparing the perpetual and periodic inventory systems
• Internal control and audit processes

68 s e c t i o n 3 • a s s e s s m e n t ta s k s
Question 1 [86 marks; 69 minutes]
Partnership – Financial statements, and asset disposal
The information below is from the books of JC Traders, with partners J Jacobs and C Minnaar.
Required
1.1 Answer the following questions:1.1.1 Briefly explain why a business would write off depreciation on
its assets. (2)1.1.2 What type of account is Depreciation, and what effect will it
have on the profit of the business? (2)1.1.3 What type of account is Accumulated depreciation on vehicles? (1)1.1.4 According to the GAAP historical cost principle, fixed assets are
recorded at cost in the General Ledger but in the Balance Sheet they are is recorded at carrying value. Give a reason why you think this is so. (2)
1.2 Prepare the Income Statement for the year ended 28 February 2019. (52)1.3 Prepare the following notes to the Statement of Financial Position:
1.3.1 Current accounts (18)1.3.2 Trade and other payables (9)
information
tRiaL BaLanCE oF JC tRaDERs as at 28 FEBRUaRY 2019
Fol. Debit Credit
Balance sheet sectionCapital: Jacobs 200 000
Capital: minnaar 250 000
Current account: Jacobs 21 021
Current account: minnaar 10 124
Drawings: Jacobs 165 000
Drawings: minnaar 161 000
Vehicles 210 000
equipment 56 000
accumulated depreciation on vehicles 103 000
accumulated depreciation on equipment 13 500
trading stock 87 520
Debtors Control 32 736
Bank 95 600
Cash float 2 000
Fixed deposit: mB Bank (8% p.a.) 120 000
Creditors Control 37 800
Provision for bad debts 1 410

69s e c t i o n 3 • a s s e s s m e n t ta s k s
nominal accounts sectionsales 1 696 699
Cost of sales 942 000
Debtors allowance 1 099
Water and electricity 13 448
Rent expense 105 440
Bad debts 1 044
telephone 14 552
Insurance 11 370
salaries 288 000
Pension fund contributions 4 320
Discount received 2 445
Bad debts recovered 680
Interest on fixed deposit ?
stationery 3 220
Interest on current account 330
Bank charges 2 412
2 326 885 2 326 885
adjustments and additional information: • Goods with a selling price R936 was returned by debtor, L King and has not
been entered in the books. The business uses a mark-up of 80% on cost. • After a physical stocktake on 28 February 2019, the following stock was on
hand:– Trading stock, R85 700– Stationery, R410
• J Pretorius, a debtor whose debt had been written off during December 2018, paid an amount of R600 on 21 February 2019. This amount was credited to Debtors Control.
• Provision for bad debts must be adjusted to 4% of outstanding debtors. • The details of an employee who was employed on 1 February 2019 were
omitted from the Salaries Journal for February by mistake. The following details apply:– Gross monthly salary, R8 000– PAYE deduction, R1 430– Pension fund, R200– For every R1 the employee contributes to the pension fund, the employer
contributes R1,50. • The rent for the building increases annually by 6% on 1 January. The rent
agreement stipulates that rent should be paid one month in advance and, therefore, the rent for March 2019 has already been paid.
• The following expenses for February 2019 were still payable on 28 February 2019:– Water and electricity, R1 023– Telephone, R764

70 s e c t i o n 3 • a s s e s s m e n t ta s k s
• Interest on the fixed deposit is capitalised, in other words, re-invested on the fixed deposit. A statement received from the bank on 28 February 2019 showed the following with regards to the fixed deposit (no entry was made of this):
Balance of fixed deposit on 1 march 2018 R120 000Interest for the year capitalised R9 600Balance of fixed deposit on 28 February 2019 R129 600
• Insurance includes a premium of R2 400 that was paid for the period 1 January 2019 to 30 June 2019.
• Depreciation is calculated as follows:– On equipment, R11 200– On vehicles, R14 400– A vehicle (cost price, R90 000 and accumulated depreciation on
28 February 2019 of R69 650) was sold for cash on 28 February 2019 for R24 000. This transaction has not been recorded.
• The partnership agreement stipulates the following:– Partners are entitled to interest on capital at 12% p.a. – Jacobs has increased her capital on 1 December 2018 with R50 000. It was
correctly recorded.– The partners receive a monthly salary of R9 000 each.– Jacobs and Minnaar share profits (or losses) in the ratio 3 : 2.
70

71s e c t i o n 3 • a s s e s s m e n t ta s k s
Question 2 [45 marks; 36 minutes]
analysis and interpretation of Financial statements
Checkmate Suppliers is a business that imports and sells board games to retail businesses. It is a partnership with partners S Stof berg and C du Toit.
Required
Study the information and answer the questions that follows.
information
• The business applies a strict mark-up percentage of 100% on cost. • All purchases of stock are on credit. Suppliers are extremely strict in cutting
off supply, if debtors do not meet their 90-day terms of credit. • The business policy in regards to debtors is to allow 45 days credit. If the
customer pays within 30 days, they are granted a 1% settlement discount. • The profit-sharing ratio between Stof berg and du Toit is 3 : 2. Du Toit’s profit
share for the financial year ended 30 June 2019 is, therefore, R517 000. • Extract from the Income Statement of Checkmate Suppliers for the year
ended 30 June 2019:
Revenue/sales (90% on credit) 5 000 000
Cost of sales (2500 000)
Operating expenses (825 000)
Interest on loan (382 500)
net profit for the year 1 292 500
• Extract from the Balance Sheet as at 30th June:
2019 2018
Owners’ equity 2 500 000 1 300 000
Capital: stofberg 1 000 000 750 000
Capital: Du toit 750 000 500 000
Current account: stofberg 400 000 30 000
Current account: Du toit 350 000 20 000
Loan: XYZ Bank 2 500 000 1 750 000
Current liabilities 300 000 750 000
Creditors Control 300 000 650 000
Bank overdraft 0 100 000
tangible/Fixed assets 1 800 000 1 100 000
Current assets 3 500 000 2 700 000
Inventories 2 250 000 2 000 000
Debtors Control 1 200 000 700 000
Cash 50 000 0

72 s e c t i o n 3 • a s s e s s m e n t ta s k s
• The following ratios have been calculated:2019 2018
Current ratio 11,67 : 1 3,6 : 1
acid-test ratio ? 0,93 : 1
Operating expenses on sales ? 21%
number of days stock on hand ? 240 days
Debtors collection period ? 51 days
Creditors payment period 69 days 91 days
Debt : equity ? 1,35 : 1
Percentage earnings by partner stofberg ? 31%
Questions
2.1 Calculate the following ratios for 2019 (round off to 2 decimal places):2.1.1 Acid-test ratio (3)2.1.2 Percentage operating expenses on sales (3)2.1.3 Number of days stock on hand (4)2.1.4 Debtors collection period (4)2.1.5 Debt : Equity (3)2.1.6 Percentage earnings by partner Stof berg (5)
2.2 Comment on the liquidity situation at the end of the current financial year. (4)
2.3 Comment on the credit control of the business. (4)2.4 Are the stock levels of Checkmate Suppliers appropriate? Explain. (3)2.5 Has the new policy for operating expenses been effective this
financial year? Explain. (3)2.6 Comment on the risk facing Checkmate Suppliers by referring to
the Debt : Equity ratio. (3)2.7 C du Toit has offered his partner S Stof berg R2 500 000 to buy his
share of the business. What advice would you give Stof berg about this offer? Should he accept or reject the offer? Is this a fair offer? (6)

73s e c t i o n 3 • a s s e s s m e n t ta s k s
Question 3 (19 marks: 15 minutes)
inventory systems
The following information is for Mudpie Traders, a business that uses a mark-up of 40% on cost.
Required
Study the information and answer the questions that follows.
information
The following accounts appeared in the books of Mudpie Traders.
General Ledger of mudpie traders
Dr Purchases n2 Cr
Date Details Fol. amount Date Details Fol. amount
2019 Feb Balance b/d 567 015 00
2019 Feb 28 Creditors allowances CAJ 12 430 00
Donations GJ 1 560 00
Drawings GJ 800 00
Trading account GJ 552 225 00
567 015 00 567 015 00
Dr trading account n2 Cr
Date Details Fol. amount Date Details Fol. amount
2019 Feb 28 Opening stock GJ 130 800 00
2019 Feb 28 Sales GJ 797 194 00
Purchases GJ ? Closing stock GJ 89 320 00
Carriage on purchases GJ 10 230 00
Profit and loss account GJ ?
Questions
3.1 Calculate the cost of sales for the period (4)3.2 Calculate the actual mark-up achieved during the period. (4)3.3 Calculate the stock turnover rate for the period. The rate of stock
turnover in the previous financial period was 4 times per year. (4)3.4 The mark-up policy of the business is 40% on cost. Suggest
TWO reasons why the business did not achieve this. (4)3.5 Name the two inventory systems. (2)3.6 Which inventory system does Mudpie Traders use? (1)

74 s e c t i o n 3 • a s s e s s m e n t ta s k s
November examination: Paper 1
accounting total: 150 marksGrade 11 time: 2 hoursanswer booklet
Question topic total mark mark achieved
1 Partnership – Financial statements, and asset disposal, and asset disposal 86
2 analysis and interpretation of Financial statements 45
3 Inventory systems 19
totaL 150
Question 1 [86 marks; 69 minutes]
Partnership – Financial statements, and asset disposal
1.1.1 Briefly explain why a business would write off depreciation on its assets.
2
1.1.2 What type of account is Depreciation, and what effect will it have on the profit of the business?
2
1.1.3 What type of account is Accumulated depreciation on vehicles?
1
1.1.4 According to the GAAP historical cost principle, fixed assets are recorded at their cost price in the General Ledger but in the Balance Sheet they are recorded at carrying value. Give a reason why you think this is so.
2

75s e c t i o n 3 • a s s e s s m e n t ta s k s
1.2
JC traders inComE statEmEnt FoR tHE YEaR EnDED 28 FEBRUaRY 2019
sales
Cost of sales
Gross profit
Other income
Gross operating income
Operating expenses
Water and electricity
Rent expense
Bad debts
telephone
Insurance
salaries
Pension fund contributions
stationery
Bank charges
Operating profit
Interest income
nEt PRoFit FoR tHE YEaR
52
1.3 Notes to the Financial Statements of JC Traders for the year ended 28 February 2019 1.3.1 Current accounts
J Jacobs C minnaar total
net profit according to Income statement
Interest on capital
salaries
Primary distribution
share in remaining profit
Drawings for the year
Retained income for the year
Balance at the beginning of the year
Balance at the end of the year
18
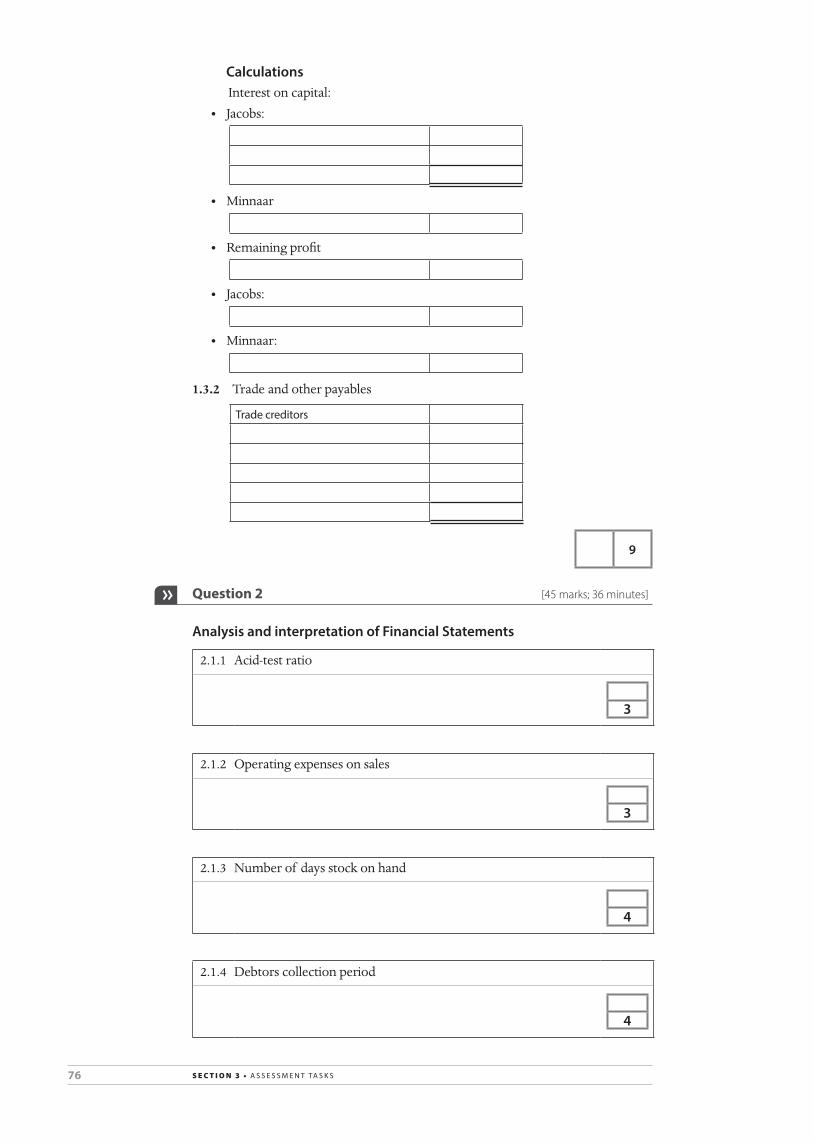
76 s e c t i o n 3 • a s s e s s m e n t ta s k s
Calculations Interest on capital:
• Jacobs:
• Minnaar
• Remaining profit
• Jacobs:
• Minnaar:
1.3.2 Trade and other payables
trade creditors
9
Question 2 [45 marks; 36 minutes]
analysis and interpretation of Financial statements
2.1.1 Acid-test ratio
3
2.1.2 Operating expenses on sales
3
2.1.3 Number of days stock on hand
4
2.1.4 Debtors collection period
4

77s e c t i o n 3 • a s s e s s m e n t ta s k s
2.1.5 Debt : Equity ratio
3
2.1.6 Percentage earnings by partner Stof berg
5
2.2 Comment on the liquidity situation at the end of the current financial year.
4
2.3 Comment on the business’s credit control.
4
2.4 Are the stock levels of Checkmate Suppliers appropriate? Explain.
3

78 s e c t i o n 3 • a s s e s s m e n t ta s k s
2.5 Has the new policy for operating expenses been effective during the financial year? Explain.
3
2.6 Comment on the risk that Checkmate Suppliers faces by referring to the Debt : Equity ratio.
4
2.7 C du Toit has offered his partner S Stof berg R2 500 000 to buy his share of the business. What advice would you give Stof berg about this offer? Should he accept or reject the offer? Is this a fair offer?
4

79s e c t i o n 3 • a s s e s s m e n t ta s k s
Question 3 [19 marks; 15 minutes]
inventory systems
3.1 Calculate the cost of sales total for the period.
4
3.2 Calculate the actual mark-up achieved during the period.
4
3.3 Calculate the stock turnover rate for the period.
4
3.4 The mark-up policy of the business is 40% on cost. Suggest TWO reasons why the business did not achieve this.
4
3.5 Name the two inventory systems.
2
3.6 Which inventory system does Mudpie Traders use?
1

80 s e c t i o n 3 • a s s e s s m e n t ta s k s
November examination: Paper 1
accounting total: 150 marksGrade 11 time: 2 hoursmarking memorandum
Question 1 [86 marks; 69 minutes]
Partnership – Financial statements, and asset disposal
1.1.1 Briefly explain why a business would write off depreciation on its assets.
The value of the assets decrease because of the use of the asset over time. ✓✓ 2
1.1.2 What type of account is Depreciation, and what effect will it have on the profit of the business?
Expense ✓
Decrease profits ✓ 2
1.1.3 What type of account is Accumulated depreciation on vehicles?
Negative asset (or contra asset) ✓1
1.1.4 According to the GAAP historical cost principle, fixed assets are recorded at their cost price in the General Ledger but in the Balance Sheet they are recorded at carrying value. Give a reason why you think this is so.
The Balance Sheet should reflect the financial position as realistically as possible, and, therefore, it is shown at the carrying value ✓✓ 2

81s e c t i o n 3 • a s s e s s m e n t ta s k s
1.2
JC traders inComE statEmEnt FoR tHE YEaR EnDED 28 FEBRUaRY 2019
sales (1 696 699 ✓ – 1 099 ✓ – 936 ✓) 1 694 664
Cost of sales (942 000 ✓ – 520 ✓) (941 480)
Gross profit (✓) 753 184
Other income (✓) 7 489
Discount received ✓ 2 445
Bad debts recovered (680 ✓ + 600 ✓) 1 280
Provision for bad debts adjustment (1 410 ✓ – 1 296 ✓✓) (✓) 114
Profit on asset (90 000 ✓ – 69 650 ✓ – 24 000 ✓) 3 650
Gross operating income 760 673
Operating expenses (✓) (471 343)
Water and electricity (13 448 ✓ + 1 023 ✓) 14 471
Rent expense (105 440 ✓ – 8 480 ✓✓✓) 96 960
Bad debts ✓ 1 044
telephone (14 552 ✓ + 764 ✓) 15 316
Insurance (11 370 ✓ – 1 600 ✓✓) (✓) 9 770
salaries (288 000 ✓ + 8 000 ✓✓) (✓) 296 000
Pension fund contributions (4 320 ✓ + 300 ✓✓) (✓) 4 620
stationery (3 220 ✓ – 410 ✓) 2 810
Bank charges ✓ 2 412
trading stock deficit (87 520 + 520 – 85 700) ✓✓✓ 2 340
Depreciation (11 200 ✓ + 14 400 ✓) 25 600
Operating profit (✓) 289 330
Interest income (330 ✓ + 9 600 ✓✓) 9 930
nEt PRoFit FoR tHE YEaR (✓) 299 260
52
1.3 Notes to the Financial Statements of JC Traders for the year ended 28 February 2019 1.3.1 Current accounts
J Jacobs C minnaar total
net profit according to Income statement 147 756 151 504 299 260
Interest on capital ✓✓✓✓19 500 ✓✓30 000 49 500
salaries ✓108 000 ✓108 000 216 000
Primary distribution 127 500 138 000 265 500
share in remaining profit (✓✓)20 256 (✓✓)13 504 33 760
Drawings for the year ✓(165 000) ✓(161 000) (326 000)
Retained income for the year (17 244) (9 496) (26 740)
Balance at the beginning of the year ✓21 021 ✓(10 124) 10 897
Balance at the end of the year (✓)3 777 (✓)(19 620) (15 843)
18

82 s e c t i o n 3 • a s s e s s m e n t ta s k s
Calculations Interest on capital:
• Jacobs:
R150 000 × 12% × 9 ___ 12 R13 500
R200 000 × 12% 3 ___ 12 R6 000
R19 500
• Minnaar
R250 000 × 12% R30 000
• Remaining profit
R(299 260 – 127 500 – 138 000) R33 760
• Jacobs:
R33 760 × 3 __ 5 R20 256
• Minnaar:
R33 760 × 2 __ 5 R13 504
1.3.2 Trade and other payables
trade creditors ✓37 800
saRs (PaYe) ✓1 430
Pension fund (200 + 300) ✓✓500
Creditors for salaries ✓✓6 370
accrued expenses (1 023 + 764) ✓✓1 787
(✓)47 887
9
Question 2 [45 marks; 36 minutes]
analysis and interpretation of Financial statements
2.1.1 Acid-test ratio
(3 500 000 – 2 250 000 ✓) : 300 000 ✓ = 1 250 000 : 300 000 = 4,17 : 1 ✓ 3
2.1.2 Operating expenses on sales
825 000 ✓
_________ 5 000 000 ✓ × 100 = 16,5% ✓ 3
2.1.3 Number of days stock on hand
= 2 125 ✓
______ 2 500 ✓ × 365 ✓ = 310 days ✓ 4

83s e c t i o n 3 • a s s e s s m e n t ta s k s
2.1.4 Debtors collection period
950 ✓
______ 4 500 ✓ × 365 ✓ = 77 days ✓ 4
2.1.5 Debt : Equity ratio
2 500 ✓ : 2 500 ✓ = 1 : 1 ✓ 3
2.1.6 Percentage earnings by partner Stof berg
775 500 ✓✓
__________ 1 090 000 ✓✓ × 100
= 71,15% ✓ 5
2.2 Comment on the liquidity situation at the end of the current financial year.
Current ratio improved from 3,6 : 1 to 11,67 : 1. ✓
Acid-test ratio improved from 0,93 : 1 to 4,17 : 1. ✓
Far more liquid than the previous year. ✓
They will be able to meet short term obligations. ✓
The problem is that too much money is tied up unproductively in debtors and cash. 4
2.3 Comment on the business’s credit control.
Credit control is poor. ✓
Debtors pay late by 32 days (77 days – 45 days). Need to tighten up debtors collection by offering greater settlement discounts. ✓
Creditors are paid 22 days early without any financial benefits. However, this could possibly generate goodwill from suppliers. ✓✓
Any acceptable answer 4

84 s e c t i o n 3 • a s s e s s m e n t ta s k s
2.4 Are the stock levels of Checkmate Suppliers appropriate? Explain.
Stock levels are very high, and have increased from 240 days on hand
to 310 days on hand. ✓✓
Storing and handling cost might be a problem. ✓
Any acceptable answer 3
2.5 Has the new policy for operating expenses been effective during the financial year? Explain.
Yes, their control over expenses has improved ✓ as the percentage has
improved from 21% to 16,5%. ✓
Less Rands from each sale are being spent on operating expenses. ✓
Any acceptable answer 3
2.6 Comment on the risk that Checkmate Suppliers faces by referring to the Debt : Equity ratio.
The Debt : Equity ratio has improved from 1,35 : 1 to 1 : 1 ✓
The risk is however still high (highly geared) ✓✓
Any acceptable answer4
2.7 C du Toit has offered his partner S Stof berg R2 500 000 to buy his share of the business. What advice would you give Stof berg about this offer? Should he accept or reject the offer? Is this a fair offer?
Stof berg is earning 71,15% on the capital invested in the business – this is very good and he would not easily get that return in an
alternative investment. ✓✓
He should reject the offer. ✓
It is not a fair offer. ✓
Any acceptable answer 4

85s e c t i o n 3 • a s s e s s m e n t ta s k s
Question 3 [19 marks; 15 minutes]
inventory systems
3.1 Calculate the cost of sales total for the period.
R(130 800 ✓ + 552 225 ✓ + 10 230 ✓ – 89 320 ✓) = R603 935 4
3.2 Calculate the actual mark-up achieved during the period.
(797 194 – 603 935)
_______________ 603 935 × 100
= 193 259 ✓✓
_________ 603 935 ✓ × 100
= 32% ✓ (31,99%) 4
3.3 Calculate the stock turnover rate for the period.
603 935 ✓
_________ 110 060 ✓✓
= 5,5 times per year ✓ 4
3.4 The mark-up policy of the business is 40% on cost. Suggest TWO reasons why the business did not achieve this.
The business sold goods at a lower price to increase the stock turnover rate from 4 times per year to 5,5 times per year. ✓✓
Theft of/damage to stock ✓✓4
3.5 Name the two inventory systems.
Perpetual ✓
Periodic ✓ 2
3.6 Which inventory system does Mudpie Traders use?
Periodic ✓1

86 s e c t i o n 3 • a s s e s s m e n t ta s k s
November examination: Paper 2
accounting total: 150 marksGrade 11 time: 2 hours[For the learner]
instructions
1. Answer all the questions.2. A special ANSWER BOOKLET is provided where ALL the questions
must be answered.3. A formula page for financial indicators is provided at the back of
the paper.4. Where applicable, show all calculations to ONE decimal point.5. You must show ALL workings so that part-marks can be awarded.6. Read the instructions carefully.7. Candidates will lose points for: The omission of important dates. The use of non-accepted abbreviations Overwrite figures Redundant entries/foreign items8. Non-programmable calculators may be used.9. No pages may be removed from the Answer booklet.10. Use the information in the table below as a guide when you answer the
questions. Try not to deviate from it.
Question topic marks time (minutes)
1 manufacturing 33 26
2 Debtors reconciliation 40 32
3 Value-added tax (Vat) 21 17
4 Budgeting 40 32
5 trading stock and controls 16 13
totaL 150 120

87s e c t i o n 3 • a s s e s s m e n t ta s k s
Question 1: Manufacturing [33 marks; 26 minutes]
1.1 Place a tick in the correct column to identify the type of cost associated with the description. (8)
DescriptionDirect
material costs
Direct labour costs
Factory overhead
costs
1.1.1 Depreciation on factory machines
1.1.2 Wages paid the worker who make the items
1.1.3 Insurance on factory machines
1.1.4 Raw materials used to make the items
1.1.5 salary paid to factory supervisor
1.1.6 Indirect materials used in the production of the items
1.1.7 Wages paid to factory security
1.1.8 Factory rent paid monthly
1.2 Use the information below to calculate the following for August 2020:1.2.1 Direct labour costs. (11)1.2.2 Direct material costs. (4)1.2.3 Factory overhead costs. (5)1.2.4 The unit cost per item of producing 50 000 units. (5)
information
A Workers in the manufacturing process: • There are eight workers who each earn R50 per hour (normal rate). The
eight workers worked a total of 1 472 hours for August. • The eight workers also worked overtime during August, and earned
double the normal rate per hour. Each worker worked 32 hours overtime.
B Raw materials: • Raw materials bought for cash during August R927 500 • Raw materials bought on credit during August R1 784 400 • Raw materials returned to creditors during August R86 800
C Factory overhead costs for August: • Factory insurance R12 200 • Depreciation on factory machines R18 300 • Depreciation on office equipment R7 300 • Factory rent R72 000 • Factory supervisor’s salary R38 000 • Office secretary’s salary R45 000

88 s e c t i o n 3 • a s s e s s m e n t ta s k s
Question 2: Debtors reconciliation [40 marks; 32 minutes]
The Tee-Shirt Shop prepared the following Debtors Control account. Below is a list of debtors accounts as at 30 July 2020. There are errors and omissions, and the Debtors Control account must be reconciled with the Debtors List.
information
General Ledger of the tee-shirt shop
Dr DEBtoRs ContRoL B Cr
Date Details Fol. amount Date Details Fol. amount
2020 Jul 1 Balance b/d 72 300 00
2020 Jul 31 Bank and discount allowed CRJ 69 800 00
31 Sales DJ 63 100 00 Debtors allowances DAJ 2 100 00
Bank (R/D cheque) CPJ 2 500 00 Journal credits GJ 8 000 00
Petty cash PCJ 4 000 00 Balance c/d 62 600 00
Journal debits GJ 600 00
142 500 00 142 500 00
Aug 1 Balance b/d 62 600 00
the tee-shirt shop DEBtoRs List as at 31 JULY 2021
Debtor Debit Credit
a mckay 21 000
a Zwane 26 400
t Olyn 16 700
D smit 0
J erasmus 2 000
Debtors Control 64 100 2 000
Errors and omissions:a) The total of the Debtors Journal should be R65 100 not R63 100.b) The total of the Debtors Allowances Journal is overcast by R1 000.c) An invoice for R9 450 was issued to A McKay but it was posted to her
account as R4 950. The correct amount was posted to the control account.d) An invoice for R2 000 was issued T Olyn but it was posted to the account
of J Erasmus by mistake.e) A receipt issued to A Zwane for R8 000 was correctly entered in the Cash
Receipts Journal but posted to his account as R3 000.f ) Interest of R450 must be charged to the account of A Zwane.g) The bank returned D Smit’s cheque of R7 500, marked R/D. The cheque
was received in full settlement of her account of R8 500. After numerous attempts to contact her, it was decided to write off the account off as a bad debt.
Required:2.1 Reconcile the Debtors Control account with the Debtors List. (36)2.2 Why is it important to reconcile debtors accounts at the end of each
month? (2)2.3 The owner of The Tee-Shirt Shop is concerned that the debtors clerk
makes too many errors. How could the owner ensue that the clerk improves her work performance? Give ONE point. (2)

89s e c t i o n 3 • a s s e s s m e n t ta s k s
Question 3: Value-added tax (VAT) [21 marks; 17 minutes]
The following information was extracted from the books of The Golf Shop, a registered VAT vendor.
informationThe following was extracted from the books for September 2020: • Total sales, exclusive of VAT R450 000 • Total purchases, inclusive of VAT R303 600
RequiredAnswer the following questions3.1 What is a registered VAT vendor? (2)3.2 What is the percentage for VAT currently charged in South Africa? (1)3.3 Identify another form of tax that The Golf Shop will be liable to
SARS for. (2)3.4 The owner is unsure on how to calculate the correct amount of VAT
to be paid to SARS at the end of the VAT period. Briefly explain how he should do this. (3)
3.5 What is the difference between VAT exempt and zero-rated VAT? (4)3.6 Use the information provided to calculate the amount of VAT due
to/by SARS at the end of September 2020. State whether this amount is due to SARS or due by SARS. (6)
3.7 Donovan who owns The Golf Shop feels that he pays too much VAT to SARS. He would like the bookkeeper to increase his VAT on purchases by falsifying purchase invoices (inclusive of VAT) for the
amount of R395 600. Should the bookkeeper follow Donovan’s request? Yes/No. Justify your answer and mention ONE consequence, if he should do so. (3)
Question 4: Budgeting [40 marks; 32 minutes]
4.1 Melissa Gee who owns Baby-Boo Traders asks you to help her to draw up a Projected Income Statement for December 2020 and January 2021.
information Extract from the Projected Income Statement:
December 2020
January 2021
sales (45% cash and 55% credit) 1 200 000 800 000
Cost of sales (4.1) (4.2)
advertising 40 000 (4.3)
Bad debts (4.4) 13 200
Rent expense (4.5) 16 500 18 975
salaries 45 000 (4.6)
telephone (4.7) 4 500 1 800
Required Study the information above and answer these questions.
4.1.1 Gross profit on cost of sales (profit mark-up) for December 2020 will be calculated at 60%. Calculate cost of sales for December 2020. (3)

90 s e c t i o n 3 • a s s e s s m e n t ta s k s
4.1.2 Gross profit on sales (profit margin) for January 2021 will be calculated at 37,5%. Calculate cost of sales for January 2021. (3)
4.1.3 Advertising expense are expected to decrease by 25% during January 2021. Calculate the advertising expense amount for January 2021. (3)
4.1.4 Bad debts will remain at 3% of credit sales for the month. Calculate the bad debts amount for December 2020. (5)
4.1.5 By what percentage is the business going to increase rent by on 1 January 2021? Show your calculation. (4)4.1.6 Melissa has three employees each earning the same salary.
Because she is expecting lower sales in January 2021, she has decided to retrench one of her employees. Once she has retrenched the employee, she will increase the salary of the
other two employees by 10% each. Calculate the salaries amount for January 2021. (6)4.1.7 Melissa is very upset because of the high telephone bill in
December 2020. She is accusing one of her employees of making phone calls illegally. What controls could Melissa put in place to prevent this from happening? Mention TWO controls. (2)
4.2 Melissa is also looking for help with her Cash Budget.
information Extract from the Cash Budget for December 2020 and January 2021:
December 2020
January 2021
Cash surplus / (shortfall) for the month 170 200 (190 700)
Opening bank balance 72 600 (b)
Closing bank balance (a) (c)
Required Study the information above and answer these questions:
4.2.1 Calculate a) to c) on the Cash Budget above. (7)4.2.2 Why is it important for a company to draw up a Cash Budget? (2)4.2.3 Choose which statement bests describes the shortfall during
January 2021. Choose the most appropriate answer and write only that letter.
a) There is a shortfall because cash receipts are more than cash payments.
b) There is a shortfall because cash receipts are less than cash payments. (1)
4.2.4 Explain the difference between a Cash Budget and a Projected Income Statement. (4)

91s e c t i o n 3 • a s s e s s m e n t ta s k s
Question 5: Trading stock and controls [16 marks; 13 minutes]
Study the Trading Stock account below and answer the questions that follow:
Dr tRaDinG stoCK B Cr
Date Details Fol. amount Date Details Fol. amount
2020 Sep 1 Balance b/d 517 800 00
2020 Sep 30 Cost of sales 632 600 00
30 Bank (5.1) Cost of sales 421 910 00
Creditors Control (credit purchases) 486 000 00 Drawings (5.4) 73 400 00
Cost of sales (5.2) 37 620 00Creditors Control (credit returns) 14 580 00
Trading stock deficit 27 930 00
5.1 If cash purchases are 60% of total purchases, calculate cash purchases. (4)5.2 What transaction gave rise to the entry of R37 620. Choose the most
appropriate answer and write only the letter on the answer sheet:a) Trading stock was sold on credit.b) A debtor returned trading stock.c) Trading stock was sold for cash. (1)
5.3 From which subsidiary journal was the entry of R73 400 posted. (1)5.4 Why is there an entry for drawings on the credit side of the Trading stock account? (2)5.5 What is the percentage credit returns on credit purchases made by
creditors during September 2020? (4)5.6 A physical stock take revealed that there was R600 000 stock at the end
of September 2020. This means that there was a trading stock deficit of R27 930.
Mention TWO control measures that the business can put in place to prevent stock from going missing. (4)
FoRmULaE:
GRaDE 10 aCCoUntinGFinanCiaL inDiCatoR FoRmULa sHEEt
Gross profit
_________ sales × 100 ___ 1 Gross profit
_________ Cost of sales × 100 ___ 1 net profit
_______ sales × 100 ___ 1
Operating expenses
_______________ sales × 100 ___ 1 Operating profit
____________ sales × 100 ___ 1
Current assets : Current liabilities (Current assets – Inventories) : Current liabilities
(trade and other receivables + Cash and cash equivalents) : Current liabilities
net profit
___________ Owner’s equity × 100 ___ 1 total assets : total liabilities

92 s e c t i o n 3 • a s s e s s m e n t ta s k s
November examination: Paper 2
accounting total: 150 marksGrade 11 time: 2 hoursanswer booklet
instructions
1. Answer all the questions.2. A special ANSWER BOOKLET is provided where ALL the questions
must be answered.3. A formula page for financial indicators is provided at the back of
the paper.4. Where applicable, show all calculations to ONE decimal point.5. You must show ALL workings so that part-marks can be awarded.6. Read the instructions carefully.7. Candidates will lose points for: The omission of important dates. The use of non-accepted abbreviations Overwrite figures Redundant entries/foreign items8. Non-programmable calculators may be used.9. No pages may be removed from the Answer booklet.10. Use the information in the table below as a guide when you answer the
questions. Try not to deviate from it.
Question topic marks time (minutes)
1 manufacturing 33 26
2 Debtors reconciliation 40 32
3 Value-added tax (Vat) 21 17
4 Budgeting 40 32
5 trading stock and controls 16 13
totaL 150 120
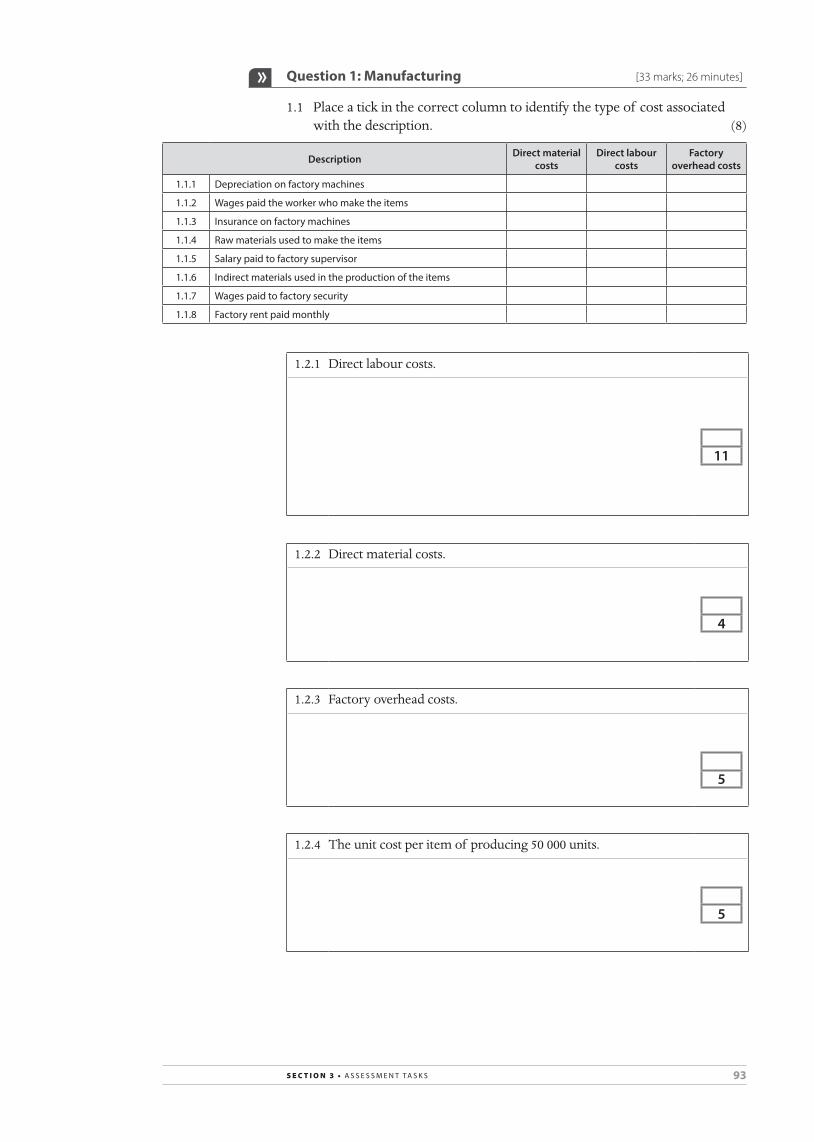
93s e c t i o n 3 • a s s e s s m e n t ta s k s
Question 1: Manufacturing [33 marks; 26 minutes]
1.1 Place a tick in the correct column to identify the type of cost associated with the description. (8)
Description Direct material costs
Direct labour costs
Factory overhead costs
1.1.1 Depreciation on factory machines
1.1.2 Wages paid the worker who make the items
1.1.3 Insurance on factory machines
1.1.4 Raw materials used to make the items
1.1.5 salary paid to factory supervisor
1.1.6 Indirect materials used in the production of the items
1.1.7 Wages paid to factory security
1.1.8 Factory rent paid monthly
1.2.1 Direct labour costs.
11
1.2.2 Direct material costs.
4
1.2.3 Factory overhead costs.
5
1.2.4 The unit cost per item of producing 50 000 units.
5
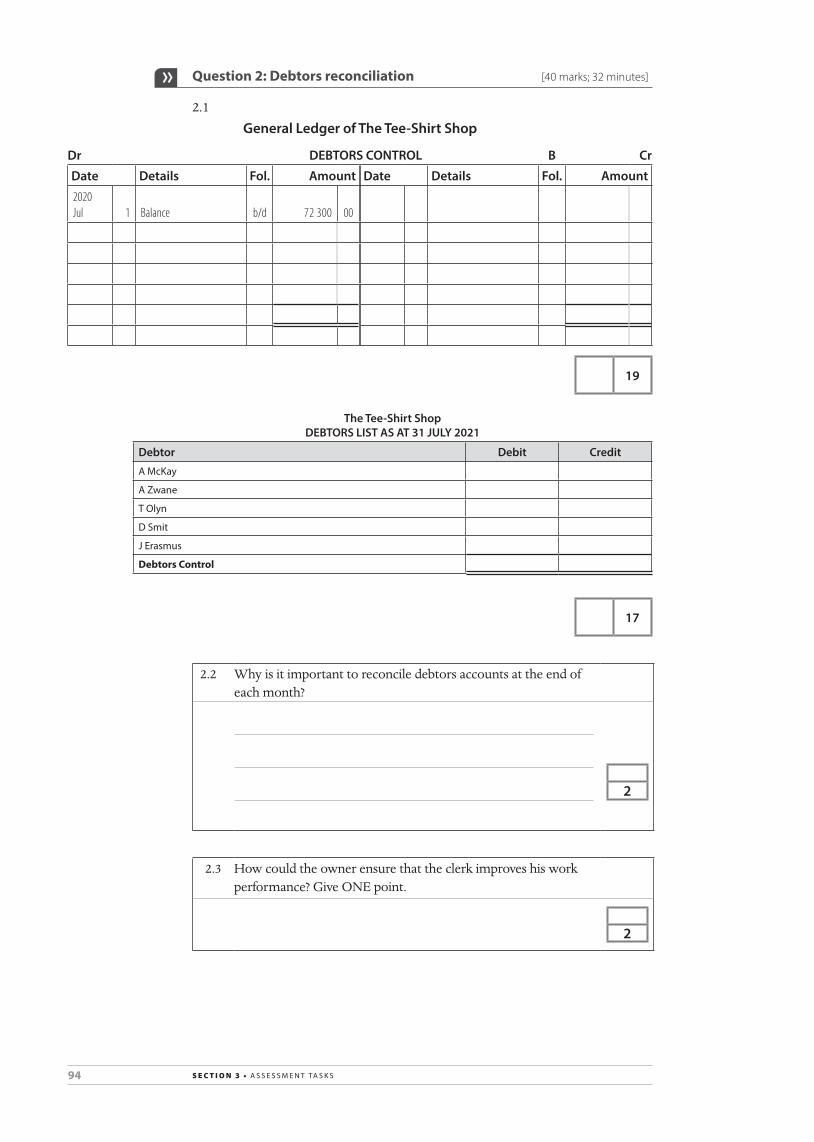
94 s e c t i o n 3 • a s s e s s m e n t ta s k s
Question 2: Debtors reconciliation [40 marks; 32 minutes]
2.1 General Ledger of the tee-shirt shop
Dr DEBtoRs ContRoL B Cr
Date Details Fol. amount Date Details Fol. amount
2020 Jul 1 Balance b/d 72 300 00
19
the tee-shirt shop DEBtoRs List as at 31 JULY 2021
Debtor Debit Credit
a mckay
a Zwane
t Olyn
D smit
J erasmus
Debtors Control
17
2.2 Why is it important to reconcile debtors accounts at the end of each month?
2
2.3 How could the owner ensure that the clerk improves his work performance? Give ONE point.
2

95s e c t i o n 3 • a s s e s s m e n t ta s k s
Question 3: Value-added tax (VAT) [21 marks; 17 minutes]
3.1 What is a registered VAT vendor?
2
3.2 What is the percentage for VAT currently charged in South Africa?
1
3.3 Identify another form of tax that The Golf Shop will be liable to SARS for.
2
3.4 The owner is unsure on how to calculate the correct amount of VAT to be paid to SARS at the end of the VAT period. Briefly explain how he should do this.
3
3.5 What is the difference between VAT exempt and zero-rated VAT?
4
3.6 Use the information provided to calculate the amount of VAT due to/by SARS at the end of September 2020. State whether this amount is due to SARS or due by SARS.
6

96 s e c t i o n 3 • a s s e s s m e n t ta s k s
3.7 Should the bookkeeper follow Donovan’s request? Yes/No. Justify your answer and mention ONE consequence, if he should do so.
3
Question 4: Budgeting [40 marks; 32 minutes]
4.1.1 Gross profit on cost of sales (profit mark-up) for December 2020 will be calculated at 60%. Calculate cost of sales for December 2020.
3
4.1.2 Gross profit on sales (profit margin) for January 2021 will be calculated at 37,5%. Calculate cost of sales for January 2021.
3
4.1.3 Advertising expense are expected to decrease by 25% during January 2021. Calculate the advertising expense amount for January 2021.
3
4.1.4 Bad debts will remain at 3% of credit sales for the month. Calculate the bad debts amount for December 2020.
5
4.1.5 By what percentage is the business going to increase rent by on 1 January 2021? Show your calculation.
4

97s e c t i o n 3 • a s s e s s m e n t ta s k s
4.1.6 Calculate the salaries amount for January 2021.
6
4.1.7 What controls could Melissa put in place to prevent this from happening? Mention TWO controls.
2
4.2.1 Calculate a) to c) on the Cash Budget above.
a)
b)
c) 7
4.2.2 Why is it important for a company to draw up a Cash Budget?
2
4.2.3 Choose which statement bests describes the shortfall during January 2021. Choose the most appropriate answer and write only that letter.
1
4.2.4 Explain the difference between a Cash Budget and a Projected Income Statement.
4

98 s e c t i o n 3 • a s s e s s m e n t ta s k s
Question 5: Trading stock and controls [16 marks; 13 minutes]
5.1 If cash purchases are 60% of total purchases, calculate cash purchases.
4
5.2 Which transaction gave rise to the entry of R37 620? Choose the most appropriate answer and write only that letter:
1
5.3 From which subsidiary journal was the entry of R73 400 posted?
1
5.4 Why is there an entry for drawings on the credit side of the Trading stock account?
2
5.5 What is the percentage credit returns on credit purchases made by creditors during September 2020?
4
5.6 Mention TWO control measures that the business can put in place to prevent stock from going missing.
4

99s e c t i o n 3 • a s s e s s m e n t ta s k s
November examination: Paper 2
accounting total: 150 marksGrade 11 time: 2 hoursmemorandum
Question 1: Manufacturing [33 marks; 26 minutes]
1.1 Place a tick in the correct column to identify the type of cost associated with the description. (8)
Description Direct material costs
Direct labour costs
Factory overhead costs
1.1.1 Depreciation on factory machines ✓
1.1.2 Wages paid the worker who make the items ✓
1.1.3 Insurance on factory machines ✓
1.1.4 Raw materials used to make the items ✓
1.1.5 salary paid to factory supervisor ✓
1.1.6 Indirect materials used in the production of the items ✓
1.1.7 Wages paid to factory security ✓
1.1.8 Factory rent paid monthly ✓
1.2.1 Direct labour costs.
8 ✓ × 250 ✓ × ( 1 472 _____ 8 = 184 ✓✓) = R368 000 ✓
8 ✓ × 500 ✓✓ × 32 ✓ = R128 000 ✓
Thus, R(368 000 + 128 000) = R496 000 ✓ 11
1.2.2 Direct material costs.
927 000 ✓ + 1 784 500 ✓ – 86 800 ✓
= R2 625 100 ✓ 4
1.2.3 Factory overhead costs.
12 200 ✓ + 18 300 ✓ + 72 000 ✓ + 38 000 ✓
= R140 500 ✓ (no part mark, if foreign items are included) 5
1.2.4 The unit cost per item of producing 50 000 units.
(496 000 ✓+ 2 625 100 ✓ + 140 500 ✓)
_____________________________ 50 000 ✓
= R65,23 per unit ✓ 5

100 s e c t i o n 3 • a s s e s s m e n t ta s k s
Question 2: Debtors reconciliation [40 marks; 32 minutes]
2.1 General Ledger of the tee-shirt shop
Dr DEBtoRs ContRoL B Cr
Date Details Fol. amount Date Details Fol. amount
2020 Jul 1 Balance b/d 72 300 00
2020 Jul 31 Bank and discount allowed CRJ ✓69 800 00
31 Sales (63 100✓ + 2 000✓) DJ ✓65 100 00Debtors allowances (2 100✓ – 1 000✓) DAJ ✓1 100 00
Bank (2 500✓ + 7 500✓) CPJ ✓10 000 00Journal credits (8 000✓ + 8 500✓) GJ ✓16 500 00
Petty cash PCJ ✓4 000 00 Balance c/d 66 050 00
Journal debits (600✓ + 450✓ +1 000✓) GJ ✓2 050 00
153 450 00 153 450 00
Aug 1 Balance b/d✓66 050
(If same as c/d)00
19
the tee-shirt shop DEBtoRs List as at 31 JULY 2021
Debtor Debit Credit
a mckay (21 000✓ + 4 500✓) ✓25 500
a Zwane (26 400✓ – 5 000✓ + 450✓) ✓21 850
t Olyn (16 700✓ + 2 000✓) ✓18 700
D smit (7 500✓ + 1 000✓ – 8 500✓) ✓0
J erasmus (–2 000✓ + 2 000✓) or (2 000 – 2 000) ✓0
Debtors Control 66 050
17
2.2 Why is it important to reconcile debtors accounts at the end of each month?
• To ensure that debtors accounts in the ledger are correct according to the Debtors Control account.✓
• To ensure that debtors receive the correct account balances.✓ • To ensure that fraud does not take place.✓ 2
2.3 How could the owner ensure that the clerk improves his work performance? Give ONE point.
• The owner could send the clerk for training.✓ • The clerk can receive a written warning for poor performance.✓ 2

101s e c t i o n 3 • a s s e s s m e n t ta s k s
Question 3: Value-added tax (VAT) [21 marks; 17 minutes]
3.1 What is a registered VAT vendor?
A registered VAT vendor is a business that has registered with SARS to charge VAT to its customers. If the business has an annual turnover of more than R1 000 000, it must register as a VAT vendor.✓✓ 2
3.2 What is the percentage for VAT currently charged in South Africa?
15% ✓1
3.3 Identify another form of tax that The Golf Shop will be liable to SARS for.
• PAYE ✓✓
• Income tax 2
3.4 The owner is unsure on how to calculate the correct amount of VAT to be paid to SARS at the end of the VAT period. Briefly explain how he should do this.
• Output VAT less Input VAT = amount payable to SARS.✓✓✓
• If Output VAT is more than Input VAT, then VAT is owed to SARS. 3
3.5 What is the difference between VAT exempt and zero-rated VAT?
• Zero rated is where VAT is 0%, such as on staple foods.✓✓
• VAT exempt are items for which VAT is not charged, however, some other form of tax is charged.✓✓ 4
3.6 Use the information provided to calculate the amount of VAT due to/by SARS at the end of September 2020. State whether this amount is due to SARS or due by SARS.
450 000 × 15 ___ 100 = 67 500 (Output VAT)✓✓
303 600 × 15 ___ 115 = 39 600 (Input VAT)✓✓
Thus, R(67 500 – 39 600) = R27 900 due to SARS.✓✓6
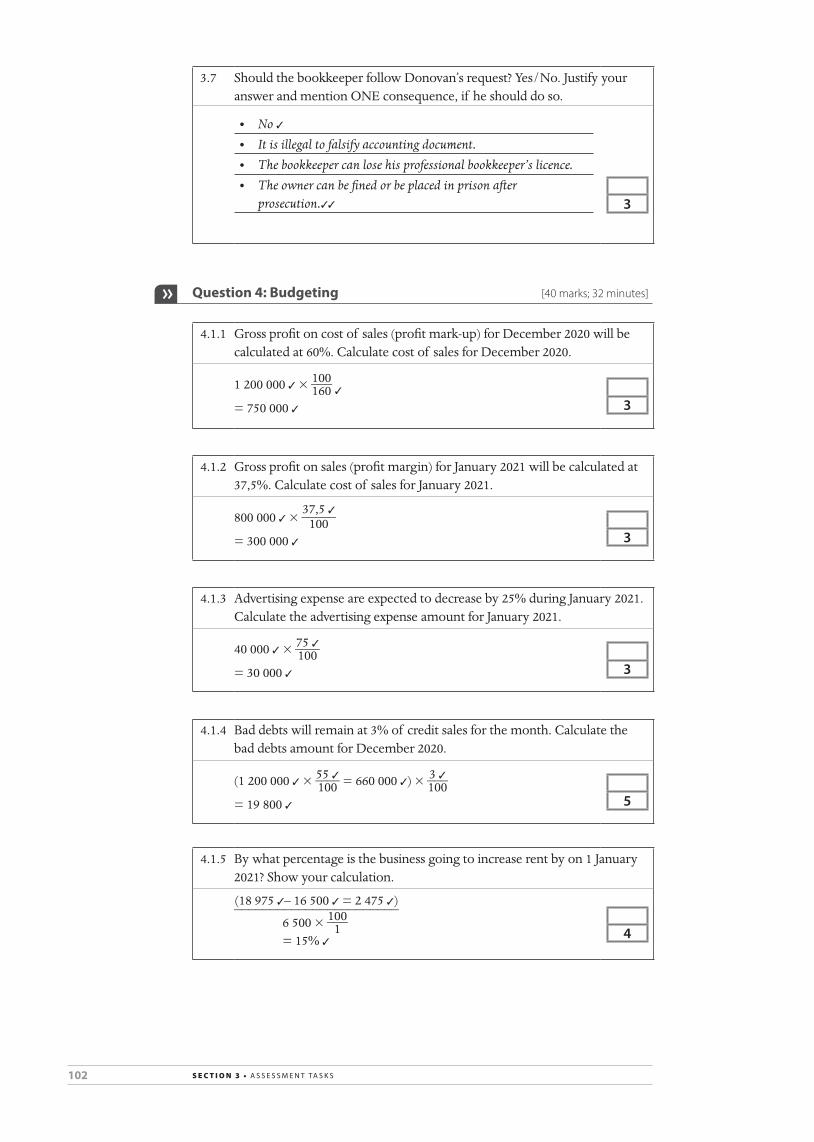
102 s e c t i o n 3 • a s s e s s m e n t ta s k s
3.7 Should the bookkeeper follow Donovan’s request? Yes/No. Justify your answer and mention ONE consequence, if he should do so.
• No ✓ • It is illegal to falsify accounting document. • The bookkeeper can lose his professional bookkeeper’s licence. • The owner can be fined or be placed in prison after
prosecution.✓✓ 3
Question 4: Budgeting [40 marks; 32 minutes]
4.1.1 Gross profit on cost of sales (profit mark-up) for December 2020 will be calculated at 60%. Calculate cost of sales for December 2020.
1 200 000 ✓ × 100 ___ 160 ✓
= 750 000 ✓ 3
4.1.2 Gross profit on sales (profit margin) for January 2021 will be calculated at 37,5%. Calculate cost of sales for January 2021.
800 000 ✓ × 37,5 ✓
_____ 100
= 300 000 ✓ 3
4.1.3 Advertising expense are expected to decrease by 25% during January 2021. Calculate the advertising expense amount for January 2021.
40 000 ✓ × 75 ✓
____ 100
= 30 000 ✓ 3
4.1.4 Bad debts will remain at 3% of credit sales for the month. Calculate the bad debts amount for December 2020.
(1 200 000 ✓ × 55 ✓
____ 100 = 660 000 ✓) × 3 ✓
___ 100
= 19 800 ✓ 5
4.1.5 By what percentage is the business going to increase rent by on 1 January 2021? Show your calculation.
(18 975 ✓– 16 500 ✓ = 2 475 ✓)
_______________________ 6 500 × 100 ___ 1
= 15% ✓ 4

103s e c t i o n 3 • a s s e s s m e n t ta s k s
4.1.6 Calculate the salaries amount for January 2021.
[( 45 000 ✓
_______ 3 = 15 000 ✓) × 110 ✓
_____ 100 = 16 500 ✓] × 2 ✓
= 33 000 ✓ 6
4.1.7 What controls could Melissa put in place to prevent this from happening? Mention TWO controls.
• Order a printout of the itemised bill from the telephone company.
• Password protect the telephone; and only give certain employees access to the telephone for business purposes only.
• Create a call log which employees must sign each time they make a call. 2
4.2.1 Calculate a) to c) on the Cash Budget above.
a) 170 200 ✓ – 72 600 ✓ = 97 600 ✓
b) 97 600 ✓
c) – 190 700 ✓ + 97 600 ✓ = 93 100 ✓ 7
4.2.2 Why is it important for a company to draw up a Cash Budget?
To plan, forecast and monitor business activities that relate to cash.✓✓
2
4.2.3 Choose which statement bests describes the shortfall during January 2021. Choose the most appropriate answer and write only that letter.
b) ✓1
4.2.4 Explain the difference between a Cash Budget and a Projected Income Statement.
• The Cash Budget reflects the estimated/budgeted cash receipts and cash payments over a budgeted period.✓✓
• The Projected Income Statement reflects the estimated/budgeted income and expenses over a budgeted period.✓✓ 4

104 s e c t i o n 3 • a s s e s s m e n t ta s k s
Question 5: Trading stock and controls [16 marks; 13 minutes]
5.1 If cash purchases are 60% of total purchases, calculate cash purchases.
486 000✓ × 60✓
____________ 40✓ = 729 000✓
or
(486 000 × 100/40 = 1 215 000) – 486 000 = 729 00 4
5.2 Which transaction gave rise to the entry of R37 620? Choose the most appropriate answer and write only that letter:
b) ✓1
5.3 From which subsidiary journal was the entry of R73 400 posted?
Debtors Journal (DJ) ✓1
5.4 Why is there an entry for drawings on the credit side of the Trading stock account?
The owner took trading stock ✓ for personal use. ✓2
5.5 What is the percentage credit returns on credit purchases made by creditors during September 2020?
14 580✓
_______ 486 000✓ × 100/1
= 3% ✓✓ 4
5.6 Mention TWO control measures that the business can put in place to prevent stock from going missing.
• Division of labour – always have two or more people involved in a process. One person orders, another person receives the items and a third person enters the transaction in the books.
• Place security cameras in the stockroom as well as at the entrance and exit to the shop.
• Only allow authorised personnel must be allowed in the stockroom.
• Proper documents must be kept, and all book entries must be regularly checked.
• Reconciliation of accounting records must be done regularly. • A physical stock take must be done regularly and accurately.
Any acceptable answer✓✓ × 2 4

105s e c t i o n 3 • a s s e s s m e n t ta s k s
5. Case studies
Learners are presented with a real-life situation, a problem or an incident-related topic. They are expected to assume a particular role in articulating the position. They will draw on their own experience, the experience of their peers or prior learning to interpret, analyse and solve problems.
Newspaper articles, magazine articles, television or radio presentations form excellent case studies. Learners have to read and/or listen, digest the information and then make informed decisions. Questions can be from lower order – direct quotes from the article – to higher order when they are asked to analyse comments and possibly make suggestions.
Case studies are a very good way of keeping the subject relevant and up to date.
These case studies should adhere to the following:• Atotalof 50marks(minimum)• Amarkingrubricshouldbeusedif possible.• Learningcanworkinsmallgroupsorbythemselves.• Itcanbedoneinclassorathome.• ThecasestudyshouldbedoneinTerm1orTerm3.

106 s e c t i o n 3 • a s s e s s m e n t ta s k s
Assessment task: Case study 1
Read the following article, which appeared on the Business Day website, and answer the questions that follow.
So-called “sustainable” business practices are looking much more
enticing as the costs of electricity, water and other services rise ever higher. Businesses, as much as individuals, are looking for areas to save not only the planet, but their back pockets as well.
Introducingefficienciesthatcanbe labelled “green” often involves some initial capital outlay. While a green label gives products a certain cachet, the resultant rise in product price is also a hard sell inSA–asintherestof theworld– because everyone is strapped for cash, says Melissa Baird, sustainability strategist for Ogilvy Earth, the sustainability practice of advertising group Ogilvy & Mather.
“Consumersoftensee(thelabel)‘green’ as an opportunity to put pricesup...butSAhasseriousresource issues, coupled with growing population needs, and a company’s water use and energy consumption has an effect on your balance sheet,” says Ms Baird.
The2011GrantThorntonInternationalBusinessReportindicates that the biggest driver forSouthAfricanbusinessestoimplement more ethical business practices is cost management.
Atotalof 62%of SouthAfricanbusiness owners say this is a key driver for corporate social responsibility in their organisations.Only37%of companies are motivated by a desire to save the planet.
Factory costs have risen significantly this year, with the producer price index climbing to6,9%yearonyearinMay,and6,6%inApril,drivenbysubstantial increases in the prices of electricity, fuel and commodities.
SA’sNewGrowthPath,whichpromises five million jobs by 2020anda“moreinclusiveandgreener economy”, is the latest in a succession of plans aimed at reducing the high unemployment rate,nowatabout24%.Theplan,released last November, estimates thatSAcouldcreate300000“green”jobsby2020.
Twizza MD Ken Clark, whose soft-drink manufacturing business has “grown exponentially” since its2003startinQueenstown,inthe Eastern Cape, has focused on sustainabilitythroughefficiency.Twizzasalesgrew45%lastyearand it is aiming to match that this year.
“It’saboutensuringacompetitive edge and a
Business finds “green” production brings efficiency gainsUsing less electricity and water in manufacturing is good for the bottom line and for the planet, writes Sue Blaine.

107s e c t i o n 3 • a s s e s s m e n t ta s k s
differentiator.It’stheculminationof a number of practices that make us stand apart that make us sustainable,” Mr Clark says.
“Every single part” of Twizza’s vertically integrated manufacturing and distribution chain is scrutinised to make it asefficientaspossible,hesays.Waste is avoided through the recycling of “clean waste” – like plastic scraps from bottle-making
– and using new bottle- and bottle cap-making technology.
Through such technology, within six weeks, all Twizza bottleswillbe18%lighterthanthe industry standard, without detriment to shelf life or gas retention. Twizza received its ISO9001andHACCPfoodsafetyaccreditationin2007.
Source:http://www.businessday.co.za/articles/Content.aspx?id=149167(Accessedon29July2011)Published:2011/07/2606:57:40AM
Questions
1. Whatismeantbytheterm“greenproduction”(usedinthetitleof thearticle)?
2. Whatismeantbytheterm“bottomline”(usedinthefirstsentenceof thearticle)?
3. Whydoesthewritersuggestthat“sustainablebusinesspracticesarelooking much more enticing”?
4. Givetworeasonswhytheintroductionof “greenefficiencies”inthemanufacturing of products may have a negative impact on the bottom line of the business.
5. Accordingtothe2011GrantThorntonInternationalBusinessReport:a. WhatisthemainmotivationforSouthAfricanbusinessesto
implement more ethical business practices?b. Whatpercentageof SouthAfricanbusinessesaremotivatedbya
desire to save the planet?
6. Whatdoes“SA’sNewGrowthPath”promise?
7. WhatwastheunemploymentrateinSouthAfricaatthetimethatthisarticle was written?
8. WhathasTwizzafocusedoninordertomaketheirsoft-drinkmanufacturing business sustainable?
9. Giveanexampleof apracticethatisemployedbyTwizzathatisbothenvironmentally friendly and economically beneficial.

108 s e c t i o n 3 • a s s e s s m e n t ta s k s
Answers
1. Theterm“greenproduction”referstothemanufactureof productsusing sustainable and environmentally friendly production processes.
2. Theterm“bottomline”meansprofit.Itreferstothelastlineof theIncomeStatement,whichliststhenetincome(ornetprofit)of thebusiness.
3. Thewritersuggestthat“sustainablebusinesspracticesarelookingmuchmore enticing” because the costs of electricity, water and other services are increasing.
4. Theintroductionof “greenefficiencies”inthemanufacturingof products usually results in the price of the products increasing and customersmightchooseothercheaperproducts.Also,the“green”labelcan cause customers to assume that the product is expensive and thus not even consider buying it.
5. a. costmanagementb. 37%
6. five-millionjobsby2020anda“moreinclusiveandgreenereconomy”
7. 24%
8. efficiency
9. Recyclingof plasticscrapsfromtheirbottle-makingprocess
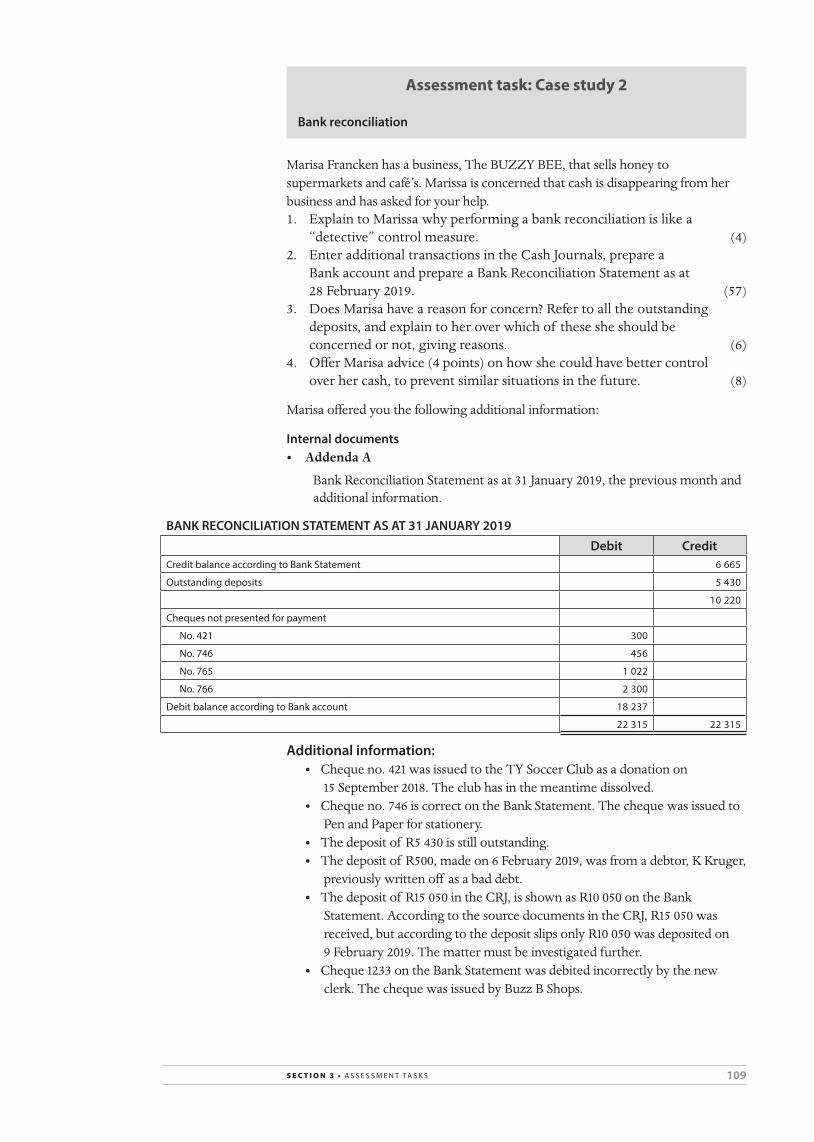
109s e c t i o n 3 • a s s e s s m e n t ta s k s
Assessment task: Case study 2
Bank reconciliation
Marisa Francken has a business, The BUZZY BEE, that sells honey to supermarkets and café’s. Marissa is concerned that cash is disappearing from her business and has asked for your help.1. ExplaintoMarissawhyperformingabankreconciliationislikea
“detective”controlmeasure. (4)2. EnteradditionaltransactionsintheCashJournals,preparea
BankaccountandprepareaBankReconciliationStatementasat28February2019. (57)
3. DoesMarisahaveareasonforconcern?Refertoalltheoutstandingdeposits, and explain to her over which of these she should be concernedornot,givingreasons. (6)
4. OfferMarisaadvice(4points)onhowshecouldhavebettercontroloverhercash,topreventsimilarsituationsinthefuture. (8)
Marisa offered you the following additional information:
internal documents • Addenda A
BankReconciliationStatementasat31January2019,thepreviousmonthandadditional information.
BaNK ReCONCiLiatiON stateMeNt as at 31 JaNuaRY 2019debit Credit
Credit balance according to Bank statement 6 665
Outstanding deposits 5 430
10 220
Cheques not presented for payment
no. 421 300
no. 746 456
no. 765 1 022
no. 766 2 300
Debit balance according to Bank account 18 237
22 315 22 315
additional information: • Cheque no. 421 was issued to the TY Soccer Club as a donation on
15September2018.Theclubhasinthemeantimedissolved. • Chequeno.746iscorrectontheBankStatement.Thechequewasissuedto
PenandPaperforstationery. • Thedepositof R5430isstilloutstanding. • Thedepositof R500,madeon6February2019,wasfromadebtor,KKruger,
previously written off as a bad debt. • Thedepositof R15050intheCRJ,isshownasR10050ontheBank
Statement.AccordingtothesourcedocumentsintheCRJ,R15050wasreceived,butaccordingtothedepositslipsonlyR10050wasdepositedon9February2019.Themattermustbeinvestigatedfurther.
• Cheque1233ontheBankStatementwasdebitedincorrectlybythenewclerk. The cheque was issued by Buzz B Shops.

110 s e c t i o n 3 • a s s e s s m e n t ta s k s
• Addenda B
TheCashJournalsforFebruary2019.Ca
sH R
eCei
Pts
JOu
RNa
L O
F tH
e Bu
ZZY
Bee
– Fe
BRu
aRY
201
9
CPJ2
doc
. no
.d
ayd
etai
lsa
naly
sis
of
rece
ipts
Bank
sale
sCo
st o
f sa
les
deb
tors
Co
ntro
ld
isco
unt
allo
wed
sund
ry a
ccou
nts
am
ount
Det
ails
CRR
4sa
les
10 8
9010
890
7 26
0
109
Gar
cia
Café
1 17
81
240
62
110
5D
ie P
adst
al1
377
13 4
451
450
73
CRR
8sa
les
12 4
5012
450
8 30
0
111
9t
Bran
d2
600
15 0
502
600
Rent
inco
me
CRR
14sa
les
13 7
8013
780
9 18
6
112
sPa
R4
370
18 1
504
600
230
CRR
18Pi
ck ’n
Pay
2 10
02
100
113
sale
s19
080
21 1
8019
080
12 7
20
CRR
24sa
les
12 3
008
200
mon
ette
’s Bi
stro
1 89
014
190
1 89
0
CRR
28sa
les/
6 90
06
900
6 90
04
600
CasH
PaY
MeN
ts JO
uRN
aL
OF
tHe
BuZZ
Y Be
e –
FeBR
ua
RY 2
019
CP
J2
doc
. no
.d
ayd
etai
lsBa
nktr
adin
g st
ock
deb
tors
Co
ntro
lCr
edito
rs
Cont
rol
dis
coun
t re
ceiv
edsu
ndry
acc
ount
s
am
ount
det
ails
767
2Pl
astic
s Lt
d20
543
20 5
43
768
6W
alto
ns21
0st
atio
nery
769
9H
ugo
trad
ers
3 20
032
0
770
17CJ
mot
ors
1 89
0Re
pairs
771
21te
lkom
789
tele
phon
e
772
23ta
felb
erg
Furn
iture
2 40
0eq
uipm
ent
773
25m
ooi U
itsig
Far
m34
550
34 5
50
774
27k
mal
an2
234
2 23
4

111s e c t i o n 3 • a s s e s s m e n t ta s k s
external documents • Addenda C
TheBankStatementreceivedfromWestBankfortheperiod29January2019to26February2019.
Bank statement
WEST BANKtHe BuZZY Bee statement: 29/01/2019 – 26/02/2019
date debits Credits Balance
Balance carried forward 29/01/2019 6 665
Deposit 30/01/2019 10 220 16 885
Cheque no. 766 30/01/2019 2 300 14 585
Cheque no. 746 31/01/2019 654 13 931
Cheque no. 767 04/02/2019 20 543 –6 612
Deposit 05/02/2019 13 445 6 833
Deposit: k kruger 06/02/2019 500 7 333
municipality: Water and electricity 07/02/2019 642 6 691
Cheque no. 768 08/02/2019 210 6 481
Deposit 09/02/2019 10 050 16 531
Cheque no. 769 10/02/2019 2 880 13 651
t Brand: cheque dishonoured 11/02/2019 2 600 11 051
service fee 12/02/2019 116 10 935
Deposit 14/02/2019 18 150 29 085
Cheque no. 771 15/02/2019 789 28 296
Cheque no. 770 17/02/2019 1 890 26 406
Deposit 18/02/2019 21 180 47 586
Cheque book fee 18/02/2019 23 47 563
allsure for insurance 19/02/2019 900 46 663
Die Padstal: cheque dishonoured 20/02/2019 1 377 45 286
t Brand: Rent income 23/02/2019 2 600 47 886
Cheque no. 1 233 23/02/2019 1 090 46 796
Interest 24/02/2019 103 46 899
Cash handling fee 24/02/2019 98 46 801
Deposit 25/02/2019 14 190 60 991
Cheque no. 773 26/02/2019 34 550 26 441

112 s e c t i o n 3 • a s s e s s m e n t ta s k s
Assessment task: Case study 2
answer booklet
1 Explain to Marissa why performing a bank reconciliation is like a “detective” control measure.
4
2 EnteradditionaltransactionsintheCashJournals,prepareaBankaccountandprepareaBankReconciliationStatementasat28February2019.
General Ledger of the Buzzy Bee
Dr Bank Cr
Date Details Fol. Amount Date Details Fol. Amount
7
BaNK ReCONCiLiatiON stateMeNt as at 28 FeBRuaRY 2019
debit Credit
19

113s e c t i o n 3 • a s s e s s m e n t ta s k s
CasH
ReC
eiPt
s JO
uRN
aL
OF
tHe
BuZZ
Y Be
e –
FeBR
ua
RY 2
019
CPJ
2
doc
. no
.d
ayd
etai
lsa
naly
sis
of
rece
ipts
Bank
sale
sCo
st o
f sa
les
deb
tors
Co
ntro
ld
isco
unt
allo
wed
sund
ry a
ccou
nts
am
ount
det
ails
CRR
4sa
les
10 8
9010
890
7 26
0
109
Gar
cia
Café
1 17
81
240
62
110
5D
ie P
adst
al1
377
13 4
451
450
73
CRR
8sa
les
12 4
5012
450
8 30
0
111
9t
Bran
d2
600
15 0
502
600
Rent
inco
me
CRR
14sa
les
13 7
8013
780
9 18
6
112
sPa
R4
370
18 1
504
600
230
CRR
18Pi
ck ’n
Pay
2 10
02
100
113
sale
s19
080
21 1
8019
080
12 7
20
CRR
24sa
les
12 3
008
200
mon
ette
’s Bi
stro
1 89
014
190
1 89
0
CRR
28sa
les/
6 90
06
900
6 90
04
600
12

114 s e c t i o n 3 • a s s e s s m e n t ta s k s
CasH
PaY
MeN
ts JO
uRN
aL
OF
tHe
BuZZ
Y Be
e –
FeBR
ua
RY 2
019
CPJ2
doc
. no
.d
ayd
etai
lsBa
nktr
adin
g st
ock
deb
tors
Co
ntro
lCr
edito
rs
Cont
rol
dis
coun
t re
ceiv
edsu
ndry
acc
ount
s
am
ount
det
ails
767
2Pl
astic
s Lt
d20
543
20 5
43
768
6W
alto
ns21
0st
atio
nery
769
9H
ugo
trad
ers
3 20
032
0
770
17CJ
mot
ors
1 89
0Re
pairs
771
21te
lkom
789
tele
phon
e
772
23ta
felb
erg
Furn
iture
2 40
0eq
uipm
ent
773
25m
ooi U
itsig
Far
m34
550
34 5
50
774
27k
mal
an2
234
2 23
4
22

115s e c t i o n 3 • a s s e s s m e n t ta s k s
3 DoesMarisahaveanyreasonforconcern?Refertoalltheoutstanding deposits and explain to her where she should be concerned.Givesreasonsforyouranswer.
6
4 OfferMarisaadvice(4points)onhowshecouldhavebettercontrol over her cash, to prevent similar situations in future.
8

116 s e c t i o n 3 • a s s e s s m e n t ta s k s
Assessment task: Case study 2
Marking memorandum
1 Explain to Marissa why performing a bank reconciliation is like a “detective” control measure.
You will determine whether employees are stealing from the business – outstanding deposits. ✓✓
You will discover whether any transactions have been incorrectly entered. ✓✓
Any acceptable answer 4
2 EnteradditionaltransactionsintheCashJournals,prepareaBankaccountandprepareaBankReconciliationStatementasat28February2019.
General Ledger of the Buzzy Bee
Dr Bank Cr
Date Details Fol. Amount Date Details Fol. Amount
2019 Feb 1 Balance b/d ✓ 18 237 00
2019 Feb 28 Total payments ✓ CPJ
(✓) 71 450
76 450
00
00
(✓) 92 418 00 Balance c/d
✓ 39 205 or
34 205
00
00
110 655 00 110 655
2019 Mar 1 Balance b/d
(✓) 39 205 or
34 205
00
00
7

117s e c t i o n 3 • a s s e s s m e n t ta s k s
BaNK ReCONCiLiatiON stateMeNt as at 28 FeBRuaRY 2019
debit CreditCredit balance according to Bank statement ✓✓ 26 441
Credit outstanding deposits ✓✓ 5 430
✓✓ 6 900
Deposit incorrect (alternatively this can be entered in the CPJ) ✓✓✓ 5 000
Credit incorrect entry ✓✓✓ 1 090
Debit Outstanding cheques
no. 765 ✓✓ 1 022
no. 772 ✓✓ 2 400
no. 774 ✓✓ 2 234
Debit balance according to Bank account ✓ 39 205 or
34 205
44 861 44 861

118 s e c t i o n 3 • a s s e s s m e n t ta s k s
CasH
ReC
eiPt
s JO
uRN
aL
OF
tHe
BuZZ
Y Be
e –
FeBR
ua
RY 2
019
CPJ
2
doc
. no
.d
ayd
etai
lsa
naly
sis
of
rece
ipts
Bank
sale
sCo
st o
f sa
les
deb
tors
Co
ntro
ld
isco
unt
allo
wed
sund
ry a
ccou
nts
am
ount
det
ails
CRR
4sa
les
10 8
9010
890
7 26
0
109
Gar
cia
Café
1 17
81
240
62
110
5D
ie P
adst
al1
377
13 4
451
450
73
CRR
8sa
les
12 4
5012
450
8 30
0
111
9t
Bran
d2
600
15 0
502
600
Rent
inco
me
CRR
14sa
les
13 7
8013
780
9 18
6
112
sPa
R4
370
18 1
504
600
230
CRR
18Pi
ck ’n
Pay
2 10
02
100
113
sale
s19
080
21 1
8019
080
12 7
20
CRR
24sa
les
12 3
008
200
mon
ette
’s Bi
stro
1 89
014
190
1 89
0
CRR
28sa
les/
6 90
06
900
6 90
04
600
tY s
occe
r Clu
b (c
hequ
e 42
1)30
0 ✓
300
✓D
onat
ions
✓
Bsk
krug
er50
0 ✓
500
✓Ba
d de
bts
reco
vere
d ✓
Bst
Bran
d2
600
✓2
600
✓ R
ent i
ncom
e ✓
BsW
est B
ank
103
✓10
3 ✓
Inte
rest
on
curr
ent a
ccou
nt
✓
92 4
18
12

119s e c t i o n 3 • a s s e s s m e n t ta s k s
CasH
PaY
MeN
ts JO
uRN
aL
OF
tHe
BuZZ
Y Be
e –
FeBR
ua
RY 2
019
CPJ2
doc
. no
.d
ayd
etai
lsBa
nktr
adin
g st
ock
deb
tors
Co
ntro
lCr
edito
rs
Cont
rol
dis
coun
t re
ceiv
edsu
ndry
acc
ount
sa
mou
ntd
etai
ls76
72
Plas
tics
Ltd
20 5
4320
543
768
6W
alto
ns21
021
0st
atio
nery
769
9H
ugo
trad
ers
2 88
03
200
320
770
17CJ
mot
ors
1 89
01
890
Repa
irs
771
21te
lkom
789
789
tele
phon
e
772
23ta
felb
erg
Furn
iture
2 40
02
400
equi
pmen
t
773
25m
ooi U
itsig
Far
m34
550
34 5
50
774
27k
mal
an2
234
2 23
4
Bs28
Pick
’n P
ay19
8 ✓
✓19
8 ✓
stat
ione
ry ✓
mun
icip
ality
642
✓64
2 ✓
Wat
er a
nd e
lect
ricity
✓
t Br
and
(R/D
che
que)
2 60
0 ✓
2 60
0 ✓
Rent
inco
me
✓
Wes
t Ban
k23
7 ✓
237
✓Ba
nk fe
es ✓
alls
ure
900
✓90
0 ✓
Insu
ranc
e ✓
Die
Pad
stal
1 37
7 ✓
1 37
7 ✓
✓
Inco
rrec
t dep
osit
5 00
0 ✓
5 00
0 ✓
Loss
due
to th
eft ✓
71 4
50
or
76 4
50
22

120 s e c t i o n 3 • a s s e s s m e n t ta s k s
3 DoesMarisahaveanyreasonforconcern?Refertoalltheoutstanding deposits and explain to her where she should be concerned.Givesreasonsforyouranswer.
R5 430 – she has reason to be concerned ✓ – this deposit has been outstanding since January 2019. ✓
R6 900 – she does not have to be concerned about this deposit – it is still outstanding only because the payment was made after the Bank Statement was sent out. ✓
R15 050 to R10 050 is R5 000 – she has reason to be concerned ✓. It is possible that the R5 000 has been stolen. ✓ 6
4 OfferMarisaadvice(4points)onhowshecouldhavebettercontrol over her cash, to prevent similar situations in future.
Safeguard cash and restrict/limit access to cash. ✓✓
Split duties. ✓✓
Cash should be deposited as soon as possible. ✓✓
Ensure that all money received is supported by a source document. ✓✓
Any acceptable answer 8

121s e c t i o n 4 • n o t e s / t i p s f o r t e a c h e r s
Section 4
noteS/tiPS FoR teAcHeRS
CHAPTER 1: EthicsProgression of this topic
Grade 10: Code of ethics and basic principles of ethics for businessesGrade 11: Identification and analysis of ethical behaviour applicable
to financial environments with reference to accountability, transparency and sustainability
Grade 12: • Roleof professionalbodiesforaccountants • Disciplinaryandpunitivemeasuresfornon-compliancewith
code of conduct • Policiesgoverningethicalbehaviour,suchasKingCodeIII • BasicprinciplescontainedinCompaniesAct
Requirements for this chapter • Identifyandanalyseethicalbehaviourthatappliestofinancial
environments, with reference to.– accountability– transparency– sustainability
Difficulties often experienced by learners with this chapter • Comprehensionandunderstandingof newterminology• Introductionof manynewconcepts• Difficultyinrelatingtothepracticalapplicationof theseconcepts.
Suggestions, tips and tricks for teaching this chapter and overcoming difficulties of learners • Inthischapter,newterminologyandmanynewconceptsareintroduced,
soitmaytakeawhileforlearnerscomprehendthissection.Wesuggestthat you pay special attention to explanations and practical examples in order to help the learners understand the new terms and become comfortable with the new concepts.
• Suggestedmethodsof teachingthischapter:– Roleplay– Group or class discussion– Practicalactivities(suchasthoseoutlinedintheprojectsattheendof
the chapter)– Case studies– Newspaper articles
• Integration:ThistopicisintegratedwithothertopicsintheLearner’sBook,somanyof theconceptsdiscussedinthischapterwillbereinforcedlaterintheyear.Theseconceptsshouldbecomecleareroncetheyaredealt with in relation to other topics in later chapters.

122 s e c t i o n 4 • n o t e s / t i p s f o r t e a c h e r s
CHAPTER 2: Internal controls and audit processesProgression of this topic
Grade 10: BasicinternalcontrolprocessesGrade 11: Demonstrationof knowledgeof internalauditconcepts,
processes and proceduresGrade 12: • Applicationof internalcontrolandinternalauditprocessesin
a business environment • Understandingthedifferencebetweentherolesof internaland
external auditors
Requirements of this chapter• Demonstrateknowledgeof theinternalauditprocess• Defineandexplainwhatismeantbyinternalaudit• Demonstrateknowledgeof:
– thedifferencebetweeninternalcontrolandaninternalaudit– the role of the internal auditor– division of duties, documentation, physical controls, authorisation
and reconciliations• Identifyinternalauditproceduresrelatingto:
– handlingcash– buyingandsellingoncredit– stock / inventory– debtors– creditors
Difficulties often experienced by learners with this chapter• Comprehensionandunderstandingof manynewconcepts• Difficultyinrelatingtothepracticalapplicationof theseconceptswith
reasonablylimitedaccountingknowledge
Suggestions, tips and tricks for teaching this chapter and overcoming difficulties of learners• Inthischaptermanynewconceptsareintroduced,soitmaytakeawhile
forlearnerscomprehendthissection.Wesuggestthatyoupayspecialattention to explanations and practical examples in order to help the learners understand and become comfortable with the new concepts.
• Suggestedmethodsof teachingthischapter:– Roleplay– Grouporclassdiscussion:Inthesediscussionsthelearnerscanthink
about the potential risks associated with various business activities; they can then identify various internal control procedures that could beusedtoprotectthebusinessagainsttheserisksandfinallytheycandrawupalistof internalauditingproceduresthatcouldbeusedtoevaluatewhethertheinternalcontrolsaremanagingtheriskseffectively.
– Case studies– Newspaper articles
• Integration:ThistopicisintegratedwithothertopicsintheLearner’sBook,somanyof theconceptsdiscussedinthischapterwillbereinforcedlaterintheyear.Theseconceptsshouldbecomecleareroncetheyaredealt with in relation to other topics in later chapters.

123s e c t i o n 4 • n o t e s / t i p s f o r t e a c h e r s
CHAPTER 3: Reconciliations – Bank reconciliationsProgression of this topic
Grade 10: Preparationof DebtorsandCreditorsListstoreconcilewiththeDebtors Control and Creditors Control accounts
Grade 11: Preparationof reconciliationstatementsbyreconcilingtobankandcreditors’statements
Grade 12: Analysisandinterpretationof bank,debtorsandcreditorsreconciliationsanddebtorsageanalysis
Requirements of this chapter• ReconcilethebankstatementswithCashJournals• PrepareaBankReconciliationStatement• Integratethefollowingconceptsintothebankreconciliationprocess:
– Outstandingcheques– Chequesnotyetpresentedforpayment– Depositsnotyetshownonthebankstatement– Stop/debitorders– Directtransfersanddeposits– Bankcharges– Interestreceivedorcharged– Correction of errors or omissions– ChequesR/Dorcancelled– Post-datedchequesreceivedorissued
• Integratewithissuesof internalcontrolandethicalissues
Difficulties often experienced by learners with this chapter• Learnersoftenrushthroughthisworkandthusmakesillymistakes.• Thisisarelativelyeasychapterbutlearnersbecomeoverconfidentand
don’tworkmeticulously.
Suggestions, tips and tricks for teaching this chapter and overcoming difficulties of learners• StartbymakingsurethatallthelearnersunderstandhowtheCRJand
CPJaffecttheBankledgeraccount.• Theyneedtounderstandthemirrorimageconceptbecausetheyare
comparingthebooksof anoutsideorganisation(bank)withthebooksof the business.
• Makesuretheyunderstandthelayoutof thebankstatementandhowtocompareittotheCRJandCPJ.
• Encourageyourlearnerstofollowthestepsatalltimes.• Theyneedtounderstandthisworkasopposedtolearningitoff byheart.• UnderstandingthisworkwillbenefittheminGrade12whentheyare
requiredtoanalysetheBankReconciliationStatement.
CHAPTER 4: Reconciliations – Creditors reconciliationsProgression of this topic
Grade 10: Preparationof DebtorsandCreditorsListstoreconcilewiththeDebtors Control and Creditors Control accounts
Grade 11: Preparationof reconciliationstatementsbyreconcilingtobankandcreditors’statements
Grade 12: Analysisandinterpretationof bank,debtorsandcreditorsreconciliationsanddebtorsageanalysis

124 s e c t i o n 4 • n o t e s / t i p s f o r t e a c h e r s
Requirements of this chapter• Reconcilethestatementsreceivedfromcreditorswithaccountsinthe
CreditorsLedger• PreparetheCreditorsReconciliationStatement• Integratethefollowingconceptsintothecreditorsreconciliationprocess:
– Outstandinginvoicesorcreditnotes– Outstandingpayments– Discountsnotrecorded– Corrections and omissions
• Integratewithissuesof internalcontrolandethicalissues
Difficulties often experienced by learners with this chapter• Learnersoftenfindthisworkverydifficult.• Theyoftenbattletoidentifytheomissionorerrorthatwasmadeand
how to correct it.
Suggestions, tips and tricks for teaching this chapter and overcoming difficulties of learners• Suggestedmethodsof teachingthischapter:
– StartbymakingsurethatallthelearnersknowwhataDebtorsLedgerandCreditorsLedgerlooklike.
– Theyneedtounderstandthemirrorimageconceptbecausetheyarecomparingthebooksof anoutsideorganisation(debtor)withthebooksof thebusiness(creditor).
• Allowthelearnerstousethetickingandcirclingmethod,asthisensuresaccuracy.
• TheyneedtounderstandthisworkbecauseitisimportantforGrade12.
CHAPTER 5: Fixed assetsProgression of this topic
Grade 10: Calculationandrecordingof depreciationGrade 11: Recordingof acquisitionanddisposalof fixedassetsGrade 12: Interpretingandreportingonmovement,valuationandcontrol
of fixed assets
Requirements for this chapter• Understandtheconceptof thefixedassetregister.• Recordtheacquisitionof fixedassets.• Calculateandrecorddepreciationusingoneof thefollowingmethods:
– Oncostprice(straight-linemethod)– Diminishingbalancemethod
• Understandhowfixedassetsarerecordedwhentheyarefullydepreciated• Recordthedisposalof fixedassets(cash,credit,tradein):
– atthebeginningof thefinancialyear– duringthefinancialyear– at the end of the financial year
• Relatetoissuesof internalcontrolmeasuresoverfixedassets• Relatetoethicalissuesregardingfixedassets• Integrateissuespertainingtotheresponsibleuseof fixedassets
Difficulties often experienced by learners with this chapter• Learnersneedtoknowhowtodepreciatefixedassets.• Theyoftenstrugglebecausetheydon’tunderstandtheledgeraccounts
relatedtobuyinganddepreciatingfixedassets.

125s e c t i o n 4 • n o t e s / t i p s f o r t e a c h e r s
Suggestions, tips and tricks for teaching this chapter and overcoming difficulties of learners• Learnersneedtounderstandterminologyrelatedtobuyingand
depreciatingfixedassets.• Dobaselineassessmentsondepreciationandrevisethemethodsbefore
startingtoteachthissection.• Teachthelearnersthesteps;whentheyfollowthebasicstepstheywill
find this section easier to understand.• Dolotsof homeworkandreinforcethissectionof work.
CHAPTER 6: Partnerships – Accounting concepts and final accounts Progression of this topic
Grade 10: Preparationof finalaccountsof soletradersGrade 11: Preparationof finalaccountsof partnershipsGrade 12: Preparationof finalaccountsof companies
Requirements of this chapter• Preparethefinalaccountsandclosingtransfersforthefollowing
accounts:– Tradingaccount– ProfitandLossaccount– Appropriationaccount
• Performyear-endadjustmentsusingthefollowingaccounts:– Tradingstockdeficit/surplus– Consumable stores on hand– Depreciation(oncostprice/straightlineandondiminishingbalance)– Accruedincome(receivable)andincomereceivedinadvance
(deferred)– Expensesprepaidandaccruedexpenses(payable)– Baddebts– Correction of errors and omissions
• DrawupaPre-adjustmentTrialBalance,Post-adjustmentTrialBalanceandPost-closingTrialBalance.
• Reversecertainyear-endadjustmentsatthebeginningof thenextfinancial period, i.e. accruals, income received in advance and prepayments.
• Whenintroducingthefinancialaccountingof apartnershipwithregardstoyear-endadjustmentsandfinalaccounts,theteachershouldexplainandintegratethefollowingaccountingconcepts:– Theaccountingcycle– Applicationof GAAPprinciples– Accountingequation– Internal control and ethics.
Difficulties often experienced by learners with this chapter• Thelearnersoftenfindtheadjustmentsverydifficult.• Thenecessityof doingclosingtransfersandadjustmentsmustbe
emphasised.
Suggestions, tips and tricks for teaching this chapter and overcoming difficulties of learners• Startbyshowingthemthebiggerpictureusingtheaccountingcycle
(PowerPoint®).

126 s e c t i o n 4 • n o t e s / t i p s f o r t e a c h e r s
• DoallthedifferentGAAPprinciplesatthebeginningof thechapter.• Letthemlearnstepsfortheclosingtransfers;thelearnersunderstand
betterwhengivenstepstofollow.• Whenintroducingadjustmentssuchasaccruedincome,showthe
writingbackof theadjustmentaswell–dothisstepbystepontheboard,notontransparency,usingdifferentcolourpenstowriteinbalances,adjustmentsandclosingtransfers.
• UseT-accountsandtimelineswhenexplainingadjustments.• Dothefirstactivityof eachnewadjustmentwiththemontheboard
andthengivethenextactivityforhomework–onceagain,repetitionisimportant.
• WhenshowinglearnerstheshortcutstodoadjustmentsonthePre-adjustmentTrialBalance,showitonatransparency;donotonlytellthem, show them.
• Integration:– AlltheGAAPprinciplesshouldbeintegratedandareoften
mentionedthroughoutthischapter.– Internalcontroloverstockcanbeintegratedwhendoingtrading
stockdeficit,andcontroloverassetswhendoingdepreciation.
CHAPTER 7: Partnerships – Financial statements Progression of this topic
Grade 10: Preparationof financialstatementsof soletradersGrade 11: Preparationof financialstatementsof partnershipsGrade 12: Preparationof financialstatementsof companies
Requirements of this chapter• Preparethefinancialstatementsof apartnership:
– IncomeStatement– BalanceSheet
• Processyear-endadjustmentsforthefollowing:– Tradingstockdeficit/surplus– Consumable stores on hand– Depreciation(oncostprice/straightlineandondiminishingbalance
methods)– Accruedincome(receivable)andincomereceivedinadvance
(deferred)– Expensesprepaidandaccruedexpenses(payable)– Baddebts– Correction of errors and omissions.
• Whenintroducingthefinancialstatements,theteachershouldexplainandintegratethefollowingaccountingconcepts:– Theaccountingcycle– Applicationof GAAPprinciples– Accountingequation– Internal control and ethics.
Difficulties often experienced by learners with this chapter• Thelearnersoftenfindtheadjustmentsverydifficult.• Theformatof theIncomeStatementandBalanceSheetneedsto
be precise.

127s e c t i o n 4 • n o t e s / t i p s f o r t e a c h e r s
Suggestions, tips and tricks for teaching this chapter and overcoming difficulties of learners• Startbyshowingthemthebiggerpictureusingtheaccountingcycle
(PowerPoint®).• DothefirstIncomeStatementandBalanceSheetontheboardwith
them, step by step.• AfterthatyoucanusetransparenciesorPowerPoint® presentations.• UseT-accountsandtimelinestoexplaintheadjustments.• Integration:
– AlltheGAAPprinciplesshouldbeintegratedandareoftenmentionedthroughoutthischapter.
– Internal control over stock, assets, debtors and creditors can be integratedthroughoutthischapter.
CHAPTER 8: Partnerships – Interpretation of financial statements Progression of this topic
Grade 10: Analysisandinterpretationof financialstatementsof soletradersGrade 11: Analysisandinterpretationof financialstatementsof
partnershipsGrade 12: Analysisandinterpretationof financialstatementsof companies
Requirements of this chapter• Analyseandinterpretfinancialstatementsandnotesforthefollowing:
– Gross profit on sales– Gross profit on cost of sales– Net profit on sales– Operatingexpensesonsales– Operatingprofitonsales– Current ratio– Acidtestratio– Solvencyratio– Returnonequity.
• Whenintroducingthefinancialstatements,theteachershouldexplainandintegratethefollowingaccountingconcepts:– Theaccountingcycle– Applicationof GAAPprinciples– Internal control and ethics.
Difficulties often experienced by learners with this chapter• Givingcommentsontheresultsfound• Whentousewhichfinancialindicator
Suggestions, tips and tricks for teaching this chapter and overcoming difficulties of learners• UsethePowerPoint® presentation or write on the board and a
transparencysimultaneouslytoshowthelearnerswheretogettheinformation they need to do the analysis.
• Whentalkingaboutthecommentsonresultsfound,givelearnersdifferentscenariosonwhichtheymightneedtocomment.
• Givelearnersasummaryof thedifferentformulas/ratiosandletthemwrite a class test so that they can learn these.
• Integration:Internalcontroloverstock,assets,debtorsandcreditorscanbeintegratedthroughoutthischapter.

128 s e c t i o n 4 • n o t e s / t i p s f o r t e a c h e r s
CHAPTER 9: Financial accounting of non-profit organisations – Clubs Progression of this topic
Grade 10: NoneGrade 11: • Definitionandexplanationof accountingconceptsuniqueto
non-profitorganisations(clubs) • Accountingcyclefornon-profitorganisations(clubs)Grade 12: None
Requirements for this chapter• Preparationof AnalysisCashBook• Postingtotheledger,particularlyaccountsuniquetononprofit
organisations,suchasaccumulatedfund,membershipfees,entrancefees,refreshments etc.
• DraftingaTrialBalance• Preparationof Statementof ReceiptsandPayments• Understandingof differencesbetweenreceiptsandincome,and
payments and expenses.
Difficulties often experienced with this chapter• LearnersoftenfindtheMembership Fees account and the Refreshments
accountverydifficult.• Learnersstruggletotellthedifferencebetweenreceiptsandincome,and
payments and expenses.
Suggestions, tips and tricks for teaching this chapter and overcoming difficulties of learners• Inthischapter,newterminologyandmanynewconceptsareintroduced,
soitmaytakeawhileforlearnerscomprehendthissection.Wesuggestthat you pay special attention to explanations and practical examples in order to help the learners understand the new terms and become comfortable with the new concepts.
• DotheMembership Fees and Refreshments accounts with the learners on theboardstepbystep–sometimesithelpstogivethemstepstofollow.
• Useatimelinetoexplainthethreesteps:writingbackof adjustmentsatthebeginningof theyear,entriesfortheyearandfinallyadjustmentsatthe end of the year.
• Repeatthedifferencesbetweenreceiptsandincome,andpaymentsandexpenses,everyperiodwhenexplainingthework.• Usepracticalexamplesof clubsinthecity/towntheylivein.• Thebestwaytomasterthepreparationof GeneralLedgeraccountsisto
practise.Sogetyourlearnerstocompleteasmanyof theactivitiesinthischapteraspossible.Remembertoprovidethemwithsolutionssothatthey can identify and learn from their mistakes.

129s e c t i o n 4 • n o t e s / t i p s f o r t e a c h e r s
CHAPTER 10: Cost AccountingProgression of this topic
Grade 10: Cost concepts and basic calculationsGrade 11: CostcalculationsandledgeraccountsGrade 12: Preparation,presentation,analysis,interpretationandreporting
oncostinformationformanufacturingenterprises
Requirements of this chapter• Identifyandclassifycostsinamanufacturingenvironment.• Calculatethefollowingcostsinamanufacturingenvironment:
– Primecost– Totalmanufacturingcost– Unitcost– Variable and fixed costs– Costof aproductusingvariableandfixedcosts– Contribution per unit– Break-evenpoint
• PrepareGeneralLedgeraccountsof amanufacturingbusiness• Integrateethical,internalcontrolandinternalauditissuesrelatingtoa
manufacturingenvironment
Difficulties often experienced by learners with this chapter• Comprehensionandunderstandingof newterminologyandconcepts• Understandingandcalculatingthebreak-evenpoint• Understandinghowtoallocateandrecordthemanufacturingcostsinthe
variousGeneralLedgeraccountsof amanufacturingbusiness
Suggestions, tips and tricks for teaching this chapter and overcoming difficulties of learners• Inthischapter,newterminologyandmanynewconceptsareintroduced,
soitmaytakeawhileforlearnerscomprehendthissection.Wesuggestthat you pay special attention to explanations and practical examples in order to help the learners understand the new terms and become comfortable with the new concepts.
• Suggestedmethodsof teachingthischapter:– Roleplay:Forexample,putlearnersintogroupsandleteachgroup
chooseaproductthatismanufactured.Thegroupsmustthenidentifyexamplesof eachof thedifferenttypesof costsinvolvedinthemanufacturingprocessforthatproduct.
– Practicalactivities:suchasmanufacturingpopcornorfudgeandthenperformingbreak-evencalculationsbasedonrealinformation
• If possible,arrangeanoutingtoalocalfactorysothatthelearnerscangetarealsenseof thedifferenttypesof costsinvolvedinthemanufacturingenvironment.
• Thebestwaytomasterthepreparationof GeneralLedgeraccountsistopractice.Sogetyourlearnerstocompleteasmanyof theactivitiesinthischapteraspossible.Remembertoprovidethemwithsolutionssothatthey can identify and learn from their mistakes.

130 s e c t i o n 4 • n o t e s / t i p s f o r t e a c h e r s
CHAPTER 11: BudgetingProgression of this topic
Grade 10: BudgetconceptsGrade 11: Preparationandpresentationof CashBudgetsandProjected
IncomeStatementsof soletradersGrade 12: Analysis,interpretationandcomparisonof CashBudgetsand
ProjectedIncomeStatementsof soletradersandcompanies
Requirements of this chapter• UnderstandthedifferencebetweenaCashBudgetandaProjected
IncomeStatement• Performbasicforecastingcalculations,includingthe:
– DebtorsCollectionSchedule– CreditorsPaymentSchedule
• PrepareandpresentaCashBudgetforasoletrader• PrepareandpresentaProjectedIncomeStatementforasoletrader• Integrateethical,internalcontrolandinternalauditissuesrelatingto
budgeting
Difficulties often experienced by learners with this chapter• Learnersstruggletocomprehendandunderstandthefundamental
differencebetweenaCashBudgetandaProjectedIncomeStatement.• LearnersoftengetconfusedwhenswitchingbetweentheCashBudget
andtheProjectedIncomeStatement.• Learnersalsooftenfindthecalculationsrelatingtothereplenishmentof
tradingstockdifficult.
Suggestions, tips and tricks for teaching this chapter and overcoming difficulties of learners• Thischapterexpandsonmanyof theconceptsthatwereintroducedin
Grade10.Wesuggestthatyoupayspecialattentiontoexplanationsandpractical examples in order to help the learners understand and become comfortable with these concepts.
• Suggestedmethodsof teachingthischapter:– Roleplay:Forexample,putlearnersintogroupsandeachgroup
mustchooseasimplesmallbusinessidea.Theymustthenidentifyhowthebusinesswillgenerateincomeandmakealistof alltheexpectedexpensesfortheirbusiness.TheyshouldthenperformresearchintothecostsinvolvedandusetheinformationgatheredtodrawupabasicProjectedIncomeStatementfortheirbusinessidea.
– Practicalactivities:suchastheprojectattheendof thechapterordrawingupapersonalCashBudget.
• Asmentionedabove,learnersoftengetconfusedwhenswitchingbetweentheCashBudgetandtheProjectedIncomeStatement.Probablythe most critical aspect to emphasise in this chapter is that the Cash Budgetisusedtoforecastthefuturecashpositionof abusinessandthusonlyinvolvesexpectedcashtransactions;whereastheProjectedIncomeStatementisusedtopredictthefutureprofitabilityof abusiness,andthus deals with expected income and expenses.
• Whendealingwithcalculationsrelatingtothereplenishmentof tradingstock,encourageyourlearnerstosetoutthesecalculationsinatable–thishelpstobreakthesecalculationsdownintomoremanageablesteps.

131s e c t i o n 4 • n o t e s / t i p s f o r t e a c h e r s
CHAPTER 12: Inventory systemsProgression of this topic
Grade 10: PerpetualstocksystemconceptsandentriesinbooksGrade 11: • Explanationof thedifferencesbetweenperpetualandperiodic
stock systems • Recordingof transactionsusingperiodicstocksystemGrade 12: Validation,valuationandcalculationof inventoriesusing
perpetualandperiodicstocksystems: • Specificidentification(of costpriceperunit) • First-in-firstout(FIFO) • Weightedaverage
Requirements for this chapter• Defineandexplainthefollowinginventorysystems:
– Perpetualstocksystem– Periodicstocksystem
• Discusstheadvantagesandthedisadvantagesof theperiodicandperpetual stock systems
• Recordtransactionsusingtheperiodicstocksysteminthe:– subsidiaryjournals– GeneralLedger
• Comparethebookentriesof theperiodicstocksystemwiththatof theperpetual stock system
• DrawupthefollowingaccountsintheGeneralLedger:– Purchases– OpeningStock– ClosingStock– Tradingaccount– CarriageonPurchases– CustomsandImportDuties
• ComparetheTrading account in the perpetual stock system with the Purchases account in the periodic stock system.
Difficulties often experienced with this chapter• LearnersstrugglewiththechangeinterminologyfromtheTrading Stock
account to the Purchases account.• Theyoftendon’tunderstandwhytheTrading Stock account is not used in
this system.
Suggestions, tips and tricks for teaching this chapter and overcoming difficulties of learners• ExplaintolearnerswhytheCost of Sales account is not used in
this system.• OncetheyunderstandthattheywillknowthattheTrading Stock account
is not used but the Purchases account is.• Startexplainingthissectionbyreferringtothedifferencesbetweenthe
perpetualandperiodicstocksystems.Learnersneedtostudythis.• Theledgeraccountsareimportantsospendsometimeexplainingthese.• Theconceptof openingstockandclosingstockisveryimportantfor
Grade12.

132 s e c t i o n 4 • n o t e s / t i p s f o r t e a c h e r s
CHAPTER 13: Value-added tax (VAT)Progression of this topic
Grade 10: Conceptsof value-addedtaxGrade 11: Calculationsof value-addedtaxGrade 12: VATControlledgeraccount
Requirements of this chapter• Understandthebasicprinciplesof VAT• PerformthefollowingVATcalculationsusingthecurrentrate:
– AddVATtocostpriceplusmark-upamount– ExtractVATfromVAT-inclusiveamounts
• Explainthedifferencebetweentheinvoicebasisandpaymentsbasisof accountingforVAT
• Describetheeffectof VATonbaddebts,discountsandgoodsreturned• Integrateethical,internalcontrolandinternalauditissuesrelating
toVAT
Difficulties often experienced by learners with this chapter• Learnersstruggletocomprehendandunderstandmanynewconcepts.• SomelearnersmayhavedifficultyperformingtheVATcalculations.
Suggestions, tips and tricks for teaching this chapter and overcoming difficulties of learners• Inthischapter,newterminologyandmanynewconceptsareintroduced,
so it may take a while for learners comprehend these sections. We suggestthatyoupayspecialattentiontoexplanationsandpracticalexamples in order to help the learners understand the new terms and become comfortable with the new concepts.
• Suggestedmethodsof teachingthischapter:– Roleplay:Forexample,putlearnersintogroupsrepresentingVAT
vendors,debtorsandcreditors(suppliers).TheVATvendorscanthenpretendtopurchasegoodsandservicesfromthecreditorsandsellproductstothedebtors.TheyshouldthencalculatetheVATamounts included in each of the transactions and determine whether theamountsshouldbeaccountedforasinputoroutputtax.Theycanthenpretendtowriteoff debtsasirrecoverable,receiveandallowdiscountsandreturngoods.Foreachof thesetransactions,thelearnersshouldcalculatetheVATamountsanddeterminethemethodthatshouldbeusedtoaccountfortheVATadjustment.
– Practicalactivities:Forexample,collectactualcashslipsandinvoicesfromrealshopsandthencheckthattheVATlistedhasbeencalculatedcorrectly.Also,checkthecashslipsandinvoicestoseeif thereareanyzero-rateditems.
• AnylearnerswhoarehavingdifficultyperformingtheVATcalculationsshoulddoadditionalpracticeexamples.Remembertogetthemtoperformbothtypesof calculations,namely:– AddingVATtothecostpriceplusmark-upamount– ExtractingVATfromVAT-inclusiveamounts.

133s e c t i o n 5 • C h a p t e r 1
Section 5
SoLUtionS to ActiVitieS
Activity 1.1 LB page 7
1. A code of ethics is a written set of rules and guidelines outlining the moral standards and ethical principles by which a business and all of its employees should conduct themselves.
2. An official caution, a fine or being suspended from working as an accountant
3. The King Code is a report drawn up by a South African committee chaired by a former High Court judge, Mervyn King, which sets out principles and guidelines relating to good and ethical corporate governance.
4. a. Accountability may be defined as the acknowledgment and assumption of responsibility for your actions, duties and decisions. It is the obligation of an individual, business or organisation to account for its activities and to be held responsible and answerable for the quality and accuracy of these activities or the results thereof.
b. Transparency may be defined as an honest way of doing things that allows other people to know exactly what you are doing. In the financial environment, transparency is essentially about conducting business activities in an open manner without withholding information or having any hidden agendas.
c. Sustainability may be defined simply as the ability to maintain economic, social and environmental resources. In the financial environment, sustainability refers to businesses operating in a manner that does not jeopardise our current and future social, environmental and economic well being.
5. Integrated reporting means companies reporting not only on their financial performance, but also on their social performance and their impact on the environment.
6. “Bottom line” accounting refers to the net income or net profit of the business (i.e. the last line of the Income Statement); in other words, reporting only on financial performance.
“Triple bottom line” accounting refers to reporting on and disclosing information about financial, social and environmental performance. The triple bottom line is thus often referred to as “people, planet, profit”.
CHAPTER 1 ethics

134 s e c t i o n 5 • C h a p t e r 1
Activity 1.2 LB page 8
1. “Bafana Bafana lose again; coach must be held accountable” This headline suggests that Bafana Bafana have lost a number of matches recently and calls for the coach to be held accountable for the string of poor performances. This means that the coach must either provide suitable reasons for the poor performances or must accept responsibility and resign or be fired.
2. “Bafana Bafana coach selects nephew – where is transparency?” This headline suggests that the Bafana Bafana coach was biased or showed favouritism in selecting his nephew to play for Bafana Bafana. It suggests that the selection process should be conducted in an open and honest way so that players are selected on merit.
3. “Bafana Bafana’s seven-match winning streak – is it sustainable?” This headline questions whether Bafana Bafana will be able to maintain their winning streak after having won seven matches in a row; in other words: “Can they keep on winning?”
Activity 1.3 LB page 8
1. “Local wildlife expert calls for oil spill accountability” This headline is about a wildlife expert demanding that the company responsible for an oil spill be held accountable. This company must explain why the oil spill happened, take responsibility for cleaning up the oil, take steps to prevent it happening again and if they were found to have acted negligently, they should be fined.
2. “Lack of accountability is big problem in schools” This headline might refer to teachers and principals are not being held responsible for poor results in their schools. It suggests that these teachers and principals should be called on to explain and justify these results.
3. “‘Transparency’ a watchword for residents of nuclear site” This headline refers to the people living near a nuclear plant being concerned about the potential risks such as nuclear fallout or being exposed to radiation. They are demanding that the company running the nuclear plant discloses all information regarding potential risks and alerts the residents immediately if any dangerous situations arise.
4. “Transparency would build public trust” This headline might refer to the public being wary of certain government activities and suggests that if the government discloses all information and acts in an open manner, then the public would be more trusting.
5. “Coca-Cola to launch sustainable plastic bottle packaging in UK” This headline refers to Coca-Cola using sustainable methods in its manufacturer of plastic bottles. This probably involves using recycled plastic and other eco-friendly techniques.
6. “Sustainability need not hurt profits” This headline argues that it is possible for a business to implement and use environmentally friendly methods in an economical manner; in other words, adopting a sustainable approach does not need to be more costly.

135s e c t i o n 5 • C h a p t e r 1
Case study 1.1 LB page 9
1. South African Institute for Chartered Accountants2. Global warming and climate change3. SAICA advises that economic development should be “achieved in
harmony with environmental priorities and social upliftment together with the eradication of poverty”.
4. SAICA believes that all organisations should: • entrenchsustainabilityobjectivesintotheirstrategiesandoperations• reporttotheirstakeholdersonsustainabilityissues,bothpositive
and negative. 5. Any Two of the following:
• Thecostof scarceresourcesisincreasing.• Consumersarebecomingmoreawareof choosingproductsthatare
produced in an environmentally friendly manner. • Regulations,finesandtaxesarebeingintroduced,whichmaybe
costly for companies that continue to employ practices that are harmful to the environment.
• Anyotherreasonableanswer.
Case study 1.2 LB page 10
1. Ethics in business relates to the business and its employees conducting themselves in a manner that is morally right. Such conduct should adhere to the principles of ethical and professional behaviour, such as integrity, objectivity, professional competence and proper care, confidentiality, respect of human rights and honesty.
Ethics is important in a business for several reasons; it helps to protect the business from harm from within, it promotes good business practice and professional behaviour, it helps to create a harmonious work environment with a strong moral culture throughout the business and can enhance the reputation of the business.
2. Ethics Institute of SA 3. The ethical culture that already exists in the business The level of development of the business’s ethics infrastructure The nature and size of the business 4. Societal censure, company censure and fear of prosecution The writer concludes that fear of punishment from within the
community and workplace seems to be a greater deterrent than the fear of being prosecuted by the State.
5. The presentation on the five steps to a culture of ethics should include suitable explanations of each of the five steps and should be neatly and clearly presented. • Obtainthecommitmentof thecompany’sseniormanagement.• Assessthecompany’svaluesandvulnerabilitiesbyconductingan
ethics audit.• Developacodeof ethicsthatsetsoutboththecompany’svalue
statement and code of conduct.• Setupanorganisationalethicsinfrastructure.• Integrateethicalbehaviourintothecultureof thecompanybyusing
the ethics infrastructure

136 s e c t i o n 5 • C h a p t e r 1
Case study 1.3 LB page 12
Use the assessment rubric to assess the learners’ reports.
Simply circle the relevant mark in each block, and add up for a mark out of 20.
Criteria 1Not achieved0–29%
2Elementary30–39%
3Moderate40–49%
4Adequate50–59%
5Substantial60–69%
6Meritorious70–79%
7Excellent80–100%
Mark achieved
the report:
• presentation
• detail
• accuracy
• reasons for decision
Could not present the information properly, even with help; no reasons included.
Needed help to present information and suggest reasons.
Some of the information presented, but not in detail; reasons not really/ always relevant.
Information presented in some detail, reasonably accurately and includes only one or two reasons.
Information presented in some detail, reasonably accurately and includes a few good reasons.
Information presented in detail, accurately and includes quite a number of good reasons.
Information presented in great detail, accurately and includes a variety of excellent reasons.
1–2 3 4 5 6 7–8 9–10
Reference to:
• ethical code
• accountability
• transparency
Could not provide information on these terms properly, even with help.
Needed help with these terms and relating them to the reasons for their decision.
Some of the terms referred to, but not in detail and not really/ always relevant.
All three terms referred to in some detail, reasonably accurately, but not very relevant or appropriate.
All three terms referred to in some detail, reasonably accurately and with some relevance.
All three terms referred to in detail, accurately and in an appropriate and relevant manner.
All three terms referred to in great detail, accurately and in a highly appropriate and relevant manner.
1–2 3 4 5 6 7–8 9–10
total: /20

137s e c t i o n 5 • C h a p t e r 2
Activity 2.1 LB page 16
1. C 2. G 3. A 4. H 5. B 6. E 7. D 8. F
Activity 2.2 LB page 19
A. 1. Main risk(s):Riskof theft(cashbeingstolen)2. Fundamental element of internal control lacking: Physical controls 3. Internal control procedure: The business should use a cash register
that locks and the excess cash should be kept in a safe. B. 1. Main risk(s): Riskof losingsalesduetoinsufficientstock Riskof undetectedtheftof stock,duetopoorstockrecordkeeping
2. Fundamental element of internal control lacking: Proper documentation
3. Internal control procedure: The business should implement a system for recording sales information on proper source documents.
C. 1. Main risk(s):Riskof theftandfraud(cashbeingstolenandbeingfraudulently covered up)
2. Fundamental element of internal control lacking:Divisionof duties (segregation of duties)
3. Internal control procedure: The business should separate these duties, so that one person counts the cash, another prepares the deposit slips and someone else deposits the money at the bank.
D. 1. Main risk(s):Riskof notdetectingerrorsandfraudulenttransactions2. Fundamental element of internal control lacking:Reconciliations3. Internal control procedure: Michael should perform a bank
reconciliationbycomparingtheCashReceiptsandCashPaymentsJournals with the bank statement. He should then investigate any differences that cannot be accounted for.
E. 1. Main risk(s):Riskof theftandfraud(stockbeingorderedandstolenwithout being detected)
2. Fundamental element of internal control lacking: Authorisation of transactions
3. Internal control procedure: Michael should authorise and sign all purchaseorders.HeshouldalsonotifytheFootwearFactorythatthey should only process purchase orders that are signed by him and, if possible, confirm all orders directly with him.
CHAPTER 2 internal controls and audit processes

138 s e c t i o n 5 • C h a p t e r 2
Activity 2.3 LB page 33
A. Internal control: Use a cash register that locks and storing excess cash in a safe.
Internal auditing procedures: • Checkthatthecashregisterandthesafearesecure.• ObserveMichaelandtheassistantsintheirhandlingof cashand
verify that they are locking the cash register and using the safe to store the excess cash.
B. Internal control: Use a system for recording and maintaining proper sales documentation.
Internal auditing procedures: • Verifythatthereisasysteminplaceforrecordingandmaintaining
proper sales documentation. • ObserveMichaelandtheassistantsperformingtheirduties,inorder
to verify whether they are adhering to sales documentation process. • Selectarepresentativesampleof salesdocumentsandcheckthemfor
accuracy, correctness and completeness. C. Internal control: Separate the duties of counting cash, preparing deposit
slips and depositing money at the bank. Internal auditing procedures:
• ObserveMichaelandtheassistantsperformingthesetasks,inordertoverify that each of these duties is performed by a different person.
• Selectarepresentativesampleof cashcountrecords,depositslipsandbank statements and verify them against each other.
D. Internal control: Perform bank reconciliations. Internal auditing procedures:
• InspecttheCashJournals,bankstatementsandBankReconciliationStatements to check for evidence of proper reconciliations being performed.
• Selectarepresentativesampleof CashJournals,bankstatementsandBankReconciliationStatementsandtraceamountsorre-performreconciliations in order to check for accuracy, correctness and completeness.
• Checkforevidenceof supplementaryentriesbeingrecordedintheappropriate Cash Journals and that any extraordinary differences were investigated and resolved.
E. Internal control: Proper authorisation of purchase orders Internal auditing procedures:
• Inspectarepresentativesampleof purchaseorderstocheckthattheyhave been properly authorised (signed by Michael).
• ConfirmwiththeFootwearFactorythattheywillnotprocessunsigned purchase orders from Shoemaker’s Shoe Shop.
• TestthiscontrolbysendinganunsignedpurchaseordertotheFootwearFactoryandseewhethertheyprocessitorwhethertheycontact Michael to query the order.
Activity 2.4 LB page 34
Internal audit procedures that may typically be used to evaluate the management and control of risks relating to fixed assets. • Conductingwalk-throughtests,tracingasampleof transactionsthrough
the fixed assets system, in order to: – verify the existence of the documented internal controls. – gain a clear understanding of the internal control processes and
procedures.

139s e c t i o n 5 • C h a p t e r 2
• Performingcompliancetestsbyobservingactivities,interviewingkeypersonnel and inspecting a representative sample of documents and records, in order to verify that: – fixed assets are physically safeguarded against theft and loss. – the measures taken to safeguarded fixed assets are being adhered to. – access to fixed assets is restricted to authorised personnel only. – proper authorisation and approvals are required for the acquisition of
fixed assets. – proper authorisation and approvals are required for the disposal of
fixed assets. – detailed records of fixed assets are maintained in a fixed assets
register. – a physical inspection of fixed assets is carried out periodically and
checked against the fixed assets register. – any discrepancies between the physical fixed assets inventory and
the records in the fixed assets register are noted and investigated promptly.
– depreciation policies are established and documented. – depreciation is calculated and recorded according to set policy. – movements of fixed assets are recorded promptly in the appropriate
journal. – fixed assets are adequately insured. – fixed assets are properly maintained. – lost, stolen or destroyed items are reported immediately.
• Conductingsubstantivetestsonarepresentativesampleof transactions,documents and records, by checking information and re-performing tasks, in order to: – verify the accuracy and completeness of the records in the fixed assets
register. – verify that the physical fixed assets inventory was accurately checked
against the fixed assets register. – check the accuracy of the depreciation calculations. – verify that depreciation and fixed assets movements were recorded
accurately in the journals. – reconcile the records in the fixed assets register against the fixed
asset accounts in the General Ledger to test for accuracy and completeness.
Case study 2.1 LB page 34
1. Duringrecessions,companiesusuallylooktoreducecostsandthisoftenresults in internal controls being unintentionally weakened. This creates opportunities for unethical employees, who may seek to take advantages of these vulnerabilities by committing fraudulent acts that are unlikely to be detected.
2. white-collar crime refers to non-violent criminal acts, committed by people in the workplace, involving fraud and illegal financial transactions.
3. Segregation of duties: when employees are retrenched there are fewer personnel available to perform various duties, so tasks that would normally be separated in order to provide greater control, are performed by the same person.
4. Theft Financialstatementfraud Bribery and corruption

140 s e c t i o n 5 • C h a p t e r 2
5. a. Riskmanagementfunctionb. Internal controls
6. Internal auditing function 7. Redflagsareusuallyusedasasigntowarnof potentialdanger.Inthis
context,redflagsrefertosignsindicatingthatfraudulentactivitiesmaybe occurring within the organisation.
8. Employeesreceivinglavishgiftsfromsuppliers Employees driving expensive cars that they would not ordinarily be able
to afford based on their salary Employees living in luxury homes they would not ordinarily be able to
afford based on their salary.
Group assessment 2.1: Written report/presentation LB page 35
Marks: 25 time: 2 hours
Use the assessment rubric to assess the learners’ reports.
Simply circle the relevant mark in each block, and add up for a mark out of 25.
Criteria 1Not achieved0–29%
2Elementary30–39%
3Moderate40–49%
4Adequate50–59%
5Substantial60–69%
6Meritorious70–79%
7Excellent80–100%
Mark achieved
the report itself
Could not present the information properly, even with help; no suggestions included.
Needed help to present information and make suggestions.
Some of the information presented, but not in detail; suggestions not always relevant.
Some of the information in correct order and reasonably accurately presented; includes one or two practical suggestions.
Information in correct order and reasonably accurately presented; includes a few practical suggestions.
Information in correct order and accurately presented; includes quite a number of practical suggestions.
Information presented in detail and accurately and in the correct order; includes a variety of excellent and practical suggestions.
1–2 3 4 5 6 7–8 9–10
Interaction as a group
No effort made to share tasks or work together as a group.
Tasks not shared; some interaction between group members.
Shared some of the tasks; interaction as a group: not too good.
Shared some of the tasks; interaction as a group: reasonably good, but some of the group members did not cooperate, or are not involved at all.
Some tasks shared; interaction as a group: satisfactory.
Most tasks shared; interaction as a group: good.
Shared tasks equally; interaction as a group: productive.
1–2 3 4 5 6 7–8 9–10
Cover page
Hardly an effort worth mentioning. Hasty and sloppy. Unacceptable.
Untidy appearance. Neither interesting nor original. Hasty and sloppy work.
Made some effort – very neat, but not particularly attractive or interesting.
Neat and reasonably interesting.
Made an effort – neat, reasonably original.
Made an effort – creative, neat, original, interesting and attractive.
An excellent cover page – creative, original, interesting and attractive. Very neat.
½ 1 2 3 3½ 4 5
total: /25

141s e c t i o n 5 • C h a p t e r 3
Activity 3.1 (Case study) LB page 38
1. The credit column2. The debit column3. Debitcolumn:Chequebookfee
Dishonouredcheque Debitorder Service fee Cash handling feeCredit column: Interest
4. Chequenumbers6and7andtheATMwithdrawalslipforR23005. No, the deposit slip on 29th is not on the bank statement.6. R54511,007. R53573,028. Becausethereareitemsonthebankstatementforwhichthebusinesshas
not accounted, as well as some cheques. Not all ATM withdrawal slips and deposit slips were taken into account at the bank.
9. He is keeping all his cheque counterfoils, ATM withdrawal slips and deposit slips, so he is keeping some sort of record. He will, however, find difficulty in calculating profit if accounting records are not formalised.
Activity 3.2 LB page 54
1. a. cash Receipts Journal of natasha Rose Designs for August 2019
Doc. no. Day Details Fol. Bank
Debtorscontrol
Sundry accountsAmount Details
31 Total b/d 177 857 00 1 550 00 151 000 00
BS Southern Bank 375 00 375 00Interest on current account
H Govender 1 000 00 1 000 00 Rent income179 232 00
B6
1. b. cash Payments Journal of natasha Rose Designs for August 2019
Doc. no. Day Name of payee Fol. Bank
Debtorscontrol
Sundry accountsAmount Details
31 Total b/d 25 058 00 1 550 00 4 200 00BS Insure 475 00 475 00 Insurance
H Govender (R/D) 1 000 00 1 000 00 Rent incomeSouthern Bank 75 00 75 00 Bank charges
26 608 00B6
CHAPTER 3 Reconciliations: Bank reconciliations

142 s e c t i o n 5 • C h a p t e r 3
2. General Ledger of natasha Rose DesignsBalance Sheet account
Dr Bank (A) B6 cr
Date Details Fol. Amount Date Details Fol. Amount
2019 Aug 31 Total receipts CRJ 179 232 00
2019 Aug 31 Total payments CPJ 26 608 00
Balance c/d 152 624 00
179 232 00 179 232 00
2019 Sep 01 Balance b/d 152 624 00
3.natasha Rose DesignsBank Reconciliation Statement on 31 August 2019
Fol. Debit credit
Credit balance as per the bank statement 154 643 00
Credit outstanding deposits 9 051 00
Debit outstanding cheques:
No. 06 4 120 00
No. 07 800 00
No. 08 6 150 00
Debit balance as per the Bank account 152 624 00
163 694 00 163 694 00
Activity 3.3 LB page 56
1.cash Receipts Journal of Joe’s Wholesale Store for September 2019
Doc. no. Day Details Fol. Bank
Debtorscontrol
Sundry accountsAmount Details Fol.
30 Total b/d 62 655 00 10 950 00
Western Bank 175 00 175 00Interest on current account
62 830 00B6
cash Payments Journal of Joe’s Wholesale Store for September 2019
Doc. no. Day Name of payee Fol. Bank
Debtorscontrol
Sundry accountsAmount Details Fol.
30 Total b/d 34 970 00 1 615 00 13 358 00BS Sanlam 645 00 645 00 Insurance
T Dlamini (R/D) 1 650 00 1 650 00Western Bank 111 00 111 00 Bank charges
37 376 00B6
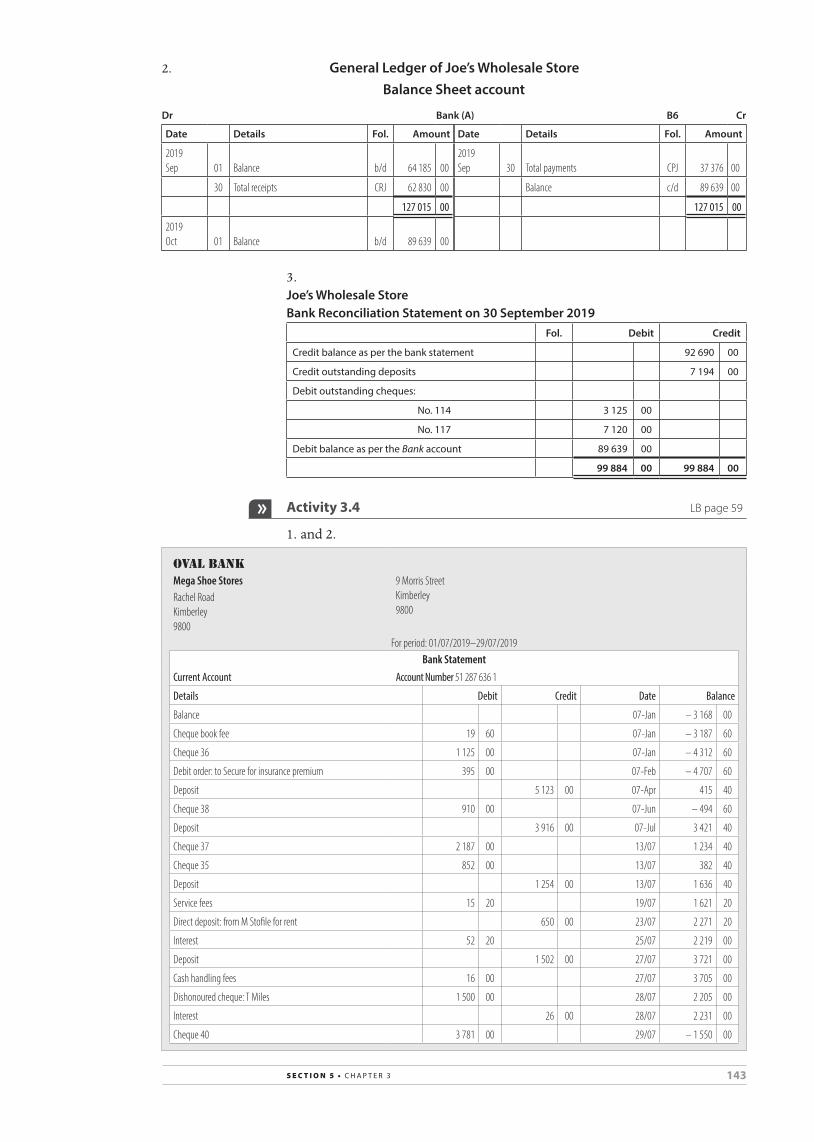
143s e c t i o n 5 • C h a p t e r 3
2. General Ledger of Joe’s Wholesale StoreBalance Sheet account
Dr Bank (A) B6 cr
Date Details Fol. Amount Date Details Fol. Amount
2019 Sep 01 Balance b/d 64 185 00
2019 Sep 30 Total payments CPJ 37 376 00
30 Total receipts CRJ 62 830 00 Balance c/d 89 639 00
127 015 00 127 015 00
2019 Oct 01 Balance b/d 89 639 00
3.Joe’s Wholesale StoreBank Reconciliation Statement on 30 September 2019
Fol. Debit credit
Credit balance as per the bank statement 92 690 00
Credit outstanding deposits 7 194 00
Debit outstanding cheques:
No. 114 3 125 00
No. 117 7 120 00
Debit balance as per the Bank account 89 639 00
99 884 00 99 884 00
Activity 3.4 LB page 59
1. and 2.
oval BANKMega Shoe Stores 9 Morris Street
Kimberley 9800
Rachel Road Kimberley 9800
For period: 01/07/2019–29/07/2019Bank Statement
Current Account Account Number 51 287 636 1
Details Debit Credit Date Balance
Balance 07-Jan – 3 168 00
Cheque book fee 19 60 07-Jan – 3 187 60
Cheque 36 1 125 00 07-Jan – 4 312 60
Debit order: to Secure for insurance premium 395 00 07-Feb – 4 707 60
Deposit 5 123 00 07-Apr 415 40
Cheque 38 910 00 07-Jun – 494 60
Deposit 3 916 00 07-Jul 3 421 40
Cheque 37 2 187 00 13/07 1 234 40
Cheque 35 852 00 13/07 382 40
Deposit 1 254 00 13/07 1 636 40
Service fees 15 20 19/07 1 621 20
Direct deposit: from M Stofile for rent 650 00 23/07 2 271 20
Interest 52 20 25/07 2 219 00
Deposit 1 502 00 27/07 3 721 00
Cash handling fees 16 00 27/07 3 705 00
Dishonoured cheque: T Miles 1 500 00 28/07 2 205 00
Interest 26 00 28/07 2 231 00
Cheque 40 3 781 00 29/07 – 1 550 00

144 s e c t i o n 5 • C h a p t e r 3
3. a. Increaseb. Decreasec. Because the bank account has an overdraft balance and a favourable
balance in the same monthd. They could charge T Miles with interest and persuade him to pay
them the money owed to them.e. Sell off stock for cash, encourage debtors to pay, hold a sale in order
to get in some cash, sell off assets that they are not using efficiently
Activity 3.5 LB page 60
1.cash Receipts Journal of Martin’s Bakery Supply Store for March 2019
Doc. no. Day Details Fol. Bank
Debtorscontrol
Sundry accountsAmount Details
31 Total b/d 44 062 00 5 650 00 14 484 00B6
cash Payments Journal of of Martin’s Bakery Supply Store for March 2019
Doc. no. Day Name of payee Fol. Bank
Debtorscontrol
Sundry accountsAmount Details
31 Total b/d 33 446 00 856 00 4 902 00BS Surance 344 00 344 00 Insurance
N Desai (R/D) 1 302 00 1 320 00East Bank 49 00 49 00 Bank chargesEast Bank 102 00 102 00 Interest on overdraft
35 243 00B6
2. General Ledger of Martin’s Bakery Supply StoreBalance Sheet account
Dr Bank (L) B6 cr
Date Details Fol. Amount Date Details Fol. Amount
2019 Mar 31 Total receipts CRJ 44 062 00
2019 Mar 30 Balance b/d 21 863 00
Balance c/d 13 044 00 Total payments CPJ 35 243 00
57 106 00 57 106 00
2019 Apr 01 Balance b/d 13 044 00
3.Martin’s Bakery Supply StoreBank Reconciliation Statement on 31 March 2019
Fol. Debit credit
Debit balance as per the bank statement 5 762 00
Credit outstanding deposits 7 880 00
Debit outstanding cheques:
No. 25 15 162 00
Credit balance as per the Bank account 13 044 00
20 924 00 20 924 00

145s e c t i o n 5 • C h a p t e r 3
Activity 3.6 LB page 67
1.cash Receipts Journal of Allied traders for november 2019
Doc. no. Day Details Fol. Bank
Debtorscontrol
Sundry accountsAmount Details
30 Total b/d 29 477 76B Hunter 1 000 00 1 000 00 Rent incomeBMW Cars 99 40 99 40 Repairs
30 577 16B6
cash Payments Journal of Allied traders for november 2019
Doc. no. Day Name of payee Fol. Bank
Debtorscontrol
Sundry accountsAmount Details
30 Total b/d 31 703 07BS F Stein 175 60 175 60
Eastern Bank 16 70 16 70 Interest on overdraftAnti-crime 450 00 450 00 Insurance
1742 BMW Cars 99 40 99 40 RepairsBS Daily News 9 00 9 00 Newspaper subscription
Eastern Bank 47 90 47 90 Bank charges32 501 67
B6
General Ledger of Allied tradersBalance Sheet account
Dr Bank B6 cr
Date Details Fol. Amount Date Details Fol. Amount
2019 Nov 30 Total receipts CRJ 30 577 16
2019 Nov 01 Balance b/d 1 147 50
Balance c/d 3 072 01 30 Total payments CPJ 32 501 67
33 649 17 33 649 17
2019 Dec 01 Balance b/d 3 072 01
2.Allied tradersBank Reconciliation Statement on 30 november 2019
Fol. Debit credit
Debit balance as per the bank statement 594 13
Credit outstanding deposits 4 860 20
Debit outstanding cheques:
No. 1734 368 68
No. 1741 6 870 00
No. 1742 99 40
Credit balance as per the Bank account 3 072 01
7 932 21 7 932 21

146 s e c t i o n 5 • C h a p t e r 3
Activity 3.7 LB page 71
1.cash Receipts Journal of Africa traders for April 2019
Doc. no. Day Details Fol. Bank
Debtorscontrol
Sundry accountsAmount Details
30 Total b/d 34 056 78BS City Press 205 00 205 00 Advertising
Safety Day Care 1 500 00 1 500 00 Rent incomeQuazi Bank 62 20 62 20 Interest on current account
35 823 98B6
cash Payments Journal of Africa traders for April 2019
Doc. no. Day Name of payee Fol. Bank
Debtorscontrol
Sundry accountsAmount Details
30 Total b/d 31 124 20BS Municipality 223 80 223 80 Water and rates
R Majiet 110 20 110 20H Saunders 249 40 249 40Multi Insurers 220 00 220 00 InsuranceQuazi Bank 220 70 220 70 Bank chargesSales 40 00 40 00 SalesBuzzy Best 198 00 198 00 Equipment
32 386 30B6
2. General Ledger of Africa tradersBalance Sheet account
Dr Bank B6 cr
Date Details Fol. Amount Date Details Fol. Amount
2019 Apr 01 Balance b/d 7 935 45
2019 Apr 30 Total payments CPJ 32 386 30
30 Total receipts CRJ 35 823 98 Balance c/d 11 373 13
43 759 43 43 759 43
2019 May 01 Balance b/d 11 373 13
3.Africa tradersBank Reconciliation Statement on 30 April 2019
Fol. Debit credit
Credit balance as per the bank statement 12 340 00
Debit outstanding cheques:
No. 418 765 25
No. 427 450 00
No. 428 3 850 00
No. 429 4 440 00
Debit balance as per the Bank account 11 373 13
Credit amount incorrectly debited by the bank 660 00
Credit outstanding deposits 7 878 78
20 878 78 20 878 78

147s e c t i o n 5 • C h a p t e r 3
Activity 3.8 (challenge) LB page 74
1.cash Receipts Journal of nieuwoudt traders for April 2015 cRJ4
Doc. no. Day Details Fol. Bank
Debtorscontrol
Sundry accountsAmount Details
30 Total b/d 61 695 00Paarl Cycling Club 500 00 500 00 Donations
BS A Bester 350 00 350 00BS XY Bank 12 640 00 12 000 00 Fixed Deposit: XY Bank
640 00 Interest on fixed depositBS SARS 27 00 27 00 SARS (PAYE)
75 212 00B6
cash Payments Journal of nieuwoudt traders for April 2015 cPJ4
Doc. no. Day Name of payee Fol. Bank
Trading stock
Debtorscontrol
Sundry accountsAmount Details
BS 30 Total b/d 68 785 00BS Jooste Wholesaler 90 00 90 00
857 Paarl Cycling Club 500 00 500 00 Donations
BS P Malherbe 1 520 00 1 520 00
SO Allsure insurers 500 00 500 00 Drawings
SO Getogether insurers 600 00 600 00 Insurance
DO Telkom 524 00 524 00 Telephone
DO Paarl Gymnasium Primary School 480 00 480 00 Drawings
858 PP Medical Aid 4 370 00 4 370 00 Medical aid
BS ABC Bank 584 00 584 00 Bank charges
BS ABC Bank 247 00 247 00 Interest on overdraft
78 200 00
B6
2. General Ledger of nieuwoudt tradersBalance Sheet account
Dr Bank (L) B6 cr
Date Details Fol. Amount Date Details Fol. Amount
2015 Apr 30 Total receipts CRJ4 75 212 00
2015 Apr 01 Balance b/d 17 344 00
Balance c/d 20 332 00 30 Total payments CPJ4 78 200 00
95 544 00 95 544 00
2015 May 01 Balance b/d 20 332 00

148 s e c t i o n 5 • C h a p t e r 3
3.nieuwoudt tradersBank Reconciliation Statement on 30 April 2015
Fol. Debit credit
Debit balance as per the bank statement 39 683 00
Credit incorrect entry 998 00
Credit outstanding deposit 34 221 00
Debit cheques not yet presented for payment:
No. 844 1 664 00
No. 850 1 100 00
No. 854 5 678 00
No. 856 2 556 00
No. 857 500 00
No. 858 4 370 00
Credit balance as per the Bank account 20 332 00
55 551 00 55 551 00
Activity 3.9 LB page 82
1.cash Receipts Journal of Freddie Stores for June 2019
Doc. no. Day Details Fol. Bank
Sundry accountsAmount Details
BS 30 Total b/d 67 407 00 5 393 00BS Boda Sports Club 1 350 00 1 350 00 DonationsBS E Prins 4 784 40 4 784 40 Rent income
71 20 71 20 Interest on current account73 612 60
B10
2.cash Payments Journal of Freddie Stores for June 2019
Doc. no. Day Name of payee Fol. Bank
Sundry accountsAmount Details
30 Total b/d 65 215 50 8 005 60BS R Beach 1 122 00 1 122 00 Debtors ControlAO CA Insurance Company 818 10 818 10 InsuranceBS 307 20 307 20 Bank charges
145 98 145 98 Interest on overdraftBasson Motors 100 00 100 00 Repairs
BS L Bell 471 00 471 00 Debtors Control68 179 78
B10
3. General Ledger of Freddie StoresBalance Sheet account
Dr Bank B6 cr
Date Details Fol. Amount Date Details Fol. Amount
2019 Jun 30 Total receipts CRJ 73 612 60
2019 Jun 01 Balance b/d 7 858 92
Balance c/d 2 426 10 30 Total payments CPJ 68 179 78
76 038 70 76 038 70
2019 Jul 01 Balance b/d 2 426 10

149s e c t i o n 5 • C h a p t e r 3
4. Freddie Stores Bank Reconciliation Statement on 30 June 2019
Fol. Debit credit
Debit balance as per the bank statement 11 082 50
Credit outstanding deposits 14 563 80
Debit outstanding cheques:
No. 6384 2 867 40
No. 6440 2 166 00
No. 6433 874 00
Credit balance as per the Bank account 2 426 10
16 989 90 16 989 90
Activity 3.10 LB page 83
1. cash Receipts Journal of indaba traders for october 2019 cRJ
Doc. no. Day Details Fol. Bank
Debtorscontrol
Sundry accountsAmount Details
31 Totals 28 919 00 7 920 00 3 795 00
BSEls Sports (cheque no. 2468 stopped) 1 142 00 1 142 00 Creditors Control
BSOW Suppliers (error corrected) 18 00 18 00 Advertising
BS 12 996 00 11 400 00 Fixed deposit1 596 40 Interest on fixed deposit
43 075 00B6
cash Payments Journal of indaba traders for october 2019 cPJ
Doc. no. Day Name of payee Fol. Bank
Debtorscontrol
Sundry accountsAmount Details
31 Totals 40 882 00 330 00 8 135 00
BSGibbs (cheque dishonoured) 1 254 00 1 254 00
BS Africa Motors 1 056 00 1 056 00Vehicle finance: Africa Motors
BS City Council 618 00 618 00 Water and electricity
BSSmith (cheque cancelled) 808 00 808 00
BS 177 00 177 00 Bank chargesBS 95 00 95 00 Interest on overdraft
44 890 00B6
2. General Ledger of indaba tradersBalance Sheet account
Dr Bank B6 cr
Date Details Fol. Amount Date Details Fol. Amount
2019 Oct 01 Balance b/d 733 00
2019 Oct 31 Total payments CPJ 44 890 00
Total receipts CRJ 43 075 00
Balance c/d 1 082 00
44 890 00 44 890 00
2019 Nov 01 Balance b/d 1 082 00
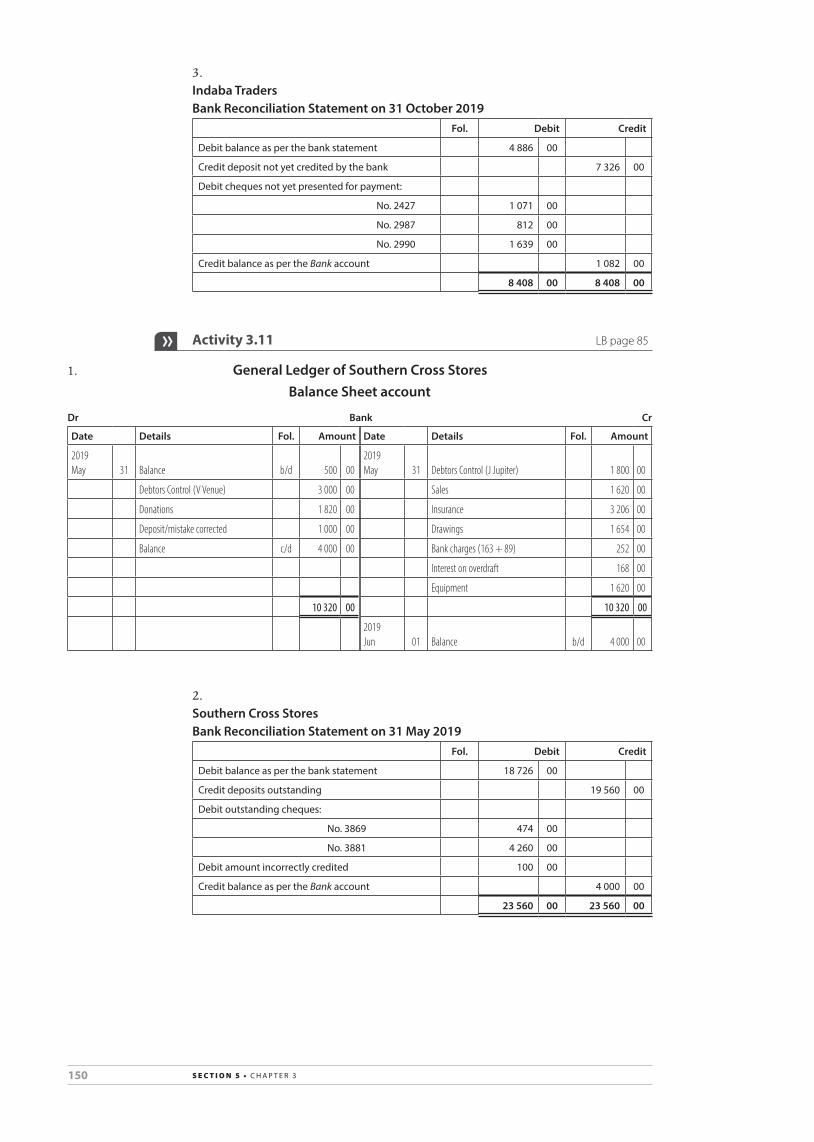
150 s e c t i o n 5 • C h a p t e r 3
3.indaba tradersBank Reconciliation Statement on 31 october 2019
Fol. Debit credit
Debit balance as per the bank statement 4 886 00
Credit deposit not yet credited by the bank 7 326 00
Debit cheques not yet presented for payment:
No. 2427 1 071 00
No. 2987 812 00
No. 2990 1 639 00
Credit balance as per the Bank account 1 082 00
8 408 00 8 408 00
Activity 3.11 LB page 85
1. General Ledger of Southern cross StoresBalance Sheet account
Dr Bank cr
Date Details Fol. Amount Date Details Fol. Amount
2019 May 31 Balance b/d 500 00
2019 May 31 Debtors Control (J Jupiter) 1 800 00
Debtors Control (V Venue) 3 000 00 Sales 1 620 00
Donations 1 820 00 Insurance 3 206 00
Deposit/mistake corrected 1 000 00 Drawings 1 654 00
Balance c/d 4 000 00 Bank charges (163 + 89) 252 00
Interest on overdraft 168 00
Equipment 1 620 00
10 320 00 10 320 00
2019 Jun 01 Balance b/d 4 000 00
2.Southern cross StoresBank Reconciliation Statement on 31 May 2019
Fol. Debit credit
Debit balance as per the bank statement 18 726 00
Credit deposits outstanding 19 560 00
Debit outstanding cheques:
No. 3869 474 00
No. 3881 4 260 00
Debit amount incorrectly credited 100 00
Credit balance as per the Bank account 4 000 00
23 560 00 23 560 00

151s e c t i o n 5 • C h a p t e r 3
Activity 3.12 LB page 86
1. General Ledger of Shuttle StoresBalance Sheet account
Dr Bank cr
Date Details Fol. Amount Date Details Fol. Amount
2012 Feb 29 Donation 267 00
2012 Feb 29 Balance b/d 2 547 00
Packing material 180 00 Bank charges 324 00
Interest on current account 38 00 Debtor’s control (D Daniels) 300 00
Rent income 2 500 00 Debtor’s control (P Paul) 260 00
Balance c/d 1 273 00 Insurance 400 00
Drawings 140 00
Electricity 287 00
4 258 00 4 258 00
2012 Mar 01 Balance b/d 1 273 00
2.Shuttle StoresBank Reconciliation Statement on 29 February 2012
Fol. Debit credit
Debit balance as per the bank statement 3 083 00
Credit deposits outstanding 3 150 00
Debit cheques not yet presented for payment:
No. 376 250 00
No. 412 340 00
No. 465 750 00
Credit balance as per the Bank account 1 273 00
4 423 00 4 423 00
Activity 3.13 LB page 88
1. –R13260+19320–2300–1820=R19402. Cheque no. 241 is stale because it is older than 6 months and it should be
cancelled. It is no longer legal tender and can no longer be presented for payment.
3. Addtheamountof R2300totheBankamountunderCashandcashequivalents and add it back to the Creditors Control amount under Trade and other payables.
4. R1940+2300=R42405. Post-datedchequesreceivedwillnotbeenteredintotheCRJand
thereforewillnotaffecttheBRS.Thepost-datedchequereceivedmustbekept in the post-dated cheque register until the valid date.
6. • Forinternalcontrolpurposes• Toidentifythecorrectbankbalanceandtoupdaterecords• Depositsmadeandchequesissuednotonlyaffectthebusinessbut
also the bank concerned therefore these transactions must be verified.• Thebusinesskeepsarecordof allcashtransactionsinthesameway
the bank also keeps a record of its transactions with the business, and the accuracy of these transactions must be checked.

152 s e c t i o n 5 • C h a p t e r 3
• Thebooksof thebusinessandthatof thebankshouldagreeandthebank balance should be the same in both books.
• Comparisonsbetweenthebooksof thebusinessandthatof thebankmustbemadeonamonthlybasisbypreparingaBankReconciliationStatement.
• Errors,fraudanddishonestycanbedetectedonamonthlybasis.
Activity 3.14 LB page 91
no. Bank account Bank Reconciliation Statement no entry
contra/Details Debit credit Debit credit
1. Packing material r18
2. P Zuma: Debtors Control r250
3. r1 600
4. Bank charges r60
5. r3 425
6. Drawings r950
7. No entry
8. Interest on current account r95
9.Creditors Control: Quip-co Ltd r425 r425
10. Debtors Control: B Zulu r850
11. r960
12. Rent income r5 000
13. Advertisements r630 r630 r630
Informal assessment 3.1 LB page 92
Marks: 45 time: 30 minutes
1.cash Receipts Journal of Hugo traders for March 2019 cRJ3
Doc. no. Day Details Fol. Bank
Debtorscontrol
Sundry accountsAmount Details Fol.
31 Total b/d ✓ 19 230 00
XAT Bank ✓ 121 00 ✓ 121 00Interest on current account ✓
PEN Stationery ✓ 280 00 ✓ 280 00 Stationery ✓Alfie Stores ✓ 3 600 00 ✓ 3 600 00 Trading stock ✓
✓ 23 231 00B6
[11]
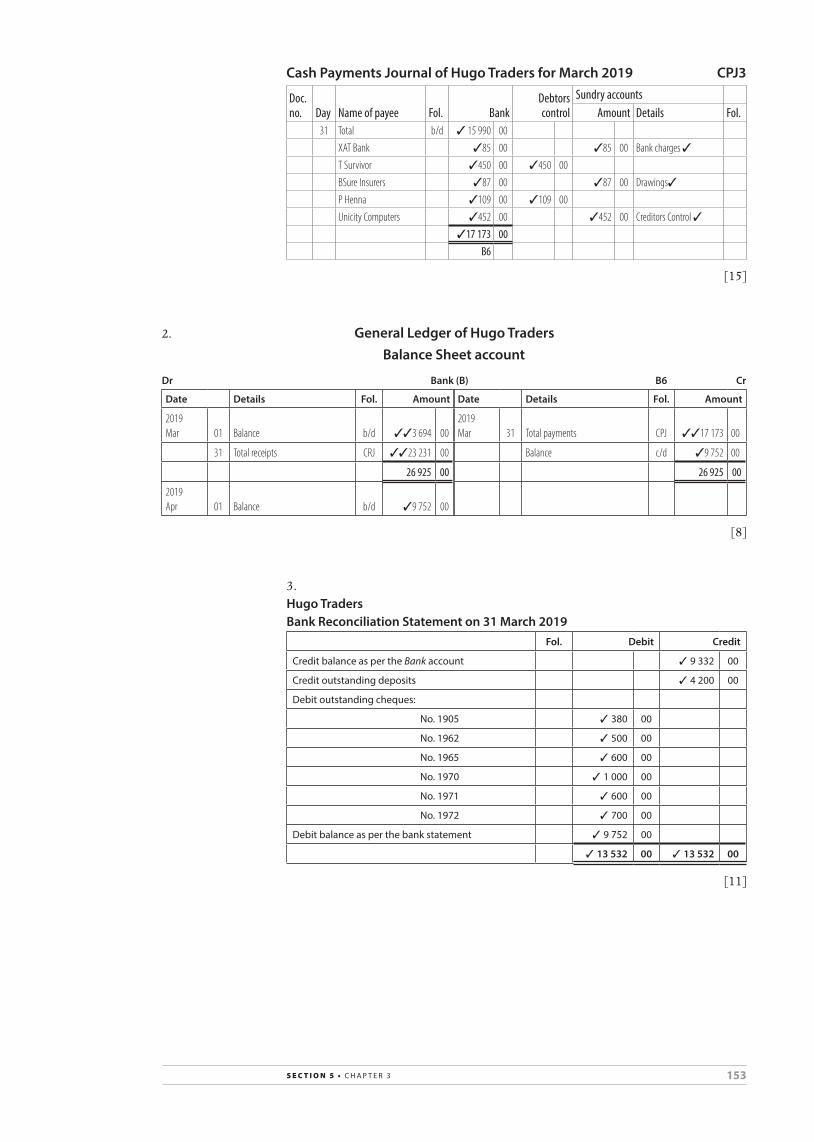
153s e c t i o n 5 • C h a p t e r 3
cash Payments Journal of Hugo traders for March 2019 cPJ3
Doc. no. Day Name of payee Fol. Bank
Debtorscontrol
Sundry accountsAmount Details Fol.
31 Total b/d ✓ 15 990 00XAT Bank ✓85 00 ✓85 00 Bank charges ✓T Survivor ✓450 00 ✓450 00BSure Insurers ✓87 00 ✓87 00 Drawings✓P Henna ✓109 00 ✓109 00Unicity Computers ✓452 00 ✓452 00 Creditors Control ✓
✓17 173 00B6
[15]
2. General Ledger of Hugo tradersBalance Sheet account
Dr Bank (B) B6 cr
Date Details Fol. Amount Date Details Fol. Amount
2019 Mar 01 Balance b/d ✓✓3 694 00
2019 Mar 31 Total payments CPJ ✓✓17 173 00
31 Total receipts CRJ ✓✓23 231 00 Balance c/d ✓9 752 00
26 925 00 26 925 00
2019 Apr 01 Balance b/d ✓9 752 00
[8]
3.Hugo tradersBank Reconciliation Statement on 31 March 2019
Fol. Debit credit
Credit balance as per the Bank account ✓ 9 332 00
Credit outstanding deposits ✓ 4 200 00
Debit outstanding cheques:
No. 1905 ✓ 380 00
No. 1962 ✓ 500 00
No. 1965 ✓ 600 00
No. 1970 ✓ 1 000 00
No. 1971 ✓ 600 00
No. 1972 ✓ 700 00
Debit balance as per the bank statement ✓ 9 752 00
✓ 13 532 00 ✓ 13 532 00
[11]
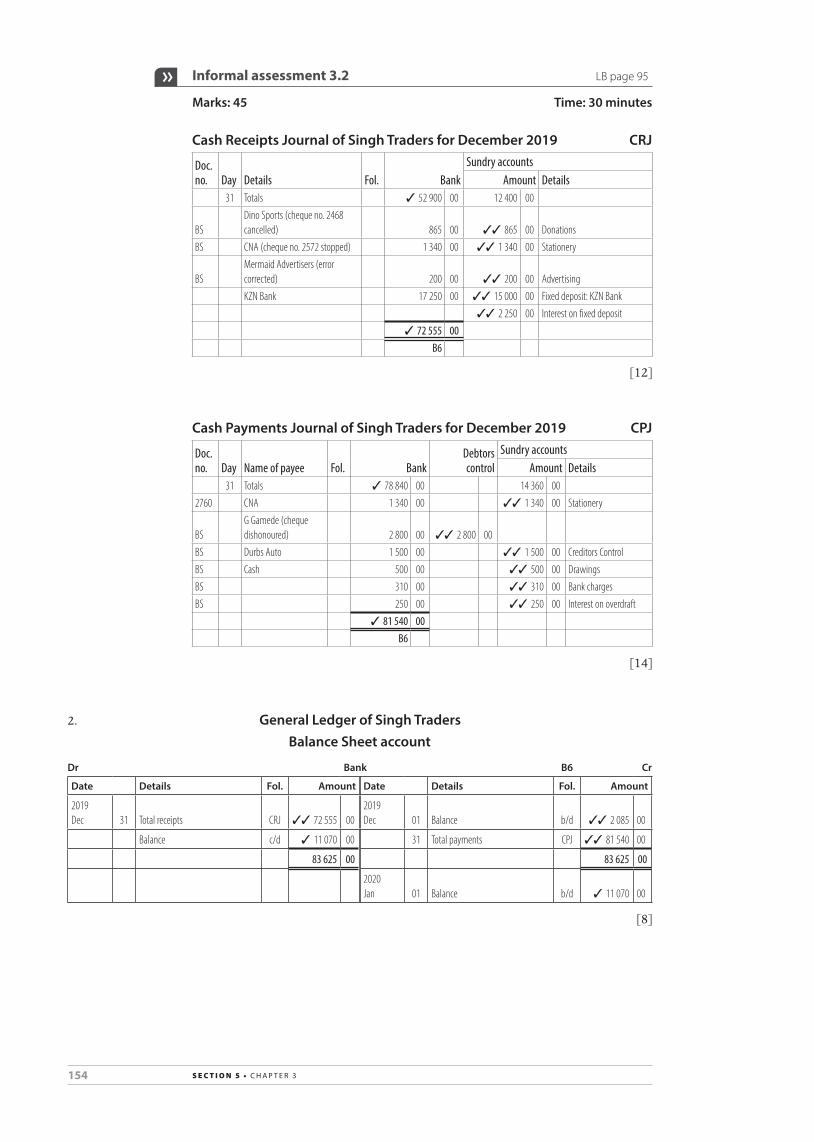
154 s e c t i o n 5 • C h a p t e r 3
Informal assessment 3.2 LB page 95
Marks: 45 time: 30 minutes
cash Receipts Journal of Singh traders for December 2019 cRJ
Doc. no. Day Details Fol. Bank
Sundry accountsAmount Details
31 Totals ✓ 52 900 00 12 400 00
BSDino Sports (cheque no. 2468 cancelled) 865 00 ✓✓ 865 00 Donations
BS CNA (cheque no. 2572 stopped) 1 340 00 ✓✓ 1 340 00 Stationery
BSMermaid Advertisers (error corrected) 200 00 ✓✓ 200 00 AdvertisingKZN Bank 17 250 00 ✓✓ 15 000 00 Fixed deposit: KZN Bank
✓✓ 2 250 00 Interest on fixed deposit✓ 72 555 00
B6
[12]
cash Payments Journal of Singh traders for December 2019 cPJ
Doc. no. Day Name of payee Fol. Bank
Debtorscontrol
Sundry accountsAmount Details
31 Totals ✓ 78 840 00 14 360 002760 CNA 1 340 00 ✓✓ 1 340 00 Stationery
BSG Gamede (cheque dishonoured) 2 800 00 ✓✓ 2 800 00
BS Durbs Auto 1 500 00 ✓✓ 1 500 00 Creditors ControlBS Cash 500 00 ✓✓ 500 00 DrawingsBS 310 00 ✓✓ 310 00 Bank chargesBS 250 00 ✓✓ 250 00 Interest on overdraft
✓ 81 540 00B6
[14]
2. General Ledger of Singh tradersBalance Sheet account
Dr Bank B6 cr
Date Details Fol. Amount Date Details Fol. Amount
2019 Dec 31 Total receipts CRJ ✓✓ 72 555 00
2019 Dec 01 Balance b/d ✓✓ 2 085 00
Balance c/d ✓ 11 070 00 31 Total payments CPJ ✓✓ 81 540 00
83 625 00 83 625 00
2020 Jan 01 Balance b/d ✓ 11 070 00
[8]

155s e c t i o n 5 • C h a p t e r 3
3.Singh tradersBank Reconciliation Statement on 31 December 2019
Fol. Debit credit
Debit balance as per the bank statement ✓✓ 17 880 00
Credit deposit not yet credited by the bank ✓ 13 500 00
Debit cheques not yet presented for payment:
No. 2652 ✓✓ 1 000 00
No. 2758 ✓ 1 540 00
No. 2759 ✓ 2 810 00
No. 2760 ✓✓ 1 340 00
Credit balance as per the Bank account ✓✓ 11 070 00
24 570 00 24 570 00
[11]
Informal assessment 3.3 (challenge) LB page 97
Marks: 30 time: 25 minutes
no. Details of entry in the journal General Ledger Bank account
Bank Reconciliation Statement
no entry
name of journal
name of account in General Journal/Ledger
Amount Account Debit
Account credit
Debit credit
1. CrJ ✓ Rent income ✓ ✓ 1 000 ✓ 1 000
2. CpJ ✓ Creditors for salaries ✓ ✓✓ 13 000 ✓ 13 000 ✓✓ 3 500
3. CpJ ✓Debtors Control (A Mlaba) ✓ ✓ 600 ✓ 600
4. CrJ ✓ Donations ✓ ✓ 500 ✓ 500
5. CpJ ✓ Insurance ✓ ✓ 400 ✓ 400
6. CpJ ✓ Trading stock ✓ ✓✓ 999 ✓ 999
7. ✓ 420
8. ✓ 1 760
[30]

156 s e c t i o n 5 • C h a p t e r 4
Activity 4.1 LB page 110
Campwell CleanersCreditors Reconciliation Statement on 30 June 2016
Balance as per creditor’s statement on 28 June 2016 19 512
Incorrect debit on statement (3 120)
Invoice no. 213 not on statement 8 165
payment not on statement (14 657)
returns not on statement (3 100)
Balance as per Creditors Ledger account 6 800
Notes: • Credittheincorrectdebit.• Alwaysaddinvoices.• Alwayssubtractpaymentsandreturns.• Theamountsinbrackets()arenegativeamountsandarecredits.
Activity 4.2 LB page 111
Fragrance BoutiqueCreditors Reconciliation Statement for Tru Blu Perfumes on 31 May 2014 (Standard format)
Debit Credit
Debit balance as per creditor’s statement on 24 May 2014 4 065 00
Discount not recorded on statement 300 00
payment not on statement 500 00
Discount not on statement 25 00
Incorrect credit on statement 1 665 00
returns not on statement 210 00
Credit balance as per Creditors Ledger account 4 695 00
5 730 00 5 730 00
CHAPTER 4 Reconciliations: Creditors reconciliations

157s e c t i o n 5 • C h a p t e r 4
Activity 4.3 LB page 113
No. Error / omissionCreditors Ledger
Creditors Reconciliation Statement
Debit Credit Debit Credit
1. a cheque for r6 250 appears in the Creditors Ledger but not on the creditor’s statement.
6 250
2. Interest of r160 charged by the creditor appeared on the statement but not in the Creditors Ledger.
160
3. an invoice was incorrectly entered in the Creditors Ledger as r2 300 instead of r3 200.
900
4. the creditor’s statement showed a credit note that was entered as r550 instead of r350.
200
5. an invoice for r1 500 was entered as a receipt on the creditor’s statement.
3 000
6. a credit note for r240 appears on the creditor’s statement but not in the Creditors Ledger.
240
7. the Creditors Ledger showed a discount received of r610 but the creditor did not allow the discount because the payment was late.
610
Activity 4.4 LB page 116
1.Creditors Ledger of The Happy HikerCamping Gear Wholesalers C1
Date Details Debit Credit Balance
31 May Closing balance 9 290 00
Invoice 334: correction of error 900 00 10 190 00
Debit note: adjustment 100 00 10 290 00
2.Camping Gear Wholesalers Creditor’s Reconciliation Statement of The Happy Hiker on 31 May 2016
Debit Credit
Debit balance according to creditors statement on 25 May 15 750 00
Discount not recorded on statement 250 00
Invoice not recorded on statement 1 390 00
payment not recorded on statement 6 000 00
Discount not recorded on statement 600 00
Credit balance as per Creditors Ledger account 10 290 00
17 140 00 17 140 00

158 s e c t i o n 5 • C h a p t e r 4
Activity 4.5 LB page 117
1. AnyTwopoints: Divisionof duties
• Differentpeoplemusttakeresponsibilityforpurchasingtheitemsboughtoncreditandreceivingtheitems.
• Differentpeoplemusttakeresponsibilityforcheckingitemsreceivedagainstthedeliverynotesandrecordinginvoicesthebooksof thebusiness.
• Thepersonpayingthecreditorsmustnotbethesamepersonorderingtheitemsfromthecreditors.
Itemsreceivedmustbecheckedagainstinvoicesanddeliverynotes.ThebalanceintheCreditors ControlaccountmustbereconciledagainstthebalanceontheCreditorsListtoensurethattransactionswerecorrectlyrecorded.
2. a.Creditors Ledger of CASS TradersVries Stores C1
Date Details Debit Credit Balance
2018 30 Jun Incorrect balance 12 120 00
Invoice no. 123 – correction of error 900 00 11 220 00
Discount cancelled 1 250 00 12 470 00
Interest on overdue account 156 00 12 626 00
Invoice no. 189 – incorrect creditor 600 00 12 026 00
Invoice no. 191 – trade discount allowed 800 00 11 226 00
Invoice no. 133 – correction of error 370 00 10 856 00
Debit note 370 00 10 486 00
2.b.CASS Traders Creditors Reconcilation Statement of Vries Stores on 30 June 2018
Balance as per creditor’s statement 13 886
Invoice not on statement 2 000
payment not on statement (5 000)
Debit note not on statement (400)
Balance per Creditors Ledger account 10 486
Activity 4.6 (challenge) LB page 119
Creditors Ledger of Jo-Jo Traders Creditors Reconciliation Statement of MacMillan Suppliers
Balance 10 991 00 16 091 00
1. + 300 00
2. – 540 00
3. – 5 000 00
4. – 70 00
5. + 4 000 00
6. + 4 670 00
Balance 15 221 00 15 221 00

159s e c t i o n 5 • C h a p t e r 5
CHAPTER 5 Fixed assets
Activity 5.1 LB page 126
Fixed Asset Register of Kuyper Traders Folio 4
Make: toyota truck (MB 234 Gp)
Model: 2015
Date of purchase: 1 January 2016
Purchased from: JS Motors
Cost: r800 000
Depreciation: 20% p.a. on the cost price
Date Depreciation Accumulated depreciation
Carrying value
30 June 2016 r80 000 r80 000 r720 000
30 June 2017 r160 000 r240 000 r560 000
30 June 2018 r160 000 r400 000 r400 000
30 June 2019 r160 000 r560 000 r240 000
Calculations
R800000×20___100×6__12=R80000
R800000×20___100=R160000
Activity 5.2 LB page 128
Fixed Asset Register of Kuyper Traders Folio 10
Make: pentium 4 Mecer computer serial no. 55329
Date of purchase: 1 March 2015
Purchased from: Computron
Cost: r5 000
Depreciation: 10% p.a. on the diminishing balance
Date Depreciation Accumulated depreciation
Carrying value
29 February 2016 r500 00 r500 00 r4 500 00
28 February 2017 r450 00 r950 00 r4 050 00
28 February 2018 r405 00 r1 355 00 r3 645 00
28 February 2019 r364 50 r1 719 50 r3 280 50

160 s e c t i o n 5 • C h a p t e r 5
CalculationsDepreciation Carryingvalue
R5000×10___100=R500,00 R5000–500=R4500,00
R4500×10___100=R450,00 R5000–950=R4050,00
R4050×10___100=R405,00 R5000–1355=R3645,00
R3645×10___100=R364,50 R5000–1719,50=R3280,50
Activity 5.3 (Baseline assessment) LB page 128
General Ledger of Wayne BrothersBalance Sheet accounts
Dr Vehicles Cr
Date Details Fol. Amount Date Details Fol. Amount
2015 Mar 01 Balance b/d 72 500 00
Dec 31 Creditors Control CJ 55 000 00
127 500 00
Dr Accumulated Depreciation on Vehicles Cr
Date Details Fol. Amount Date Details Fol. Amount
2015 Mar 01 Balance b/d 12 125 00
2016 Feb 29 Depreciation GJ 12 250 00
24 375 00
Nominal account
Dr Depreciation Cr
Date Details Fol. Amount Date Details Fol. Amount
2016 Feb 29 Accumulated depreciation on vehicles GJ 12 250 00
2016 Feb 29 Profit and loss GJ 12 250 00
Calculations
R72500×15___100 =R10875 –existingvehicles
R55000×15___100 =R1375 –newvehicle R12 250

161s e c t i o n 5 • C h a p t e r 5
Activity 5.4 (Baseline assessment) LB page 129
1. General Ledger of West Discount StoreBalance Sheet accounts
Dr Equipment Cr
Date Details Fol. Amount Date Details Fol. Amount
2015 Jul 01 Balance b/d 41 400 00
2016 Jan 01 Bank CJ 10 000 00
51 400 00
2.Dr Accumulated Depreciation on Equipment Cr
Date Details Fol. Amount Date Details Fol. Amount
2015 Jul 01 Balance b/d 14 900 00
2016 Jun 30 Depreciation GJ 6 300 00
21 200 00
3. Nominal account
Dr Depreciation Cr
Date Details Fol. Amount Date Details Fol. Amount
2016 Jun 30
Accumulated depreciation on equipment GJ 6 300 00
2016 Jun 30 Profit and Loss GJ 6 300 00
Calculations
R41400–14900=26500×20___100=R5300 –existing
R10000×20___100×6__12 =R1000 –new R6 300
Activity 5.5 LB page 130
1. Accumulateddepreciationonvehiclesason01/03/17: Toyota Tazz
01/03/15–28/02/17(24months) R130000×15___100×24__12 =R39000 Opel Corsa
31/12/15–28/02/17(14months) R150000×15___100×14__12 =R26250 Nissan One Tonner
01/07/16–28/02/17(8months) R165000×15___100×8__12 =R16500 R81 750
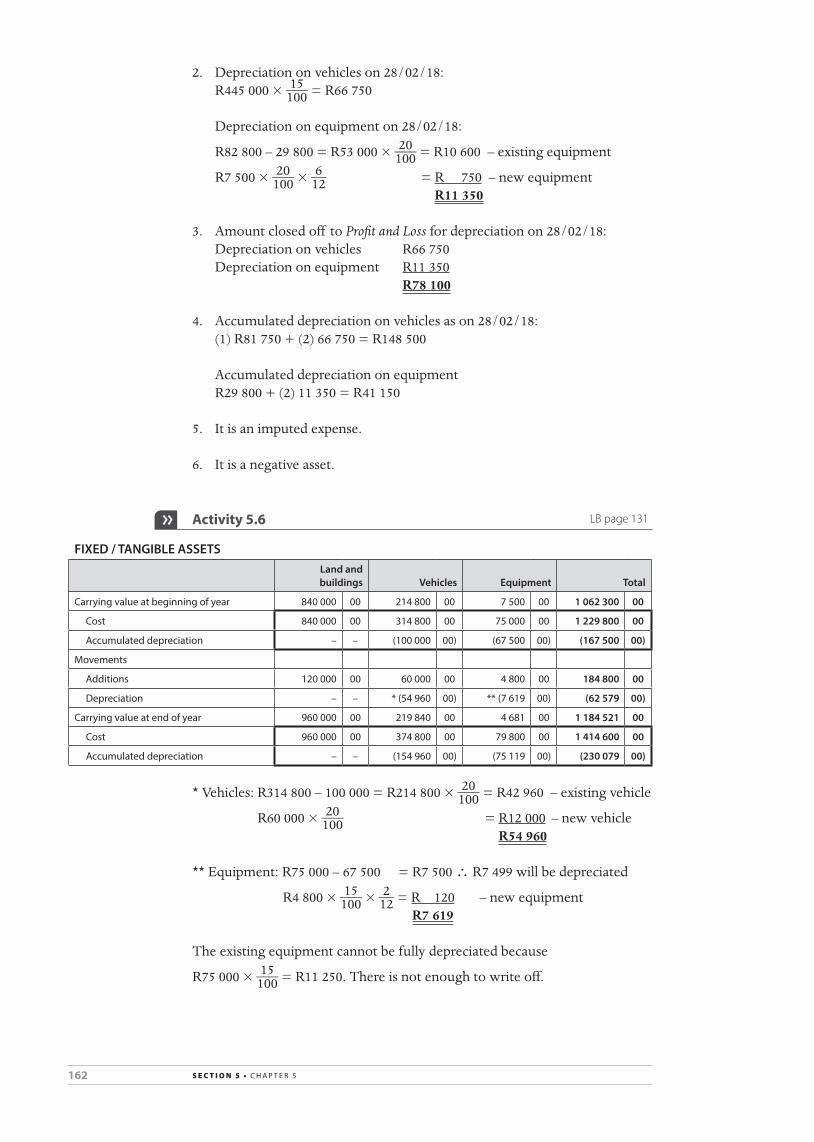
162 s e c t i o n 5 • C h a p t e r 5
2. Depreciationonvehicleson28/02/18: R445000×15___100=R66750
Depreciationonequipmenton28/02/18:
R82800–29800=R53000×20___100=R10600–existingequipment
R7500×20___100×6__12 =R 750–newequipment R11 350
3. Amountclosedoff toProfit and Lossfordepreciationon28/02/18: Depreciationonvehicles R66750 Depreciationonequipment R11350 R78 100
4. Accumulateddepreciationonvehiclesason28/02/18: (1)R81750+(2)66750=R148500
Accumulateddepreciationonequipment R29800+(2)11350=R41150
5. Itisanimputedexpense.
6. Itisanegativeasset.
Activity 5.6 LB page 131
FIXED / TANGIBLE ASSETSLand and buildings Vehicles Equipment Total
Carrying value at beginning of year 840 000 00 214 800 00 7 500 00 1 062 300 00
Cost 840 000 00 314 800 00 75 000 00 1 229 800 00
accumulated depreciation – – (100 000 00) (67 500 00) (167 500 00)
Movements
additions 120 000 00 60 000 00 4 800 00 184 800 00
Depreciation – – * (54 960 00) ** (7 619 00) (62 579 00)
Carrying value at end of year 960 000 00 219 840 00 4 681 00 1 184 521 00
Cost 960 000 00 374 800 00 79 800 00 1 414 600 00
accumulated depreciation – – (154 960 00) (75 119 00) (230 079 00)
*Vehicles:R314800–100000=R214800×20___100=R42960–existingvehicle
R60000×20___100 =R12000–newvehicle R54 960
**Equipment:R75000–67500 =R7500∴R7499willbedepreciated
R4800×15___100×2__12=R 120 –newequipment R7 619
Theexistingequipmentcannotbefullydepreciatedbecause
R75000×15___100=R11250.Thereisnotenoughtowriteoff.

163s e c t i o n 5 • C h a p t e r 5
Activity 5.7 LB page 137
1.General Journal of Thandi’s Boutique for March 2017
Day Fol. Debit Credit
01 asset disposal 160 000 00
Vehicles 160 000 00
(transfer of cost price to asset disposal)
accumulated depreciation on vehicles 86 272 00
asset disposal 86 272 00
(transfer of accumulated depreciation to asset disposal)
asset disposal 1 272 00
profit on sale of asset 1 272 00
(profit realised on the sale of the asset)
Cash Receipts Journal of Thandi’s Boutique for March 2017
Doc. no. Day Details Fol.
Analysis of receipts Bank
Sundry accountsDetails Fol.
R... 01 Buddy Motors 75 000 00 75 000 00 75 000 00
2. General Ledger of Thandi’s BoutiqueBalance Sheet accounts
Dr Vehicles Cr
Date Details Fol. Amount Date Details Fol. Amount
2017 Mar 01 Balance b/d 280 000 00
2017 Mar 01 Asset disposal GJ 160 000 00
Balance c/d 120 000 00
280 000 00 280 000 00
2017 Apr 01 Balance b/d 120 000 00
Dr Accumulated Depreciation on Vehicles Cr
Date Details Fol. Amount Date Details Fol. Amount
2017 Mar 01 Asset disposal GJ 86 272 00
2017 Mar 01 Balance b/d 126 272 00
Balance c/d 40 000 00
126 272 00 126 272 00
2017 Apr 01 Balance b/d 40 000 00
Nominal accounts
Dr Asset Disposal Cr
Date Details Fol. Amount Date Details Fol. Amount
2017 Mar 01 Vehicles GJ 160 000 00
2017 Mar 01 Accumulated depreciation on vehicles GJ 86 272 00
Profit sale of asset GJ 1 272 00 Bank CRJ 75 000 00
161 272 00 161 272 00
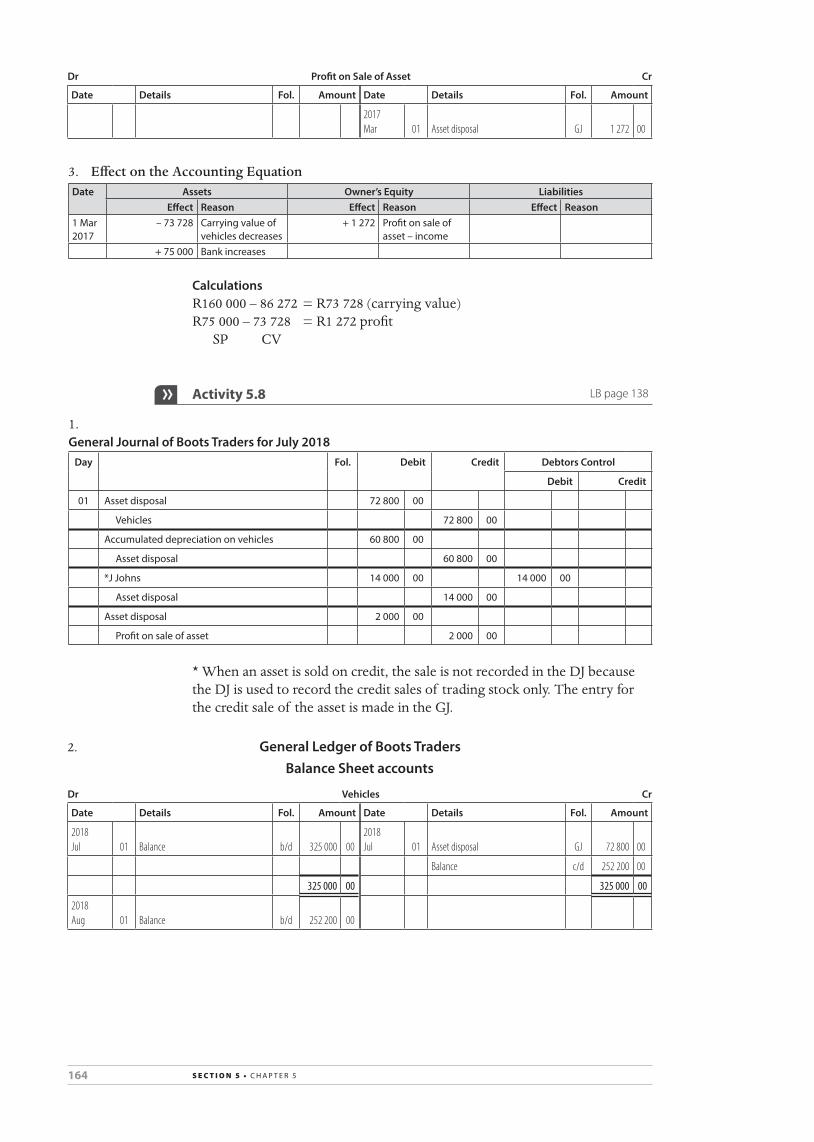
164 s e c t i o n 5 • C h a p t e r 5
Dr Profit on Sale of Asset Cr
Date Details Fol. Amount Date Details Fol. Amount
2017 Mar 01 Asset disposal GJ 1 272 00
3. Effect on the Accounting EquationDate Assets Owner’s Equity Liabilities
Effect Reason Effect Reason Effect Reason1 Mar 2017
– 73 728 Carrying value of vehicles decreases
+ 1 272 profit on sale of asset – income
+ 75 000 Bank increases
CalculationsR160000–86272=R73728(carryingvalue)R75000–73728 =R1272profitSP CV
Activity 5.8 LB page 138
1.General Journal of Boots Traders for July 2018
Day Fol. Debit Credit Debtors Control
Debit Credit
01 asset disposal 72 800 00
Vehicles 72 800 00
accumulated depreciation on vehicles 60 800 00
asset disposal 60 800 00
*J Johns 14 000 00 14 000 00
asset disposal 14 000 00
asset disposal 2 000 00
profit on sale of asset 2 000 00
*whenanassetissoldoncredit,thesaleisnotrecordedintheDJbecausetheDJisusedtorecordthecreditsalesof tradingstockonly.Theentryforthecreditsaleof theassetismadeintheGJ.
2. General Ledger of Boots TradersBalance Sheet accounts
Dr Vehicles Cr
Date Details Fol. Amount Date Details Fol. Amount
2018 Jul 01 Balance b/d 325 000 00
2018 Jul 01 Asset disposal GJ 72 800 00
Balance c/d 252 200 00
325 000 00 325 000 00
2018 Aug 01 Balance b/d 252 200 00

165s e c t i o n 5 • C h a p t e r 5
Dr Accumulated Depreciation on Vehicles Cr
Date Details Fol. Amount Date Details Fol. Amount
2018 Jul 01 Asset disposal GJ 60 800 00
2018 Jul 01 Balance b/d 157 000 00
Balance c/d 96 200 00
157 000 00 157 000 00
2018 Aug 01 Balance b/d 96 200 00
Nominal accounts
Dr Asset Disposal Cr
Date Details Fol. Amount Date Details Fol. Amount
2018 Jul 01 Vehicles GJ 72 800 00
2018 Jul 01 Accumulated depreciation on vehicles GJ 60 800 00
Profit on sale of asset GJ 2 000 00 Debtors Control GJ 14 000 00
74 800 00 74 800 00
Dr Profit on Sale of Asset Cr
Date Details Fol. Amount Date Details Fol. Amount
2018 Jul 01 Asset disposal GJ 2 000 00
3. Effect on the Accounting EquationDate Assets Owner’s Equity Liabilities
Effect Reason Effect Reason Effect Reason1 July 2018
– 12 000 Carrying value of vehicles decreases
+ 2 000 profit on sale of asset – income
+ 14 000 Debtors increase
Activity 5.9 LB page 138
1.General Journal of Dlamini’s Taxis for January 2018
Day Fol. Debit Credit
01 asset disposal 150 000 00
Vehicles 150 000 00
accumulated depreciation on vehicles 75 000 00
asset disposal 75 000 00
Drawings 75 000 00
asset disposal 75 000 00

166 s e c t i o n 5 • C h a p t e r 5
2. General Ledger of Dlamini’s TaxisBalance Sheet accounts
Dr Vehicles Cr
Date Details Fol. Amount Date Details Fol. Amount
2018 Jan 01 Balance b/d 450 000 00
2018 Jan 01 Asset disposal GJ 150 000 00
Balance c/d 300 000 00
450 000 00 450 000 00
2018 Feb 01 Balance b/d 300 000 00
Dr Accumulated Depreciation on Vehicles Cr
Date Details Fol. Amount Date Details Fol. Amount
2018 Jan 01 Asset disposal GJ 75 000 00
2018 Jan 01 Balance b/d 195 000 00
Balance c/d 120 000 00
195 000 00 195 000 00
2018 Feb 01 Balance b/d 120 000 00
Nominal account
Dr Asset Disposal Cr
Date Details Fol. Amount Date Details Fol. Amount
2018 Jan 01 Vehicles GJ 150 000 00
2018 Jan 01 Accumulated depreciation on vehicles GJ 75 000 00
Drawings* GJ 75 000 00
150 000 00 150 000 00
*whenanassetissoldatitscarryingvalue,thenneitheraprofitnoralosswasmade.
Calculation of accumulated depreciation
R150000×20___100×30__12=R75000(01/07/15–31/12/17=30months)
3. EffectontheAccountingEquationDate Assets Owner’s Equity Liabilities
Effect Reason Effect Reason Effect Reason1 Jan 2018
– 75 000 Carrying value of vehicles decreases
– 75 000 Drawings
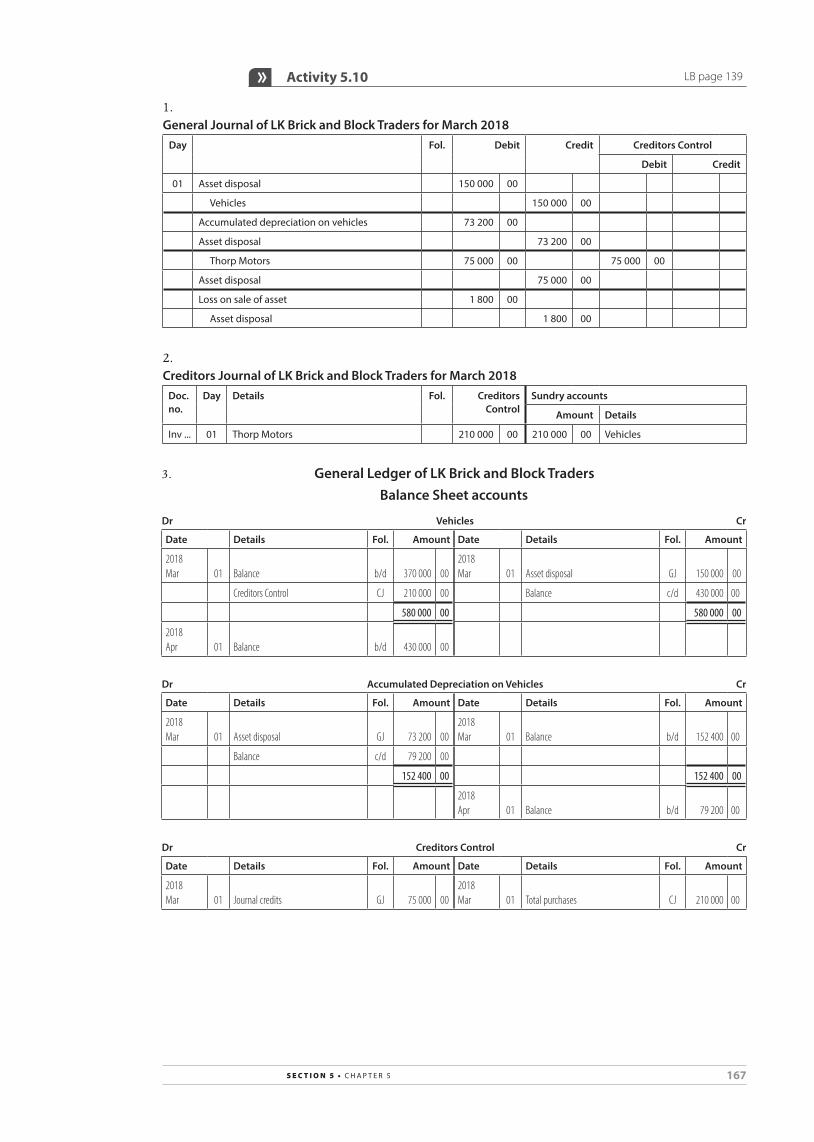
167s e c t i o n 5 • C h a p t e r 5
Activity 5.10 LB page 139
1.General Journal of LK Brick and Block Traders for March 2018
Day Fol. Debit Credit Creditors Control
Debit Credit
01 asset disposal 150 000 00
Vehicles 150 000 00
accumulated depreciation on vehicles 73 200 00
asset disposal 73 200 00
thorp Motors 75 000 00 75 000 00
asset disposal 75 000 00
Loss on sale of asset 1 800 00
asset disposal 1 800 00
2.Creditors Journal of LK Brick and Block Traders for March 2018
Doc. no.
Day Details Fol. Creditors Control
Sundry accounts
Amount Details
Inv ... 01 thorp Motors 210 000 00 210 000 00 Vehicles
3. General Ledger of LK Brick and Block TradersBalance Sheet accounts
Dr Vehicles Cr
Date Details Fol. Amount Date Details Fol. Amount
2018 Mar 01 Balance b/d 370 000 00
2018 Mar 01 Asset disposal GJ 150 000 00
Creditors Control CJ 210 000 00 Balance c/d 430 000 00
580 000 00 580 000 00
2018 Apr 01 Balance b/d 430 000 00
Dr Accumulated Depreciation on Vehicles Cr
Date Details Fol. Amount Date Details Fol. Amount
2018 Mar 01 Asset disposal GJ 73 200 00
2018 Mar 01 Balance b/d 152 400 00
Balance c/d 79 200 00
152 400 00 152 400 00
2018 Apr 01 Balance b/d 79 200 00
Dr Creditors Control Cr
Date Details Fol. Amount Date Details Fol. Amount
2018 Mar 01 Journal credits GJ 75 000 00
2018 Mar 01 Total purchases CJ 210 000 00

168 s e c t i o n 5 • C h a p t e r 5
Nominal accounts
Dr Asset Disposal Cr
Date Details Fol. Amount Date Details Fol. Amount
2018 Mar 01 Vehicles GJ 150 000 00
2018 Mar 01 Accumulated depreciation on vehicles GJ 73 200 00
Creditors Control GJ 75 000 00
Loss on sale of asset GJ 1 800 00
150 000 00 150 000 00
Dr Loss on Sale of Asset Cr
Date Details Fol. Amount Date Details Fol. Amount
2018 Mar 01 Asset disposal GJ 1 800 00
TheCreditorsLedgerwasnotrequiredbutisusedtoexplaintheconceptof trade-in.
Creditors Ledger of LK Brick and Block Traders Thorp Motors
Date Details / Document number Fol. Debit Credit Balance
2018 Mar 01 Invoice CJ 210 000 00 210 000 00
Journal voucher (vehicle trade-in) GJ 75 000 00 135 000 00
Activity 5.11 LB page 143
1.General Journal of Mandy’s Tuckshop for September 2018
Day Fol. Debit Credit
30 asset disposal 1 500 00
equipment 1 500 00
accumulated depreciation on equipment 1 350 00
asset disposal 1 350 00
asset disposal 150 00
profit on sale of asset 150 00
Depreciation 1 724 00
accumulated depreciation on equipment 1 724 00
2.Cash Payments Journal of Mandy’s Tuckshop for September 2018
Doc. no. Day Name of payee Fol. Bank
Debtors Control
Sundry accountsAmount Details
01 Buddy Motors 3 200 00 3 200 00

169s e c t i o n 5 • C h a p t e r 5
3. General Ledger of Mandy’s TuckshopBalance Sheet accounts
Dr Equipment Cr
Date Details Fol. Amount Date Details Fol. Amount
2017 Oct 01 Balance b/d 8 620 00
2018 Sep 30 Asset disposal GJ 1 500 00
2018 Sep 30 Bank CPJ 3 200 00 Balance c/d 10 320 00
11 820 00 11 820 00
2018 Oct 01 Balance b/d 10 320 00
Dr Accumulated Depreciation on Equipment Cr
Date Details Fol. Amount Date Details Fol. Amount
2018 Sep 30 Asset disposal GJ 1 350 00
2017 Oct 01 Balance b/d 3 220 00
Balance c/d 3 594 002018 Sep 30 Depreciation GJ 1 724 00
4 944 00 4 944 00
2018 Oct 01 Balance b/d 3 594 00
Calculation of accumulated depreciation to date of sale01/10/17–30/09/18(assetsold)
R1500×20___100=R300 ∴R1050+300=R1350
Nominal accounts
Dr Asset Disposal Cr
Date Details Fol. Amount Date Details Fol. Amount
2018 Sep 30 Equipment GJ 1 500 00
2018 Sep 30
Accumulated depreciation on equipment GJ 1 350 00
Profit on sale of asset GJ 150 00 Bank CRJ 300 00
1 650 00 1 650 00
Dr Profit on Sale of Asset Cr
Date Details Fol. Amount Date Details Fol. Amount
2018 Sep 30 Profit and loss GJ 150 00
2018 Sep 30 Asset disposal GJ 150 00
Dr Depreciation Cr
Date Details Fol. Amount Date Details Fol. Amount
2018 Sep 30
Accumulated depreciation on equipment GJ 1 724 00
2018 Sep 30 Profit and Loss GJ 1 724 00
Calculation for depreciation for the financial year
R8620×20___100=R1724
ThisamountincludestheR300depreciationontheequipmentsold.Thenewequipmentwillnotbedepreciatedbecauseitwasboughtonthelastdayof thefinancialyear.

170 s e c t i o n 5 • C h a p t e r 5
4. EffectontheAccountingEquationNo. Assets Owner’s Equity Liabilities
Effect Reason Effect Reason Effect Reason– 150 Carrying value
of equipment decreases
+ 150 profit on sale of asset – income
+ 300 Bank increases
Activity 5.12 LB page 144
1.Fixed Asset Register of Zomba Transport Company Folio 2
Make: KIa 2.8 Diesel
Model: 2016
Date of purchase: 1 March 2016 Date sold: 28 February 2018
Purchased from: Craig’s Motors
Cost: r252 000
Depreciation: 20% p.a. on the carrying value
Date Depreciation Accumulated depreciation
Carrying value
28 February 2017 * r50 400 r50 400 r201 600
28 February 2018 ** r40 320 r90 720 r161 280
*R252000×20___100=R50400**R252000–50400=R201600×20___100=R40320
2. a.General Journal of Zomba Transport Company for February 2018
Day Fol. Debit Credit
28 asset disposal 252 000 00
Vehicles 252 000 00
accumulated depreciation on vehicles 90 720 00
asset disposal 90 720 00
Loss on sale of asset 1 280 00
asset disposal 1 280 00
Depreciation 67 032 00
accumulated depreciation on vehicles 67 032 00
2. b.Cash Receipts Journal of Zomba Transport Company for February 2018
Doc. no. Day Details Fol.
Analysis of receipts Bank
Sundry accountsDetails
28 Salie’s Builders 160 000 00 160 000 00 160 000 00 Asset disposal

171s e c t i o n 5 • C h a p t e r 5
3. General Ledger of Zomba Transport CompanyBalance Sheet accounts
Dr Vehicles Cr
Date Details Fol. Amount Date Details Fol. Amount
2017 Mar 01 Balance b/d 441 000 00
2018 Feb 28 Asset disposal GJ 252 000 00
Balance c/d 189 000 00
441 000 00 441 000 00
2018 Mar 01 Balance b/d 189 000 00
Dr Accumulated Depreciation on Vehicles Cr
Date Details Fol. Amount Date Details Fol. Amount
2018 Feb 28 Asset disposal GJ 90 720 00
2017 Mar 01 Balance b/d 105 840 00
Balance c/d 82 152 002018 Feb 28 Depreciation GJ 67 032 00
172 872 00 172 872 00
2018 Mar 01 Balance b/d 82 152 00
Nominal accounts
Dr Asset Disposal B6 Cr
Date Details Fol. Amount Date Details Fol. Amount
2018 Feb 28 Vehicles GJ 252 000 00
2018 Feb 28 Accumulated depreciation on vehicles GJ 90 720 00
Bank CRJ 160 000 00
Loss on sale of asset GJ 1 280 00
252 000 00 252 000 00
Dr Loss on Sale of Asset Cr
Date Details Fol. Amount Date Details Fol. Amount
2018 Feb 28 Asset disposal GJ 1 280 00
2018 Feb 28 Profit and Loss GJ 1 280 00
Dr Depreciation Cr
Date Details Fol. Amount Date Details Fol. Amount
2018 Feb 28 Accumulated depreciation on vehicles GJ 67 032 00
2018 Feb 28 Profit and Loss GJ 67 032 00
Calculation for depreciation for the financial year
R441000–105840=R335160×20___100=R67032

172 s e c t i o n 5 • C h a p t e r 5
Activity 5.13 LB page 145
1.General Journal of Model Stores for June 2019
Day Fol. Debit Credit Creditors Control
Debit Credit
30 asset disposal 25 000 00
Vehicles 25 000 00
accumulated depreciation on vehicles 25 000 00
asset disposal 25 000 00
Dyson Motors 11 500 00 11 500 00
asset disposal 11 500 00
asset disposal 11 500 00
profit on sale of asset 11 500 00
Depreciation 5 000 00
accumulated depreciation on vehicles 5 000 00
Calculation for depreciation for the financial year
R25000×20___100=R5000 Depreciationfortheyear
∴R20000+5000=R25000 Accumulateddepreciationtodateof sale
2.Creditors Journal of Model Stores for June 2019
Doc. no.
Day Details Fol. Creditors Control
Sundry accounts
Amount Details
30 Dyson Motors 84 000 00 84 000 00 Vehicles
3. General Ledger of Model StoresBalance Sheet accounts
Dr Vehicles Cr
Date Details Fol. Amount Date Details Fol. Amount
2018 Jul 01 Balance b/d 25 000 00
2019 Jun 30 Asset disposal GJ 25 000 00
2019 Jun 30 Creditors Control CJ 84 000 00 Balance c/d 84 000 00
109 000 00 109 000 00
2019 Jul 01 Balance b/d 84 000 00
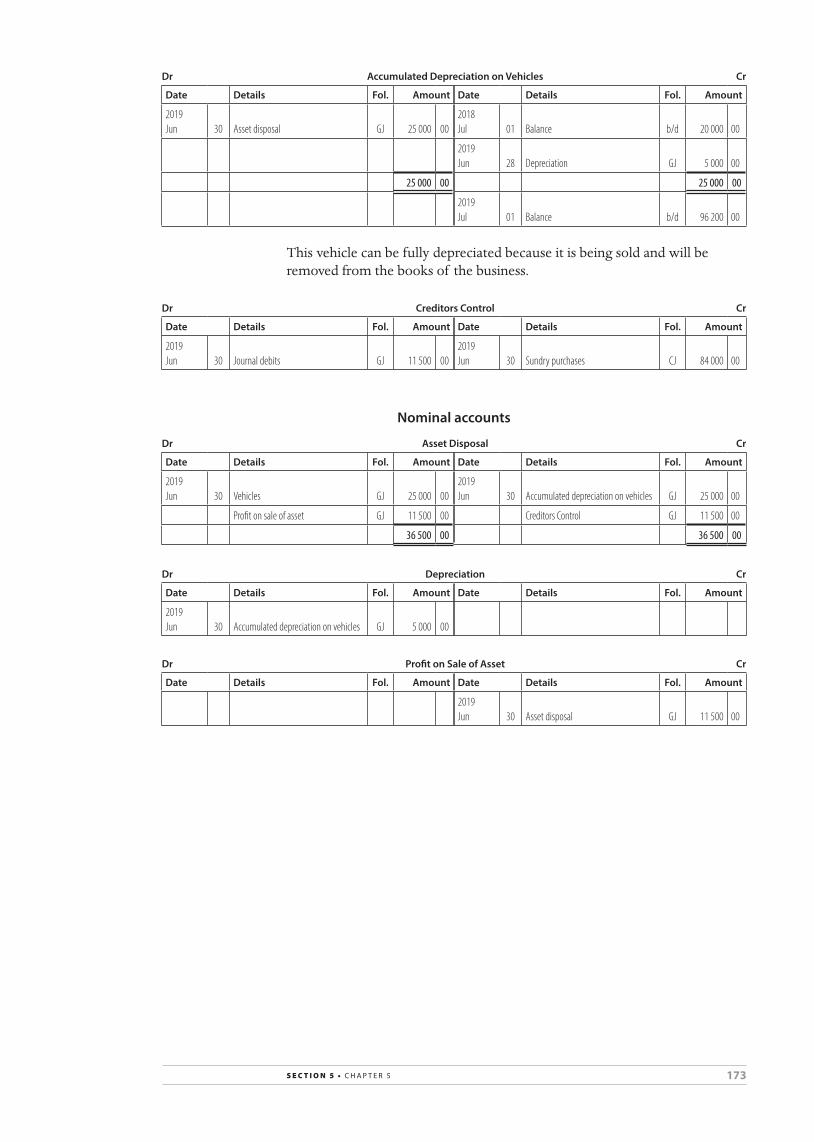
173s e c t i o n 5 • C h a p t e r 5
Dr Accumulated Depreciation on Vehicles Cr
Date Details Fol. Amount Date Details Fol. Amount
2019 Jun 30 Asset disposal GJ 25 000 00
2018 Jul 01 Balance b/d 20 000 00
2019 Jun 28 Depreciation GJ 5 000 00
25 000 00 25 000 00
2019 Jul 01 Balance b/d 96 200 00
Thisvehiclecanbefullydepreciatedbecauseitisbeingsoldandwillberemovedfromthebooksof thebusiness.
Dr Creditors Control Cr
Date Details Fol. Amount Date Details Fol. Amount
2019 Jun 30 Journal debits GJ 11 500 00
2019 Jun 30 Sundry purchases CJ 84 000 00
Nominal accounts
Dr Asset Disposal Cr
Date Details Fol. Amount Date Details Fol. Amount
2019 Jun 30 Vehicles GJ 25 000 00
2019 Jun 30 Accumulated depreciation on vehicles GJ 25 000 00
Profit on sale of asset GJ 11 500 00 Creditors Control GJ 11 500 00
36 500 00 36 500 00
Dr Depreciation Cr
Date Details Fol. Amount Date Details Fol. Amount
2019 Jun 30 Accumulated depreciation on vehicles GJ 5 000 00
Dr Profit on Sale of Asset Cr
Date Details Fol. Amount Date Details Fol. Amount
2019 Jun 30 Asset disposal GJ 11 500 00

174 s e c t i o n 5 • C h a p t e r 5
Activity 5.14 LB page 151
1.General Journal of Fast Printers for January 2018
Day Fol. Debit Credit Debtors Control
Debit Credit
31 asset disposal 14 000 00
equipment 14 000 00
Depreciation 1 050 00
accumulated depreciation on equipment 1 050 00
accumulated depreciation on equipment 7 450 00
asset disposal 7 450 00
Litho print 6 300 00 6 300 00
asset disposal 6 300 00
Loss on sale of asset 250 00
asset disposal 250 00
2. General Ledger of Fast PrintersBalance Sheet accounts
Dr Equipment Cr
Date Details Fol. Amount Date Details Fol. Amount
2017 Feb 01 Balance b/d 114 000 00
2017 Oct 31 Asset disposal GJ 14 000 00
Balance c/d 100 000 00
114 000 00 114 000 00
2018 Feb 01 Balance b/d 100 000 00
Dr Accumulated Depreciation on Equipment Cr
Date Details Fol. Amount Date Details Fol. Amount
2017 Oct 31 Asset disposal (6 400 + 1 050) GJ 7 450 00
2017 Feb 01 Balance b/d 22 800 00
Balance c/d 16 400 002017 Oct 31 Depreciation GJ 1 050 00
52 500 00 52 500 00
2017 Nov 01 Balance b/d 16 400 00
2018 Jan 31 Depreciation GJ 10 000 00
26 400 00

175s e c t i o n 5 • C h a p t e r 5
Nominal accounts
Dr Asset Disposal Cr
Date Details Fol. Amount Date Details Fol. Amount
2017 Oct 31 Equipment GJ 14 000 00
2017 Oct 31
Accumulated depreciation on equipment GJ 7 450 00
Debtors Control GJ 6 300 00
Loss on sale of asset 250 00
14 000 00 14 000 00
Calculation for accumulated depreciation to date of sale
R14000×10___100×9__12=R1050
R6400+1050=R7450
Calculation for depreciation for the financial year
R114000–14000=R100000×10___100=R100000
Dr Loss on Sale of Asset Cr
Date Details Fol. Amount Date Details Fol. Amount
2017 Oct 31 Asset disposal GJ 250 00
2018 Jan 31 Profit and loss GJ 250 00
Dr Depreciation Cr
Date Details Fol. Amount Date Details Fol. Amount
2017 Oct 31
Accumulated depreciation on equipment GJ 1 050 00
2018 Jan 31 Profit and loss GJ 11 050 00
2018 Jan 31
Accumulated depreciation on equipment GJ 10 000 00
11 050 00 11 050 00
3. EffectontheAccountingEquationNo. Assets Owner’s Equity Liabilities
Effect Reason Effect Reason Effect Reason– 6 550 Carrying value
of equipment decreases
– 250 Loss on sale of asset – expense
+ 6 300 Debtors increases
Activity 5.15 LB page 152
General Ledger of Phillip TradersBalance Sheet accounts
Dr Equipment Cr
Date Details Fol. Amount Date Details Fol. Amount
2018 Jan 01 Balance b/d 17 100 00
2018 Apr 30 Asset disposal GJ 2 100 00
Balance c/d 15 000 00
17 100 00 17 100 00
May 01 Balance b/d 15 000 00
Mar 01 Creditors Control CJ 14 500 00
Bank CPJ 3 500 00
33 000 00

176 s e c t i o n 5 • C h a p t e r 5
Dr Accumulated Depreciation on Equipment Cr
Date Details Fol. Amount Date Details Fol. Amount
2018 Apr 30 Asset disposal (960 + 105) GJ 1 065 00
2018 Jan 01 Balance b/d 3 420 00
Balance c/d 2 460 00 Apr 30 Depreciation GJ 105 00
3 525 00 3 525 00
May 01 Balance b/d 2 460 00
Dec 31 Depreciation (2 250 + 2 250) GJ 4 500 00
6 960 00
Calculation for accumulated depreciation to date of sale
R2100×15___100×4__12=R105
∴R105+960=R1065
Nominal accounts
Dr Asset Disposal B6 Cr
Date Details Fol. Amount Date Details Fol. Amount
2018 Apr 30 Equipment GJ 2 100 00
2018 Apr 30
Accumulated depreciation on equipment GJ 1 065 00
Bank CRJ 945 00
Loss on sale of asset GJ 90 00
2 100 00 2 100 00
Dr Loss on Sale of Asset Cr
Date Details Fol. Amount Date Details Fol. Amount
2018 Apr 30 Asset disposal GJ 90 00
2018 Dec 31 Profit and loss GJ 90 00
Dr Depreciation B6 Cr
Date Details Fol. Amount Date Details Fol. Amount
2018 Apr 30
Accumulated depreciation on equipment GJ 105 00
2018 Dec 31 Profit and loss GJ 4 605 00
2018 Dec 31
Accumulated depreciation on equipment GJ 4 500 00
4 605 00 4 605 00

177s e c t i o n 5 • C h a p t e r 5
Activity 5.16 LB page 154
1.General Journal of Xoseka Investments for August 2017
Day Fol. Debit Credit Creditors Control
Debit Credit
31 asset disposal 80 000 00
Vehicles 80 000 00
Depreciation 3 200 00
accumulated depreciation on vehicles 3 200 00
accumulated depreciation on vehicles 51 200 00
asset disposal 51 200 00
reliable Motors 30 000 00 30 000 00
asset disposal 30 000 00
asset disposal 1 200 00
profit on sale of asset 1 200 00
2. General Ledger of Xoseka InvestmentsBalance Sheet accounts
Dr Vehicles Cr
Date Details Fol. Amount Date Details Fol. Amount
2017 Mar 01 Balance b/d 240 000 00
2017 Aug 31 Asset disposal GJ 80 000 00
Aug 31 Creditors Control CJ 110 000 00 Balance c/d 270 000 00
350 000 00 350 000 00
2017 Sep 01 Balance b/d 270 000 00
Dr Accumulated Depreciation on Vehicles Cr
Date Details Fol. Amount Date Details Fol. Amount
2017 Aug 31 Asset disposal GJ 51 200 00
2017 Mar 01 Balance b/d 85 000 00
Balance c/d 37 000 00 Aug 31 Depreciation GJ 3 200 00
88 200 00 88 200 00
2018 Feb 28 Balance c/d 72 600 00
2017 Sep 01 Balance b/d 37 000 00
2018 Feb 28 Depreciation GJ 35 600 00
72 600 00 72 600 00
2018 Mar 01 Balance b/d 72 600 00
Nominal accounts
Dr Asset Disposal B6 Cr
Date Details Fol. Amount Date Details Fol. Amount
2017 Aug 31 Vehicles GJ 80 000 00
2017 Aug 31 Accumulated depreciation on vehicles GJ 51 200 00
Profit on sale of asset GJ 1 200 00 Creditors Control GJ 30 000 00
81 200 00 81 200 00

178 s e c t i o n 5 • C h a p t e r 5
Dr Profit on Sale of Asset Cr
Date Details Fol. Amount Date Details Fol. Amount
2018 Feb 28 Profit and loss GJ 1 200 00
2017 Aug 31 Asset disposal GJ 1 200 00
Dr Depreciation Cr
Date Details Fol. Amount Date Details Fol. Amount
2017 Aug 31 Accumulated depreciation on vehicles GJ 3 200 00
2018 Feb 28 Profit and loss GJ 38 800 00
2018 Feb 28 Accumulated depreciation on vehicles GJ 35 600 00
38 800 00 38 800 00
Calculation for accumulated depreciation to date of sale
R80000–48000=R32000×20___100×6__12=R3200
∴R48000+3200=R51200
Calculation for depreciation on remaining assets
R240000–80000=R160000
R85000+3200–51200=R37000
R160000–37000=R123000×20__10=R24600
R110000×20___100×6__12=R11000
3. EffectontheAccountingEquationNo. Assets Owner’s Equity Liabilities
Effect Reason Effect Reason Effect Reason– 28 800 Carrying value of
vehicles decreases+ 1 200 profit on sale of
asset – income– 30 000 Creditors decrease
+ 110 000 Vehicles increase + 110 000 Creditors increase
Activity 5.17 LB page 155
General Ledger of Trendy OutfittersBalance Sheet accounts
Dr Equipment Cr
Date Details Fol. Amount Date Details Fol. Amount
2017 Jan 01 Balance b/d 160 000 00
2017 Aug 31 Asset disposal GJ 20 000 00
Nov 01 Creditors Control CJ 40 000 00 Nov 30 Balance c/d 180 000 00
200 000 00 200 000 00
2017 Dec 01 Balance b/d 180 000 00
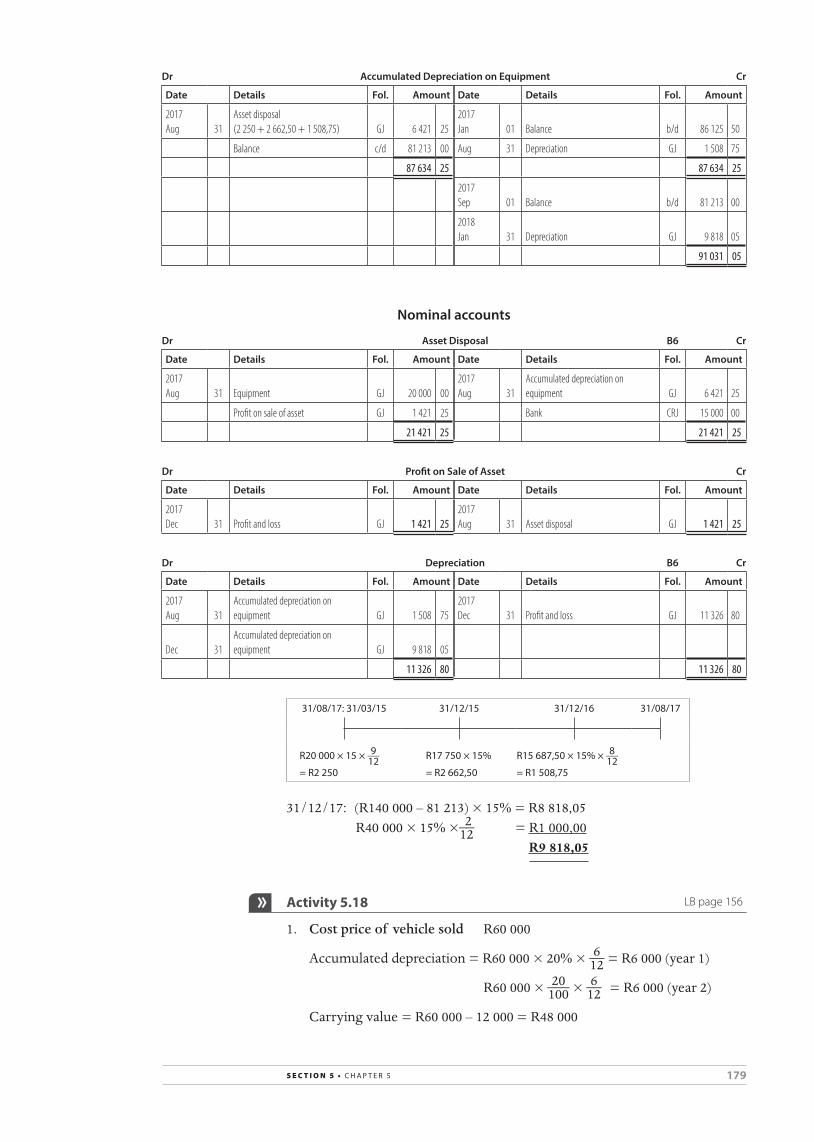
179s e c t i o n 5 • C h a p t e r 5
Dr Accumulated Depreciation on Equipment Cr
Date Details Fol. Amount Date Details Fol. Amount
2017 Aug 31
Asset disposal (2 250 + 2 662,50 + 1 508,75) GJ 6 421 25
2017 Jan 01 Balance b/d 86 125 50
Balance c/d 81 213 00 Aug 31 Depreciation GJ 1 508 75
87 634 25 87 634 25
2017 Sep 01 Balance b/d 81 213 00
2018 Jan 31 Depreciation GJ 9 818 05
91 031 05
Nominal accounts
Dr Asset Disposal B6 Cr
Date Details Fol. Amount Date Details Fol. Amount
2017 Aug 31 Equipment GJ 20 000 00
2017 Aug 31
Accumulated depreciation on equipment GJ 6 421 25
Profit on sale of asset GJ 1 421 25 Bank CRJ 15 000 00
21 421 25 21 421 25
Dr Profit on Sale of Asset Cr
Date Details Fol. Amount Date Details Fol. Amount
2017 Dec 31 Profit and loss GJ 1 421 25
2017 Aug 31 Asset disposal GJ 1 421 25
Dr Depreciation B6 Cr
Date Details Fol. Amount Date Details Fol. Amount
2017 Aug 31
Accumulated depreciation on equipment GJ 1 508 75
2017 Dec 31 Profit and loss GJ 11 326 80
Dec 31Accumulated depreciation on equipment GJ 9 818 05
11 326 80 11 326 80
31/08/17: 31/03/15 31/12/15 31/12/16 31/08/17
r20 000 × 15 × 9 ___ 12
= r2 250
r17 750 × 15%
= r2 662,50
r15 687,50 × 15% × 8 ___ 12
= r1 508,75
31/12/17: (R140000–81213)×15%=R8818,05 R40000×15%×2__12 =R1000,00 R9 818,05
Activity 5.18 LB page 156
1. Cost price of vehicle sold R60000
Accumulateddepreciation=R60000×20%×6__12=R6000(year1)
R60000×20___100×6__12 =R6000(year2)
Carryingvalue=R60000–12000=R48000

180 s e c t i o n 5 • C h a p t e r 5
2.Dr Asset Disposal Cr
Date Details Fol. Amount Date Details Fol. Amount
2017 Sep 01 Vehicles 60 000 00
2017 Sep 01 Accumulated depreciation on vehicles 12 000 00
Loss on sale of asset 1 600 00
Bank/Debtors Control* 46 400 00
60 000 00 60 000 00
*Sellingpriceof vehiclesold=R46400(balancingfigure)
3. Depreciation on vehicles for the year ended 28 February 2018
(R100000×20%×12__12)+(R60000×20%×6__12)
+(R100000×20%×6__12)
=R20000+6000+10000
=R36000
4. On 28 February 2018:Costpriceof vehicles=R200000Accumulateddepreciationonvehicles=R26000+36000–12000=R50000∴Carryingvalueof vehicles=R200000–50000=R150000
Activity 5.19 (optimal activity) LB page 157
1. General Ledger of Madladlana TradersBalance Sheet accounts
Dr Vehicles Cr
Date Details Fol. Amount Date Details Fol. Amount
2018 Jul 01 Balance b/d 45 000 00
2019 Apr 30 Sales GJ 10 000 00
Dec 31 Bank CPJ 16 300 00 Balance c/d 51 300 00
61 300 00 61 300 00
2019 May 01 Balance b/d 51 300 00
2.Dr Equipment Cr
Date Details Fol. Amount Date Details Fol. Amount
2018 Jul 01 Balance b/d 39 000 00
2018 Dec 31 Asset disposal GJ 3 200 00
Creditors Control CJ 3 100 00 Balance c/d 38 900 00
42 100 00 42 100 00
2019 Jan 01 Balance b/d 38 900 00
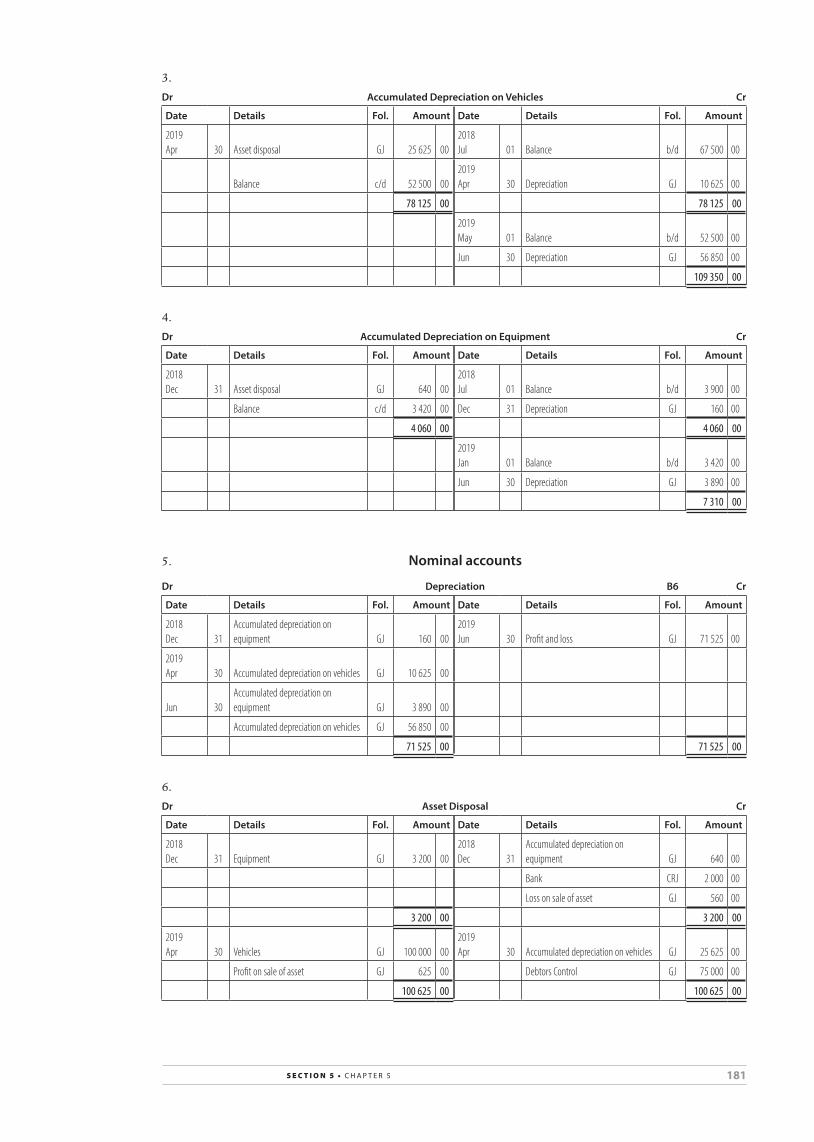
181s e c t i o n 5 • C h a p t e r 5
3.Dr Accumulated Depreciation on Vehicles Cr
Date Details Fol. Amount Date Details Fol. Amount
2019 Apr 30 Asset disposal GJ 25 625 00
2018 Jul 01 Balance b/d 67 500 00
Balance c/d 52 500 002019 Apr 30 Depreciation GJ 10 625 00
78 125 00 78 125 00
2019 May 01 Balance b/d 52 500 00
Jun 30 Depreciation GJ 56 850 00
109 350 00
4.Dr Accumulated Depreciation on Equipment Cr
Date Details Fol. Amount Date Details Fol. Amount
2018 Dec 31 Asset disposal GJ 640 00
2018 Jul 01 Balance b/d 3 900 00
Balance c/d 3 420 00 Dec 31 Depreciation GJ 160 00
4 060 00 4 060 00
2019 Jan 01 Balance b/d 3 420 00
Jun 30 Depreciation GJ 3 890 00
7 310 00
5. Nominal accounts
Dr Depreciation B6 Cr
Date Details Fol. Amount Date Details Fol. Amount
2018 Dec 31
Accumulated depreciation on equipment GJ 160 00
2019 Jun 30 Profit and loss GJ 71 525 00
2019 Apr 30 Accumulated depreciation on vehicles GJ 10 625 00
Jun 30Accumulated depreciation on equipment GJ 3 890 00
Accumulated depreciation on vehicles GJ 56 850 00
71 525 00 71 525 00
6.Dr Asset Disposal Cr
Date Details Fol. Amount Date Details Fol. Amount
2018 Dec 31 Equipment GJ 3 200 00
2018 Dec 31
Accumulated depreciation on equipment GJ 640 00
Bank CRJ 2 000 00
Loss on sale of asset GJ 560 00
3 200 00 3 200 00
2019 Apr 30 Vehicles GJ 100 000 00
2019 Apr 30 Accumulated depreciation on vehicles GJ 25 625 00
Profit on sale of asset GJ 625 00 Debtors Control GJ 75 000 00
100 625 00 100 625 00

182 s e c t i o n 5 • C h a p t e r 5
7.Dr Profit on Sale of Asset Cr
Date Details Fol. Amount Date Details Fol. Amount
2019 Jun 30 Profit and loss GJ 625 00
2019 Apr 30 Asset disposal GJ 625 00
8.Dr Loss on Sale of Asset Cr
Date Details Fol. Amount Date Details Fol. Amount
2018 Dec 31 Asset disposal GJ 560 00
2019 Jun 30 Profit and loss GJ 560 00
AnswersMember 1• Accumulateddepreciationonequipmenton1July2018
R39000×10___100=R3 900
• BalanceintheEquipmentaccounton30June2019R39000+3100–3200=R38 900
• BalanceintheVehicleaccounton30June2019 R45000+15000+1300–10000=R51 300
Member 2• Additionaldepreciationtobewrittenoff ontheequipmentsold
R3200×10___100×6__12=R160
• Accumulateddepreciationtodateof saleontheequipmentsoldR480+160=R640
• BalanceintheAccumulated Depreciationaccounton31December2018R3900+160–640=R3 420
Member3•Additionaldepreciationtobewrittenoff onthevehiclesold
1July2017to30June2018 R100000×15___100=R15 000
1July2018to30April2019 R80000×15___100×10__12=R10 625
• Accumulateddepreciationtodateof saleonthevehiclesoldR15000+10625=R25 625
• BalanceintheAccumulated Depreciationaccounton31April2019R67500+10625–25625=R52 500
Member 4 (Group leader)• Depreciationonremainingvehicleson30June2019
R450000–100000=R350000–52500×15___100=R44625
R163000×15___100×6__12=R12225
R44625+12225=R56 850

183s e c t i o n 5 • C h a p t e r 5
• Depreciationonremainingequipmenton30June2019
R39000–3200=R35800×10___100=R3580
R3100×10___100=R310
R3580+310=R3 890
Informal assessment 5.1 LB page 159
Marks: 35 Time: 30 minutes
General Ledger of Dysan LtdBalance Sheet accounts
Dr Equipment Cr
Date Details Fol. Amount Date Details Fol. Amount
2017 Jan 01 Balance b/d ✓ 108 690 00
2017 Jul 01 Asset disposal GJ ✓✓ 17 600 00
Oct 01 Creditors Control CJ ✓✓ 16 000 00 Oct 31 Balance c/d ✓ 107 090 00
124 690 00 124 690 00
2017 Nov 01 Balance b/d ✓ 107 090 00
[7]
Dr Accumulated Depreciation on Equipment Cr
Date Details Fol. Amount Date Details Fol. Amount
2017 Jul 01 Asset disposal GJ ✓✓ 4 400 00
2017 Jan 01 Balance b/d ✓ 28 916 00
Dec 31 Balance c/d ✓ 34 905 00 Jul 01 Depreciation GJ ✓✓ 880 00
Dec 31 Depreciation GJ ✓✓✓ 9 509 00
8 235 00 8 235 00
2018 Jan 01 Balance b/d ✓ 34 905 00
[10]
Calculation for Accumulated depreciation to date of sale
01/01/2015–31/12/2016 R17600×10___100×24__12=R3520
01/01/2017–01/07/2017 R17600×10___100×6__12=R880
R3520+880=R4400 Nominal accounts
Dr Asset Disposal Cr
Date Details Fol. Amount Date Details Fol. Amount
2017 Jul 01 Equipment GJ ✓✓ 17 600 00
2017 Jul 01
Accumulated depreciation on equipment GJ ✓✓ 4 400 00
Profit on sale of asset GJ ✓✓✓ 1 786 00 Bank CRJ ✓✓ 14 986 00
19 386 00 19 386 00
[9]

184 s e c t i o n 5 • C h a p t e r 5
Dr Profit on Sale of Asset Cr
Date Details Fol. Amount Date Details Fol. Amount
2017 Jul 01 Profit and loss GJ ✓ 1 786 00
2018 Jul 01 Asset disposal GJ ✓✓ 1 786 00
[3]
Dr Depreciation Cr
Date Details Fol. Amount Date Details Fol. Amount
2017 Jul 01
Accumulated depreciation on equipment GJ ✓✓ 880 00
2017 Dec 31 Profit and loss GJ ✓✓ 10 389 00
Dec 31Accumulated depreciation on equipment GJ ✓✓ 9 509 00
10 389 00 10 389 00
[6]
Calculation for depreciation for the financial year
R108690–17600=91090×10___100=R9109
R16000×10___100×3__12=R400
R9109+400=R9509
Activity 5.20 LB page 161
FIXED/TANGIBLE ASSETSLand and buildings Vehicles Equipment Total
Carrying value on 28/02/2017 180 000 105 000 36 360 321 360
Cost 180 000 240 000 55 000 475 000
accumulated depreciation – (135 000) (18 640) (153 640)
Movements
additions at cost 40 000 120 000 6 700 166 700
Disposals at carrying value (80 000 – 33 920) – (46 080) – (46 080)
Depreciation – (14 180) (12 760) (26 940)
Carrying value on 28/02/2018 220 000 164 740 30 300 415 040
Cost 220 000 280 000 61 700 561 700
accumulated depreciation – (115 260) (31 400) (146 660)
Cost price of vehicles on 28 February 2018R240000+120000–80000=R280000
Accumulated depreciation on vehicles on 28 February 2018R135000+14180–33920=R115260
Cost price of equipment on 28 February 2018R55000+6700=R61700
Accumulated depreciation on equipment on 28 February 2018R18640+12760=R31400

185s e c t i o n 5 • C h a p t e r 5
Activity 5.21 LB page 162
FIXED/TANGIBLE ASSETSLand and buildings Vehicles Equipment Total
Carrying value on 30/06/2017 120 000 00 59 500 00 16 200 00 195 700 00
Cost 120 000 00 75 000 00 19 000 00 214 000 00
accumulated depreciation – – (15 500 00) (2 800 00) (18 300 00)
Movements
additions at cost 50 000 00 65 000 00 6 200 00 121 200 00
Disposals at carrying value (5 100 – 1 995) – – – – (3 105 00) (3 105 00)
Depreciation – – (18 400 00) (3 470 00) (21 870 00)
Carrying value on 30/06/2018 170 000 00 106 100 00 15 825 00 291 925 00
Cost 170 000 00 140 000 00 20 100 00 330 100 00
accumulated depreciation – – (33 900 00) (4 275 00) (38 175 00)
CalculationsCostpriceof vehicleson30June2018:R75000+65000=R140000
Depreciation on vehicles
R75000–15500=R59500×20___100=R11900
R65000×20___100×6__12=R6500
R11900+6500=R18400
Accumulated depreciation on vehicles on 30 June 2018R15500+18400=R33900
Accumulated depreciation on the equipment sold
R5100×15___100=R765
R1230+765=R1995
Cost price of equipment on 30 June 2018R19000+6200–5100=R20100
Depreciation on equipment
(19000–5100)×15___100=R2085
R6200×15___100×8__12=R620
R2085+620+765=R3470
Accumulated depreciation on equipment on 30 June 2018R2800+3470–1995=R4275

186 s e c t i o n 5 • C h a p t e r 5
Informal assessment 5.2 LB page 163
Marks: 50 Time: 20 minutes
FIXED/TANGIBLE ASSETSLand and buildings Vehicles Equipment Total
Carrying value on 28/02/2017 ✓ 220 000 00 ✓ 68 000 00 ✓ 61 650 00 349 650 00
Cost 220 000 00 ✓ 100 000 00 ✓ 78 000 00 398 000 00
accumulated depreciation – – ✓ (32 000 00) ✓ (16 350 00) (48 350 00)
Movements
additions at cost ✓✓ 100 000 00 ✓✓ 135 000 00 ✓✓ 6 400 00 241 400 00
Disposals at carrying value (4 000 – 1 408) – – – –
✓✓✓✓ (2 592 00) (2 592 00)
Depreciation – –✓✓✓✓✓
(13 375 00)✓✓✓✓✓✓
(12 650 00) (26 025 00)
Carrying value on 28/02/2018 ✓✓ 320 000 00 ✓✓ 189 625 00 ✓✓ 52 808 00 562 433 00
Cost 320 000 00 ✓✓ 235 000 00✓✓✓✓✓
80 400 00 635 400 00
accumulated depreciation – –✓✓✓✓ (45 375 00)
✓✓✓✓✓ (27 592 00) (72 967 00)
Note to teacher: the30marksbelowarepart-marksthatshouldbeawardedif theaboveanswersareincorrect.
CalculationsCost price of vehicles on 28 February 2018R100000+35000=R135000
Depreciation on vehicles
R100000×10___100=R10000✓✓
R135000×10___100×3__12=R3375✓✓✓
R10000+3375=R13375
Accumulated depreciation on vehicles on 28 February 2018R32000✓✓+13375✓✓=R45375
Accumulated depreciation on the equipment sold on 28 February 2018
R4000–760=R3240×20___100=R648✓✓✓
R760+648=R1408✓
Cost price of equipment on 28 February 2018R78000✓✓+6400✓✓–4000✓✓=R80400
Depreciation on equipment on 28 February 2018
R78000–16350=R61650×20___100=R12330✓✓✓
R6400×20___100×3__12=R320✓✓✓
R12330+320=R12650
Accumulated depreciation on equipment on 28 February 2018R16350✓+12650✓✓–1408✓✓=R27592
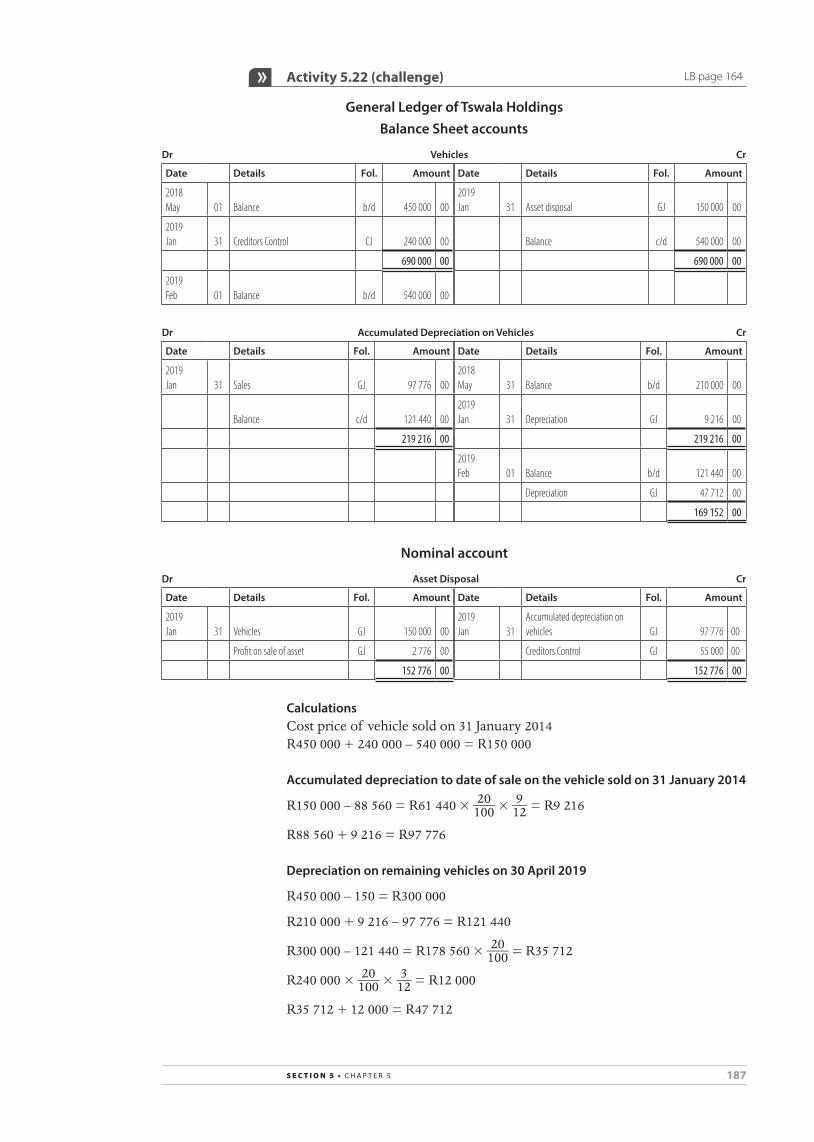
187s e c t i o n 5 • C h a p t e r 5
Activity 5.22 (challenge) LB page 164
General Ledger of Tswala HoldingsBalance Sheet accounts
Dr Vehicles Cr
Date Details Fol. Amount Date Details Fol. Amount
2018 May 01 Balance b/d 450 000 00
2019 Jan 31 Asset disposal GJ 150 000 00
2019 Jan 31 Creditors Control CJ 240 000 00 Balance c/d 540 000 00
690 000 00 690 000 00
2019 Feb 01 Balance b/d 540 000 00
Dr Accumulated Depreciation on Vehicles Cr
Date Details Fol. Amount Date Details Fol. Amount
2019 Jan 31 Sales GJ 97 776 00
2018 May 31 Balance b/d 210 000 00
Balance c/d 121 440 002019 Jan 31 Depreciation GJ 9 216 00
219 216 00 219 216 00
2019 Feb 01 Balance b/d 121 440 00
Depreciation GJ 47 712 00
169 152 00
Nominal account
Dr Asset Disposal Cr
Date Details Fol. Amount Date Details Fol. Amount
2019 Jan 31 Vehicles GJ 150 000 00
2019 Jan 31
Accumulated depreciation on vehicles GJ 97 776 00
Profit on sale of asset GJ 2 776 00 Creditors Control GJ 55 000 00
152 776 00 152 776 00
CalculationsCostpriceof vehiclesoldon31January2014R450000+240000–540000=R150000
Accumulated depreciation to date of sale on the vehicle sold on 31 January 2014
R150000–88560=R61440×20___100×9__12=R9216
R88560+9216=R97776
Depreciation on remaining vehicles on 30 April 2019
R450000–150=R300000
R210000+9216–97776=R121440
R300000–121440=R178560×20___100=R35712
R240000×20___100×3__12=R12000
R35712+12000=R47712

188 s e c t i o n 5 • c h a p t e r 6
Activity 6.1 LB page 172
1. Sole trader Partnership
capital account
Drawings account
Capital account
Drawings account } for each partner
Current account
the net profit is carried over from the Profit and Loss account to the Capital account.
the net profit is carried over from the Profit and Loss account to the Appropriation account, where it is shared between partners according to the partnership agreement.
the Drawings account is closed off to the Capital account at the end of the financial year.
the Drawings account is closed off to the Current account of each partner at the end of the financial year.
the capital balance will vary each year because net profit is added and drawings are subtracted.
Capital accounts balances will only change if a partner decreases or increases his or her capital.
2. A sleeping partner:• makesacontributionintheformof capital,labour,knowledge
orskills• nolongerphysicallyworksforthebusiness–oftenaretiredperson• isknowntothepublic• isfullyliablefordebtsand/orlosses.
3. A quasi-partner:• isapartnerthathasprovidedcapitaltothebusinessintheform
of aloan,onwhichthebusinesspaysinterestataratethatvariesaccordingtothenetprofitgenerated
• doesnotphysicallyworkforthebusiness• isnotknowntothepublic• hasliabilitythatislimitedtotheamountinvestedinthebusinessby
himorher.
4. Advantages• Abiggercapitalamount–twoormorepeopleareabletogenerate
moremoneythanoneperson.• Moretalent–skills,expertiseandknowledgeof differentpeoplein
variousfieldsarecombined.• Competitionislimited.• Continuationof thebusinesscanbeensured–shouldapartnerwish
toretireorleavethebusiness,asonordaughteroranyotherpersoncouldtakeoverfromhimorher.
CHAPTER 6 Partnerships – Accounting concepts and final accounts

189s e c t i o n 5 • c h a p t e r 6
Disadvantages• Partnersarejointlyandseverallyliableforalldebtsorlosses.This
meansthattheprivateassetsof partnerscouldbeusedtopaydebtsincurredbythebusiness.
• Thedeathorretirementof apartnercouldcausemanyproblems.Shouldapartnerpassaway,acertainamountmustbepaidouttohisorherfamilymembers:insurancepolicieswillpreventsuchasetback.Thepartnershipwillhavetoberesolveduponthedeathof apartner.
• Thebehaviourandattitudeof onepartnercouldnegativelyinfluencetheentirebusiness.
• Eachpartnerhasthepowertobindthebusinesscontractually.Thepartnershipasawholeisliableforanycontractstakenon.
5. If apartnershipisinsolventthepartnersareliableforitsdebts.Thisisnotlimitedtotheamountinvestedbythemandtheirpersonalpossessionscanalsobeused.
Activity 6.2 LB page 186
1. General Ledger of Backmin TradersBalance Sheet accounts
Dr Capital: Back B1 Cr
Date Details Fol. Amount Date Details Fol. Amount
2014 Mar 01 Balance b/d 150 000 00
Jul 01 Bank CRJ 50 000 00
200 000 00
Dr Capital: Minitzer B2 Cr
Date Details Fol. Amount Date Details Fol. Amount
2014 Mar 01 Balance b/d 250 000 00
Dr Drawings: Back B3 Cr
Date Details Fol. Amount Date Details Fol. Amount
2015 Feb 28 Balance b/d 103 600 00
2015 Feb 28 Current account: K Back GJ 103 600 00
103 600 00 103 600 00
Dr Drawings: Minitzer B4 Cr
Date Details Fol. Amount Date Details Fol. Amount
2015 Feb 28 Balance b/d 113 400 00
2015 Feb 28 Current account: Y Minitzer GJ 113 400 00
113 400 00 113 400 00

190 s e c t i o n 5 • c h a p t e r 6
Dr Current account: Back B5 Cr
Date Details Fol. Amount Date Details Fol. Amount
2015 Feb 28 Drawings: K Back GJ 103 600 00
2014 Mar 01 Balance b/d 1 022 00
Balance c/d 29 322 002015 Feb 28 Interest on capital GJ 27 500 00
Salary: K Back GJ 98 400 00
Appropriation account GJ 6 000 00
132 922 00 132 922 00
2015 Mar 01 Balance b/d 29 322 00
Dr Current account: Minitzer B6 Cr
Date Details Fol. Amount Date Details Fol. Amount
2015 Feb 28 Drawings: Y Minitzer GJ 113 400 00
2014 Mar 01 Balance b/d 2 147 00
Balance c/d 41 747 002015 Feb 28 Interest on capital GJ 37 500 00
Salary: Y Minitzer GJ 90 000 00
Bonus to partner GJ 18 000 00
Appropriation account GJ 7 500 00
155 147 00 155 147 00
2015 Mar 01 Balance b/d 41 747 00
Nominal accounts
Dr Interest on Capital N21 Cr
Date Details Fol. Amount Date Details Fol. Amount
2015 Feb 28 Current account: K Back GJ 27 500 00
2015 Feb 28 Appropriation account GJ 65 000 00
Current account: Y Minitzer GJ 37 500 00
65 000 00 65 000 00
Dr Salary: Back N22 Cr
Date Details Fol. Amount Date Details Fol. Amount
2015 Feb 28 Current account: K Back GJ 98 400 00
2015 Feb 28 Appropriation account GJ 98 400 00
98 400 00 98 400 00
Dr Salary: Minitzer N23 Cr
Date Details Fol. Amount Date Details Fol. Amount
2015 Feb 28 Current account: Y Minitzer GJ 90 000 00
2015 Feb 28 Appropriation account GJ 90 000 00
90 000 00 90 000 00
Dr Bonus to Partners N24 Cr
Date Details Fol. Amount Date Details Fol. Amount
2015 Feb 28 Current account: Y Minitzer GJ 18 000 00
2015 Feb 28 Appropriation account GJ 18 000 00
18 000 00 18 000 00
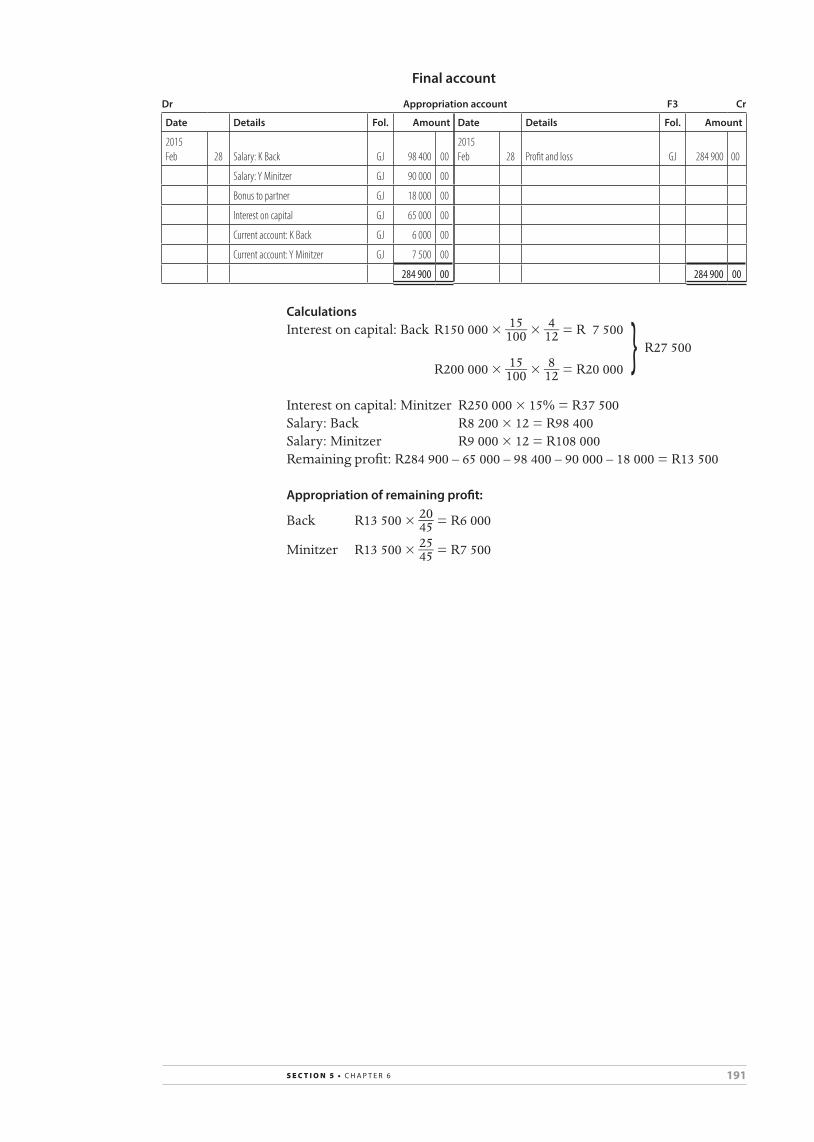
191s e c t i o n 5 • c h a p t e r 6
Final account
Dr Appropriation account F3 Cr
Date Details Fol. Amount Date Details Fol. Amount
2015 Feb 28 Salary: K Back GJ 98 400 00
2015 Feb 28 Profit and loss GJ 284 900 00
Salary: Y Minitzer GJ 90 000 00
Bonus to partner GJ 18 000 00
Interest on capital GJ 65 000 00
Current account: K Back GJ 6 000 00
Current account: Y Minitzer GJ 7 500 00
284 900 00 284 900 00
CalculationsInterestoncapital:BackR150000×15 ___ 100×4 __ 12=R7500 }R27500 R200000×15 ___ 100×8 __ 12=R20000
Interestoncapital:Minitzer R250000×15%=R37500Salary:Back R8200×12=R98400Salary:Minitzer R9000×12=R108000Remainingprofit:R284900–65000–98400–90000–18000=R13500
Appropriation of remaining profit:
Back R13500×20 __ 45=R6000
Minitzer R13500×25 __ 45=R7500
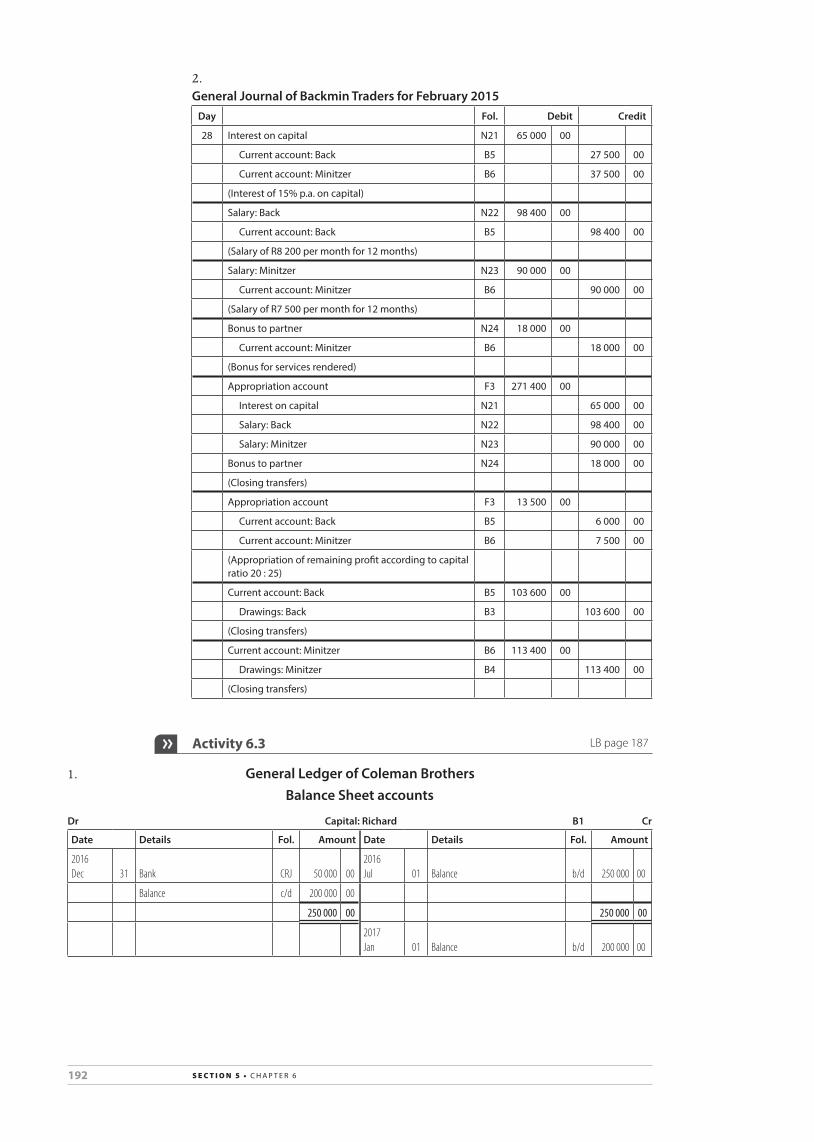
192 s e c t i o n 5 • c h a p t e r 6
2.General Journal of Backmin Traders for February 2015
Day Fol. Debit Credit
28 Interest on capital N21 65 000 00
current account: Back B5 27 500 00
current account: Minitzer B6 37 500 00
(Interest of 15% p.a. on capital)
Salary: Back N22 98 400 00
current account: Back B5 98 400 00
(Salary of r8 200 per month for 12 months)
Salary: Minitzer N23 90 000 00
current account: Minitzer B6 90 000 00
(Salary of r7 500 per month for 12 months)
Bonus to partner N24 18 000 00
current account: Minitzer B6 18 000 00
(Bonus for services rendered)
appropriation account F3 271 400 00
Interest on capital N21 65 000 00
Salary: Back N22 98 400 00
Salary: Minitzer N23 90 000 00
Bonus to partner N24 18 000 00
(closing transfers)
appropriation account F3 13 500 00
current account: Back B5 6 000 00
current account: Minitzer B6 7 500 00
(appropriation of remaining profit according to capital ratio 20 : 25)
current account: Back B5 103 600 00
Drawings: Back B3 103 600 00
(closing transfers)
current account: Minitzer B6 113 400 00
Drawings: Minitzer B4 113 400 00
(closing transfers)
Activity 6.3 LB page 187
1. General Ledger of Coleman BrothersBalance Sheet accounts
Dr Capital: Richard B1 Cr
Date Details Fol. Amount Date Details Fol. Amount
2016 Dec 31 Bank CRJ 50 000 00
2016 Jul 01 Balance b/d 250 000 00
Balance c/d 200 000 00
250 000 00 250 000 00
2017 Jan 01 Balance b/d 200 000 00

193s e c t i o n 5 • c h a p t e r 6
Dr Capital: Peter B2 Cr
Date Details Fol. Amount Date Details Fol. Amount
2016 Jul 01 Balance b/d 150 000 00
2017 Jan 01 Bank CRJ 50 000 00
200 000 00
Dr Drawings: Richard B3 Cr
Date Details Fol. Amount Date Details Fol. Amount
2017 Jun 30 Balance b/d 135 900 00
2017 Jun 30 Current account: Richard GJ 135 900 00
135 900 00 135 900 00
Dr Drawings: Peter B4 Cr
Date Details Fol. Amount Date Details Fol. Amount
2017 Jun 30 Balance b/d 124 700 00
2017 Jun 30 Current account: Peter GJ 124 700 00
124 700 00 124 700 00
Dr Current account: Richard B5 Cr
Date Details Fol. Amount Date Details Fol. Amount
2017 Jun 30 Drawings: Richard GJ 135 900 00
2016 Jul 01 Balance b/d 2 553 00
Balance c/d 4 953 002017 Jun 30 Interest on capital GJ 22 500 00
Salary: Richard GJ 115 200 00
Appropriation account GJ 600 00
140 853 00 140 853 00
2017 Jul 01 Balance b/d 4 953 00
Dr Current account: Peter B6 Cr
Date Details Fol. Amount Date Details Fol. Amount
2016 Jul 01 Balance b/d 1 556 00
2017 Jun 30 Interest on capital GJ 17 500 00
2017 Jun 30 Drawings: Peter GJ 124 700 00 Salary: Peter GJ 97 200 00
Appropriation account GJ 600 00
Balance c/d 10 956 00
126 256 00 126 256 00
2017 Jul 01 Balance b/d 10 956 00

194 s e c t i o n 5 • c h a p t e r 6
Nominal accounts
Dr Interest on Capital N21 Cr
Date Details Fol. Amount Date Details Fol. Amount
2017 Jun 30 Current account: Richard GJ 22 500 00
2017 Jun 30 Appropriation account GJ 40 000 00
Current account: Peter GJ 17 500 00
40 000 00 40 000 00
Dr Salary: Richard N22 Cr
Date Details Fol. Amount Date Details Fol. Amount
2017 Jun 30 Current account: Richard GJ 115 200 00
2017 Jun 30 Appropriation account GJ 115 200 00
115 200 00 115 200 00
Dr Salary: Peter N23 Cr
Date Details Fol. Amount Date Details Fol. Amount
2017 Jun 30 Current account: Peter GJ 97 200 00
2017 Jun 30 Appropriation account GJ 97 200 00
97 200 00 97 200 00
Final account
Dr Appropriation account F3 Cr
Date Details Fol. Amount Date Details Fol. Amount
2017 Jun 30 Salary: Richard GJ 115 200 00
2017 Jun 30 Profit and loss GJ 253 600 00
Salary: Peter GJ 97 200 00
Interest on capital GJ 40 000 00
Current account: Richard GJ 600 00
Current account: Peter GJ 600 00
253 600 00 253 600 00
CalculationsInterestoncapital:Richard R250000×10%×6 __ 12=R12500 }R22500 R200000×10%×6 __ 12=R10000
Interestoncapital:Peter R150000×10%×6 __ 12=R7500 }R17500 R200000×10%×6 __ 12=R10000
Salary:Richard R9600×12=R115200Salary:Peter R8100×12=R97200
Remainingprofit=R253600–40000–115200–97200=R1200R1200×2=R600

195s e c t i o n 5 • c h a p t e r 6
2.General Journal of Coleman Brothers for June 2017
Day Fol. Debit Credit
30 Interest on capital N21 40 000 00
current account: richard B5 22 500 00
current account: peter B6 17 500 00
(Interest of 10% traders on capital)
Salary: richard N22 115 200 00
current account: richard B5 115 200 00
(Salary of r9 600 per month for 12 months)
Salary: peter N23 97 200 00
current account: peter B6 97 200 00
(Salary of r8 100 per month for 12 months)
appropriation account F3 252 400 00
Interest on capital N21 40 000 00
Salary: richard N22 115 200 00
Salary: peter N23 97 200 00
(closing transfers)
appropriation account F3 1 200 00
current account: richard B5 600 00
current account: peter B6 600 00
(appropriation of remaining profit is divided equally between partners) (253 600 – 252 400 = 1 200)
current account: richard B5 135 900 00
Drawings: richard B3 135 900 00
(closing transfers)
current account: peter B6 124 700 00
Drawings: peter B4 124 700 00
(closing transfers)
Activity 6.4 LB page 188
General Ledger of BellsonnBalance Sheet accounts
Dr Current account: Bell Cr
Date Details Fol. Amount Date Details Fol. Amount
2018 Jul 01 Balance b/d 4 300 00
2019 Jun 30 Interest on capital 60 000 00
2019 Jun 30 Drawings: Bell 295 000 00 Bonus to partners 47 400 00
Balance c/d 3 860 00 Salary: Bell 151 200 00
Appropriation account 44 560 00
303 160 00 303 160 00
2019 Jul 01 Balance b/d 3 860 00

196 s e c t i o n 5 • c h a p t e r 6
Dr Current account: Sonn Cr
Date Details Fol. Amount Date Details Fol. Amount
2019 Jun 30 Drawings: Sonn 338 000 00
2018 Jul 01 Balance b/d 7 680 00
2019 Jun 30 Interest on capital 70 000 00
Salary: Sonn 192 000 00
Appropriation account 66 840 00
Balance c/d 1 480 00
338 000 00 338 000 00
2019 Jul 01 Balance b/d 1 480 00
Nominal accounts
Dr Interest on Capital Cr
Date Details Fol. Amount Date Details Fol. Amount
2019 Jun 30 Current account: Bell 60 000 00
2019 Jun 30 Appropriation account 130 000 00
Current account: Sonn 70 000 00
130 000 00 130 000 00
CalculationsInterestoncapital:Bell R400000×15%=R60000
Interestoncapital:Sonn R450000×15%×8 __ 12=R45000 }R70000 R500000×15%×4 __ 12=R25000
Dr Bonus to Partners Cr
Date Details Fol. Amount Date Details Fol. Amount
2019 Jun 30 Current account: Bell 47 400 00
2019 Jun 30 Appropriation account 47 400 00
47 400 00 47 400 00
CalculationBonus:R632000×7,5%=R47400
Dr Salary: Bell Cr
Date Details Fol. Amount Date Details Fol. Amount
2019 Jun 30 Current account: Bell 151 200 00
2019 Jun 30 Appropriation account 151 200 00
151 200 00 151 200 00
Dr Salary: Sonn Cr
Date Details Fol. Amount Date Details Fol. Amount
2019 Jun 30 Current account: Sonn 192 000 00
2019 Jun 30 Appropriation account 192 000 00
192 000 00 192 000 00

197s e c t i o n 5 • c h a p t e r 6
Final account
Dr Appropriation account Cr
Date Details Fol. Amount Date Details Fol. Amount
2019 Jun 30 Interest on capital 130 000 00
2019 Jun 30 Profit and loss 632 000 00
Bonus to partners 47 400 00
Salary: Bell 151 200 00
Salary: Sonn 192 000 00
Current account: Bell 44 560 00
Current account: Sonn 66 840 00
632 000 00 632 000 00
CalculationsRemainingprofit=R632000–130000–47400–151200–192000
=R111400
Bell: R111400×2 __ 5=R44560
Sonn: R111400×3 __ 5=R66840
Activity 6.5 LB page 189
General Ledger of Steyn & Co.Balance Sheet accounts
Dr Current account: P Steyn B5 Cr
Date Details Fol. Amount Date Details Fol. Amount
2020 Feb 29 Appropriation account GJ 4 900 00
2019 Mar 01 Balance b/d 11 800 00
Drawings: Steyn GJ 70 000 002020 Feb 29 Interest on capital GJ 30 000 00
Balance c/d 38 900 00 Salary: Steyn GJ 72 000 00
113 800 00 113 800 00
2020 Mar 01 Balance b/d 38 900 00
Dr Current account: S Roux B6 Cr
Date Details Fol. Amount Date Details Fol. Amount
2019 Mar 01 Balance b/d 1 820 00
2020 Feb 29 Interest on capital GJ 28 200 00
2020 Feb 29 Appropriation account GJ 4 900 00 Salary: Roux GJ 69 600 00
Drawings: Roux GJ 71 400 00
Balance c/d 19 680 00
97 800 00 97 800 00
2020 Mar 01 Balance b/d 19 680 00

198 s e c t i o n 5 • c h a p t e r 6
Final account
Dr Appropriation account F3 Cr
Date Details Fol. Amount Date Details Fol. Amount
2020 Feb 29 Salary: Steyn GJ 72 000 00
2020 Feb 29 Profit and loss GJ 190 000 00
Salary: Roux GJ 69 600 00 Current account: Steyn GJ 4 900 00
Interest on capital GJ 58 200 00 Current account: Roux GJ 4 900 00
199 800 00 199 800 00
CalculationsInterestoncapital:Steyn R250000×12%=R30000
Interestoncapital:Roux R220000×12%×6 __ 12=R13200 }R28200 R250000×12%×6 __ 12=R15000
Salary:Steyn R6000×12=R72000Salary:Roux R5800×12=R69600
Remainingloss=R30000+28200+72000+69600–190000=R9800Appropriationof remainingloss:R9800÷2=R4900
Activity 6.6 LB page 190
General Ledger of Woody TradersBalance Sheet accounts
Dr Drawings: M Dyer B4 Cr
Date Details Fol. Amount Date Details Fol. Amount
2017 Jun 30 Balance c/d 110 600 00
2017 Jun 30 Donations GJ 8 000 00
Current account: M Dyer GJ 102 600 00
110 600 00 110 600 00
Dr Current account: T Woodward B5 Cr
Date Details Fol. Amount Date Details Fol. Amount
2017 Jun 30 Drawings: T Woodward GJ 101 300 00
2016 Jul 01 Balance b/d 1 250 00
Balance c/d 6 450 002017 Jun 30 Interest on capital GJ 13 200 00
Salary: Woodward GJ 92 400 00
Appropriation account GJ 900 00
107 750 00 107 750 00
2017 Jul 01 Balance b/d 6 450 00

199s e c t i o n 5 • c h a p t e r 6
Dr Current account: M Dyer B6 Cr
Date Details Fol. Amount Date Details Fol. Amount
2016 Jul 01 Balance b/d 2 114 00
2017 Jun 30 Interest on capital GJ 16 200 00
2017 Jun 30 Drawings: M Dyer GJ 102 600 00 Salary: M Dyer GJ 100 800 00
Balance c/d 13 096 00 Appropriation account GJ 810 00
117 810 00 117 810 00
2017 Jul 01 Balance b/d 13 096 00
Final account
Dr Appropriation account F3 Cr
Date Details Fol. Amount Date Details Fol. Amount
2017 Jun 30 Salary: Woodward GJ 92 400 00
2017 Jun 30 Profit and loss (232 310 – 8 000) GJ 224 310 00
Salary: Dyer GJ 100 800 00
Interest on capital GJ 29 400 00
Current account: Woodward GJ 900 00
Current account: Dyer GJ 810 00
224 310 00 224 310 00
CalculationsInterestoncapital:Woodward R70000×12%×6 __ 12=R4200 }R13200 R150000×12%×6 __ 12=R9000
Interestoncapital:Dyer R135000×12%=R16200
Salary:Woodward R7700×12=R92400Salary:Dyer R8400×12=R100800
Remainingprofit=R224310–92400–100800–29400=R1710
Woodward R1710×150 ___ 285=R900
Dyer R1710×135 ___ 285=R810
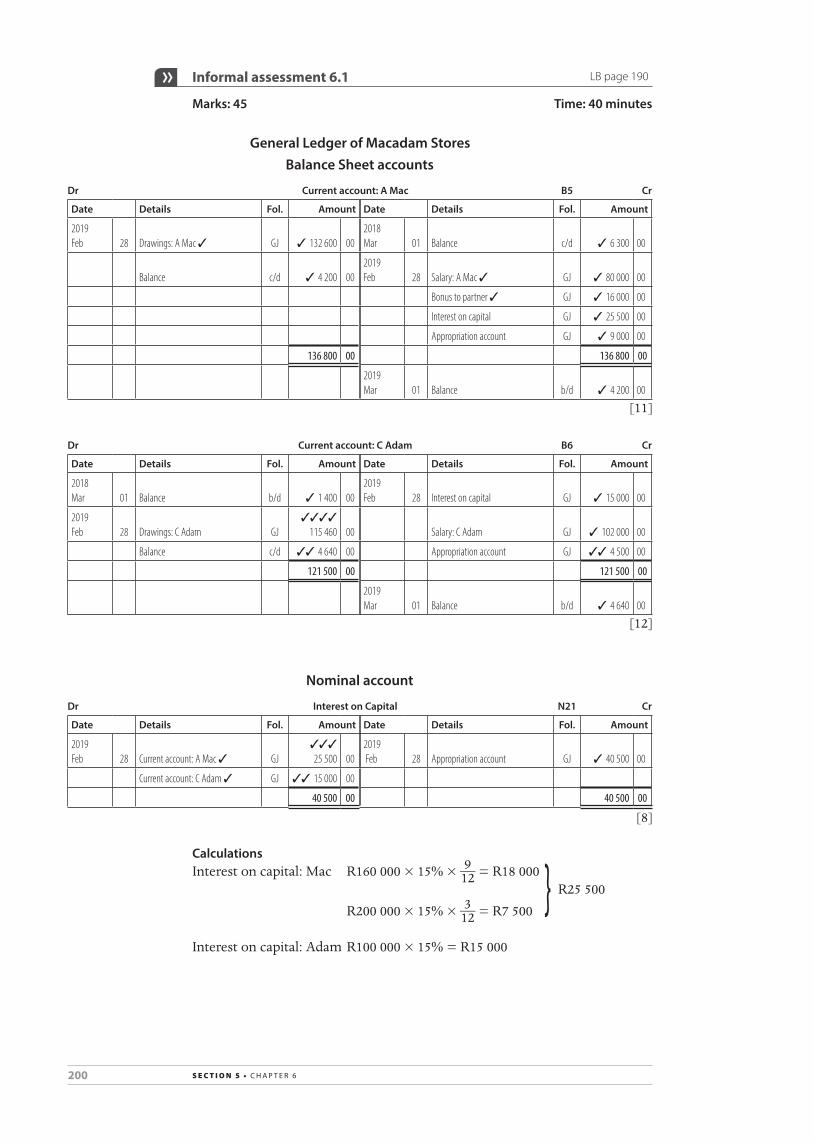
200 s e c t i o n 5 • c h a p t e r 6
Informal assessment 6.1 LB page 190
Marks: 45 Time: 40 minutes
General Ledger of Macadam StoresBalance Sheet accounts
Dr Current account: A Mac B5 Cr
Date Details Fol. Amount Date Details Fol. Amount
2019 Feb 28 Drawings: A Mac ✓ GJ ✓ 132 600 00
2018 Mar 01 Balance c/d ✓ 6 300 00
Balance c/d ✓ 4 200 002019 Feb 28 Salary: A Mac ✓ GJ ✓ 80 000 00
Bonus to partner ✓ GJ ✓ 16 000 00
Interest on capital GJ ✓ 25 500 00
Appropriation account GJ ✓ 9 000 00
136 800 00 136 800 00
2019 Mar 01 Balance b/d ✓ 4 200 00
[11]
Dr Current account: C Adam B6 Cr
Date Details Fol. Amount Date Details Fol. Amount
2018 Mar 01 Balance b/d ✓ 1 400 00
2019 Feb 28 Interest on capital GJ ✓ 15 000 00
2019 Feb 28 Drawings: C Adam GJ
✓✓✓✓
115 460 00 Salary: C Adam GJ ✓ 102 000 00
Balance c/d ✓✓ 4 640 00 Appropriation account GJ ✓✓ 4 500 00
121 500 00 121 500 00
2019 Mar 01 Balance b/d ✓ 4 640 00
[12]
Nominal account
Dr Interest on Capital N21 Cr
Date Details Fol. Amount Date Details Fol. Amount
2019 Feb 28 Current account: A Mac ✓ GJ
✓✓✓
25 500 002019 Feb 28 Appropriation account GJ ✓ 40 500 00
Current account: C Adam ✓ GJ ✓✓ 15 000 00
40 500 00 40 500 00
[8]
CalculationsInterestoncapital:Mac R160000×15%×9 __ 12=R18000 }R25500 R200000×15%×3 __ 12=R7500
Interestoncapital:AdamR100000×15%=R15000

201s e c t i o n 5 • c h a p t e r 6
Final account
Dr Appropriation account F3 Cr
Date Details Fol. Amount Date Details Fol. Amount
2019 Feb 28 Salary: A Mac ✓ ✓ 80 000 00
2019 Feb 28 Profit and loss ✓ ✓ 252 000 00
Salary: C Adam ✓ ✓ 102 000 00
Bonus to partners ✓ ✓ 16 000 00
Interest on capital ✓ ✓ 40 500 00
Current account: A Mac ✓ ✓ 9 000 00
Current account: C Adam ✓ ✓ 4 500 00
252 000 00 252 000 00
[14]
CalculationsRemainingprofit=R252000–96000–102000–40500=R13500Appropriation:Mac R13500×2÷3=R9000Appropriation:Adam R13500×1÷3=R4500
Activity 6.7 LB page 191
1. a.Cash Payments Journal of Backmin Traders for August 2019 CPJ
Doc. no. Day Name of payee Fol. Bank
Sundry accountsAmount Details
398 03 Minitzer 30 000 00 30 000 00 Capital: Minitzer401 25 Cash 600 00 600 00 Drawings: Minitzer411 31 Back 7 600 00 7 600 00 Drawings: Back412 Minitzer 8 100 00 8 100 00 Drawings: Minitzer
1. b.Cash Receipts Journal of Backmin Traders for August 2019 CRJ
Doc. no. Day Details Fol.
Analysis of receipts Bank
Sundry accountsDetails
78 01 Back 20 000 00 20 000 00 20 000 00 Capital: Back
1. c.General Journal of Backmin Traders for August 2019 GJ12
Day Details Fol. Debit Credit
02 Drawings: Minitzer 4 500 00
trading stock 4 500 00
(took stock for personal use)
04 Drawings: Back 56 00
Stationery 56 00
(partner took stationery for personal use)
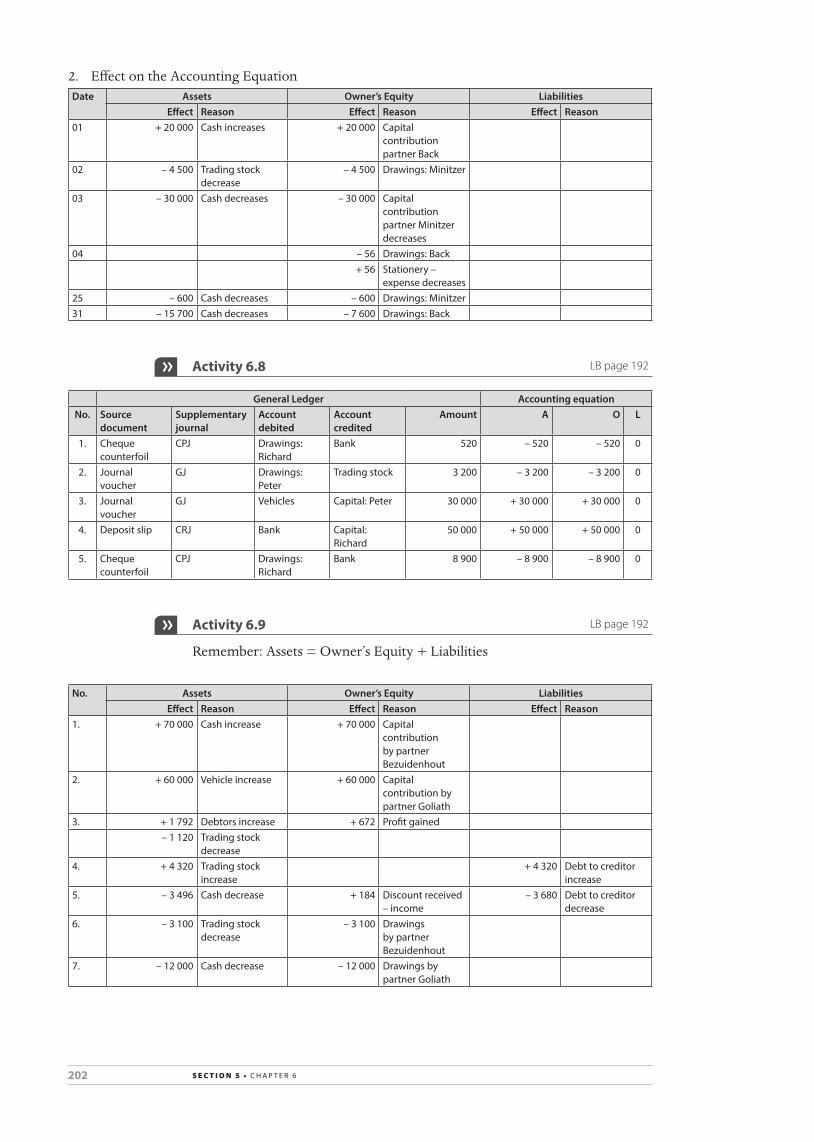
202 s e c t i o n 5 • c h a p t e r 6
2. EffectontheAccountingEquationDate Assets Owner’s Equity Liabilities
Effect Reason Effect Reason Effect Reason01 + 20 000 cash increases + 20 000 capital
contribution partner Back
02 – 4 500 trading stock decrease
– 4 500 Drawings: Minitzer
03 – 30 000 cash decreases – 30 000 capital contribution partner Minitzer decreases
04 – 56 Drawings: Back+ 56 Stationery –
expense decreases25 – 600 cash decreases – 600 Drawings: Minitzer31 – 15 700 cash decreases – 7 600 Drawings: Back
Activity 6.8 LB page 192
General Ledger Accounting equationNo. Source
documentSupplementary journal
Account debited
Account credited
Amount A O L
1. cheque counterfoil
cpJ Drawings: richard
Bank 520 – 520 – 520 0
2. Journal voucher
GJ Drawings: peter
trading stock 3 200 – 3 200 – 3 200 0
3. Journal voucher
GJ Vehicles capital: peter 30 000 + 30 000 + 30 000 0
4. Deposit slip crJ Bank capital: richard
50 000 + 50 000 + 50 000 0
5. cheque counterfoil
cpJ Drawings: richard
Bank 8 900 – 8 900 – 8 900 0
Activity 6.9 LB page 192
Remember:Assets=Owner’sEquity+Liabilities
No. Assets Owner’s Equity LiabilitiesEffect Reason Effect Reason Effect Reason
1. + 70 000 cash increase + 70 000 capital contribution by partner Bezuidenhout
2. + 60 000 Vehicle increase + 60 000 capital contribution by partner Goliath
3. + 1 792 Debtors increase + 672 profit gained– 1 120 trading stock
decrease4. + 4 320 trading stock
increase+ 4 320 Debt to creditor
increase5. – 3 496 cash decrease + 184 Discount received
– income– 3 680 Debt to creditor
decrease6. – 3 100 trading stock
decrease– 3 100 Drawings
by partner Bezuidenhout
7. – 12 000 cash decrease – 12 000 Drawings by partner Goliath

203s e c t i o n 5 • c h a p t e r 6
Activity 6.10 LB page 201
General Journal of Clorette Traders for February 2019 Day Fol. Debit Credit
28 Water and electricity 533 00
telephone 497 00
accrued expenses 1 030 00
accrued income 325 00
Interest on fixed deposit (26 000 × 5% × 3 __ 12 ) 325 00
rent income 2 500 00
Income received advance ( 17 500 _____ 14 × 2) 2 500 00
prepaid expenses 480 00
advertising ( 720 ___ 6 × 4) 480 00
Depreciation (11 300 + 2 500) 13 800 00
accumulated depreciation on vehicles [(90 000 – 33 500) × 20%] 11 300 00
accumulated depreciation on equipment (25 000 × 10%) 2 500 00
trading stock deficit 1 300 00
trading stock (23 200 – 21 900) 1 300 00
consumable stores on hand 1 120 00
packaging 976 00
Stationery 144 00
Activity 6.11 LB page 204
CalculationsR11400×5%=R570
1.General Journal of Binchy Stores for June 2012 GJ12
Day Fol. Debit Credit
30 provision for bad debts adjustment N21 570 00
provision for bad debts B9 570 00
(create the account to make provision for bad debts at 5% of debtors)
2. General Ledger of Binchy StoresBalance Sheet accounts
Dr Provision for Bad Debts B9 Cr
Date Details Fol. Amount Date Details Fol. Amount
2012 Jun 30 Provision for bad debts adjustment GJ 570 00
Dr Provision for Bad Debts Adjustment N21 Cr
Date Details Fol. Amount Date Details Fol. Amount
2012 Jun 30 Provision for bad debts GJ 570 00

204 s e c t i o n 5 • c h a p t e r 6
Activity 6.12 LB page 206
CalculationsR12040×5%=R602R602–570=R32
1.General Journal of Binchy Stores for June 2013 GJ12
Day Fol. Debit Credit
30 provision for bad debts adjustment N21 32 00
provision for bad debts B9 32 00
(adjust provision for bad debts to 5% of debtors)
2. General Ledger of Binchy StoresBalance Sheet account
Dr Provision for Bad Debts B9 Cr
Date Details Fol. Amount Date Details Fol. Amount
2012 Jul 01 Balance b/d 570 00
2013 Jun 30 Provision for bad debts adjustment GJ 32 00
602 00
Nominal accounts
Dr Provision for Bad Debts Adjustment N21 Cr
Date Details Fol. Amount Date Details Fol. Amount
2013 Jun 30 Provision for bad debts GJ 32 00
2013 Jun 30 Profit and loss GJ 32 00
32 00 32 00
3. EffectontheAccountingEquationDate Assets Owner’s Equity Liabilities
Effect Reason Effect Reason Effect Reason30 – 32 Negative asset:
provision for bad debts increase
– 32 provision for bad debts adjustment is an expense
Activity 6.13 LB page 209
Calculations(R10800–440)×5%=R518R602–518=R84
1.General Journal of Binchy Stores for June 2014 GJ12
Day Fol. Debit Credit Debtors Control
Debit Credit
30 Bad debts N20 440 00
t Block D1 440 00 440 00
(Write off as bad debt)
provision for bad debts B8 84 00
provision for bad debts adjustment W21 84 00
(adjust provision for bad debts to 5% of debtors)

205s e c t i o n 5 • c h a p t e r 6
2. General Ledger of Binchy StoresBalance Sheet accounts
Dr Debtors Control B7 Cr
Date Details Fol. Amount Date Details Fol. Amount
2014 Jun 30 Balance b/d 10 800 00
2014 Jun 30 Bad debts GJ 440 00
Balance c/d 10 360 00
10 800 00 10 800 00
2014 Jun 30 Balance b/d 10 360 00
Dr Provision for Bad Debts B8 Cr
Date Details Fol. Amount Date Details Fol. Amount
2014 Jun 30 Provision for bad debts adjustment GJ 84 00
2013 Jul 01 Balance b/d 602 00
Balance c/d 518 00
602 00 602 00
2014 Jun 01 Balance b/d 518 00
Nominal accounts
Dr Bad Debts N20 Cr
Date Details Fol. Amount Date Details Fol. Amount
2014 Jun 30 Balance b/d 1 386 00
2014 Jun 30 Profit and loss GJ 1 826 00
440 00
T Block GJ 1 826 00 1 826 00
Dr Provision for Bad Debts – adjustment N21 Cr
Date Details Fol. Amount Date Details Fol. Amount
2014 Jun 30 Profit and loss GJ 84 00
2014 Jun 30 Provision for bad debts GJ 84 00
3. EffectontheAccountingEquationDate Assets Owner’s Equity Liabilities
Effect Reason Effect Reason Effect Reason30 + 84 Negative asset:
provision for bad debts decrease
+ 84 provision for bad debts adjustment is an income
– 440 Debtors decrease – 440 Bad debt is an expense

206 s e c t i o n 5 • c h a p t e r 6
Activity 6.14 LB page 209
General Journal of Vanessa & Mandy’s Coffee Shop for February 2020 GJ12 Day Fol. Debit Credit
29 trading stock deficit 170 00
trading stock 170 00
consumable stores on hand 210 00
Stationery 210 00
prepaid expenses 2 400 00
rent expense 2 400 00
telephone 542 00
Water and electricity 487 00
accrued expenses 1 029 00
accrued income 200 00
Interest on fixed deposit 200 00
Depreciation 11 770 00
accumulated depreciation on vehicles 8 900 00
accumulated depreciation on equipment 2 870 00
Bad debts 150 00
K Malan 150 00
provision for bad debts adjustment 96 00
provision for bad debts (11 900 × 4%) = 476 – 380 96 00
Activity 6.15 LB page 217
1.General Journal of Dan the Handyman for June 2017 GJ
Day Fol. Debit Credit
28 Interest on loan 22 400 00
Loan: conbank 22 400 00
(adjustment for interest on loan for the year)
2. General Ledger of Dan the HandymanBalance Sheet account
Dr Loan: Conbank Cr
Date Details Fol. Amount Date Details Fol. Amount
2017 Jun 28 Bank CPJ 25 800 00
2016 Jul 01 Balance b/d 166 400 00
Balance c/d 163 000 002017 Jun 30 Interest on loan GJ 22 400 00
188 800 00 188 800 00
2017 Jul 01 Balance b/d 163 000 00
Nominal account
Dr Interest on Loan Cr
Date Details Fol. Amount Date Details Fol. Amount
2017 Jun 30 Loan: Conbank GJ 22 400 00
2017 Jun 30 Profit and loss GJ 22 400 00
Note:

207s e c t i o n 5 • c h a p t e r 6
TheInterest on Loanaccountisclosedoff totheProfit and Lossaccountasitisregardedasanexpenseforthefinancialperiod.Itisthecostof borrowingthemoneyfromthebank,thefinancecost.
3. EffectontheAccountingEquation
DetailsAssets Owner’s Equity Liabilities
Effect Reason Effect Reason Effect Reasonpayments on loan during the year (r2150 × 12)
–25 800 cash in bank decreases
–25 800 Loan decreases
Interest capitalised
–22 400 Interest on loan – expense
+22 400 Loan increases
Activity 6.16 LB page 219
1. General Ledger of Xoseka & Co.Balance Sheet accounts
Dr Current account: Xoseka B5 Cr
Date Details Fol. Amount Date Details Fol. Amount
2020 Feb 29 Drawings: Xoseka GJ 106 200 00
2019 Mar 01 Balance b/d 10 833 00
Balance c/d 12 200 002020 Feb 29 Interest on capital GJ 22 000 00
Salary: Xoseka GJ 66 000 00
Bonus to partner GJ 8 400 00
Appropriation account GJ 11 167 00
118 400 00 118 400 00
2020 Mar 01 Balance b/d 12 200 00
Dr Current account: Yawa B6 Cr
Date Details Fol. Amount Date Details Fol. Amount
2020 Feb 29 Drawings: Yawa GJ 119 120 00
2019 Mar 01 Balance b/d 6 035 00
2020 Feb 29 Interest on capital GJ 24 000 00
Salary: Yawa GJ 66 000 00
Appropriation account GJ 11 167 00
Balance c/d 11 918 00
119 120 00 119 120 00
2020 Mar 01 Balance b/d 11 918 00
Final accounts
Dr Trading account F1 Cr
Date Details Fol. Amount Date Details Fol. Amount
2020 Feb 29 Cost of sales GJ 620 400 00
2020 Feb 29 Sales (933 010 – 2 410) GJ 930 600 00
Profit and loss GJ 310 200 00
930 600 00 930 600 00

208 s e c t i o n 5 • c h a p t e r 6
Dr Profit and Loss account B6 Cr
Date Details Fol. Amount Date Details Fol. Amount
2020 Feb 29 Bank charges GJ 2 532 00
2020 Feb 29 Trading account GJ 310 200 00
Discount allowed GJ 1 054 00 Rent income (14 950 – 1 150) GJ 13 800 00
Stationery (1 685 – 112) GJ 1 573 00 Interest on current account GJ 870 00
Wages and salaries GJ 86 800 00 Discount received GJ 1 464 00
Insurance (7 240 – 1 540) GJ 5 700 00 Provision for bad debts adjustment GJ 88 00
Bad debts (589 + 120) GJ 709 00
Telephone (5 379 + 521) GJ 5 900 00
Water and electricity (4 944 + 466) GJ 5 410 00
Trading stock deficit (23 410 – 22 980) GJ 430 00
Depreciation (5 160 + 2 420) GJ 7 580 00
Appropriation account GJ 208 734 00
326 422 00 326 422 00
Dr Appropriation account F3 Cr
Date Details Fol. Amount Date Details Fol. Amount
2020 Feb 29 Interest on capital (22 000 + 24 000) GJ 46 000 00
2020 Feb 29 Profit and loss GJ 208 734 00
Salary: Xoseka GJ 66 000 00
Salary: Yawa GJ 66 000 00
Bonus to partner GJ 8 400 00
Current account: Xoseka GJ 11 167 00
Current account: Yawa GJ 11 167 00
208 734 00 208 734 00

209s e c t i o n 5 • c h a p t e r 6
2.Post-closing Trial Balance of Xoseka & Co. as at 29 February 2020
Fol. Debit Credit
Balance Sheet accounts
capital: Xoseka 220 000 00
capital: Yawa 240 000 00
current account: Xoseka 12 200 00
current account: Yawa 11 918 00
Land and buildings 400 000 00
Vehicles 60 000 00
equipment 24 200 00
accumulated depreciation on vehicles (25 600 + 5 160) 30 760 00
accumulated depreciation on equipment (10 800 + 2 420) 13 220 00
trading stock (23 410 – 430) 22 980 00
Debtors control (10 560 – 120) 10 440 00
provision for bad debts (610 – 88) 522 00
Bank 5 641 00
cash float 1 000 00
creditors control 18 992 00
consumable stores on hand 112 00
Income received in advance 1 150 00
accrued expenses (521 + 466) 987 00
prepaid expenses 1 540 00
537 831 00 537 831 00
Activity 6.17 LB page 225
1.General Journal of Batts Traders for February 2018 GJ12
Day Fol. Debit Credit
28 rent income N5 2 000 00
Income received in advance B20 2 000 00
(adjustment)
Water and electricity N6 778 00
accrued expense B21 778 00
(adjustment)
consumable stores on hand B22 390 00
Stationery N7 390 00
(adjustment)
prepaid expenses B23 4 400 00
advertisements N8 4 400 00
(adjustment)

210 s e c t i o n 5 • c h a p t e r 6
2.General Journal of Batts Traders for March 2018 GJ12
Day Fol. Debit Credit
01 Income received in advance B20 2 000 00
rent income N5 2 000 00
(reversal of adjustment)
accrued expense B21 778 00
Water and electricity N6 778 00
(reversal of adjustment)
Stationery N7 390 00
consumable stores on hand B22 390 00
(reversal of adjustment)
advertisements N8 4 400 00
prepaid expenses B23 4 400 00
(reversal of adjustment)
1.and2. General Ledger of Batts TradersBalance Sheet accounts
Dr Income Received in Advance B20 Cr
Date Details Fol. Amount Date Details Fol. Amount
2018 Mar 01 Rent income GJ 2 000 00
2018 Feb 28 Rent income GJ 2 000 00
Dr Accrued Expense B21 Cr
Date Details Fol. Amount Date Details Fol. Amount
2018 Mar 01 Water and electricity GJ 778 00
2018 Feb 28 Water and electricity GJ 778 00
Dr Consumable Stores on Hand B22 Cr
Date Details Fol. Amount Date Details Fol. Amount
2018 Feb 28 Stationery GJ 390 00
2018 Mar 01 Stationery GJ 390 00
Dr Prepaid Expense B23 Cr
Date Details Fol. Amount Date Details Fol. Amount
2018 Feb 28 Advertisements GJ 4 400 00
2018 Mar 01 Advertisements GJ 4 400 00
Nominal accounts
Dr Rent Income N5 Cr
Date Details Fol. Amount Date Details Fol. Amount
2018 Feb 28 Income received in advance GJ 2 000 00
2018 Feb 28 Balance b/d 26 000 00
Profit and loss GJ 24 000 00
26 000 00 26 000 00
2018 Mar 01 Income received in advance GJ 2 000 00

211s e c t i o n 5 • c h a p t e r 6
Dr Water and Electricity N6 Cr
Date Details Fol. Amount Date Details Fol. Amount
2018 Feb 28 Balance b/d 9 552 00
2018 Feb 28 Profit and loss GJ 10 330 00
Accrued expense GJ 778 00
10 330 00 10 330 00
2018 Mar 01 Accrued expense GJ 778 00
Dr Stationery N7 Cr
Date Details Fol. Amount Date Details Fol. Amount
2018 Feb 28 Balance b/d 2 094 00
2018 Feb 28 Consumable stores on hand GJ 390 00
Profit and loss GJ 1 704 00
2 094 00 2 094 00
2018 Mar 01 Consumable stores on hand GJ 390 00
Dr Advertisements N8 Cr
Date Details Fol. Amount Date Details Fol. Amount
2018 Feb 28 Balance b/d 9 700 00
2018 Feb 28 Prepaid expense GJ 4 400 00
Profit and loss GJ 5 300 00
9 700 00 9 700 00
2018 Mar 01 Prepaid expense GJ 4 400 00

212 s e c t i o n 5 • c h a p t e r 7
CHAPTER 7 Partnerships – Financial statements
Activity 7.1 LB page 237
1.S Ackerman and J SteenkampTrading as Sanjah ClothingStatement of Comprehensive Income for the year ended 30 June 2016
Note R
Sales (1 621 778 – 5 778) 1 616 000
cost of sales (966 250)
Gross profit 649 750
Other operating income 12 723
rent income (13 650 – 1 050) 12 600
provision for bad debts adjustment [867 – (18 600 × 4%)] 123
Gross operating income 662 473
Operating expenses (285 909)
Salaries and wages 210 000
consumable stores (5 680 – 870) 4 810
advertising (12 340 – 800) 11 540
Bad debts 1 430
Insurance 7 680
Water and electricity (10 976 + 643) 11 619
telephone 11 320
Sundry expenses 18 665
Depreciation [(60 000 – 12 300) × 15%] 7 155
trading stock deficit (54 890 – 53 200) 1 690
Operating profit (loss) 376 564
Interest income 1 1 436
Profit (loss) before interest expense 378 000
Interest expense 2 (33 000)
Net profit (loss) for the year 345 000

213s e c t i o n 5 • c h a p t e r 7
2.S Ackerman and J SteenkampTrading as Sanjah ClothingStatement of Financial Position at 30 June 2016
Note R
ASSETS
NON-cUrreNt aSSetS 710 545
Fixed / tangible assets 3 710 545
Financial assets –
cUrreNt aSSetS 92 117
Inventories 4 54 070
trade and other receivables 5 18 656
cash and cash equivalents 6 19 391
TOTAL ASSETS 802 662
EQUITY AND LIABILITIES
OWNer’S eQUItY 515 199
capital 7 500 000
current accounts 8 15 199
NON-cUrreNt LIaBILItIeS 228 000
Loan from aB Bank (264 000 – 36 000) 228 000
cUrreNt LIaBILItIeS 59 463
trade and other payables 9 23 463
current portion of loan 36 000
TOTAL EQUITY AND LIABILITIES 802 662

214 s e c t i o n 5 • c h a p t e r 7
S Ackerman and J SteenkampTrading as Sanjah ClothingNotes to the Financial Statements at 30 June 2016
1. INTEREST INCOmEOn current bank account 1 436
1 436
2. INTEREST EXPENSEOn loan 33 000
33 000
3. FIXED / TANGIBLE ASSETSLand and buildings Equipment Total
carrying value at beginning of year 670 000 47 700 717 700
cost 670 000 60 000 730 000
accumulated depreciation – (12 300) (12 300)
Movements
additions – – –
Disposals at carrying value – – –
Depreciation (7 155) (7 155)
carrying value at end of year 670 000 40 545 710 545
cost 670 000 60 000 730 000
accumulated depreciation – (19 455) (19 455)
4. INVENTORIEStrading stock 53 200
consumable stores on hand 870
54 070
5. TRADE AND OTHER RECEIVABLEStrade debtors 18 600
provision for bad debts (18 600 × 4%) (744)
Net trade debtors 17 856
expenses prepaid 800
18 656
6. CASH AND CASH EQUIVALENTSBank 16 891
cash float 2 500
19 391
7. CAPITALS Ackerman J Steenkamp Total
Balance at beginning of year 300 000 200 000 500 000
additional capital contributed – – –
300 000 200 000 500 000
Decreasing of capital – – –
Balance at end of year 300 000 200 000 500 000
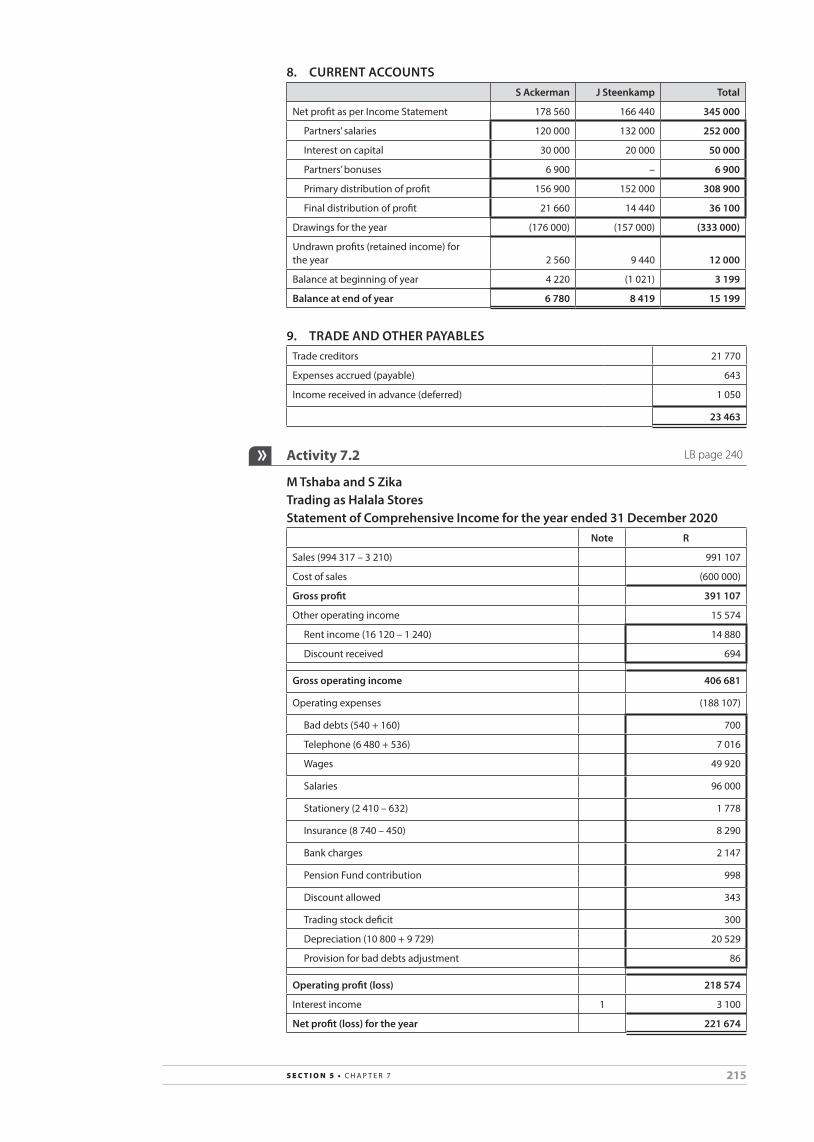
215s e c t i o n 5 • c h a p t e r 7
8. CURRENT ACCOUNTSS Ackerman J Steenkamp Total
Net profit as per Income Statement 178 560 166 440 345 000
partners’ salaries 120 000 132 000 252 000
Interest on capital 30 000 20 000 50 000
partners’ bonuses 6 900 – 6 900
primary distribution of profit 156 900 152 000 308 900
Final distribution of profit 21 660 14 440 36 100
Drawings for the year (176 000) (157 000) (333 000)
Undrawn profits (retained income) for the year 2 560 9 440 12 000
Balance at beginning of year 4 220 (1 021) 3 199
Balance at end of year 6 780 8 419 15 199
9. TRADE AND OTHER PAYABLEStrade creditors 21 770
expenses accrued (payable) 643
Income received in advance (deferred) 1 050
23 463
Activity 7.2 LB page 240
m Tshaba and S ZikaTrading as Halala StoresStatement of Comprehensive Income for the year ended 31 December 2020
Note R
Sales (994 317 – 3 210) 991 107
cost of sales (600 000)
Gross profit 391 107
Other operating income 15 574
rent income (16 120 – 1 240) 14 880
Discount received 694
Gross operating income 406 681
Operating expenses (188 107)
Bad debts (540 + 160) 700
telephone (6 480 + 536) 7 016
Wages 49 920
Salaries 96 000
Stationery (2 410 – 632) 1 778
Insurance (8 740 – 450) 8 290
Bank charges 2 147
pension Fund contribution 998
Discount allowed 343
trading stock deficit 300
Depreciation (10 800 + 9 729) 20 529
provision for bad debts adjustment 86
Operating profit (loss) 218 574
Interest income 1 3 100
Net profit (loss) for the year 221 674

216 s e c t i o n 5 • c h a p t e r 7
m Tshaba and S ZikaTrading as Halala StoresStatement of Financial Position at 31 December 2020
Note R
ASSETS
NON-cUrreNt aSSetS 459 371
Fixed / tangible assets 3 422 371
Financial assets –
Fixed deposit: ar Bank 37 000
cUrreNt aSSetS 79 781
Inventories 4 38 752
trade and other receivables 5 24 799
cash and cash equivalents 6 16 230
TOTAL ASSETS 539 152
EQUITY AND LIABILITIES
OWNer’S eQUItY 510 418
capital 7 450 000
current accounts 8 60 418
cUrreNt LIaBILItIeS 28 734
trade and other payables 9 28 734
TOTAL EQUITY AND LIABILITIES 539 152
m Tshaba and S ZikaTrading as Halala StoresNotes to the Financial Statements at 31 December 20201. INTEREST INCOmE
On investment (2 175 + 925) 3 100
3 100
3. FIXED / TANGIBLE ASSETSLand and buildings Vehicles Equipment Total
carrying value at beginning of year 340 000 54 000 48 900 442 900
cost 340 000 90 000 64 860 494 860
accumulated depreciation – (36 000) (15 960) (51 960)
Movements
additions – – – –
Disposals at carrying value – – – –
Depreciation – (10 800) (9 729) (20 529)
carrying value at end of year 340 000 43 200 39 171 422 371
cost 340 000 90 000 64 860 494 860
accumulated depreciation – (46 800) (25 689) (72 489)
4. INVENTORIEStrading stock 38 120
consumable stores on hand 632
38 752

217s e c t i o n 5 • c h a p t e r 7
5. TRADE AND OTHER RECEIVABLEStrade debtors (24 560 – 160) 24 400
provision for bad debts (976)
Net trade debtors 23 424
expenses prepaid 450
Income accrued (receivable) 925
24 799
6. CASH AND CASH EQUIVALENTSBank 15 230
cash float 1 000
16 230
7. CAPITALTshaba Zika Total
Balance at beginning of year 200 000 220 000 420 000
additional capital contributed 30 000 – 30 000
Balance at end of year 230 000 220 000 450 000
8. CURRENT ACCOUNTSTshaba Zika Total
Net profit as per Income Statement 111 737 109 937 221 674
partners’ salaries 69 600 72 000 141 600
Interest on capital 25 800 26 400 52 200
partners’ bonuses 4 800 – 4 800
primary distribution of profit 100 200 98 400 198 600
Final distribution of profit 11 537 11 537 23 074
Drawings for the year (86 500) (78 600) (165 100)
Undrawn profits (retained income) for the year
25 237 31 337 56 574
Balance at beginning of year 2 760 1 084 3 844
Balance at end of year 27 997 32 421 60 418
CalculationsInterest on capital: Tshaba R200 000 × 12% × 6 __ 12 = R12 000 } R25 800 R230 000 × 12% × 6 __ 12 = R13 800
Interest on capital: Zika R220 000 × 12% = R26 400
9. TRADE AND OTHER PAYABLEStrade creditors 22 438
expenses accrued (payable) 536
Income received in advance (deferred) 1 240
Sa revenue Services 1 980
pension Fund 2 540
28 734

218 s e c t i o n 5 • c h a p t e r 7
Activity 7.3 LB page 242
Alta Traders Statement of Owner’s Equity1. CAPITAL
Alta Johan Total
Balance at beginning of year 350 000 150 000 500 000
additional capital contributed – 50 000 50 000
350 000 200 000 550 000
Decreasing of capital (50 000) – (50 000)
Balance at end of year 300 000 200 000 500 000
2. CURRENT ACCOUNTSAlta Johan Total
Net profit as per Income Statement 130 949 114 716 245 665
partners’ salaries 96 000 84 000 180 000
Interest on capital 31 250 16 250 47 500
partners’ bonuses – 12 000 12 000
primary distribution of profit 127 250 112 250 239 500
Final distribution of profit 3 699 2 466 6 165
Drawings for the year (129 400) (115 600) (245 000)
Undrawn profits (retained income) for the year 1 549 (884) 665
Balance at beginning of year 2 456 (1 602) 854
Balance at end of year 4 005 (2 486) 1 519
CalculationsInterest on capital: Johan R150 000 × 10% × 9 __ 12 = R11 250 } R16 250 R200 000 × 10% × 3 __ 12 = R 5 000
Activity 7.4 LB page 243
1. General Ledger of macadam StoresBalance Sheet accounts
Dr Debtors Control Cr
Date Details Fol. Amount Date Details Fol. Amount
2020 Feb 29 Balance b/d 43 970 00
2020 Feb 29 Debtors allowances 336 00
Bad debts recovered 300 00 Bad debts 274 00
Balance c/d 43 660 00
44 270 00 44 270 00
2020 Mar 01 Balance b/d 43 660 00
Dr Provision for Bad Debts Cr
Date Details Fol. Amount Date Details Fol. Amount
2020 Feb 29 Provision for bad debts adjustment 567 00
2020 Feb 29 Balance b/d 2 750 00
Balance c/d 2 183 00
2 750 00 2 750 00
2020 Mar 01 Balance b/d 2 183 00

219s e c t i o n 5 • c h a p t e r 7
2.m mac and A AdamTrading as macadam StoresStatement of Comprehensive Income for the year ended 29 February 2020
Note R
Sales [683 600 – (18 230 + 336)] 665 034
cost of sales (276 420 – 240) (276 180)
Gross profit 388 854
Other operating income 10 497
rent income (7 700 + 700) 8 400
Discount received 1 230
provision for bad debts adjustment 567
Bad debts recovered 300
Gross operating income 399 351
Operating expenses (203 741)
Salaries and wages 123 000
property rates and taxes 8 000
Municipal services 1 570
advertising 12 700
Bad debts (585 + 274) 859
packaging material (4 130 – 940) 3 190
Insurance (7 300 – 2 400) 4 900
Bank charges 1 050
Stationery (3 120 – 90) 3 030
Sundry expenses 21 902
trading stock deficit (56 240 + 240) – (57 670 – 2 900) 1 710
Depreciation (10 950 + 10 880) 21 830
Profit (loss) before interest expense 195 610
Interest expense 1 (26 970)
Net profit (loss) for the year 168 640
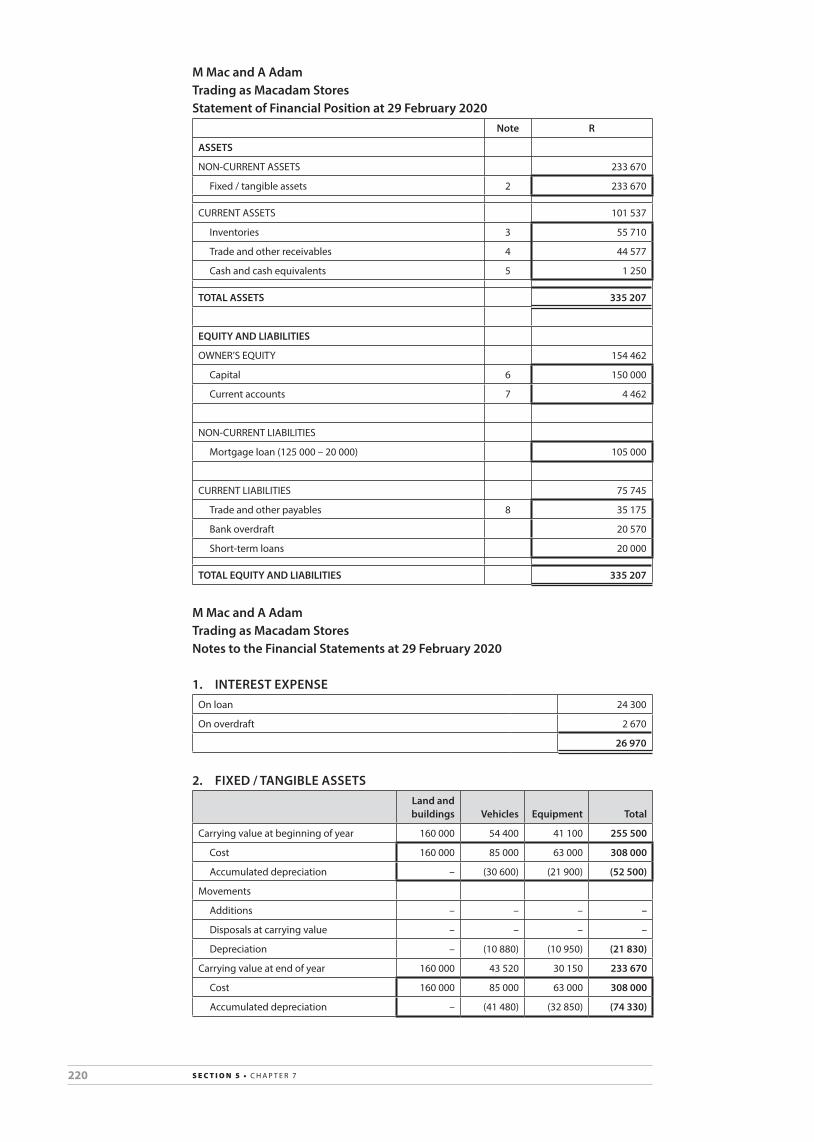
220 s e c t i o n 5 • c h a p t e r 7
m mac and A AdamTrading as macadam StoresStatement of Financial Position at 29 February 2020
Note R
ASSETS
NON-cUrreNt aSSetS 233 670
Fixed / tangible assets 2 233 670
cUrreNt aSSetS 101 537
Inventories 3 55 710
trade and other receivables 4 44 577
cash and cash equivalents 5 1 250
TOTAL ASSETS 335 207
EQUITY AND LIABILITIES
OWNer’S eQUItY 154 462
capital 6 150 000
current accounts 7 4 462
NON-cUrreNt LIaBILItIeS
Mortgage loan (125 000 – 20 000) 105 000
cUrreNt LIaBILItIeS 75 745
trade and other payables 8 35 175
Bank overdraft 20 570
Short-term loans 20 000
TOTAL EQUITY AND LIABILITIES 335 207
m mac and A AdamTrading as macadam StoresNotes to the Financial Statements at 29 February 2020
1. INTEREST EXPENSEOn loan 24 300
On overdraft 2 670
26 970
2. FIXED / TANGIBLE ASSETSLand and buildings Vehicles Equipment Total
carrying value at beginning of year 160 000 54 400 41 100 255 500
cost 160 000 85 000 63 000 308 000
accumulated depreciation – (30 600) (21 900) (52 500)
Movements
additions – – – –
Disposals at carrying value – – – –
Depreciation – (10 880) (10 950) (21 830)
carrying value at end of year 160 000 43 520 30 150 233 670
cost 160 000 85 000 63 000 308 000
accumulated depreciation – (41 480) (32 850) (74 330)

221s e c t i o n 5 • c h a p t e r 7
3. INVENTORIEStrading stock (56 240 + 240 – 1 710) 54 770
consumable stores on hand 940
55 710
4. TRADE AND OTHER RECEIVABLEStrade debtors (43 970 – 336 + 300 – 274) 43 660
provision for bad debts (2 750 – 567) (2 183)
Net trade debtors 41 477
expenses prepaid 2 400
Income accrued (receivable) 700
44 577
5. CASH AND CASH EQUIVALENTScash float 1 000
petty cash 250
1 250
6. CAPITALmac Adam Total
Balance on the last day of previous year 60 000 60 000 120 000
additional capital contributed 30 000 – 30 000
Balance on last day of current year 90 000 60 000 150 000
7. CURRENT ACCOUNTSmac Adam Total
Net profit as per Income Statement 83 784 84 856 168 640
partners’ salaries 84 000 84 000 168 000
Interest on capital 7 500 6000 13 500
primary distribution of profit 91 500 90 000 181 500
Final distribution of profit (7 716) (5 144) (12 860)
Drawings for the year (88 690) (86 100) (174 790)
Undrawn profits (retained income) for the year (4 906) (1 244) (6 150)
Balance at beginning of year 15 412 (4 800) 10 612
Balance at end of year 10 506 (6 044) 4 462
CalculationsInterest on capital: Mac R60 000 × 10% × 6 __ 12 = R3 000 } R7 500 R90 000 × 10% × 6 __ 12 = R4 500
Interest on capital: Adam R60 000 × 10% = R6 000
8. TRADE AND OTHER PAYABLEStrade creditors 35 175
35 175
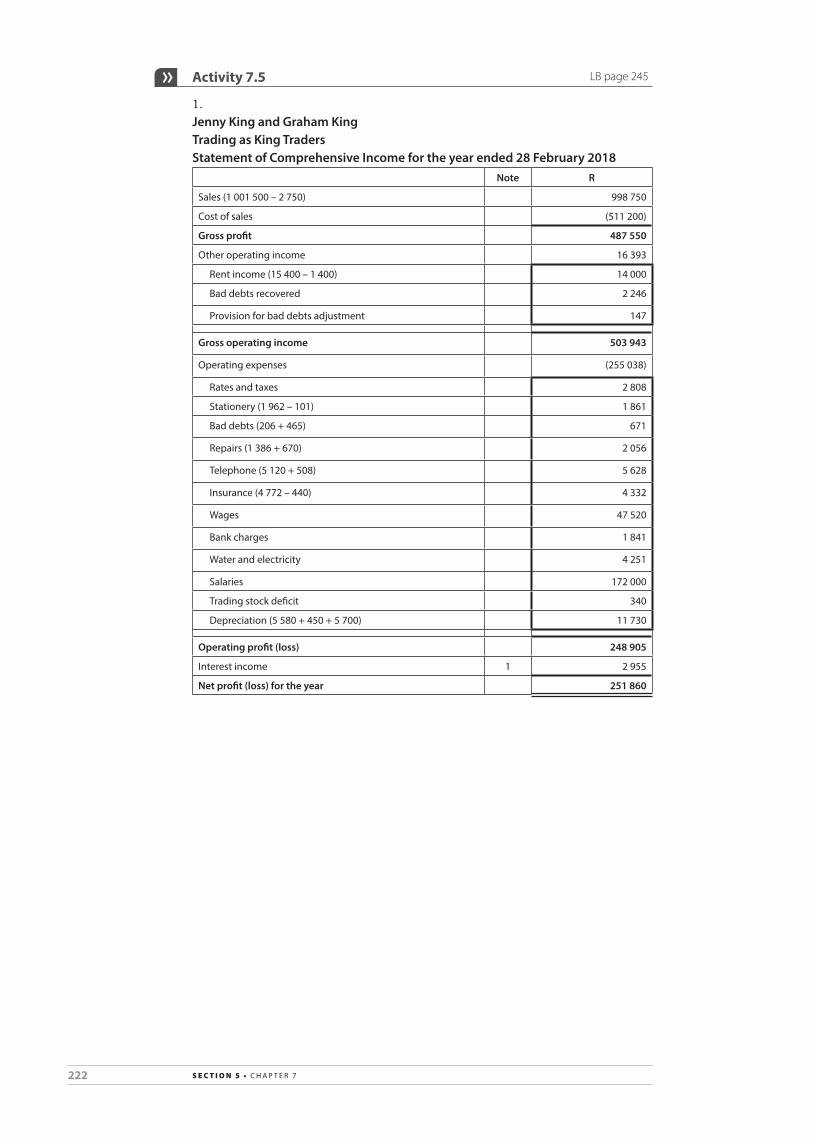
222 s e c t i o n 5 • c h a p t e r 7
Activity 7.5 LB page 245
1.Jenny King and Graham KingTrading as King TradersStatement of Comprehensive Income for the year ended 28 February 2018
Note R
Sales (1 001 500 – 2 750) 998 750
cost of sales (511 200)
Gross profit 487 550
Other operating income 16 393
rent income (15 400 – 1 400) 14 000
Bad debts recovered 2 246
provision for bad debts adjustment 147
Gross operating income 503 943
Operating expenses (255 038)
rates and taxes 2 808
Stationery (1 962 – 101) 1 861
Bad debts (206 + 465) 671
repairs (1 386 + 670) 2 056
telephone (5 120 + 508) 5 628
Insurance (4 772 – 440) 4 332
Wages 47 520
Bank charges 1 841
Water and electricity 4 251
Salaries 172 000
trading stock deficit 340
Depreciation (5 580 + 450 + 5 700) 11 730
Operating profit (loss) 248 905
Interest income 1 2 955
Net profit (loss) for the year 251 860

223s e c t i o n 5 • c h a p t e r 7
2.Jenny King and Graham KingTrading as King Traders Statement of Financial Position at 28 February 2018
Note R
ASSETS
NON-cUrreNt aSSetS 440 810
Fixed / tangible assets 2 423 810
Financial assets –
Fixed deposit: aB Bank 17 000
cUrreNt aSSetS 71 476
Inventories 3 39 061
trade and other receivables 4 10 205
cash and cash equivalents 5 22 210
TOTAL ASSETS 512 286
EQUITY AND LIABILITIES
OWNer’S eQUItY 484 725
capital 6 396 000
current accounts 7 88 725
cUrreNt LIaBILItIeS 27 561
trade and other payables 8 27 561
TOTAL EQUITY AND LIABILITIES 512 286
Jenny King and Graham KingTrading as King Traders Notes to the Financial Statements at 28 February 20181. INTEREST INCOmE
On investment 2 955
2 955
2. FIXED / TANGIBLE ASSETSLand and buildings Vehicles Equipment Total
carrying value at beginning of year 340 000 55 800 27 740 423 540
cost 340 000 72 000 38 000 450 000
accumulated depreciation – (16 200) (10 260) (26 460)
Movements
additions – – 12 000 12 000
Disposals at carrying value – – – –
Depreciation – (5 580) (6 150) (11 730)
carrying value at end of year 340 000 50 220 33 590 423 810
cost 340 000 72 000 50 000 462 000
accumulated depreciation – (21 780) (16 410) (38 190)
3. INVENTORIEStrading stock (40 500 – 1 200 – 340) 38 960
consumable stores on hand 101
39 061

224 s e c t i o n 5 • c h a p t e r 7
4. TRADE AND OTHER RECEIVABLEStrade debtors (9 765 – 465) 9 300
provision for bad debts (465)
Net trade debtors 8 835
expenses prepaid 440
Income accrued (receivable) 930
10 205
5. CASH AND CASH EQUIVALENTSBank 22 210
22 210
6. CAPITALJenny Graham Total
Balance on the last day of previous year 216 000 180 000 396 000
Balance on last day of current year 216 000 180 000 396 000
8. CURRENT ACCOUNTSJenny Graham Total
Net profit as per Income Statement 130 630 121 230 251 860
partners’ salaries 93 600 93 600 187 200
Interest on capital 32 400 27 000 59 400
partners’ bonuses 4 000 – 4 000
primary distribution of profit 130 000 120 600 250 600
Final distribution of profit 630 630 1 260
Drawings for the year (81 320) (90 520) (171 840)
Undrawn profits (retained income) for the year 49 310 30 710 80 020
Balance at beginning of year 4 201 4 504 8 705
Balance at end of year 53 511 35 214 88 725
9. TRADE AND OTHER PAYABLEStrade creditors (24 983 + 670) 25 653
expenses accrued (payable) 508
Income received in advance (deferred) 1 400
27 561

225s e c t i o n 5 • c h a p t e r 7
Activity 7.6 LB page 248
E Palmer and J HarkerTrading as Island TradersStatement of Comprehensive Income for the year ended 28 February 2019
Note R
Sales (1 428 200 – 3 200) 1 425 000
cost of sales (930 000)
Gross profit 495 000
Other operating income 25 475
rent income (24 000 + 2 000 – 2 000) 24 000
profit on sale of assets 875
Bad debts recovered 600
Gross operating income 520 475
Operating expenses (247 845)
Salaries (177 300 + 7 800) 185 100
Bank charges (1 760 + 120) 1 880
Discount allowed (2 522 – 10) 2 512
consumable goods (1 650 – 720) 930
pension fund contribution (5 146 + 170) 5 316
advertising (18 000 – 10 500) 7 500
Donations (12 850 + 800) 13 650
Bad debts (1 800 + 200) 2 000
Insurance (10 560 + 460) 11 020
Stationery (2 930 – 230) 2 700
Depreciation (10 590 + 3 125) 13 715
trading stock deficit (35 800 – 800 – 34 260) 740
provision for bad debts adjustment 62
Loss due to fire 720
Operating profit (loss) 272 630
Interest income (1 562 + 3 750) 1 5 312
Profit (loss) before interest expense 277 942
Interest expense 2 (26 500)
Net profit (loss) for the year 251 442
CalculationsInterest expenseR150 000 × 18% × 6 __ 12 = R13 500 } R26 500R130 000 × 20% × 6 __ 12 = R13 000
DepreciationOld equipment: R70 600 × 15% = R10 590
Sold equipment: R25 000 × 15% × 10 __ 12 = R3 125

226 s e c t i o n 5 • c h a p t e r 7
Asset Disposal
Equipment 25 000
Accumulated depreciation on equipment (18 750 + 3 125) 21 875
Profit with asset disposal 875 Bank 4 000
25 875 25 875
E Palmer and J Harker Trading as Island Traders Statement of Financial Position at 28 February 2019
Note R
ASSETS
NON-cUrreNt aSSetS 718 160
Fixed / tangible assets 3 693 160
Financial assets: Fixed deposit: Sp Bank 25 000
cUrreNt aSSetS 99 448
Inventories 4 34 490
trade and other receivables 5 25 928
cash and cash equivalents 6 39 030
TOTAL ASSETS 817 608
EQUITY AND LIABILITIES
OWNer’S eQUItY 633 468
capital 7 620 000
current accounts 8 13 468
NON-cUrreNt LIaBILItIeS
Loan from hJ Building Society (130 000 – 20 000) 110 000
cUrreNt LIaBILItIeS 74 140
trade and other payables 9 54 410
Bank overdraft –
current portion of loan 20 000
TOTAL EQUITY AND LIABILITIES 817 608
E Palmer and J Harker Trading as Island Traders Notes to the Financial Statements at 28 February 2019
1. INTEREST INCOmEOn fixed deposit 3 750
On current bank account 1 562
5 312
2. INTEREST EXPENSEOn loan 26 500
26 500

227s e c t i o n 5 • c h a p t e r 7
3. FIXED / TANGIBLE ASSETSLand and buildings Equipment Total
carrying value at beginning of year 595 000 75 000 670 000
cost 595 000 95 600 690 600
accumulated depreciation – (20 600) (20 600)
Movements
additions 40 000 – 40 000
Disposals at carrying value – (3 125) (3 125)
Depreciation – (13 715) (13 715)
carrying value at end of year 635 000 58 160 693 160
cost 635 000 70 600 705 600
accumulated depreciation – (12 440) (12 440)
4. INVENTORIEStrading stock 34 260
consumable stores on hand 230
34 490
5. TRADE AND OTHER RECEIVABLEStrade debtors (16 240 + 200 – 200) 16 240
provision for bad debts (812)
Net trade debtors 15 428
expenses prepaid 10 500
25 928
6. CASH AND CASH EQUIVALENTSBank (32 650 – 120 – 460 – 190 + 2 000 + 4 000) 37 880
cash float 1 000
petty cash 150
39 030
7. CAPITALPalmer Harker Total
Balance at beginning of year 310 000 250 000 560 000
additional capital contributed – 60 000 60 000
Decreasing of capital – – –
Balance at end of year 310 000 310 000 620 000

228 s e c t i o n 5 • c h a p t e r 7
8. CURRENT ACCOUNTSPalmer Harker Total
Net profit as per Income Statement 122 121 129 321 251 442
partners’ salaries 98 400 102 000 200 400
Interest on capital 24 800 22 400 47 200
partners’ bonuses – 6 000 6 000
primary distribution of profit 123 200 130 400 253 600
Final distribution of profit (1 079) (1 079) (2 158)
Drawings for the year (129 974) (106 800) (236 774)
Undrawn profits (retained income) for the year (7 853) 22 521 14 668
Balance at beginning of year 3 200 (4 400) (1 200)
Balance at end of year (4 653) 18 121 13 468
Interest calculations:Palmer: R310 000 × 8% = R24 800
Harker: R250 000 × 8% × 6 __ 12 = R10 000 } R22 400 R310 000 × 8% × 6 __ 12 = R12 400
9. TRADE AND OTHER PAYABLEStrade creditors 23 370
expenses accrued (payable) 13 000
Income received in advance (deferred) 2 000
creditors for salaries 5 510
pension fund (2 400 + 340 + 170) 2 910
SarS (paYe) (5 400 + 1950) 7 350
54 140
Activity 7.7 LB page 251
1. General Ledger of CC StoresBalance Sheet account
Dr Trading Stock Cr
Date Details Fol. Amount Date Details Fol. Amount
2013 Jun 30 Balance b/d 35 794 00
2013 Jun 30 Donations 1 500 00
Drawings: Collett 2 250 00 Trading stock deficit 1 460 00
Creditors Control 546 00 Balance c/d 35 630 00
38 590 00 38 590 00
2013 Jul 01 Balance b/d 35 630 00

229s e c t i o n 5 • c h a p t e r 7
2.D Collett and P ColeTrading as CC StoresStatement of Financial Position at 30 June 2013
Note R
ASSETS
NON-cUrreNt aSSetS 365 200
Fixed / tangible assets 3 365 200
cUrreNt aSSetS 71 494
Inventories 4 35 940
trade and other receivables 5 30 996
cash and cash equivalents 6 4 558
TOTAL ASSETS 436 694
EQUITY AND LIABILITIES
OWNer’S eQUItY 405 189
capital 7 360 000
current accounts 8 45 189
cUrreNt LIaBILItIeS 31 505
trade and other payables 9 31 505
TOTAL EQUITY AND LIABILITIES 436 694
D Collett and P ColeTrading as CC StoresNotes to the Financial Statements at 30 June 20133. FIXED / TANGIBLE ASSETS
Land and buildings Equipment Total
carrying value at beginning of year 268 000 77 000 345 000
cost 268 000 114 000 382 000
accumulated depreciation – (37 000) (37 000)
Movements
additions 22 000 16 000 38 000
Depreciation – (17 800) (17 800)
carrying value at end of year 290 000 75 200 365 200
cost 290 000 130 000 420 000
accumulated depreciation – (54 800) (54 800)
4. INVENTORIEStrading stock (35 994 + 2 250 – 1 500 + 546 – 1 460) 35 630
consumable stores on hand 310
35 940
5. TRADE AND OTHER RECEIVABLEStrade debtors (31 500 – 900) 30 600
provision for bad debts (1 540 – 316) (1 224)
Net trade debtors 29 376
expenses prepaid 1 620
30 996

230 s e c t i o n 5 • c h a p t e r 7
6. CASH AND CASH EQUIVALENTSBank 3 558
cash float 1 000
4 558
7. CAPITALD Collett P Cole Total
Balance on last day of current year 160 000 200 000 360 000
8. CURRENT ACCOUNTSD Collett P Cole Total
Net profit as per Income Statement 106 968 109 476 216 444
partners’ salaries 85 000 85 000 170 000
Interest on capital 16 000 20 000 36 000
primary distribution of profit 101 000 105 000 206 000
Final distribution of profit 5 968 4 476 10 444
Drawings for the year (87 980) (87 043) (175 023)
Undrawn profits (retained income) for the year 18 988 22 433 41 421
Balance at beginning of year 1 246 2 522 3 768
Balance at end of year 20 234 24 955 45 189
9. TRADE AND OTHER PAYABLEStrade creditors (28 634 + 546) 29 180
expenses accrued (payable) 580
Income received in advance (deferred) 1 610
Unemployment Insurance Fund (10 + 10) 20
Sa revenue Services (paYe) 115
31 505
Informal assessment 7.1 LB page 253
marks: 50 Time: 45 minutes
1.P Joubert and m BosmanTrading as Sunshine Coast TradersExtract from the Statement of Financial Position at 28 February 2018
Note R
EQUITY AND LIABILITIES
OWNer’S eQUItY ✓ 536 882
capital 1 ✓ 500 000
current accounts 2 ✓ 36 882
NON-cUrreNt LIaBILItIeS
Mortgage bond: XY Bank ✓✓✓ 176 000
cUrreNt LIaBILItIeS ✓ 59 185
trade and other payables 3 ✓ 35 185
Short-term loans ✓✓ 24 000
TOTAL EQUITY AND LIABILITIES ✓ 772 067
[11]
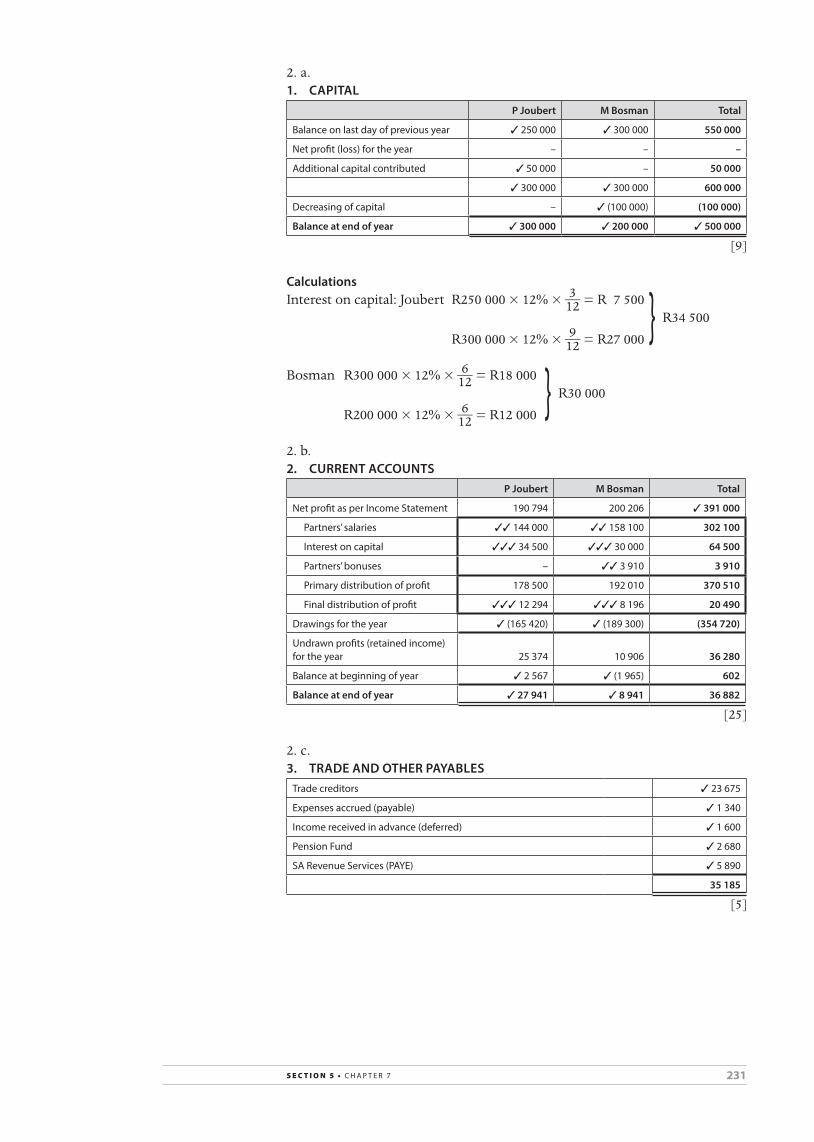
231s e c t i o n 5 • c h a p t e r 7
2. a. 1. CAPITAL
P Joubert m Bosman Total
Balance on last day of previous year ✓ 250 000 ✓ 300 000 550 000
Net profit (loss) for the year – – –
additional capital contributed ✓ 50 000 – 50 000
✓ 300 000 ✓ 300 000 600 000
Decreasing of capital – ✓ (100 000) (100 000)
Balance at end of year ✓ 300 000 ✓ 200 000 ✓ 500 000
[9]
CalculationsInterest on capital: Joubert R250 000 × 12% × 3 __ 12 = R 7 500 } R34 500 R300 000 × 12% × 9 __ 12 = R27 000
Bosman R300 000 × 12% × 6 __ 12 = R18 000 } R30 000 R200 000 × 12% × 6 __ 12 = R12 000
2. b. 2. CURRENT ACCOUNTS
P Joubert m Bosman Total
Net profit as per Income Statement 190 794 200 206 ✓ 391 000
partners’ salaries ✓✓ 144 000 ✓✓ 158 100 302 100
Interest on capital ✓✓✓ 34 500 ✓✓✓ 30 000 64 500
partners’ bonuses – ✓✓ 3 910 3 910
primary distribution of profit 178 500 192 010 370 510
Final distribution of profit ✓✓✓ 12 294 ✓✓✓ 8 196 20 490
Drawings for the year ✓ (165 420) ✓ (189 300) (354 720)
Undrawn profits (retained income) for the year 25 374 10 906 36 280
Balance at beginning of year ✓ 2 567 ✓ (1 965) 602
Balance at end of year ✓ 27 941 ✓ 8 941 36 882
[25]
2. c. 3. TRADE AND OTHER PAYABLES
trade creditors ✓ 23 675
expenses accrued (payable) ✓ 1 340
Income received in advance (deferred) ✓ 1 600
pension Fund ✓ 2 680
Sa revenue Services (paYe) ✓ 5 890
35 185
[5]

232 s e c t i o n 5 • c h a p t e r 7
Activity 7.8 (challenge) LB page 255
1. (200 000 × 6 __ 12 × x ___ 100 ) + (300 000 × 6 __ 12 × x ___ 100 ) = 40 000 1 000x + 1 500x = 40 000 x = 16 Interest rate is 16%
2. Interest on capital = (300 000 × 9 __ 12 × 16%) + (200 000 × 3 __ 12 × 16%) = (R36 000 + 8 000) = R44 000 Primary distribution = R44 000 + R45 000 = R89 000
3. R7 825
4. R168 100 + 44 000 + 45 000 + 7 825 – 110 000 = R154 925
5.S mlata & S FestusTrading as Fessim StoresStatement of Comprehensive Income for the year ended 28 February 2021
Note R
Sales (878 550 – 20 550 – 6 000) 852 000
cost of sales (516 800 – 4 800) (512 000)
Gross profit 340 000
Other operating income 23 537
rent income (26 600 – 3 325) 23 275
provision for bad debts adjustment 262
Gross operating income 363 537
Operating expenses (156 337)
trading stock deficit (77 300 + 4 800 + 3 900 – 85 000) 1 000
Stationery (4 810 – 1 020) 3 790
Salaries (88 100 + 5 600) 93 700
pension fund contributions (5 000 + 450) 5 450
Insurance (6 250 – 1 600) 4 650
Bad debts (1 000 + 170) 1 170
Depreciation (29 999 + 5 268 + 300) 35 567
repairs 4 300
telephone (1 900 + 100) 2 000
Bank charges 4 710
Operating profit (loss) 207 200
Interest income (2 250 + 900) 3 150
Profit before interest expense 210 350
Interest expense (20 700)
Net profit (loss) for the year 189 650

233s e c t i o n 5 • c h a p t e r 7
6. TRADE AND OTHER PAYABLES
trade creditors 23 675
expenses accrued (payable) 1 340
Income received in advance (deferred) 1 600
pension Fund 2 680
Sa revenue Services (paYe) 5 890
35 185
[5]7.Extract from the Statement of Financial Position of Fessim Stores at 28 February 2021
Note R
EQUITY AND LIABILITIES
OWNer’S eQUItY 802 430
capital (300 000 + 200 000) 7 500 000
current accounts (154 925 + 147 505) 8 302 430
NON-cUrreNt LIaBILItIeS 80 000
Loan from SB Bank (100 000 – 20 000) 80 000
cUrreNt LIaBILItIeS 59 285
trade and other payables 38 285
Bank overdraft 9 1 000
Short-term loans 20 000
TOTAL EQUITY AND LIABILITIES 941 175

234 s e c t i o n 5 • c h a p t e r 8
CHAPTER 8 Partnerships – Interpretation of financial statements
Activity 8.1 LB page 275
1. Percentage gross profit on sales/turnover = Gross profit
_________ Sales × 100 ___ 1 2019 2018
388 854 ______ 665 034 × 100 ___ 1 400 200 ______ 667 034 × 100 ___ 1
= 58,5% = 60%
2. Percentage profit mark-up on cost = Gross profit
_________ Cost of sales × 100 ___ 1 2019 2018
388 854 ______ 276 180 × 100 ___ 1 400 200 ______ 266 800 × 100 ___ 1
= 140,8% = 150%
3. • Thepercentagegrossprofitonsalesdecreasedfrom60%in2018to58,5%in2019.
• Thepercentagegrossprofitoncostof salesdecreasedfrom150%in2018to140,8%in2019.
• Bothratiosthusindicatethatin2019thebusinessoperatedbelowtheprofitmarginof thepreviousyear.
• Thereasonscouldbeoneof thefollowingandthebusinessshouldinvestigatethis:– Regularsalesatdiscountpricestookplacetoincreasetherateof
stockturnoverorbecauseof competitorsinthemarket.– Costof salescouldhaveincreasedduetoanincreaseinprices
fromsuppliers.– Mistakescouldhavebeenmadeincalculatingprices,onsource
documentsorinthejournals.– Inthecaseof theperiodicinventorysystemitcanbedueto
normalstocklosses,suchastheftordamage.
4. Percentage net profit on sales = Net profit
_______ Sales × 100 ___ 1 2019 2018
168 640 ______ 665 034 × 100 ___ 1 153 418 ______ 667 034 × 100 ___ 1
= 25,4% = 23%
5. Percentage operating expenses on sales = Operatingexpenses
______________ Sales × 100 ___ 1 2019 2018
214 244 ______ 665 034 × 100 ___ 1 238 782 ______ 667 034 × 100 ___ 1
= 32,2% = 35,8%

235s e c t i o n 5 • c h a p t e r 8
6. Percentageoperatingprofitonsales=Operatingprofit
____________ Sales × 100 ___ 1 2019 2018
195610 ______ 665 034 × 100 ___ 1 181 418 ______ 667 034 × 100 ___ 1
=29,4% =27,2%
7. • Thepercentagenetprofitonsalesincreasedfrom23%in2018to25,4%in2019.
• Thepercentageoperatingprofitonsalesincreasedfrom27,2%in2018to29,4%in2019.
• Anincreaseinboththeseratiosispositive–itindicatesthatthebusinessoperatedmoreefficientin2019.
• Thepercentageoperatingexpensesonsalesdecreasedslightlyfrom35,8%in2018to32,2%in2019.
• Thisisgood.Itindicatesthatthebusinesshadbettercontroloverexpensesandwasmoreproductive.
• Thebusinesswillinvestigateif theycanreduceexpensesfurtherinthefuture.
• Goodplanningandstayingwithinthebudgetcanimprovethesefiguresfurther.
8. Currentratio=Currentassets:Currentliabilities
2019 2018 101537:75745 60536:60424 =1,3:1 =1:1
9. Acidtestratio=(Currentassets–Stock):Currentliabilitiesor =(Tradeandotherreceivables+Cashandcash
equivalents):Currentliabilities
2019 2018 (101537–55710):75745 (60536–28252):60424Or (44577+1250):75745 (26650+5634):60424 =45827:75745 =32284:60424 =0,6:1 =0,5:1
10. • Thecurrentratioimprovedfrom1:1in2018to1,3:1in2019.• Itisrelativelylowandthebusinessshouldtrytoimproveitfurther,so
thatthereareatleastTWOassetsforeveryONEliability.• Theacidtestratioimprovedfrom0,5:1in2018to0,6:1in2019.• Althoughthereisanimprovementitisalsorelativelylow.They
shouldtrytoimprovethisratiotoatleast1:1.• Thebankoverdraftshowsliquidityproblemsandhasanegative
influenceontheratio.• Theseratiosindicatethatthebusinesscouldhaveahardtime
meetingshort-termobligations.Theyshouldcontinuetotryandimprovetheseratios.

236 s e c t i o n 5 • c h a p t e r 8
11. Stock turnover ratefor2019=Cost of sales __________ Averagestock =timesperyear
= 276 180 _______________ 1 __ 2(55710+28252)
= 276 180 ______ 41981
=6,6timesperyear
Comments• Therateof stockturnoverdecreasedfrom9timesperyearin2018to
6,6timesperyearin2019.• Thebusinessshouldtrytoincreasetheirrateinstockturnoverasstill
willhaveapositiveeffectontheliquidityratio.
12. Stock holding period = Averagestock
__________ Cost of sales × 12
= 1 __ 2(55710+28252)
_______________ 276 180 × 12
= 41981 ______ 276 180 × 12
=1,8months
OR Averagestock
__________ Cost of sales × 365
= 1 __ 2(55710+28252)
_______________ 276 180 × 365
= 41981 ______ 276 180 × 365
=55days
13.Averagedebtors collection period = Averagedebtors
___________ Creditsales × 365 ___ 1
1 __ 2(43660+25210)
_______________ 354 130 × 365 ___ 1
= 34 435 ______ 354 130 × 365 ___ 1
=35,5days
Comments• Theaveragedebtorscollectionperiodimprovedfrom40daysin2018
to35,5daysin2019.• Thiscouldbeoneof reasonsthereisanimprovementinliquidity.• Thecreditcontrol,however,isstillnotverygood–theyshouldtryto
collectdebtswithin30days.• Waystoimprovedebtcollectioncanbe:
– Chargeoverdueaccountswithinterest.– Allowdiscountforearlypayments.– Applycreditlimits–acustomerfirstneedtosettleaccountbefore
furtherpurchasescanbemade.

237s e c t i o n 5 • c h a p t e r 8
14.Averagecreditors payment period = Averagecreditors
____________ Creditpurchases × 365 ___ 1
1 __ 2(25000+32100)
_______________ 212 472 × 365
= 28 550 ______ 212 472 × 365
=49days
Comments• Theaveragecreditorspaymentperiodincreasedfrom36daysfrom
2018to49daysin2019.• Thebusinessshouldnegotiatewithcreditorsforalongerpayment
periodbetween60to90days.• Theyshould,however,stillmakesuretopaycreditorsontimeto
avoidpayinginterestonoverdueaccountsandtomakeuse of discount.
15. Solvency ratio=Totalassets:Totalliabilities
2019 2018 735207:(105000+75745) 716036:(125000+60424) =735207:180745 =716036:185424 =4,1:1 =3,9:1
Comments• Thesolvencyratioimprovedfrom3,9:1in2018to4,1:1in2019.• Thesolvabilityisgood.Forevery1liabilitythereis4,1assets.• Assetsexceedliabilities.
16. Debt : equity ratio=Long-termliabilities:Owner’sEquity
2019 2018 105000:554462 125000:530612 =0,19:1 =0,24:1
Comments• Thedebt:equityratioimprovedslightlyfrom0,24:1in2018to
0,19:1in2019.• Thebusinessislowgearedandcreditworthy–thefinancialrisk
islow.• Owncapitalismorethanforeigncapital.• Theywillbeabletoapplyforanadditionalloan–theyshould,
however,keepinmindthatthecurrentportionof anadditionalloanmighthaveaninfluenceontheliquidityof thebusiness,whichisnotsogood.
17. Return on owner’s equity = Net profit
________________ Averageowner’sequity × 100 ___ 1
168 640 _________________ 1 __ 2(554462+530612)
× 100 ___ 1
= 168 640 ______ 542 537 × 100 ___ 1
= 31,1%

238 s e c t i o n 5 • c h a p t e r 8
18.Percentageearningsof partner=Totalearningof partner
_________________ Averagepartner’sequity × 100 ___ 1
Partner Mac
80000+7500+4000–7716 _______________________________ 1 __ 2(290000+260000+10506+15412)
× 100 ___ 1
= 83 784 ______ 287959 × 100 ___ 1
=29,6%
Partner Adam
84000+6000–5144 ____________________________ 1 __ 2(260000+260000–4800–6044)
× 100 ___ 1
= 84 856 ______ 254 578 × 100 ___ 1
= 33,3%
19.Commentsonreturnoninvestment:• Thebusinessmadeareturnof 31,1%.Thisisgood.• Bothpartnersshouldfeelsatisfiedwiththeirreturnontheir
investment.Itisworththeeffortandrisk.• Comparedwithalternativeformsof investment,itisagoodpercentage.
Activity 8.2 LB page 277
1. 135551:62500 =2,2:1
Comments• Ithasslightlydecreasedfrom2,4in2018to2,2in2019.• Thebusinessshouldneverthelessbeabletomeetitsshort-term
liabilities.
2. Acidtestratio=(Currentassets[CA]–stock):Currentliabilities(CL) =1,3:1
∴CA–stock=62500×1,3 CA–stock=81250 Stock =135551–81250 = 54 301
3.
Current account: Balsamo
Drawings 50 600 Balance b/d 5 820
Balance c/d 2 490 Total earnings 47 270
53 090 53 090
Balance b/d 2 490
Current account: Du Toit
Balance b/d 1 810 Total earnings 32 770
Drawings 29 800
Balance c/d 1 160
32 770 32 770
Balance b/d 1 160

239s e c t i o n 5 • c h a p t e r 8
4. Percentageearningsof Balsamo
= 47 270 _____________________________ 1 __ 2(180000+180000+5820+2490)
× 100 ___ 1
= 47 270 ______ 184 155 × 100 ___ 1
= 25,7%
Yes,sheshouldbesatisfied–thisisfarmorethanwhatevershewouldhaveearnedfromthebank.
5. Debt : owner’s equity ratio
Before loan After loan
r20 000 : (180 000 + 108 000 + 2 490 + 1 160)
= r20 000
= 0,07 : 1
r200 000 : 291 650
= 0,7 : 1
Comments• Thebusinessislowgearedandcreditworthybeforeandaftertheloan.• Thebusinesswillbeabletotakeonanotherloanwithoutany
problem.
Activity 8.3 LB page 278
1. Yes,thepercentagenetvalueonsaleshasimprovedfrom26,4%to31,2%.
2. No.• Thecurrentratiohasimprovedfrom2,3:1to4,6:1.• Theacidtestratiohasimprovedfrom1,1:1to1,9:1.• Theturnoverspeedof stockhasalsoimprovedfrom5,6to7,4times
peryear.
3. Yes,theywilleasilybeabletoobtainaloan,asthedebt:owner’sequityratiois0,06:1.Thebusinessislowgearedandcreditworthy.Theearningsonthecapitalemployedis29%,whileinterestontheloanamountstoonly17%.
Iwouldrecommendthis.
4. 188900 _____________________________ 1 __ 2(500000+9923+500000+1223)
× 100 ___ 1
= 37,4%
Yes,heshouldfeelsatisfied,asitisagoodinvestment.
5. Current account: Michael
Drawings 183 360 Balance b/d 1 090
Total appropriation 176 200
Balance c/d 6 070
183 360 183 360
Balance b/d 6 070

240 s e c t i o n 5 • c h a p t e r 8
ThisisnotmuchmorethantheamountHannohimself haswithdrawn,butitisfarmorethantheamountappropriatedtoMichael.
Yes,hecouldfeelunhappy.
6. 1 __ 2(8920+9960)
_____________ 91250 × 365 ___ 1
=38days
Comments• Chargeinterestonoverdueaccounts.• Allowdiscountonearlypayments.
Activity 8.4 LB page 279
1. a. Ratioof totalassetstototalliabilitiesfor2017: 3847000:1333300 =2.9:1
b. No,assetsoutweighliabilities. Forevery1liabilitythereis2,9assets.
2. a. Debt:equityratiofor2017: 1000000:2513700 =0,4:1
b. Thedebt:equityratiohasincreasedfrom0,28to0,4.Thedegreeof riskisincreasing.
Theonlyreasonthedebt/equityratioisstillreasonable(0,4:1)isthatLainghasinvestedextracapitalof R700000intothebusiness.
Interestontheloan(14%)exceedsreturnoncapitalemployed(7,2%)–returnsarebeingnegativelyaffectedbytheloan.
3. a. Laing’spercentagereturnonaverageequityfor2017
(70000+46000+8000)
________________________________ 1 __ 2(41200+90200+800000+1500000)
× 100 ___ 1
= 124 000 ________ 1 215 700 × 100 ___ 1
= 10,2 %
b. Laing’sreturnhasdroppedfrom14,9%to10,2%. Nkewu’sreturnhasdroppedfrom12,5%to11,7%.
NkewuhaswithdrawnR300000capitalwhileLainghasincreasedhiscapitalwithR700000–thisisaffectingtheirreturns.
Nkewuhasalargeunfavourablebalanceinhiscurrentaccount,whileLainghasnotdrawnalltheprofitssheisentitledtoasreflectedbyherfavourablecurrentaccountbalanceof R90200.

241s e c t i o n 5 • c h a p t e r 8
4. a. Averagedebtorscollectionperiodfor2017
1 __ 2(395000+236000)
_________________ 1 038 000 × 365 ___ 1
= 315 500 ________ 1 038 000 × 365 ___ 1
=110,9days
b. SaleshavedeclinedfromR3920400toR2595000. TradingstockhasdeclinedfromR326000toR170000. Turnoverrateof stockhasdecreasedfrom7,4to6,9.
c. Nkewuisnotworried:• Currentratiohasdecreasedfrom3,5:1to2,2,butisstillabove2:1.• Acidtestratiohasincreasedfrom1,6:1to1,7:1.
Laingisworried:(anyTWOpoints)• Debtorsaretakingtoolongtopay(110days).• Creditorsarebeingpaidtooearly(23days).• Salesaredecreasing(R3920400toR2595000).• LoansarenowR1000000,whichmeanhighinteresttopayand
largeloanrepayments.
Activity 8.5 LB page 282
1. General Ledger of The Great Outdoors
Dr Current account: S Yolisa Cr
Date Details Fol. Amount Date Details Fol. Amount
2018 Feb 28 Drawings: Yolisa 85 534 00
2017 Mar 01 Balance b/d 3 450 00
Balance c/d 12 666 002018 Feb 28 Interest on capital 45 000 00
Salary: Yolisa 40 000 00
Appropriation account 9 750 00
98 200 00 98 200 00
2018 Mar 01 Balance b/d 12 666 00
CalculationsInterestoncapitalSYolisa: R400000×10%×6 __ 12 = R20 000
R500 000 × 10% × 6 __ 12 = R25 000 R45 000
2. Percentageearningsof Yolisa:
(45000+40000+9750)
______________________________ 1 __ 2(400000+3450+500000+12666)
× 100 ___ 1
= 94750 ______ 458 058 × 100 ___ 1
= 20,7%
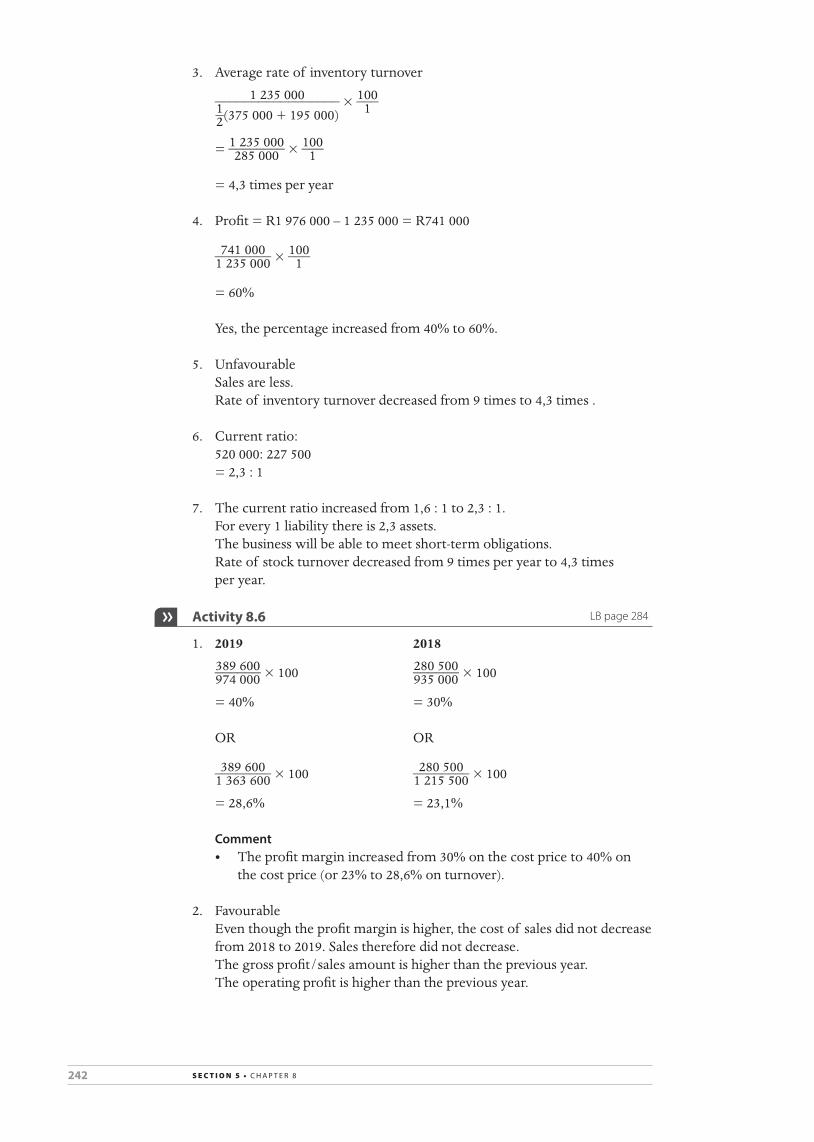
242 s e c t i o n 5 • c h a p t e r 8
3. Averagerateof inventoryturnover
1 235 000 _________________ 1 __ 2(375000+195000)
× 100 ___ 1
= 1 235 000 ________ 285 000 × 100 ___ 1
=4,3timesperyear
4. Profit=R1976000–1235000=R741000
741 000 ________ 1 235 000 × 100 ___ 1
= 60%
Yes,thepercentageincreasedfrom40%to60%.
5. Unfavourable Sales are less. Rateof inventoryturnoverdecreasedfrom9timesto4,3times.
6. Currentratio: 520000:227500 =2,3:1
7. Thecurrentratioincreasedfrom1,6:1to2,3:1. Forevery1liabilitythereis2,3assets. Thebusinesswillbeabletomeetshort-termobligations. Rateof stockturnoverdecreasedfrom9timesperyearto4,3times
peryear.
Activity 8.6 LB page 284
1. 2019 2018
389600 ______ 974000 × 100 280 500 ______ 935000 × 100
= 40% = 30%
OR OR
389600 ________ 1 363 600 × 100 280 500 ________ 1 215 500 × 100
= 28,6% = 23,1%
Comment• Theprofitmarginincreasedfrom30%onthecostpriceto40%on
thecostprice(or23%to28,6%onturnover). 2. Favourable Eventhoughtheprofitmarginishigher,thecostof salesdidnotdecrease
from2018to2019.Salesthereforedidnotdecrease. Thegrossprofit/salesamountishigherthanthepreviousyear. Theoperatingprofitishigherthanthepreviousyear.

243s e c t i o n 5 • c h a p t e r 8
3. Calculations:
348 870 ________ 1 363 600 × 100 ___ 1
= 25,6%
Comments• Thepercentageincreasedfrom23,4in2018to25,6%in2019.• Thecontrolisworsethanthepreviousyear.
4. Areasof concern:
• Damagedstockwrittenoff increasedfromR1000toR12000.• TradingstockdeficitincreasedfromR790toR8560.
Methodsof internalcontrol:(anyTHREE)• Divisionof dutiesshouldbeappliedwithemployeesworking
withstock.• Invoicesreceivedshouldbecomparedtostockdelivered.• Stockshouldbestoresinasafeplace.• Stockpurchasesandsalesshouldbeproperlyrecorded.
5. Whatwillalternativepremisescostandarethereanyavailable? Willtheylosecustomersif theymovethepremises?
6. Calculations: 221000:85000 =2,6:1
Comments• Theratiodecreasedfrom3:1in2018to2,6:1in2019.• Thereishoweverstill2,6assetsforevery1liability.• Theywillstillbeabletomeetshort-termobligations.
7. Calculations: 120000:249600 0,5:1
Comments• Theyarelowgearedandcreditworthy.• Theyshouldbeabletosecurealoan.
Informal assessment 8.1 LB page 286
Marks: 40 Time: 45 minutes1. Currentassets:Currentliabilities=128750✓:45881✓ =2,8:1✓
Comments• Theoperatingcapitalratiohasincreasedfrom1,9:1in2016to2,8:1
in2017.✓✓• Forevery1currentliabilitythereare2,8currentassets.✓✓• Thebusinessshouldbeabletomeetitsshort-termobligations.✓✓✓
[10]

244 s e c t i o n 5 • c h a p t e r 8
2.
Current account: Joubert
Drawings ✓ 60 890 Balance b/d ✓ 5 470
Balance c/d ✓ 2 450 Total earnings ✓ 57 870
63 340 63 340
Current account: Conradie
Balance b/d ✓ 2 740 Total earnings ✓ 81 180
Drawings ✓ 76 550
Balance c/d ✓ 1 890
81 180 81 180
[8]
3. Percentage earnings: Joubert ✓ 57 870 _____________________________
1 __ 2(200000+250000+5470+2450) × 100 ___ 1
✓ ✓ ✓
= 57 870 ______ 228960 × 100 ___ 1 ✓
= 25,3% ✓✓
Percentage earnings: Conradie ✓ 81 180 _____________________________
1 __ 2(250000+300000+1890–2740) × 100 ___ 1
✓ ✓ ✓
= 81 180 ______ 274 575 × 100 ___ 1 ✓
=29,6%✓✓
ConradiebenefitsalittlemorefromthebusinessthanJoubertdoes.[14]
4. Debtorscollectionperiod =averagedebtors/creditsales×365 ___ 1
✓ ✓ ✓
1 __ 2(20774+18972)
_______________ 189752 × 365 ___ 1 ✓
= 19873 ______ 189752 × 365 ___ 1 ✓
=38days✓
Thebusinesspractisesfairlygoodcreditcontrol.✓ Thebusinessshould,however,trytocollectdebtswithin30days.✓
[8]

245s e c t i o n 5 • c h a p t e r 8
Activity 8.7 (challenge) LB page 287
1. General Ledger of Ride ItBalance Sheet account
Dr Current account: Le Roux Cr
Date Details Fol. Amount Date Details Fol. Amount
2015 Jun 30 Drawings: Le Roux 97 000 00
2015 Jun 30 Salary: Le Roux 84 000 00
Balance c/d 22 425 00 Interest on capital 33 750 00
Appropriation account 1 675 00
119 425 00 119 425 00
2015 Jul 01 Balance c/d 22 425 00
2. Final account
Dr Appropriation account Cr
Date Details Fol. Amount Date Details Fol. Amount
2015 Jun 30 Interest on capital 101 250 00
2015 Jun 30 Profit and Loss 272 600 00
Salaries: Maree 84 000 00
Salaries: Le Roux 84 000 00
Current account: Maree 1 675 00
Current account: Le Roux 1 675 00
272 600 00 272 600 00
Interest on capitalMaree R450 000 × 15% = R67 500
LeRoux R200000×15%×6 __ 12 = R15 000 } R33 750 R250 000 × 15% × 6 __ 12 = R18 750
Salary: LeRoux/month 97000–6000 ___________ 13 = R7 000
Maree R84 000
3. Largercapital/Combinationof talentsandskills/Eliminatecompetition(anyONE)
4. Totalearnings:LeRoux R84000+33750+1675=R119425 Totalearnings:Maree R84000+67500+1675=R153175
5. Technicalskills/talents Competitioneliminated Advertisementsarefocusedononebusiness (Anyacceptableanswer)

246 s e c t i o n 5 • c h a p t e r 8
6. 272 600 _______________________________________________ 1 __ 2(450000+450000+250000+200000+69175+22425)
× 100 ___ 1
272 600 ______ 720 800 × 100 ___ 1
= 37,8%
7. a. %earnings:Maree 153 175 ________________________ 1 __ 2(450000+450000+69175)
× 100 ___ 1
153 175 _________ 484 587,50 × 100 ___ 1
= 31,6% %earnings:LeRoux 119425 ________________________
1 __ 2(200000+250000+22428) × 100 ___ 1
119425 _________ 236 212,50 × 100 ___ 1
= 50,6%
b. • Yes,hisreasonsarevalid.Hisearningshavedecreasedfrom R155 000 to R153 175.
• Hispercentageearningsarelessthanthoseof LeRoux.
c. Partnershipagreement• Mareeshouldreceivealargershareof thefinalprofit–he
investedmorecapital.• LeRoux’spercentageearningsarelargerthanMaree’s–thisis
unfair.• Theyshouldlaydownruleswithregardstodrawingsinthe
partnershipagreement.(Anyacceptablesolutiontotheproblem)

247s e c t i o n 5 • c h a p t e r 9
CHAPTER 9 Financial accounting of non-profit organisations – Clubs
Activity 9.1 LB page 296
Analysis Cash Book of Lingelihle Soccer Club for January to December 2019CASH RECEIPTS CASH PAYMENTS
Doc. no. Day Details
Analysis of
receipts BankMember-ship fees
Sundry accountsDoc. no. Day Details
Sundry accounts
Amount Details Bank Amount Detailsb/d 1/1 Bank balance 4 112 187 25/1 Silwana Suppliers 1 021 1 021 Refreshments34 20/1 R Seteni 400 400 188 31/1 Top Sport 460 460 Soccer balls
35 N Tuku 400 400 189 15/3 Hippo Rock 2 400 2 400Soccer jerseys
36 B Kwezi 400 400 190 16/5Green Finger Garden Service 1 500 1 500 Maintenance
37 K Bango 400 1 600 400 191 31/8 Municipality 345 345Water and electricity
38 10/3 N Tshiwo 400 400 192 13/9 EP Soccer Union 1 680 1 680Affiliation fees
39 B Madinge 600 400 200 Entrance fee 193 11/11 Silwana Suppliers 1 449 1 449 Refreshments40 W Butler 600 1 600 400 200 Entrance fee 194 22/11 M Tantsi 300 300 Honorarium
41 9/5 Tams Stores 1 800 1 800 1 800 Donation 195 30/11Green Finger Garden Service 1 500 1 500 Maintenance
42 22/5 J King 400 400 BS 31/12 SB Bank 129 129 Bank charges43 M Tantsi 400 400 c/d Bank balance 4 40744 A Xhaso 400 1 200 400BS 23/8 Cash 1 655 1 655 RefreshmentsBS 8/9 Cash 1 560 1 560 Soccer jerseysBS 1/12 Cash 1 664 1 664 Refreshments
15 191 4 000 15 191b/d 1/1 Bank balance 4 407

248 s e c t i o n 5 • c h a p t e r 9
Activity 9.2 LB page 298
1.–3.Analysis Cash Book of The Fish Eagle Angling Club for January to December 2019
CASH RECEIPTS CASH PAYMENTS
Doc. no. Day Details
Analysis of
receipts BankMember-ship fees
Sundry accountsDoc. no. Day Details
Sundry accounts
Amount Details Bank Amount Detailsb/d 1/1 Balance 3 254 119 26/1 Sportman’s Den 610 610 Fishing gear43 13/1 D Conradie 500 500 120 23/2 Makro 1 050 1 050 Refreshments44 C du Toit 500 500 121 19/3 KJ Sport 2 021 2 021 Fishing gear
45 S Stofberg 700 500 200 Entrance fee 122 21/4 EP Fishing Union 900 900Affiliation fees
46 J de Ridder 700 2 400 500 200 Entrance fee 123 16/7Dan the Handyman 600 600 Repairs
47 8/2 M Burger 500 500 124 19/10 Outdoor Shop 1 300 1 300 Prize giving48 D Nel 700 500 200 Entrance fee 125 22/10 King Catering 1 090 1 090 Prize giving
49 Y Xhaso 500 1 700 500 126 2/12 Municipality 1 589 1 589Water and electricity
50 21/2 L Ngwenya 2 000 2 000 2 000 Donation 127 6/12 D Conradie 350 350 Honorarium51 5/3 K Abrahams 500 500 BS 31/12 XY Bank 133 133 Bank charges52 D Swart 500 1000 500 c/d Balance 3 16553 25/8 L Pete 500 500 500
2/9 Cash 1 340 1 340 1 340 RefreshmentsBS 31/12 G Daniels 500 500
BS XY Bank 114 114
Interest on current account
12 808 12 808
b/d1/1
2020 Balance 3 165
4.Fish Eagle Angling Club Bank Reconciliation Statement on 31 December 2019
Debit Credit
credit balance as per bank statement 3 515 00
Debit outstanding cheque no.127 350 00
Debit balance of Bank account (as per analysis cash Book) 3 165 00
3 515 00 3 515 00
Activity 9.3 LB page 301
General Ledger of Ace Tennis Club
Dr Membership Fees Cr
Date Details Fol. Amount Date Details Fol. Amount
2012 Jan 01 Accrued income (13 × 180) 2 340 00
2012 Jan 01 Income received in advance (9 × 180) 1 620 00
Dec 31 Income received in advance (7 × 180) 1 260 00 Dec 31 Bank (1 800 + 13 140 + 1 260) 16 200 00
Income and expenditure 15 480 00Membership fees written off (2 340 – 1 800) 540 00
Accrued income (4 × 180) 720 00
19 080 00 19 080 00

249s e c t i o n 5 • c h a p t e r 9
Activity 9.4 LB page 302
General Ledger of Umzinyathi Canoe Club
Dr Membership Fees Cr
Date Details Fol. Amount Date Details Fol. Amount
2019 Jan 01 Accrued income (9 × 480) 4 320 00
2019 Jan 01 Income received in advance (3 × 480) 1 440 00
Dec 31 Bank (480 × 3 __ 12 ) 120 00 Dec 31 Bank 58 080 00
Income received in advance (10 × 480) 4 800 00
Membership fees written off (4 320 – 2 400) 1 920 00
Income and expenditure 53 160 00 Accrued income (2 × 480) 960 00
62 400 00 62 400 00
Calculation of Income and Expenditure amountEx-members: 100 – 4 (members written off ) → 96 × R480 46 080 15 new members → 15 × R480 7 200 3 months’ membership fees paid back (120) 53 160
ProcedureFill in all the amounts and work back to Bank on the credit side.
Activity 9.5 LB page 302
General Ledger of Giant Cycling Club
Dr Membership Fees Cr
Date Details Fol. Amount Date Details Fol. Amount
2013 Jan 01 Accrued income (15 × R100) 1 500 00
2013 Jan 01
Income received in advance (3 × R100 × 8) 2 400 00
Dec 31Income received in advance (6 × R100) 600 00 Dec 31 Bank 83 000 00
Income and expenditure *86 000 00 Accrued income **2 700 00
88 100 00 88 100 00
ProcedureFill in all the amounts in and work back to the Bank amount on the credit side.
Calculation of Income and Expenditure amount1 Jan–31 Oct [70 members × (R100 × 10 month)] 70 000Nov [(70 members + l0 new members) × R100] 8 000Dec [80 members × R100] 8 000 *86 000
Calculation of the Accrued Income amount on the credit sideAll membership fees up to October have been receivedNovember (80 members – 68 received) × R100 1 200December (80 members – 65 received) × R100 1 500 **2 700

250 s e c t i o n 5 • c h a p t e r 9
Activity 9.6 LB page 303
General Ledger of Image Photo Club
Dr Membership Fees Cr
Date Details Fol. Amount Date Details Fol. Amount
2020 Mar 01 Accrued income (9 × 450) 4 050 00
2020 Mar 01 Income received in advance (3 × 450) 1 350 00
2021 Feb 28 Income received in advance (2 × 450) 900 00
2021 Feb 28
Bank – 2020: (4 × 450)
2021: {[(229 + 10) × 450] – 1 350}
2022: (2 × 450)
1 800
106 200
900
00
00
00
Income and expenditure 112 500 00Membership fees written off (5 × 450) 2 250 00
Honorarium 450 00
Accrued income 4 500 00
117 450 00 117 450 00
ProcedureFill in all the amounts and work back to Accrued income on the credit side.
Calculation of Income and Expenditure amountEx-members (245 – 5) × R450 108 00010 new members × R450 4 500 112 500

251s e c t i o n 5 • c h a p t e r 9
Activity 9.7 LB page 306
1.Golden Gate Cycling ClubStatement of Receipts and Payments for the year ended 31 December 2019
Note R
RECEIPTS 50 701
Membership fees (900 + 2 500 + 600) 24 000
entrance fees 2 000
Dinner 8 000
Donations 2 690
Sale of refreshments 5 887
cycling gear 7 900
Interest on savings account 224
PAYMENTS (46 954)
Dinner 6 560
purchase of refreshments 3 690
cycling gear 8 400
honorarium 500
affiliation fees 8 000
Bank charges 1 104
prizes for achievers 2 100
equipment 4 200
rental expense 2 400
Fixed deposit 10 000
Surplus (deficit) for the year 3 747
Opening balances 6 199
Bank 1 879
Savings account 4 320
Closing balances 9 946
Bank 5 402
Savings account 4 544

252 s e c t i o n 5 • c h a p t e r 9
2. General Ledger of Golden Gate Cycling ClubNominal acconts
Dr Membership Fees Cr
Date Details Fol. Amount Date Details Fol. Amount
2019 Jan 01 Accrued income 900 00
2019 Jan 01 Income received in advance 300 00
Dec 31 Income received in advance 600 00 Dec 31 Bank (900 + 22 500 + 600) 24 000 00
Income and expenditure 23 100 00 Accrued income 300 00
24 600 00 24 600 00
Dr Refreshments Cr
Date Details Fol. Amount Date Details Fol. Amount
2019 Dec 31 Bank 3 690 00
2019 Dec 31 Bank 5 887 00
Profit on sale of refreshments 2 197 00
5 887 00 5 887 00
Dr Club Cycling Gear Cr
Date Details Fol. Amount Date Details Fol. Amount
2019 Dec 31 Bank 8 400 00
2019 Dec 31 Bank 7 900 00
Profit on sale of cycling gear 700 00 Cycling gear on hand 1 200 00
9 100 00 9 100 00

253s e c t i o n 5 • c h a p t e r 9
Activity 9.8 LB page 307
1.Rovers Tennis ClubStatement of Receipts and Payments for the year ended 31 December 2020
Note R
RECEIPTS 117 076
Membership fees (960 + 28 320 + 720) 30 000
entrance fees (10 × r50) 500
Sale of refreshments 9 870
Function 9 450
tournament 1 980
Donations 5 000
Interest on savings account 276
Loan: aB Bank 60 000
PAYMENTS (55 002)
purchase of refreshments 5 972
Stationery 320
affiliation 12 000
Wages 9 900
honorarium 700
rental expense (11 × r300) 3 300
Function 5 980
tournament 1 241
tennis balls 5 400
equipment 1 890
Water and electricity 3 744
repairs 340
creditors 1 965
Interest on loan 2 250
Surplus (deficit) for the year 62 074
Opening balances 4 700
Bank 700
Savings account 4 000
Closing balances 66 774
Bank 62 498
Savings account 4 276

254 s e c t i o n 5 • c h a p t e r 9
2. General Ledger of Rovers Tennis ClubNominal accounts
Dr Membership Fees Cr
Date Details Fol. Amount Date Details Fol. Amount
2020 Jan 01 Accrued income 1 200 00
2020 Jan 01 Income received in advance 480 00
Dec 31 Income received in advance 720 00 Dec 31
Bank 2019 2020 2021
960 28 320
720
00 00 00
Income and expenditure [(120 – 1 + 10) × R240] 30 960 00 Membership fees written off 240 00
Accrued income 2 160 00
32 880 00 32 880 00
Dr Refreshments Cr
Date Details Fol. Amount Date Details Fol. Amount
2020 Jan 01 Refreshments on hand 564 00
2020 Dec 31 Bank 9 870 00
Dec 31 Bank 5 972 00 Refreshments on hand 674 00
Profit on sale of refreshments 4 008 00
10 544 00 10 544 00
Dr Stationery Cr
Date Details Fol. Amount Date Details Fol. Amount
2020 Dec 31 Bank 320 00
2020 Dec 31 Stationery on hand 54 00
Creditors 113 00 Income and expenditure 379 00
433 00 433 00
Dr Honorarium Cr
Date Details Fol. Amount Date Details Fol. Amount
2020 Dec 31 Bank 700 00
2020 Dec 01 Accrued expenses 100 00
31 Income and expenditure 600 00
700 00 700 00

255s e c t i o n 5 • c h a p t e r 9
Activity 9.9 LB page 309
1.Fish River Canoe ClubStatement of Receipts and Payments for the year ended 31 December 2021
Note R
RECEIPTS 129 262
Membership fees (600 + 11 880 + 720) 13 200
entrance fees (8 × r60) 480
Loan: XYZ Bank (01/01/2021) 70 000
Interest on savings account 215
Sale of refreshments 11 567
Bequest 30 000
competition entries 3 800
PAYMENTS (99 908)
equipment (01/07/2021) 1 900
honorarium 170
affiliation fees 5 400
repairs 700
Land and Buildings 62 000
Loan (01/07/2021) 10 000
Interest on loan 7 500
Insurance (r200 × 12) 2 400
Bank charges 331
purchase of refreshments 4 652
creditors 1 963
Water and electricity 2 892
Surplus (deficit) for the year 29 354
Opening balances 3 614
Bank 1 014
Savings account 2 600
Closing balances 32 968
Bank 30 153
Savings account 2 815

256 s e c t i o n 5 • c h a p t e r 9
2. General Ledger of Fish River Canoe ClubNominal accounts
Dr Membership Fees Cr
Date Details Fol. Amount Date Details Fol. Amount
2021 Jan 01 Accrued income 900 00
2021 Jan 01 Income received in advance 660 00
Dec 31 Income received in advance 720 00 Dec 31 Bank: 2020 600 00
Income and expenditure 13 860 00 2021 11 880 00
2022 720 00
Membership fees written off 300 00
Accrued income 990 00
Honorarium 330 00
15 480 00 15 480 00
Dr Refreshments Cr
Date Details Fol. Amount Date Details Fol. Amount
2021 Jan 01 Refreshments on hand 246 00
2021 Dec 31 Bank 11 567 00
Dec 31 Bank 4 652 00 Debtors for refreshments 230 00
Creditors 2 134 00 Refreshments on hand 336 00
Profit on sale of refreshments 5 101 00
12 133 00 12 133 00
Dr Honorarium Cr
Date Details Fol. Amount Date Details Fol. Amount
2021 Dec 31 Membership fees 330 00
2021 Dec 01 Accrued expenses 500 00
Bank 170 00 31 Income and expenditure 700 00
Accrued expenses 700 00
1 200 00 1 200 00
Activity 9.10 LB page 323
1. General Ledger of Fish River Canoe ClubNominal accounts
Dr Competition Entries Cr
Date Details Fol. Amount Date Details Fol. Amount
2021 Dec 31 Income and expenditure 3 800 00
2021 Dec 31 Bank 3 800 00
Dr Entrance Fees Cr
Date Details Fol. Amount Date Details Fol. Amount
2021 Dec 31 Income and expenditure 480 00
2021 Dec 31 Bank 480 00
Dr Affiliation Fees Cr
Date Details Fol. Amount Date Details Fol. Amount
2021 Dec 31 Bank 5 400 00
2021 Dec 31 Income and expenditure 5 400 00

257s e c t i o n 5 • c h a p t e r 9
Dr Repairs Cr
Date Details Fol. Amount Date Details Fol. Amount
2021 Dec 31 Bank 700 00
2021 Dec 31 Income and expenditure 700 00
Dr Interest on Loan Cr
Date Details Fol. Amount Date Details Fol. Amount
2021 Dec 31 Bank 7 500 00
2021 Dec 31 Income and expenditure 9 750 00
Accrued expenses 2 250 00
9 750 00 9 750 00
CalculationsR70 000 × 15% × 6 __ 12 = R5 250
R60 000 × 15% × 6 __ 12 = R4 500 R9 750
Dr Insurance Cr
Date Details Fol. Amount Date Details Fol. Amount
2021 Dec 31 Bank 2 400 00
2021 Dec 31 Income and expenditure 2 400 00
Dr Interest on Savings Cr
Date Details Fol. Amount Date Details Fol. Amount
2021 Dec 31 Income and expenditure 215 00
2021 Dec 31 Savings account 215 00
Dr Bank Charges Cr
Date Details Fol. Amount Date Details Fol. Amount
2021 Dec 31 Bank 331 00
2021 Dec 31 Income and expenditure 331 00
Dr Water and Electricity Cr
Date Details Fol. Amount Date Details Fol. Amount
2021 Dec 31 Bank 2 892 00
2021 Dec 31 Income and expenditure 3 133 00
Accrued expenses 241 00
3 133 00 3 133 00
Dr Depreciation Cr
Date Details Fol. Amount Date Details Fol. Amount
2021 Dec 31
Accumulated depreciation on equipment 567 00
2021 Dec 31 Income and expenditure 567 00
CalculationsOld equipment: (R6 700 – 1 980) × 10% R472
New equipment: R1 900 × 10% × 6 __ 12 R 95 R567

258 s e c t i o n 5 • c h a p t e r 9
Dr Membership Fees Written Off Cr
Date Details Fol. Amount Date Details Fol. Amount
2021 Dec 31 Membership fees 300 00
2021 Dec 31 Income and expenditure 300 00
Dr Profit on Sale of Refreshments Cr
Date Details Fol. Amount Date Details Fol. Amount
2021 Dec 31 Income and expenditure 5 101 00
2021 Dec 31 Refreshments 5 101 00
Balance Sheet accounts
Dr Accumulated Funds Cr
Date Details Fol. Amount Date Details Fol. Amount
2021 Jan 01 Balance b/d 106 357 00
Dec 31 Bequest 30 000 00
136 357 00
Dr Clubhouse Cr
Date Details Fol. Amount Date Details Fol. Amount
2021 Jan 01 Balance b/d 100 000 00
Dec 31 Bank 62 000 00
162 000 00
Dr Equipment Cr
Date Details Fol. Amount Date Details Fol. Amount
2021 Jan 01 Balance b/d 6 700 00
Jul 01 Bank 1 900 00
8 600 00
Dr Accumulated Depreciation on Equipment Cr
Date Details Fol. Amount Date Details Fol. Amount
2021 Jan 01 Balance b/d 1 980 00
Dec 31 Depreciation 567 00
2 547 00
Dr Accrued Income Cr
Date Details Fol. Amount Date Details Fol. Amount
2021 Jan 01 Balance b/d 900 00
2021 Jan 01 Membership Fees 900 00
Dec 31 Membership fees 990 00

259s e c t i o n 5 • c h a p t e r 9
Dr Income Received in Advance Cr
Date Details Fol. Amount Date Details Fol. Amount
2021 Jan 01 Membership fees 660 00
2021 Jan 01 Balance b/d 660 00
Dec 31 Membership fees 720 00
Dr Refreshments on Hand Cr
Date Details Fol. Amount Date Details Fol. Amount
2021 Jan 01 Balance b/d 246 00
2021 Jan 01 Refreshments 246 00
Dec 31 Refreshments 336 00
Dr Accrued Expenses Cr
Date Details Fol. Amount Date Details Fol. Amount
2021 Jan 01 Honorarium 500 00
2021 Jan 01 Balance b/d 500 00
Dec 31 Honorarium 700 00
Interest on loan 2 250 00
Water and electricity 241 00
3 191 00
Dr Creditors Cr
Date Details Fol. Amount Date Details Fol. Amount
2021 Dec 31 Bank 1 963 00
2021 Jan 01 Balance b/d 1 963 00
Balance c/d 2 134 00 Dec 31 Refreshments 2 134 00
4 097 00 4 097 00
2022 Jan 01 Balance b/d 2 134 00
Dr Debtors Cr
Date Details Fol. Amount Date Details Fol. Amount
2021 Dec 31 Refreshments 230 00
Dr Loan: XYZ Bank Cr
Date Details Fol. Amount Date Details Fol. Amount
2021 Dec 31 Bank 10 000 00
2021 Jan 01 Bank 70 000 00
Balance c/d 60 000 00
70 000 00 70 000 00
2022 Jan 01 Balance b/d 60 000 00
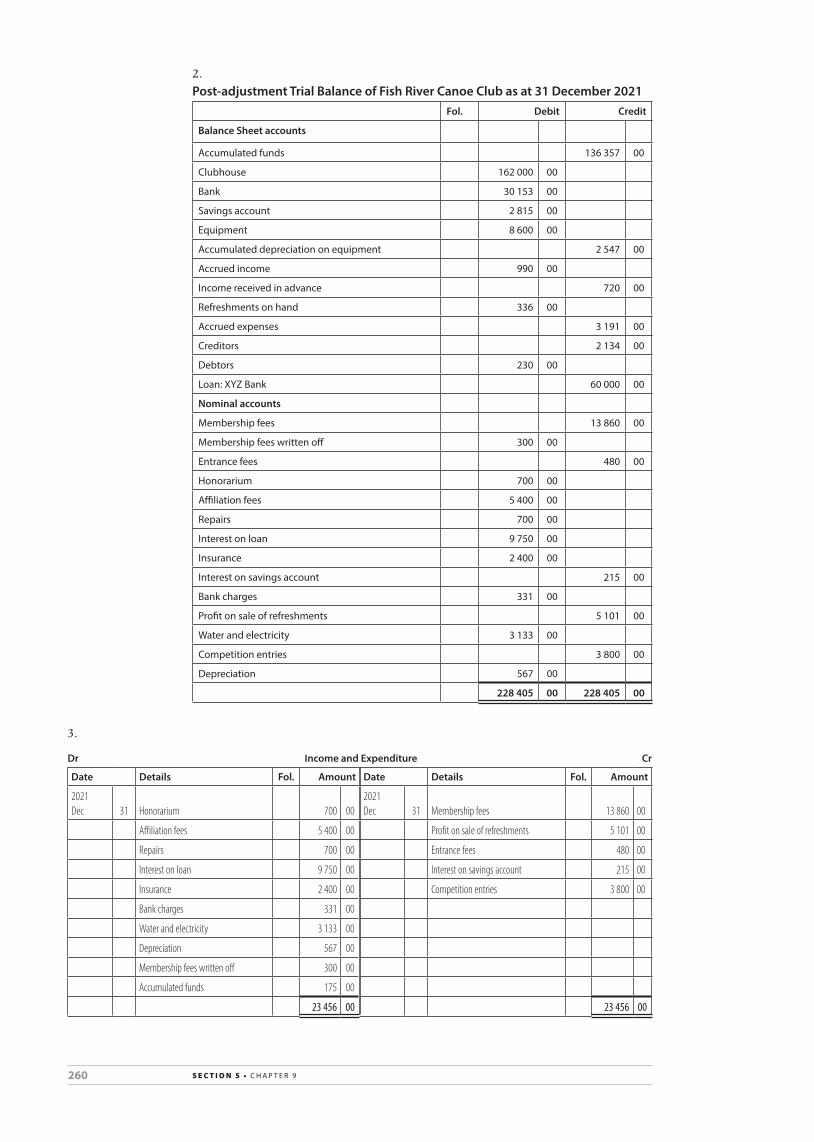
260 s e c t i o n 5 • c h a p t e r 9
2.Post-adjustment Trial Balance of Fish River Canoe Club as at 31 December 2021
Fol. Debit Credit
Balance Sheet accounts
accumulated funds 136 357 00
clubhouse 162 000 00
Bank 30 153 00
Savings account 2 815 00
equipment 8 600 00
accumulated depreciation on equipment 2 547 00
accrued income 990 00
Income received in advance 720 00
refreshments on hand 336 00
accrued expenses 3 191 00
creditors 2 134 00
Debtors 230 00
Loan: XYZ Bank 60 000 00
Nominal accounts
Membership fees 13 860 00
Membership fees written off 300 00
entrance fees 480 00
honorarium 700 00
affiliation fees 5 400 00
repairs 700 00
Interest on loan 9 750 00
Insurance 2 400 00
Interest on savings account 215 00
Bank charges 331 00
profit on sale of refreshments 5 101 00
Water and electricity 3 133 00
competition entries 3 800 00
Depreciation 567 00
228 405 00 228 405 00
3.
Dr Income and Expenditure Cr
Date Details Fol. Amount Date Details Fol. Amount
2021 Dec 31 Honorarium 700 00
2021 Dec 31 Membership fees 13 860 00
Affiliation fees 5 400 00 Profit on sale of refreshments 5 101 00
Repairs 700 00 Entrance fees 480 00
Interest on loan 9 750 00 Interest on savings account 215 00
Insurance 2 400 00 Competition entries 3 800 00
Bank charges 331 00
Water and electricity 3 133 00
Depreciation 567 00
Membership fees written off 300 00
Accumulated funds 175 00
23 456 00 23 456 00

261s e c t i o n 5 • c h a p t e r 9
4.Post-closing Trial Balance of Fish River Canoe Club as at 31 December 2021
Fol. Debit Credit
Balance Sheet accounts
accumulated funds 136 532 00
clubhouse 162 000 00
Bank 30 153 00
Savings account 2 815 00
equipment 8 600 00
accumulated depreciation on equipment 2 547 00
accrued income 990 00
Income received in advance 720 00
refreshments on hand 336 00
accrued expenses 3 191 00
creditors 2 134 00
Debtors 230 00
Loan: XYZ Bank 60 000 00
205 124 00 205 124 00
Activity 9.11 LB page 324
1. General Ledger of Lingelihle Soccer ClubBalance Sheet accounts
Dr Accumulated Funds Cr
Date Details Fol. Amount Date Details Fol. Amount
2019 Jan 01 Balance b/d 199 944 00
Dec 31 Income and expenditure 599 00
200 543 00
Dr Equipment Cr
Date Details Fol. Amount Date Details Fol. Amount
2019 Jan 01 Balance b/d 10 300 00
May 01 Bank 3 000 00
13 300 00
Dr Accumulated Depreciation on Equipment Cr
Date Details Fol. Amount Date Details Fol. Amount
2019 Jan 01 Balance b/d 2 600 00
Dec 31 Depreciation 970 00
3 570 00
Calculations(R10 300 – 2 600) × 10% R770
R3 000 × 10% × 8 __ 12 R200 R970

262 s e c t i o n 5 • c h a p t e r 9
Dr Savings account Cr
Date Details Fol. Amount Date Details Fol. Amount
2019 Jan 01 Balance b/d 4 000 00
2019 Dec 31 Fixed deposit: Best Bank 3 000 00
Dec 31 Interest on savings account 134 00 Balance c/d 1 134 00
4 134 00 4 134 00
2020 Jan 01 Balance b/d 1 134 00
Dr Fixed Deposit: Best Bank Cr
Date Details Fol. Amount Date Details Fol. Amount
2019 Dec 31 Savings account 3 000 00
Bank 2 000 00
5 000 00
Dr Creditors Cr
Date Details Fol. Amount Date Details Fol. Amount
2019 Dec 31 Bank 997 00
2019 Dec 31 Stationery 198 00
Balance c/d 188 00 Sports day 987 00
1 185 00 1 185 00
2020 Jan 01 Balance b/d 188 00
Dr Accrued Expenses Cr
Date Details Fol. Amount Date Details Fol. Amount
2019 Jan 01 Wages 400 00
2019 Jan 01 Balance b/d 400 00
2019 Dec 31 Water and electricity 189 00
Honorarium 780 00
969 00
Dr Accrued Income Cr
Date Details Fol. Amount Date Details Fol. Amount
2019 Jan 01 Balance b/d 720 00
2019 Jan 01 Membership fees 720 00
Dec 31 Membership fees 720 00
Dr Income Received in Advance Cr
Date Details Fol. Amount Date Details Fol. Amount
2019 Jan 01 Membership fees 240 00
2019 Jan 01 Balance b/d 240 00
Dec 31 Membership fees 360 00
Dr Prepaid Expenses Cr
Date Details Fol. Amount Date Details Fol. Amount
2019 Jan 01 Balance b/d 1 000 00
2019 Jan 01 Rates 1 000 00
Dec 31 Affiliation fees 1 120 00
Rates 1 200 00
2 320 00

263s e c t i o n 5 • c h a p t e r 9
Dr Refreshments on Hand Cr
Date Details Fol. Amount Date Details Fol. Amount
2019 Jan 01 Balance b/d 384 00
2019 Jan 01 Refreshments 384 00
Dec 31 Refreshments 578 00
Nominal accounts
Dr Entrance Fees B6 Cr
Date Details Fol. Amount Date Details Fol. Amount
2019 Dec 31 Income and expenditure 400 00
2019 Dec 31 Bank 400 00
Dr Membership Fees Cr
Date Details Fol. Amount Date Details Fol. Amount
2019 Jan 01 Accrued income 720 00
2019 Jan 01 Income received in advance 240 00
Dec 31 Income received in advance 360 00 Dec 31 Bank 6 240 00
Income and expenditure 6 360 00 Membership fees written off 240 00
Accrued income 720 00
7 440 00 7 440 00
Dr Stationery Cr
Date Details Fol. Amount Date Details Fol. Amount
2019 Dec 31 Bank 165 00
2019 Dec 31 Income and expenditure 363 00
Creditors 198 00
363 00 363 00
Dr Refreshments Cr
Date Details Fol. Amount Date Details Fol. Amount
2019 Jan 01 Refreshments on hand 384 00
2019 Dec 31 Bank 11 562 00
Dec 31 Bank 6 447 00 Catering 460 00
Profit on sale of refreshments 5 769 00 Refreshments on hand 578 00
12 600 00 12 600 00
Dr Wages Cr
Date Details Fol. Amount Date Details Fol. Amount
2019 Dec 31 Bank 7 200 00
2019 Jan 01 Accrued expenses 400 00
Income and expenditure 6 800 00
7 200 00 7 200 00
Dr Affiliation Fees Cr
Date Details Fol. Amount Date Details Fol. Amount
2019 Dec 31 Bank 3 370 00
2019 Dec 31 Prepaid expenses 1 120 00
Income and expenditure 2 250 00
3 370 00 3 370 00

264 s e c t i o n 5 • c h a p t e r 9
Dr Rates and Taxes Cr
Date Details Fol. Amount Date Details Fol. Amount
2019 Jan 01 Prepaid expenses 1 000 00
2019 Dec 31 Prepaid expenses 1 200 00
Dec 31 Bank 2 400 00 Income and expenditure 2 200 00
3 400 00 3 400 00
R2 400 × 6 __ 12 = R1 200
Dr Sports Day Cr
Date Details Fol. Amount Date Details Fol. Amount
2019 Dec 31 Bank 6 221 00
2019 Dec 31 Bank 11 564 00
Creditors 987 00
Income and expenditure 4 356 00
11 564 00 11 564 00
Dr Interest on Fixed Deposit Cr
Date Details Fol. Amount Date Details Fol. Amount
2019 Dec 31 Income and expenditure 100 00
2019 Dec Bank 100 00
R5 000 × 8% × 3 __ 12 = R100
Dr Interest on Savings Account Cr
Date Details Fol. Amount Date Details Fol. Amount
2019 Dec 31 Income and expenditure 134 00
2019 Dec 31 Savings account 134 00
Dr Water and Electricity Cr
Date Details Fol. Amount Date Details Fol. Amount
2019 Dec 31 Bank 2 268 00
2019 Dec 31 Income and expenditure 2 457 00
Accrued expenses 189 00
2 457 00 2 457 00
Dr Honorarium Cr
Date Details Fol. Amount Date Details Fol. Amount
2019 Dec 31 Accrued expenses 780 00
2019 Dec 31 Income and expenditure 780 00
Dr Depreciation Cr
Date Details Fol. Amount Date Details Fol. Amount
2019 Dec 31
Accumulated depreciation on equipment 970 00
2019 Dec 31 Income and expenditure 970 00
Dr Membership Fees Written Off Cr
Date Details Fol. Amount Date Details Fol. Amount
2019 Dec 31 Membership fees 240 00
2019 Dec 31 Income and expenditure 240 00

265s e c t i o n 5 • c h a p t e r 9
Dr Catering Cr
Date Details Fol. Amount Date Details Fol. Amount
2019 Dec 31 Refreshments 460 00
2019 Dec 31 Income and expenditure 460 00
Dr Profit on Sale of Refreshments Cr
Date Details Fol. Amount Date Details Fol. Amount
2019 Dec 31 Income and expenditure 5 769 00
2019 Dec 31 Refreshments 5 769 00
2.Lingelihle Soccer ClubStatement of Receipts and Payments for the year ended 31 December 2019
Note R
RECEIPTS 30 000
entrance fees (10 × r40) 400
Membership fees (480 + 5 400 + 360) 6 240
Sale of refreshments 11 562
Sports day 11 564
Interest on fixed deposit 100
Interest on savings account 134
PAYMENTS (37 068)
Stationery 165
purchase of refreshments 6 447
Wages 7 200
affiliation fees 3 370
equipment (01/05/2020) 3 000
rates 2 400
Sports day 6 221
Fixed deposit: Best Bank 5 000
creditors 997
Water and electricity 2 268
Surplus (deficit) for the year (7 068)
Opening balances 10 780
Bank 6 780
Savings account 4 000
Closing balances 3 712
Bank 2 578
Savings account 1 134

266 s e c t i o n 5 • c h a p t e r 9
3.Dr Income and Expenditure Cr
Date Details Fol. Amount Date Details Fol. Amount
2019 Dec 31 Membership fees written off 240 00
2019 Dec 31 Membership fees 6 360 00
Depreciation 970 00 Entrance fee 400 00
Catering 460 00 Profit on sale of refreshments 5 769 00
Stationery 363 00 Profit from sports day 4 356 00
Wages 6 800 00 Interest income 234 00
Affiliation fees 2 250 00
Rates 2 200 00
Water and electricity 2 457 00
Honorarium 780 00
Accumulated funds 599 00
17 119 00 17 119 00
4.Post-closing Trial Balance of Lingelihle Soccer Club as at 31 December 2019
Fol. Debit Credit
Balance Sheet accounts
accumulated funds 200 543 00
Land and buildings 180 000 00
equipment 13 300 00
accumulated depreciation on equipment 3 570 00
Savings account 1 134 00
current bank account 2 578 00
Fixed deposit: Best Bank 5 000 00
creditors 188 00
accrued expenses 969 00
accrued income 720 00
Income received in advance 360 00
prepaid expenses 2 320 00
refreshments on hand 578 00
205 630 00 205 630 00

267s e c t i o n 5 • c h a p t e r 9
Activity 9.12 LB page 325
General Ledger of Sunshine Coast Sports Club
Dr Accumulated Funds Cr
Date Details Fol. Amount Date Details Fol. Amount
2012 Jan 01 Balance b/d 9 844 00
Dec 31 Donation 10 000 00
Income and expenditure 5 047 00
24 891 00
Dr Membership Fees Cr
Date Details Fol. Amount Date Details Fol. Amount
2012 Jan 01 Accrued income 720 00
2012 Jan 01 Income received in advance 1 920 00
Dec 31 Income received in advance 1 200 00 Dec 31 Bank (240 + 11 280 + 1 200) 12 720 00
Bank 120 00 Membership fees written off 480 00
Donations 120 00 Honorarium 240 00
Income and expenditure 14 880 00 Accrued income 1 680 00
17 040 00 17 040 00
Calculate the Income and expenditure amount and work back to Accrued income:(55 + 10 new members – 2 members written off ) × R240 R15 120Members transferred (2 × R120) R (240) R14 880
Dr Tuck Shop Cr
Date Details Fol. Amount Date Details Fol. Amount
2012 Jan 01 Tuck shop stock 2 640 00
2012 Dec 31 Bank 20 250 00
Dec 31 Creditors 3 978 00 Debtors for tuck shop 1 042 00
Bank 12 510 00 Tuck shop stock 2 996 00
Donations 1 400 00
Profit from tuck shop 3 760 00
24 288 00 24 288 00
Dr Tracksuits Cr
Date Details Fol. Amount Date Details Fol. Amount
2012 Jan 01 Tracksuits on hand 8 750 00
2012 Dec 31 Bank 17 250 00
Dec 31 Bank 6 250 00 Prices (R250 × 2) 500 00
Profit on sale of tracksuits *5 750 00 Tracksuits on hand **3 000 00
20 750 00 20 750 00
* R17 250 × 50 ___ 150
** (35 + 25 – 2 – 46) × 250 = R3 000
Selling price of tracksuits: R250 × 150 ___ 100 = R375

268 s e c t i o n 5 • c h a p t e r 9
Dr Honorarium Cr
Date Details Fol. Amount Date Details Fol. Amount
2012 Dec 31 Membership fees 240 00
2012 Jan 01 Accrued expenses 400 00
Bank 160 00 Dec 31 Income and expenditure 500 00
Accrued expenses 500 00
900 00 900 00
Informal assessment 9.1 LB page 327
Marks: 25 Time: 20 minutes
General Ledger of Kenton Sports Club
Dr Membership Fees Cr
Date Details Fol. Amount Date Details Fol. Amount
2016 Sep 01 Accrued income ✓ ✓ 750 00
2016 Sep 01 Income received in advance ✓ ✓ 500 00
2017 Aug 31 Income received in advance ✓ ✓ 1 250 00
2017 Aug 31 Bank ✓ ✓ 31 250 00
Income and expenditure ✓ ✓ 32 500 00 Membership fees written off ✓ ✓ 250 00
Accrued income ✓ ✓ 2 500 00
34 500 00 ✓ 34 500 00
[15]
Dr Refreshments B6 Cr
Date Details Fol. Amount Date Details Fol. Amount
2016 Sep 01 Refreshments on hand ✓ ✓ 385 00
2017 Aug 31 Bank ✓ ✓ 65 400 00
2017 Aug 31 Bank ✓ ✓ 21 700 00 Refreshments on hand ✓ ✓ 300 00
Profit on sale of refreshments ✓ ✓ 43 615 00
65 700 00 65 700 00
[10]

269s e c t i o n 5 • c h a p t e r 9
Activity 9.13 LB page 328
No. Statement of Receipts and Payments Income and Expenditure Statement
Receipts Payments Income Expenditure
1. 20 000
2. 600 10 000 800
3. 5 800 6 300 400
4. 8 772 5 332 2 449
5. 2 978
6. 1 240
7. 600 1 100
8. 9 700 9 000
T-accounts and calculations
2.Interest on Fixed Deposit
I + E 800 Bank 600
AI 200
800 800
3.Membership Fees
01 Jan Acc. income 1 200 01 Jan Income received in advance 900
31 Dec Income received in advance 600 31 Dec Bank – 2011 *800
– 2012 4 400
6 300 – 2013 600
Mem. fees wr. off 400
Accrued income 1 000
8 100 8 100
4.Refreshments
01 Jan Refr. on hand 389 01 Jan Bank 8 772
31 Dec Bank 5 332 31 Dec Refr. on hand 422
Credit 1 024
Profit 2 449
9 194 9 194
8.Affiliation Fees
Bank 9 700 01 Jan Acc. exp. 700
Accum. exp. 31 Dec I + E 9 000
9 700 9 700

270 s e c t i o n 5 • c h a p t e r 9
Activity 9.14 LB page 329
No. Statement of Receipts and Payments Income and Expenditure Statement
Receipts Payments Income Expenditure
1. 139 500 141 000 15 000
2. 9 000 5 400
3. 1 605 1 110 375 100
4. 5 640 640
5. 4 890 4 480 4 710
6. 6 250 2 000
7. 50 250 2 050
8. 84 84
9. 3 400 2 250 950
10. 740
11. 266 435
12. 2 000 2 400
13. 4 480 * 480
14. 10 000
15. 1 500
16. 880 58
* Interest on loanR4 000 × 18% × 8 __ 12 = R480
T-accounts and calculations
1.Membership Fees
01 Jan Acc. income 2 500 01 Jan Income received in advance 1 500
31 Dec Income received in advance 3 000 31 Dec Bank 139 500
141 000 Mem. fees wr. off 1 500
Acc. income 4 000
146 500 146 500
2.Entrance Fees
31 Dec Accum. funds 3 600 31 Dec Bank 9 000
Inc. exp. 5 400
9 000 9 000
3.Refreshments
01 Jan Refr. on hand 360 31 Dec Bank 1 605
31 Dec Bank 1 110 Don. exp. 100
I + E 375 Refr. on hand 140
1 845 1 845

271s e c t i o n 5 • c h a p t e r 9
5.Sports Day
31 Dec Bank 4 480 31 Dec Bank 4 890
Acc. exp. 700 Acc. income 5 000
I + E 4 710
9 890 9 890
6.Affiliation Fees
31 Dec Bank 6 250 01 Jan Acc. exp. 1 750
31 Dec PE 2 500
I + E 2 000
6 250 6 250
7.Tennis Balls
01 Jan Ten. on hand 500 31 Dec Bank 50
31 Dec Credit 1 480 T/balls on hand 130
Comp. 250 I + E 2 050
2 230 2 230
9.Club Tracksuits
01 Jan Club tr. suits on hand 1 500 31 Dec Bank 3 400
31 Dec Bank 2 250 Debtors 400
I + E 950 Club tr. suits on hand 900
4 700 4 700
11.Stationery
01 Jan Stationery on hand 135 31 Dec Stationery on hand 123
31 Dec Bank 266 I + E 435
Creditors 157
558 558

272 s e c t i o n 5 • c h a p t e r 9
Activity 9.15 (challenge) LB page 331
1. General Ledger of Egoli Judo Club
Dr Membership Fees Cr
Date Details Fol. Amount Date Details Fol. Amount
2012 Jul 01 Accrued income 720 00
2012 Jul 01 Income received in advance 1 680 00
Dec 31 Income received in advance 1 440 00 Dec 31 Bank 26 640 00
Bank 240 00 Membership fees written off 480 00
Income and expenditure 27 600 00 Accrued income 1 200 00
30 000 00 30 000 00
Dr Tracksuits Cr
Date Details Fol. Amount Date Details Fol. Amount
2012 Jan 01 Inventory: tracksuits 5 750 00
2012 Dec 31 Bank 18 216 00
Dec 31 Bank 9 200 00 Creditors 460 00
Creditors 4 600 00 Development 690 00
Profit from tracksuits 3 036 00 Stock of tracksuits 3 220 00
22 586 00 22 586 00
2. a. Profit = R276 – 230 = R46
Profit percentage = 46 ___ 230 × 100 ___ 1
= 20%
b. 108 + 10 – 2 – 1 = 115
or
27 600 ______ 249 = 115
c. 35 889 ______ 115 = R312,07
R313 – 240 = R73
Therefore the membership fees should increase by R73.
d. 35 889 ______ 240 = 149,5
150 – 115 = 35 new members
e. Any fundraising project e.g. sponsorship, donations, refreshments, functions

273s e c t i o n 5 • c h a p t e r 9
Activity 9.16 (working backwards) (for enrichment only) LB page 333
1. General Ledger of Cheetah Sports Club
Dr Membership Fees Cr
Date Details Fol. Amount Date Details Fol. Amount
2013 Jul 01 Accrued income 1 000 00
2013 Jul 01 Income received in advance 750 00
Dec 31 Income received in advance 500 00 Dec 31 Bank 15 500 00
Income and expenditure 15 750 00 Membership fees written off 250 00
Accrued income 750 00
17 250 00 17 250 00
Dr Telephone Cr
Date Details Fol. Amount Date Details Fol. Amount
2013 Dec 31 Bank 2 646 00
2013 Jan 01 Accrued expenses 193 00
Accrued expenses 211 00 Dec 31 Income and expenditure 2 664 00
2 857 00 2 857 00
Dr Insurance Cr
Date Details Fol. Amount Date Details Fol. Amount
2013 Jan 01 Prepaid expenses 185 00
2013 Dec 31 Prepaid expenses 230 00
Dec 31 Bank 2 585 00 Income and expenditure 2 540 00
2 770 00 2 770 00
Dr Interest on Fixed Deposit Cr
Date Details Fol. Amount Date Details Fol. Amount
2013 Dec 31 Bank 550 00
2013 Dec 31 Income and expenditure 750 00
Accrued income 200 00
750 00 750 00
R5 000 × 15% = R750
Dr Stationery Cr
Date Details Fol. Amount Date Details Fol. Amount
2013 Jan 01 Stock of stationery 145 00
2013 Dec 31 Stock of stationery 109 00
Dec 31 Bank 374 00 Income and expenditure 410 00
519 00 519 00

274 s e c t i o n 5 • c h a p t e r 9
2.Cheetah Sports ClubStatement of Receipts and Payments for the year ended 31 December 2013
Note R
RECEIPTS 24 810 00
Membership fees 15 500 00
rent income 2 760 00
Donations received 6 000 00
Interest on fixed deposit 550 00
PAYMENTS (38 334 00)
Maintenance of fields 7 580 00
Water and electricity 2 445 00
Stationery 374 00
Donation expense 2 011 00
Interest on loan 1 800 00
honorarium 2 000 00
telephone 2 646 00
Insurance 2 585 00
Diverse expenses 1 893 00
Land and buildings 10 000 00
Fixed deposit 3 000 00
Loan: XY Bank 2 000 00
Deficit for the year (13 524 00)
Opening balance 16 468 00
Closing balance 2 944 00
Activity 9.17 (working backwards) (for enrichment only) LB page 334
1. General Ledger of Eastern Soccer Club
Dr Membership Fees Cr
Date Details Fol. Amount Date Details Fol. Amount
2011 Jan 01 Accrued income 1 200 00
2011 Jan 01 Income received in advance 900 00
Dec 31 Income received in advance 600 00 Dec 31 Bank 23 700 00
Income and expenditure 24 000 00 Membership fees written off 300 00
Accrued income 900 00
25 800 00 25 800 00
Dr Soccer Balls Cr
Date Details Fol. Amount Date Details Fol. Amount
2011 Jan 01 Stock of soccer balls 900 00
2011 Dec 31 Stock of soccer balls 780 00
Dec 31 Bank 2 710 00 Income and expenditure 2 830 00
3 610 00 3 610 00

275s e c t i o n 5 • c h a p t e r 9
Dr Insurance Cr
Date Details Fol. Amount Date Details Fol. Amount
2011 Jan 01 Prepaid expenses 210 00
2011 Dec 31 Prepaid expenses 250 00
Dec 31 Bank 5 340 00 Income and expenditure 5 300 00
5 550 00 5 550 00
Dr Repairs Cr
Date Details Fol. Amount Date Details Fol. Amount
2011 Dec 31 Bank 5 605 00
2011 Jan 01 Accrued expenses 180 00
Accrued expenses 385 00 Dec 31 Income and expenditure 5 810 00
5 990 00 5 990 00
Calculation of equipment purchasesCarrying value on 31/12/2010 R4 800Depreciation for the year (630)Carrying value of old equipment on 31/12/2011 4 170Carrying value on 31/12/2011 7 170 (4 170)New equipment purchased R3 000
2.Eastern Soccer Club Statement of Receipts and Payments for the year ended 31 December 2011
Note R
RECEIPTS 46 700
Membership fees 23 700
Donations received 15 000
entrance fees 4 000
Fixed deposit 4 000
PAYMENTS (49 925)
repairs 5 605
Insurance 5 340
Wages 8 300
Sundry expenses 1 910
Soccer balls 2 710
telephone 3 060
Land and buildings 20 000
equipment 3 000
Deficit for the year (3 225)
Opening balance 7 055
Closing balance 3 830

276 s e c t i o n 5 • c h a p t e r 9
Informal assessment 9.2 LB page 336
Marks: 24 Time: 10 minutes
Column 1: Concepts of clubs Column 2: Explanation
1. treasurer c. responsible for the bookkeeping and for submitting financial statements to the members at the aGM
2. constitution of a club e. a set of principles according to which a club is governed
3. annual General Meeting (aGM) J. a meeting that is held once a year
4. Membership fees F. a fee, payable on an annual or monthly basis, to be part of a club or society and to use their facilities
5. entrance fees h. a fee that is payable when you join a club
6. affiliation fees a. the money that a club has to pay to the body that organises the particular sport in their province
7. honorarium B. remuneration that is paid to one of the committee members for services rendered
8. accumulated funds D. a surplus that accumulated over the years of money not spent in previous years
9. Bequests L. the sum of money that is left to the club in a will when a member of a club passes away
10. Statement of receipts and payments K. a summary of all the receipts and payments made from the analysis cash Book
11. Income and Expenditure account G. the surplus or deficit for the financial year is calculated here.
12. trial Balance I. a summary of all the accounts in the General Ledger
[12 × 2 = 24]

277s e c t i o n 5 • c h a p t e r 1 0
CHAPTER 10 Cost Accounting
Activity 10.1 LB page 340
No. Type of manufacturing cost
1. Factory overhead
2. Factory overhead (indirect labour cost)
3. Direct material cost
4. Direct labour cost
5. Direct material cost
6. Factory overhead (indirect material cost)
7. Factory overhead (indirect labour cost)
8. Factory overhead
9. Direct labour cost
10. Direct material cost
11. Sales and distribution costs
12. Finance cost
13. administrative costs
14. Sales and distribution costs
15. administrative costs
Activity 10.2 LB page 343
1. Direct material cost = Wool + Buttons = R60 000 + 10 000 = R70 000
2. Direct labour cost = Wages paid to knitting machine operators = R20 000
3. Prime cost = Direct material cost + Direct labour cost = R70 000 + 20 000 = R90 000
4. Factory overheads = Wages paid to cleaner + Rent of machines + General = R4 000 + 30 000 + 36 000 = R70 000

278 s e c t i o n 5 • c h a p t e r 1 0
5. Total manufacturing cost = Prime cost + Factory overheads = R90 000 + 70 000 = R160 000
6. Unit cost of a jersey = Total manufacturing cost
__________________________ Total number of units produced
= R160 000 ________ 4 000
= R40
7. Selling price of a jersey = Cost price + Profit mark-up = R40 + (R40 × 75%) = R40 + 30 = R70
Activity 10.3 LB page 346
No. Manufacturing cost according to behaviour
1. Fixed cost
2. Semi-fixed cost
3. Variable cost
4. Variable cost
5. Semi-variable cost
6. Variable cost
7. Fixed cost
8. Variable cost
9. Semi-fixed cost
10. Semi-variable cost
Activity 10.4 LB page 348
Number of units Variable costs Fixed costsTotal
manufacturing costUnit cost
10 r100 r400 r500 r50
20 r200 r400 r600 r30
50 r500 r400 r900 r18
* 100 r1 000 r400 r1 400 r14

279s e c t i o n 5 • c h a p t e r 1 0
Total manufacturing costs= Variable costs + Fixed costs= (R10 × n) + R400
Total manufacturing costs= Unit cost × Number of units= R14 × n∴ 10n + 400 = 14n∴ 4n = 400∴ n = 100
Activity 10.5 LB page 348
1. Total manufacturing cost = R20 000 + 5 000 = R25 000
2. Unit cost = R25 000 _______ 500 = R50
3. Variable cost per unit = R20 000 _______ 500 = R40
4. Fixed cost per unit = R5 000 ______ 500 = R10
5. Total manufacturing cost = (R40 × 2 500) + 5 000 = R105 000
6. Unit cost = R105 000 ________ 2 500 = R42
7. Variable cost per unit = R40 (remains constant)
8. Fixed cost per unit = R5 000 ______ 2 500 = R2
Activity 10.6 LB page 350
Fixed costs = R1 000 + 2 800 + 400 = R4 200
Variable cost per kite = R4 500 ______ 100 + 30
= R45 + 30
= R75
Contribution = Selling price per unit – Variable cost per unit = R195 – 75 = R120
Break-even point = Fixed costs ___________ Contribution
= R4 200 ______ 120
= 35 kites

280 s e c t i o n 5 • c h a p t e r 1 0
Activity 10.7 LB page 350
Fixed costs = R1 700 + 500 + 200 = R2 400
Variable cost (per person) = R35 + 5 = R40
Contribution = Selling price per ticket – Variable cost per person = R100 – 40 = R60
Break-even point = Fixed costs ___________ Contribution
= R2 400 ______ 60
= 40 tickets
Notes:• Incomegeneratedfromthesaleof 40tickets=R100×40=R4000• Totalcostof dancefor40people=R2400+(R40×40)=R4000
Therefore, the income will be exactly equal to the costs if 40 tickets are sold.
Activity 10.8 LB page 350
1. a. Unit cost of coffee: Number of units per tin = 500 g ÷ 5 g = 100 units Cost per unit = R60,00 ÷ 100 = R0,60 (or 60 cents)
b. Unit cost of sugar: Number of units per bag = 2 500 g ÷ 10 g = 250 units Cost per unit = R12,50 ÷ 250 = R0,05 (or 5 cents)
c. Unit cost of milk: Number of units per bottle = 2 000 ml ÷ 25 ml = 80 units Cost per unit = R12,00 ÷ 80 = R0,15 (or 15 cents)
d. Unit cost of a cup: Number of units per box = 50 units Cost per unit = R10,00 ÷ 50 = R0,20 (or 20 cents)
2. Total cost per cup of coffee= R0,60 + 0,05 + 0,15 + 0,20= R1,00
3. Gross profit per cup of coffee= R4,00 – 1,00= R3,00

281s e c t i o n 5 • c h a p t e r 1 0
4. Number of cups to be sold to cover the cost of the kettle= R300 ÷ 3= 100 cups
Activity 10.9 LB page 351
Variable cost per unit
= R1 900 + 1 000 + 60 ________________ 200
= R14,80
Contribution per unit= R25 – 14,8= R10,20
Break-even point
= 300 + 120 + 90 ____________ 10,20
= 50 packets of rusks
Activity 10.10 LB page 358
General Ledger of Stormers ManufacturersBalance Sheet accounts
Dr Raw Material Stock Cr
Date Details Fol. Amount Date Details Fol. Amount
2017 Mar 01 Balance b/d 50 000 00
2017 Mar 31 Raw materials issued 93 000 00
31 Bank 45 000 00 Balance c/d 32 000 00
Creditors Control 30 000 00
125 000 00 125 000 00
2017 Apr Balance b/d 32 000 00
Dr Work-in-progress Cr
Date Details Fol. Amount Date Details Fol. Amount
2017 Mar 31 Direct material cost 93 000 00
2017 Mar 31 Finished goods 135 000 00
Direct labour cost 24 000 00 Balance c/d 15 000 00
Factory overheads 33 000 00
150 000 00 150 000 00
2017 Apr 01 Balance b/d 15 000 00
Dr Finished Goods Cr
Date Details Fol. Amount Date Details Fol. Amount
2017 Mar 31 Work-in-progress 135 000 00

282 s e c t i o n 5 • c h a p t e r 1 0
Nominal accounts
Dr Raw Materials Issued Cr
Date Details Fol. Amount Date Details Fol. Amount
2017 Mar 31 Raw materials 93 000 00
2017 Mar 31 Direct material cost 93 000 00
Dr Indirect Materials Cr
Date Details Fol. Amount Date Details Fol. Amount
2017 Mar 31 Bank 7 000 00
2017 Mar 31 Factory overheads 7 000 00
Dr Wages Cr
Date Details Fol. Amount Date Details Fol. Amount
2017 Mar 31 Gross wages 30 000 00
2017 Mar 31 Direct labour cost 24 000 00
Factory overheads 6 000 00
30 000 00 30 000 00
Dr Electricity Cr
Date Details Fol. Amount Date Details Fol. Amount
2017 Mar 31 Bank 5 000 00
2017 Mar 31 Factory overheads 3 500 00
Balance c/d 1 500 00
5 000 00 5 000 00
2017 Apr 01 Balance b/d 1 500 00
Dr Rent of Factory Cr
Date Details Fol. Amount Date Details Fol. Amount
2017 Mar 31 Bank 12 000 00
2017 Mar 31 Factory overheads 12 000 00
Dr Repairs Cr
Date Details Fol. Amount Date Details Fol. Amount
2017 Mar 31 Bank 2 500 00
2017 Mar 31 Factory overheads 2 500 00
Dr Depreciation Cr
Date Details Fol. Amount Date Details Fol. Amount
2017 Mar 31
Accumulated depreciation on machinery 2 000 00
2017 Mar 31 Factory overheads 2 000 00
Cost accountsDr Direct Material Costs Cr
Date Details Fol. Amount Date Details Fol. Amount
2017 Mar 31 Raw material issued 93 000 00
2017 Mar 31 Work-in-progress 93 000 00
Dr Direct Labour Costs Cr
Date Details Fol. Amount Date Details Fol. Amount
2017 Mar 31 Wages 24 000 00
2017 Mar 31 Work-in-progress 24 000 00

283s e c t i o n 5 • c h a p t e r 1 0
Dr Factory Overheads Cr
Date Details Fol. Amount Date Details Fol. Amount
2017 Mar 31 Indirect materials 7 000 00
2017 Mar 31 Work-in-progress 33 000 00
Wages 6 000 00
Factory rent 12 000 00
Repairs: factory 2 500 00
Electricity 3 500 00
Depreciation 2 000 00
33 000 00 33 000 00
Activity 10.11 LB page 359
General Ledger of BB ManufacturersBalance Sheet accounts
Dr Raw Material Stock Cr
Date Details Fol. Amount Date Details Fol. Amount
2017 Jan 01 Balance b/d 30 000 00
2017 Jan 31 Raw materials issued * 47 300 00
31 Bank (25%) 10 000 00 Balance c/d 22 700 00
Creditors Control (75%) 30 000 00
70 000 00 70 000 00
2017 Feb 01 Balance b/d 22 700 00
* Raw materials issued – balancing figure
Dr Work-in-progress Cr
Date Details Fol. Amount Date Details Fol. Amount
2017 Jan 01 Balance b/d 55 000 00
2017 Jan 31 Finished goods * 118 125 00
31 Direct material cost 47 300 00 Balance c/d 39 375 00
Direct labour cost 17 000 00
Factory overheads 38 200 00
157 500 00 157 500 00
2017 Feb 01 Balance b/d 39 375 00
* Finished goods = R157 500 × 75% = R118 125

284 s e c t i o n 5 • c h a p t e r 1 0
Dr Finished Goods Cr
Date Details Fol. Amount Date Details Fol. Amount
2017 Jan 01 Balance b/d 22 000 00
2017 Jan 31 Balance c/d 140 125 00
31 Work-in-progress 118 125 00
140 125 00 140 125 00
2017 Feb 01 Balance b/d 140 125 00
Cost account
Dr Factory Overheads Cr
Date Details Fol. Amount Date Details Fol. Amount
2017 Jan 31 Indirect materials 6 700 00
2017 Jan 31 Work-in-progress 38 200 00
Wages 3 000 00
Water and electricity 8 600 00
Rent expense 13 800 00
Insurance 3 800 00
Repairs 2 300 00
38 200 00 38 200 00
Wages = (R17 000 ÷ 85) × 15 = R3 000Rent expense = (R144 000 ÷ 12) × 115% = R13 800
Activity 10.12 LB page 361
General Ledger of Viking ManufacturersBalance Sheet accounts
Dr Raw Materials Stock Cr
Date Details Fol. Amount Date Details Fol. Amount
2017 Jul 31 Bank 30 000 00
2017 Jul 31 Raw materials issued 45 000 00
Creditors Control 35 000 00 Balance c/d 25 000 00
Bank (carriage) 5 000 00
70 000 00 70 000 00
2017 Aug 01 Balance b/d 25 000 00
Dr Work-in-progress Cr
Date Details Fol. Amount Date Details Fol. Amount
2017 Jul 31 Direct materials 45 000 00
2017 Jul 31 Finished goods 107 700 00
Direct labour 28 000 00
Factory overheads 34 700 00
107 700 00 107 700 00

285s e c t i o n 5 • c h a p t e r 1 0
Dr Finished Goods Cr
Date Details Fol. Amount Date Details Fol. Amount
2017 Jul 31 Work-in-progress 107 700 00
2017 Jul 31 Cost of sales 100 000 00
Balance c/d 7 700 00
107 700 00 107 700 00
2017 Aug 01 Balance b/d 7 700 00
Nominal accounts
Dr Cost of Sales Cr
Date Details Fol. Amount Date Details Fol. Amount
2017 Jul 31 Finished goods 100 000 00
Dr Raw Materials Issued Cr
Date Details Fol. Amount Date Details Fol. Amount
2017 Jul 31 Raw materials 45 000 00
2017 Jul 31 Direct materials 45 000 00
Dr Indirect Material Cr
Date Details Fol. Amount Date Details Fol. Amount
2017 Jul 31 Bank 5 000 00
2017 Jul 31 Factory overheads 5 000 00
Dr Wages Cr
Date Details Fol. Amount Date Details Fol. Amount
2017 Jul 31 Gross wages 35 000 00
2017 Jul 31 Direct labour 28 000 00
Factory overheads 8 000 00
35 000 00 35 000 00
Work-in-progress = R35 000 × 80% = R28 000Factory overheads = R35 000 × 20% = R7 000
Dr Salaries Cr
Date Details Fol. Amount Date Details Fol. Amount
2017 Jul 31 Gross salaries 15 000 00
2017 Jul 31 Factory overheads 7 000 00
Balance c/d 8 000 00
15 000 00 15 000 00
2017 Aug 01 Balance b/d 8 000 00
Dr Electricity Cr
Date Details Fol. Amount Date Details Fol. Amount
2017 Jul 31 Bank 6 000 00
2017 Jul 31 Factory overheads 5 700 00
Balance c/d 300 00
6 000 00 6 000 00
2017 Aug 01 Balance b/d 300 00

286 s e c t i o n 5 • c h a p t e r 1 0
Dr Rent Expense Cr
Date Details Fol. Amount Date Details Fol. Amount
2017 Jul 31 Bank 8 000 00
2017 Jul 31 Factory overheads 8 000 00
Dr Maintenance Cr
Date Details Fol. Amount Date Details Fol. Amount
2017 Jul 31 Bank 2 000 00
2017 Jul 31 Factory overheads 2 000 00
Cost accounts
Dr Direct Materials Cr
Date Details Fol. Amount Date Details Fol. Amount
2017 Jul 31 Raw materials issued 45 000 00
2017 Jul 31 Work-in-progress 45 000 00
Dr Direct Labour Cr
Date Details Fol. Amount Date Details Fol. Amount
2017 Jul 31 Wages 28 000 00
2017 Jul 31 Work-in-progress 28 000 00
Dr Factory Overheads Cr
Date Details Fol. Amount Date Details Fol. Amount
2017 Mar 31 Indirect materials 5 000 00
2017 Mar 31 Work-in-progress 34 700 00
Wages 7 000 00
Salaries 7 000 00
Electricity 5 700 00
Rent expense 8 000 00
Maintenance 2 000 00
34 700 00 34 700 00
Activity 10.13 LB page 373
General Ledger of Creative Gear CCBalance Sheet accounts
Dr Raw Material Stock B6 Cr
Date Details Fol. Amount Date Details Fol. Amount
2017 Mar 01 Balance b/d 42 100 00
2018 Feb 28 Raw materials issued 375 540 00
2018 Feb 28 Bank 204 300 00 Balance c/d 39 860 00
415 400 00 415 400 00
2018 Mar 01 Balance b/d 39 860 00

287s e c t i o n 5 • c h a p t e r 1 0
Dr Work-in-progress B7 Cr
Date Details Fol. Amount Date Details Fol. Amount
2017 Mar 01 Balance b/d 8 750 00
2018 Feb 28 Finished goods 730 309 00
2018 Feb 28 Direct material cost 375 540 00 Balance c/d 12 550 00
Direct labour cost 207 520 00
Factory overheads 151 049 00
742 859 00 742 859 00
2018 Mar 01 Balance b/d 12 550 00
Dr Finished Goods B8 Cr
Date Details Fol. Amount Date Details Fol. Amount
2017 Mar 01 Balance b/d 30 870 00
2018 Feb 28 Cost of sales 734 279 00
2018 Feb 28 Work-in-progress 730 309 00 Balance c/d 26 900 00
761 179 00 761 179 00
2018 Mar 01 Balance b/d 26 900 00
Dr Consumable Stores on Hand B9 Cr
Date Details Fol. Amount Date Details Fol. Amount
2017 Mar 01 Balance b/d 2 156 00
2017 Mar 01 Indirect materials 2 156 00
2018 Feb 28 Indirect materials 2 041 00
Nominal accounts
Dr Sales N1 Cr
Date Details Fol. Amount Date Details Fol. Amount
2018 Feb 28 Trading account 1 223 890 00
2018 Feb 28 Balance b/d 1 233 890 00
Dr Cost of Sales N2 Cr
Date Details Fol. Amount Date Details Fol. Amount
2018 Feb 28 Finished goods 734 279 00
2018 Feb 28 Trading account 734 279 00
Dr Raw Materials Issued N3 Cr
Date Details Fol. Amount Date Details Fol. Amount
2018 Feb 28 Raw materials 375 540 00
2018 Feb 28 Direct material cost 375 540 00
Dr Indirect Material N4 Cr
Date Details Fol. Amount Date Details Fol. Amount
2017 Mar 01 Consumable stores on hand 2 156 00
2018 Feb 28 Factory overheads 9 091 00
2018 Feb 28 Bank 8 976 00 Consumable stores on hand 2 041 00
11 132 00 11 132 00

288 s e c t i o n 5 • c h a p t e r 1 0
Dr Salaries and Wages N5 Cr
Date Details Fol. Amount Date Details Fol. Amount
2018 Feb 28 Balance b/d 343 000 00
2018 Feb 28 Direct labour cost 203 000 00
Factory overheads 36 000 00
Administration cost 104 000 00
343 000 00 343 000 00
Dr Unemployment Insurance Fund Contributions N6 Cr
Date Details Fol. Amount Date Details Fol. Amount
2018 Feb 28 Balance b/d 4 520 00
2018 Feb 28 Direct labour cost 4 520 00
Dr Repairs and Maintenance N7 Cr
Date Details Fol. Amount Date Details Fol. Amount
2018 Feb 28 Balance b/d 18 200 00
2018 Feb 28 Factory overheads 16 200 00
Sales and distribution cost 2 000 00
18 200 00 18 200 00
Dr Rental Expense N8 Cr
Date Details Fol. Amount Date Details Fol. Amount
2018 Feb 28 Balance b/d 84 000 00
2018 Feb 28 Factory overheads 67 200 00
Administration cost 16 800 00
84 000 00 84 000 00
Dr Municipal Levies N9 Cr
Date Details Fol. Amount Date Details Fol. Amount
2018 Feb 28 Balance b/d 8 970 00
2018 Feb 28 Factory overheads 6 558 00
Administration cost 2 412 00
8 970 00 8 970 00
Dr Stationery N10 Cr
Date Details Fol. Amount Date Details Fol. Amount
2018 Feb 28 Balance b/d 1 236 00
2018 Feb 28 Administration cost 1 236 00
Dr Insurance N11 Cr
Date Details Fol. Amount Date Details Fol. Amount
2018 Feb 28 Balance b/d 11 000 00
2018 Feb 28 Factory overheads 8 000 00
Administration cost 3 000 00
11 000 00 11 000 00
Dr Telephone N12 Cr
Date Details Fol. Amount Date Details Fol. Amount
2018 Feb 28 Balance b/d 13 580 00
2018 Feb 28 Administration cost 13 580 00

289s e c t i o n 5 • c h a p t e r 1 0
Dr Depreciation N13 Cr
Date Details Fol. Amount Date Details Fol. Amount
2018 Feb 28 Balance b/d 13 660 00
2018 Feb 28 Factory overheads 8 000 00
Sales and distribution cost 4 100 00
Administration cost 1 560 00
13 660 00 13 660 00
Dr Advertisements N14 Cr
Date Details Fol. Amount Date Details Fol. Amount
2018 Feb 28 Balance b/d 2 541 00
2018 Feb 28 Sales and distribution cost 2 541 00
Dr Bad Debts N15 Cr
Date Details Fol. Amount Date Details Fol. Amount
2018 Feb 28 Balance b/d 2 363 00
2018 Feb 28 Sales and distribution cost 2 363 00
Dr Commission Paid N16 Cr
Date Details Fol. Amount Date Details Fol. Amount
2018 Feb 28 Balance b/d 12 000 00
2018 Feb 28 Sales and distribution cost 12 000 00
Dr Fuel N17 Cr
Date Details Fol. Amount Date Details Fol. Amount
2018 Feb 28 Balance b/d 12 300 00
2018 Feb 28 Sales and distribution cost 12 300 00
Dr Bank Costs N18 Cr
Date Details Fol. Amount Date Details Fol. Amount
2018 Feb 28 Balance b/d 15 210 00
2018 Feb 28 Administration cost 15 210 00
Cost accounts
Dr Direct Material Costs C1 Cr
Date Details Fol. Amount Date Details Fol. Amount
2018 Feb 28 Raw materials issued 375 540 00
2018 Feb 28 Work-in-progress 375 540 00
Dr Direct Labour Costs C2 Cr
Date Details Fol. Amount Date Details Fol. Amount
2018 Feb 28 Wages 203 000 00
2018 Feb 28 Work-in-progress 207 520 00
Unemployment Insurance Fund contribution 4 520 00
207 520 00 207 520 00
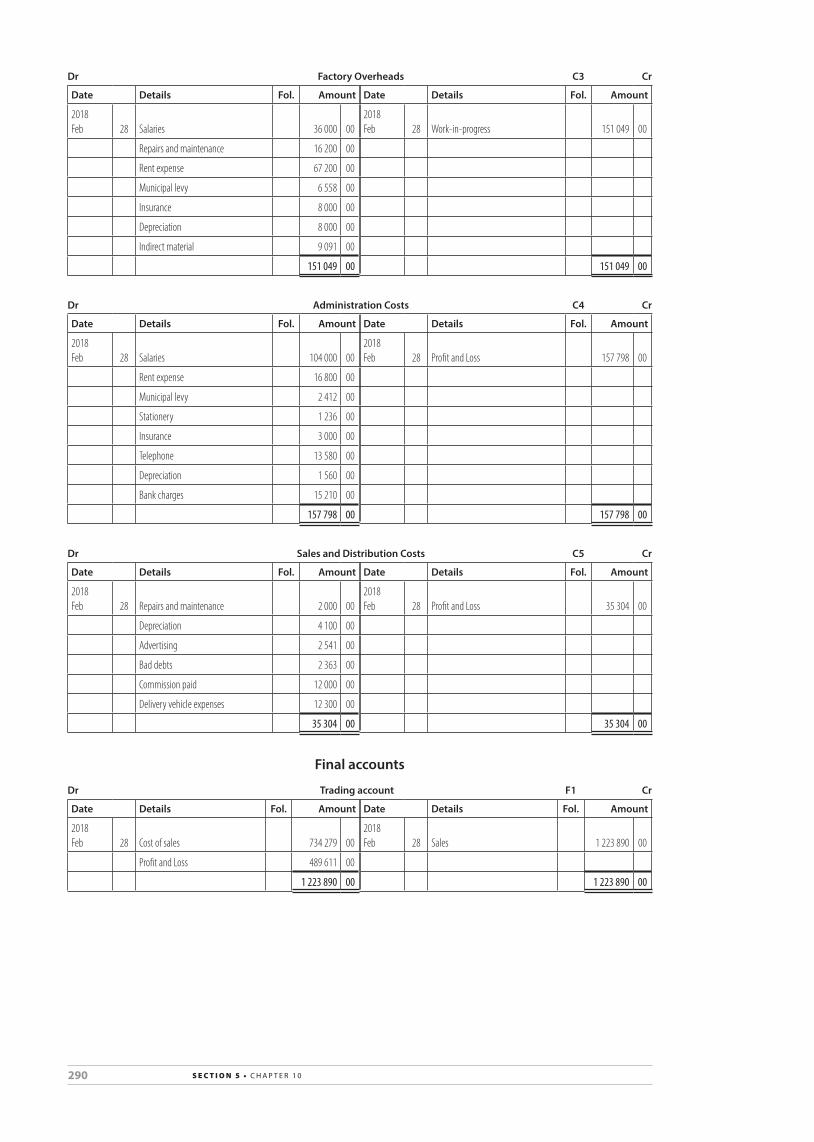
290 s e c t i o n 5 • c h a p t e r 1 0
Dr Factory Overheads C3 Cr
Date Details Fol. Amount Date Details Fol. Amount
2018 Feb 28 Salaries 36 000 00
2018 Feb 28 Work-in-progress 151 049 00
Repairs and maintenance 16 200 00
Rent expense 67 200 00
Municipal levy 6 558 00
Insurance 8 000 00
Depreciation 8 000 00
Indirect material 9 091 00
151 049 00 151 049 00
Dr Administration Costs C4 Cr
Date Details Fol. Amount Date Details Fol. Amount
2018 Feb 28 Salaries 104 000 00
2018 Feb 28 Profit and Loss 157 798 00
Rent expense 16 800 00
Municipal levy 2 412 00
Stationery 1 236 00
Insurance 3 000 00
Telephone 13 580 00
Depreciation 1 560 00
Bank charges 15 210 00
157 798 00 157 798 00
Dr Sales and Distribution Costs C5 Cr
Date Details Fol. Amount Date Details Fol. Amount
2018 Feb 28 Repairs and maintenance 2 000 00
2018 Feb 28 Profit and Loss 35 304 00
Depreciation 4 100 00
Advertising 2 541 00
Bad debts 2 363 00
Commission paid 12 000 00
Delivery vehicle expenses 12 300 00
35 304 00 35 304 00
Final accounts
Dr Trading account F1 Cr
Date Details Fol. Amount Date Details Fol. Amount
2018 Feb 28 Cost of sales 734 279 00
2018 Feb 28 Sales 1 223 890 00
Profit and Loss 489 611 00
1 223 890 00 1 223 890 00

291s e c t i o n 5 • c h a p t e r 1 0
Dr Profit and Loss account F1 Cr
Date Details Fol. Amount Date Details Fol. Amount
2018 Feb 28 Administration costs 157 798 00
2018 Feb 28 Trading account 489 611 00
Sales and distribution cost 35 304 00
Appropriation account 29 650 00
489 611 00 489 611 00
Activity 10.14 LB page 375
General Ledger of Slip-Slops ManufacturersBalance Sheet accounts
Dr Raw Material Stock B6 Cr
Date Details Fol. Amount Date Details Fol. Amount
2017 Mar 01 Balance b/d 145 000 00
2018 Feb 28 Raw materials issued 424 630 00
2018 Feb 28 Bank 279 600 00 Balance c/d 71 260 00
Creditors Control 65 970 00
Bank 5 320 00
495 890 00 495 890 00
2018 Mar 01 Balance b/d 71 260 00
Dr Work-in-progress B7 Cr
Date Details Fol. Amount Date Details Fol. Amount
2017 Mar 01 Balance b/d 63 000 00
2018 Feb 28 Finished goods 947 570 00
2018 Feb 28 Direct material cost 424 630 00 Balance c/d 65 400 00
Direct labour cost 332 950 00
Factory overheads 192 390 00
1 012 970 00 1 012 970 00
2018 Mar 01 Balance b/d 65 400 00
Dr Finished Goods B8 Cr
Date Details Fol. Amount Date Details Fol. Amount
2017 Mar 01 Balance 57 400 00
2018 Feb 28 Cost of sales 932 600 00
2018 Feb 28 Work-in-progress 947 570 00 Balance c/d 72 370 00
1 004 970 00 1 004 970 00
2018 Mar 01 Balance b/d 72 370 00

292 s e c t i o n 5 • c h a p t e r 1 0
Dr Consumables on Hand B9 Cr
Date Details Fol. Amount Date Details Fol. Amount
2017 Mar 01 Balance b/d 7 980 00
2017 Mar 01 Indirect materials 7 980 00
2018 Feb 28 Indirect materials 6 320 00
Nominal accounts
Dr Sales N1 Cr
Date Details Fol. Amount Date Details Fol. Amount
2018 Feb 28 Trading account 1 398 900 00
2018 Feb 28 Balance b/d 1 398 900 00
Dr Cost of Sales N2 Cr
Date Details Fol. Amount Date Details Fol. Amount
2018 Feb 28 Finished goods 932 600 00
2018 Feb 28 Trading account 932 600 00
Dr Raw Materials Issued N3 Cr
Date Details Fol. Amount Date Details Fol. Amount
2018 Feb 28 Raw materials 424 630 00
2018 Feb 28 Direct material cost 424 630 00
Dr Indirect Material N4 Cr
Date Details Fol. Amount Date Details Fol. Amount
2017 Mar 01 Consumable stores on hand 7 980 00
2018 Feb 28 Factory overheads 17 060 00
2018 Feb 28 Bank 15 400 00 Consumable stores on hand 6 320 00
23 380 00 23 380 00
Dr Wages N5 Cr
Date Details Fol. Amount Date Details Fol. Amount
2018 Feb 28 Balance b/d 369 550 00
2018 Feb 28 Direct labour cost 332 950 00
Factory overheads 36 600 00
369 550 00 369 550 00
Dr Salaries N6 Cr
Date Details Fol. Amount Date Details Fol. Amount
2018 Feb 28 Balance b/d 231 450 00
2018 Feb 28 Sales and distribution cost 87 920 00
Factory overheads 77 000 00
Administration cost 66 530 00
231 450 00 231 450 00
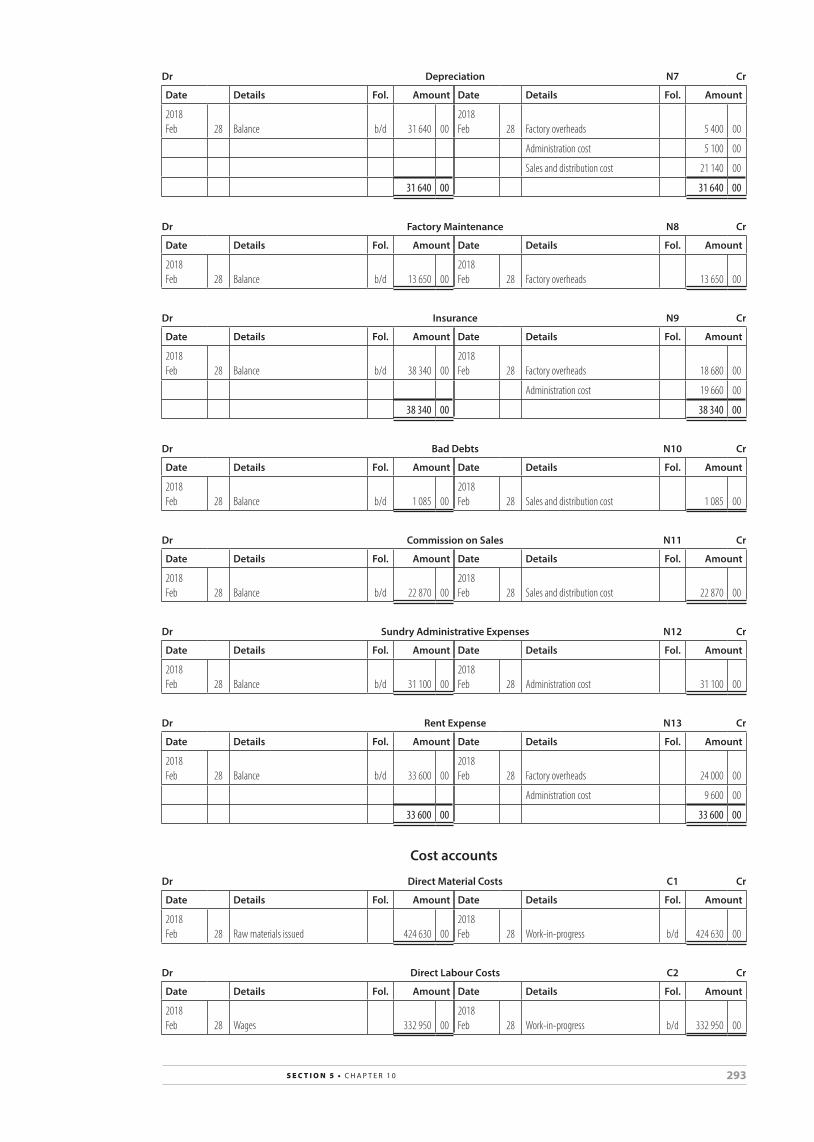
293s e c t i o n 5 • c h a p t e r 1 0
Dr Depreciation N7 Cr
Date Details Fol. Amount Date Details Fol. Amount
2018 Feb 28 Balance b/d 31 640 00
2018 Feb 28 Factory overheads 5 400 00
Administration cost 5 100 00
Sales and distribution cost 21 140 00
31 640 00 31 640 00
Dr Factory Maintenance N8 Cr
Date Details Fol. Amount Date Details Fol. Amount
2018 Feb 28 Balance b/d 13 650 00
2018 Feb 28 Factory overheads 13 650 00
Dr Insurance N9 Cr
Date Details Fol. Amount Date Details Fol. Amount
2018 Feb 28 Balance b/d 38 340 00
2018 Feb 28 Factory overheads 18 680 00
Administration cost 19 660 00
38 340 00 38 340 00
Dr Bad Debts N10 Cr
Date Details Fol. Amount Date Details Fol. Amount
2018 Feb 28 Balance b/d 1 085 00
2018 Feb 28 Sales and distribution cost 1 085 00
Dr Commission on Sales N11 Cr
Date Details Fol. Amount Date Details Fol. Amount
2018 Feb 28 Balance b/d 22 870 00
2018 Feb 28 Sales and distribution cost 22 870 00
Dr Sundry Administrative Expenses N12 Cr
Date Details Fol. Amount Date Details Fol. Amount
2018 Feb 28 Balance b/d 31 100 00
2018 Feb 28 Administration cost 31 100 00
Dr Rent Expense N13 Cr
Date Details Fol. Amount Date Details Fol. Amount
2018 Feb 28 Balance b/d 33 600 00
2018 Feb 28 Factory overheads 24 000 00
Administration cost 9 600 00
33 600 00 33 600 00
Cost accounts
Dr Direct Material Costs C1 Cr
Date Details Fol. Amount Date Details Fol. Amount
2018 Feb 28 Raw materials issued 424 630 00
2018 Feb 28 Work-in-progress b/d 424 630 00
Dr Direct Labour Costs C2 Cr
Date Details Fol. Amount Date Details Fol. Amount
2018 Feb 28 Wages 332 950 00
2018 Feb 28 Work-in-progress b/d 332 950 00

294 s e c t i o n 5 • c h a p t e r 1 0
Dr Factory Overheads C3 Cr
Date Details Fol. Amount Date Details Fol. Amount
2018 Feb 28 Indirect material 17 060 00
2018 Feb 28 Work-in-progress 192 390 00
Wages 36 600 00
Salaries 77 000 00
Depreciation 5 400 00
Factory maintenance 13 650 00
Insurance 18 680 00
Rent expense 24 000 00
192 390 00 192 390 00
Dr Administration Costs C4 Cr
Date Details Fol. Amount Date Details Fol. Amount
2018 Feb 28 Salaries 66 530 00
2018 Feb 28 Profit and Loss 131 990 00
Depreciation 5 100 00
Insurance 19 660 00
Sundry administration expenses 31 100 00
Rent expense 9 600 00
131 990 00 131 990 00
Dr Sales and Distribution Costs C5 Cr
Date Details Fol. Amount Date Details Fol. Amount
2018 Feb 28 Salaries 87 920 00
2018 Feb 28 Profit and Loss 133 015 00
Depreciation 21 140 00
Bad debts 1 085 00
Commission 22 870 00
133 015 00 133 015 00
Final accounts
Dr Trading account F1 Cr
Date Details Fol. Amount Date Details Fol. Amount
2018 Feb 28 Cost of sales 932 600 00
2018 Feb 28 Sales 1 398 900 00
Profit and Loss 466 300 00
1 398 900 00 1 398 900 00
Dr Profit and Loss account F2 Cr
Date Details Fol. Amount Date Details Fol. Amount
2018 Feb 28 Administration cost b/d 131 990 00
2018 Feb 28 Trading account 466 300 00
Sales and distribution 133 015 00
Capital 201 295 00
466 300 00 466 300 00

295s e c t i o n 5 • c h a p t e r 1 0
Activity 10.15 LB page 377
General Ledger of Siyanda ManufacturersBalance Sheet accounts
Dr Raw Material Stock Cr
Date Details Fol. Amount Date Details Fol. Amount
2017 Mar 01 Balance b/d 32 300 00
2017 Mar 31 Raw materials issued 214 800 00
31 Bank 51 100 00 Balance c/d 77 700 00
Creditors Control 204 400 00
Bank (import duty) 4 700 00
292 500 00 292 500 00
2017 Apr 01 Balance b/d 77 700 00
Bank = (R255 500 × 20%) = R51 100Creditors Control = (R255 500 × 80%) = R204 400
Dr Work-in-progress Cr
Date Details Fol. Amount Date Details Fol. Amount
2017 Mar 01 Balance b/d 14 400 00
2017 Mar 31 Finished goods 380 400 00
31 Direct material cost 214 800 00 Balance c/d 121 700 00
Direct labour cost 165 600 00
Factory overheads 107 300 00
502 100 00 502 100 00
2017 Apr 01 Balance b/d 121 700 00
Finished goods = R502 100 – 121 700 = R380 400
Dr Finished Goods Cr
Date Details Fol. Amount Date Details Fol. Amount
2017 Mar 01 Balance b/d 23 700 00
2017 Mar 31 Cost of sales 352 200 00
31 Work-in-progress 380 400 00 Balance c/d 51 900 00
404 100 00 404 100 00
2017 Apr 01 Balance b/d 51 900 00
Cost of sales = (R528 300 × 100% _____ 150% ) = R352 200
Nominal account
Dr Wages Cr
Date Details Fol. Amount Date Details Fol. Amount
2017 Mar 31 Gross wages 220 800 00
2017 Mar 31 Direct labour cost 165 600 00
Factory overheads 55 200 00
220 800 00 220 800 00
Direct labour = R220 800 × 75% = R165 000Factory overheads = R220 800 × 25% = R55 200

296 s e c t i o n 5 • c h a p t e r 1 0
Cost account
Dr Factory Overheads Cr
Date Details Fol. Amount Date Details Fol. Amount
2017 Mar 31 Indirect material 13 300 00
2017 Mar 31 Work-in-progress 107 300 00
Wages 55 200 00
Insurance 2 600 00
Rent expense 12 000 00
Maintenance 3 500 00
Electricity (23 000 × 90%) 20 700 00
107 300 00 107 300 00
Case study 10.1 LB page 378
1. George Foreman. He oversees the production and is not directly involved.
2. John Blade. He is directly involved in the production (cutting the leather). Cathy Cotton. She is directly involved in the production (sewing the
leather). or: Naomi Needle. She is directly involved in the production (sewing the
leather). Sally Sewright. She is directly involved in the production (sewing the
leather). Jerry Packer. He is directly involved in the production (the special plastic
container forms part of the final product). (any TWO employees)
3. Leather.Itcanbeidentifiedin(formspartof )thefinalproduct. Plasticcontainer.Itcanbeidentifiedin(formspartof )thefinalproduct.
4. Thread. Although it can be identified in (forms part of ) the final product, it forms a relatively insignificant part of the finished product.
Polishingspray.Itdoesnotformspartof thefinalproduct. (Also it is a relatively insignificant part of the finished product.)
5. Total wages for the month = R4 200 + 5 100 + 5 100 + 5 100 + 3 800 + 6 200 = R29 500
6. Direct labour cost = R29 500 – 6 200 = R23 300 Indirectlabourcost=R6200
7. Opening balance in Raw Materials Stock account Leather = R8 000 × 5 = R40 000 Plastic containers = R40 × 500 = R20 000 Opening balance = R40 000 + 20 000 = R60 000
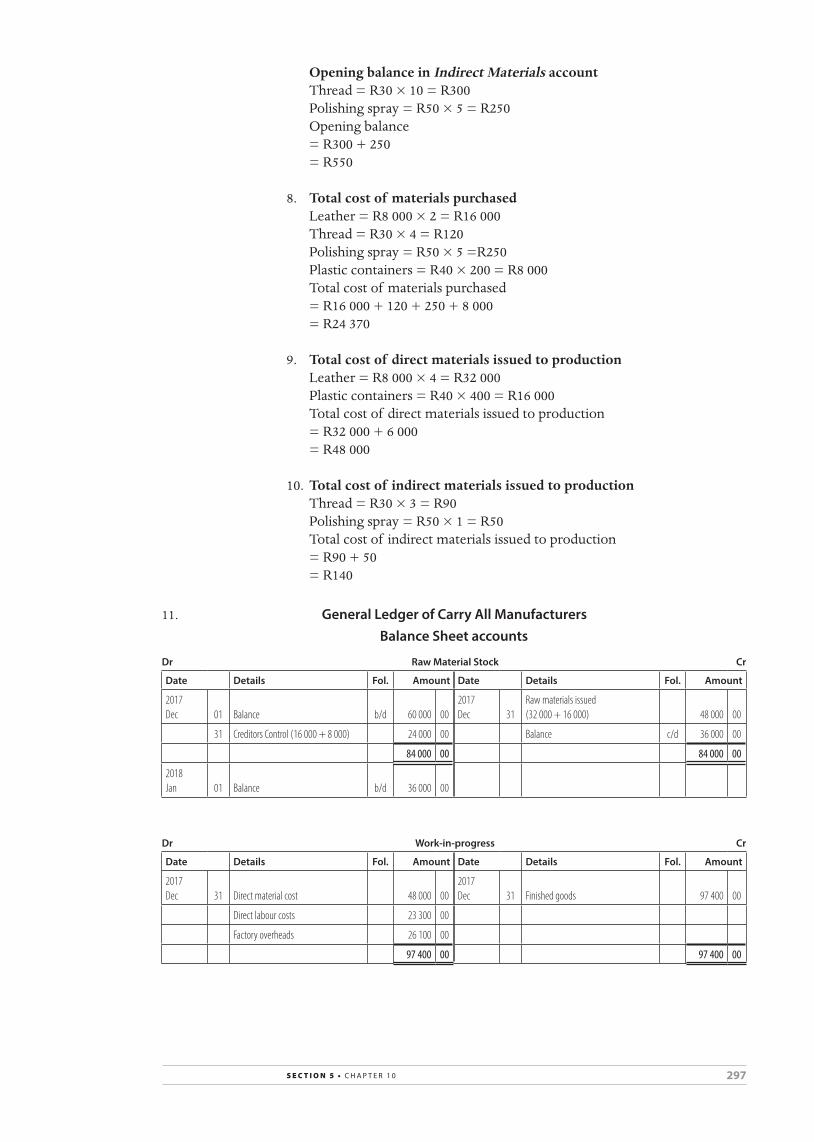
297s e c t i o n 5 • c h a p t e r 1 0
Opening balance in Indirect Materials account Thread = R30 × 10 = R300 Polishing spray = R50 × 5 = R250 Opening balance = R300 + 250 = R550
8. Total cost of materials purchased Leather = R8 000 × 2 = R16 000 Thread = R30 × 4 = R120 Polishing spray = R50 × 5 =R250 Plastic containers = R40 × 200 = R8 000 Total cost of materials purchased = R16 000 + 120 + 250 + 8 000 = R24 370
9. Total cost of direct materials issued to production Leather = R8 000 × 4 = R32 000 Plastic containers = R40 × 400 = R16 000 Total cost of direct materials issued to production = R32 000 + 6 000 = R48 000
10. Total cost of indirect materials issued to production Thread = R30 × 3 = R90 Polishing spray = R50 × 1 = R50 Total cost of indirect materials issued to production = R90 + 50 = R140
11. General Ledger of Carry All ManufacturersBalance Sheet accounts
Dr Raw Material Stock Cr
Date Details Fol. Amount Date Details Fol. Amount
2017 Dec 01 Balance b/d 60 000 00
2017 Dec 31
Raw materials issued (32 000 + 16 000) 48 000 00
31 Creditors Control (16 000 + 8 000) 24 000 00 Balance c/d 36 000 00
84 000 00 84 000 00
2018 Jan 01 Balance b/d 36 000 00
Dr Work-in-progress Cr
Date Details Fol. Amount Date Details Fol. Amount
2017 Dec 31 Direct material cost 48 000 00
2017 Dec 31 Finished goods 97 400 00
Direct labour costs 23 300 00
Factory overheads 26 100 00
97 400 00 97 400 00

298 s e c t i o n 5 • c h a p t e r 1 0
Cost account
Dr Factory Overheads Cr
Date Details Fol. Amount Date Details Fol. Amount
2017 Dec 31 Indirect materials b/d 140 00
2017 Dec 31 Work-in-progress 26 100 00
Wages 6 200 00
Rent expense 10 000 00
Water and electricity 4 960 00
Insurance 4 800 00
26 100 00 26 100 00
Rent expense = R12 000 – 2 000 = R10 000Water and electricity = R6 200 × 80% = R4 960
12. 400 units 400 plastic containers were issued to production during the month and all production started was completed.
13. Unit cost = R97 400 ÷ 400 = R243,50
14. Selling price = Cost price + Mark-up = R243,50 + 243,50 = R487
Activity 10.16 LB page 380
General Ledger of Sihle ManufacturersBalance Sheet accounts
Dr Raw Material Stock B6 Cr
Date Details Fol. Amount Date Details Fol. Amount
2016 Mar 01 Balance b/d 33 000 00
2017 Feb 28 Raw materials issued 740 000 00
2017 Feb 28 Bank 357 000 00 Balance c/d 79 320 00
Creditors Control 421 520 00
Bank (carriage) 7 800 00
819 320 00 819 320 00
2017 Mar 01 Balance b/d 79 320 00
Dr Work-in-progress Cr
Date Details Fol. Amount Date Details Fol. Amount
2016 Mar 01 Balance 74 600 00
2017 Feb 28 Finished goods 1 400 000 00
2017 Mar 28 Direct materials 740 000 00 Balance c/d 107 800 00
Direct labour 393 200 00
Factory overheads 300 000 00
1 507 800 00 1 507 800 00
2017 Mar 01 Balance b/d 107 800 00

299s e c t i o n 5 • c h a p t e r 1 0
Dr Finished Goods Cr
Date Details Fol. Amount Date Details Fol. Amount
2016 Mar 01 Balance b/d 445 000 00
2017 Feb 28 Cost of sales 1 315 968 00
2017 Feb 28 Work-in-progress 1 400 000 00 Balance c/d 529 032 00
1 845 000 00 1 845 000 00
2017 Mar 01 Balance b/d 529 032 00
Nominal account
Dr Indirect Materials Cr
Date Details Fol. Amount Date Details Fol. Amount
2016 Feb 28 Consumable stores stock b/d 1 320 00
2017 Feb 28 Factory overheads 8 220 00
2017 Feb Bank 3 480 00 Consumable stores stock 1 300 00
Creditors Control 4 720 00
9 520 00 9 520 00
Cost accounts
Dr Factory Overheads Cr
Date Details Fol. Amount Date Details Fol. Amount
2017 Feb 28 Wages 70 660 00
2017 Feb 28 Work-in-progress 300 000 00
UIF contribution 840 00
Salaries 139 300 00
Insurance 19 300 00
Maintenance 35 280 00
Depreciation 26 400 00
Indirect materials 8 220 00
300 000 00 300 000 00
Dr Administration Costs Cr
Date Details Fol. Amount Date Details Fol. Amount
2017 Feb 28 Consumables 1 740 00
2017 Feb 28 Profit and Loss 174 460 00
Salaries 153 080 00
Insurance 2 440 00
Depreciation 17 200 00
174 460 00 174 460 00
Dr Sales and Distribution Costs Cr
Date Details Fol. Amount Date Details Fol. Amount
2017 Feb 28 Wages 49 600 00
2017 Feb 28 Profit and Loss 282 000 00
Salaries 225 500 00
Insurance 6 900 00
282 000 00 282 000 00

300 s e c t i o n 5 • c h a p t e r 1 0
Activity 10.17 (challenge) LB page 381
SECTION A
1. Direct labour costs:Normal time 9 × R2 200 × 16 = R316 800Overtime 9 × R100 × 24 = R21 600 R338 400
2. General Ledger of Kaden T-shirt ManufacturersBalance Sheet accounts
Dr Raw Material Stock Cr
Date Details Fol. Amount Date Details Fol. Amount
2018 Jul 01 Balance b/d 38 600 00
2019 Jun 30 Creditors Control 7 500 00
2019 Jun 30 Creditors Control 439 000 00 Raw materials damaged 3 000 00
Bank 120 000 00 Raw materials issued 581 400 00
Bank 18 200 00 Balance c/d 23 900 00
615 800 00 615 800 00
2019 Jul 01 Balance b/d 23 900 00
Dr Work-in-progress Stock Cr
Date Details Fol. Amount Date Details Fol. Amount
2018 Jul 01 Balance b/d 89 700 00
2019 Jun 30 Finished goods 1 171 800 00
2019 Jun 30 Direct material cost 581 400 00 Balance c/d 80 400 00
Direct labour cost 338 400 00
Factory overheads 242 700 00
1 252 200 00 1 252 200 00
2019 Jul 01 Balance b/d 80 400 00
Nominal account
Dr Factory Overheads Cr
Date Details Fol. Amount Date Details Fol. Amount
2019 Jun 30
Indirect materials (2 400 + 18 700 – 4 300) 16 800 00
2019 Jun 30 Work-in-progress 242 700 00
Indirect labour 76 000 00
Factory maintenance 34 000 00
Electricity 35 900 00
Rent (108 000 × 1 _ 2 ) 54 000 00
Depreciation 26 000 00
242 700 00 242 700 00
SECTION B3. a. Possible reasons for the difference in direct material cost
per unit:• Theycouldnegotiateabetterpricebecauselargequantitieswere
purchased.

301s e c t i o n 5 • c h a p t e r 1 0
• Goodspurchasedwereof aslightlypoorerquality.• Therewasageneralpricedecreaseinrawmaterial.(Any TWO reasons)
b. Possible reasons for the difference in factory overhead cost per unit:• Totalproductionwaslowerthanexpected.• Maintenanceof factorywashigherthanexpected.• Therewasanincreaseinpriceof electricity/rent.(Any TWO reasons)
c. Ways in which Rainbow T-shirt manufacturers could increase their profits next year:• Increaseprofitmarginpercentage.• Increaseproduction–bydoingthisthefixedcostperunitdecreases.• Increasesales.• Trytoexercisebettercontroloverexpenses.(Any TWO ways)
4. R200 × 115 ___ 100 = R230
Informal assessment 10.1 LB page 384
Marks: 63 Time: 35 minutes
SECTION A
1. General Ledger of Abrahams ManufacturersBalance Sheet accounts
Dr Raw Material Stock Cr
Date Details Fol. Amount Date Details Fol. Amount
2017 Mar 01 Balance b/d ✓ 78 456 00
2018 Feb 28
Work-in-progress / Raw materials issued ✓ ✓✓✓ 557 200 00
2018 Feb 28 Bank ✓ 416 985 00 Balance c/d ✓ 41 991 00
Creditors Control ✓ 93 300 00
Bank ✓ 10 450 00
599 191 00 599 191 00
2018 Mar 01 Balance b/d ✓ 41 991 00
[10]
Dr Work-in-progress Stock Cr
Date Details Fol. Amount Date Details Fol. Amount
2017 Mar 01 Balance b/d ✓ 18 460 00
2018 Feb 28 Finished goods stock ✓ ✓ 1 299 000 00
2018 Feb 28 Direct material costs ✓ ✓ 557 200 00 Balance c/d ✓ 12 430 00
Direct labour costs ✓ (354 700 + 800) ✓✓✓ 355 500 00
Factory overheads ✓ ✓ 380 270 00
1 311 430 00 1 311 430 00
2018 Mar 01 Balance ✓ 12 430 00
[13]

302 s e c t i o n 5 • c h a p t e r 1 0
Dr Finished Goods Stock Cr
Date Details Fol. Amount Date Details Fol. Amount
2017 Mar 01 Balance b/d ✓ 48 210 00
2018 Feb 28 Cost of sales ✓ ✓✓ 1 304 700 00
2018 Feb 28 Work-in-progress ✓ ✓ 1 299 000 00 Balance c/d ✓ 42 510 00
1 347 210 00 1 347 210 00
2018 Mar 01 Balance b/d ✓ 42 510 00
[8]
Nominal account
Dr Factory Overheads Cr
Date Details Fol. Amount Date Details Fol. Amount
2018 Feb 28
Indirect material ✓ (2 300 + 50 000 –2 140) ✓✓✓ 50 160 00
2018 Feb 28 Work-in-progress ✓ ✓ 380 270 00
Wages / Indirect labour ✓ 145 650 00
Rent ✓(120 000 × 120 ___ 200 ) ✓✓ 72 000 00
Insurance ✓ 31 500 00
Maintenance ✓ 48 500 00
Depreciation ✓ 32 460 00
380 270 00 380 270 00
[13]
SECTION B
2. a. The cost of production will decrease. ✓✓ [2]
b. The quality of the plastic ✓✓
Isthesuppliertrustworthyinsupplyingthegoodsontime?✓✓
Terms of agreement regarding payment ✓✓
(Any TWO answers) [4]
3. a. Break-even point Contribution per unit = R150✓ – 89✓ = R61✓
Break-even point = 453 200✓ ________ 61✓
= 7 429,51 = 7 430 units ✓✓ [7]
b. 1 884 000✓ _________ 150✓
= 12 560 ✓
Yes ✓, they have sold 12 560 units. ✓
The break-even point is 7 430 units. ✓ [6]

303s e c t i o n 5 • c h a p t e r 1 0
Case study 10.2 LB page 387
1. The term “green production” refers to the manufacture of products using sustainable and environmentally friendly production processes.
2. Theterm“bottomline”meansprofit.Itreferstothelastlineof theIncomeStatement,whichliststhenetincome(ornetprofit)of thebusiness.
3. The writer suggest that “sustainable business practices are looking much more enticing” because the costs of electricity, water and other services are increasing.
4. The introduction of “green efficiencies” in the manufacturing of products usually results in the price of the products increasing and customers might choose other cheaper products. Also, the “green” label can cause customers to assume that the product is expensive and thus not even consider buying it.
5. a. cost managementb. 37%
6. five million jobs by 2020 and a “more inclusive and greener economy”7. 24%8. efficiency9. recycling of plastic scraps from their bottle-making process

304 s e c t i o n 5 • c h a p t e r 1 1
CHAPTER 11 Budgeting
Activity 11.1 LB page 394
Cash Receipts of Polela Mdala from 1 July 2017 to 31 December 2017Salary (after living expenses) [r2 500 × 6] 15 000
private lessons [(r200 × 6) × 5] 6 000
chef salary [r1 000 + (r1 000 × 120% × 5)] 7 000
Total receipts 28 000
Cash Payments of Polela Mdala from 1 July 2017 to 31 December 2017Grandmother’s birthday present 500
clothes [r600 × 3] 1 800
Business School fees [r300 × 5] 1 500
cell phone airtime [r75 × 6] 450
Total payments 4 250
Cash Receipts of Polela Mdala from 1 July 2017 to 31 December 2017cash on hand on 30 June 2017 24 000
Net cash from 1 June to 31 December 2017 [28 000 – 4 250] 23 750
Cash on hand on 31 December 2017 47 750
Therefore, Polela can expect to have R47 750 cash on hand on 31 December 2017 and will be able to open her restaurant.
Activity 11.2 LB page 397
Polela MdalaCash Budget for the period 1 July 2017 to 31 December 2017
RECEIPTS
Salary (after living expenses) [r2 500 × 6] 15 000
private lessons [(r200 × 6) × 5] 6 000
chef salary [r1 000 + (r1 000 × 120% × 5)] 7 000
TOTAL RECEIPTS 28 000
PAYMENTS
Grandmother’s birthday present 500
clothes [r600 × 3] 1 800
Business School fees [r300 × 5] 1 500
cell phone airtime [r75 × 6] 450
TOTAL PAYMENTS 4 250
caSh SUrpLUS / DeFIcIt 23 750
caSh BaLaNce at BeGINNING OF perIOD 24 000
CASH ON HAND AT END OF PERIOD 47 750

305s e c t i o n 5 • c h a p t e r 1 1
Activity 11.3 LB page 398
Green Fingers Garden ServicesCash Budget for the period 1 March 2017 to 30 April 2017
Mar 2017 Apr 2017 Total budget
RECEIPTS
Services rendered [r500 × 25] [r500 × 30] 12 500 15 000 27 500
rent income [1 500 × 120%] 1 500 1 800 3 300
Interest on fixed deposit [20 000 × 15% × 1 __ 12 ] 250 250 500
equipment sold 500 – 500
TOTAL RECEIPTS 14 750 17 050 31 800
PAYMENTS
General office expenses 800 800 1 600
equipment purchased [2 700 ÷ 3] – 900 900
Wages [2 000 × 115%] 2 000 2 300 4 300
petrol [1 000 × 125%] 1 250 1 250 2 500
TOTAL PAYMENTS 4 050 5 250 9 300
caSh SUrpLUS / DeFIcIt 10 700 11 800 22 500
caSh BaLaNce at BeGINNING OF perIOD 7 200 17 900 7 200
CASH ON HAND AT END OF PERIOD 17 900 29 700 29 700
Activity 11.4 LB page 401
One-Stop TradersDebtors Collection Schedule for the period 1 June 2017 to 31 July 2017
Period Credit sales Collections Jun 2017
Collections Jul 2017
Bad debts
March 2017 r56 000 (56 000 × 17%) 9 520
(56 000 × 3%) 1 680
april 2017 r68 000 (68 000 × 20%) 13 600
(68 000 × 17%) 11 560
(68 000 × 3%) 2 040
May 2017 r63 000 (63 000 × 60%) 37 800
(63 000 × 20%) 12 600
June 2017 r72 000 (72 000 × 60%) 43 200
60 920 67 360 3 720
Activity 11.5 LB page 401
Actual and budgeted sales August September October November
total sales (160 000 × 110%) 150 000 160 000 176 000 186 000
credit sales (60% of total sales) 90 000 96 000 105 600 111 600
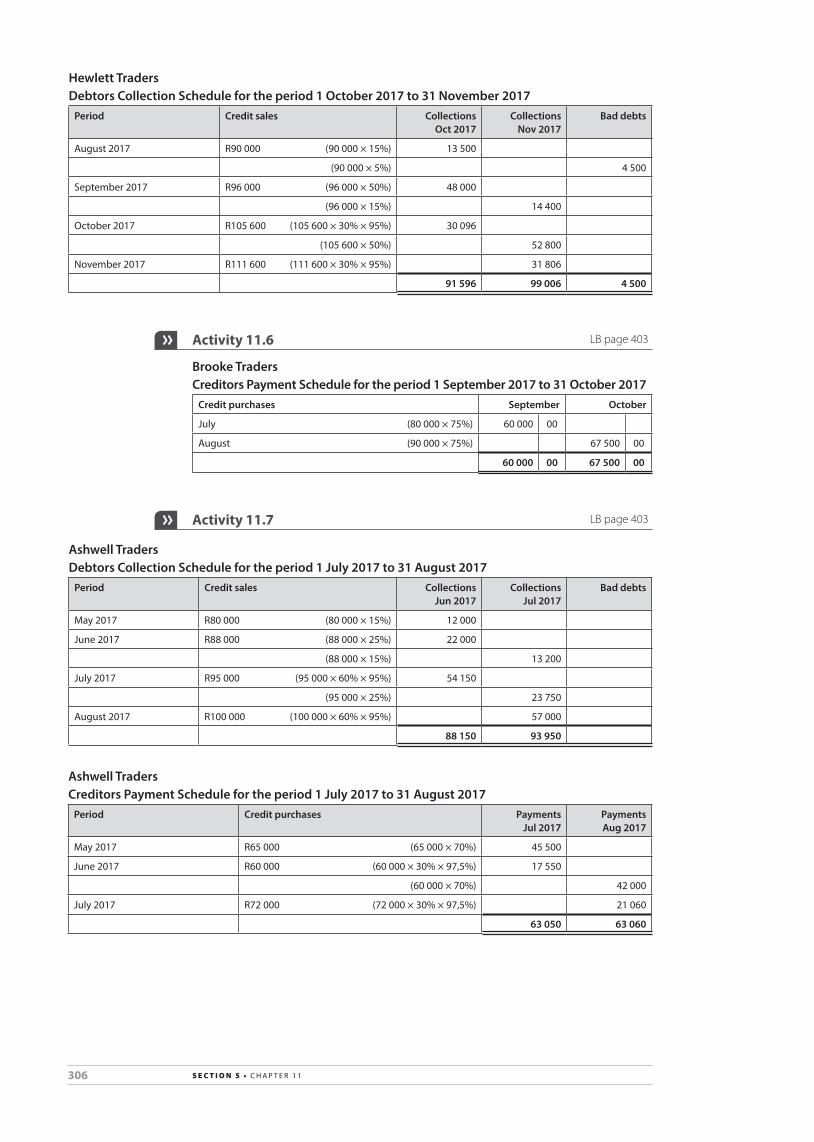
306 s e c t i o n 5 • c h a p t e r 1 1
Hewlett TradersDebtors Collection Schedule for the period 1 October 2017 to 31 November 2017
Period Credit sales Collections Oct 2017
Collections Nov 2017
Bad debts
august 2017 r90 000 (90 000 × 15%) 13 500
(90 000 × 5%) 4 500
September 2017 r96 000 (96 000 × 50%) 48 000
(96 000 × 15%) 14 400
October 2017 r105 600 (105 600 × 30% × 95%) 30 096
(105 600 × 50%) 52 800
November 2017 r111 600 (111 600 × 30% × 95%) 31 806
91 596 99 006 4 500
Activity 11.6 LB page 403
Brooke TradersCreditors Payment Schedule for the period 1 September 2017 to 31 October 2017
Credit purchases September October
July (80 000 × 75%) 60 000 00
august (90 000 × 75%) 67 500 00
60 000 00 67 500 00
Activity 11.7 LB page 403
Ashwell TradersDebtors Collection Schedule for the period 1 July 2017 to 31 August 2017
Period Credit sales Collections Jun 2017
Collections Jul 2017
Bad debts
May 2017 r80 000 (80 000 × 15%) 12 000
June 2017 r88 000 (88 000 × 25%) 22 000
(88 000 × 15%) 13 200
July 2017 r95 000 (95 000 × 60% × 95%) 54 150
(95 000 × 25%) 23 750
august 2017 r100 000 (100 000 × 60% × 95%) 57 000
88 150 93 950
Ashwell TradersCreditors Payment Schedule for the period 1 July 2017 to 31 August 2017
Period Credit purchases Payments Jul 2017
Payments Aug 2017
May 2017 r65 000 (65 000 × 70%) 45 500
June 2017 r60 000 (60 000 × 30% × 97,5%) 17 550
(60 000 × 70%) 42 000
July 2017 r72 000 (72 000 × 30% × 97,5%) 21 060
63 050 63 060

307s e c t i o n 5 • c h a p t e r 1 1
Activity 11.8 LB page 406
Nomvete TradersCash Budget for the period 1 April 2017 to 30 June 2017
Apr 2017 May 2017 Jun 2017
RECEIPTS
cash sales 65 600 63 000 62 900
cash from debtors 35 852 39 366 39 075
Interest on fixed deposit (50 000 × 18% × 6 __ 12 ) – – 4 500
equipment – 20 000 –
TOTAL RECEIPTS 101 452 122 366 106 475
PAYMENTS
cash purchases 54 000 50 800 58 500
payments to creditors (40 000 × 95%) 38 000 – –
(34 800 × 95%) – 33 060 –
(35 000 × 95%) – – 33 250
Drawings (3 000 – 800 – 50) 2 150 2 150 2 150
Wages (15 000 × 110%) 15 000 15 000 16 500
Other operating expenses 12 000 12 000 12 000
Vehicle [(50 000 – 20 000) ÷ 3] – 20 000 10 000
TOTAL PAYMENTS 121 150 133 010 132 400
caSh SUrpLUS/DeFIcIt (19 698) (10 644) (25 925)
caSh BaLaNce at BeGINNING OF perIOD 32 850 13 152 2 508
CASH ON HAND AT END OF PERIOD 13 152 2 508 (23 417)
Cash from debtors April May June
January (42 000 × 20%) 8 400
February (38 000 × 25%) 9 500
(38 000 × 20%) 7 600
March (37 400 × 50% × 96%) 17 952
(37 400 × 25%) 9 350
(37 400 × 20%) 7 4808
april (46 700 × 50% × 96%) 22 416
(46 700 × 25%) 11 675
May (41 500 × 50% × 96%) 19 920
35 853 39 366 39 075

308 s e c t i o n 5 • c h a p t e r 1 1
Activity 11.9 LB page 407
Mayosi TradersCash Budget for the period 1 January 2018 to 28 February 2018
Jan 2018 Feb 2018 Totals
RECEIPTS
cash sales (228 000 × 50%) (283 000 × 50%) 114 000 141 500 255 500
collections from debtors 113 067 123 462 236 529
Loan: BF Bank – 20 000 20 000
Vehicles 35 000 – 35 000
TOTAL RECEIPTS 262 067 284 962 547 029
PAYMENTS
cash purchases (231 000 × 20%) (192 000 × 20%) 46 200 38 400 84 600
payments to creditors (222 000 × 80% × 97%) (231 000 × 80% × 97%) 172 272 179 256 351 528
Salaries (42 000 + 6 000 – 8 000) [(42 000 × 150%) + 8 000] 40 000 71 000 111 000
Drawings (8 000 – 2 600) (9 000 – 2 600) 5 400 6 400 11 800
Vehicles (120 000 ÷ 10) – 12 000 12 000
Sundry expenses [3 800 + (44 500 × 90%)] [4 450 + (45 600 × 90%)] 43 850 45 490 89 340
Interest on loan (30 000 × 18% × 1 __ 12 ) (50 000 × 18% × 1 __ 2 ) 450 750 1 200
TOTAL PAYMENTS 308 172 353 296 661 468
caSh SUrpLUS/DeFIcIt (46 105) (68 334) (114 439)
caSh BaLaNce at BeGINNING OF perIOD (8 800) (54 905) (8 800)
CASH ON HAND AT END OF PERIOD (54 905) (123 239) (123 239)
Mayosi TradersDebtors Collection Schedule for the period 1 January 2018 to 28 February 2018
Period Credit sales Collections Jan 2018
Collections Feb 2018
Bad debts
November 2017 r127 500 (× 15%) (× 5%) 19 125 – 6 375
December 2017 r135 000 (× 25%) (× 15%) (× 5%) 33 750 20 250 6 750
January 2018 r114 000 (× 55%) (× 96%) (× 25%) 60 192 28 500 –
February 2018 r141 500 (× 55%) (× 96%) – 74 712 –
113 067 123 462 13 125

309s e c t i o n 5 • c h a p t e r 1 1
Activity 11.10 LB page 409
Mbalula TradersCash Budget for the period 1 to 31 August 2016
August 2016
RECEIPTS
cash sales 22 600
cash from debtors 70 520
June (88 200 × 15%) 13 230
July (60 500 × 30%) 18 150
august (82 400 × 50% × 95%) 39 140
rent income (6 000 × 115%) 6 900
TOTAL RECEIPTS 100 020
PAYMENTS
cash purchases [(22 600 + 82 400) × 100 ___ 150 × 30%] 21 000
payments to creditors [(18 400 + 60 500) × 100 ___ 150 × 70%] 36 820
Drawings 2 000
Salaries (20 000 × 108%) 21 600
Other operating expenses 14 500
Bank charges 1 500
TOTAL PAYMENTS 97 420
caSh SUrpLUS/DeFIcIt 2 600
caSh BaLaNce at BeGINNING OF perIOD (8 200)
CASH ON HAND AT END OF PERIOD (5 600)

310 s e c t i o n 5 • c h a p t e r 1 1
Activity 11.11 (challenge) LB page 410
Marley TradersCash Budget for the period 1 January 2017 to 31 March 2017
Jan 2017 Feb 2017 Mar 2017
RECEIPTS
cash sales (see calculations below) 1 300 1 500 1 350
collections from debtors 10 746 11 205 11 907
November (9 900 × 36%) 3 564 – –
December (12 600 × 60% × 95%) 7 182 – –
(12 600 × 36%) – 4 536 –
January (11 700 × 60% × 95%) – 6 669 –
(11 700 × 36%) – – 4 212
February (13 500 × 60% × 95%) – – 7 695
rent income* (1 650 × 110%) 1 650 1 650 1 815
Interest on fixed deposit (24 000 × 14% × 3 __ 12 ] – – 840
Vehicles [(25 000 – 18 000) + 2 800] 9 800 – –
TOTAL RECEIPTS 23 496 14 355 15 912
PAYMENTS
cash purchases (see calculations below) 1 300 1 500 1 350
payments to creditors (see calculations below) 5 600 5 200 6 000
Insurance (800 + 3 000) 800 3 800 800
Sundry expenses (66 000 ÷ 12) 5 500 5 500 5 500
Wages (2 750 × 100 ___ 110 %) 2 500 2 500 2 750
TOTAL PAYMENTS 15 700 18 500 16 400
caSh SUrpLUS/DeFIcIt 7 796 (4 145) (488)
caSh BaLaNce at BeGINNING OF perIOD (3 400) 4 396 251
CASH ON HAND AT END OF PERIOD 4 396 251 (237)
* Let rent income per month at the beginning of the previous year = rThen: (2 × r) + (10 × 1,1 × r) = R19 500 13r = R19 500 r = R1 500Rent per month from 1 March 2016 = R1 500 × 110% = R1 650
CalculationsCredit sales November
2016December
2016January
2017February
2017March
2017
total sales [(120 000 ÷ 12) × 130%]
(15 000 × 90%)
11 000 14 000 13 000 15 000 13 500
cash sales (10%) 1 100 1 400 1 300 1 500 1 350
credit sales (90%) 9 900 12 600 11 700 13 500 12 150
total purchases (50% of total sales) 5 500 7 000 6 500 7 500 6 750
cash purchases (20%) 1 100 1 400 1 300 1 500 1 350
credit purchases (80%) 4 400 5 600 5 200 6 000 5 400

311s e c t i o n 5 • c h a p t e r 1 1
Activity 11.12 LB page 411
1.Sharp StoresCash Budget for the period 1 March 2016 to 30 April 2016
Mar 2016 Apr 2016 Total budget
RECEIPTS
cash sales 52 500 67 500 120 000
collections from debtors 195 750 228 750 424 500
previous month 96 000 48 000 144 000
March 99 750 52 500 152 250
april – 128 250 128 250
capital contribution – 20 000 20 000
Vehicles sales (30 000 – 12 000 + 4 000) – 22 000 22 000
Interest on fixed deposit 1 875 – 1 875
TOTAL RECEIPTS 250 125 338 250 588 375
PAYMENTS
payments to creditors *136 500 **181 500 318 000
Drawings 2 500 2 500 5 000
Interest on mortgage loan 2 400 1 200 3 600
Mortgage loan – 60 000 60 000
Salaries 48 000 24 000 72 000
Operating expenses (other) 41 600 49 175 90 775
purchase of vehicle – 60 000 60 000
TOTAL PAYMENTS 231 000 378 375 609 375
caSh SUrpLUS/DeFIcIt 19 125 (40 125) (21 000)
caSh BaLaNce at BeGINNING OF perIOD (17 000) 2 125 (17 000)
CASH ON HAND AT END OF PERIOD 2 125 (38 000) (38 000)
* R135 000 + 1 500 ** R180 000 + 1 500
2. The following problems may arise:• Thebusiness’saccountwillexceeditslimitasaresultof thevehicle
that was purchased.• Jacquesshouldratherhavewaiteduntilhehadthenecessarycash
before selling the old vehicle and buying the new one.• Hecouldpossiblyincreasehiscapitalcontributiontobuythenew
vehicle, should he have enough money available.• Hisbestoptionistousethemoneyinvestedinfixeddepositstobuy
the vehicle.• Hecouldborrowthemoneytobuythevehicle,butthenhewillhave
to pay interest on the loan.

312 s e c t i o n 5 • c h a p t e r 1 1
Activity 11.13 LB page 416
Sipho StoresProjected Income Statement for the month ended 31 March 2017
Sales (18 000 × [160%/60%]) r48 000
LeSS: cost of sales (18 000 × [100%/60%]) (30 000)
Gross profit 18 000
aDD: Other income 5 220
rent income 5 220
Gross operating income 23 220
LeSS: Operating expenses (18 480)
Wages [(84 000 ÷ 12) × 2 __ 3 ] 10 500
advertising (7 800 ÷ 3) 2 600
Insurance (18 000 ÷ 12) + (4 800 ÷ 6) 2 300
Stationery 550
Sundry expenses [(27 600 × 110%) ÷ 12] 2 530
Operating profit (loss) 4 740
aDD: Interest income (78 000 × 14% × 1 __ 12 ) 910
Profit (loss) before interest expense 5 650
LeSS: Interest expense –
Net profit (loss) for the month 5 650
* Mark-up = 150 000 ______ 250 000 × 100 ___ 1 = 60%
Activity 11.14 LB page 417
1.Kylie’s Surf ShopProjected Income Statement for the two months ended 31 December 2017
Nov 2017 Dec 2017
Sales* 28 400 55 000
LeSS: cost of sales (28 400 × 100 ____ 133 1 __ 3
) (55 000 × 100 ____ 133 1 __ 3
) (21 300) (41 250)
Gross profit 7 100 13 750
aDD: Other income 2 500 5 000
rent income (2 500 × 2) 2 500 5 000
Gross operating income 9 600 18 750
LeSS: Operating expenses (16 950) (9 150)
advertising (3 500 + 1 500) 5 000 1 500
Salaries 2 800 2 800
rent expense 2 200 2 200
repairs 4 300 –
Depreciation (18 000 × 10% × 1 __ 12 ) 150 150
Sundry expenses 2 500 2 500
Operating profit (loss) (7 350) 9 600
aDD: Interest income – –
Profit (loss) before interest expense (7 350) 9 600
LeSS: Interest expense (50 000 × 15% × 1 __ 12 ) (625) (625)
Net profit (loss) (7 975) 8 975
* Sales for November = (1 800 × 8) + (1 400 × 10) = R28 400 Sales for December = (1 800 × 15) + (1 400 × 20) = R55 000

313s e c t i o n 5 • c h a p t e r 1 1
2. Answer could be “yes” or “no”, but answer should be supported by reasons and references to the Projected Income Statement, such as:• Yes,Kylieshouldstartthebusinessbecause:
– although she can expect to make a loss of about R8 000 in the firstmonth,sheshouldmakeaprofitof aboutR9000inthesecond month.
– theexpectedlossinthefirstmonthismainlyduetothelimitedsales volumes and the additional start-up expenses (advertising and repairs).
– from the second month the sales volumes are expected to almost double, while the operating expenses are expected to decrease by about R7 800 (R16 950 – R9 150).
– the sales volumes should hopefully increase as her shop becomes more established.
– from the second month, the rent income of R5 000 per month will cover about half her monthly expenses (of about R10 000), sohermonthlyprofitfromsaleswillonlyhavetobeaboutR5000to break even.
OR:• No,Kylieshouldnotstartthebusinessbecause:
– itisexpectedthatshewillmakealossof aboutR8000inthefirstmonth and will have to almost double her sales in the second month just to cover this loss.
– evenif shecansustaintheprofitexpectedinthesecondmonth,she still has to take into account the tax that she will need to pay. The amount that she will earn after paying tax is not worth taking on the risks involved with running a business.
– these projections are based on two month during middle of summer (November and December), which is a time when many peopletakeupsurfing.Hersalesvolumesandrentalincomemightbe expected to decrease substantially during the winter month.
Case study 11.1 LB page 418
1.Bag It Projected Income Statement for the period 1 September 2016 to 28 February 2017
Sep 2016 Oct 2016 Nov 2016 Dec 2016 Jan 2017 Feb 2017
Sales – 45 000 48 000 90 000 63 000 27 000
LeSS: cost of sales – (21 000) (22 000) (36 000) (26 000) (15 000)
Gross profit – 24 000 26 000 54 000 37 000 12 000
aDD: Other income
LeSS: Operating expenses (17 000) (17 300) (17 300) (19 700) (17 850) (17 850)
Salaries 6 000 6 000 6 000 6 000 6 300 6 300
Wages 5 000 5 000 5 000 5 600 5 250 5 250
rent expense 3 300 3 300 3 300 3 300 3 300 3 300
Water and electricity 500 500 500 500 500 500
telephone 500 500 500 500 500 500
Insurance – 300 300 300 300 300
advertising/Marketing – – – 1 800 – –
Other overheads 1 000 1 000 1 000 1 000 1 000 1 000
Depreciation 700 700 700 700 700 700

314 s e c t i o n 5 • c h a p t e r 1 1
Operating profit (loss) (17 000) 6 700 8 700 34 300 19 150 (5 850)
aDD: Interest income – – – – – –
LeSS: Interest expense – (800) (800) (800) (800) (800)
Net profit (loss) (17 000) 5 900 7 900 33 500 18 350 (6 650)
2.Bag ItDebtors Collection Schedule for the period 1 September 2016 to 28 February 2017
Period Credit sales Collections Sep 2016
Collections Oct 2016
Collections Nov 2016
Collections Dec 2016
Collections Jan 2017
Collections Feb 2017
October 2016 r15 000 6 000 9 000
November 2016 r16 000 6 400 9 600
December 2016 r30 000 12 000 18 000
January 2017 r21 000 8 400
– – 6 000 15 400 21 600 26 400
3.Bag It Cash Budget for the period 1 September 2016 to 28 February 2017
Sep 2016 Oct 2016 Nov 2016 Dec 2016 Jan 2017 Feb 2017
receIptS
cash sales – 30 000 32 000 60 000 42 000 18 000
collections from debtors – – 6 000 15 400 21 600 26 400
capital contribution 100 000 – – – – –
Loan 100 000 – – – – –
TOTAL RECEIPTS 200 000 30 000 38 000 75 400 63 600 44 400
PAYMENTS
cash purchases of stock 10 000 10 700 20 000 13 000 6 000 6 000
payments to creditors – – 5 000 5 300 10 000 7 000
repayment of loan – 400 400 400 400 400
Interest on loan – 800 800 800 800 800
purchase of equipment 70 000 – – – – –
Salaries 6 000 6 000 6 000 6 000 6 300 6 300
Wages 5 000 5 000 5 000 5 600 5 250 5 250
rent expense 6 600 3 300 3 300 3 300 3 300 3 300
Water and electricity – 500 500 500 500 500
telephone – 500 500 500 500 500
Insurance – 300 300 300 300 300
advertising/Marketing – – – 1 800 – –
Other overheads 1 000 1 000 1 000 1 000 1 000 1 000
TOTAL PAYMENTS 98 600 28 500 42 800 38 500 34 350 31 350
caSh SUrpLUS/DeFIcIt 101 400 1 500 (4 800) 36 900 29 250 13 050
caSh BaLaNce at BeGINNING OF perIOD – 101 400 102 900 98 100 135 000 164 250
CASH ON HAND AT END OF PERIOD 101 400 102 900 98 100 135 000 164 250 177 300

315s e c t i o n 5 • c h a p t e r 1 1
4. a. ThereasonforMarie’santicipatedhighsalesfiguresinDecembercanbeascribed to her planned marketing campaign, as well as to the fact that it will be holiday season, when people spend more than at other times.
b. No, it is not necessary for Marie to take out a loan. If she does not have to pay the interest, the capital contribution of R100 000 would be enough for her to make all her payments.
Informal assessment 11.1 LB page 425
Marks: 66 Time: 40 minutes1.Camel Traders Debtors Collection Schedule for the period 1 March 2018 to 30 April 2018
Period Credit sales Collections Mar 2018
Collections Apr 2018
January 2018 (25 000 × 60% × 15%) ✓✓✓ 2 250 –
February 2018 (32 000 × 60% × 30%) ✓✓✓ 5 760 –
(32 000 × 60% × 15%) – ✓✓✓ 2 880
March 2018 (26 000 × 60% × 50% × 96%) ✓✓✓✓ 7 488 –
(26 000 × 60% × 30%) – ✓✓✓ 4 680
april 2018 (28 000 × 60% × 50% × 96%) – ✓✓✓✓ 8 064
15 498 15 624
[20]2.Camel TradersCash Budget for the period 1 March 2018 to 30 April 2018
Mar 2018 Apr 2018
RECEIPTS
cash sales (26 000 × 40%) (28 000 × 40%) ✓✓ 10 400 ✓✓ 11 200
collections from debtors ✓ 15 498 ✓ 15 624
Interest on fixed deposit (20 000 × 12 1 __ 2 % × 3 __ 12 ) ✓✓✓ 625
rent income (990 × 2) ✓✓✓ 1 980 ✓✓ 990
TOTAL RECEIPTS 28 503 27 874
PAYMENTS
cash purchases of stock (13 000 × 30%) (14 000 × 30%) ✓✓✓ 3 900 ✓✓✓ 4 200
payments to creditors (16 000 × 70% × 95%) (13 000 × 70% × 95%) ✓✓✓✓ 10 640 ✓✓✓✓ 8 645
Stationery (5 600 × 25%) (5 600 × 75%) ✓✓ 1 400 ✓✓ 4 200
Drawings (3 600 – 100) ✓ 3 500 ✓ 3 500
Insurance [(4 800 ÷ 12) ÷ 75] ✓✓ 475 ✓ 475
Sundry expenses [(18 000 ÷ 12) × 108%] ✓✓ 1 620 ✓ 1 620
TOTAL PAYMENTS 21 535 22 640
caSh SUrpLUS/DeFIcIt ✓ 6 968 ✓ 5 234
caSh BaLaNce at BeGINNING OF perIOD ✓ (3 450) ✓ 3 518
CASH ON HAND AT END OF PERIOD ✓ 3 518 ✓ 8 752
* Let rent income per month at the beginning of the previous year = rThen: (10 × r) + (2 × 1,1 × r) = R10 980 12,2 r = R10 980 r = R900Rentpermonthfrom1January2018=R900×110%=R990 [46]

316 s e c t i o n 5 • c h a p t e r 1 1
Project 11.1 LB page 426
Usetherubricbelowtoassessthelearners’competenceindrawingupaProjected Income Statement.
Criteria 7 6 5 4 3 2 1
Learner has drawn up a basic business plan showing how the business would generate and manage income, main expenses, target market, competitive edge, number of employees, advertising strategy, and so on.
projected Income Statement: the data and information selected from resources are relevant. Information is coherent and presented logically.
comment on the viability of the business: knowledge and understanding. conclusion is based on the evidence and shows independent reasoning.
presentation: all sources that were consulted are properly acknowledged. technical quality: effort made.
Originality and creativity
Key:7 Outstanding 80–100%
6 Meritorious 70–79%
5 Substantial 60–69%
4 adequate 50–59%
3 Moderate 40–49%
2 elementary 30–39%
1 Not achieved 20–29%
Total: out of 35

317s e c t i o n 5 • c h a p t e r 1 2
CHAPTER 12 Inventory systems
Activity 12.1 LB page 433
Criteria Perpetual Periodic
1.When stock is bought, the cost price is debited to the:
Cost of Sales accountNo entry as there is no Cost of Sales account
2.When stock is sold, the cost price is credited to the:
Trading Stock accountNo entry as the cost price cannot be determined
3. how is cost of sales determined?By using a profit mark-up percentage
cost of sales cannot be determined
4.carriage on purchases and custom duty is debited to the:
Trading Stock accountCarriage on Purchases and Customs Duty accounts
5.When stock is returned by a customer, the cost price is debited to the:
Trading Stock accountNo entry as cost price cannot be determined
6.When stock is returned to a supplier, the cost price is credited to:
Trading Stock account Purchases account
7.how is the value of closing stock determined?
By checking the closing balance in the Trading Stock account and by doing a physical stock take
By doing a physical stock take
8.how does the business determine stock losses?
By comparing the closing balance in the Trading Stock account with the value of the stock take
By determining the profit mark-up % attained with the intended profit mark-up %
Activity 12.2 LB page 433
1. Because in this system, no continuous record of stock is kept2. Cost of sales cannot be determined at the point of sale because a fixed
profit mark-up is not maintained.3. Account to be debited: Purchases Account to be credited: Creditors Control4. Account to be debited: Bank Account to be credited: Sales5. Account to be debited: Carriage on Purchases Account to be credited: Bank6. In order to determine the amount of stock they are holding and in order
to determine possible stock losses7. A business selling a variety of items that are marked up differently8. The government charged taxes on imports to increase their revenue and
to encourage South African businesses to buy goods within our borders.

318 s e c t i o n 5 • c h a p t e r 1 2
Activity 12.3 LB page 434
Perpetual stock system
Advantages Disadvantages
Trading Stock account is continually updated when stock is bought and sold therefore
there is better control over the movement of stock.
Because this system is complex, expensive computer equipment is required to administer it.
the balance in the Trading Stock account (closing stock) should, at any time, be equal
to the actual value of stock in the store therefore stock losses can easily be detected.
easy to determine trading stock deficit
(Book value – physical value).
Periodic stock system
Advantages Disadvantages
this system is cheaper to administer as it does not require expensive computer
equipment.
the value of closing stock is determined by a physical stock take done periodically therefore it is very
difficult to determine stock losses after a stock take has been done.
No Trading Stock Deficit account. It is difficult to determine because a continuous balance of stock on
hand is not kept.
Activity 12.4 LB page 434
1.Cash Receipts Journal of Affordable Building Supplies for August 2019
Doc. no. Day Details Fol.
Analysisof receipts Bank Sales
Debtorscontrol
Discount allowed
Sundry accountsAmount Details
03 Sales 2 288 00 2 288 0064 Naran Paints 1 729 00 4 017 00 1 850 00 121 00
07 Sales 2 400 00 2 400 00 2 400 0014 MT Plumbers 1 200 00 1 200 00 1 200 00 Bad debts recovered15 Sales 8 480 00 8 480 00
66 Naran Paints 937 00 9 417 00 937 0022 Sales 6 600 00 6 600 00
67 Maxi Builders 2 400 00 9 000 00 2 400 00 Rent income
B/S 28 National Bank 84 00 84 00Interest on current account
26 118 00 19 768 00 2 787 00 121 00 3 684 00

319s e c t i o n 5 • c h a p t e r 1 2
2.Cash Payments Journal of Affordable Building Supplies for August 2019
Doc. no. Day Name of payee Fol. Bank Purchases
Creditors Control
Discount received
Debtors Control
Sundry accountsAmount Details
187 01 Milestone Traders 4 400 00 4 400 00188 02 Ash Suppliers 1 649 00 1 736 00 87 00189 06 Giardino Moulds 6 400 00 6 050 00 350 00 Drawings190 12 Cavalry Stationery 214 00 214 00 Stationery181 Cash 3 569 00 3 569 00 Creditors for wagesD/N 13 Naran Paints 1 729 00 1 729 00192 18 Zamani Traders 5 280 00 4 500 00 780 00 Stationery193 22 Municipality 640 00 640 00 Water & rates194 195 25 Employees 14 336 00 14 336 00 Creditors for salariesB/S 28 National Bank 293 00 293 00 Bank charges
N-Sure 500 00 500 00 InsuranceCarFin 2 400 00 2 400 00 Loan: CarFin
196 30 Cash 850 00 850 00 Drawings42 260 00 14 950 00 1 736 00 87 00 1 729 00 23 932 00
3.Debtors Journal of Affordable Building Supplies for August 2019Doc. no. Day Debtor Fol. Sales89 07 D’ Argie Builders 1 224 00
90 Seal Roofing 3 122 00
91 Balu Electricians 4 780 00
92 22 D’ Argie Builders 3 200 00
12 326 00
4.Debtors Allowances Journal of Affordable Building Supplies for August 2019Doc. no. Day Debtor Fol. Debtors allowances21 09 D’ Argie Builders 24 00
5.Creditors Journal of Affordable Building Supplies for August 2019
Doc. no. Day Creditor Fol.
Creditors Control Purchases
Sundry accounts
Amount Details52 06 Tiger Brands 2 848 00 2 848 00
53 08 Auto Repairs 887 00 887 00 Repairs
54 22 Alpha Building Supplies 8 210 00 8 210 00
11 945 00 11 058 00 887 00
6.Creditors Allowances Journal of Affordable Building Supplies for August 2019
Doc. no. Day Creditor Fol.
Creditors Control
Creditors allowances
Sundry accounts
Amount Details7 23 Alpha Building Supplies 525 00 525 00

320 s e c t i o n 5 • c h a p t e r 1 2
7.General Journal of Affordable Building Supplies for August 2019
Day Details Fol. Debit Credit
Debtors Control
Debit Credit
12 Donations 850 00
Purchases 850 00
13 Naran Paints 121 00 121 00
Discount allowed 121 00
Naran Paints 24 00 24 00
Interest received/Interest income 24 00
15 Bad debts 937 00
Naran Paints 937 00 937 00
23 Drawings 650 00
Purchases 650 00
145 00 937 00
8.Petty Cash Journal of Affordable Building Supplies for August 2019
Doc. no. Day Details Fol. Petty cash Purchases
Carriage on purchases
Sundry accounts
Amount Details Fol.18 08 Star Express 128 00 128 00
19 18 Star Express 150 00 150 00
20 22 Packing material 28 00 28 00 Packing material
21 23 Postage 32 00 32 00 Postage
338 00 278 00 60 00
Activity 12.5 LB page 436
1.Cash Receipts Journal of The Plant People for August 2020
Doc. no. Day Details Fol.
Analysisof receipts Bank Sales
Debtorscontrol
Discount allowed
Sundry accountsAmount Details Fol.
144 02 L Truter 740 00 800 00 60 00Sales 6 736 00 7 476 00 6 736 00
145 08 J Jacobs 365 00 365 00Bad debts recovered
Sales 8 368 00 8 733 00 8 368 00146 10 K Joubert 1 560 00 1 560 00
Sales 3 632 00 5 192 00 3 632 0027 Sales 6 848 00 6 848 00 6 848 00
147 29 D Conradie 1 050 00 1 050 00 1 200 00 150 0029 299 00 25 584 00 3 560 00 210 00 365 00

321s e c t i o n 5 • c h a p t e r 1 2
2.Cash Payments Journal of The Plant People for August 2020
Doc. no. Day Name of payee Fol. Bank Purchases Wages
Creditors Control
Discount received
Sundry accountsAmount Details Fol.
188 01 Cash 200 00 200 00 Petty cash189 04 George Hardware 1860 00 2 000 00 140 00190 06 Forest Wholesalers 4010 00 4 010 00191 14 Cash 6 580 00 6 400 00 180 00
192 15 Municipality 570 00 570 00Water and electricity
193 16 Piet’s Farm 6 880 00 6 880 00194 17 JJ the Handyman 3 625 00 3 625 00 Equipment195 20 Cash 6400 00 6 400 00196 21 Telkom 625 00 625 00 Telephone197 27 DJ Printers 670 00 700 00 30 00
31 420 00 6 880 00 12 800 00 6 710 00 170 00 5 200 00
3.Creditors Journal of The Plant People for August 2020
Doc. no. Day Creditor Fol.
Creditors Control Purchases Stationery Equipment
Sundry accounts
Amount Details Fol.112 04 Forest Wholesalers 3 112 00 3 112 00
113 13 George Hardware 1 860 00 1 860 00
114 23 Forest Wholesalers 6 550 00 4 220 00 2 330 00
115 28 DJ Printers 2 680 00 1 230 00 1 450 00 Advertising
14 202 00 7 332 00 1 230 00 4 190 00 1 450 00
Creditors Allowances Journal of The Plant People for August 2020
Doc. no. Day Creditor Fol.
Creditors Control
Creditors allowances Stationery Equipment
Sundry accounts
Amount Details Fol.56 06 Forest Wholesalers 500 00 500 00
57 16 George Hardware 330 00 330 00
58 29 DJ Printers 100 00 100 00
930 00 500 00 100 00 330 00
4.Debtors Journal of The Plant People for August 2020Doc. no. Day Debtor Fol. Sales104 02 D Conradie 480 00
105 15 K Joubert 896 00
106 24 E Wilken 1 032 00
2 568 00
Debtors Allowances Journal of The Plant People for August 2020Doc. no. Day Debtor Fol.
Debtors Allowances
23 17 K Joubert 88 00
24 25 E Wilken 72 00
160 00

322 s e c t i o n 5 • c h a p t e r 1 2
5.Petty Cash Journal of The Plant People for August 2020
Doc. no. Day Details Fol. Petty cash Purchases Stationery
Sundry accounts
Details Fol.32 05 Mill Stores 80 00 80 00
33 19 Makro 60 00 60 00
34 25 Wages 40 00 40 00 Wages
180 00 80 00 60 00 40 00
6.General Journal of The Plant People for August 2020
Day Details Fol. Debit Credit
Debtors Control Creditors Control
Debit Credit Debit Credit
01 Vehicles 50 000 00
Capital 50 000 00
(Owner gave personal van for business use)
05 Drawings 560 00
Purchases 560 00
(Owners wife took plants for own use)
09 Interest paid 16 00
DJ Printers 16 00 16 00
(Creditor charged interest on overdue account)
16 D Conradie 12 00 12 00
Interest received 12 00
(Charged overdue debtor’s account with interest)
27 Bad debts 1 250 00
L Truter 1 250 00 1 250 00
(Wrote off account as irrecoverable)
31 Stationery 210 00
Purchases 210 00
(Correction of error)
12 00 1 250 00 16 00

323s e c t i o n 5 • c h a p t e r 1 2
Activity 12.6 LB page 441
No.
Perpetual stock system Periodic stock system
Account to be debited
Account to be credited
Account to be debited
Account to be credited
1. trading stock creditors control purchases creditors control
2. Debtors control Sales Debtors control Sales
cost of sales trading stock
3. trading stock Bank carriage on purchases
Bank
4. Donations trading stock Donations purchases
5. Bank Sales Bank Sales
cost of sales trading stock
6. Debtors allowances Debtors control Debtors allowances Debtors control
trading stock cost of sales
7. creditors control trading stock creditors control purchases
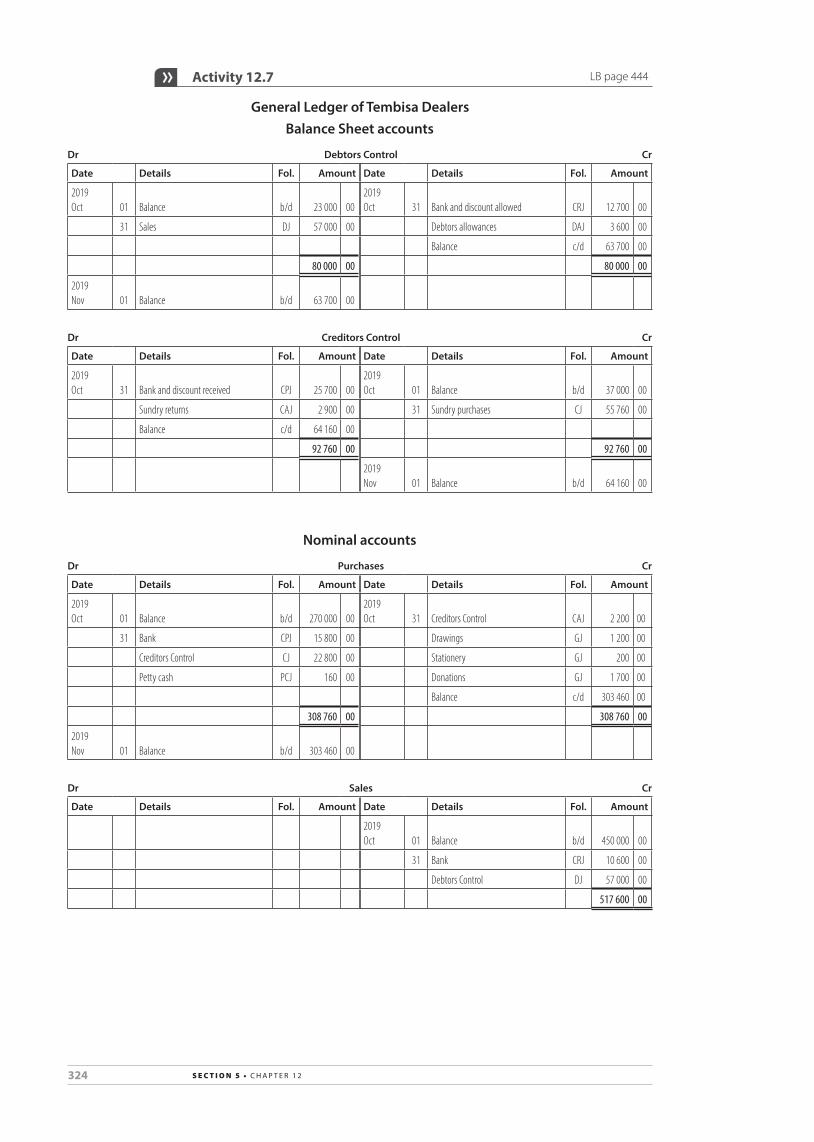
324 s e c t i o n 5 • c h a p t e r 1 2
Activity 12.7 LB page 444
General Ledger of Tembisa DealersBalance Sheet accounts
Dr Debtors Control Cr
Date Details Fol. Amount Date Details Fol. Amount
2019 Oct 01 Balance b/d 23 000 00
2019 Oct 31 Bank and discount allowed CRJ 12 700 00
31 Sales DJ 57 000 00 Debtors allowances DAJ 3 600 00
Balance c/d 63 700 00
80 000 00 80 000 00
2019 Nov 01 Balance b/d 63 700 00
Dr Creditors Control Cr
Date Details Fol. Amount Date Details Fol. Amount
2019 Oct 31 Bank and discount received CPJ 25 700 00
2019 Oct 01 Balance b/d 37 000 00
Sundry returns CAJ 2 900 00 31 Sundry purchases CJ 55 760 00
Balance c/d 64 160 00
92 760 00 92 760 00
2019 Nov 01 Balance b/d 64 160 00
Nominal accounts
Dr Purchases Cr
Date Details Fol. Amount Date Details Fol. Amount
2019 Oct 01 Balance b/d 270 000 00
2019 Oct 31 Creditors Control CAJ 2 200 00
31 Bank CPJ 15 800 00 Drawings GJ 1 200 00
Creditors Control CJ 22 800 00 Stationery GJ 200 00
Petty cash PCJ 160 00 Donations GJ 1 700 00
Balance c/d 303 460 00
308 760 00 308 760 00
2019 Nov 01 Balance b/d 303 460 00
Dr Sales Cr
Date Details Fol. Amount Date Details Fol. Amount
2019 Oct 01 Balance b/d 450 000 00
31 Bank CRJ 10 600 00
Debtors Control DJ 57 000 00
517 600 00

325s e c t i o n 5 • c h a p t e r 1 2
Dr Carriage on Purchases Cr
Date Details Fol. Amount Date Details Fol. Amount
2019 Oct 01 Balance b/d 17 800 00
31 Bank CPJ 4 000 00
Creditors Control CJ 650 00
Petty cash PCJ 80 00
22 530 00
Dr Debtors Allowances Cr
Date Details Fol. Amount Date Details Fol. Amount
2019 Oct 01 Balance b/d 11 400 00
31 Debtors Control DAJ 3 600 00
15 000 00
Activity 12.8 LB page 445
1. – 2. General Ledger of Du Toit TradersBalance Sheet accounts
Dr Debtors Control Cr
Date Details Fol. Amount Date Details Fol. Amount
2019 Nov 01 Balance b/d 8 742 00
2019 Nov 30 Bank and discount allowed CRJ 33 200 00
30 Sales DJ 62 480 00 Debtors allowances DAJ 5 560 00
Journal debits GJ 127 00 Journal credits GJ 475 00
Balance c/d 32 114 00
71 349 00 71 349 00
2019 Dec 01 Balance b/d 32 114 00
Dr Equipment Cr
Date Details Fol. Amount Date Details Fol. Amount
2019 Nov 01 Balance b/d 120 205 00
2019 Nov 30 Creditors Control CAJ 2 370 00
30 Creditors Control CJ 28 230 00 Balance c/d 146 065 00
148 435 00 148 435 00
2019 Dec 01 Balance b/d 146 065 00
Dr Creditors Control Cr
Date Details Fol. Amount Date Details Fol. Amount
2019 Nov 30 Bank and discount received CPJ 25 980 00
2019 Nov 01 Balance b/d 3 508 00
Sundry returns CAJ 25 980 00 30 Sundry purchases CJ 86 120 00
Journal debits GJ 132 00 Journal credits GJ 350 00
Balance c/d 53 071 00
89 978 00 89 978 00
2019 Dec 01 Balance b/d 53 071 00
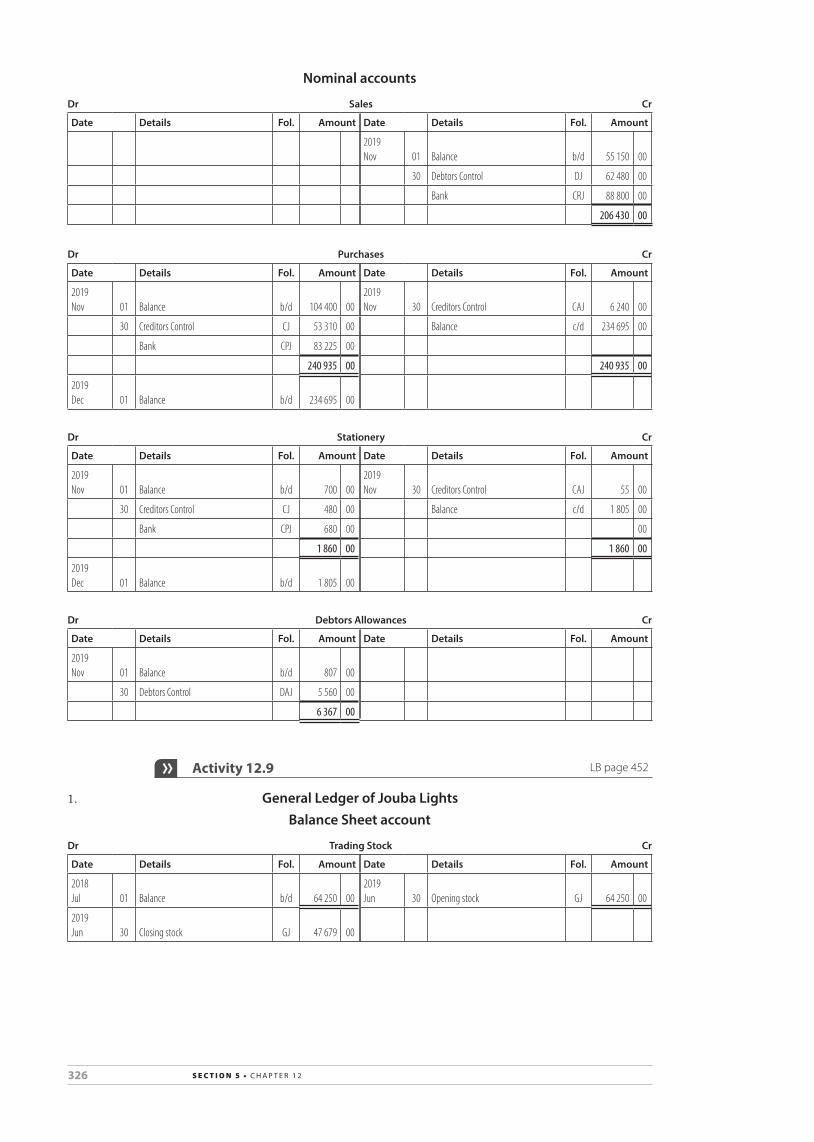
326 s e c t i o n 5 • c h a p t e r 1 2
Nominal accounts
Dr Sales Cr
Date Details Fol. Amount Date Details Fol. Amount
2019 Nov 01 Balance b/d 55 150 00
30 Debtors Control DJ 62 480 00
Bank CRJ 88 800 00
206 430 00
Dr Purchases Cr
Date Details Fol. Amount Date Details Fol. Amount
2019 Nov 01 Balance b/d 104 400 00
2019 Nov 30 Creditors Control CAJ 6 240 00
30 Creditors Control CJ 53 310 00 Balance c/d 234 695 00
Bank CPJ 83 225 00
240 935 00 240 935 00
2019 Dec 01 Balance b/d 234 695 00
Dr Stationery Cr
Date Details Fol. Amount Date Details Fol. Amount
2019 Nov 01 Balance b/d 700 00
2019 Nov 30 Creditors Control CAJ 55 00
30 Creditors Control CJ 480 00 Balance c/d 1 805 00
Bank CPJ 680 00 00
1 860 00 1 860 00
2019 Dec 01 Balance b/d 1 805 00
Dr Debtors Allowances Cr
Date Details Fol. Amount Date Details Fol. Amount
2019 Nov 01 Balance b/d 807 00
30 Debtors Control DAJ 5 560 00
6 367 00
Activity 12.9 LB page 452
1. General Ledger of Jouba LightsBalance Sheet account
Dr Trading Stock Cr
Date Details Fol. Amount Date Details Fol. Amount
2018 Jul 01 Balance b/d 64 250 00
2019 Jun 30 Opening stock GJ 64 250 00
2019 Jun 30 Closing stock GJ 47 679 00

327s e c t i o n 5 • c h a p t e r 1 2
Nominal accounts
Dr Sales Cr
Date Details Fol. Amount Date Details Fol. Amount
2019 Jun 30 Debtors allowances GJ 18 590 00
2019 Jun 01 Balance b/d 1 254 000 00
Trading account GJ 1 344 910 00 30 Bank CRJ 48 700 00
Debtors Control DJ 60 800 00
1 363 500 00 1 363 500 00
Dr Purchases Cr
Date Details Fol. Amount Date Details Fol. Amount
2019 Oct 01 Balance b/d 855 014 00
2019 Oct 31 Creditors Control CAJ 5 800 00
31 Bank CPJ 44 700 00 Drawings GJ 520 00
Creditors Control CJ 28 960 00 Trading account GJ 922 354 00
928 674 00 928 674 00
Dr Debtors Allowances Cr
Date Details Fol. Amount Date Details Fol. Amount
2019 Jun 01 Balance b/d 16 720 00
2019 Jun 30 Sales GJ 18 590 00
30 Debtors Control DAJ 1 870 00
18 590 00 18 590 00
Dr Carriage on Purchases Cr
Date Details Fol. Amount Date Details Fol. Amount
2019 Jun 01 Balance b/d 34 100 00
2019 Jun 30 Trading account GJ 35 985 00
30 Bank CPJ 840 00
Creditors Control CJ 1 045 00
35 985 00 35 985 00
Dr Opening Stock Cr
Date Details Fol. Amount Date Details Fol. Amount
2019 Jun 30 Trading stock GJ 64 250 00
2019 Jun 30 Trading account GJ 64 250 00
Dr Closing Stock Cr
Date Details Fol. Amount Date Details Fol. Amount
2019 Jun 30 Trading stock GJ 47 679 00
2019 Jun 30 Trading account GJ 47 679 00

328 s e c t i o n 5 • c h a p t e r 1 2
2.General Journal of Jouba Lights for June 2019
Day Fol. Debit Credit
30 Sales 18 590 00
Debtors allowances 18 590 00
(closing transfer)
Opening stock 64 250 00
trading stock 64 250 00
(Opening stock transferred to nominal account)
trading account 1 022 589 00
Opening stock 64 250 00
purchases 922 354 00
carriage on purchases 35 985 00
(closing transfer)
trading stock 47 679 00
closing stock 47 679 00
(closing stock taken into consideration)
Sales 1 344 910 00
closing stock 47 679 00
trading account 1 392 589 00
(closing transfer)
trading account 370 000 00
profit and loss 370 000 00
(transfer of gross profit)
3.Dr Trading account Cr
Date Details Fol. Amount Date Details Fol. Amount
2019 Jun 30 Opening stock GJ 64 250 00
2019 Jun 30 Sales GJ 1 344 910 00
Purchases GJ 922 354 00 Closing stock GJ 47 679 00
Carriage on purchases GJ 35 985 00
Profit and Loss GJ 370 000 00
1 392 589 00 1 392 589 00
Dr Profit and Loss account Cr
Date Details Fol. Amount Date Details Fol. Amount
2019 Jun 30 Trading account GJ 370 000 00
4. Opening stock R64 250
Purchases 922 354
Carriage on purchases 35 985
Goods available 1 022 589
Closing stock (47 679)
Cost of sales R974 910
Gross profit
_________ Cost of sales × 100 ___ 1
370 000 ______ 974 910 × 100 ___ 1
= 37,95% (profit mark-up achieved)

329s e c t i o n 5 • c h a p t e r 1 2
Activity 12.10 LB page 454
General Ledger of Dube TradersBalance Sheet account
Dr Trading Stock Cr
Date Details Fol. Amount Date Details Fol. Amount
2019 Feb 20 Balance b/d 27 255 00
2019 Feb 28 Opening stock GJ 27 830 00
28 Purchases GJ 575 00
27 830 00 27 830 00
28 Closing stock GJ 26 400 00
Nominal accounts
Dr Purchases Cr
Date Details Fol. Amount Date Details Fol. Amount
2019 Feb 01 Balance b/d 243 455 00
2019 Feb 28 Trading stock GJ 575 00
28 Donations GJ 570 00 Creditors Control CAJ 3 910 00
Creditors Control CJ 3 610 00 Trading account GJ 243 150 00
247 635 00 247 635 00
Dr Carriage on Purchases Cr
Date Details Fol. Amount Date Details Fol. Amount
2019 Feb 01 Balance b/d 4 945 00
2019 Feb 28 Trading account GJ 5 335 00
28 Creditors Control CJ 390 00
5 335 00 5 335 00
Final account
Dr Trading account Cr
Date Details Fol. Amount Date Details Fol. Amount
2019 Feb 28 Opening stock GJ 27 830 00
2019 Feb 28 Sales (372 190 – 3 220) GJ 368 970 00
Purchases GJ 243 150 00 Closing stock GJ 26 400 00
Carriage on purchases GJ 5 335 00
Custom duty GJ 3 950 00
Profit and loss GJ 115 105 00
395 370 00 395 370 00
Activity 12.11 LB page 455
1. General Ledger of Bergvliet Pet StoreNominal account
Dr Purchases Cr
Date Details Fol. Amount Date Details Fol. Amount
2019 Sep 01 Balance b/d 166 000 00
2019 Sep 29 Drawings: T Scott GJ 760 00
Creditors Control CJ 2 100 00 Trading account GJ 167 340 00
168 100 00 168 100 00

330 s e c t i o n 5 • c h a p t e r 1 2
Final account
Dr Trading account Cr
Date Details Fol. Amount Date Details Fol. Amount
2019 Sep 30 Opening stock GJ 55 000 00
2019 Sep 30 Sales (290 000 – 2 450) GJ 287 550 00
Purchases GJ 167 340 00 Closing stock (61 000 + 1 400) GJ 62 400 00
Carriage on purchases (11 000 + 105) GJ 11 105 00
Profit and loss GJ 116 505 00
349 950 00 349 950 00
2. Sales – Gross profit = Cost of sales R287 550 – 116 505 = R171 045
116 505 ______ 171 045 × 100 ___ 1 = 68%
3. Sales – Cost of sales = Gross profit R300 000 – 194 000 = R106 000
106 000 ______ 194 000 × 100 ___ 1 = 54,6%
No, she need not be concerned. Although her sales have dropped, she has made a higher percentage profit off her sales. She is actually better off than in the previous financial year because she is earning a higher percentage gross profit on cost of sales.
She should, however, be concerned that she has not achieved her intended profit mark-up of 75%. This could be due to the following factors: Theft, allowing too much discount or not marking her goods correctly.
4. Main advantages of the perpetual stock system• Acontinuousrecordof stockonhandiskept.• Thevalueof stocklossescanbeeasilydetermined.• Thecostpricecanbedeterminedatthepointof sale.
5. Main advantages of the periodic stock system• Itiseasytoadminister.• Recordkeepingissimple.• Itcanbeusedinanytypeof business.
Activity 12.12 (challenge) LB page 456
1. Sales – Gross profit = Cost of sales R1 590 770 – 433 590 = R1 157 180
2. Gross profit
___________ Cost of sales × 100 ___ 1
= 433 590 _________ 1 1257 180 × 100 ___ 1
= 37,4%

331s e c t i o n 5 • c h a p t e r 1 2
3. Yes, expenses are quite high. It is nearly 50% of gross profit.• Theycouldonlyemployoneshopassistant.• Theownersmightwanttobecomemoreinvolvedinthedaily
running of the business.• Theycouldrentasmallershop.• Thebusinessownstwovehicles.• Therunningcostsof thevehiclesarequitehigh.• Theycouldreducetheirloanandoverdrafttoavoidthehigh
finance costs.• If theyreducetheirstockholdingtheymightpaylessinsurance.
4. Yes, they must increase their profit mark-up. They must, however, remain competitive and not charge exorbitant prices. They might improve service delivery and thus keep loyal customers.
5. No, the debtors allowances are quite high, 2% of total sales. Too many debtors are returning stock. The owners need to tighten up on their returns policy.
6. No, they are either not counting their stock correctly during the stock take process or they are not recording their transactions correctly.
They cannot account for 2,6% of their stock. Advice: They need to take stock more regularly or process their
transactions more thoroughly.
7. The amount is shared among the partners according to the partnership agreement. It will be transferred to the Appropriation account where it will be divided into:• interestoncapital• salaries• remainingprofitshare.
Activity 12.13 LB page 457
1. General Ledger of Sunshine CaféNominal accounts
Dr Carriage on Purchases Cr
Date Details Fol. Amount Date Details Fol. Amount
2019 Feb 28 Balance 9 775 00
2019 Feb 28 Trading account 10 105 00
Creditors Control 330 00
10 105 00 10 105 00
Dr Purchases Cr
Date Details Fol. Amount Date Details Fol. Amount
2019 Feb 28 Balance 210 765 00
2019 Feb 28 Drawings 690 00
Creditors Control 4 800 00 Donations 1 380 00
Creditors Control 15 470 00
Trading account 198 025 00
215 565 00 215 565 00

332 s e c t i o n 5 • c h a p t e r 1 2
Final account
Dr Trading account Cr
Date Details Fol. Amount Date Details Fol. Amount
2019 Feb 28 Opening stock 98 000 00
2019 Feb 28 Sales (430 900 00 12 430) 418 470 00
Purchases 198 025 00 Closing stock 87 640 00
Carriage on purchases 10 105 00
Profit and loss 199 980 00
506 110 00 506 110 00
2. Cost price = R98 000 +198 025 + 10 105 – 87 640 = R218 490
OR = R418 470 – 199 980 = R218 490
Profit mark up % = 199 980 ______ 218 490 × 100 ___ 1
= 91,53%
3. The person ordering the stock must not count the stock when it arrives. Compare invoices with physical stock to delivery not when stock is
delivered. Ensure that regular a stock take is done. Keep stock in a secure place to ensure that stock does not get stolen. The person entering the invoices in the books must not also check the
delivery note. Ensure that staff at the tills are scanning all stock that is sold.
4. Prudence principle – If stock is bought at different prices then it should be valued at the most accurate and concervative realisable price.
Activity 12.14 (challenge) LB page 458
General Ledger of Seedgrow Seed TradersFinal account
Dr Trading account Cr
Date Details Fol. Amount Date Details Fol. Amount
2019 Feb 28 Opening stock 33 000 00
2019 Feb 28 Sales 111 000 00
Purchases 79 500 00 Closing stock * 34 800 00
Profit and loss #* 33 300 00
145 800 00 145 800 00
* Balancing figures
# Calculation for gross profit:111 000 × 30 ___ 100 = R33 300
Claim from insurance company:R34 800 – 800 = R34 000
Note:The closing stock should have been R34 800 if no fire took place.

333s e c t i o n 5 • c h a p t e r 1 2
Informal assessment 12.1 LB page 459
Marks: 35 Time: 25 minutes
No. Source document Journal Account to debit Account to credit Amount
1. Original invoice ✓ cJ purchases ✓✓ creditors control ✓ ✓4 104
packing material ✓✓ creditors control ✓ 680
2.cheque counterfoil ✓ cpJ
carriage on purchases ✓✓ Bank ✓✓ 166
3. Debit note ✓ caJ creditors control ✓ purchases ✓✓ 340
creditors control ✓ packing material ✓✓ 90
4. Duplicate invoice ✓ DJ Debtors control ✓✓ Sales ✓✓ 720
5. credit note ✓ DaJDebtors allowances ✓✓ Debtors control ✓✓ 240
6. Voucher ✓ GJ Drawings ✓✓ purchases ✓✓ 460
[35]
Informal assessment 12.2 LB page 460
Marks: 39 Time: 25 minutes
General Ledger of Mike TradersBalance Sheet account
Dr Trading Stock Cr
Date Details Fol. Amount Date Details Fol. Amount
2018 Jul ✓ 01 Balance b/d ✓ 28 620 00
2019 Jun 30 Opening stock GJ ✓✓ 28 620 00
2019 Jun 30 Closing stock GJ ✓✓ 30 980 00
[6]Nominal accounts
Dr Purchases Cr
Date Details Fol. Amount Date Details Fol. Amount
2019 Jun 01 Balance b/d ✓✓285 795 00
2019 Jun 30 Donations GJ ✓✓✓1 200 00
30 Creditors Control CJ ✓✓✓4 320 00 Drawings: Mike GJ ✓✓✓675 00
Creditors Control CAJ ✓✓4 590 00
Trading account GJ ✓✓283 650 00
290 115 00 290 115 00
[15]
Dr Carriage on Purchases Cr
Date Details Fol. Amount Date Details Fol. Amount
2019 Jun 01 Balance b/d ✓ 5 805 00
2019 Jun 30 Trading account GJ ✓✓✓6 205 00
30 Creditors Control CJ ✓✓400 00
6 205 00 6 205 00
[6]

334 s e c t i o n 5 • c h a p t e r 1 2
Final account
Dr Trading account Cr
Date Details Fol. Amount Date Details Fol. Amount
2019 June 30 Opening stock GJ ✓✓ 28 620 00
2019 June 30 Sales (436 255 – 3 780) GJ
✓✓✓✓ 432 475 00
Purchases GJ ✓ 283 650 00 Closing stock GJ ✓ 30 980 00
Carriage on purchases GJ ✓ 6 205 00
Profit and loss GJ ✓✓ 144 980 00
463 455 00 ✓ 463 455 00
[12]

335s e c t i o n 5 • c h a p t e r 1 3
CHAPTER 13 Value-added tax (VAT)
Activity 13.1 LB page 471
1. Value-added tax (VAT)2. VAT is the tax that is charged whenever goods are sold or services are
rendered, by a registered VAT vendor.3. Compulsory registration is the registration as a VAT vendor of a
business enterprise whose annual income exceeds R1 million. This is required by law.
Voluntary registration occurs when any enterprise whose annual income is less than R1 million (but more than R50 000) registers voluntarily as a VAT vendor.
4. 15% 5. Exempt items are goods or services on which VAT is not charged at
either the standard rate or zero-rate. 6. Financial services, rental of a private residence, transportation of people
by road or rail, educational services when supplied by the State (Any two) 7. Zero-rated items are goods or services which are taxed at a rate of 0%. 8. Brown bread, maize products, rice, milk, milk powder, milk blends,
fruit, vegetables, lentils, dried beans and legumes, vegetable oil, eggs, canned pilchards, export of moveable goods, petrol, diesel, international transport of passengers and goods (Any three)
9. Input tax is the VAT paid by a registered VAT vendor on its purchases (“inputs”) from another registered VAT vendor.
Output tax is the VAT charged by a registered VAT vendor to its customers for its goods or services (“outputs”).
10. VAT payable = Output tax – Input tax 11. Each vendor in the production and distribution chain is responsible for
collecting VAT equal to 15% of the “value” he “added” (the difference between selling price and the cost involved in selling the product) to the product. This is why this tax is called “value-added” tax.
12. The benefit of this system to SARS is that they don’t have to wait for the product to be sold to the end customer before receiving tax.
Tax is collected from each vendor in the production and distribution chain, as it is sold from vendor to vendor.
Activity 13.2 LB page 475
1. Price (excl. VAT) = R200 + (R200 × 50%) = R300
Price (incl. VAT) = R300 × 115 ___ 100 = R345
2. Price (excl. VAT) = R500 + (R500 × 100%) = R1 000
Price (incl. VAT) = R1 000 × 115 ___ 100 = R1 150
3. Price (excl. VAT) = R40 + (R40 × 150%) = R100
Price (incl. VAT) = R100 × 115 ___ 100 = R115

336 s e c t i o n 5 • c h a p t e r 1 3
4. Price (excl. VAT) = R150 + (R150 × 33 1 _ 2 %) = R200
Price (incl. VAT) = R200 × 115 ___ 100 = R230
5. Price (excl. VAT) = R176 + (R176 × 25%) = R220
Price (incl. VAT) = R220 × 115 ___ 100 = R253
Activity 13.3 LB page 475
1. VAT = R4,56 × 15 ___ 115 = R0,59 (or 59 cents)
2. VAT = R250,80 × 15 ___ 115 = R32,71
3. VAT = R741 × 15 ___ 115 = R96,65
4. VAT = R8,15 × 15 ___ 115 = R1,06
5. VAT = R1 995 × 15 ___ 115 = R260,22
Activity 13.4 LB page 475
No. Cost price % mark-up on cost
Selling price (excl. VAT)
VAT (at 15%)
Selling price (incl. VAT)
1. r250 100% r500 r75 r575
2. r300 33 1 __ 3 % r400 r60 r460
3. r4 200 25% r5 250 r787,50 r6 037,50
4. r100 150% r250 r37,50 r287,50
5. r500 100% r1 000 r150 r1 150
Activity 13.5 LB page 476
Tax invoice: Invoice No. 223 Date: 2 May 2019
From: Bill’s Computer Suppliers
To: CBA Data Company
Description Amount
2 × HP Laser Printers R6 000 00
VAT @ 15% R900 00
Total R6 900 00
Tax invoice: Invoice No. 237 Date: 11 May 2019
From: Bill’s Computer Suppliers
To: Sea View Hotels
Description Amount
2 × Dell Laptops R14 000 00
VAT @ 15% R2 100 00
Total R16 100 00

337s e c t i o n 5 • c h a p t e r 1 3
Tax invoice: Invoice No. 229 Date: 6 May 2019
From: Bill’s Computer Suppliers
To: CompuStudy CC
Description Amount
18 × Compaq 17 inch monitors R11 895 65
VAT @ 15% R1 784 35
Total R13 680 00
Tax invoice: Invoice No. 245 Date: 15 May 2019
From: Bill’s Computer Suppliers
To: Learn-well High School
Description Amount
10 × Mecer keyboards R3 200 00
10 × HP Genius mouse R1 800 00
Sub-total R5 000 00
VAT @ 15% R750 00
Total R5 750 00
Bill’s Computer Supplies..............................
Cash sales slip 323
Total (excl. VAT) R56,00
VAT @ 15% R8,40
Total (incl. VAT) R64,40
Bill’s Computer Supplies..............................
Cash sales slip 334
Total (excl. VAT) R78,31
VAT @ 15% R11,75
Total (incl. VAT) R90,06
Bill’s Computer Supplies..............................
Cash sales slip 351
Total (excl. VAT) R142,33
VAT @ 15% R21,35
Total (incl. VAT) R163,68
Activity 13.6 LB page 482
1. 1.1 E.1.2 D.1.3 A.1.4 F.1.5 B.1.6 C.
2. the VAT 201 return form3. 25th4. a penalty (fine) and interest5. The invoice basis of accounting for VAT requires vendors to account for
VAT based on the tax period in which invoices are issued or received. However, where payment is received (or made) prior to an invoice being issued (or received), then the vendor must account for VAT at the time of the payment.
The payments basis of accounting for VAT requires vendors to account for VAT only when payments are actually received and payments actually made.
6. the accrual basis7. the receipts basis and the cash basis

338 s e c t i o n 5 • c h a p t e r 1 3
8. Advantages of using the invoices basis to account for VAT:• VAToncreditpurchasescanbedeductedbeforepaymentismade
to creditors.• Itisrelativelyeasytocalculateandadminister.
Disadvantages of using the invoices basis to account for VAT:• VAToncreditsalesisincludedbeforepaymentisreceivedfrom
debtors.• Itcanleadtocash-flowproblems.
9. Advantages of using the payments basis of accounting for VAT:• VAToncreditsalesisonlyincludedwhenpaymentisreceivedfrom
debtors.• Itcanassistcashflow.
Disadvantages of using the payments basis of accounting for VAT:• VAToncreditpurchasescanonlybedeductedafterpaymentismade
to creditors.• Itcanbemoredifficulttocalculateandadminister.
Activity 13.7 LB page 485
Invoice No.: 1004765
TAX INVOICE
From: Cellular Warehouse (Pty) Ltd
17 Cell Park
Johannesburg
2001
VAT No. 4030251382
Date: 08 August 2019
To: Cele Cellphone Stores
28 Maseru Street
Orlando, Soweto
1840
VAT No. 6578236575
DATE DESCRIPTION QUANTITY AMOUNT
8/8/2019 Vodafone 252 Oscar @ R75 each 40 R3 450
Nokia 1280 @ R100 each 25 R2 875
Samsung E250 @ R250 each 20 R5 750
Nokia 5130 Xpress Music @ R400 each 10 R4 600
BlackBerry Curve 9300 @ R1 500 each 6 R10 350
TOTAL R27 025
VAT included R 3 525
Calculations:Nokia 1280: Amount (incl. VAT) = (R100 × 25) × 115 ___ 100 = R2 875
Samsung E250: Quantity = (R5 750 × 100 ___ 115 ) ÷ R250 = 20
Nokia 5130 Xpress Music: Unit price (excl. VAT) = (R4 600 × 100 ___ 115 ) ÷ 10 = R400
BlackBerry Curve 9300: Amount (incl. VAT) = (R1 500 × 6) × 115 ___ 100 = R10 350
VAT included: R27 025 × 15 ___ 115 = R3 525

339s e c t i o n 5 • c h a p t e r 1 3
Activity 13.8 LB page 492
No.Effect on the amount of VAT payable to SARS
WorkingsDecrease (–) Increase (+)
e.g. r297,39 r2 280 × 15 ___ 115 = r297,39
1. r223,04 r1 710 × 15 ___ 115 = r223,04
2. r371,74 r2 850 × 15 ___ 115 = r371,74
3. r111,52 r855 × 15 ___ 115 = r111,52
4. r96,65 r741 × 15 ___ 115 = r96,65
5. r11,90 (r1 824 × 5%) × 15 ___ 115 = r11,90
6. r52,04 r399 × 15 ___ 115 = r52,04
7. r104,09 r798 × 15 ___ 115 = r104,09
8. r41,63 r319,20 × 15 ___ 115 = r41,63
9. r12,79 (r2 451 × 4%) × 15 ___ 115 = r12,79
Activity 13.9 LB page 492
1. E.2. H.3. F.4. B.5. A.6. D.
Activity 13.10 LB page 493
1. False. When a vendor issues an invoice to a debtor, the vendor must account for the VAT amount on the invoice as output tax.
2. False. When a vendor writes off a debt as irrecoverable, the amount of VAT payable by the vendor should be decreased by the VAT portion of the amount written off.
3. False. A debt is seldom written off in the same tax period as it originated. OR A debt is usually written off after the tax period in which it originated.
4. True5. False. In order to decrease the amount of VAT payable, a vendor must
make an adjustment that either decreases output tax or increases input tax.6. True.7. True.8. False. When a vendor issues a credit note to a debtor, the vendor must
make an adjustment that decreases the amount of VAT payable.9. False. If a vendor receives a payment from a customer whose debt had
previously been written off, then the vendor must account for the VAT on the amount received as output tax.
10. True.

340 s e c t i o n 5 • c h a p t e r 1 3
Activity 13.11 LB page 493
1. R1 020,002. output tax3. March4. R1 380,005. input tax6. decrease7. R322,008. decrease9. output tax10. input tax
Case study 13.1 LB page 496
1. R6,4 million2. “issuing false VAT invoices”3. The Eksteens created two sets of invoices. They issued proper invoices
with the correct amount of VAT to their customers, but accounted to SARS using false invoices for lesser amounts. Therefore they paid SARS less VAT than they actually collected and kept the difference for themselves.
4. 10 years5. 4 years6. the most devious and deceitful fraudulent act7. It is an easy way for the public to provide SARS with information about
someone who they suspect may be committing tax fraud.
Informal assessment 13.1 LB page 500
Marks: 25 Time: 15 minutes
1. Price (excl. VAT) = R450 + (R450 × 50%) = R675 ✓✓
Price (incl. VAT) = R675 × 115 ___ 100 = R776,25 ✓✓✓ [5]
2. VAT = R85,50 × 15 ___ 115 = R11,15 ✓✓✓
Price (excl. VAT) = R85,50 – R11,15 = R74,35 ✓✓ [5]
3.
No. Cost price % mark-up on cost
Selling price (excl. VAT)
VAT (at 15%)
Selling price (incl. VAT)
a. r400 100% r800 ✓✓ r120 ✓✓ r920 ✓
b. r2 200 50% ✓✓ r3 300 ✓✓ r495 ✓ r3 795
c. r2 080 ✓✓ 150% r5 200 ✓✓ r780 r5 980 ✓
[15]

341s e c t i o n 5 • c h a p t e r 1 4
CHAPTER 14 Revision activities
Activity 14.1 Bank reconciliation LB page 502
1.Cash Receipts Journal of Caron’s Boutique for April 2016 CRJ
Doc. no. Day Details Fol. Bank
Sundry accountsAmount Details
30 Totals 54 600 00Vergelegen Retirement Home 500 00 500 00 Donations
BS Elzaan Properties 1 900 00 1 900 00 Rent incomeBS Southern Bank 107 00 107 00 Interest on current account
Pen & Ink (chq 574 error) 360 00 360 00 Stationery57 467 00
Cash Payments Journal of Caron’s Boutique for April 2016 CPJ
Doc. no. Day Name of payee Fol. Bank
Debtorscontrol
Sundry accountsAmount Details Fol.
30 Totals 42 120 00BS Southern Bank 389 00 389 00 Bank chargesBS Allsure 890 00 890 00 InsuranceBS L King 405 00 405 00
43 804 00
2. General Ledger of Caron’s Boutique
Dr Bank Cr
Date Details Fol. Amount Date Details Fol. Amount
2016 Apr 01 Balance b/d 13 930 00
2016 Apr 30 Total payments CPJ 43 804 00
31 Total receipts CRJ 57 467 00 Balance c/d 27 593 00
71 397 00 71 397 00
2016 May 01 Balance b/d 27 593 00
3.Caron’s BoutiqueBank Reconciliation Statement on 30 April 2016
Fol. Debit Credit
credit balance according to bank statement 24 794 00
credit outstanding deposit 7 659 00
Debit cheques not presented for payment:
No. 599 500 00
No. 591 1 980 00
No. 526 2 380 00
Debit balance according to Bank account 27 593 00
32 453 00 32 453 00

342 s e c t i o n 5 • c h a p t e r 1 4
Activity 14.2 Bank reconciliation LB page 503
1. Rent income, R2 600 Cheque no. 877 expired, Ring o’ Roses Creche, R800
2. Dishonoured cheque, K Habana, R465Bank charges, R389
3.LL StoresBank Reconciliation Statement on 31 October 2015
Fol. Debit Credit
credit balance according to bank statement 68 439 00
credit outstanding deposit 9 980 00
Debit cheques not presented for payment:
no. 1997 7 400 00
no. 2052 5 780 00
no. 2101 7 500 00
Debit balance according to Bank account 57 739 00
78 419 00 78 419 00
4. Add to Creditors Control and add to Bank.
5. Control measures:Record information from bank statementsor any acceptable reason
Activity 14.3 Bank reconciliation LB page 504
1. General Ledger of Breede River Traders
Dr Bank B7 Cr
Date Details Fol. Amount Date Details Fol. Amount
2013 Sep 30 Donations 300 00
2013 Sep 30 Balance b/d 1 979 00
Packing material 1 056 00 Packing material 1 056 00
Creditors for wages 27 00 Debtors Control: P Marais 582 00
Rent income 1 240 00 Insurance 400 00
Bad debts recovered 650 00 Drawings 200 00
Balance c/d 1 413 00 Bank charges 386 00
Interest on overdraft 83 00
4 686 00 4 686 00
2013 Oct 01 Balance b/d 1 413 00

343s e c t i o n 5 • c h a p t e r 1 4
2.Breede River TradersBank Reconciliation Statement on 30 September 2013
Fol. Debit Credit
Debit balance according to bank statement 1 664 00
credit incorrect entry 1 480 00
credit outstanding deposit 4 899 00
Debit cheques not presented for payment:
no. 2473 610 00
no. 2489 997 00
no. 2500 3 465 00
no. 2501 1 056 00
credit balance according to Bank account 1 413 00
7 792 00 7 792 00
Activity 14.4 Creditors reconciliation LB page 506
1.Creditors Ledger of Joseph StoresAdam Dealers
Date Details / Document number Fol. Debit Credit Balance
2020 Mar 31 Balance 18 187 00
Incorrect invoice 900 00 17 287 00
Incorrect invoice 490 00 16 797 00
Interest 97 00 16 894 00
2.Creditors Reconciliation Statement of Adam Dealers on 31 March 2020
Fol. Debit Credit
Debit balance according to statement of account 21 044 00
credit note incorrect 400 00
Discount not entered 250 00
payment after 29 March 3 500 00
Balance according to creditors Ledger 16 894 00
21 044 00 21 044 00

344 s e c t i o n 5 • c h a p t e r 1 4
Activity 14.5 Asset disposal LB page 508
General Ledger of Trendy TradingBalance Sheet accounts
Dr Accumulated Depreciation on Vehicles Cr
Date Details Fol. Amount Date Details Fol. Amount
2013 Oct 01 Asset disposal 33 734 00
2013 Jul 01 Balance b/d 52 100 00
31 Balance c/d 19 748 00 Oct 01 Depreciation 1 382 00
53 482 00 53 482 00
Nov 01 Balance b/d 19 748 00
2014 Jun 30 Depreciation 13 383 00
33 131 00
Dr Asset Disposal Cr
Date Details Fol. Amount Date Details Fol. Amount
2013 Oct 01 Vehicles 60 000 00
2013 Oct 01 Accumulated depreciation on vehicles 33 734 00
Bank 20 000 00
Loss on sale of asset 6 266 00
60 000 00 60 000 00
CalculationsMazda Bakkie
01/01/2010 30/06/2010 30/06/2011 30/06/2012 30/06/2013 1/10/2013
r60 000 × 20% × 6 ___ 12
= r6 000
r54 000 × 20%
= r10 800
r43 200 × 20%
= r8 640
r34 560 × 20%
= r6 912
r27 648 × 20% × 3 __ 12
= r1 382
Depreciation – 30 June 2014
Old vehicles (R60 000 – 19 748) × 20% = R 8 050
New vehicles R80 000 × 20% × 4 __ 12 = R 5 333 R13 383

345s e c t i o n 5 • c h a p t e r 1 4
Activity 14.6 Asset disposal LB page 508
General Ledger of Dolphin Coast TradersBalance Sheet accounts
Dr Vehicles Cr
Date Details Fol. Amount Date Details Fol. Amount
2014 Mar 01 Balance b/d 67 000 00
2014 Jul 01 Asset disposal 60 000 00
Jul 01 Creditors Control 90 000 00 31 Balance c/d 97 000 00
157 000 00 157 000 00
2014 Aug 01 Balance b/d 97 000 00
Dr Accumulated Depreciation on Vehicles Cr
Date Details Fol. Amount Date Details Fol. Amount
2014 Jul 01 Asset disposal 15 369 00
2014 Mar 01 Balance b/d 14 530 00
31 Balance c/d 700 00 Jul 01 Depreciation 1 539 00
16 069 00 16 069 00
2014 Aug 01 Balance b/d 700 00
2015 Feb 28 Depreciation 6 630 00
7 330 00
Dr Computers Cr
Date Details Fol. Amount Date Details Fol. Amount
2014 Mar 01 Balance b/d 8 600 00
2014 May 01 Asset disposal 4 000 00
May 01 Bank 7 000 00 31 Balance c/d 11 600 00
15 600 00 15 600 00
2014 Jun 01 Balance b/d 11 600 00
Dr Accumulated Depreciation on Computers Cr
Date Details Fol. Amount Date Details Fol. Amount
2014 May 01 Asset disposal 2 150 00
2014 Mar 01 Balance b/d 2 280 00
03 Balance c/d 230 00 May 01 Depreciation 100 00
2 380 00 2 380 00
2014 Jun 01 Balance b/d 230 00
2015 Feb 28 Depreciation 1 565 00
1 795 00

346 s e c t i o n 5 • c h a p t e r 1 4
Dr Asset Disposal Cr
Date Details Fol. Amount Date Details Fol. Amount
2014 May 01 Computers 4 000 00
2014 May 01
Accumulated depreciation on computers 2 150 00
Bank 1 200 00
Loss on sale of asset 650 00
4 000 00 4 000 00
2014 Jul 01 Vehicles 60 000 00
2014 Jul 01 Accumulated depreciation on vehicles 15 369 00
Profit on sale of asset 369 00 Creditors Control 45 000 00
60 369 00 60 369 00
Calculations for depreciationComputers
Intel Celeron
01/01/2010 28/02/2011 28/02/2012 28/02/2013 28/02/2014 01/05/2014
r4 000 × 15% × 5 __ 12
= r250
r4 000 × 15%
= r600
r4 000 × 15%
= r600
r4 000 × 15%
= r600
r4 000 × 15% × 2 __ 12
= r100
2 050
AMD Athlon
01/11/2013 28/02/2014 28/02/2015
r4 000 × 15% × 4 __ 12
= r230
r4 000 × 15% × 4 __ 12
= r230
Intel Pentium
01/05/2014 28/02/2015
r7 000 × 15% × 10 __ 12 = r875

347s e c t i o n 5 • c h a p t e r 1 4
VehiclesToyota Venture
01/09/2011 28/02/2012 28/02/2013 08/02/2014 01/07/2014
r60 000 × 10% × 6 __ 12
= r3 000
r57 000 × 10%
= r5 700
r51 300 × 10%
= r5 130
r46 170 × 10% × 4 __ 12
= r1 539
13 830
Suzuki motorcycle
01/03/2013 28/02/2014 28/02/2015
r7 000 × 10%
= r700
r6 300 × 10%
= r630
Corsa bakkie
01/07/2014 28/02/2015
r9 000 × 10% × 8 __ 12 = r6 000
Activity 14.7 Asset disposal LB page 509
1. General Ledger of The Camping SpotBalance Sheet accounts
Dr Vehicles Cr
Date Details Fol. Amount Date Details Fol. Amount
2018 Mar 01 Balance b/d 122 000 00
2018 May 31 Asset disposal 80 000 00
Balance c/d 42 000 00
122 000 00 122 000 00
2018 Jun 01 Balance b/d 42 000 00
2018 Oct 01 Creditors Control 120 000 00
162 000 00

348 s e c t i o n 5 • c h a p t e r 1 4
Dr Accumulated Depreciation on Vehicles Cr
Date Details Fol. Amount Date Details Fol. Amount
2018 May 31 Asset disposal 31 360 00
2018 Mar 01 Balance b/d 52 100 00
Balance c/d 23 300 00 May 31 Depreciation 2 560 00
54 660 00 54 660 00
Jun Balance b/d 23 300 00
2019 Feb 28 Depreciation 13 740 00
37 040 00
Calculations
Depreciation on equipment
Old equipment: R32 000 × 15% = R4 800
New equipment R7 000 × 15% × 10 __ 12 = R 875 R5 675
Depreciation on vehicles
Vehicle stolen: (R80 000 – 28 800) × 20% × 3 __ 12 = R 2 560
Old vehicles: (R42 000 – 23 300) × 20% = R 3 740
New vehicle: R120 000 × 20% × 5 __ 12 = R10 000 R13 740
2.FIXED / TANGIBLE ASSETS
Vehicles Equipment
carrying value at beginning of year 69 900 00 17 200 00
cost 233 000 00 32 000 00
accumulated depreciation (52 100 00) (14 800 00)
Movements
additions 120 000 00 7 000 00
Disposals at carrying value (48 640 00) – –
Depreciation (16 300 00) (5 675 00)
carrying value at end of year 124 960 00 18 525 00
cost 162 000 00 39 000 00
accumulated depreciation (37 040 00) (20 475 00)
3. The driver should not be allowed to take the vehicle home at night or over weekends.The vehicle should be parked in a garage at night and over weekends.Safekeeping of assets(Any acceptable answer)

349s e c t i o n 5 • c h a p t e r 1 4
Activity 14.8 Asset disposal LB page 510
1. General Ledger of Adam TradersBalance Sheet accounts
Dr Accumulated Depreciation on Equipment Cr
Date Details Fol. Amount Date Details Fol. Amount
2013 Jun 01 Asset disposal (e) CJ 15 680 00
2012 Feb 29 Depreciation (a) GJ 9 000 00
2014 Feb 28 Balance (h) c/d 7 840 00
2013 Jun 30 Depreciation (b) GJ 10 200 00
2013 Jun 01 Depreciation (d) GJ 1 280 00
2014 Feb 28 Depreciation (f) GJ 3 040 00
(e) 23 520 00 (g) 23 520 00
2014 Mar 01 Balance (h) b/d 7 840 00
2015 Feb 28 Depreciation (i) GJ 5 757 00
(j) 13 597 00
2.Dr Asset Disposal Cr
Date Details Fol. Amount Date Details Fol. Amount
2013 Jun 01 Equipment (c) GJ 40 000 00
2013 Jun 01 Bank CRJ 22 600 00
Accumulated depreciation on equipment (e) GJ 15 680 00
Loss on sale of asset GJ 1 720 00
40 000 00 40 000 00
CalculationsTimeline
01/06/13
– 40 000
01/08/14
+ 28 500
01/03/11 01/12/11
– 40 000 + 28 500
29/02/12 28/02/13 28/02/14 28/02/15
12 12 1212
3 3 7
(a) R40 000 × 20 ___ 100 = R8 000
R20 000 × 20 ___ 100 × 3 __ 12 = R1 000
R8 000 + 1 000 = R9 000
(b) R40 000 – 8 000 = R32 000 × 20 ___ 100 = R6 400
R20 000 – 1 000 = R19 000 × 20 ___ 100 = R3 800
R6 400 + 3 800 = R10 200

350 s e c t i o n 5 • c h a p t e r 1 4
(c) R40 000
(d) R40 000 – (8 000 + 6 400 ) = R25 600 × 20 ___ 100 × 3 __ 12 = R1 280
(e) R8 000 + 6 400 + 1 280 = R15 680
(f ) R20 000 – (1 000 + 3 800) = R15 200 × 20 ___ 100 = R3 040
(g) R9 000 + 10 200 + 1 280 + 3 040 = R23 520
(h) R23 520 – 15 680 = R7 840
(i) R20 000 – (1 000 + 3 800 + 3 040) = R12 160 × 20 ___ 100 = R2 432
R28 500 × 20 ___ 100 × 7 __ 12 = R3 325
R2 432 + 3 325 = R5 757
( j) R7 840 + 5 757 = R13 597
Activity 14.9 Partnerships: General Ledger accounts LB page 512
1. General Ledger of Bessie Best
Dr Current account: Batt Cr
Date Details Fol. Amount Date Details Fol. Amount
2020 Jun 30 Drawings: Batt 22 260 00
2019 Jul 01 Balance b/d 8 000 00
Balance c/d 9 100 002020 Jun 30 Interest on capital 6 400 00
Salary: Batt 13 200 00
Appropriation account 3 760 00
31 360 00 31 360 00
2020 Jul 01 Balance b/d 9 100 00
2. R12 800 + 8 400 + 7 520 ______ 160 000 + 8 000 × 100
= 28 720 ______ 160 000 × 100
= 17,1%
3. • Ininterest=R1280×100 ___ 8
= R16 000
or: capital on 1 July 2019 = R11 520 × 100 ___ 8
= R144 000
• Incapital=R160000–144000 = R16 000

351s e c t i o n 5 • c h a p t e r 1 4
Activity 14.10 Partnerships: General Journal and General Ledger LB page 512
1.General Journal of Sleeptight Mattresses for June 2015
Day Fol. Debit Credit
30 Jun Drawings: powell 17 650 00
trading stock 17 650 00
Drawings: Firman 780 00
telephone 780 00
Interest on capital 133 500 00
current account: powell 64 800 00
current account: Firman 68 700 00
Salary: powell 67 320 00
current account: powell 67 320 00
Salary: Firman 84 000 00
current account: Firman 84 000 00
current account: powell 84 970 00
Drawings: powell 84 970 00
current account: Firman 35 780 00
Drawings: Firman 35 780 00
profit and loss 317 470 00
appropriation account 317 470 00
appropriation account 317 470 00
Salary: powell 67 320 00
Salary: Firman 84 000 00
Interest on capital 133 500 00
current account: powell 16 325 00
current account: Firman 16 325 00
2. General Ledger of Sleeptight Mattresses
Dr Appropriation account Cr
Date Details Fol. Amount Date Details Fol. Amount
2015 Jun 30 Salary: Powell GJ 67 320 00
2015 Jun 30
Profit and loss (299 040 + 780 + 17 650) GJ 317 470 00
Salary: Firman GJ 84 000 00
Interest on capital GJ 133 500 00
Current account: Powell GJ 16 325 00
Current account: Firman GJ 16 325 00
317 470 00 317 470 00

352 s e c t i o n 5 • c h a p t e r 1 4
CalculationsSalaries: Powell R5 500 × 8 = R44 000 R5 500 × 106 ___ 100 = R5 830 × 4 = R23 320 R67 320 Firman R7 000 × 12 = R84 000
Interestoncapital: Powell R530000×12%×6 __ 12 = R31 800
R550 000 × 12% × 6 __ 12 = R33 000 R64 800
Firman R595 000 × 12% × 6 __ 12 = R35 700
R550 000 × 12% × 6 __ 12 = R33 000 R68 700 R64 800 + 68 700 = R133 500
Remaining profit: (R299 040 + 780 + 17 650) – 67 320 – 84 800 – 133 500 = R32 650 Powell: R16 325 Firman: R16 325
Drawings: Powell R67 320 + 17 650 = R84 970 Firman R35 000 + 780 = R35 780

353s e c t i o n 5 • c h a p t e r 1 4
Activity 14.11 Partnerships: Financial statements LB page 514
1.S Sam and B Banga Trading as Samba TradersStatement of Comprehensive Income for the year ended 28 February 2015
Note R
Sales [1 540 230 – (2 587 + 1 008 )] 1 536 635 00
cost of sales (855 200 – 560 ) (864 640 00)
Gross profit 671 995 00
Other operating income 22 785 00
rent income (21 280 – 1 760) 19 520 00
Bad debts recovered 1 087 00
Discount received 1 778 00
profit on sale of asset 400 00
Gross operating income 694 780 00
Operating expenses (328 656 00)
Discount allowed (2 544 – 250 ) 2 294 00
Bad debts 1 870 00
Stationery (1 026 – 340 ) 686 00
Water and electricity (9 624 + 334 ) 9 958 00
telephone (8 389 + 478 ) 8 867 00
Insurance (15 800 – 1 200 ) 14 600 00
Depreciation (243 + 4 423 ) 4 666 00
Bank charges (2 532 + 189 ) 2 721 00
Salaries and wages 266 410 00
Unemployment Insurance Fund contribution 2 664 00
advertising 10 870 00
provision for bad debts adjustment (948 – 750 ) 198 00
trading stock deficit [(44 632 + 560 ) – (41 780 + 560 )] 2 852 00
Operating profit (loss) 366 124 00
Interest income – –
Profit (loss) before interest expense 366 124 00
Interest expense (10 880 + 6 760 + 34 ) (17 674 00)
Net profit (loss) for the year 348 450 00
Interest on loan
01/03/14 31/03/14 28/02/15
r144 000 × 14% × 3 __ 12
= r5 040
r120 000 × 14% × 9 __ 12
= r12 600

354 s e c t i o n 5 • c h a p t e r 1 4
Rent income10x + 3(x × 110 ___ 100 ) = R21 280
13,3x = R21 280∴ x = R1 600
x × 110 ___ 100 = R1 760
2. General Ledger of Samba Traders
Dr Accumulated Depreciation on Equipment Cr
Date Details Fol. Amount Date Details Fol. Amount
2014 Aug 31 Asset disposal 1 383 00
2014 Mar 01 Balance b/d 37 880 00
Balance c/d 36 740 00 Aug 31 Depreciation 243 00
38 123 00 38 123 00
2014 Sep 01 Balance b/d 36 740 00
2015 Feb 28 Depreciation 4 423 00
41 163 00
3. (R6 000 – 1 383) + 400 = R5 017
4. 671 995 ________ 1 536 635 × 100 ___ 1
= 43,7%
Sales, theft
5. a.TRADE AND OTHER RECEIVABLES
trade debtors (17 718 – 1 008 + 2 250) 18 960 00
provision for bad debts (948 00)
Net trade debtors 18 012 00
creditors for wages 400 00
expenses prepaid 1 200 00
19 612 00
5. b.TRADE AND OTHER PAYABLES
trade creditors 22 480 00
expenses accrued (payable) (334 + 478 + 6 760) 7 572 00
Income received in advance (deferred) 1 760 00
SarS (paYe) 6 890 00
38 702 00

355s e c t i o n 5 • c h a p t e r 1 4
5. c.
FIXED / TANGIBLE ASSETSLand and buildings Equipment Total
carrying value at beginning of year 330 000 00 49 090 00 379 090 00
cost 330 000 00 86 970 00 416 970 00
accumulated depreciation – – (37 880 00) (37 880 00)
Movements
additions 70 000 00 – – 70 000 00
Disposals at carrying value – – (4 617 00) (4 617 00)
Depreciation – – (4 666 00) (4 666 00)
carrying value at end of year 400 000 00 39 807 00 439 807 00
cost 400 000 00 80 970 00 480 970 00
accumulated depreciation – – (41 163 00) (41 163 00)
5. d.CAPITAL
S Sam B Banga Total
Balance at beginning of year 50 000 00 75 000 00 125 000 00
additional capital contributed 50 000 00 – – 50 000 00
Balance at end of year 100 000 00 75 000 00 175 000 00
5. e.CURRENT ACCOUNTS
S Sam B Banga Total
Net profit as per Income Statement 186 725 161 725 348 450
partners’ salaries 96 000 72 000 168 000
Interest on capital 10 000 9 000 19 000
partners’ bonuses – – –
primary distribution of profit 106 000 81 000 187 000
Final distribution of profit 80 725 80 725 161 450
Drawings for the year (107 000) (88 200) (195 200)
Undrawn profits (retained income) for the year
79 725 73 525 153 250
Balance at beginning of year 3 117 (1 045) 2 072
Balance at end of year 82 842 72 480 155 322
Interest: Sam R50000×12%×4 __ 12 = R2 000
R100 000 × 12% × 8 __ 12 = R8 000 R10 000
Banga R75 000 × 12% = R9 000

356 s e c t i o n 5 • c h a p t e r 1 4
6.S Sam and B BangaTrading as Samba TradersExtract from Statement of Financial Position at 28 February 2015
Note R
OWNer’S eQUItY 330 322 00
capital 175 000 00
current accounts 155 322 00
NON-cUrreNt LIaBILItIeS 96 000 00
Loan from Sa Bank 96 000 00
cUrreNt LIaBILItIeS 75 777 00
trade and other payables 38 702 00
Bank overdraft (10 452 + 400 + 189 + 2 000 + 34) 13 075 00
Short term loans 24 000 00
TOTAL EQUITY AND LIABILITIES 502 099 00
Activity 14.12 Partnerships: Interpretation of financial statements LB page 516
1. General Ledger of King Traders
Dr Appropriation account Cr
Date Details Fol. Amount Date Details Fol. Amount
2015 Feb 28 Salary: Jenny 165 000 00
2015 Feb 28 Profit and loss 420 100 00
Salary: Graham 110 000 00
Interest on capital 108 000 00
Current account: Jenny 18 550 00
Current account: Graham 18 550 00
420 100 00 420 100 00
2. R110 000 + 60 000 + 18 550 __________________________________ 1 __ 2 (500 000 + 600 000 + 5 562 – 2 988) × 100 ___ 1
R188 550 ________ 551 287 × 100 ___ 1
= 34,2% Yes, it is a good investment.
3. 250 000 : 1 038 154 = 0,24 : 1
4. Yes, the proceeds on capital applied amount to 32,2%, while the interest is only 20%. The debt/owner’s equity ratio is 0,24 : 1. The business is credit worthy.
5. (68 000 – 28 000) : 482 000 = 39 600 : 48 200= 0,82 : 1

357s e c t i o n 5 • c h a p t e r 1 4
6. The acid ratio has decreased from 1,1 to 0,8 : 1. The rate of stock turnover has improved from 8,4 to 9,2 times p.a.
The liquidity position is reasonable, but they may have a hard time paying their creditors.
Activity 14.13 Clubs (challenge) LB page 517
1. General Ledger of Rovers Rugby ClubNominal accounts
Dr Membership Fees Cr
Date Details Fol. Amount Date Details Fol. Amount
2014 Jan 01 Accrued income 300 00
2014 Jan 01 Income received in advance 440 00
Dec 31 Income received in advance 600 00 Dec 31 Bank – 2013 200 00
Income and expenditure 6 380 00 – 2014 5 610 00
– 2015 600 00
Membership fees written off 100 00
Honorarium 110 00
Accrued income 220 00
7 280 00 7 280 00
Dr T-shirts Cr
Date Details Fol. Amount Date Details Fol. Amount
2014 Jan 01 Inventory: T-shirts 840 00
2014 Dec 31 Bank 4 704 00
Dec 31 Bank 4 200 00 Stock of club T-shirts 1 120 00
Profit from T-shirts * 784 00
5 824 00 5 824 00
Calculations
* 840 ___ 70 + 4 200 _____ 70 – 16 = 56
56 × R70 = R3 920
R3 920 × 20 ___ 100 = R784
Dr Stationery Cr
Date Details Fol. Amount Date Details Fol. Amount
2014 Dec 31 Bank 328 00
2014 Dec 31 Stationery on hand 87 00
Creditors 126 00 Income and expenditure 367 00
454 00 454 00
Dr Depreciation Cr
Date Details Fol. Amount Date Details Fol. Amount
2014 Dec 31
Accumulated depreciation on equipment 3 700 00
2014 Dec 31 Income and expenditure 3 700 00
3 700 00 3 700 00

358 s e c t i o n 5 • c h a p t e r 1 4
Calculationsc/d R25 000 × 12% = R3 000New R10 000 × 12% × 7 __ 12 = R 700 R3 700
Dr Insurance Cr
Date Details Fol. Amount Date Details Fol. Amount
2014 Jan 1 Accrued expenses 400 00
2014 Dec 31 Accrued expenses 210 00
Dec 31 Bank 3 520 00 Income and expenditure 3 710 00
3 920 00 3 920 00
Dr Interest on Investment Cr
Date Details Fol. Amount Date Details Fol. Amount
2014 Dec 31 Income and expenditure 2 000 00
2014 Dec 31 Bank 1 500 00
Accrued income 500 00
2 000 00 2 000 00
CalculationsR20 000 × 10% = R 2 000 = R–1 500 = R 500
Dr Interest on Mortgage Bond Cr
Date Details Fol. Amount Date Details Fol. Amount
2014 Dec 31 Bank 7 000 00
2014 Dec 31 Income and expenditure 11 125 00
Accrued expenses 4 125 00
11 125 00 11 125 00
CalculationsR50 000 × 16% × 7 __ 12 = R 7 000
R55 000 × 18% × 5 __ 12 = R 4 125 R11 125
Dr Refreshments Cr
Date Details Fol. Amount Date Details Fol. Amount
2014 Jan 01 Refreshments on hand 310 00
2014 Dec 31 Bank 33 770 00
Dec 31 Bank 23 410 00 Refreshments on hand 1 430 00
Creditors 3 200 00
Profit on sale of refreshments 8 280 00
35 200 00 35 200 00
Dr Rugby Balls Cr
Date Details Fol. Amount Date Details Fol. Amount
2014 Jan 01 Rugby balls on hand 560 00
2014 Dec 31 Rugby balls on hand 650 00
Bank 2 080 00 Income and expenditure 1 990 00
2640 00 2 640 00

359s e c t i o n 5 • c h a p t e r 1 4
Dr Wages Cr
Date Details Fol. Amount Date Details Fol. Amount
2014 Dec 31 Bank 11 000 00
2014 Dec 31 Income and expenditure 12 000 00
Accrued expenses 1 000 00
12 000 00 12 000 00
Dr Telephone Cr
Date Details Fol. Amount Date Details Fol. Amount
2014 Dec 31 Bank 2 676 00
2014 Jan 01 Accrued expenses 254 00
Income and expenditure 2 422 00
2 676 00 2 676 00
Dr Honorarium Cr
Date Details Fol. Amount Date Details Fol. Amount
2014 Dec 31 Bank 500 00
2014 Jan 01 Accrued expenses 250 00
Membership fees 110 00 Dec 31 Income and expenditure 500 00
Accrued expenses 440 00
750 00 750 00
Final accounts
Dr Accumulated Funds Cr
Date Details Fol. Amount Date Details Fol. Amount
2014 Dec 31 Income and expenditure 734 00
2014 Jan 01 Balance b/d 171 040 00
Balance c/d 170 806 00 Dec 31 Entrance fees 500 00
171 540 00 171 540 00
2015 Jan 01 Balance b/d 170 806 00
Dr Income and Expenditure Cr
Date Details Fol. Amount Date Details Fol. Amount
2014 Dec 31 Membership fees written off 100 00
2014 Dec 31 Entrance fees 1 000 00
Ruby balls 1 990 00 Membership fees 6 380 00
Wages 12 000 00 Profit from sale of T-shirts 784 00
Stationery 367 00 Profit from sale of refreshments 8 280 00
Telephone 2 422 00 Interest on fixed deposit 2 000 00
Bank charges 364 00 Donations 1 000 00
Affiliation 600 00 Sponsor 17 000 00
Honorarium 800 00 Accumulated funds 734 00
Insurance 3 710 00
Interest on loan 11 125 00
Depreciation 3 700 00
37 178 00 37 178 00

360 s e c t i o n 5 • c h a p t e r 1 4
2.Post-closing Trial Balance for Rovers Rugby Club as at 31 December 2014
Fol. Debit Credit
Balance Sheet accounts
accumulated profit 170 806 00
club building (200 000 + 30 000) 230 000 00
equipment (25 000 + 10 000) 35 000 00
accumulated depreciation (8 200 + 3 700) 11 900 00
Loan: aMr Bank 55 000 00
Fixed deposit: tedbank 20 000 00
Savings account 600 00
Bank 42 950 00
creditors (1 540 + 126 + 3 200 – 1 980) 2 886 00
accrued expenses (440 + 1 000 + 4 125) 5 565 00
accrued income (110 + 500) 610 00
t-shirts on hand 1 120 00
Stationery on hand 87 00
prepaid expenses 210 00
refreshments on hand 1 430 00
rugby balls on hand 650 00
Income received in advance 600 00
289 707 00 289 707 00
3. Yes, as expenses have increased in price4. No, they should rather pay off the loan to decrease interest expenses.5. Cost price = R310 + 23 410 + 3 200 – 1 430 = R25 490
Gross profit on cost price = 8 280 ______ 25 490 × 100 ___ 1
= 32,5%
Activity 14.14 Clubs LB page 520
1. General Ledger of Berg-en-Dal Hiking Club
Dr Membership Fees Cr
Date Details Fol. Amount Date Details Fol. Amount
2016 Jan 01 Accrued income 1 800 00
2016 Jan 01 Income received in advance 1 500 00
Dec 31 Income received in advance 900 00 Dec 31 Bank 2015 1 200 00
Income and expenditure (249 – 2 + 30) × R300 113 100 00 2016 108 000 00
2017 900 00
Membership fees written off 600 00
Honorarium 300 00
Accrued income 3 300 00
115 800 00 115 800 00

361s e c t i o n 5 • c h a p t e r 1 4
Dr Backpacks Cr
Date Details Fol. Amount Date Details Fol. Amount
2016 Jan 01 Stock: Backpacks 6 300 00
2016 Dec 31 Bank 20 709 00
Dec 31 Bank 10 350 00 Gifts 1 350 00
Creditors 7 200 00 Stock: Backpacks 4 950 00
Profit on backpacks (20 709 × 18 ___ 118 ) 3 159 00
27 009 00 27 009 00
2. Membership fees can remain the same. Use fixed deposits to pay off loan for lower interest.
Activity 14.15 Clubs (challenge) LB page 521
1. General Ledger of Stellenbosch Tennis Club
Dr Membership Fees Cr
Date Details Fol. Amount Date Details Fol. Amount
2014 Jan 01 Accrued income 15 600 00
2014 Jan 01 Income received in advance 8 400 00
Dec 31 Income received in advance 9 600 00 Dec 31 Bank (4 800 + 109 200) 123 600 00
Bank 2 400 00 Membership fees written off 10 800 00
Income and expenditure *134 400 00 Accrued income 19 200 00
162 000 00 162 000 00
* (109 + 18 – 4 – 9 – 2) × R1 200
2. No, they won’t be happy. Membership fees of R10 800 were written off. 3. Yes, the club shows a surplus of R76 000.4. Decrease membership fees.
Improvefacilities,withmoneyfromtheinvestment.Any acceptable suggestion
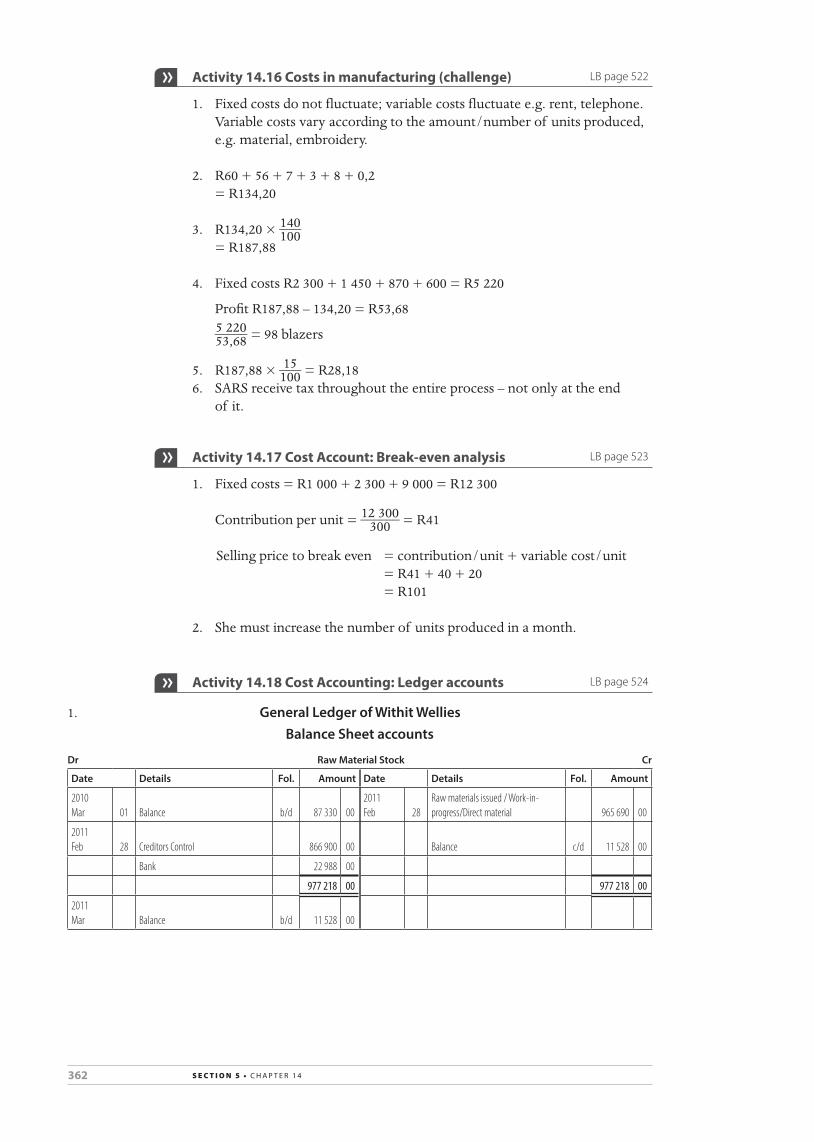
362 s e c t i o n 5 • c h a p t e r 1 4
Activity 14.16 Costs in manufacturing (challenge) LB page 522
1. Fixed costs do not fluctuate; variable costs fluctuate e.g. rent, telephone. Variable costs vary according to the amount/number of units produced,
e.g. material, embroidery.
2. R60 + 56 + 7 + 3 + 8 + 0,2 = R134,20
3. R134,20 × 140 ___ 100 = R187,88
4. Fixed costs R2 300 + 1 450 + 870 + 600 = R5 220
Profit R187,88 – 134,20 = R53,68
5 220 _____ 53,68 = 98 blazers
5. R187,88 × 15 ___ 100 = R28,186. SARS receive tax throughout the entire process – not only at the end
of it.
Activity 14.17 Cost Account: Break-even analysis LB page 523
1. Fixed costs = R1 000 + 2 300 + 9 000 = R12 300
Contribution per unit = 12 300 ______ 300 = R41
Selling price to break even = contribution/unit + variable cost/unit = R41 + 40 + 20 = R101
2. She must increase the number of units produced in a month.
Activity 14.18 Cost Accounting: Ledger accounts LB page 524
1. General Ledger of Withit WelliesBalance Sheet accounts
Dr Raw Material Stock Cr
Date Details Fol. Amount Date Details Fol. Amount
2010 Mar 01 Balance b/d 87 330 00
2011 Feb 28
Raw materials issued / Work-in-progress/Direct material 965 690 00
2011 Feb 28 Creditors Control 866 900 00 Balance c/d 11 528 00
Bank 22 988 00
977 218 00 977 218 00
2011 Mar Balance b/d 11 528 00

363s e c t i o n 5 • c h a p t e r 1 4
Dr Work-in-progress Cr
Date Details Fol. Amount Date Details Fol. Amount
2010 Mar 01 Balance b/d 36 200 00
2011 Feb 28 Finished goods 2 125 891 00
2011 Feb 28 Direct material cost 965 690 00 Balance c/d 39 870 00
Direct labour cost 829 300 00
Factory overheads 334 571 00
2 165 761 00 2 165 761 00
2011 Mar 01 Balance b/d 39 870 00
Dr Consumable Stores Stock Cr
Date Details Fol. Amount Date Details Fol. Amount
2010 Mar 01 Balance b/d 6 880 00
2011 Feb 28
Factory overheads / Indirect material factory 21 556 00
2011 Feb 28 Bank 25 890 00
Sales and distribution/ Indirect material sales 3 452 00
Balance c/d 7 762 00
32 770 00 32 770 00
2011 Mar 01 Balance b/d 7 762 00
Nominal account
Dr Factory Overheads Cr
Date Details Fol. Amount Date Details Fol. Amount
2011 Feb 28 Indirect material 21 556 00
2011 Feb 28 Work-in-progress 334 571 00
Indirect labour 68 700 00
Rent (150 000 × 2 _ 3 ) 100 000 00
Insurance 38 870 00
Maintenance 45 682 00
Depreciation on factory equipment 49 200 00
Depreciation on vehicle (24 647 × 3 _ 7 ) 10 563 00
334 571 00 334 571 00
2. Cost of sales: R64 630 + 2 125 891 – 56 400 = R2 134 121
Activity 14.19 Budgets (challenge) LB page 525
1.First Traders Debtors Collection Schedule for the period 1 January 2015 to 28 February 2015
Date Details Jan 2015 Feb 2015
28 December 40 000 30 000
January 28 000 5 320 21 000
February 32 000 6 080
35 320 27 080

364 s e c t i o n 5 • c h a p t e r 1 4
2.First TradersCash Budget for the period 1 January 2015 to 28 February 2015
Jan 2015 Feb 2015
RECEIPTS
cash sales 7 000 8 000
collections from debtors 35 320 27 080
Interest on fixed deposit 500 500
Fixed deposit – 50 000
TOTAL RECEIPTS 42 820 85 580
PAYMENTS
cash purchases of stock 7 000 8 000
payments to creditors 30 000 21 000
Vehicles 33 000 3 100
Salaries 1 100 1 650
Drawings 1 500 1 500
Stationery – 500
Insurance – 2 160
rent expense 2 880 2 880
TOTAL PAYMENTS 75 480 40 790
caSh SUrpLUS/DeFIcIt (32 660) 44 790
BaLaNce at BeGINNING OF perIOD (2 000) (34 660)
CASH ON HAND AT END OF PERIOD (34 660) 10 130
3. a. Itisaninvestment. Itsavesonrentexpense.(anyONEanswer) b. Capital R40 000 Fixed deposit R50 000 Loan R110 000
Activity 14.20 Budgets LB page 527
1.Green StoreDebtors Collection Schedule for the period 1 to 31 October 2014
Credit sales October 2014
July 2014 18 000 × 20% 3 600
august 2014 2 000 × 20% 10 500
September 2014 24 000 × 20% 6 000
October 2014 20 000 × 20% –
20 100

365s e c t i o n 5 • c h a p t e r 1 4
2.Green StoreCash Budget for the month 1 to 31 October 2014
OCT 2014
RECEIPTS
cash sales 18 000
collections from debtors 20 100
rent income 1 925
TOTAL RECEIPTS 40 025
PAYMENTS
cash purchases of stock 4 900
payments to creditors 7 900
current expenses 1 400
Drawings 500
equipment 3 000
TOTAL PAYMENTS 17 700
caSh SUrpLUS/DeFIcIt 22 325
caSh BaLaNce at BeGINNING OF perIOD (2 135)
CASH ON HAND AT END OF PERIOD 20 190
Activity 14.21 Budgets LB page 528
Bennie StoresProjected Income Statement for the period 1 September to 30 November 2020
Sep 2020 Oct 2020 Nov 2020
Sales 273 000 198 000 217 800
LeSS: cost of sales (182 000) (132 000) (130 680)
Gross profit 91 000 66 000 87 120
aDD: Other income 2 100 2 415 2 415
rent income 2 100 2 415 2 415
Gross income 93 100 68 415 89 535
LeSS: Operating expenses (56 910) (53 351) (54 015)
Bad debts 8 190 5 940 6 534
Depreciation 1 400 1 400 1 400
Salaries 40 600 38 640 38 640
Insurance 315 315 385
Stationery 105 126 126
advertising 6 300 6 930 6 930
Operating profit (loss) 36 190 15 064 35 520
aDD: Interest income 200 – –
Net profit (loss) 36 390 15 064 35 520

366 s e c t i o n 5 • c h a p t e r 1 4
Activity 14.22 Periodic stock system (challenge) LB page 529
1. General Ledger of Li-an OutfittersNominal account
Dr Purchases Cr
Date Details Fol. Amount Date Details Fol. Amount
2016 Feb 29 Balance b/d 280 240 00
2016 Feb 29 Creditors Control 17 380 00
Creditors Control 3 460 00 Drawings 1 340 00
Trading account 264 980 00
283 700 00 283 700 00
Final account
Dr Trading account Cr
Date Details Fol. Amount Date Details Fol. Amount
2016 Feb 29 Opening stock 82 800 00
2016 Feb 29 Sales (504 840 – 15 420 – 576) 488 844 00
Purchases 264 980 00 Closing stock (76 900 + 320) 77 220 00
Carriage on purchases (6 160 + 350) 6 510 00
Profit and loss 211 774 00
566 064 00 566 064 00
2.Cost of sales
Opening stock 82 800 00
purchases 264 980 00
carriage on purchases 6 510 00
354 290 00
closing stock (77 220 00)
cost of sales 277 070 00
3. Percentage mark-up achieved:
211 774 ______ 277 070 × 100 ___ 1
= 76,4%
4. Need not worry. Possible reasons for difference:• sales• stocklosses
Activity 14.23 Periodic stock system LB page 530
1. General Ledger of Sunshine CaféNominal accounts
Dr Purchases Cr
Date Details Fol. Amount Date Details Fol. Amount
2015 Jun 30 Balance b/d 304 210 00
2015 Jun 30 Creditors Control 4 682 00
Creditors Control 24 500 00 Trading account 324 028 00
328 710 00 328 710 00

367s e c t i o n 5 • c h a p t e r 1 4
Dr Carriage on Purchases Cr
Date Details Fol. Amount Date Details Fol. Amount
2015 Jun 30 Balance b/d 10 475 00
2015 Jun 30 Trading account 12 175 00
Creditors Control 1 700 00
328 710 00 328 710 00
Final account
Dr Trading account Cr
Date Details Fol. Amount Date Details Fol. Amount
2015 Jun 30 Opening stock 34 650 00
2015 Jun 30 Sales (598 520 – 2 541) 595 979 00
Purchases 324 028 00 Closing stock 54 800 00
Carriage on purchases 12 175 00
Customs duties 3 620 00
Profit and loss 376 306 00
650 779 00 650 779 00
2. Periodic – cheaper Continuous – better control over stock or any acceptable answer.
Activity 14.24 Periodic stock system LB page 531
No.Source document
Subsidiary book
General Ledger
AmountAccount debited
Account credited
e.g.Cheque counterfoil
CPJ Stationery Bank R210
1. Original invoice cJ purchases creditors control
r34 200
2.cheque counterfoil
cpJ carriage on purchases
Bank r450
3. Debit note caJ creditors control
purchases r2 100
4. Journal voucher GJ Drawings purchases r980
5. Journal voucher GJ Stationery purchases r430
6.Duplicate invoice
DJ Debtors control Sales r1 392
7. credit note DaJ Debtors
allowances Debtors control r120

368 s e c t i o n 5 • c h a p t e r 1 4
Activity 14.25 Periodic stock system LB page 531
1. R689 088 + 22 360 – 21 660 – 442 900 – 23 400 = R223 488
223 488 ______ 689 088 × 100 = 32,4%
2. Sales could have been held. Theft of stock Incorrectentriesinbooks Delivery notes and stock were not checked 3. Profit and Loss account
4. Closing Stock account
5. Opening stock R 23 400 Purchases R442 900 Carriage on purchases R 21 660 R487 960 Closing stock R(22 360) Cost of sales R465 600
6. Advantages:(anyONE)• Bettercontroloverstock• Alwaysknowshowmuchstockisonhand• Willseeif thereisadeficitof stock
Disadvantages: (anyONE)• Moreexpensive• Moreadministrationinvolved
Activity 14.26 VAT LB page 532
1. R2 691 × 15 ___ 115 = R351
2. 2 340 _____ 20 = R117
3. R117 × 160 ___ 100 × 115 ___ 100 = R215,28
4. Inputtaxiswhatthebusinesspayswhentheypurchasestock/services. Output tax is what the business collects on behalf of SARS when sales
take place.

369s e c t i o n 5 • c h a p t e r 1 4
Activity 14.27 VAT LB page 532
1. Sales – zero-rated items
= R133 632 – 21 000
= R112 632
R112 632 × 15 ___ 115 = R14 691,13
2. Outputtax–Inputtax
= R14 691,13 – 5 977,00
= R8 714,13
3. Cost price (VAT exclusive)
= (R3 990 + 228) × 100 ___ 115
= R3 667,83
Selling price (VAT exclusive)
= R3 667,83 × 180 ___ 100
= R6 602,09
Selling price (VAT inclusive)
= R6 602,09 × 115 ___ 100
= R7 592,40
Activity 14.28 VAT LB page 533
1. Whentheyhaveaturnoverof R1000000ormoreperannum
2. Output = VAT received by the business with sales
3. Everytwomonths
4. R1 580 × 15 ___ 100 = R237
5. R130 × 160 ___ 100 = R208
R208 × 115 ___ 100 = R239,20
6. Inputtax = R1 580 × 15 ___ 100 = R237
Output tax
= R1 580 × 160 ___ 100 × 15 ___ 100
= R379,20
Amount payable to SARS: = R379,20 – 237,00 = R142,20
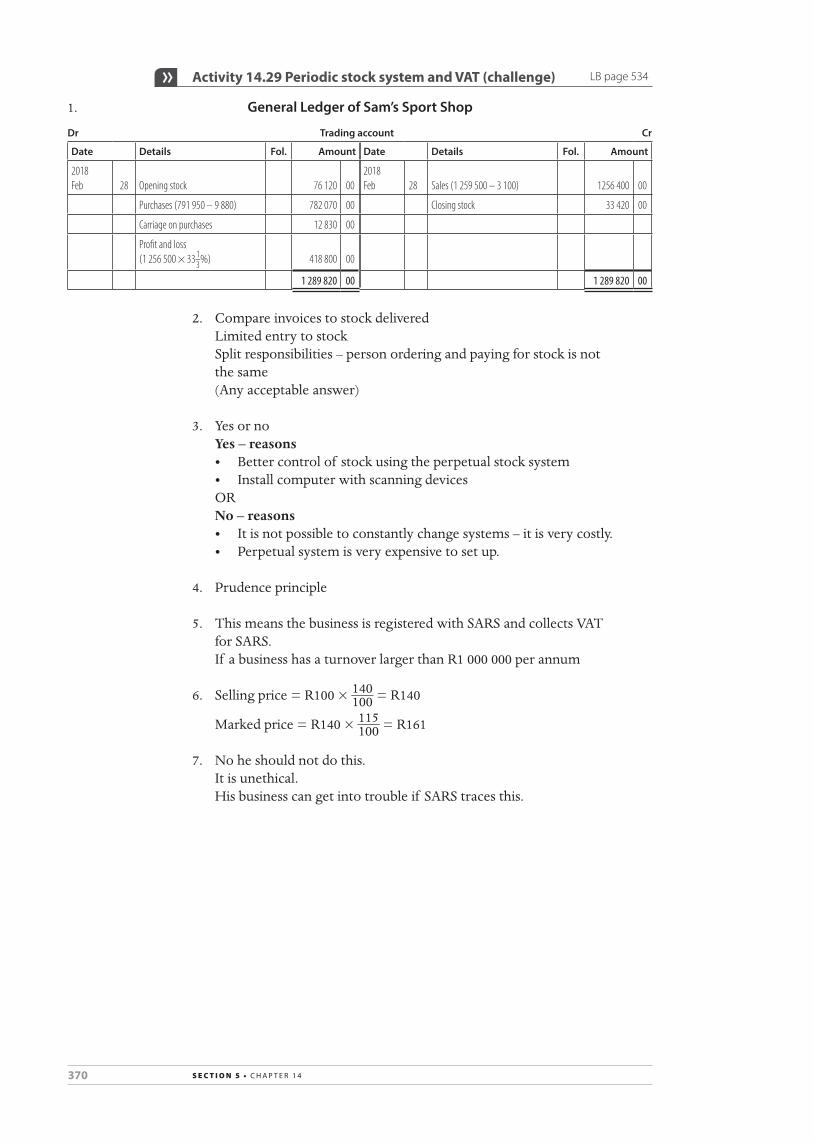
370 s e c t i o n 5 • c h a p t e r 1 4
Activity 14.29 Periodic stock system and VAT (challenge) LB page 534
1. General Ledger of Sam’s Sport Shop
Dr Trading account Cr
Date Details Fol. Amount Date Details Fol. Amount
2018 Feb 28 Opening stock 76 120 00
2018 Feb 28 Sales (1 259 500 – 3 100) 1256 400 00
Purchases (791 950 – 9 880) 782 070 00 Closing stock 33 420 00
Carriage on purchases 12 830 00
Profit and loss (1 256 500 × 33 1 _ 3 %) 418 800 00
1 289 820 00 1 289 820 00
2. Compare invoices to stock deliveredLimited entry to stock
Split responsibilities – person ordering and paying for stock is not the same(Any acceptable answer)
3. Yes or noYes – reasons• Bettercontrolof stockusingtheperpetualstocksystem• InstallcomputerwithscanningdevicesORNo – reasons• Itisnotpossibletoconstantlychangesystems–itisverycostly.• Perpetualsystemisveryexpensivetosetup.
4. Prudence principle
5. This means the business is registered with SARS and collects VAT for SARS.If abusinesshasaturnoverlargerthanR1000000perannum
6. Selling price = R100 × 140 ___ 100 = R140
Marked price = R140 × 115 ___ 100 = R161
7. No he should not do this.Itisunethical.His business can get into trouble if SARS traces this.

371s e c t i o n 6 • m o d e r at i o n t e m p l at e s
Section 6
moderation templateS
MODERATION OF ASSESSMENT
Moderation refers to the process that ensures that the assessment tasks are fair, valid and reliable.
Moderation should be implemented at school, district, provincial and national levels. Comprehensive and appropriate moderation practices must be in place for the quality assurance of all subject assessments.
Moderation at the school will be carried out by the head of department responsible for the subject. Teachers’ portfolios and evidence of learner performance must be moderated to ensure that a variety of assessment tasks have been used to address the curriculum and that assessment covered a range of cognitive levels.
All assessment tasks should be moderated before they are handed out to learners. After an assessment task has been marked, at least three learners’ tasks should be moderated.
The following moderation templates are provided to assist the teacher in the moderation process:• templatefortheassessmentof teacherportfolios• templateforthemoderationof learnerportfolios• templateforthemoderationof examinationpapers/tests• trackingmoderationtool• templateforlearnerportfolio:contents/consolidation/intervention.
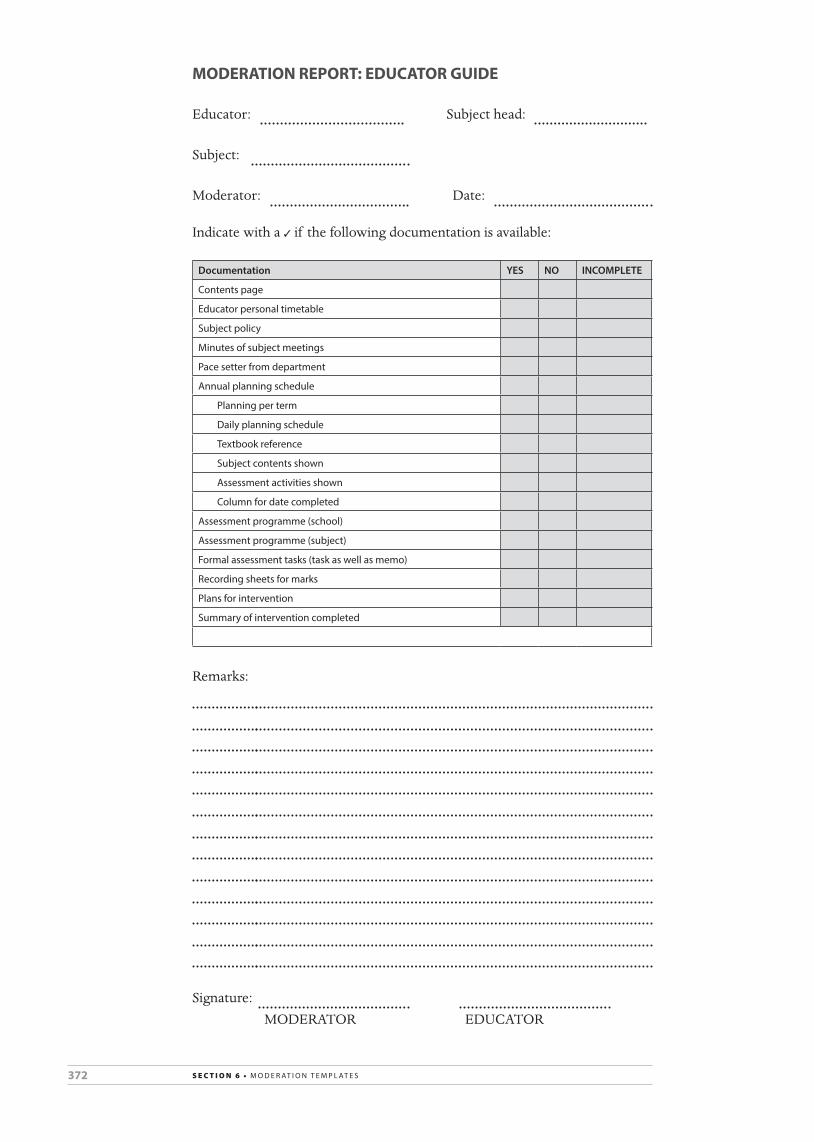
372 s e c t i o n 6 • m o d e r at i o n t e m p l at e s
MODERATION REPORT: EDUCATOR GUIDE
Educator: Subject head:
Subject:
Moderator: Date:
Indicate with a ✓ if the following documentation is available:
documentation YeS no incomplete
Contents page
educator personal timetable
subject policy
minutes of subject meetings
pace setter from department
annual planning schedule
planning per term
daily planning schedule
textbook reference
subject contents shown
assessment activities shown
Column for date completed
assessment programme (school)
assessment programme (subject)
Formal assessment tasks (task as well as memo)
recording sheets for marks
plans for intervention
summary of intervention completed
Remarks:
Signature:MODERATOR EDUCATOR

373s e c t i o n 6 • m o d e r at i o n t e m p l at e s
MODERATION REPORT: LEARNER PORTFOLIO
Educator: Subject:
Subjecthead/Moderator: Date:
Use a ✓ in the correct block during the moderation process.
2 above average, 2 average and 2 below average learner portfolios were provided.
Yes no oCCasionallY
Contents page Yes no oCCasionallY
Consolidation schedule Yes no oCCasionallY
each learner portfolio contains a signed statement of authenticity. Yes no oCCasionallY
the different section from which the Cass mark was calculated is shown on the consolidation schedule and completed.
Yes no oCCasionallY
the portfolio contains all assessment tasks completed up to date. Yes no oCCasionallY
the tasks in the portfolio has clear instructions. Yes no oCCasionallY
a rubric/memorandum/marking instrument gives learners an indication on how they were assessed.
Yes no oCCasionallY
evidence of assessment tasks show that different forms of assessment took place as prescribed by the subject guidelines.
Yes no oCCasionallY
evidence of assessment task in portfolio was marked, signed and the date when marked included.
Yes no oCCasionallY
the educator goes through a lot of trouble to write comments for the learners.
Yes no oCCasionallY
there is evidence of moderation that took place. Yes no oCCasionallY
accurate recording of marks Yes no oCCasionallY
parents signed the test to take note of marks. Yes no oCCasionallY
marking according to marking instrument is satisfactory. Yes no oCCasionallY
General remarks:
Signature:MODERATOR EDUCATOR

374 s e c t i o n 6 • m o d e r at i o n t e m p l at e s
MODERATION OF EXAM PAPERS/TESTS
Educator: Paper/Test:
Moderator: Date:
criteria ✓ comment
technical quality
Heading with subject, grade, total marks and time allocated
the time allocated corresponds to the time allocated on the exam table.
Questions are numbered correctly.
instructions to learners are clear and unambiguous.
mark allocation per question is correct.
mark total of paper is correct.
mark allocation on paper and memorandum corresponds.
paper and memorandum is typed and presented neatly.
a range of assessment standards, as determined by the subject guidelines, was covered.
Quality of questions
Questions are phrased clearly and unambiguously.
a variety of questions were asked.
different cognitive levels were covered.
language
accurate translations
subject terminology used correctly
no form of racial/cultural or sexual discrimination
General remarks:
Signature:MODERATOR EDUCATOR

375s e c t i o n 6 • m o d e r at i o n t e m p l at e s
tra
cKin
G m
od
erat
ion
to
ol
educ
ator
:
Subj
ect:
ass
essm
ent t
ask
dat
eco
mm
ents
nam
es o
f lea
rner
sm
oder
ator
capa
city
leve
l: in
tern
al
376 s e c t i o n 6 • m o d e r at i o n t e m p l at e s
ass
essm
ent t
ask
dat
eco
mm
ents
nam
es o
f lea
rner
sm
oder
ator
capa
city
leve
l: in
tern
al
leve
l: Cl
uste
r
1st r
ound
of m
oder
atio
n
Fina
l mod
erat
ion
leve
l: sc
hool
vis
its
leve
l: U
mal
usi

377s e c t i o n 6 • m o d e r at i o n t e m p l at e s
Lear
ner p
ortf
olio
: Con
tent
s/Co
nsol
idat
ion/
Inte
rven
tion
acc
oU
nti
nG
G
rade
11
nam
e:Yo
ur g
oal f
or a
ccou
ntin
g fo
r the
yea
r:
Cont
act d
etai
l of p
aren
ts:
Hom
e:W
ork:
Cell
phon
e:
caSS
act
iviti
esd
ate
tota
l mar
km
ark
achi
eved
%co
mm
ent o
f tea
cher
/par
ent
Sign
atur
e pa
rent
Sign
atur
e m
oder
ator
calc
ulat
ion
of y
ear m
ark
term
1
pres
enta
tion
/10
Cont
rol t
est
/20
term
2
proj
ect
/20
mid
-yea
r ex
amin
atio
n/2
0
term
3
repo
rt/1
0
Cont
rol t
est
/20
tota
l Fo
r Ye
ar
ma
rK/1
00
end-
of-y
ear e
xam
inat
ion
/300
tota
l/4
00
Stat
emen
t of a
uthe
ntic
ity:
I her
eby
decl
are
that
ALL
item
s in
my
port
folio
are
my
own
orig
inal
wor
k, a
nd th
at w
here
I ha
ve u
sed
any
othe
r sou
rce,
I ha
ve g
iven
cre
dit t
o it.
The
se it
ems w
ere
also
not
pre
viou
slyh
ande
din
fora
sses
smen
t/m
oder
atio
n.
Sign
atur
e of
lear
ner:


379s e c t i o n 7 • a n s w e r s h e e t t e m p l at e s
Section 7
anSwer Sheet templateS
FORMAT FOR INCOME STATEMENT FOR PARTNERSHIP
names of partners name of business income Statement for the year ended ......................................
note r
sales
Cost of sales
Gross profit
other operating income
Discount received
rent income
profit on sale of assets
Bad debts recovered
etc.
salaries and wages
advertising
Depreciation
Bad debts
sundry expenses
etc.
operating profit (loss)
Interest income 1
profit (loss) before interest expense
Interest expense 2
net profit (loss) for the year

380 s e c t i o n 7 • a n s w e r s h e e t t e m p l at e s
FORMAT FOR BALANCE SHEET FOR PARTNERSHIP
names of partners name of business Balance Sheet at .................................................
note r
aSSetS
nOn-CUrrent assets
Fixed / tangible assets 3
Financial assets
CUrrent assets
Inventories 4
trade and other receivables 5
Cash and cash equivalents 6
total aSSetS
eQUity and liaBilitieS
Owner’s eQUItY
Capital 7
Current accounts 8
nOn-CUrrent lIaBIlItIes
loan from ...
loan from ...
CUrrent lIaBIlItIes
trade and other payables 9
Bank overdraft
Current portion of loan
total eQUity and liaBilitieS

381s e c t i o n 7 • a n s w e r s h e e t t e m p l at e s
FORMAT FOR NOTES TO THE FINANCIAL STATEMENTS FOR PARTNERSHIP
names of partners name of business noteS to the financial StatementS at .........................................................
1. intereSt incomeOn fixed deposit
On savings account
On current bank account
On overdue debtors
2. intereSt eXpenSeOn loan from ...............................
On overdraft
On overdue creditors
3. fiXed / tanGiBle aSSetSland and buildings Vehicles equipment total
Carrying value at beginning of year
Cost
accumulated depreciation
movements
additions
Disposals at carrying value
Depreciation
Carrying value at end of year
Cost
accumulated depreciation
4. inVentorieStrading stock
Consumable stores on hand
5. trade and other receiVaBleStrade debtors
provision for bad debts
net trade debtors
expenses prepaid
Income accrued (receivable)
Deposits paid for water and electricity

382 s e c t i o n 7 • a n s w e r s h e e t t e m p l at e s
6. caSh and caSh eQUiValentSFixed deposits (maturing within 12 months)
savings account
Bank
Cash float
petty cash
Deposits paid for water and electricity
7. capitalBalance at beginning of year
net profit (loss) for the year
additional capital contributed
Decreasing of capital
Balance at end of year
8. cUrrent accoUntSpartner a partner B total
Balance at beginning of year
net profit as per Income statement
partners’ salaries
Interest on capital
partners’ bonuses
primary distribution of profit
Final distribution of profit
Drawings for the year
Undrawn profits (retained income) for the year
Balance at end of year
9. trade and other payaBleStrade creditors
expenses accrued (payable)
Income received in advance (deferred)
Creditors for salaries
pension Fund
medical aid
sars

383s e c t i o n 7 • a n s w e r s h e e t t e m p l at e s
FORMAT FOR STATEMENT OF RECEIPTS AND PAYMENTS FOR CLUB
name of club Statement of receiptS and paymentS for the year ended ..................
note r
receiptS
membership fees
entrance fees
Donations
sale of refreshments
Fixed deposit matured
Interest on fixed deposit
Interest on savings account
etc.
paymentS
salaries and wages
purchase of refreshments
Investment in fixed deposit
repairs
equipment
Bank charges
Creditors
etc.
Surplus (deficit) for the year
opening balances
Bank
savings account
closing balances
Bank
savings account
inVeStment in fiXed depoSit
Balance at beginning of year
Changes during the year
Interest capitalised
Balance at end of year
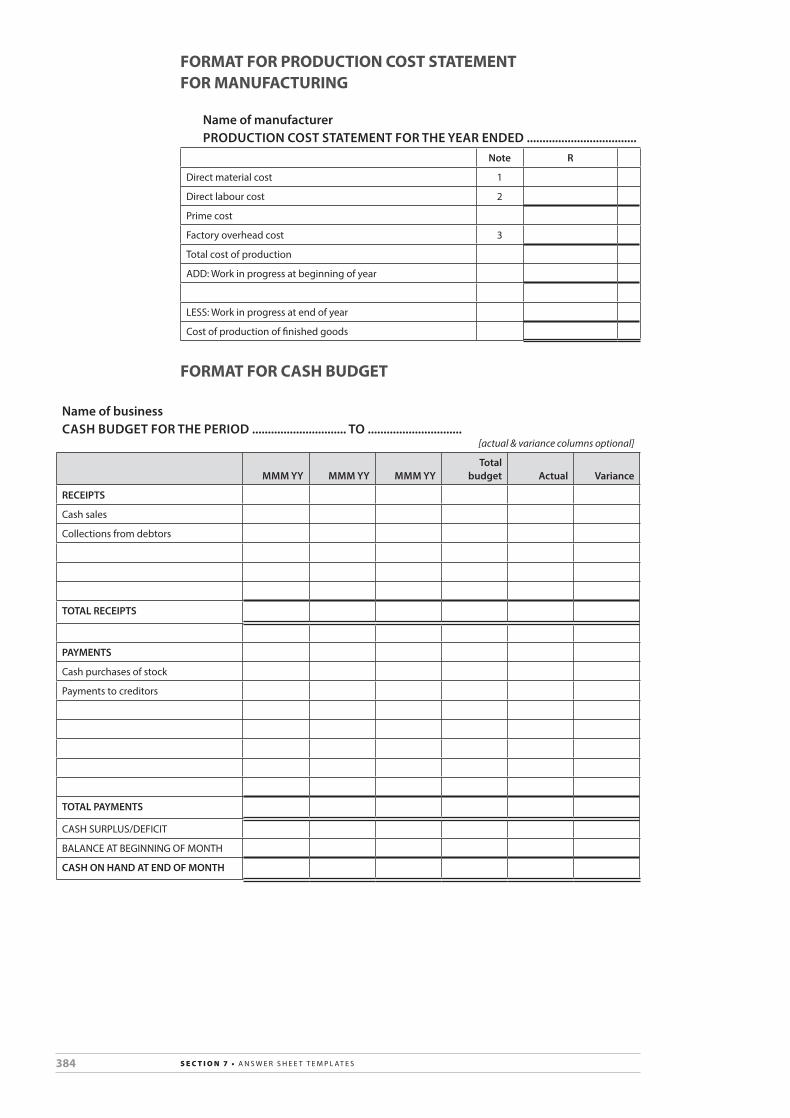
384 s e c t i o n 7 • a n s w e r s h e e t t e m p l at e s
FORMAT FOR PRODUCTION COST STATEMENT FOR MANUFACTURING
name of manufacturer prodUction coSt Statement for the year ended ...................................
note r
Direct material cost 1
Direct labour cost 2
prime cost
Factory overhead cost 3
total cost of production
aDD: work in progress at beginning of year
less: work in progress at end of year
Cost of production of finished goods
FORMAT FOR CASH BUDGET
name of businesscaSh BUdGet for the period .............................. to ..............................
[actual & variance columns optional]
mmm yy mmm yy mmm yytotal
budget actual Variance
receiptS
Cash sales
Collections from debtors
total receiptS
paymentS
Cash purchases of stock
payments to creditors
total paymentS
Cash sUrplUs/DeFICIt
BalanCe at BeGInnInG OF mOnth
caSh on hand at end of month


![[Teacher's Manual] 7. Attendance & Grade Management](https://img.pdfslide.net/doc/110x75/6265f61c4318f20d5a5a0683/teachers-manual-7-attendance-amp-grade-management.jpg)
