Embed Size (px)
Citation preview
December, 2015
How households of different Socio-Economic background spend on tourism – A comparative study based on Domestic Tourism Survey, 2008-09
Study Commissioned by Ministry of Tourism, Government of India


How households of different Socio-Economic background spend on tourism – A comparative study based on Domestic Tourism Survey, 2008-09
Study Commissioned by the
Ministry of Tourism, Government of India
Prepared by:
National Council of Applied Economic Research
Parisila Bhawan, 11 I. P. Estate, New Delhi – 110002.
India

© National Council of Applied Economic Research, 2014
All rights reserved. The material in this publication is copyrighted. NCAER encourages the
dissemination of its work and will normally grant permission to reproduce portions of the work
promptly. For permission to photocopy or reprint any part of this work, please send a request
with complete information to the publisher below.
Published by
Anil Kumar Sharma Acting Secretary, NCAER National Council of Applied Economic Research (NCAER) Parisila Bhawan, 11, Indraprastha Estate, New Delhi–110 002 Email: [email protected]
Disclaimer: The findings, interpretations, and conclusions expressed are those of the
authors and do not necessarily reflect the views of the Governing Body of NCAER.

A comparative study of domestic Tourism survey, 2008-09
National Council of Applied Economic Research i
STUDY TEAM
Project Leader
Poonam Munjal
Senior Advisor
Ramesh Kolli
Core Research Team
K. A. Siddiqui
Amit Sharma
Monisha Grover
Shashi Singh

A comparative study of domestic Tourism survey, 2008-09
National Council of Applied Economic Research ii
A comparative study of domestic Tourism survey, 2008-09
National Council of Applied Economic Research iii
PREFACE
This is the second in a series of reports that NCAER, the National Council of
Applied Economic Research, has been doing on detailed tourism satellite accounts for
the states and union territories of India. With the tremendous growth of the Indian
service sector, tourism as a location-specific economic activity is important at the sub-
national level. This is true for both tourism’s contribution to national income and to
employment. With 29 states, many larger in population than most countries in the
world, it is important to measure tourism activity within states through the compilation
of State Tourism Satellite Accounts (TSAs). State TSAs go well beyond a national TSA
in providing the direct and indirect contribution of tourism to state GDP and
employment using state-specific demand and supply data.
TSAs at the sub-national level are becoming increasingly important. The United
Nations World Tourism Organisation has emphasised the many reasons for
encouraging countries to develop sub-national or regional TSAs. One reason is the
worldwide trend towards decentralisation of political power and management of
national resources in states, regions and municipalities. In order to allocate and
monitor these resources effectively, more and better-integrated regional and local
information is required. Tourism activity inevitably has an unequal geographical
distribution and characteristics within a national territory, and understanding this
requires tourism statistics at different territorial levels. Improving the allocation of
resources and regulating markets in sensible ways for a sector with such diversity can
only be achieved by upgrading data and measuring economic impact at the sub-
regional level.
NCAER was commissioned by the Ministry of Tourism in the Government of India
in 2013 to compile Regional Tourism Satellite Accounts for all the states and UTs of
India for the base year 2009–10 in order to have a more complete understanding of the
tourism sector. NCAER has earlier compiled both the first and second national TSAs
for India. NCAER’s first report covered Andhra Pradesh, Bihar, Gujarat, Jammu &
Kashmir, Punjab, Rajasthan, Sikkim, Tripura, Tamil Nadu, and West Bengal. This
report covers Arunachal Pradesh, Assam, Goa, Himachal Pradesh, Jharkhand,
Karnataka, Maharashtra, Odisha, Puducherry, and Uttar Pradesh
In the absence of standard international guidelines to prepare sub-national TSAs,
NCAER has compiled the state TSAs along the same lines as the national TSA,
overcoming several data limitations in the process. These limitations have been
overcome by using the most logical rates and ratios based on reasonable assumptions.

A comparative study of domestic Tourism survey, 2008-09
National Council of Applied Economic Research iv
I would like to thank the agencies that provided the underlying data for the TSA
2009–10, especially the National Sample Survey Office, the Indian Statistical Institute,
and Central Statistical Office. NCAER is particularly grateful to several Ministry of
Tourism officials, in particular Shri R.K. Bhatnagar, Additional Director-General, Mr
Shailesh Kumar, Deputy Director, Smt. Mini Prasanna Kumar, Joint Director, Smt.
Neha Srivastava, Deputy Director and Shri S.K. Mohanta, Data Processing Assistant,
for their valuable inputs and administrative support during the preparation of the state
TSAs.
In ending, I would like to thank the team members, Shri Ramesh Kolli, Senior
Advisor, Dr Poonam Munjal, the Task Team Leader, Mr K. A. Siddiqui, Associate
Fellow, Mr Amit Sharma, Research Analyst, Ms Monisha Grover, Consultant and Ms
Shashi Singh, Office Assistant, for their tireless work in producing India’s first state
Tourism Satellite Accounts.
New Delhi Shekhar Shah December 20th, 2015 Director-General NCAER
A comparative study of domestic Tourism survey, 2008-09
National Council of Applied Economic Research v
ACKNOWLEDGEMENT
We would like to thank the officials of The Ministry of Tourism (MoT) for their
valuable inputs during the project review meetings and presentations. In particular, we
are immensely grateful to Dr. R.K. Bhatnagar (ADG, Market Research, and MoT), Smt.
Mini Prasanna Kumar (Joint Director, Market Research, MoT), Smt. Neha Srivastava
(Dy. Director, Market Research, MoT) and Shailesh Kumar (Deputy Director, Market
Research, MoT). The study also benefited immensely from the important inputs from
the officials of various State Tourism Departments.

A comparative study of domestic Tourism survey, 2008-09
National Council of Applied Economic Research vi

A comparative study of domestic Tourism survey, 2008-09
National Council of Applied Economic Research vii
ABBREVIATIONS AND ACRONYMS Units used in the Report 1 crore = 10 million 1 lakh = 100 thousand Abbreviations
DTS Domestic Tourism Survey
IPS International Passenger Survey
ISI Indian Statistical Institute
NCAER National Council of Applied Economic Research
NRI Non-Resident Indian
NSSO National Sample Survey Office
PIO Persons of Indian Origin
TSA Tourism Satellite Account
A comparative study of domestic Tourism survey, 2008-09
National Council of Applied Economic Research viii

A comparative study of domestic Tourism survey, 2008-09
National Council of Applied Economic Research ix
TABLE OF CONTENT
Study Team .......................................................................................................................... i
Preface ............................................................................................................................... iii
Acknowledgement............................................................................................................... v
Abbreviations & Acronyms ............................................................................................... vii
List of Figures ..................................................................................................................... x
List of Tables ..................................................................................................................... xi
1. Introduction…………………………………………………………………………………………………………………… 1
2. Context of the study………………………………………………………………………………………………………… 1
3. Objectives of the Study……………………………………………………………………………………………………. 2
4. About Data Source………………………………………………………………………………………………………….. 2
5. Important concepts/definitions used in DTS………………………………………………………………….…. 4
6. Incidence of trips by Socio-Economic categories……………………………………………………………….. 8
7. Average duration of overnight trips………………………………………………………………………………….. 9
Appendix….……………………………………………………………………………………………..……………17
A comparative study of domestic Tourism survey, 2008-09
National Council of Applied Economic Research x
LIST OF FIGURES
Figure 1: Average duration of trips (number of nights spent) Average expenditure per overnight trips
1
0
Figure 2: Average expenditure (Rs.) per overnight trip by categories of expenditure and BY RELIGION
1
1
Figure 3: Average expenditure (Rs.) per overnight trip by categories of expenditure and BY SOCIAL
GROUPS
1
2
Figure 4: Average expenditure (Rs.) per overnight trip by categories of expenditure and BY
HOUSEHOLD TYPE
1
3
Figure 5: Average expenditure (Rs.) per overnight trip by categories of expenditure and BY PRINCIPAL
OCCUPATION (NCO) OF HOUSEHOLDS
1
4
Figure 6: Average expenditure (Rs.) per overnight trip by categories of expenditure and BY PRINCIPAL
INDUSTRY (NIC) OF HOUSEHOLDS
1
5

A comparative study of domestic Tourism survey, 2008-09
National Council of Applied Economic Research xi
LIST OF TABLES
Table 1: Incidence of trips by Socio-Economic categories (Number of trips per person) 9
Table A1: Number of overnight trips per 100 persons by purpose and by gender of visitors 19
Table A2: Number of overnight trips per 100 persons by purpose and by age-groups of visitors 20
Table A3 (a): Number of overnight trips per 100 persons by purpose and by usual principal activity
status of visitors - RURAL 21
Table A3 (b): Number of overnight trips per 100 persons by purpose and by usual principal activity
status of visitors – URBAN 22
Table A3 (c): Number of overnight trips per 100 persons by purpose and by usual principal activity
status of visitors – TOTAL 23
Table A4: Number of overnight trips per 100 persons by purpose and by religion of visitors 24
Table A5: Number of overnight trips per 100 persons by purpose and by social groups of visitors 25
Table A6: Number of overnight trips per 100 persons by purpose and by household types of visitors 26
Table A7: Number of overnight trips per 100 persons by purpose and by principal occupation (NCO) of
visitors 27
Table A7: Number of overnight trips per 100 persons by purpose and by principal occupation (NCO) of
visitors 28
Table A8: Number of overnight trips per 100 persons by purpose and by principal industry (NIC) of
visitors 29
Table A9: Number of overnight trips per 100 persons by purpose and by MPCE quintile 30
Table A10: Average duration of overnight trips (number of nights spent) by purpose and by religion 31
Table A11: Average duration of overnight trips (number of nights spent) by purpose and by social
groups 32
Table A12: Average duration of overnight trips (number of nights spent) by purpose and by types of
household 33
Table A13: Average duration of overnight trips (number of nights spent) by purpose and by principal
occupation (NCO) of households 34
Table A14: Average duration of overnight trips (number of nights spent) by purpose and by principal
industry (NIC) of households 35
Table A15: Average duration of overnight trips (number of nights spent) by purpose and by MPCE
quintiles 36
Table A16: Average expenditure per overnight BUSINESS trip by categories of expenditure and by
religion 37
A comparative study of domestic Tourism survey, 2008-09
National Council of Applied Economic Research xii
Table A17: Average expenditure per overnight BUSINESS trip by categories of expenditure and by
social groups 38
Table A18: Average expenditure per overnight BUSINESS trip by categories of expenditure and by
types of household 39
Table A19: Average expenditure per overnight BUSINESS trip by categories of expenditure and by
principal occupation (NCO) of households 40
Table A20: Average expenditure per overnight BUSINESS trip by categories of expenditure and by
principal industry (NIC) of households 41
Table A21: Average expenditure per overnight BUSINESS trip by categories of expenditure and by
MPCE quintiles 42
Table A22: Average expenditure per overnight LEISURE trip by categories of expenditure and by
religion 43
Table A23: Average expenditure per overnight LEISURE trip by categories of expenditure and by
social groups 44
Table A24: Average expenditure per overnight LEISURE trip by categories of expenditure and by types
of households 45
Table A25: Average expenditure per overnight LEISURE trip by categories of expenditure and by
principal occupation (NCO) of households 46
Table A26: Average expenditure per overnight LEISURE trip by categories of expenditure and by
principal industry (NIC) of households 47
Table A27: Average expenditure per overnight LEISURE trip by categories of expenditure and by
MPCE quintiles 48
Table A28: Average expenditure per overnight SOCIAL trip by categories of expenditure and by
religion 49
Table A29: Average expenditure per overnight SOCIAL trip by categories of expenditure and by social
groups 50
Table A30: Average expenditure per overnight SOCIAL trip by categories of expenditure and by types
of household 51
Table A31: Average expenditure per overnight SOCIAL trip by categories of expenditure and by
principal occupation (NCO) of households 52
Table A32: Average expenditure per overnight SOCIAL trip by categories of expenditure and by
principal industry (NIC) of households 53
Table A33: Average expenditure per overnight SOCIAL trip by categories of expenditure and by MPCE
quintiles 54
Table A34: Average expenditure per overnight RELIGIOUS trip by categories of expenditure and by
religion 55
Table A35: Average expenditure per overnight RELIGIOUS trip by categories of expenditure and by
social groups 56
Table A36: Average expenditure per overnight RELIGIOUS trip by categories of expenditure and by
types of household 57
Table A37: Average expenditure per overnight RELIGIOUS trip by categories of expenditure and by
principal occupation (NCO of household 58
Table A38: Average expenditure per overnight RELIGIOUS trip by categories of expenditure and by
principal industry (NIC) of households 59
Table A39: Average expenditure per overnight RELIGIOUS trip by categories of expenditure and by
MPCE quintiles 60
A comparative study of domestic Tourism survey, 2008-09
National Council of Applied Economic Research xiii
Table A40: Average expenditure per overnight EDUCATIONAL trip by categories of expenditure and
by religion 61
Table A41: Average expenditure per overnight EDUCATIONAL trip by categories of expenditure and
by social groups 62
Table A42: Average expenditure per overnight EDUCATIONAL trip by categories of expenditure and
by types of household 63
Table A43: Average expenditure per overnight EDUCATIONAL trip by categories of expenditure and
by principal occupation (NCO) of household 64
Table A44: Average expenditure per overnight EDUCATIONAL trip by categories of expenditure and
by principal industry (NIC) of households 65
Table A45: Average expenditure per overnight EDUCATIONAL trip by categories of expenditure and
by MPCE quintiles 66
Table A46: Average expenditure per overnight MEDICAL trip by categories of expenditure and by
religion 67
Table A47: Average expenditure per overnight MEDICAL trip by categories of expenditure and by
social groups 68
Table A48: Average expenditure per overnight MEDICAL trip by categories of expenditure and by
types of household 69
Table A49: Average expenditure per overnight MEDICAL trip by categories of expenditure and by
principal occupation (NCO) of households 70
Table A50: Average expenditure per overnight MEDICAL trip by categories of expenditure and by
principal industry (NIC) of households 71
Table A51: Average expenditure per overnight MEDICAL trip by categories of expenditure and by
MPCE quintile 72
Table A52: Average expenditure per overnight SHOPPING trip by categories of expenditure and by
religion 73
Table A53: Average expenditure per overnight SHOPPING trip by categories of expenditure and by
social groups 74
Table A54: Average expenditure per overnight SHOPPING trip by categories of expenditure and by
types of household 75
Table A55: Average expenditure per overnight SHOPPING trip by categories of expenditure and by
principal occupation of households 76
Table A56: Average expenditure per overnight SHOPPING trip by categories of expenditure and by
principal industry (NIC) of households 77
Table A57: Average expenditure per overnight SHOPPING trip by categories of expenditure and by
MPCE quintiles 78
Table A58: Average expenditure per overnight OTHER trip by categories of expenditure and by religion 79
Table A59: Average expenditure per overnight OTHER trip by categories of expenditure and by social
groups 80
Table A60: Average expenditure per overnight OTHER trip by categories of expenditure and by types
of household 80
Table A62: Average expenditure per overnight OTHER trip by categories of expenditure and by
principal industry (NIC) of households 83
Table A63: Average expenditure per overnight OTHER trip by categories of expenditure and by MPCE
quintiles 84
___________________

A comparative study of domestic Tourism survey, 2008-09
National Council of Applied Economic Research xiv
A comparative study of domestic Tourism survey, 2008-09
National Council of Applied Economic Research 1
How households of different Socio-Economic background spend on tourism
A comparative study based on Domestic Tourism Survey, 2008-09
1. Introduction
These days tourism is a way of life for everybody. The prime objective of tourism is to
take time out for recreation, visiting relatives/friends or pilgrimage etc. irrespective of the
Socio-Economic characteristics like caste, religion, gender, age, income class or occupation
group that a tourist might belong to. But the preferences for tourism activities, destinations
and expenses incurred on travel might vary across these characteristics.
The purpose of this study is to present the pattern of expenditure incurred on domestic
tourism across the tourist-households’ socio-economic characteristics. There are some
insights available on number of tourists by gender and age but there is a complete void of
information on spending pattern of tourists by the various socio-economic characteristics.
Such information was collected in the pan-India household survey on “Domestic Tourism in
India”, which was conducted by the National Sample Survey Organisation (NSSO) during
2008-09. This report presents some of the key findings of this survey that help us meet the
objectives of this study.
2. Context of the study
Domestic tourism is a huge and ever-growing phenomenon in India. Despite this, the
tourism sector has failed to get as much attention from the research perspective as has many
other economic sectors of India, mostly because of the huge dearth of data. Realising this,
the Ministry of Tourism, Government of India, took an initiative to fill this data void to a
great extent by conducting two comprehensive surveys on “Domestic Tourism in India” and
“International Passenger Survey”, the data of which have been extensively used in the
preparation of India’s Tourism Satellite Account and even the State Tourism Satellite
Accounts.
A comparative study of domestic Tourism survey, 2008-09
National Council of Applied Economic Research 2
The present study, commissioned by the Ministry of Tourism to NCAER, analyses
these data to prepare a report on “How households of different Socio-Economic background
spend on tourism – A comparative study using Domestic Tourism Survey”. This report is a
part of the second phase of the “3-year integrated plan for preparation of regional TSAs for
all states and UTs of India and two research topics for each year” that was commissioned to
NCAER by MoT in October 2013.
3. Objectives of the Study
As desired, the study aims to present and compare the spending pattern of tourists
belonging to different socio-economic categories. The socio-economic variables for which
data are available are as follows:
Gender
Age
Marital Status
Religion
Social Group
Household Type
Educational level
Usual Principal Status
Profession / Occupation
Industry of employment
The item-wise expenditure incurred by tourists belonging to the household variables are
presented in this report.
4. About Data Source
“Domestic Tourism in India” is an all-India household survey on domestic tourism
(DTS 2008-09), carried out during the period July 2008 to June 2009 by National Sample
Survey Organisation (NSSO) as part of its 65th Round of sample surveys. This was the first
time that such comprehensive survey on domestic tourism was undertaken by NSSO.
A comparative study of domestic Tourism survey, 2008-09
National Council of Applied Economic Research 3
A stratified multi-stage sampling design was adopted for the DTS 2008-09. The first
stage units (FSU) were the 2001 census villages in rural sector and urban frame survey
blocks in the urban sector. For larges FSUs, an intermediate stage of sampling was the
division of the FSU into a number of parts and random selection of one part for survey. The
ultimate stage sampling units were the households. In all, 1,53,038 households were
surveyed from 8109 sample villages and 4719 urban blocks spread over all states and union
territories of India. Of the total households, 97,074 (63 per cent) belonged to the rural areas
and 56,234 to urban areas.
A detailed schedule of enquiry was used to collect data from the sample households
on various parameters like household characteristics comprising household size, principal
industry, principal occupation, household type, religion, social group, household
consumption expenditure, number of overnight trips and same-day trips undertaken by the
household, visits of NRIs to the households and their impact, renting out of some portion of
the house to tourists during the last 365 days, and awareness, source of information, and
impact of the “Incredible India” campaign by the Government of India or other tourism
promotional campaigns. Data were also collected for each household member on age,
gender, marital status, educational level, usual principal activity status, industry and
occupation of employed members, number of overnight as well as same-day trips completed
during last 30 days and last 365 days.
For each trip, various trip characteristic data were also collected. These included
leading purpose of the trip, main destination, number of places visited, mode of travel, type
of stay, number of nights spent outside usual place of residence and so on. Finally, for the
latest three overnight trips completed during the last 30 days, detailed data were collected on
particulars of expenditure on different items under the heads of accommodation, food and
drink, transport, shopping, recreation, religious, cultural, sporting and health-related
activities, and other expenditures along with information of reimbursement/direct payment
by any institution for such trips.

A comparative study of domestic Tourism survey, 2008-09
National Council of Applied Economic Research 4
5. Important concepts/definitions used in DTS
Trip A trip refers to the movement by one or more household members
travelling to a place outside their usual environment for purposes other
than those of migration or getting employed or setting up of residence
in that place and which is outside their regular routine of life, for a
duration of not more than six months.
Domestic
Visitor
A domestic visitor is a household member, who has completed a ‘trip’.
In other words, a domestic visitor is a person (household member),
residing in the country, who travels to a place within the country,
outside his or her usual environment and not as a part of his or her
regular routine of life, for duration of not more than six months at a
time.
Further, domestic visitors are classified into two categories: domestic
overnight visitors and domestic same-day visitors. A domestic
overnight visitor is a domestic visitor who spent at least one night in a
trip during last 365 days. This means that the trip covered at least two
calendar days, wholly or partly. A domestic same-day visitor is a
domestic visitor who did not spend even a single night in any trip
during last 365 days. This means that the trip started and ended on the
same day.
Since it is difficult to distinguish domestic tourists from other
travellers who are travelling within the boundary of the country of
reference, it is important to identify them by carefully looking into
their purpose and duration of travel. This requires a little more
scrutiny and it must be noted that:
All movements of persons commuting regularly and frequently
(nearly every day/every week/every fortnight) between their

A comparative study of domestic Tourism survey, 2008-09
National Council of Applied Economic Research 5
usual environment and some fixed places for the purpose of
work or study, visiting homes of friends or relatives, shopping
centres, religious places, centres of health care or any other
facilities that might be at a substantial distance away but
nevertheless were regularly and frequently visited were not
considered as trips.
Similarly, all movements of persons, whose nature of activities
within their regular routine of life involved making movements
outside their usual environment to different places, like
travelling salesmen, mobile hawkers, medical representatives,
on-board staff of airlines/railways or of buses, hired taxis, etc.
were not considered as trips.
Exceptions for exclusion from the coverage of trip as mentioned
above were all domestic movements performed by air except for
the purpose of migration or getting employed or setting up of
residence in that place were considered as trips even if such
movements fall within the regular routine of life of the visitor.
However, domestic movements performed by on-board aircraft
crew as part of their duty were not considered as trips.
Leading purpose
of the trip
This is defined as the purpose in the absence of which the trip would
not have taken place. Leading purpose for all the members who are
performing a trip is that purpose without which none of the members
in that trip would have undertaken the trip. Clearly, the leading
purpose of a trip will be the same for all the members who undertook
that trip. In DTS – 2008-09, these purposes have been identified as
below:
Business - This category includes trips of employees of
Government, public or private organisations or of self-
employed people, trips for installation of equipment,
A comparative study of domestic Tourism survey, 2008-09
National Council of Applied Economic Research 6
inspection, purchase and sale for enterprise; for attending
conferences, congresses, trade fairs and exhibitions; for
delivering lectures or concerts; for participation in professional
sport activities, etc. For example: Official tours of government
officials posted outside Delhi to attend occasional official
meetings at Delhi.
Holidaying, leisure and recreation - This category includes
sightseeing, attending sporting and cultural events, non-
professional active sports, adventure sports, recreational
activities, cultural activities, holidays at beaches and hill
stations, summer camps, dining out, visiting spas and other
establishments specialized in well-being, fitness except in the
context of a medical treatment (in which case the purpose
would be health & medical), etc.
Social (including visiting friends and relatives, attending
marriages, etc.) - This category includes visiting friends and
relatives, attending marriages/ any other family events/ other
social functions, visiting home towns, visits to arrange short-
term caring for the baby, sick or old; etc.
Pilgrimage & religious activities - This category includes
attending various religious meetings and events, and
undertaking pilgrimages to different places of worship or holy
places.
Education & training - This category includes trips to join
short-term courses (less than six months) following particular
programs of study, education and research programming,
acquiring specific skills through formal on-the-job training
including paid study, etc. For example, the trip of a professional
academician (e.g. college lecturer/school teacher) for acquiring

A comparative study of domestic Tourism survey, 2008-09
National Council of Applied Economic Research 7
a certain academic qualification would come under this
category. However, if his trip primarily involves delivering
academic lectures then the purpose of his trip was reported not
as education and training but as business.
Health & medical - This category includes trips to spa, fitness
and health resorts, treatments and cures, Ayurvedic and other
health resorts of traditional medicines, etc., for getting short-
term (less than six months) medical treatment.
Shopping - This category includes purchasing of consumer
goods for own personal use or as gifts but not for resale or for
use in a future productive process (in which case the purpose
would be business). For example, in many places in our
country people visit some nearby city/town or market place
primarily for the purpose of purchasing consumer goods
during festivals like Puja, Diwali, Eid, Christmas, etc. or
during social functions like marriages, birthdays, etc., in their
households. For such trips the purpose was taken as shopping.
But if a shopkeeper undertakes a trip to a city/town to make
wholesale purchase for retail selling then the purpose of his
trip was taken as business and not shopping.
Others - This category includes purposes which are not
indicated elsewhere. For example, making a trip to render
some social service, such as attending a blood donation camp
to donate blood, comes under this category.
Domestic
Tourism
Domestic tourism covers all the trips of household members within the
territory of India, i.e. of domestic visitors, either as a domestic trip or
as part of an international trip.

A comparative study of domestic Tourism survey, 2008-09
National Council of Applied Economic Research 8
Tourism
Expenditure
This refers to the total expenditure incurred on a trip undertaken by a
domestic visitor. This includes expenditure made not just during the
trip but also the expenditure related to the trip even if made before or
after the trip. It also includes expenditure related to the trip, whether
directly paid or reimbursed, by some institution like Government or
other agencies on behalf of the selected household.
Trip duration
This refers to the average night spent out of usual place of stay by
visitors including time of travelling.
6. Incidence of trips by Socio-Economic categories
The data suggests that the incidence of trips undertaken in a year by persons in rural
areas and by those in urban areas does not vary much. The average number of overnight
trips made by a rural person was estimated at 2.10 while for urban person, it was 2.07. Both
rural males and urban males, on an average, undertake more trips than rural females and
urban females respectively. Incidence of overnight trips is observed the highest amongst Sikh
persons in rural areas (2.37) and amongst Jains (2.34) in urban areas. While analyzing
incidence of trips by age groups of the visitors, highest trips per person is made by those
belonging to 30-59 years of age-groups (rural: 2.47, urban:2.33); and this is followed by
persons belonging to 15-29 years age-group (rural: 2.13, urban: 2.02). The effect of some
socio-economic characteristics on incidence of trips is presented in Table 1.

A comparative study of domestic Tourism survey, 2008-09
National Council of Applied Economic Research 9
Table 1: Incidence of trips by Socio-Economic categories (Number of trips per person)
Category of persons Rural Urban Total
All persons 2.10 2.07 2.09
Male 2.25 2.20 2.24
Female 1.94 1.92 1.94
Hinduism 2.13 2.14 2.13
Islam 1.88 1.71 1.82
Christianity 1.89 2.03 1.94
Sikhism 2.37 2.32 2.35
Jainism 1.72 2.34 2.19
Other religious groups 2.23 1.64 2.04
Scheduled tribe 1.96 2.00 1.96
Scheduled caste 2.12 1.96 2.09
Other backward class 2.10 2.15 2.11
Other social groups 2.14 2.03 2.10
0-14 years 1.81 1.87 1.82
15-29 years 2.13 2.02 2.10
30-59 years 2.47 2.33 2.43
60+ years 1.70 1.68 1.69
Persons engaged in agriculture 2.50 2.40 2.50
Persons engaged in industries 2.62 2.31 2.49
Persons engaged in services 2.70 2.46 2.56
Source: NCAER’s computation using DTS, 2008-09 data
The detailed effects of socio-economic characteristics by leading purposes are given
in Tables A1 to A9 in the appendix.
7. Average duration of overnight trips
The average number of nights spent on overnight trips was about 3 for the rural
population and about 4 for the urban. However, the average duration of overnight trips
undertaken by the urban population varied from 2 nights in case of shopping trips to 5.6 in
case of medical trips. In rural areas, the least average duration was observed in case of
shopping related trips (1.5 nights) while the highest average duration pertained to leisure
trips (4.3 nights). Figure 1 presents average duration by leading purposes.

A comparative study of domestic Tourism survey, 2008-09
National Council of Applied Economic Research 10
Figure 1: Average duration of trips (number of nights spent)
Source: NCAER’s computation using DTS, 2008-09 data
Tables A10 to A15 in appendix give the average duration of overnight trips for all the
leading purposes separately by religion, social groups, household type, principal occupation
and principal industry of households and MPCE quintiles of households.
8. Average expenditure per overnight trips
The following figures present the average expenditure per-overnight trip by
categories of expenditure for each Socio-Economic category and the detailed tables of the
same, further classified by leading purposes are given in appendix (see Tables A16 to A63).
For each category, a comparison is drawn for rural, urban and overall sectors also.
4.1
4.3
2.9
2.7
4.3
4.2
1.5
4.2
3.1
2.9
5.1
4.0
4.8
3.7
5.6
2.0
3.8
4.2
3.7
4.7
3.2
3.5
4.1
4.4
1.6
4.1
3.4
0
1
2
3
4
5
6
Business Leisure Social Religious Educational Medical Shopping Other purposes
All Purposes
No
. o
f n
igh
ts s
pen
t
Rural Urban Total
A comparative study of domestic Tourism survey, 2008-09
National Council of Applied Economic Research 11
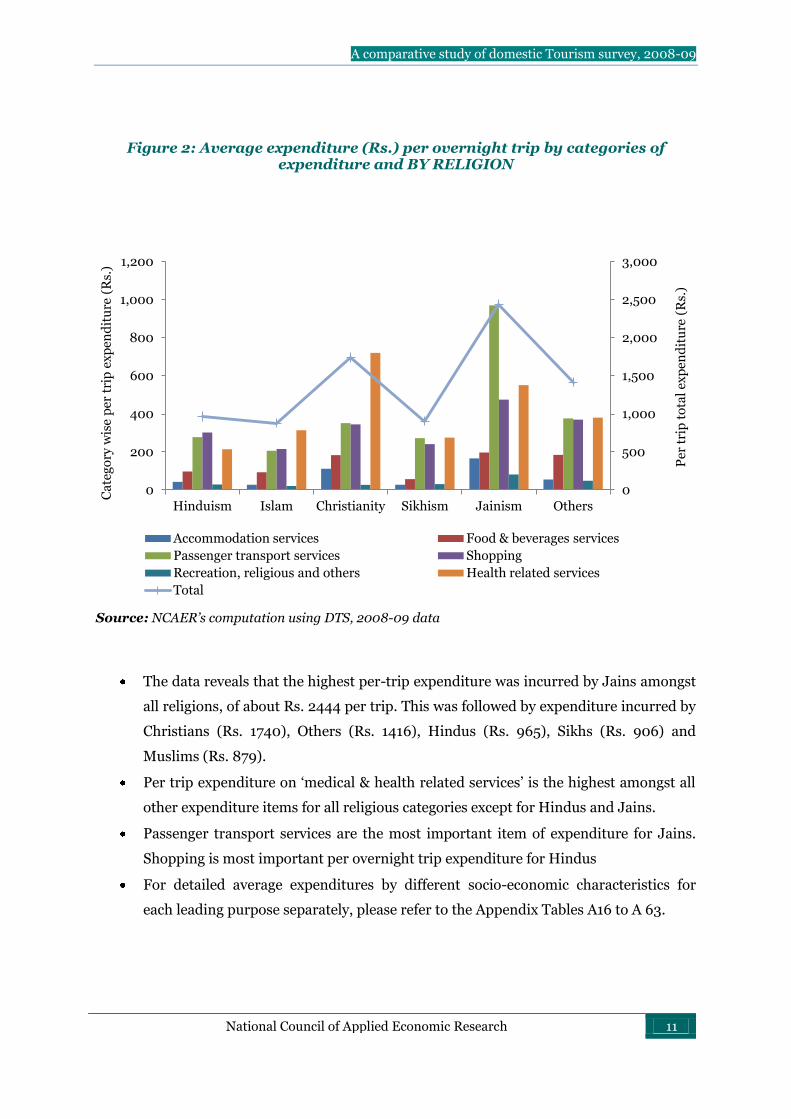
Figure 2: Average expenditure (Rs.) per overnight trip by categories of expenditure and BY RELIGION
Source: NCAER’s computation using DTS, 2008-09 data
The data reveals that the highest per-trip expenditure was incurred by Jains amongst
all religions, of about Rs. 2444 per trip. This was followed by expenditure incurred by
Christians (Rs. 1740), Others (Rs. 1416), Hindus (Rs. 965), Sikhs (Rs. 906) and
Muslims (Rs. 879).
Per trip expenditure on ‘medical & health related services’ is the highest amongst all
other expenditure items for all religious categories except for Hindus and Jains.
Passenger transport services are the most important item of expenditure for Jains.
Shopping is most important per overnight trip expenditure for Hindus
For detailed average expenditures by different socio-economic characteristics for
each leading purpose separately, please refer to the Appendix Tables A16 to A 63.
0
500
1,000
1,500
2,000
2,500
3,000
0
200
400
600
800
1,000
1,200
Hinduism Islam Christianity Sikhism Jainism Others
Per
tri
p t
ota
l ex
pen
dit
ure
(R
s.)
Ca
teg
ory
wis
e p
er t
rip
ex
pen
dit
ure
(R
s.)
Accommodation services Food & beverages services
Passenger transport services Shopping
Recreation, religious and others Health related services
Total

A comparative study of domestic Tourism survey, 2008-09
National Council of Applied Economic Research 12
Figure 3: Average expenditure (Rs.) per overnight trip by categories of expenditure and BY SOCIAL GROUPS
Source: NCAER’s computation using DTS, 2008-09 data
In India, Shopping is the most important item of expenditure for Scheduled tribe,
Scheduled caste and Other backward class
Passenger transport services are the most important item of expenditure for “Others”.
“Others” or the general category, amongst all social groups, incur the highest per
overnight trip expenditure in India, of about Rs. 1414.6, followed by Other backward
class (Rs. 881), Scheduled tribe (Rs. 625) and Scheduled caste (Rs. 615)
For detailed average expenditures by different socio-economic characteristics for
each leading purpose separately, please refer to the Appendix Tables A16 to A 63.
0
200
400
600
800
1,000
1,200
1,400
1,600
0
50
100
150
200
250
300
350
400
450
500
Scheduled tribe Scheduled caste Other backward class
Others
Per
tri
p t
ota
l ex
pen
dit
ure
(R
s.)
Ca
teg
ory
wis
e p
er t
rip
ex
pen
dit
ure
(R
s.)
Accommodation services Food & beverages services
Passenger transport services Shopping
Recreation, religious and others Health related services
Total
A comparative study of domestic Tourism survey, 2008-09
National Council of Applied Economic Research 13
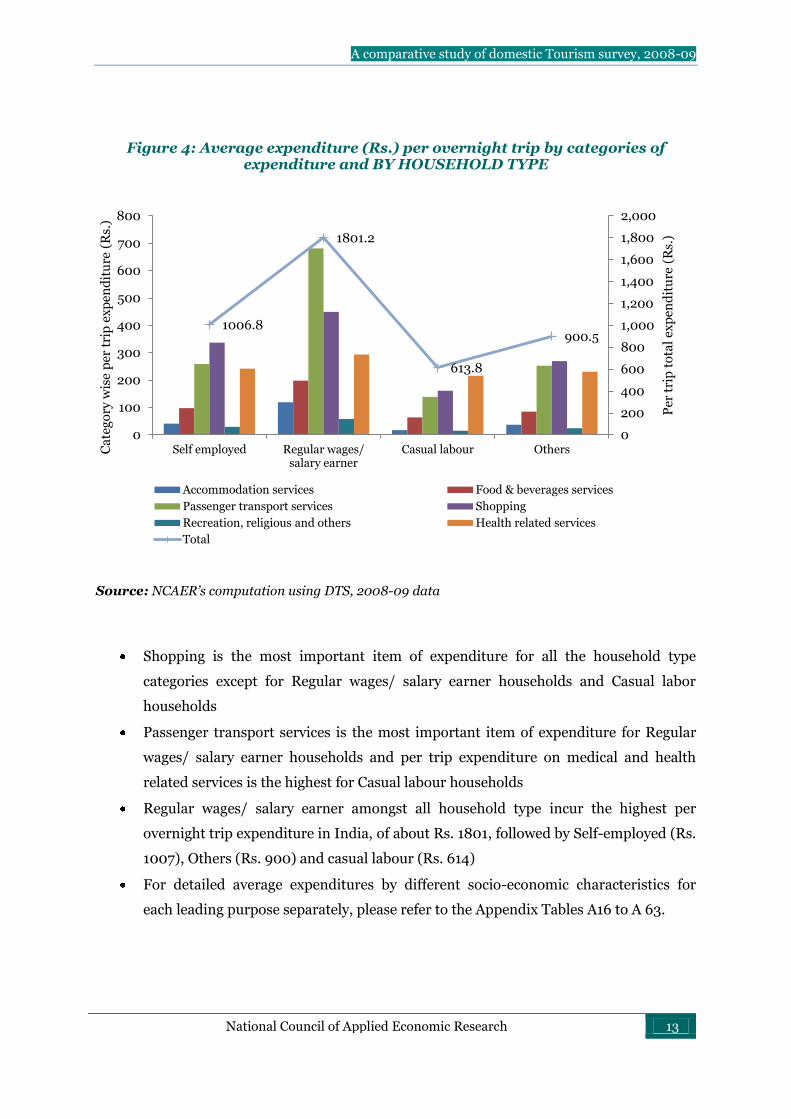
Figure 4: Average expenditure (Rs.) per overnight trip by categories of expenditure and BY HOUSEHOLD TYPE
Source: NCAER’s computation using DTS, 2008-09 data
Shopping is the most important item of expenditure for all the household type
categories except for Regular wages/ salary earner households and Casual labor
households
Passenger transport services is the most important item of expenditure for Regular
wages/ salary earner households and per trip expenditure on medical and health
related services is the highest for Casual labour households
Regular wages/ salary earner amongst all household type incur the highest per
overnight trip expenditure in India, of about Rs. 1801, followed by Self-employed (Rs.
1007), Others (Rs. 900) and casual labour (Rs. 614)
For detailed average expenditures by different socio-economic characteristics for
each leading purpose separately, please refer to the Appendix Tables A16 to A 63.
1006.8
1801.2
613.8
900.5
0
200
400
600
800
1,000
1,200
1,400
1,600
1,800
2,000
0
100
200
300
400
500
600
700
800
Self employed Regular wages/ salary earner
Casual labour Others
Per
tri
p t
ota
l ex
pen
dit
ure
(R
s.)
Ca
teg
ory
wis
e p
er t
rip
ex
pen
dit
ure
(R
s.)
Accommodation services Food & beverages services
Passenger transport services Shopping
Recreation, religious and others Health related services
Total

A comparative study of domestic Tourism survey, 2008-09
National Council of Applied Economic Research 14
Figure 5: Average expenditure (Rs.) per overnight trip by categories of expenditure and BY PRINCIPAL OCCUPATION (NCO) OF HOUSEHOLDS
Source: NCAER’s computation using DTS, 2008-09 data
Passenger transport services are the most important item of expenditure for
Legislators, senior officials and managers, Professionals and Clerks. Medical & health
related services is the most important item of expenditure for Service workers and
shop & market sales workers, Craft and related trades workers and Plant and
machine operators. Shopping is the most important item of expenditure for Associate
professionals, Elementary occupation and Skilled agricultural and fishery workers.
Legislators, senior officials and managers amongst all professionals record the
highest per overnight trip expenditure in India, of about Rs. 2294.9.
For detailed average expenditures by different socio-economic characteristics for
each leading purpose separately, please refer to the Appendix Tables A16 to A 63.
Legislators,
senior officials and
managers
Professionals
Associate
professionals
Clerks
Service &
market sales
workers
Skilled agri & fishery worker
s
Trades worker
s
Machine
operators
Elementary
occupations
Accommodation services 193.0 157.8 94.8 100.3 47.3 21.0 28.9 20.4 13.9
Food & beverages services 255.2 204.7 167.1 165.8 102.7 77.5 91.5 112.2 61.1
Passenger transport services 777.9 719.9 607.8 535.5 312.3 168.3 219.6 303.7 139.1
Shopping 603.8 534.5 780.6 406.0 327.1 288.2 224.0 245.0 168.1
Recreation, religious and others 62.7 58.3 51.1 38.4 29.8 27.2 28.6 24.4 15.3
Health related services 402.3 239.0 270.6 176.2 340.6 250.1 245.4 332.1 166.1
Total 2294.9 1914.2 1972.1 1422.3 1159.9 832.3 838.1 1037.8 563.6
0
500
1,000
1,500
2,000
2,500
0
100
200
300
400
500
600
700
800
900

A comparative study of domestic Tourism survey, 2008-09
National Council of Applied Economic Research 15
Figure 6: Average expenditure (Rs.) per overnight trip by categories of expenditure and BY PRINCIPAL INDUSTRY (NIC) OF HOUSEHOLDS
Source: NCAER’s computation using DTS, 2008-09 data
Shopping is the most important item of expenditure for households with primary
occupation as Agriculture and allied activities
Passenger transport services is the most important item of expenditure for
households which are primarily engaged in Industry and Services
Households engaged in Services amongst all sectors accounts for the highest per
overnight trip expenditure in India, of about Rs. 1449, followed by those engaged in
Industry (Rs. 972) and Agriculture (Rs. 738)
For detailed average expenditures by different socio-economic characteristics for
each leading purpose separately, please refer to the Appendix Tables A16 to A 63.
0
200
400
600
800
1,000
1,200
1,400
1,600
0
50
100
150
200
250
300
350
400
450
500
Agriculture Industry Services
Per
tri
p t
ota
l ex
pen
dit
ure
(R
s.)
Ca
teg
ory
wis
e p
er t
rip
ex
pen
dit
ure
(R
s.)
Accommodation services Food & beverages services
Passenger transport services Shopping
Recreation, religious and others Health related services
Total
A comparative study of domestic Tourism survey, 2008-09
National Council of Applied Economic Research 16

A comparative study of domestic Tourism survey, 2008-09
National Council of Applied Economic Research 17
APPENDIX

A comparative study of domestic Tourism survey, 2008-09
National Council of Applied Economic Research 18
A comparative study of domestic Tourism survey, 2008-09
National Council of Applied Economic Research 19
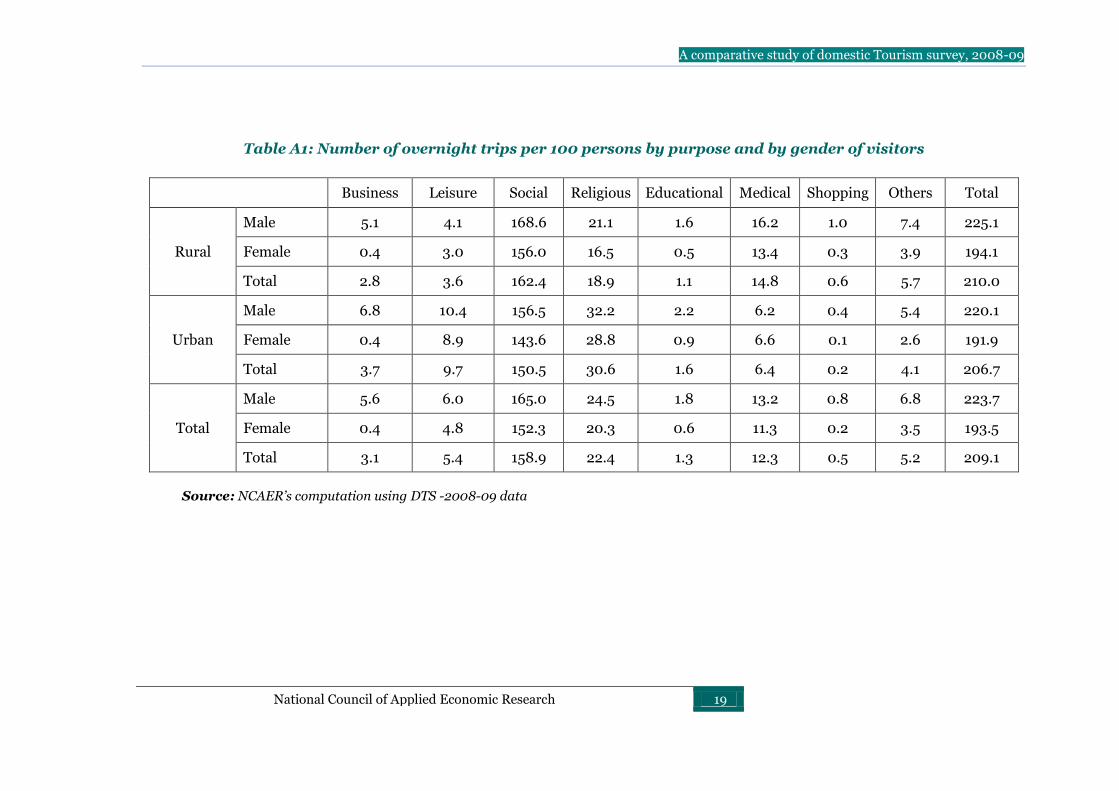
Table A1: Number of overnight trips per 100 persons by purpose and by gender of visitors
Business Leisure Social Religious Educational Medical Shopping Others Total
Rural
Male 5.1 4.1 168.6 21.1 1.6 16.2 1.0 7.4 225.1
Female 0.4 3.0 156.0 16.5 0.5 13.4 0.3 3.9 194.1
Total 2.8 3.6 162.4 18.9 1.1 14.8 0.6 5.7 210.0
Urban
Male 6.8 10.4 156.5 32.2 2.2 6.2 0.4 5.4 220.1
Female 0.4 8.9 143.6 28.8 0.9 6.6 0.1 2.6 191.9
Total 3.7 9.7 150.5 30.6 1.6 6.4 0.2 4.1 206.7
Total
Male 5.6 6.0 165.0 24.5 1.8 13.2 0.8 6.8 223.7
Female 0.4 4.8 152.3 20.3 0.6 11.3 0.2 3.5 193.5
Total 3.1 5.4 158.9 22.4 1.3 12.3 0.5 5.2 209.1
Source: NCAER’s computation using DTS -2008-09 data

A comparative study of domestic Tourism survey, 2008-09
National Council of Applied Economic Research 20
Table A2: Number of overnight trips per 100 persons by purpose and by age-groups of visitors
Business Leisure Social Religious Educational Medical Shopping Others Total
Rural
0-14 years 0.2 3.6 152.5 13.6 0.2 6.7 0.2 3.5 180.5
15-29 years 3.2 5.2 162.3 19.0 3.0 13.4 0.6 6.0 212.8
30-59 years 5.2 3.0 183.8 23.9 0.8 21.3 1.1 7.6 246.6
60+ years 1.1 1.3 120.1 18.2 0.1 22.6 0.6 5.6 169.6
Total 2.8 3.6 162.4 18.9 1.1 14.8 0.6 5.7 210.0
Urban
0-14 years 0.3 10.1 140.8 30.0 0.2 3.2 0.1 2.0 186.7
15-29 years 2.7 11.0 151.2 24.8 3.2 4.7 0.1 4.5 202.2
30-59 years 7.5 9.1 165.4 35.9 1.4 8.1 0.5 5.4 233.3
60+ years 1.6 6.0 111.6 29.3 0.9 15.3 0.1 3.4 168.3
Total 3.7 9.7 150.5 30.6 1.6 6.4 0.2 4.1 206.7
Total
0-14 years 0.2 5.4 149.1 18.0 0.2 5.7 0.2 3.1 181.9
15-29 years 3.0 7.2 159.0 21.0 3.1 10.5 0.4 5.5 209.7
30-59 years 5.9 4.9 178.3 27.6 1.0 17.3 0.9 6.9 242.8
60+ years 1.3 2.7 117.6 21.5 0.4 20.4 0.5 4.9 169.3
Total 3.1 5.4 158.9 22.4 1.3 12.3 0.5 5.2 209.1
Source: NCAER’s computation using DTS -2008-09 data

A comparative study of domestic Tourism survey, 2008-09
National Council of Applied Economic Research 21
Table A3 (a): Number of overnight trips per 100 persons by purpose and by usual principal activity status of visitors - RURAL
Status Business Leisure Social Religious Educational Medical Shopping Others Total
Self-employed – Own Account Worker 9.6 4.1 202.3 27.8 0.7 24.0 2.0 8.5 278.9
Self-employed - Employer 15.1 10.8 187.0 31.6 0.7 25.5 0.8 9.7 281.1
Worked as helper in household enterprise (unpaid)
4.1 3.1 174.2 24.3 1.3 16.1 1.4 4.0 228.4
Worked as regular salaried/ wage employee
10.7 8.2 195.6 31.3 5.5 19.9 1.6 14.6 287.3
Worked as casual wage labour: in public
11.1 0.2 182.3 9.2 3.4 29.3 0.7 2.2 238.4
Worked as casual wage labour: in other types of work
4.2 2.6 185.4 23.2 0.1 19.8 0.5 7.5 243.4
Did not work but was seeking and/or available for work
3.0 3.5 122.8 20.5 15.0 11.3 0.2 26.8 203.2
Attended educational institution 0.2 5.0 146.7 15.3 2.4 5.2 0.3 2.7 177.8
Attended domestic duties only 0.1 2.5 149.8 15.8 0.4 15.1 0.3 4.6 188.6
Domestic duties & also engaged in free collection of goods
0.1 2.8 155.0 14.2 0.1 17.4 0.1 4.0 193.7
Rentiers, pensioners , remittance recipients, etc.
0.2 2.8 145.2 20.2 0.1 30.1 0.7 7.6 206.9
Not able to work due to disability 0.6 0.2 71.2 8.0 0.0 32.8 0.0 8.6 121.4
Total 2.8 3.6 162.5 18.9 1.1 14.8 0.6 5.7 210.1
Source: NCAER’s computation using DTS -2008-09 data

A comparative study of domestic Tourism survey, 2008-09
National Council of Applied Economic Research 22
Table A3 (b): Number of overnight trips per 100 persons by purpose and by usual principal activity status of visitors – URBAN
Status Business Leisure Social Religious Educational Medical Shopping Others Total
Self-employed – Own Account Worker 17.4 6.9 174.6 34.9 0.8 9.6 0.7 7.4 252.2
Self-employed - Employer 24.2 27.7 142.7 47.6 0.4 4.3 0.3 9.6 256.8
Worked as helper in household enterprise (unpaid)
7.8 7.1 146.8 29.9 0.3 13.8 0.1 3.7 209.6
Worked as regular salaried/ wage employee
8.8 12.0 176.8 34.6 3.7 6.1 0.4 6.4 248.9
Worked as casual wage labour: in public 0.4 10.4 97.9 6.1 0.4 34.1 5.0 1.0 155.4
Worked as casual wage labour: in other types of work
3.0 2.6 160.8 34.0 0.1 7.0 0.1 6.1 213.7
Did not work but was seeking and/or available for work
0.6 12.0 102.5 34.2 4.8 3.6 0.1 16.9 174.7
Attended educational institution 0.2 13.9 140.4 30.2 2.5 3.0 0.1 2.5 192.8
Attended domestic duties only 0.2 7.5 144.0 30.2 0.4 7.0 0.1 2.5 191.9
Domestic duties & also engaged in free collection of goods
0.3 7.4 159.3 20.0 0.0 11.2 0.3 3.6 202.1
Rentiers, pensioners , remittance recipients, etc.
2.9 8.1 144.4 45.3 1.8 15.0 0.3 4.6 222.4
Not able to work due to disability 0.1 1.5 49.3 9.4 0.0 40.2 0.0 4.7 105.2
Total 3.7 9.7 150.5 30.6 1.6 6.4 0.2 4.1 206.7
Source: NCAER’s computation using DTS -2008-09 data
A comparative study of domestic Tourism survey, 2008-09
National Council of Applied Economic Research 23
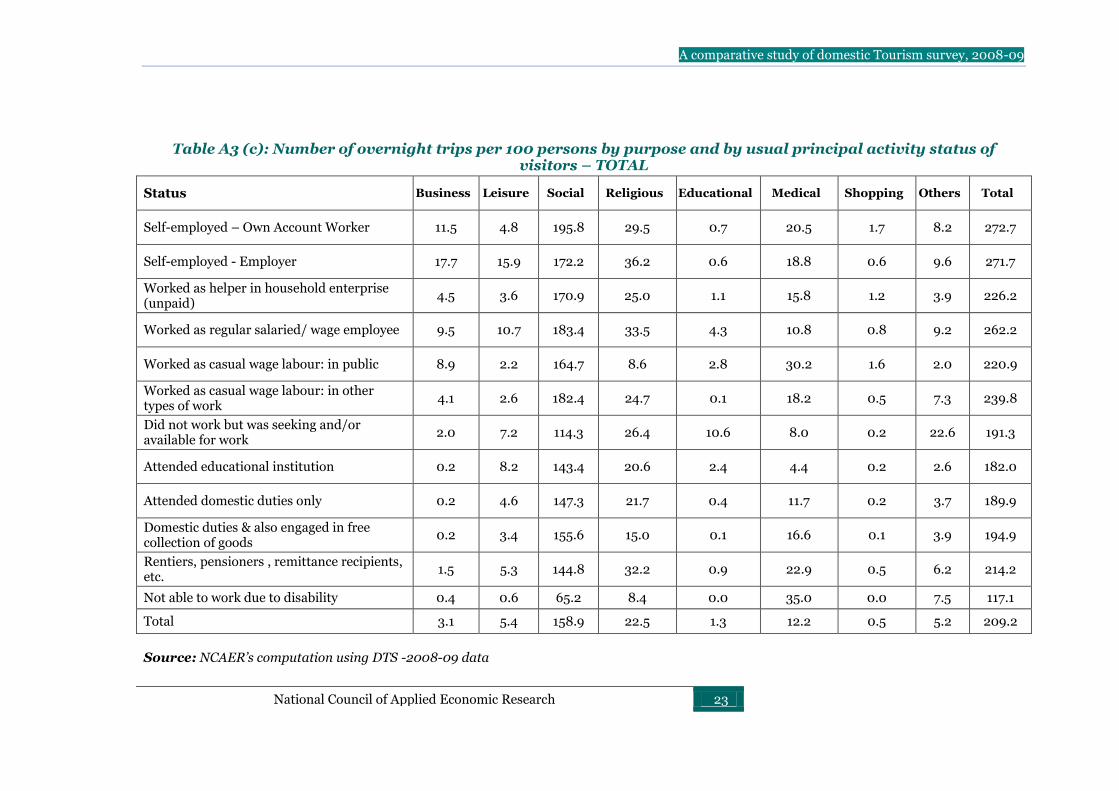
Table A3 (c): Number of overnight trips per 100 persons by purpose and by usual principal activity status of visitors – TOTAL
Status Business Leisure Social Religious Educational Medical Shopping Others Total
Self-employed – Own Account Worker 11.5 4.8 195.8 29.5 0.7 20.5 1.7 8.2 272.7
Self-employed - Employer 17.7 15.9 172.2 36.2 0.6 18.8 0.6 9.6 271.7
Worked as helper in household enterprise (unpaid)
4.5 3.6 170.9 25.0 1.1 15.8 1.2 3.9 226.2
Worked as regular salaried/ wage employee 9.5 10.7 183.4 33.5 4.3 10.8 0.8 9.2 262.2
Worked as casual wage labour: in public 8.9 2.2 164.7 8.6 2.8 30.2 1.6 2.0 220.9
Worked as casual wage labour: in other types of work
4.1 2.6 182.4 24.7 0.1 18.2 0.5 7.3 239.8
Did not work but was seeking and/or available for work
2.0 7.2 114.3 26.4 10.6 8.0 0.2 22.6 191.3
Attended educational institution 0.2 8.2 143.4 20.6 2.4 4.4 0.2 2.6 182.0
Attended domestic duties only 0.2 4.6 147.3 21.7 0.4 11.7 0.2 3.7 189.9
Domestic duties & also engaged in free collection of goods
0.2 3.4 155.6 15.0 0.1 16.6 0.1 3.9 194.9
Rentiers, pensioners , remittance recipients, etc.
1.5 5.3 144.8 32.2 0.9 22.9 0.5 6.2 214.2
Not able to work due to disability 0.4 0.6 65.2 8.4 0.0 35.0 0.0 7.5 117.1
Total 3.1 5.4 158.9 22.5 1.3 12.2 0.5 5.2 209.2
Source: NCAER’s computation using DTS -2008-09 data

A comparative study of domestic Tourism survey, 2008-09
National Council of Applied Economic Research 24
Table A4: Number of overnight trips per 100 persons by purpose and by religion of visitors
Business Leisure Social Religious Educational Medical Shopping Others Total
Rural
Hinduism 2.8 3.5 164.2 20.7 1.1 14.4 0.6 5.6 212.9
Islam 2.2 4.3 152.5 5.9 0.5 16.5 0.6 5.5 188.0
Christianity 6.4 6.5 139.4 8.0 2.6 12.3 1.1 12.3 188.5
Sikhism 1.3 0.4 195.4 23.1 2.1 9.7 0.0 4.7 236.7
Jainism 7.6 0.0 160.0 2.8 0.0 1.7 0.0 0.3 172.4
Others 4.5 5.4 114.5 30.2 1.3 55.3 3.5 8.6 223.3
Total 2.8 3.6 162.4 18.9 1.1 14.8 0.6 5.7 210.0
Urban
Hinduism 2.8 3.5 164.8 20.8 1.1 14.5 0.6 5.6 213.7
Islam 2.0 3.9 138.6 5.4 0.4 15.0 0.5 5.0 170.9
Christianity 6.9 7.0 149.8 8.6 2.8 13.2 1.2 13.2 202.7
Sikhism 1.2 0.4 191.6 22.7 2.0 9.5 0.0 4.6 232.0
Jainism 10.3 0.0 217.6 3.8 0.0 2.3 0.0 0.3 234.4
Others 3.3 3.9 83.9 22.1 0.9 40.6 2.6 6.3 163.7
Total 2.8 3.5 159.8 18.6 1.1 14.6 0.6 5.6 206.7
Total
Hinduism 2.8 3.5 164.3 20.7 1.1 14.4 0.6 5.6 213.1
Islam 2.2 4.2 147.9 5.7 0.4 16.0 0.6 5.3 182.4
Christianity 6.6 6.7 143.2 8.2 2.6 12.6 1.1 12.6 193.7
Sikhism 1.3 0.4 194.4 23.0 2.1 9.7 0.0 4.7 235.4
Jainism 9.7 0.0 203.3 3.6 0.0 2.2 0.0 0.3 219.1
Others 4.1 4.9 104.8 27.6 1.2 50.7 3.2 7.9 204.5
Total 2.8 3.6 161.7 18.8 1.1 14.8 0.6 5.7 209.1
Source: NCAER’s computation using DTS -2008-09 data

A comparative study of domestic Tourism survey, 2008-09
National Council of Applied Economic Research 25
Table A5: Number of overnight trips per 100 persons by purpose and by social groups of visitors
Business Leisure Social Religious Educational Medical Shopping Others Total
Rural
Scheduled tribe 4.2 3.8 147.6 18.1 1.9 14.3 1.4 4.5 195.8
Scheduled caste 2.5 3.6 166.8 15.9 1.2 15.0 0.3 7.1 212.4
Other backward class 2.4 3.3 163.2 20.6 0.9 14.4 0.4 5.1 210.3
Others 3.4 4.1 163.5 18.8 1.2 15.7 1.0 6.2 213.9
Total 2.8 3.6 162.4 18.9 1.1 14.8 0.6 5.7 210.0
Urban
Scheduled tribe 4.2 18.7 121.6 40.3 2.6 3.5 0.4 8.6 199.8
Scheduled caste 2.8 7.6 143.2 31.0 1.7 6.3 0.1 3.4 196.2
Other backward class 3.1 6.6 160.6 31.1 1.1 7.9 0.2 4.5 215.1
Others 4.5 12.0 146.5 29.3 1.8 5.4 0.3 3.6 203.4
Total 3.7 9.7 150.5 30.6 1.6 6.4 0.2 4.1 206.8
Total
Scheduled tribe 4.2 5.8 143.9 21.1 2.0 12.8 1.3 5.0 196.1
Scheduled caste 2.6 4.5 161.9 19.4 1.3 13.1 0.3 6.3 209.2
Other backward class 2.6 4.1 162.5 23.3 0.9 12.7 0.4 4.9 211.5
Others 3.9 7.6 156.3 23.5 1.5 11.2 0.7 5.0 209.7
Total 3.1 5.4 158.9 22.4 1.3 12.3 0.5 5.2 209.1
Source: NCAER’s computation using DTS -2008-09 data

A comparative study of domestic Tourism survey, 2008-09
National Council of Applied Economic Research 26
Table A6: Number of overnight trips per 100 persons by purpose and by household types of visitors
Business Leisure Social Religious Educational Medical Shopping Others Total
Rural
Self-employed in non-agriculture 5.0 5.0 155.0 19.5 1.1 15.5 0.6 4.6 206.3
Agricultural labour 2.0 2.9 161.5 16.2 0.3 15.5 0.5 5.4 204.3
Other labour 2.5 2.2 169.0 21.8 0.6 14.3 0.2 5.9 216.4
Self-employed in agriculture 2.5 2.6 162.1 19.0 1.1 14.3 0.9 4.9 207.4
Others 2.7 7.4 173.8 20.1 3.2 15.4 0.8 10.7 234.2
Total 2.8 3.6 162.4 18.9 1.1 14.8 0.6 5.7 210.0
Urban
Self-employed 5.2 7.8 148.4 29.7 0.8 6.5 0.3 3.8 202.5
Regular wage/salary earning 3.8 10.5 151.0 30.6 2.3 5.6 0.3 4.0 208.0
Casual labour 1.3 1.9 139.0 37.4 0.2 6.8 0.1 4.5 191.2
Others 0.6 25.1 183.8 27.3 3.4 9.4 0.0 5.4 255.0
Total 3.7 9.7 150.5 30.6 1.6 6.4 0.2 4.1 206.7
Total
Self employed 3.7 4.4 157.3 21.6 1.1 12.7 0.7 4.6 206.1
Regular wage/salary earning 3.8 10.5 151.0 30.6 2.3 5.6 0.3 4.0 208.0
Casual labour 2.1 2.6 160.6 20.7 0.4 14.0 0.3 5.4 206.0
Others 2.2 11.8 175.7 21.8 3.3 13.8 0.6 9.4 238.5
Total 3.1 5.4 158.9 22.4 1.3 12.3 0.5 5.2 209.1
Source: NCAER’s computation using DTS -2008-09 data

A comparative study of domestic Tourism survey, 2008-09
National Council of Applied Economic Research 27
Table A7: Number of overnight trips per 100 persons by purpose and by principal occupation (NCO) of visitors
Business Leisure Social Religious Educational Medical Shopping Others Total
Ru
ral
Legislators, senior officials and manage 17.1 6.7 184.7 33.9 1.8 21.3 2.0 6.3 273.8
Professionals 26.2 11.0 178.5 27.7 4.2 44.0 2.2 15.9 309.7
Associate professionals 11.9 13.0 216.4 29.2 13.0 16.8 2.4 13.1 315.8
Clerks 18.6 8.1 194.8 33.0 5.6 14.8 0.9 11.4 287.2
Service workers and shop & market sales 14.9 4.2 166.0 23.0 1.2 27.9 2.4 10.3 249.9
Skilled agricultural and fishery workers 5.1 3.0 194.4 26.3 0.9 19.1 1.7 6.8 257.3
Craft and related trades workers 7.9 5.1 183.7 22.7 0.2 23.6 0.6 7.7 251.5
Plant and machine operators and assemble 11.5 8.2 184.3 36.2 0.2 19.5 0.9 11.9 272.6
Elementary occupations 4.0 2.7 186.7 23.8 0.2 19.1 0.5 7.2 244.2
Total 6.7 3.8 188.4 25.6 1.0 20.4 1.3 7.7 254.9
Urb
an
Legislators, senior officials and manage 17.7 16.2 159.9 45.4 2.3 6.2 0.8 7.6 256.1
Professionals 16.3 18.6 179.7 34.5 7.9 6.0 0.6 4.9 268.6
Associate professionals 25.9 14.1 161.2 39.4 4.2 6.6 0.6 11.8 263.9
Clerks 7.8 10.4 185.9 32.8 4.2 6.4 0.4 6.6 254.5
Service workers and shop & market sales 11.6 8.6 166.9 29.6 0.5 11.8 0.6 5.5 235.2
Skilled agricultural and fishery workers 9.2 3.6 196.8 27.6 0.5 10.2 0.3 11.0 259.3
Craft and related trades workers 6.9 4.4 162.5 35.3 0.4 10.7 0.4 5.9 226.5
Plant and machine operators and assemble 4.4 5.6 198.7 32.5 0.7 5.8 0.0 7.3 255.0
Elementary occupations 4.0 2.9 164.5 30.6 0.2 5.8 0.3 4.7 212.9
Total 10.7 8.8 169.9 34.1 1.9 7.9 0.5 6.4 240.3
Source: NCAER’s computation using DTS -2008-09 data

A comparative study of domestic Tourism survey, 2008-09
National Council of Applied Economic Research 28
Table A7: Number of overnight trips per 100 persons by purpose and by principal occupation (NCO) of visitors
Continued
Business Leisure Social Religious Educational Medical Shopping Others Total
To
tal
Legislators, senior officials and manage 17.4 12.3 169.3 40.6 2.1 12.2 1.3 7.0 262.3
Professionals 20.3 15.5 179.1 31.7 6.4 21.4 1.3 9.3 285.0
Associate professionals 20.1 13.7 185.8 35.4 8.0 11.0 1.4 12.5 287.8
Clerks 11.1 9.7 188.4 32.8 4.7 9.0 0.5 8.1 264.4
Service workers and shop & market sales 13.2 6.5 166.6 26.5 0.9 19.3 1.4 7.8 242.2
Skilled agricultural and fishery workers 5.2 3.0 194.5 26.4 0.9 18.8 1.7 7.0 257.4
Craft and related trades workers 7.4 4.8 173.7 28.6 0.3 17.5 0.5 6.8 239.7
Plant and machine operators and assemble 7.6 6.8 192.7 34.2 0.5 12.1 0.4 9.4 263.8
Elementary occupations 4.0 2.7 183.4 25.0 0.2 16.9 0.5 6.8 239.5
Total 7.8 5.1 183.8 27.9 1.2 17.1 1.1 7.4 251.4
Source: NCAER’s computation using DTS -2008-09 data

A comparative study of domestic Tourism survey, 2008-09
National Council of Applied Economic Research 29
Table A8: Number of overnight trips per 100 persons by purpose and by principal industry (NIC) of visitors
Business Leisure Social Religious Educational Medical Shopping Others Total
Rural
Agriculture 4.5 3.1 189.9 24.8 0.7 19.5 1.3 6.7 250.3
Industry 8.8 3.6 192.3 26.0 0.3 21.0 1.2 9.1 262.4
Services 14.4 7.0 181.0 28.8 3.0 24.3 1.3 10.7 270.5
Total 6.7 3.8 188.4 25.6 1.0 20.4 1.3 7.7 254.8
Urban
Agriculture 6.1 2.8 180.4 31.6 0.5 9.0 0.5 9.3 240.1
Industry 7.6 5.8 170.4 33.0 0.6 7.5 0.5 5.3 230.7
Services 12.9 11.2 168.6 35.1 2.8 8.0 0.5 6.8 245.9
Total 10.7 8.8 169.8 34.2 1.9 7.9 0.5 6.4 240.3
Total
Agriculture 4.5 3.1 189.6 25.0 0.6 19.1 1.3 6.8 250.0
Industry 8.3 4.7 182.8 29.3 0.5 14.9 0.9 7.3 248.5
Services 13.6 9.4 173.9 32.4 2.9 15.0 0.8 8.5 256.5
Total 7.8 5.1 183.7 27.9 1.2 17.1 1.1 7.4 251.3
Source: NCAER’s computation using DTS -2008-09 data

A comparative study of domestic Tourism survey, 2008-09
National Council of Applied Economic Research 30
Table A9: Number of overnight trips per 100 persons by purpose and by MPCE quintile
Business Leisure Social Religious Educational Medical Shopping Others Total
Rural
Quintile 1 (Bottom) 2.2 3.6 151.1 11.0 0.5 8.7 0.7 4.9 182.7
Quintile 2 1.9 2.2 161.5 15.2 0.7 12.5 0.6 2.9 197.5
Quintile 3 2.5 3.0 166.1 18.4 1.2 13.6 0.6 4.4 209.8
Quintile 4 3.4 3.7 170.0 22.7 1.4 13.8 0.6 5.3 221.0
Quintile 5 (Top) 4.3 5.6 181.7 28.4 1.8 25.7 0.8 11.1 259.3
Total 2.8 3.6 162.5 18.9 1.1 14.9 0.6 5.7 210.2
Urban
Quintile 1 (Bottom) 2.1 3.1 141.2 23.0 0.4 7.2 0.2 3.4 180.5
Quintile 2 3.7 4.7 151.6 27.2 0.8 5.5 0.3 3.6 197.4
Quintile 3 3.5 6.3 154.0 28.9 1.0 8.7 0.5 4.6 207.5
Quintile 4 4.6 10.8 162.1 30.6 2.1 5.8 0.1 4.2 220.4
Quintile 5 (Top) 5.9 23.8 163.1 41.2 3.9 7.5 0.3 5.9 251.6
Total 3.9 9.6 150.5 29.4 1.6 6.6 0.2 4.2 206.2
Total
Quintile 1 (Bottom) 2.0 2.8 151.2 12.3 0.5 9.6 0.6 4.2 183.3
Quintile 2 2.0 3.0 162.6 18.0 0.9 11.7 0.5 3.8 202.6
Quintile 3 2.8 3.4 164.0 20.9 0.9 12.1 0.6 4.1 208.9
Quintile 4 4.2 4.4 166.8 25.1 1.5 12.5 0.4 6.0 220.8
Quintile 5 (Top) 4.7 13.0 169.8 35.0 2.5 17.3 0.5 8.5 251.4
Total 3.1 5.4 159.1 22.1 1.3 12.4 0.5 5.3 209.1
Source: NCAER’s computation using DTS -2008-09 data
A comparative study of domestic Tourism survey, 2008-09
National Council of Applied Economic Research 31
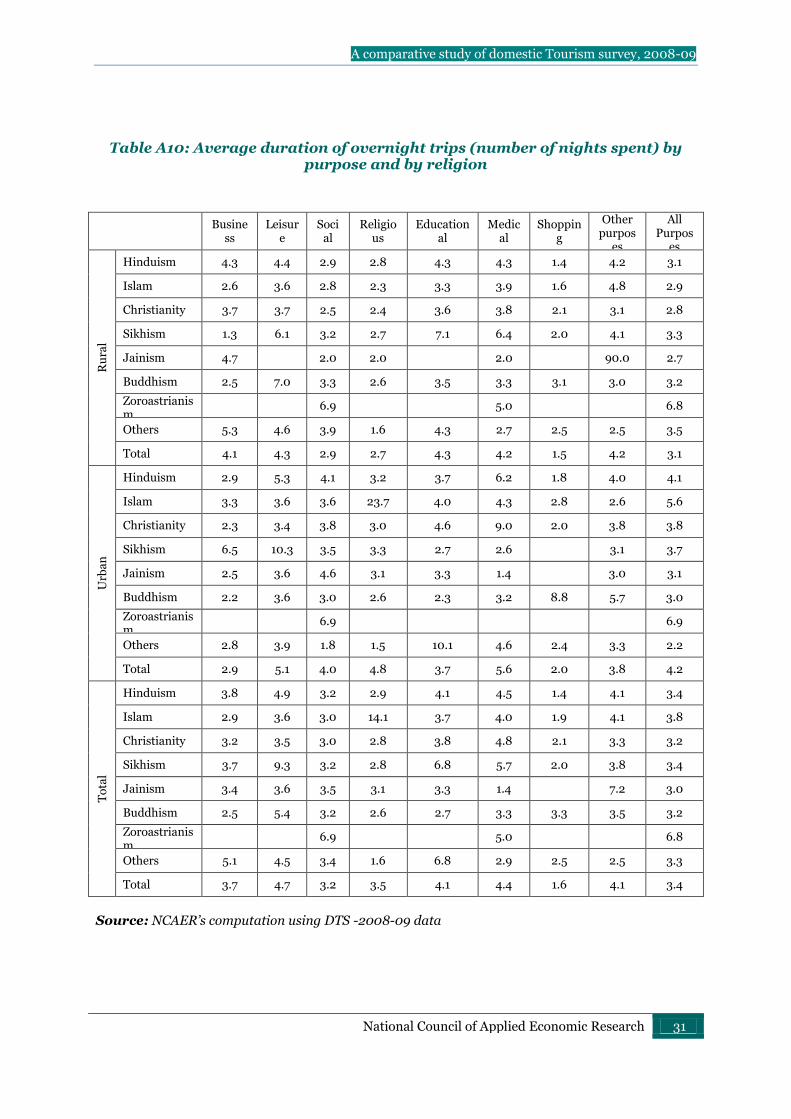
Table A10: Average duration of overnight trips (number of nights spent) by purpose and by religion
Business
Leisure
Social
Religious
Educational
Medical
Shopping
Other purpos
es
All Purpos
es
Ru
ral
Hinduism 4.3 4.4 2.9 2.8 4.3 4.3 1.4 4.2 3.1
Islam 2.6 3.6 2.8 2.3 3.3 3.9 1.6 4.8 2.9
Christianity 3.7 3.7 2.5 2.4 3.6 3.8 2.1 3.1 2.8
Sikhism 1.3 6.1 3.2 2.7 7.1 6.4 2.0 4.1 3.3
Jainism 4.7
2.0 2.0
2.0
90.0 2.7
Buddhism 2.5 7.0 3.3 2.6 3.5 3.3 3.1 3.0 3.2
Zoroastrianism
6.9
5.0
6.8
Others 5.3 4.6 3.9 1.6 4.3 2.7 2.5 2.5 3.5
Total 4.1 4.3 2.9 2.7 4.3 4.2 1.5 4.2 3.1
Urb
an
Hinduism 2.9 5.3 4.1 3.2 3.7 6.2 1.8 4.0 4.1
Islam 3.3 3.6 3.6 23.7 4.0 4.3 2.8 2.6 5.6
Christianity 2.3 3.4 3.8 3.0 4.6 9.0 2.0 3.8 3.8
Sikhism 6.5 10.3 3.5 3.3 2.7 2.6
3.1 3.7
Jainism 2.5 3.6 4.6 3.1 3.3 1.4
3.0 3.1
Buddhism 2.2 3.6 3.0 2.6 2.3 3.2 8.8 5.7 3.0
Zoroastrianism
6.9
6.9
Others 2.8 3.9 1.8 1.5 10.1 4.6 2.4 3.3 2.2
Total 2.9 5.1 4.0 4.8 3.7 5.6 2.0 3.8 4.2
To
tal
Hinduism 3.8 4.9 3.2 2.9 4.1 4.5 1.4 4.1 3.4
Islam 2.9 3.6 3.0 14.1 3.7 4.0 1.9 4.1 3.8
Christianity 3.2 3.5 3.0 2.8 3.8 4.8 2.1 3.3 3.2
Sikhism 3.7 9.3 3.2 2.8 6.8 5.7 2.0 3.8 3.4
Jainism 3.4 3.6 3.5 3.1 3.3 1.4
7.2 3.0
Buddhism 2.5 5.4 3.2 2.6 2.7 3.3 3.3 3.5 3.2
Zoroastrianism
6.9
5.0
6.8
Others 5.1 4.5 3.4 1.6 6.8 2.9 2.5 2.5 3.3
Total 3.7 4.7 3.2 3.5 4.1 4.4 1.6 4.1 3.4
Source: NCAER’s computation using DTS -2008-09 data

A comparative study of domestic Tourism survey, 2008-09
National Council of Applied Economic Research 32
Table A11: Average duration of overnight trips (number of nights spent) by purpose and by social groups
Business
Leisure
Social
Religious
Educational
Medical
Shopping
Other purposes
All Purposes
Ru
ral
Scheduled tribe 8.3 3.8 3.3 3.8 4.5 3.6 1.9 3.4 3.6
Scheduled caste 3.7 4.5 2.9 2.4 3.3 3.9 1.5 3.7 3.0
Other backward class
4.1 4.5 2.8 2.5 5.4 4.7 1.2 4.7 3.0
Others 2.7 4.1 2.9 3.0 3.6 3.9 1.6 4.0 3.1
Total 4.1 4.3 2.9 2.7 4.3 4.2 1.5 4.2 3.1
Urb
an
Scheduled tribe 2.5 8.6 4.3 5.6 5.8 3.0 1.6 2.4 5.1
Scheduled caste 3.5 4.6 3.8 2.2 2.7 7.3 1.9 3.1 3.7
Other backward class
2.5 4.4 3.7 3.0 3.1 6.1 1.8 3.3 3.6
Others 3.1 5.0 4.4 6.8 4.1 4.7 2.1 4.6 4.7
Total 2.9 5.1 4.0 4.8 3.7 5.6 2.0 3.8 4.2
To
tal
Scheduled tribe 7.5 6.3 3.4 4.4 4.7 3.6 1.8 3.2 3.8
Scheduled caste 3.7 4.5 3.0 2.4 3.1 4.2 1.5 3.7 3.1
Other backward class
3.6 4.4 3.0 2.7 4.7 4.9 1.3 4.4 3.2
Others 2.9 4.7 3.5 4.9 3.9 4.1 1.7 4.2 3.7
Total 3.7 4.7 3.2 3.5 4.1 4.4 1.6 4.1 3.4
Source: NCAER’s computation using DTS, 2008-09 data

A comparative study of domestic Tourism survey, 2008-09
National Council of Applied Economic Research 33
Table A12: Average duration of overnight trips (number of nights spent) by purpose and by types of household
Business
Leisure
Social
Religious
Educational
Medical
Shopping
Other purposes
All Purposes
Ru
ral
Self-employed in non-agriculture
3.0 3.1 2.6 2.7 4.1 3.3 1.5 6.2 2.9
Agricultural labour 8.2 4.1 2.7 2.2 2.4 4.7 1.6 3.4 3.0
Other labour 6.1 5.2 2.6 2.0 2.8 4.6 1.2 4.2 2.9
Self-employed in agriculture
3.2 3.7 2.7 2.9 5.2 4.0 1.6 3.7 2.9
Others 2.6 6.0 4.0 3.6 4.0 4.7 1.3 4.4 4.1
Total 4.1 4.3 2.9 2.7 4.3 4.2 1.5 4.2 3.1
Urb
an
Self-employed 2.6 4.4 3.6 3.1 4.1 4.1 1.8 3.6 3.6
Regular wage/salary earning
3.2 4.5 4.0 3.5 3.6 7.6 2.0 4.3 4.0
Casual labour 4.1 3.8 3.5 2.0 3.0 5.6 3.2 3.9 3.4
Others 2.7 6.3 5.3 15.0 3.8 4.5 2.0 2.3 6.3
Total 2.9 5.1 4.0 4.8 3.7 5.6 2.0 3.8 4.2
To
tal
Self employed 2.9 3.8 2.9 2.9 4.7 3.8 1.6 4.3 3.0
Regular wage/salary earning
3.2 4.5 4.0 3.5 3.6 7.6 2.0 4.3 4.0
Casual labour 7.0 4.3 2.8 2.1 2.6 4.7 1.6 3.7 3.0
Others 2.6 6.2 4.4 8.0 3.9 4.6 1.3 4.0 4.8
Total 3.7 4.7 3.2 3.5 4.1 4.4 1.6 4.1 3.4
Source: NCAER’s computation using DTS, 2008-09 data
A comparative study of domestic Tourism survey, 2008-09
National Council of Applied Economic Research 34
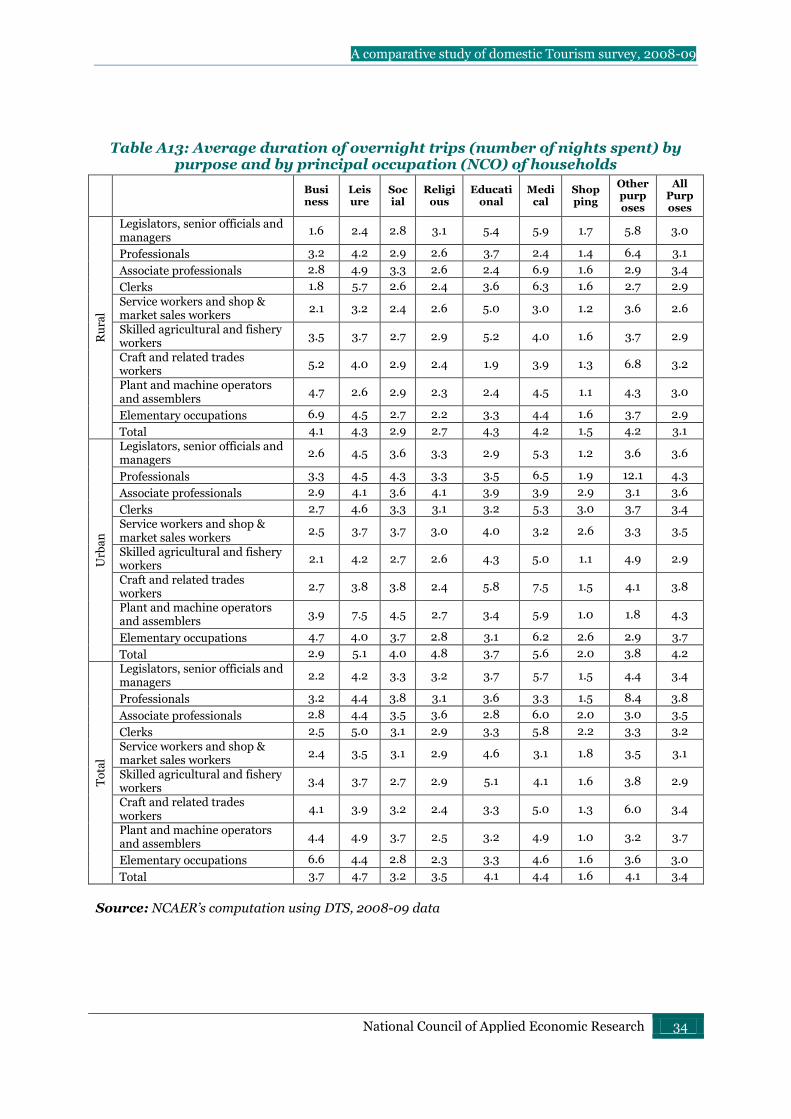
Table A13: Average duration of overnight trips (number of nights spent) by purpose and by principal occupation (NCO) of households
Business
Leisure
Social
Religious
Educational
Medical
Shopping
Other purposes
All Purposes
Ru
ral
Legislators, senior officials and managers
1.6 2.4 2.8 3.1 5.4 5.9 1.7 5.8 3.0
Professionals 3.2 4.2 2.9 2.6 3.7 2.4 1.4 6.4 3.1
Associate professionals 2.8 4.9 3.3 2.6 2.4 6.9 1.6 2.9 3.4
Clerks 1.8 5.7 2.6 2.4 3.6 6.3 1.6 2.7 2.9
Service workers and shop & market sales workers
2.1 3.2 2.4 2.6 5.0 3.0 1.2 3.6 2.6
Skilled agricultural and fishery workers
3.5 3.7 2.7 2.9 5.2 4.0 1.6 3.7 2.9
Craft and related trades workers
5.2 4.0 2.9 2.4 1.9 3.9 1.3 6.8 3.2
Plant and machine operators and assemblers
4.7 2.6 2.9 2.3 2.4 4.5 1.1 4.3 3.0
Elementary occupations 6.9 4.5 2.7 2.2 3.3 4.4 1.6 3.7 2.9
Total 4.1 4.3 2.9 2.7 4.3 4.2 1.5 4.2 3.1
Urb
an
Legislators, senior officials and managers
2.6 4.5 3.6 3.3 2.9 5.3 1.2 3.6 3.6
Professionals 3.3 4.5 4.3 3.3 3.5 6.5 1.9 12.1 4.3
Associate professionals 2.9 4.1 3.6 4.1 3.9 3.9 2.9 3.1 3.6
Clerks 2.7 4.6 3.3 3.1 3.2 5.3 3.0 3.7 3.4
Service workers and shop & market sales workers
2.5 3.7 3.7 3.0 4.0 3.2 2.6 3.3 3.5
Skilled agricultural and fishery workers
2.1 4.2 2.7 2.6 4.3 5.0 1.1 4.9 2.9
Craft and related trades workers
2.7 3.8 3.8 2.4 5.8 7.5 1.5 4.1 3.8
Plant and machine operators and assemblers
3.9 7.5 4.5 2.7 3.4 5.9 1.0 1.8 4.3
Elementary occupations 4.7 4.0 3.7 2.8 3.1 6.2 2.6 2.9 3.7
Total 2.9 5.1 4.0 4.8 3.7 5.6 2.0 3.8 4.2
To
tal
Legislators, senior officials and managers
2.2 4.2 3.3 3.2 3.7 5.7 1.5 4.4 3.4
Professionals 3.2 4.4 3.8 3.1 3.6 3.3 1.5 8.4 3.8
Associate professionals 2.8 4.4 3.5 3.6 2.8 6.0 2.0 3.0 3.5
Clerks 2.5 5.0 3.1 2.9 3.3 5.8 2.2 3.3 3.2
Service workers and shop & market sales workers
2.4 3.5 3.1 2.9 4.6 3.1 1.8 3.5 3.1
Skilled agricultural and fishery workers
3.4 3.7 2.7 2.9 5.1 4.1 1.6 3.8 2.9
Craft and related trades workers
4.1 3.9 3.2 2.4 3.3 5.0 1.3 6.0 3.4
Plant and machine operators and assemblers
4.4 4.9 3.7 2.5 3.2 4.9 1.0 3.2 3.7
Elementary occupations 6.6 4.4 2.8 2.3 3.3 4.6 1.6 3.6 3.0
Total 3.7 4.7 3.2 3.5 4.1 4.4 1.6 4.1 3.4
Source: NCAER’s computation using DTS, 2008-09 data
A comparative study of domestic Tourism survey, 2008-09
National Council of Applied Economic Research 35
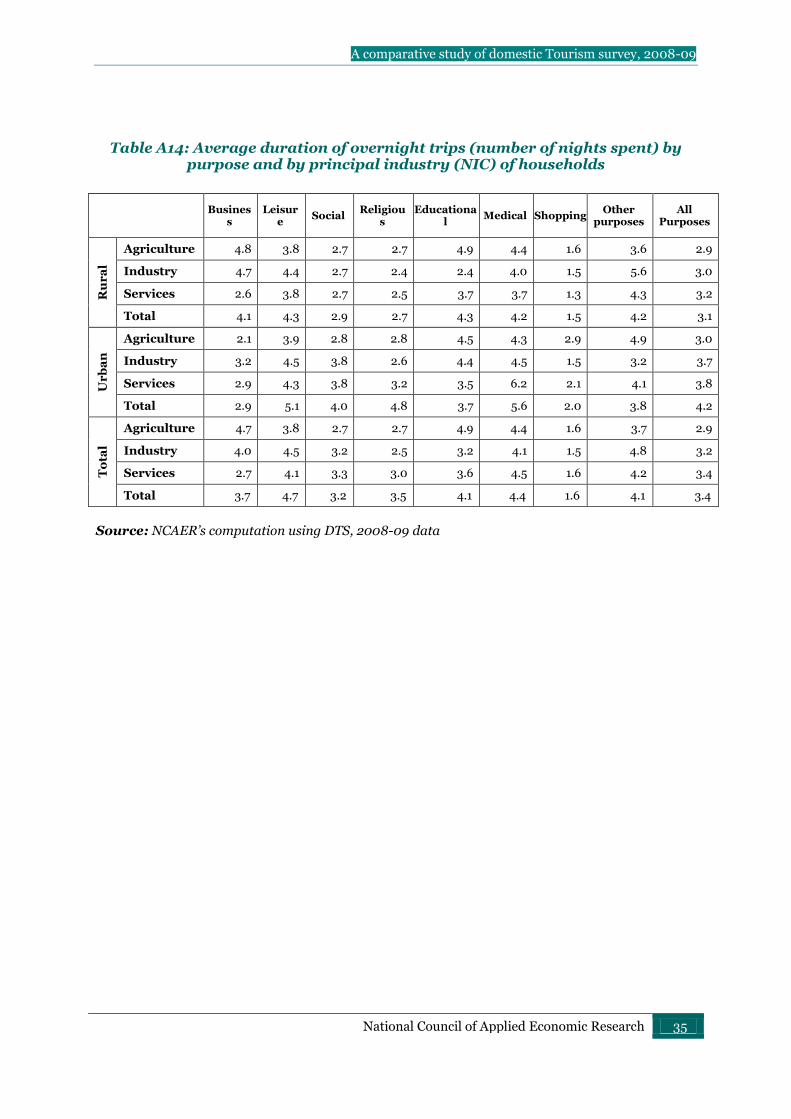
Table A14: Average duration of overnight trips (number of nights spent) by purpose and by principal industry (NIC) of households
Business
Leisure
Social Religiou
s Educationa
l Medical Shopping
Other purposes
All Purposes
Ru
ra
l
Agriculture 4.8 3.8 2.7 2.7 4.9 4.4 1.6 3.6 2.9
Industry 4.7 4.4 2.7 2.4 2.4 4.0 1.5 5.6 3.0
Services 2.6 3.8 2.7 2.5 3.7 3.7 1.3 4.3 3.2
Total 4.1 4.3 2.9 2.7 4.3 4.2 1.5 4.2 3.1
Ur
ba
n
Agriculture 2.1 3.9 2.8 2.8 4.5 4.3 2.9 4.9 3.0
Industry 3.2 4.5 3.8 2.6 4.4 4.5 1.5 3.2 3.7
Services 2.9 4.3 3.8 3.2 3.5 6.2 2.1 4.1 3.8
Total 2.9 5.1 4.0 4.8 3.7 5.6 2.0 3.8 4.2
To
tal
Agriculture 4.7 3.8 2.7 2.7 4.9 4.4 1.6 3.7 2.9
Industry 4.0 4.5 3.2 2.5 3.2 4.1 1.5 4.8 3.2
Services 2.7 4.1 3.3 3.0 3.6 4.5 1.6 4.2 3.4
Total 3.7 4.7 3.2 3.5 4.1 4.4 1.6 4.1 3.4
Source: NCAER’s computation using DTS, 2008-09 data

A comparative study of domestic Tourism survey, 2008-09
National Council of Applied Economic Research 36
Table A15: Average duration of overnight trips (number of nights spent) by purpose and by MPCE quintiles
Business
Leisure
Social
Religious
Educational
Medical
Shopping
Other purposes
All Purposes
Ru
ral
Quintile 1 (Bottom)
5.9 3.8 2.8 2.4 3.1 3.8 2.2 3.5 3.0
Quintile 2 5.1 3.6 2.6 3.3 3.4 2.9 1.2 3.0 2.7
Quintile 3 4.2 4.1 2.8 2.6 4.0 3.6 1.3 4.8 2.9
Quintile 4 3.7 4.8 2.7 2.6 6.8 4.6 1.3 3.7 3.0
Quintile 5 (Top) 3.2 4.8 3.1 2.8 3.7 5.0 1.6 4.7 3.3
Total 4.1 4.3 2.9 2.7 4.3 4.2 1.5 4.2 3.1
Urb
an
Quintile 1 (Bottom)
3.6 6.3 3.3 4.1 3.4 8.0 1.7 2.7 3.7
Quintile 2 2.6 4.0 3.7 9.3 5.0 5.2 2.3 2.8 4.5
Quintile 3 2.8 5.4 4.0 3.9 3.9 3.0 1.5 3.7 3.9
Quintile 4 3.1 5.7 3.7 3.4 3.3 3.7 1.5 3.2 3.7
Quintile 5 (Top) 2.9 4.6 5.1 3.8 3.7 7.6 3.1 5.4 4.9
Total 2.9 5.1 4.0 4.8 3.7 5.6 2.0 3.8 4.2
To
tal
Quintile 1 (Bottom)
5.3 4.1 2.8 3.0 2.9 4.1 1.9 3.4 3.0
Quintile 2 5.1 4.5 2.7 3.0 4.4 3.2 1.3 2.8 2.8
Quintile 3 3.2 3.4 2.9 5.1 5.3 3.8 1.4 4.8 3.3
Quintile 4 3.6 5.4 3.2 3.4 4.3 5.1 1.4 4.7 3.4
Quintile 5 (Top) 2.8 5.0 3.9 3.2 3.7 5.1 1.8 4.1 3.9
Total 3.7 4.7 3.2 3.5 4.1 4.4 1.6 4.1 3.4
Source: NCAER’s computation using DTS, 2008-09 data

A comparative study of domestic Tourism survey, 2008-09
National Council of Applied Economic Research 37
Table A16: Average expenditure per overnight BUSINESS trip by categories of expenditure and by religion
(In Rs.)
Accommodation services
Food & beverages services
Passenger transport services
Shopping Recreation,
religious and others
Total
Rural
Hinduism 67 174 186 581 66 1074
Islam 64 169 245 654 29 1161
Christianity 123 445 371 462 128 1528
Sikhism 14 29 302 28 5 378
Jainism 179 421 111 271 2 983
Buddhism 124 130 211 499 13 978
Zoroastrianism Others 93 538 613 1214 130 2588
Total 76 195 219 617 79 1194
Urban
Hinduism 491 519 1055 1601 57 3584
Islam 194 248 440 374 28 1285
Christianity 300 241 822 675 20 2058
Sikhism 478 182 1179 100 57 1811
Jainism 484 324 709 68 88 1674
Buddhism 103 131 205 146 27 612
Zoroastrianism Others 571 868 891 4693 494 7516
Total 492 493 1099 1429 94 3586
Total
Hinduism 223 300 453 954 62 1992
Islam 117 201 324 541 29 1212
Christianity 182 376 522 533 92 1705
Sikhism 235 102 631 62 30 1059
Jainism 345 362 440 155 50 1351
Buddhism 120 131 210 427 15 903
Zoroastrianism Others 136 567 637 1523 163 3026
Total 216 296 516 891 73 2002
Source: NCAER’s computation using DTS, 2008-09 data

A comparative study of domestic Tourism survey, 2008-09
National Council of Applied Economic Research 38
Table A17: Average expenditure per overnight BUSINESS trip by categories of expenditure and by social groups
(in Rs.)
Accommodation services
Food & beverages services
Passenger transport services
Shopping Recreation,
religious and others
Total
Rural
Scheduled tribe 52 352 247 414 113 1178
Scheduled caste 49 101 114 196 32 492
Other backward class 76 197 188 1139 42 1643
Others 84 170 260 199 93 806
Total 76 195 219 617 79 1194
Urban
Scheduled tribe 268 275 805 681 44 2073
Scheduled caste 436 211 473 460 66 1645
Other backward class 227 211 416 161 61 1076
Others 590 669 1170 2275 47 4752
Total 492 493 1099 1429 94 3586
Total
scheduled tribe 82 340 323 449 103 1297
Scheduled tribe 130 124 189 251 39 733
Scheduled caste 127 202 265 814 49 1456
Other backward class 345 427 730 1270 70 2841
Others 216 296 516 891 73 2002
Source: NCAER’s computation using DTS, 2008-09 data

A comparative study of domestic Tourism survey, 2008-09
National Council of Applied Economic Research 39
Table A18: Average expenditure per overnight BUSINESS trip by categories of expenditure and by types of household
(in Rs.)
Accommodation services
Food & beverages services
Passenger transport services
Shopping Recreation,
religious and others
Total
Rural
Self-employed in non-agriculture
54 166 255 440 51 965
Agricultural labour 61 249 185 165 59 719
Other labour 26 251 91 145 19 531
Self-employed in agriculture
90 181 203 1128 96 1698
Others 112 136 196 222 57 723
Total 76 195 219 617 79 1194
Urban
Self-employed 313 272 586 2445 51 3666
Regular wage/salary earning
641 753 1228 234 56 2912
Casual labour 309 240 547 116 59 1271
Others 356 165 935 359 31 1845
Total 492 493 1099 1429 94 3586
Total
Self employed 151 206 344 1334 67 2101
Regular wage/salary earning
641 753 1228 234 56 2912
Casual labour 71 249 183 153 44 699
Others 129 138 248 231 55 802
Total 216 296 516 891 73 2002
Source: NCAER’s computation using DTS, 2008-09 data

A comparative study of domestic Tourism survey, 2008-09
National Council of Applied Economic Research 40
Table A19: Average expenditure per overnight BUSINESS trip by categories of expenditure and by principal occupation (NCO) of households
(in Rs.)
Accommodation services
Food & beverages services
Passenger transport services
Shopping Recreation,
religious and others
Total
Rural
Legislators, senior officials and managers
88 128 335 1174 16 1740
Professionals 64 167 184 320 75 811
Associate professionals 148 170 665 206 79 1268
Clerks 151 138 283 488 34 1094
Service workers and shop & market sales workers
50 89 163 320 36 658
Skilled agricultural and fishery workers
83 196 199 1062 102 1643
Craft and related trades workers
60 268 140 90 34 592
Plant and machine operators and assemblers
32 262 98 128 51 571
Elementary occupations 46 203 146 167 38 600
Total 76 195 219 617 79 1194
Urban
Legislators, senior officials and managers
883 1299 1734 2357 48 6321
Professionals 697 347 1097 410 68 2620
Associate professionals 524 399 904 4111 40 5977
Clerks 346 296 680 404 38 1764
Service workers and shop & market sales workers
166 218 406 731 62 1583
Skilled agricultural and fishery workers
37 92 134 285 53 601
Craft and related trades workers
137 182 279 167 71 835
Plant and machine operators and assemblers
150 207 365 158 22 902
Elementary occupations 35 113 330 288 32 798
Total 492 493 1099 1429 94 3586
Total
Legislators, senior officials and managers
611 898 1254 1945 37 4744
Professionals 427 270 707 372 71 1847
Associate professionals 405 327 829 2879 52 4492
Clerks 288 249 562 431 37 1567
Service workers and shop & market sales workers
111 157 290 535 50 1143
Skilled agricultural and fishery workers
82 192 196 1030 100 1600
Craft and related trades workers
92 232 198 122 49 693
Plant and machine operators and assemblers
73 242 191 138 41 685
Elementary occupations 44 188 175 186 37 631
Total 216 296 516 891 73 2002
Source: NCAER’s computation using DTS, 2008-09 data

A comparative study of domestic Tourism survey, 2008-09
National Council of Applied Economic Research 41
Table A20: Average expenditure per overnight BUSINESS trip by categories of expenditure and by principal industry (NIC) of households
(in Rs.)
Accommodation services
Food & beverages services
Passenger transport services
Shopping Recreation,
religious and others
Total
Ru
ral
Agriculture 77 211 195 819 84 1386
Industry 56 217 178 382 22 855
Services 69 135 231 307 59 802
Total 76 195 219 617 79 1194
Urb
an
Agriculture 32 86 120 273 51 562
Industry 382 955 1123 166 64 2690
Services 490 315 785 1891 50 3531
Total 492 493 1099 1429 94 3586
To
tal
Agriculture 76 207 192 801 83 1360
Industry 203 550 605 284 41 1683
Services 311 238 549 1216 54 2368
Total 216 296 516 891 73 2002
Source: NCAER’s computation using DTS, 2008-09 data
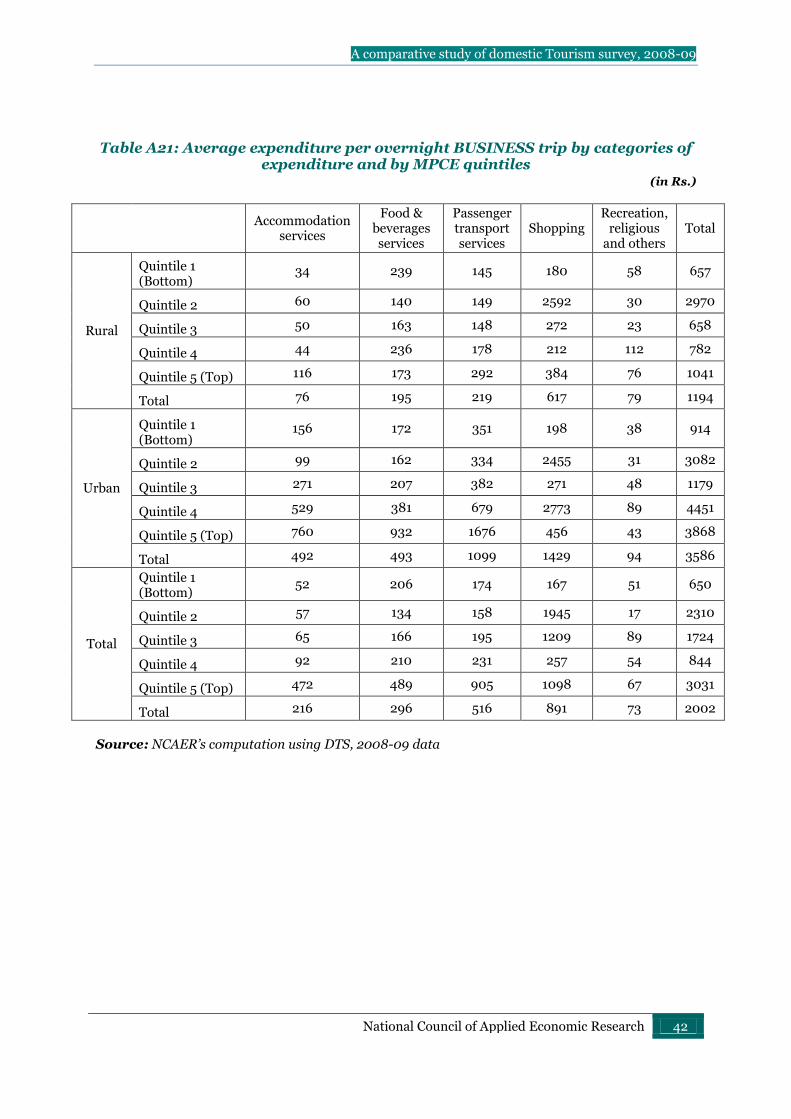
A comparative study of domestic Tourism survey, 2008-09
National Council of Applied Economic Research 42
Table A21: Average expenditure per overnight BUSINESS trip by categories of expenditure and by MPCE quintiles
(in Rs.)
Accommodation services
Food & beverages services
Passenger transport services
Shopping Recreation,
religious and others
Total
Rural
Quintile 1 (Bottom)
34 239 145 180 58 657
Quintile 2 60 140 149 2592 30 2970
Quintile 3 50 163 148 272 23 658
Quintile 4 44 236 178 212 112 782
Quintile 5 (Top) 116 173 292 384 76 1041
Total 76 195 219 617 79 1194
Urban
Quintile 1 (Bottom)
156 172 351 198 38 914
Quintile 2 99 162 334 2455 31 3082
Quintile 3 271 207 382 271 48 1179
Quintile 4 529 381 679 2773 89 4451
Quintile 5 (Top) 760 932 1676 456 43 3868
Total 492 493 1099 1429 94 3586
Total
Quintile 1 (Bottom)
52 206 174 167 51 650
Quintile 2 57 134 158 1945 17 2310
Quintile 3 65 166 195 1209 89 1724
Quintile 4 92 210 231 257 54 844
Quintile 5 (Top) 472 489 905 1098 67 3031
Total 216 296 516 891 73 2002
Source: NCAER’s computation using DTS, 2008-09 data
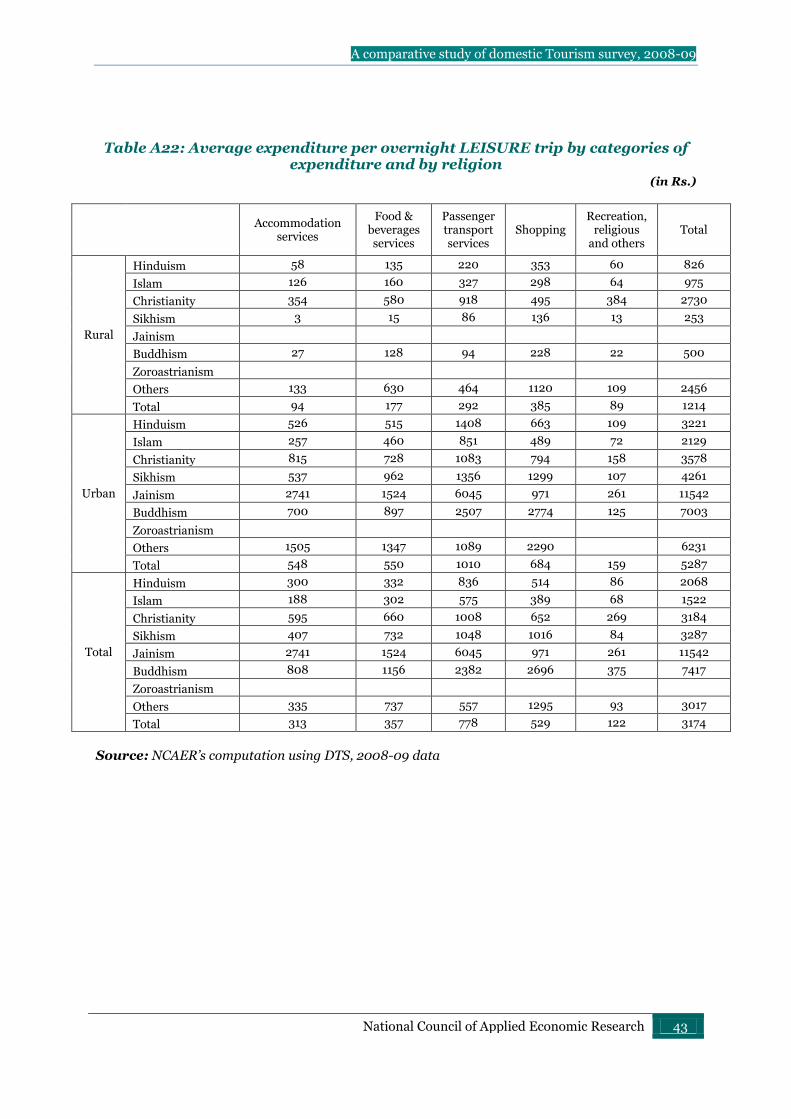
A comparative study of domestic Tourism survey, 2008-09
National Council of Applied Economic Research 43
Table A22: Average expenditure per overnight LEISURE trip by categories of expenditure and by religion
(in Rs.)
Accommodation services
Food & beverages services
Passenger transport services
Shopping Recreation,
religious and others
Total
Rural
Hinduism 58 135 220 353 60 826
Islam 126 160 327 298 64 975
Christianity 354 580 918 495 384 2730
Sikhism 3 15 86 136 13 253
Jainism
Buddhism 27 128 94 228 22 500
Zoroastrianism
Others 133 630 464 1120 109 2456
Total 94 177 292 385 89 1214
Urban
Hinduism 526 515 1408 663 109 3221
Islam 257 460 851 489 72 2129
Christianity 815 728 1083 794 158 3578
Sikhism 537 962 1356 1299 107 4261
Jainism 2741 1524 6045 971 261 11542
Buddhism 700 897 2507 2774 125 7003
Zoroastrianism
Others 1505 1347 1089 2290 6231
Total 548 550 1010 684 159 5287
Total
Hinduism 300 332 836 514 86 2068
Islam 188 302 575 389 68 1522
Christianity 595 660 1008 652 269 3184
Sikhism 407 732 1048 1016 84 3287
Jainism 2741 1524 6045 971 261 11542
Buddhism 808 1156 2382 2696 375 7417
Zoroastrianism
Others 335 737 557 1295 93 3017
Total 313 357 778 529 122 3174
Source: NCAER’s computation using DTS, 2008-09 data

A comparative study of domestic Tourism survey, 2008-09
National Council of Applied Economic Research 44
Table A23: Average expenditure per overnight LEISURE trip by categories of expenditure and by social groups
(in Rs.)
Accommodation services
Food & beverages services
Passenger transport services
Shopping Recreation,
religious and others
Total
Rural
Scheduled tribe 37 124 140 171 30 503
Scheduled caste 44 101 217 442 69 874
Other backward class 68 175 253 258 105 859
Others 152 216 401 559 62 1391
Total 94 177 292 385 89 1214
Urban
Scheduled tribe 62 75 181 194 17 529
Scheduled caste 155 194 538 371 52 1310
Other backward class 300 330 833 334 98 1895
Others 817 789 2069 995 144 4814
Total 548 550 1010 684 159 5287
Total
scheduled tribe 50 107 165 190 26 538
Scheduled tribe 89 139 348 413 62 1052
Scheduled caste 161 237 486 289 102 1275
Other backward class 595 597 1511 849 117 3670
Others 313 357 778 529 122 3174
Source: NCAER’s computation using DTS, 2008-09 data
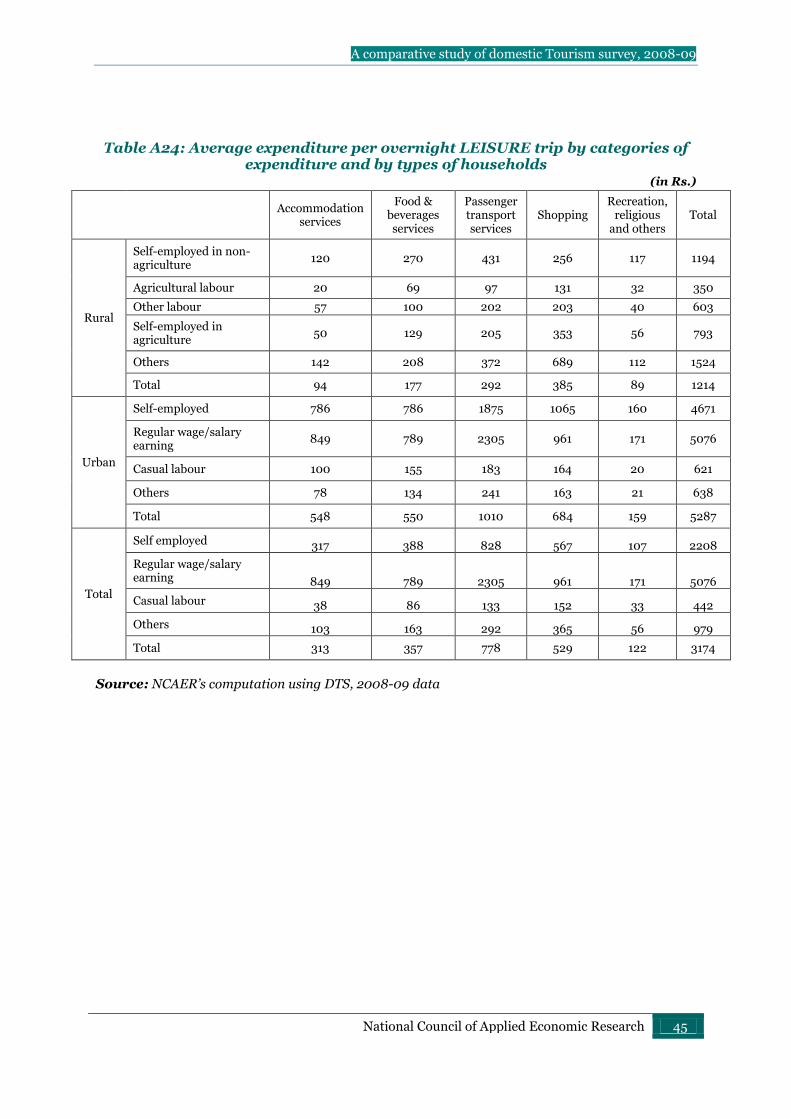
A comparative study of domestic Tourism survey, 2008-09
National Council of Applied Economic Research 45
Table A24: Average expenditure per overnight LEISURE trip by categories of expenditure and by types of households
(in Rs.)
Accommodation services
Food & beverages services
Passenger transport services
Shopping Recreation,
religious and others
Total
Rural
Self-employed in non-agriculture
120 270 431 256 117 1194
Agricultural labour 20 69 97 131 32 350
Other labour 57 100 202 203 40 603
Self-employed in agriculture
50 129 205 353 56 793
Others 142 208 372 689 112 1524
Total 94 177 292 385 89 1214
Urban
Self-employed 786 786 1875 1065 160 4671
Regular wage/salary earning
849 789 2305 961 171 5076
Casual labour 100 155 183 164 20 621
Others 78 134 241 163 21 638
Total 548 550 1010 684 159 5287
Total
Self employed 317 388 828 567 107 2208
Regular wage/salary earning 849 789 2305 961 171 5076
Casual labour 38 86 133 152 33 442
Others 103 163 292 365 56 979
Total 313 357 778 529 122 3174
Source: NCAER’s computation using DTS, 2008-09 data

A comparative study of domestic Tourism survey, 2008-09
National Council of Applied Economic Research 46
Table A25: Average expenditure per overnight LEISURE trip by categories of expenditure and by principal occupation (NCO) of households
(in Rs.)
Accommodation services
Food & beverages services
Passenger transport services
Shopping Recreation,
religious and others
Total
Rural
Legislators, senior officials and managers
357 464 770 601 94 2285
Professionals 146 148 320 318 154 1085
Associate professionals 250 851 771 735 115 2721
Clerks 185 280 618 690 107 1881
Service workers and shop & market sales workers
177 193 441 230 45 1087
Skilled agricultural and fishery workers
51 130 207 355 58 801
Craft and related trades workers
163 273 420 381 205 1443
Plant and machine operators and assemblers
8 66 131 135 31 372
Elementary occupations 21 70 123 152 35 400
Total 94 177 292 385 89 1214
Urban
Legislators, senior officials and managers
1381 1408 3730 1627 271 8416
Professionals 1301 906 2263 1141 185 5795
Associate professionals 762 823 3829 1006 203 6624
Clerks 697 922 2218 904 166 4908
Service workers and shop & market sales workers
277 288 665 320 68 1619
Skilled agricultural and fishery workers
392 351 482 849 105 2179
Craft and related trades workers
145 204 459 306 88 1203
Plant and machine operators and assemblers
139 301 581 1107 52 2179
Elementary occupations 95 258 337 587 57 1334
Total 548 550 1010 684 159 5287
Total
Legislators, senior officials and managers
1222 1262 3270 1467 243 7464
Professionals 949 675 1671 890 176 4362
Associate professionals 560 834 2619 899 168 5081
Clerks 534 717 1706 836 147 3940
Service workers and shop & market sales workers
242 255 586 288 60 1430
Skilled agricultural and fishery workers
66 140 218 376 60 860
Craft and related trades workers
157 247 435 353 162 1354
Plant and machine operators and assemblers
70 176 343 592 41 1221
Elementary occupations 33 102 159 226 39 560
Total 313 357 778 529 122 3174
Source: NCAER’s computation using DTS, 2008-09 data
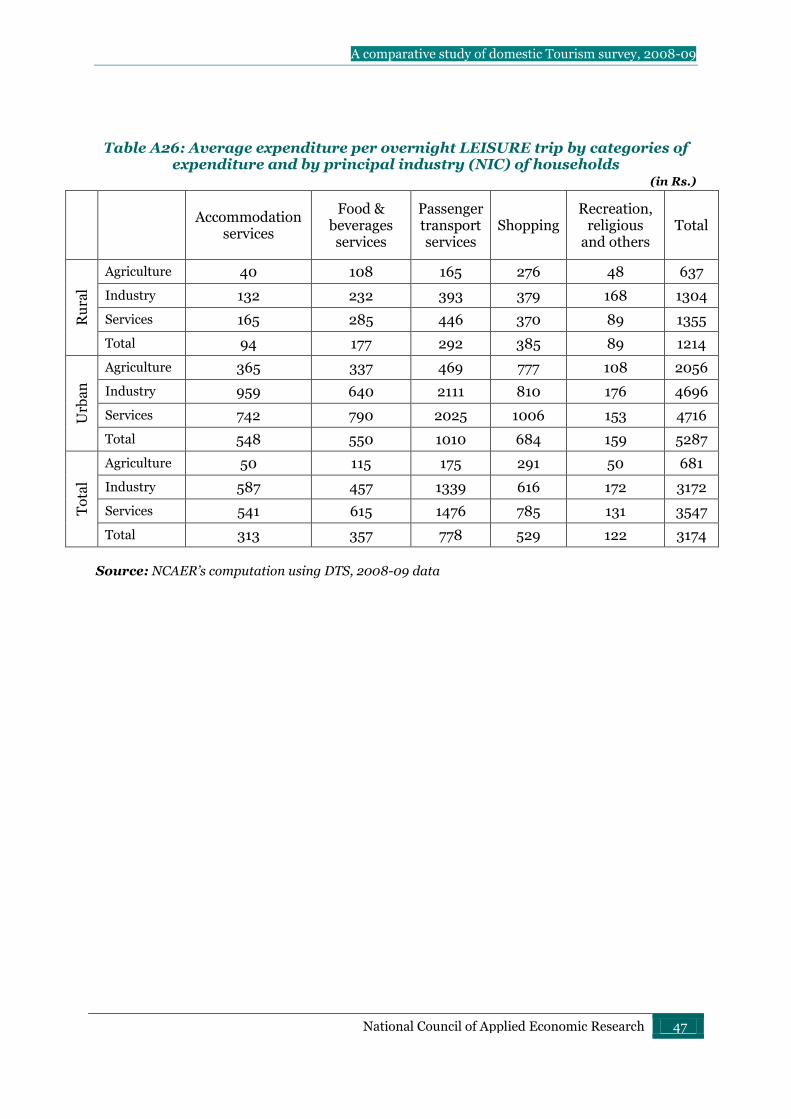
A comparative study of domestic Tourism survey, 2008-09
National Council of Applied Economic Research 47
Table A26: Average expenditure per overnight LEISURE trip by categories of expenditure and by principal industry (NIC) of households
(in Rs.)
Accommodation services
Food & beverages services
Passenger transport services
Shopping Recreation,
religious and others
Total
Ru
ral
Agriculture 40 108 165 276 48 637
Industry 132 232 393 379 168 1304
Services 165 285 446 370 89 1355
Total 94 177 292 385 89 1214
Urb
an
Agriculture 365 337 469 777 108 2056
Industry 959 640 2111 810 176 4696
Services 742 790 2025 1006 153 4716
Total 548 550 1010 684 159 5287
To
tal
Agriculture 50 115 175 291 50 681
Industry 587 457 1339 616 172 3172
Services 541 615 1476 785 131 3547
Total 313 357 778 529 122 3174
Source: NCAER’s computation using DTS, 2008-09 data

A comparative study of domestic Tourism survey, 2008-09
National Council of Applied Economic Research 48
Table A27: Average expenditure per overnight LEISURE trip by categories of expenditure and by MPCE quintiles
(in Rs.)
Accommodation
services
Food & beverages services
Passenger transport services
Shopping Recreation,
religious and others
Total
Rural
Quintile 1 (Bottom)
17 48 79 67 18 228
Quintile 2 14 69 107 188 34 412
Quintile 3 15 78 126 129 37 384
Quintile 4 16 68 112 212 44 453
Quintile 5 (Top) 227 379 635 847 172 2260
Total 94 177 292 385 89 1214
Urban
Quintile 1 (Bottom)
88 155 322 187 13 765
Quintile 2 128 193 468 384 57 1232
Quintile 3 161 191 470 738 72 1633
Quintile 4 264 294 685 419 58 1719
Quintile 5 (Top) 1018 967 2598 1067 191 5842
Total 548 550 1010 684 159 5287
Total
Quintile 1 (Bottom)
19 51 102 77 19 268
Quintile 2 14 65 99 132 24 334
Quintile 3 47 100 193 178 38 556
Quintile 4 88 151 299 333 65 936
Quintile 5 (Top) 619 646 1603 909 157 3933
Total 313 357 778 529 122 3174
Source: NCAER’s computation using DTS, 2008-09 data

A comparative study of domestic Tourism survey, 2008-09
National Council of Applied Economic Research 49
Table A28: Average expenditure per overnight SOCIAL trip by categories of expenditure and by religion
(in Rs.)
Accommodation services
Food & beverages services
Passenger transport services
Shopping Recreation,
religious and others
Total
Rural
Hinduism 2 40 128 254 34 457
Islam 1 42 111 156 35 345
Christianity 29 57 163 202 21 471
Sikhism 22 164 239 35 461
Jainism 78 230 390 5 704
Buddhism 10 42 157 130 39 377
Zoroastrianism 41 54 101 35 231
Others 89 246 678 1025 164 2202
Total 2 39 127 239 59 466
Urban
Hinduism 16 86 442 368 34 947
Islam 7 69 323 321 86 805
Christianity 34 169 409 466 159 1236
Sikhism 11 59 493 355 26 944
Jainism 5 117 1311 899 54 2385
Buddhism 3 82 268 183 21 557
Zoroastrianism 262 4534 961 109 5866
Others 6 74 366 120 15 582
Total 12 84 425 372 94 989
Total
Hinduism 6 52 214 285 34 592
Islam 3 49 171 203 50 476
Christianity 31 102 262 307 76 778
Sikhism 3 30 231 263 33 559
Jainism 3 101 869 690 34 1696
Buddhism 7 58 204 152 32 452
Zoroastrianism 197 3220 709 87 4213
Others 57 217 767 709 109 1860
Total 4 50 201 272 68 596
Source: NCAER’s computation using DTS, 2008-09 data

A comparative study of domestic Tourism survey, 2008-09
National Council of Applied Economic Research 50
Table A29: Average expenditure per overnight SOCIAL trip by categories of expenditure and by social groups
(in Rs.)
Accommodation services
Food & beverages services
Passenger transport services
Shopping Recreation,
religious and others
Total
Rural
Scheduled tribe 8 35 119 210 13 385
Scheduled caste 1 29 91 188 19 328
Other backward class 3 44 128 263 46 484
Others 3 45 164 269 32 512
Total 2 39 127 239 59 466
Urban
Scheduled tribe 3 83 295 281 28 689
Scheduled caste 5 63 261 248 31 608
Other backward class 8 64 294 273 51 689
Others 26 113 607 486 40 1272
Total 12 84 425 372 94 989
Total
scheduled tribe 7 41 139 218 15 420
Scheduled tribe 2 35 122 199 21 378
Scheduled caste 4 49 171 265 47 536
Other backward class 12 73 346 358 35 825
Others 4 50 201 272 68 596
Source: NCAER’s computation using DTS, 2008-09 data

A comparative study of domestic Tourism survey, 2008-09
National Council of Applied Economic Research 51
Table A30: Average expenditure per overnight SOCIAL trip by categories of expenditure and by types of household
(in Rs.)
Accommodation services
Food & beverages services
Passenger transport services
Shopping Recreation,
religious and others
Total
Rural
Self-employed in non-agriculture
8 40 139 247 29 463
Agricultural labour 1 34 96 166 17 314
Other labour 29 107 174 16 327
Self-employed in agriculture
2 47 131 275 50 505
Others 3 39 175 326 35 577
Total 2 39 127 239 59 466
Urban
Self-employed 27 104 508 453 42 1135
Regular wage/salary earning
16 101 498 442 46 1102
Casual labour 1 50 215 163 72 501
Others 3 46 270 158 20 497
Total 12 84 425 372 94 989
Total
Self employed 8 56 204 303 44 615
Regular wage/salary earning 16 101 498 442 46 1102
Casual labour 1 34 112 168 23 338
Others 3 41 206 270 30 550
Total 4 50 201 272 68 596
Source: NCAER’s computation using DTS, 2008-09 data

A comparative study of domestic Tourism survey, 2008-09
National Council of Applied Economic Research 52
Table A31: Average expenditure per overnight SOCIAL trip by categories of expenditure and by principal occupation (NCO) of households
(in Rs.)
Accommodation services
Food & beverages services
Passenger transport services
Shopping Recreation,
religious and others
Total
Rural
Legislators, senior officials and managers
32 61 202 294 18 606
Professionals 16 59 216 402 52 744
Associate professionals 7 58 316 839 80 1299
Clerks 2 47 170 366 21 606
Service workers and shop & market sales workers
1 34 114 216 18 382
Skilled agricultural and fishery workers
2 46 130 275 48 501
Craft and related trades workers
1 30 121 200 27 379
Plant and machine operators and assemblers
1 31 133 204 35 403
Elementary occupations 1 33 96 167 18 313
Total 2 39 127 239 59 466
Urban
Legislators, senior officials and managers
67 145 810 660 64 1746
Professionals 54 156 817 672 58 1757
Associate professionals 13 94 631 474 40 1252
Clerks 10 93 418 424 28 972
Service workers and shop & market sales workers
10 75 398 423 52 957
Skilled agricultural and fishery workers
3 49 242 304 36 635
Craft and related trades workers
3 79 275 285 79 720
Plant and machine operators and assemblers
103 407 278 32 820
Elementary occupations 1 61 238 226 15 540
Total 12 84 425 372 94 989
Total
Legislators, senior officials and managers
52 108 548 502 44 1255
Professionals 40 119 588 569 56 1371
Associate professionals 10 77 478 651 59 1275
Clerks 7 76 328 402 26 838
Service workers and shop & market sales workers
5 55 257 320 35 672
Skilled agricultural and fishery workers
2 46 133 276 48 505
Craft and related trades workers
2 49 182 233 48 514
Plant and machine operators and assemblers
1 68 273 241 33 615
Elementary occupations 1 37 117 175 17 347
Total 4 50 201 272 68 596
Source: NCAER’s computation using DTS, 2008-09 data

A comparative study of domestic Tourism survey, 2008-09
National Council of Applied Economic Research 53
Table A32: Average expenditure per overnight SOCIAL trip by categories of expenditure and by principal industry (NIC) of households
(in Rs.)
Accommodation services
Food & beverages services
Passenger transport services
Shopping Recreation,
religious and others
Total
Ru
ral
Agriculture 2 42 119 237 38 438
Industry 1 32 121 190 22 365
Services 8 43 162 333 33 579
Total 3 41 127 248 35 453
Urb
an
Agriculture 2 39 127 239 59 466
Industry 26 104 418 364 61 973
Services 16 96 512 451 42 1118
Total 12 84 425 372 94 989
To
tal
Agriculture 2 42 121 238 38 441
Industry 11 61 239 259 38 607
Services 12 71 347 395 38 863
Total 4 50 201 272 68 596
Source: NCAER’s computation using DTS, 2008-09 data

A comparative study of domestic Tourism survey, 2008-09
National Council of Applied Economic Research 54
Table A33: Average expenditure per overnight SOCIAL trip by categories of expenditure and by MPCE quintiles
(in Rs.)
Accommodation services
Food & beverages services
Passenger transport services
Shopping Recreation, religious and others
Total
Rural
Quintile 1 (Bottom) 2 56 95 240 34 427
Quintile 2 1 31 90 155 18 294
Quintile 3 1 29 101 175 17 323
Quintile 4 1 35 124 210 24 394
Quintile 5 (Top) 7 49 202 390 66 714
Total 2 39 127 239 59 466
Urban
Quintile 1 (Bottom) 1 39 180 192 14 425
Quintile 2 8 63 277 260 20 628
Quintile 3 4 75 337 265 58 739
Quintile 4 10 81 381 348 28 847
Quintile 5 (Top) 47 152 861 702 91 1852
Total 12 84 425 372 94 989
Total
Quintile 1 (Bottom) 2 48 99 211 27 387
Quintile 2 1 29 102 159 15 306
Quintile 3 1 33 127 192 21 375
Quintile 4 3 47 181 228 30 488
Quintile 5 (Top) 21 90 462 516 75 1164
Total 4 50 201 272 68 596
Source: NCAER’s computation using DTS, 2008-09 data

A comparative study of domestic Tourism survey, 2008-09
National Council of Applied Economic Research 55
Table A34: Average expenditure per overnight RELIGIOUS trip by categories of expenditure and by religion
(in Rs.)
Accommodation services
Food & beverages services
Passenger transport services
Shopping Recreation,
religious and others
Total
Rural
Hinduism 61 167 338 228 117 911
Islam 37 121 192 119 65 533
Christianity 193 295 781 206 94 1570
Sikhism 31 130 316 176 42 694
Jainism 90 251 872 78 234 1525
Buddhism 15 90 252 182 32 570
Zoroastrianism
Others 274 728 627 31 1661
Total 59 167 342 221 126 997
Urban
Hinduism 184 296 822 334 149 1784
Islam 103 239 502 363 100 1306
Christianity 169 298 683 255 138 1543
Sikhism 151 201 822 198 151 1522
Jainism 193 376 1510 227 140 2446
Buddhism 66 141 436 82 525 1251
Zoroastrianism
Others 41 114 90 206 8 460
Total 188 300 838 294 197 1919
Total
Hinduism 104 213 509 266 128 1220
Islam 75 194 374 260 89 993
Christianity 179 297 721 236 121 1554
Sikhism 53 143 412 180 63 852
Jainism 190 372 1488 222 143 2414
Buddhism 20 95 271 172 83 641
Zoroastrianism
Others 6 253 641 570 28 1497
Total 102 211 506 244 149 1301
Source: NCAER’s computation using DTS, 2008-09 data

A comparative study of domestic Tourism survey, 2008-09
National Council of Applied Economic Research 56
Table A35: Average expenditure per overnight RELIGIOUS trip by categories of expenditure and by social groups
(in Rs.)
Accommodation services
Food & beverages services
Passenger transport services
Shopping Recreation,
religious and others
Total
Rural
Scheduled tribe 47 179 348 121 58 754
Scheduled caste 38 146 255 167 73 680
Other backward class 58 156 332 229 103 878
Others 79 191 397 280 166 1113
Total 59 167 342 221 126 997
Urban
Scheduled tribe 21 78 260 90 78 527
Scheduled caste 93 165 506 251 96 1111
Other backward class 144 250 657 366 145 1562
Others 266 413 1145 378 180 2383
Total 188 300 838 294 197 1919
Total
scheduled tribe 38 144 318 111 65 676
Scheduled tribe 53 151 323 190 80 797
Scheduled caste 84 184 431 270 116 1085
Other backward class 169 299 759 331 175 1734
Others 102 211 506 244 149 1301
Source: NCAER’s computation using DTS, 2008-09 data

A comparative study of domestic Tourism survey, 2008-09
National Council of Applied Economic Research 57
Table A36: Average expenditure per overnight RELIGIOUS trip by categories of expenditure and by types of household
(in Rs.)
Accommodation services
Food & beverages services
Passenger transport services
Shopping Recreation,
religious and others
Total
Rural
Self-employed in non-agriculture
84 182 345 242 213 1066
Agricultural labour 32 119 233 130 69 584
Other labour 24 118 270 175 112 699
Self-employed in agriculture
65 169 358 260 90 942
Others 84 243 474 264 112 1176
Total 59 167 342 221 126 997
Urban
Self-employed 214 333 860 332 145 1884
Regular wage/salary earning
194 366 1035 434 185 2215
Casual labour 64 110 358 224 100 857
Others 153 150 457 131 87 977
Total 188 300 838 294 197 1919
Total
Self employed 109 215 488 275 130 1218
Regular wage/salary earning 194 366 1035 434 185 2215
Casual labour 35 117 268 162 88 671
Others 110 207 467 213 102 1100
Total 102 211 506 244 149 1301
Source: NCAER’s computation using DTS, 2008-09 data
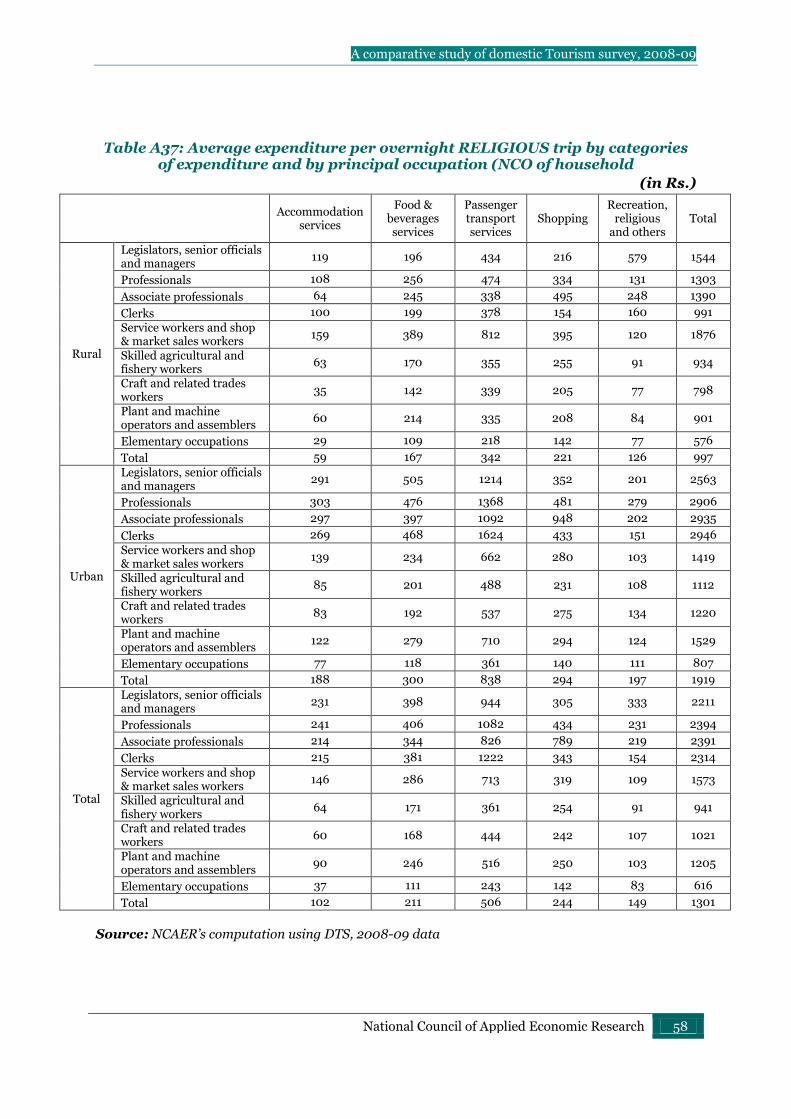
A comparative study of domestic Tourism survey, 2008-09
National Council of Applied Economic Research 58
Table A37: Average expenditure per overnight RELIGIOUS trip by categories of expenditure and by principal occupation (NCO of household
(in Rs.)
Accommodation services
Food & beverages services
Passenger transport services
Shopping Recreation,
religious and others
Total
Rural
Legislators, senior officials and managers
119 196 434 216 579 1544
Professionals 108 256 474 334 131 1303
Associate professionals 64 245 338 495 248 1390
Clerks 100 199 378 154 160 991
Service workers and shop & market sales workers
159 389 812 395 120 1876
Skilled agricultural and fishery workers
63 170 355 255 91 934
Craft and related trades workers
35 142 339 205 77 798
Plant and machine operators and assemblers
60 214 335 208 84 901
Elementary occupations 29 109 218 142 77 576
Total 59 167 342 221 126 997
Urban
Legislators, senior officials and managers
291 505 1214 352 201 2563
Professionals 303 476 1368 481 279 2906
Associate professionals 297 397 1092 948 202 2935
Clerks 269 468 1624 433 151 2946
Service workers and shop & market sales workers
139 234 662 280 103 1419
Skilled agricultural and fishery workers
85 201 488 231 108 1112
Craft and related trades workers
83 192 537 275 134 1220
Plant and machine operators and assemblers
122 279 710 294 124 1529
Elementary occupations 77 118 361 140 111 807
Total 188 300 838 294 197 1919
Total
Legislators, senior officials and managers
231 398 944 305 333 2211
Professionals 241 406 1082 434 231 2394
Associate professionals 214 344 826 789 219 2391
Clerks 215 381 1222 343 154 2314
Service workers and shop & market sales workers
146 286 713 319 109 1573
Skilled agricultural and fishery workers
64 171 361 254 91 941
Craft and related trades workers
60 168 444 242 107 1021
Plant and machine operators and assemblers
90 246 516 250 103 1205
Elementary occupations 37 111 243 142 83 616
Total 102 211 506 244 149 1301
Source: NCAER’s computation using DTS, 2008-09 data

A comparative study of domestic Tourism survey, 2008-09
National Council of Applied Economic Research 59
Table A38: Average expenditure per overnight RELIGIOUS trip by categories of expenditure and by principal industry (NIC) of households
(in Rs.)
Accommodation services
Food & beverages services
Passenger transport services
Shopping Recreation,
religious and others
Total
Ru
ral
Agriculture 54 154 316 219 83 825
Industry 36 130 277 189 91 722
Services 93 233 448 276 223 1274
Total 59 167 342 221 126 997
Urb
an
Agriculture 59 149 363 196 167 934
Industry 156 262 774 323 163 1678
Services 211 362 978 402 154 2107
Total 188 300 838 294 197 1919
To
tal
Agriculture 54 154 319 217 87 831
Industry 96 196 526 256 127 1201
Services 164 310 766 352 182 1774
Total 102 211 506 244 149 1301
Source: NCAER’s computation using DTS, 2008-09 data

A comparative study of domestic Tourism survey, 2008-09
National Council of Applied Economic Research 60
Table A39: Average expenditure per overnight RELIGIOUS trip by categories of expenditure and by MPCE quintiles
(in Rs.)
Accommodation services
Food & beverages services
Passenger transport services
Shopping Recreation,
religious and others
Total
Rural
Quintile 1 (Bottom) 32 108 192 108 88 528
Quintile 2 30 96 195 145 54 520
Quintile 3 30 113 230 170 58 601
Quintile 4 53 144 287 210 84 779
Quintile 5 (Top) 102 259 541 334 192 1427
Total 59 167 342 221 126 997
Urban
Quintile 1 (Bottom) 33 190 479 193 86 981
Quintile 2 107 175 417 192 118 1009
Quintile 3 112 194 631 221 111 1269
Quintile 4 154 289 779 284 158 1664
Quintile 5 (Top) 434 585 1639 677 256 3591
Total 188 300 838 294 197 1919
Total
Quintile 1 (Bottom) 33 128 268 133 73 635
Quintile 2 29 101 223 157 62 572
Quintile 3 37 117 248 160 72 635
Quintile 4 86 179 399 229 141 1033
Quintile 5 (Top) 219 381 976 444 193 2214
Total 102 211 506 244 149 1301
Source: NCAER’s computation using DTS, 2008-09 data

A comparative study of domestic Tourism survey, 2008-09
National Council of Applied Economic Research 61
Table A40: Average expenditure per overnight EDUCATIONAL trip by categories of expenditure and by religion
(in Rs.)
Accommodation services
Food & beverages services
Passenger transport services
Shopping Recreation,
religious and others
Total
Rural
Hinduism 100 123 182 268 75 748
Islam 213 204 421 179 18 1034
Christianity 151 317 293 451 60 1273
Sikhism 19 37 125 177 1 358
Jainism
Buddhism 417 313 823 196 43 1792
Zoroastrianism
Others 234 699 553 1404 330 3220
Total 136 147 211 278 126 996
Urban
Hinduism 254 282 904 365 74 1880
Islam 137 161 367 200 58 922
Christianity 118 235 705 356 28 1442
Sikhism 636 584 1656 429 8 3313
Jainism 25 38 226 91 112 492
Buddhism 197 110 222 200 25 753
Zoroastrianism
Others 314 975 681 1480 405 3856
Total 255 283 863 357 95 1995
Total
Hinduism 159 184 458 305 74 1181
Islam 172 181 392 190 40 975
Christianity 144 300 377 432 53 1307
Sikhism 64 76 235 195 1 571
Jainism 25 38 226 91 112 492
Buddhism 276 184 440 199 31 1130
Zoroastrianism
Others 268 816 607 1437 362 3489
Total 176 193 434 305 115 1337
Source: NCAER’s computation using DTS, 2008-09 data

A comparative study of domestic Tourism survey, 2008-09
National Council of Applied Economic Research 62
Table A41: Average expenditure per overnight EDUCATIONAL trip by categories of expenditure and by social groups
(in Rs.)
Accommodation services
Food & beverages services
Passenger transport services
Shopping Recreation,
religious and others
Total
Rural
Scheduled tribe 112 190 233 314 137 985
Scheduled caste 36 62 102 151 48 399
Other backward class 179 154 214 293 74 914
Others 78 143 257 325 37 840
Total 136 147 211 278 126 996
Urban
Scheduled tribe 132 236 412 543 48 1372
Scheduled caste 106 176 325 164 18 790
Other backward class 161 180 550 272 110 1271
Others 333 347 1182 425 70 2357
Total 255 283 863 357 95 1995
Total
scheduled tribe 115 197 262 352 122 1048
Scheduled tribe 56 95 166 155 39 512
Scheduled caste 174 163 326 288 86 1037
Other backward class 220 256 772 381 55 1685
Others 176 193 434 305 115 1337
Source: NCAER’s computation using DTS, 2008-09 data
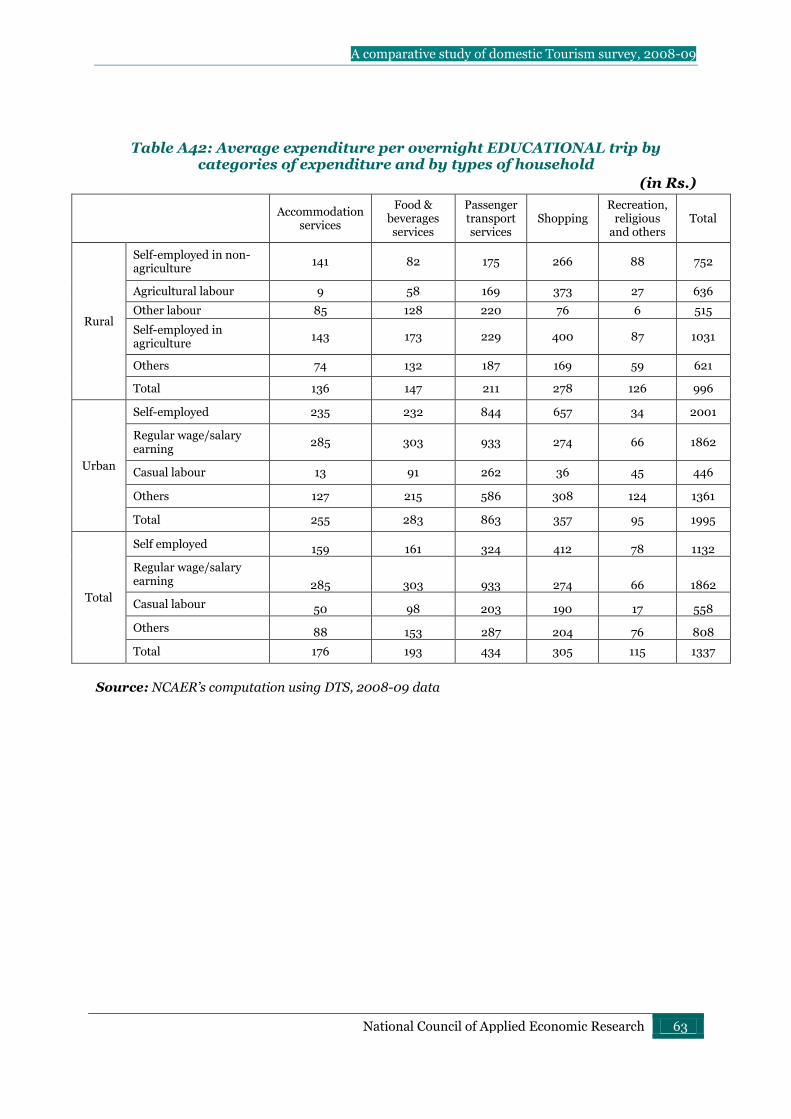
A comparative study of domestic Tourism survey, 2008-09
National Council of Applied Economic Research 63
Table A42: Average expenditure per overnight EDUCATIONAL trip by categories of expenditure and by types of household
(in Rs.)
Accommodation services
Food & beverages services
Passenger transport services
Shopping Recreation,
religious and others
Total
Rural
Self-employed in non-agriculture
141 82 175 266 88 752
Agricultural labour 9 58 169 373 27 636
Other labour 85 128 220 76 6 515
Self-employed in agriculture
143 173 229 400 87 1031
Others 74 132 187 169 59 621
Total 136 147 211 278 126 996
Urban
Self-employed 235 232 844 657 34 2001
Regular wage/salary earning
285 303 933 274 66 1862
Casual labour 13 91 262 36 45 446
Others 127 215 586 308 124 1361
Total 255 283 863 357 95 1995
Total
Self employed 159 161 324 412 78 1132
Regular wage/salary earning 285 303 933 274 66 1862
Casual labour 50 98 203 190 17 558
Others 88 153 287 204 76 808
Total 176 193 434 305 115 1337
Source: NCAER’s computation using DTS, 2008-09 data

A comparative study of domestic Tourism survey, 2008-09
National Council of Applied Economic Research 64
Table A43: Average expenditure per overnight EDUCATIONAL trip by categories of expenditure and by principal occupation (NCO) of household
(in Rs.)
Accommodation services
Food & beverages services
Passenger transport services
Shopping Recreation,
religious and others
Total
Rural
Legislators, senior officials and managers
477 84 228 164 348 1302
Professionals 168 284 411 358 42 1263
Associate professionals 70 124 163 139 15 511
Clerks 103 105 241 187 48 684
Service workers and shop & market sales workers
129 176 300 230 103 939
Skilled agricultural and fishery workers
141 172 226 392 84 1015
Craft and related trades workers
22 69 123 209 13 437
Plant and machine operators and assemblers
42 158 141 145 47 533
Elementary occupations 24 91 161 268 17 562
Total 136 147 211 278 126 996
Urban
Legislators, senior officials and managers
343 219 1068 498 36 2163
Professionals 413 419 1738 506 45 3121
Associate professionals 510 364 464 278 49 1665
Clerks 106 199 466 218 51 1041
Service workers and shop & market sales workers
37 132 227 145 30 570
Skilled agricultural and fishery workers
87 277 431 256 67 1119
Craft and related trades workers
157 220 404 301 176 1258
Plant and machine operators and assemblers
334 297 495 157 50 1334
Elementary occupations 127 125 542 760 95 1648
Total 255 283 863 357 95 1995
Total
Legislators, senior officials and managers
385 176 803 392 134 1891
Professionals 340 379 1344 462 44 2570
Associate professionals 189 189 244 177 24 822
Clerks 105 170 396 208 50 928
Service workers and shop & market sales workers
93 159 272 197 75 796
Skilled agricultural and fishery workers
140 175 231 388 84 1018
Craft and related trades workers
70 122 222 242 70 726
Plant and machine operators and assemblers
297 279 450 156 50 1231
Elementary occupations 41 97 221 345 29 732
Total 176 193 434 305 115 1337
Source: NCAER’s computation using DTS, 2008-09 data

A comparative study of domestic Tourism survey, 2008-09
National Council of Applied Economic Research 65
Table A44: Average expenditure per overnight EDUCATIONAL trip by categories of expenditure and by principal industry (NIC) of households
(in Rs.)
Accommodation services
Food & beverages services
Passenger transport services
Shopping Recreation,
religious and others
Total
Ru
ral
Agriculture 126 157 220 390 78 973
Industry 40 117 140 184 14 495
Services 143 153 253 204 76 830
Total 136 147 211 278 126 996
Urb
an
Agriculture 145 303 451 318 65 1282
Industry 271 226 835 487 147 1967
Services 285 293 935 344 43 1900
Total 255 283 863 357 95 1995
To
tal
Agriculture 127 161 226 388 78 980
Industry 129 159 408 301 65 1063
Services 221 230 628 281 58 1419
Total 176 193 434 305 115 1337
Source: NCAER’s computation using DTS, 2008-09 data

A comparative study of domestic Tourism survey, 2008-09
National Council of Applied Economic Research 66
Table A45: Average expenditure per overnight EDUCATIONAL trip by categories of expenditure and by MPCE quintiles
(in Rs.)
Accommodation services
Food & beverages services
Passenger transport services
Shopping Recreation,
religious and others
Total
Rural
Quintile 1 (Bottom) 18 73 203 143 15 452
Quintile 2 63 112 191 136 17 519
Quintile 3 114 79 124 151 90 557
Quintile 4 191 217 242 392 28 1070
Quintile 5 (Top) 98 154 238 363 107 959
Total 136 147 211 278 126 996
Urban
Quintile 1 (Bottom) 241 224 538 151 98 1251
Quintile 2 106 340 359 402 46 1253
Quintile 3 52 100 205 152 76 585
Quintile 4 226 213 615 329 100 1483
Quintile 5 (Top) 329 331 1281 417 55 2413
Total 255 283 863 357 95 1995
Total
Quintile 1 (Bottom) 20 75 200 121 13 430
Quintile 2 126 73 123 175 76 574
Quintile 3 157 166 236 327 51 938
Quintile 4 99 206 257 237 72 871
Quintile 5 (Top) 217 226 729 380 79 1629
Total 176 193 434 305 115 1337
Source: NCAER’s computation using DTS, 2008-09 data

A comparative study of domestic Tourism survey, 2008-09
National Council of Applied Economic Research 67
Table A46: Average expenditure per overnight MEDICAL trip by categories of expenditure and by religion
(in Rs.)
Accommodation services
Food & beverages services
Passenger transport services
Shopping Recreation,
religious and others
Total
Rural
Hinduism 127 201 242 108 2663 3339
Islam 126 268 227 111 2542 3275
Christianity 183 255 233 176 2715 3563
Sikhism 191 116 294 120 5303 6024
Jainism 50 80 35 3500 3665
Buddhism 19 172 184 81 1888 2344
Zoroastrianism 80 2798 2878
Others 3 217 207 194 958 1579
Total 129 214 242 108 2720 3416
Urban
Hinduism 193 238 574 147 4699 5851
Islam 110 177 301 128 4185 4901
Christianity 2166 1055 761 621 43074 47677
Sikhism 186 90 269 61 576 1181
Jainism 65 36 242 290 3952 4584
Buddhism 161 116 168 89 1024 1559
Zoroastrianism
Others 381 770 569 456 3250 5426
Total 237 248 522 164 5785 6956
Total
Hinduism 137 206 292 114 2969 3718
Islam 123 251 241 114 2849 3578
Christianity 544 403 331 259 10048 11585
Sikhism 190 112 290 110 4480 5181
Jainism 63 35 237 283 3892 4510
Buddhism 24 170 183 82 1858 2317
Zoroastrianism 80 2798 2878
Others 36 266 239 218 1162 1921
Total 144 219 282 116 3154 3918
Source: NCAER’s computation using DTS, 2008-09 data

A comparative study of domestic Tourism survey, 2008-09
National Council of Applied Economic Research 68
Table A47: Average expenditure per overnight MEDICAL trip by categories of expenditure and by social groups
(in Rs.)
Accommodation services
Food & beverages services
Passenger transport services
Shopping Recreation,
religious and others
Total
Rural
Scheduled tribe 67 130 233 117 1173 1720
Scheduled caste 93 146 166 93 1854 2351
Other backward class 125 227 228 97 2693 3371
Others 167 248 309 137 3672 4534
Total 129 214 242 108 2720 3416
Urban
Scheduled tribe 522 377 614 335 2068 3916
Scheduled caste 71 206 483 188 2650 3598
Other backward class 226 246 367 120 4622 5582
Others 252 224 664 182 7331 8653
Total 237 248 522 164 5785 6956
Total
scheduled tribe 88 142 251 127 1216 1823
Scheduled tribe 90 152 197 102 1929 2471
Scheduled caste 143 230 252 101 3027 3753
Other backward class 186 243 385 146 4459 5419
Others 144 219 282 116 3154 3918
Source: NCAER’s computation using DTS, 2008-09 data
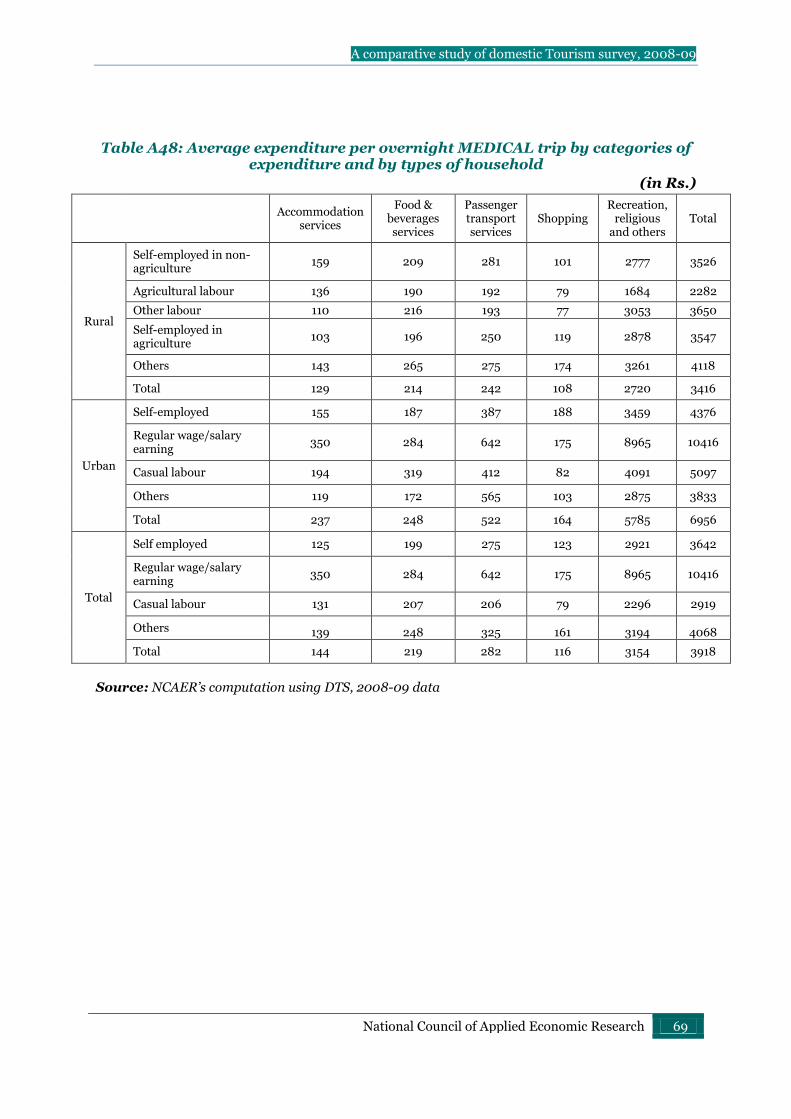
A comparative study of domestic Tourism survey, 2008-09
National Council of Applied Economic Research 69
Table A48: Average expenditure per overnight MEDICAL trip by categories of expenditure and by types of household
(in Rs.)
Accommodation services
Food & beverages services
Passenger transport services
Shopping Recreation,
religious and others
Total
Rural
Self-employed in non-agriculture
159 209 281 101 2777 3526
Agricultural labour 136 190 192 79 1684 2282
Other labour 110 216 193 77 3053 3650
Self-employed in agriculture
103 196 250 119 2878 3547
Others 143 265 275 174 3261 4118
Total 129 214 242 108 2720 3416
Urban
Self-employed 155 187 387 188 3459 4376
Regular wage/salary earning
350 284 642 175 8965 10416
Casual labour 194 319 412 82 4091 5097
Others 119 172 565 103 2875 3833
Total 237 248 522 164 5785 6956
Total
Self employed 125 199 275 123 2921 3642
Regular wage/salary earning
350 284 642 175 8965 10416
Casual labour 131 207 206 79 2296 2919
Others 139 248 325 161 3194 4068
Total 144 219 282 116 3154 3918
Source: NCAER’s computation using DTS, 2008-09 data
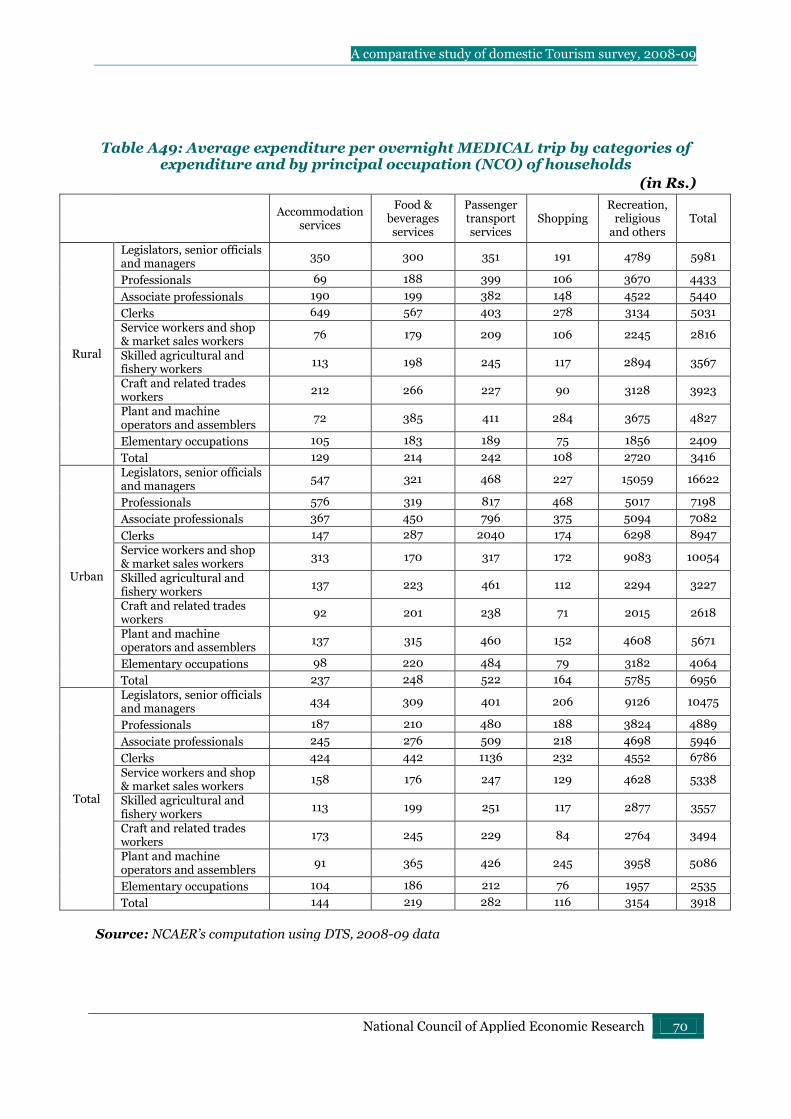
A comparative study of domestic Tourism survey, 2008-09
National Council of Applied Economic Research 70
Table A49: Average expenditure per overnight MEDICAL trip by categories of expenditure and by principal occupation (NCO) of households
(in Rs.)
Accommodation services
Food & beverages services
Passenger transport services
Shopping Recreation,
religious and others
Total
Rural
Legislators, senior officials and managers
350 300 351 191 4789 5981
Professionals 69 188 399 106 3670 4433
Associate professionals 190 199 382 148 4522 5440
Clerks 649 567 403 278 3134 5031
Service workers and shop & market sales workers
76 179 209 106 2245 2816
Skilled agricultural and fishery workers
113 198 245 117 2894 3567
Craft and related trades workers
212 266 227 90 3128 3923
Plant and machine operators and assemblers
72 385 411 284 3675 4827
Elementary occupations 105 183 189 75 1856 2409
Total 129 214 242 108 2720 3416
Urban
Legislators, senior officials and managers
547 321 468 227 15059 16622
Professionals 576 319 817 468 5017 7198
Associate professionals 367 450 796 375 5094 7082
Clerks 147 287 2040 174 6298 8947
Service workers and shop & market sales workers
313 170 317 172 9083 10054
Skilled agricultural and fishery workers
137 223 461 112 2294 3227
Craft and related trades workers
92 201 238 71 2015 2618
Plant and machine operators and assemblers
137 315 460 152 4608 5671
Elementary occupations 98 220 484 79 3182 4064
Total 237 248 522 164 5785 6956
Total
Legislators, senior officials and managers
434 309 401 206 9126 10475
Professionals 187 210 480 188 3824 4889
Associate professionals 245 276 509 218 4698 5946
Clerks 424 442 1136 232 4552 6786
Service workers and shop & market sales workers
158 176 247 129 4628 5338
Skilled agricultural and fishery workers
113 199 251 117 2877 3557
Craft and related trades workers
173 245 229 84 2764 3494
Plant and machine operators and assemblers
91 365 426 245 3958 5086
Elementary occupations 104 186 212 76 1957 2535
Total 144 219 282 116 3154 3918
Source: NCAER’s computation using DTS, 2008-09 data

A comparative study of domestic Tourism survey, 2008-09
National Council of Applied Economic Research 71
Table A50: Average expenditure per overnight MEDICAL trip by categories of expenditure and by principal industry (NIC) of households
(in Rs.)
Accommodation services
Food & beverages services
Passenger transport services
Shopping Recreation,
religious and others
Total
Ru
ral
Agriculture 118 193 229 103 2465 3107
Industry 154 219 205 76 2934 3589
Services 132 260 312 161 3179 4044
Total 129 214 242 108 2720 3416
Urb
an
Agriculture 107 176 375 90 2062 2810
Industry 100 211 335 108 2811 3566
Services 328 271 590 204 7798 9192
Total 237 248 522 164 5785 6956
To
tal
Agriculture 117 192 232 103 2456 3100
Industry 140 216 239 84 2895 3574
Services 200 264 408 175 4764 5811
Total 144 219 282 116 3154 3918
Source: NCAER’s computation using DTS, 2008-09 data

A comparative study of domestic Tourism survey, 2008-09
National Council of Applied Economic Research 72
Table A51: Average expenditure per overnight MEDICAL trip by categories of expenditure and by MPCE quintile
(in Rs.)
Accommodation services
Food & beverages services
Passenger transport services
Shopping Recreation,
religious and others
Total
Rural
Quintile 1 (Bottom) 33 119 132 73 1302 1659
Quintile 2 82 144 166 64 1465 1919
Quintile 3 49 129 166 100 1382 1825
Quintile 4 63 149 177 104 1540 2032
Quintile 5 (Top) 231 320 357 144 4605 5658
Total 129 214 242 108 2720 3416
Urban
Quintile 1 (Bottom) 46 138 192 69 1739 2185
Quintile 2 60 196 323 135 2536 3250
Quintile 3 198 162 323 139 7725 8548
Quintile 4 196 196 418 181 2525 3516
Quintile 5 (Top) 553 449 1162 252 11273 13690
Total 237 248 522 164 5785 6956
Total
Quintile 1 (Bottom) 55 105 122 58 1304 1644
Quintile 2 54 141 160 85 1305 1746
Quintile 3 55 145 192 94 1516 2002
Quintile 4 117 205 230 126 2052 2731
Quintile 5 (Top) 291 335 500 163 6517 7806
Total 144 219 282 116 3154 3918
Source: NCAER’s computation using DTS, 2008-09 data
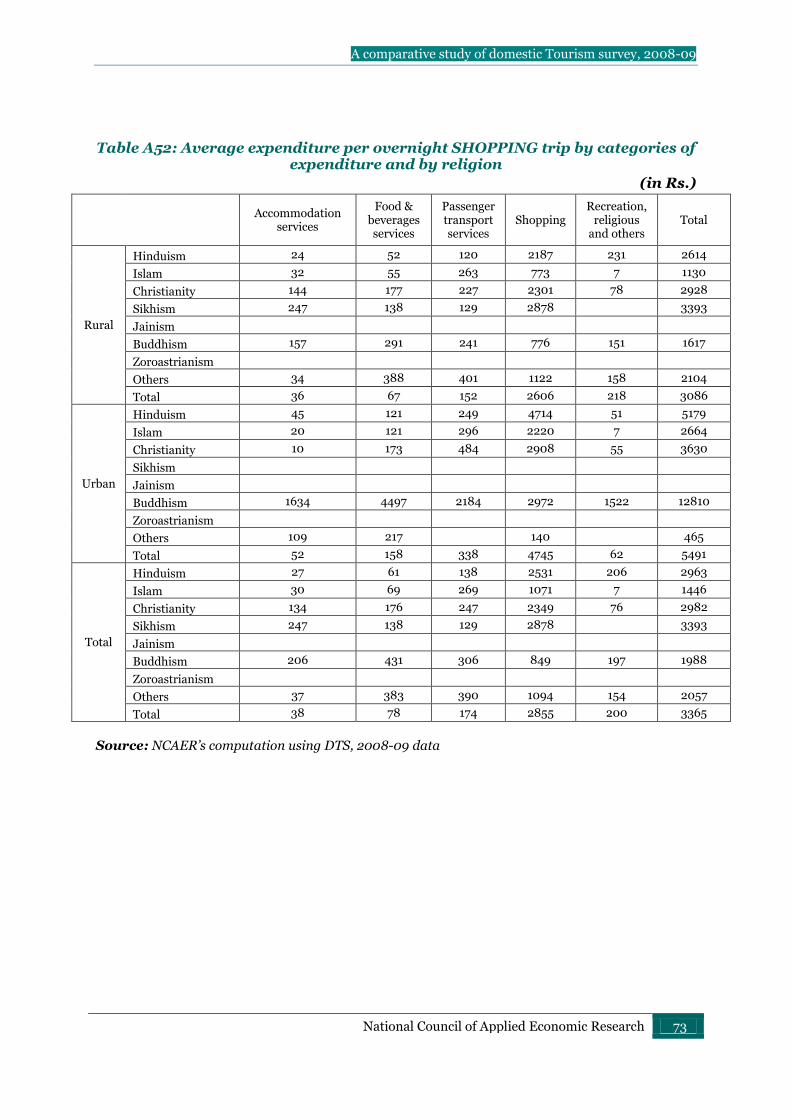
A comparative study of domestic Tourism survey, 2008-09
National Council of Applied Economic Research 73
Table A52: Average expenditure per overnight SHOPPING trip by categories of expenditure and by religion
(in Rs.)
Accommodation services
Food & beverages services
Passenger transport services
Shopping Recreation,
religious and others
Total
Rural
Hinduism 24 52 120 2187 231 2614
Islam 32 55 263 773 7 1130
Christianity 144 177 227 2301 78 2928
Sikhism 247 138 129 2878 3393
Jainism
Buddhism 157 291 241 776 151 1617
Zoroastrianism
Others 34 388 401 1122 158 2104
Total 36 67 152 2606 218 3086
Urban
Hinduism 45 121 249 4714 51 5179
Islam 20 121 296 2220 7 2664
Christianity 10 173 484 2908 55 3630
Sikhism
Jainism
Buddhism 1634 4497 2184 2972 1522 12810
Zoroastrianism
Others 109 217 140 465
Total 52 158 338 4745 62 5491
Total
Hinduism 27 61 138 2531 206 2963
Islam 30 69 269 1071 7 1446
Christianity 134 176 247 2349 76 2982
Sikhism 247 138 129 2878 3393
Jainism
Buddhism 206 431 306 849 197 1988
Zoroastrianism
Others 37 383 390 1094 154 2057
Total 38 78 174 2855 200 3365
Source: NCAER’s computation using DTS, 2008-09 data

A comparative study of domestic Tourism survey, 2008-09
National Council of Applied Economic Research 74
Table A53: Average expenditure per overnight SHOPPING trip by categories of expenditure and by social groups
(in Rs.)
Accommodation services
Food & beverages services
Passenger transport services
Shopping Recreation,
religious and others
Total
Rural
Scheduled tribe 67 131 159 1135 63 1554
Scheduled caste 14 41 73 3615 13 3757
Other backward class 16 60 131 2087 161 2456
Others 40 56 169 1998 367 2631
Total 36 67 152 2606 218 3086
Urban
Scheduled tribe 19 256 364 2975 47 3662
Scheduled caste 102 274 2265 2642
Other backward class 54 180 262 3350 17 3863
Others 57 139 273 4878 73 5421
Total 52 158 338 4745 62 5491
Total
scheduled tribe 65 135 166 1199 62 1628
Scheduled tribe 13 45 85 3535 13 3690
Scheduled caste 20 74 145 2223 145 2607
Other backward class 44 74 192 2628 303 3240
Others 38 78 174 2855 200 3365
Source: NCAER’s computation using DTS, 2008-09 data

A comparative study of domestic Tourism survey, 2008-09
National Council of Applied Economic Research 75
Table A54: Average expenditure per overnight SHOPPING trip by categories of expenditure and by types of household
(in Rs.)
Accommodation services
Food & beverages services
Passenger transport services
Shopping Recreation,
religious and others
Total
Rural
Self-employed in non-agriculture
50 105 283 3884 277 4599
Agricultural labour 10 32 59 916 17 1032
Other labour 26 69 137 1770 11 2012
Self-employed in agriculture
44 80 135 2018 285 2561
Others 20 46 128 1290 51 1536
Total 36 67 152 2606 218 3086
Urban
Self-employed 45 126 218 2265 97 2752
Regular wage/salary earning
47 146 355 5874 24 6446
Casual labour 184 526 23 8951 9683
Others 2 49 218 1908 22 2198
Total 52 158 338 4745 62 5491
Total
Self employed 45 89 173 2423 266 2996
Regular wage/salary earning
47 146 355 5874 24 6446
Casual labour 19 57 73 1373 15 1537
Others 19 46 130 1304 51 1551
Total 38 78 174 2855 200 3365
Source: NCAER’s computation using DTS, 2008-09 data

A comparative study of domestic Tourism survey, 2008-09
National Council of Applied Economic Research 76
Table A55: Average expenditure per overnight SHOPPING trip by categories of expenditure and by principal occupation of households
(in Rs.)
Accommodation services
Food & beverages services
Passenger transport services
Shopping Recreation,
religious and others
Total
Rural
Legislators, senior officials and managers
63 63 239 2240 6 2611
Professionals 30 90 187 1731 50 2088
Associate professionals 29 59 151 1043 122 1404
Clerks 92 223 307 1817 95 2534
Service workers and shop & market sales workers
19 93 444 8945 14 9515
Skilled agricultural and fishery workers
46 82 135 2114 368 2744
Craft and related trades workers
26 84 137 3198 22 3467
Plant and machine operators and assemblers
6 14 111 10 141
Elementary occupations 13 40 71 854 16 994
Total 36 67 152 2606 218 3086
Urban
Legislators, senior officials and managers
63 106 163 3463 14 3809
Professionals 95 219 379 6573 15 7281
Associate professionals 75 130 302 11677 304 12488
Clerks 13 164 571 12351 11 13110
Service workers and shop & market sales workers
74 232 284 1032 61 1683
Skilled agricultural and fishery workers
4 11 68 988 1071
Craft and related trades workers
7 137 403 2797 15 3360
Plant and machine operators and assemblers
1 30 103 1032 3 1170
Elementary occupations 72 253 313 5155 18 5812
Total 52 158 338 4745 62 5491
Total
Legislators, senior officials and managers
63 76 217 2600 8 2963
Professionals 43 116 226 2704 43 3131
Associate professionals 44 82 200 4514 182 5022
Clerks 58 198 420 6313 59 7047
Service workers and shop & market sales workers
41 150 366 5396 33 5986
Skilled agricultural and fishery workers
45 81 135 2107 366 2735
Craft and related trades workers
19 103 232 3039 20 3413
Plant and machine operators and assemblers
1 18 56 552 7 633
Elementary occupations 18 59 93 1236 16 1421
Total 38 78 174 2855 200 3365
Source: NCAER’s computation using DTS, 2008-09 data

A comparative study of domestic Tourism survey, 2008-09
National Council of Applied Economic Research 77
Table A56: Average expenditure per overnight SHOPPING trip by categories of expenditure and by principal industry (NIC) of households
(in Rs.)
Accommodation services
Food & beverages services
Passenger transport services
Shopping Recreation,
religious and others
Total
Ru
ral
Agriculture 36 71 120 1819 278 2324
Industry 21 65 215 2940 33 3274
Services 47 86 213 2685 36 3067
Total 36 67 152 2606 218 3086
Urb
an
Agriculture 162 452 21 8145
8780
Industry 15 93 271 3757 16 4151
Services 63 162 302 4355 83 4965
Total 52 158 338 4745 62 5491
To
tal
Agriculture 38 76 119 1894 274 2401
Industry 19 75 235 3230 27 3586
Services 53 112 243 3259 52 3720
Total 38 78 174 2855 200 3365
Source: NCAER’s computation using DTS, 2008-09 data

A comparative study of domestic Tourism survey, 2008-09
National Council of Applied Economic Research 78
Table A57: Average expenditure per overnight SHOPPING trip by categories of expenditure and by MPCE quintiles
(in Rs.)
Accommodation services
Food & beverages services
Passenger transport services
Shopping Recreation,
religious and others
Total
Rural
Quintile 1 (Bottom) 25 93 184 738 37 1077
Quintile 2 20 47 97 770 18 952
Quintile 3 55 65 109 1231 20 1481
Quintile 4 50 90 115 1961 279 2495
Quintile 5 (Top) 29 67 201 4362 516 5175
Total 36 67 152 2606 218 3086
Urban
Quintile 1 (Bottom) 1 106 508 2041 27 2684
Quintile 2 12 57 165 1656 3 1894
Quintile 3 90 177 165 7022 98 7553
Quintile 4 18 101 246 861 27 1253
Quintile 5 (Top) 76 261 417 5713 66 6533
Total 52 158 338 4745 62 5491
Total
Quintile 1 (Bottom) 19 73 144 650 30 916
Quintile 2 53 60 134 1144 18 1409
Quintile 3 32 72 125 1535 202 1965
Quintile 4 49 103 174 4127 33 4486
Quintile 5 (Top) 33 95 217 4164 599 5109
Total 38 78 174 2855 200 3365
Source: NCAER’s computation using DTS, 2008-09 data
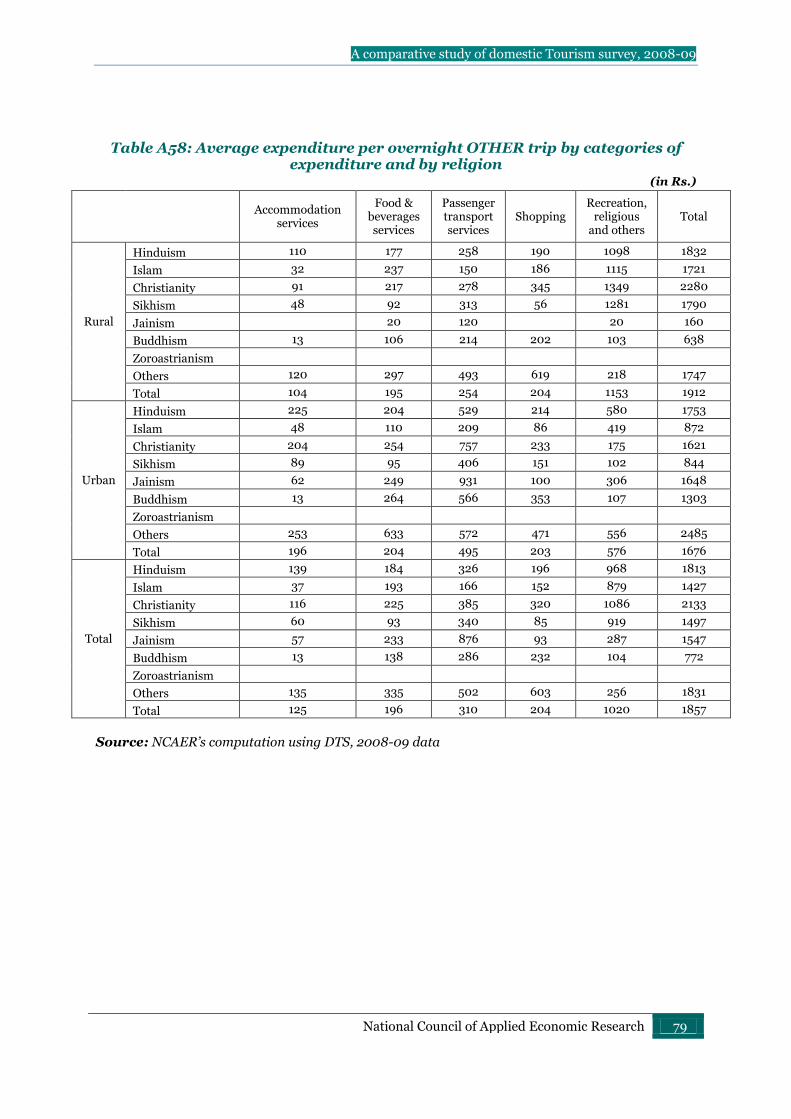
A comparative study of domestic Tourism survey, 2008-09
National Council of Applied Economic Research 79
Table A58: Average expenditure per overnight OTHER trip by categories of expenditure and by religion
(in Rs.)
Accommodation services
Food & beverages services
Passenger transport services
Shopping Recreation,
religious and others
Total
Rural
Hinduism 110 177 258 190 1098 1832
Islam 32 237 150 186 1115 1721
Christianity 91 217 278 345 1349 2280
Sikhism 48 92 313 56 1281 1790
Jainism 20 120 20 160
Buddhism 13 106 214 202 103 638
Zoroastrianism
Others 120 297 493 619 218 1747
Total 104 195 254 204 1153 1912
Urban
Hinduism 225 204 529 214 580 1753
Islam 48 110 209 86 419 872
Christianity 204 254 757 233 175 1621
Sikhism 89 95 406 151 102 844
Jainism 62 249 931 100 306 1648
Buddhism 13 264 566 353 107 1303
Zoroastrianism
Others 253 633 572 471 556 2485
Total 196 204 495 203 576 1676
Total
Hinduism 139 184 326 196 968 1813
Islam 37 193 166 152 879 1427
Christianity 116 225 385 320 1086 2133
Sikhism 60 93 340 85 919 1497
Jainism 57 233 876 93 287 1547
Buddhism 13 138 286 232 104 772
Zoroastrianism
Others 135 335 502 603 256 1831
Total 125 196 310 204 1020 1857
Source: NCAER’s computation using DTS, 2008-09 data
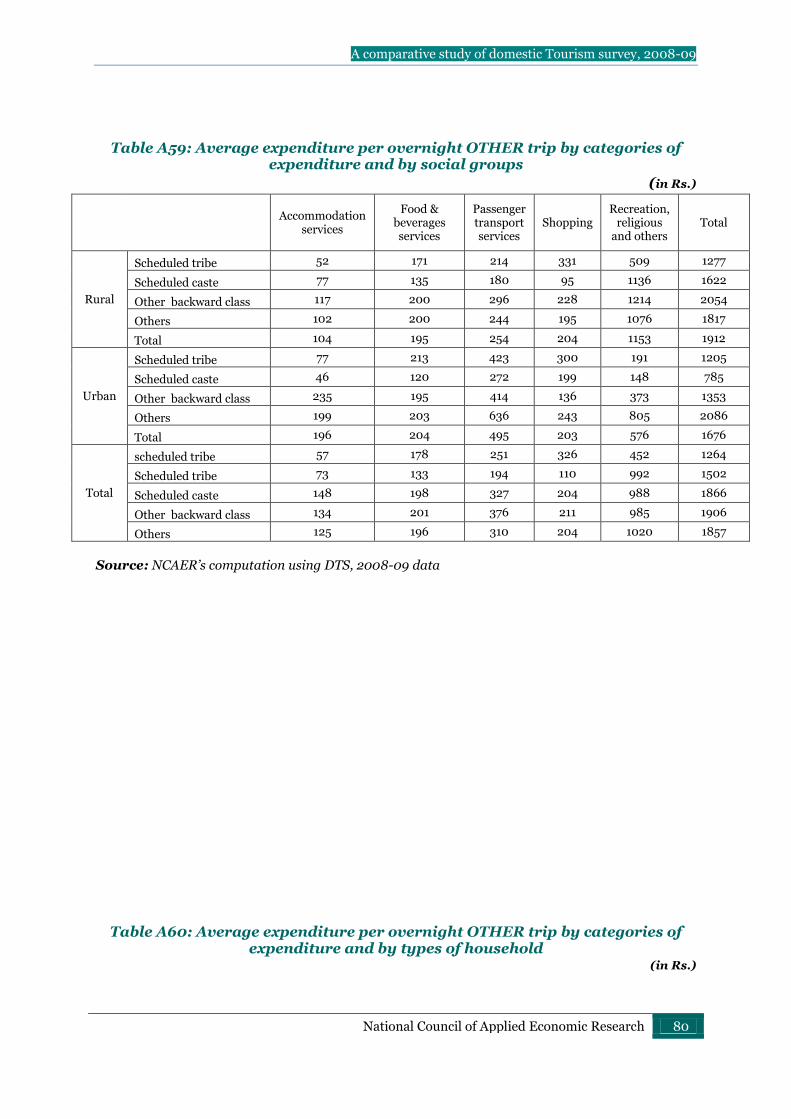
A comparative study of domestic Tourism survey, 2008-09
National Council of Applied Economic Research 80
Table A59: Average expenditure per overnight OTHER trip by categories of expenditure and by social groups
(in Rs.)
Accommodation services
Food & beverages services
Passenger transport services
Shopping Recreation,
religious and others
Total
Rural
Scheduled tribe 52 171 214 331 509 1277
Scheduled caste 77 135 180 95 1136 1622
Other backward class 117 200 296 228 1214 2054
Others 102 200 244 195 1076 1817
Total 104 195 254 204 1153 1912
Urban
Scheduled tribe 77 213 423 300 191 1205
Scheduled caste 46 120 272 199 148 785
Other backward class 235 195 414 136 373 1353
Others 199 203 636 243 805 2086
Total 196 204 495 203 576 1676
Total
scheduled tribe 57 178 251 326 452 1264
Scheduled tribe 73 133 194 110 992 1502
Scheduled caste 148 198 327 204 988 1866
Other backward class 134 201 376 211 985 1906
Others 125 196 310 204 1020 1857
Source: NCAER’s computation using DTS, 2008-09 data
Table A60: Average expenditure per overnight OTHER trip by categories of expenditure and by types of household
(in Rs.)
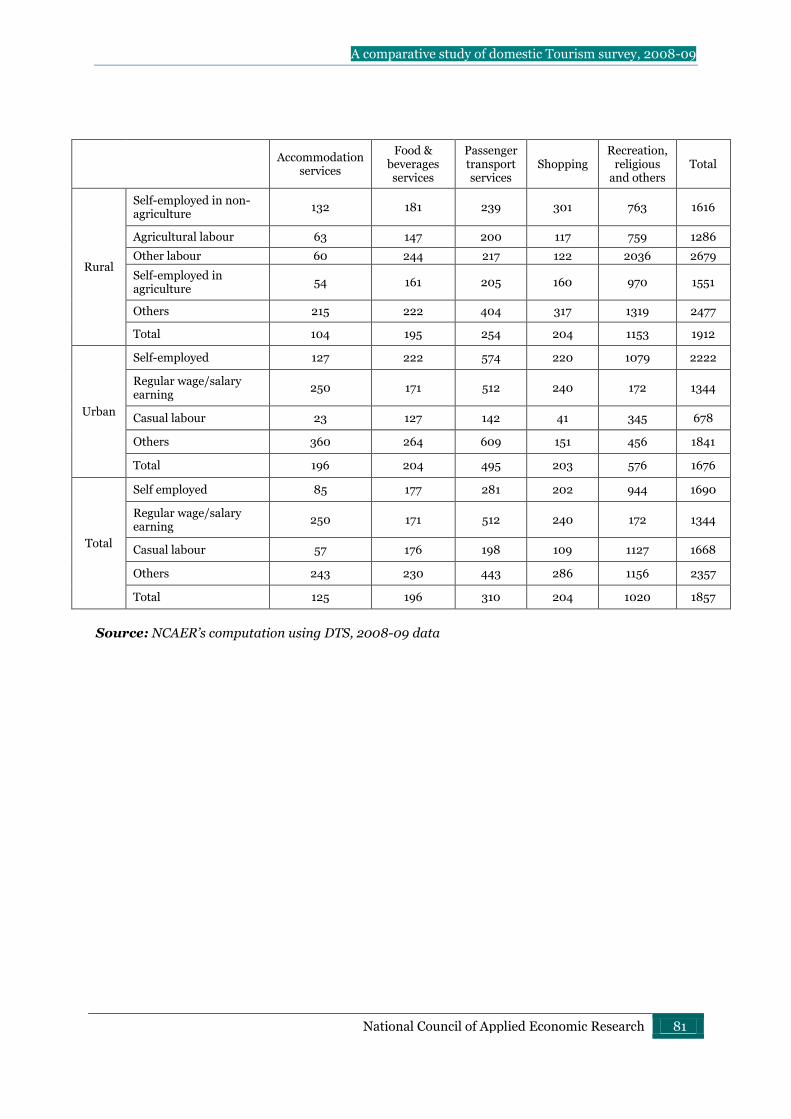
A comparative study of domestic Tourism survey, 2008-09
National Council of Applied Economic Research 81
Accommodation services
Food & beverages services
Passenger transport services
Shopping Recreation,
religious and others
Total
Rural
Self-employed in non-agriculture
132 181 239 301 763 1616
Agricultural labour 63 147 200 117 759 1286
Other labour 60 244 217 122 2036 2679
Self-employed in agriculture
54 161 205 160 970 1551
Others 215 222 404 317 1319 2477
Total 104 195 254 204 1153 1912
Urban
Self-employed 127 222 574 220 1079 2222
Regular wage/salary earning
250 171 512 240 172 1344
Casual labour 23 127 142 41 345 678
Others 360 264 609 151 456 1841
Total 196 204 495 203 576 1676
Total
Self employed 85 177 281 202 944 1690
Regular wage/salary earning
250 171 512 240 172 1344
Casual labour 57 176 198 109 1127 1668
Others 243 230 443 286 1156 2357
Total 125 196 310 204 1020 1857
Source: NCAER’s computation using DTS, 2008-09 data

A comparative study of domestic Tourism survey, 2008-09
National Council of Applied Economic Research 82
Table A61: Average expenditure per overnight OTHER trip by categories of expenditure and
by principal occupation (NCO) of households
(in Rs.)
Accommodation services
Food & beverages services
Passenger transport services
Shopping Recreation,
religious and others
Total
Rural
Legislators, senior officials and managers
1451 579 2321 1986 1454 7790
Professionals 145 205 192 98 1133 1773
Associate professionals 38 157 266 231 435 1127
Clerks 179 174 377 182 321 1232
Service workers and shop & market sales workers
201 255 199 383 743 1781
Skilled agricultural and fishery workers
52 162 219 155 941 1528
Craft and related trades workers
77 228 128 75 1212 1720
Plant and machine operators and assemblers
22 159 155 153 3942 4430
Elementary occupations 52 148 196 131 945 1471
Total 104 195 254 204 1153 1912
Urban
Legislators, senior officials and managers
370 312 1160 338 701 2881
Professionals 239 204 1052 570 139 2205
Associate professionals 78 234 655 268 1973 3208
Clerks 1174 312 424 279 66 2256
Service workers and shop & market sales workers
106 195 330 128 498 1256
Skilled agricultural and fishery workers
44 129 156 180 188 697
Craft and related trades workers
51 148 281 117 209 806
Plant and machine operators and assemblers
23 60 166 83 288 620
Elementary occupations 19 119 180 71 221 612
Total 196 204 495 203 576 1676
Total
Legislators, senior officials and managers
764 409 1583 938 975 4668
Professionals 178 204 496 265 778 1921
Associate professionals 58 196 461 250 1204 2169
Clerks 794 259 406 242 163 1865
Service workers and shop & market sales workers
163 230 249 282 643 1567
Skilled agricultural and fishery workers
51 160 216 156 907 1490
Craft and related trades workers
69 203 174 88 905 1440
Plant and machine operators and assemblers
21 115 153 120 2410 2819
Elementary occupations 47 144 194 121 825 1331
Total 125 196 310 204 1020 1857
Source: NCAER’s computation using DTS, 2008-09 data

A comparative study of domestic Tourism survey, 2008-09
National Council of Applied Economic Research 83
Table A62: Average expenditure per overnight OTHER trip by categories of expenditure and by principal industry (NIC) of households
(in Rs.)
Accommodation services
Food & beverages services
Passenger transport services
Shopping Recreation,
religious and others
Total
Ru
ral
Agriculture 57 162 213 148 992 1572
Industry 60 206 193 97 1566 2123
Services 228 214 383 389 1083 2298
Total 104 195 254 204 1153 1912
Urb
an
Agriculture 46 138 154 143 243 725
Industry 90 149 315 119 377 1051
Services 218 202 586 243 630 1880
Total 196 204 495 203 576 1676
To
tal
Agriculture 56 161 210 147 955 1530
Industry 71 187 235 105 1168 1766
Services 224 209 475 323 878 2109
Total 125 196 310 204 1020 1857
Source: NCAER’s computation using DTS, 2008-09 data

A comparative study of domestic Tourism survey, 2008-09
National Council of Applied Economic Research 84
Table A63: Average expenditure per overnight OTHER trip by categories of expenditure and by MPCE quintiles
(in Rs.)
Accommodation services
Food & beverages services
Passenger transport services
Shopping Recreation,
religious and others
Total
Rural
Quintile 1 (Bottom) 11 126 120 77 144 478
Quintile 2 26 75 135 72 165 473
Quintile 3 55 116 195 180 1179 1725
Quintile 4 48 128 168 116 1330 1790
Quintile 5 (Top) 188 283 381 315 1582 2748
Total 104 195 254 204 1153 1912
Urban
Quintile 1 (Bottom) 19 103 183 70 234 609
Quintile 2 29 110 225 105 293 762
Quintile 3 111 179 322 217 302 1131
Quintile 4 50 101 320 166 160 798
Quintile 5 (Top) 526 364 1030 333 1177 3430
Total 196 204 495 203 576 1676
Total
Quintile 1 (Bottom) 18 110 123 71 153 475
Quintile 2 15 91 158 66 401 731
Quintile 3 62 122 211 189 1059 1642
Quintile 4 52 172 202 161 700 1286
Quintile 5 (Top) 271 265 532 304 1497 2868
Total 125 196 310 204 1020 1857
Source: NCAER’s computation using DTS, 2008-09 data