Embed Size (px)
Citation preview
8/12/2019 Study NATURA 2000 Si Energia Alternativa
http://slidepdf.com/reader/full/study-natura-2000-si-energia-alternativa 1/32
Impacts of climate changeand selected renewable
energy infrastructures onEU biodiversity and theNatura 2000 network
Summary Report
Monika Bertzky4, Barney Dickson
4, Russell Galt
1,5,
Eleanor Glen2, Mike Harley
2, Nikki Hodgson
2, Guus
Keder 5, Igor Lysenko
4, Maria Pooley
2, Corinna
Ravilious4
, Todd Sajwaj2
, Roxi Schiopu2
, Yves deSoye1 and Graham Tucker 3.
1: IUCN. 2: AEA. 3: IEEP. 4: WCMC. 5: AXIOM
February 2011
Final Report to the European Commission under Contract
ENV.B.2/SER/2007/0076 “Natura 2000 Preparatory Actions – Lot 5: ClimateChange and Biodiversity in relation to the Natura 2000 Network”
8/12/2019 Study NATURA 2000 Si Energia Alternativa
http://slidepdf.com/reader/full/study-natura-2000-si-energia-alternativa 2/32
Impacts of climate change and renewable energy infrastructures on EU biodiversity and Natura 2000
Citation and disclaimerii
Citation and disclaimer
This document should be quoted as follows:
Bertzky, M., B. Dickson, R. Galt, E. Glen, M. Harley, N. Hodgson, G. Keder, I. Lysenko, M.Pooley, C. Ravilious, T. Sajwaj, R. Schiopu, Y. de Soye & G. Tucker (2010). Impacts ofclimate change and selected renewable energy infrastructures on EU biodiversity and theNatura 2000 network: Summary Report. European Commission and International Unionfor Conservation of Nature, Brussels.
The present Summary Report is based on the following five individual task reports:
Hodgson, N., E. Glen, M. Harley, M. Pooley, T. Sajwaj, R. Schiopu & Y. de Soye (2009).Impacts of climate change and selected renewable energy infrastructures on EUbiodiversity and the Natura 2000 network: Task 1 – Impacts of climate change on EUbiodiversity: evidence and modelling results. European Commission and International
Union for Conservation of Nature, Brussels.
Sajwaj, T., G. Tucker, M. Harley & Y. de Soye (2009). Impacts of climate change andselected renewable energy infrastructures on EU biodiversity and the Natura 2000network: Task 2a – An assessment framework for climate change vulnerability:methodology and results. European Commission and International Union for Conservationof Nature, Brussels.
Bertzky, M., I. Lysenko, C. Ravilious, B. Dickson & Y. de Soye (2009). Impacts of climatechange and selected renewable energy infrastructures on EU biodiversity and the Natura2000 network: Task 3a - Applying the vulnerability assessment framework: impacts ofclimate change on the Natura 2000 network. European Commission and International
Union for Conservation of Nature, Brussels.
Tucker, T. & Y. de Soye (2009). Impacts of climate change and selected renewable energyinfrastructures on EU biodiversity and the Natura 2000 network: Tasks 2b & 3b - Impactsof climate change on EU biodiversity policy, and recommendations for policies andmeasures to maintain and restore biodiversity in the EU in the face of climate change.European Commission and International Union for Conservation of Nature, Brussels.
Keder, G. & R. McIntyre Galt (2009). Impacts of climate change and selected renewableenergy infrastructures on EU biodiversity and the Natura 2000 network: Task 4 – Wind,hydro and marine renewable energy infrastructures in the EU: biodiversity impacts,mitigation and policy recommendations. European Commission and International Union
for Conservation of Nature, Brussels.
The contents and views contained in this document are those of the authors, and do notnecessarily represent those of the European Commission.
8/12/2019 Study NATURA 2000 Si Energia Alternativa
http://slidepdf.com/reader/full/study-natura-2000-si-energia-alternativa 3/32
Summary Report
Objectives, contributors and acknowledgements iii
Contract objectives, contributors and main responsibilities for tasks
The general purpose of the service contract underlying the present Summary Report, as wellas the aforementioned individual task reports, were “to provide the [European] Commissionwith an overview of the likely impact of climate change on biodiversity in the European Unionand indications as to how the design and implementation of current policy might need to beadapted in order to ensure that the EU respects its commitment to reduce biodiversity loss by2010 and beyond. The contract will also provide support to the Commission with regard tobiodiversity impacts associated with specific climate change mitigation measures.”
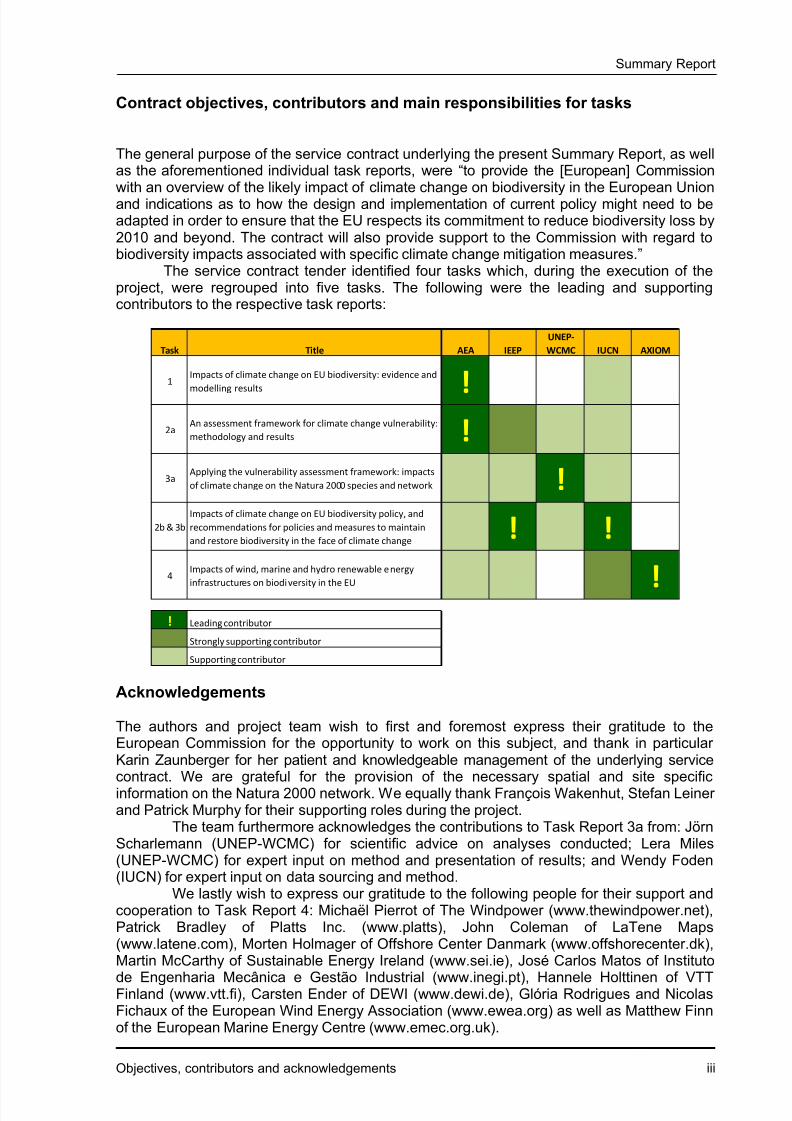
The service contract tender identified four tasks which, during the execution of theproject, were regrouped into five tasks. The following were the leading and supportingcontributors to the respective task reports:
Task Title AEA IEEP
UNEP-
WCMC IUCN AXIOM
1Impacts of climate change on EU biodiversity: evidence and
modelling results
!2a
An assessment framework for climate change vulnerability:
methodology and results !
3aApplying the vulnerability assessment framework: impacts
of climate change on the Natura 2000 species and network !
2b & 3b
Impacts of climate change on EU biodiversity policy, and
recommendations for policies and measures to maintain
and restore biodiversity in the face of climate change ! !
4Impacts of wind, marine and hydro renewable energy
infrastructures on biodiversity in the EU !
! Leading contributor
Strongly supporting contributor
Supporting contributor
Acknowledgements
The authors and project team wish to first and foremost express their gratitude to theEuropean Commission for the opportunity to work on this subject, and thank in particularKarin Zaunberger for her patient and knowledgeable management of the underlying servicecontract. We are grateful for the provision of the necessary spatial and site specificinformation on the Natura 2000 network. We equally thank François Wakenhut, Stefan Leinerand Patrick Murphy for their supporting roles during the project.
The team furthermore acknowledges the contributions to Task Report 3a from: JörnScharlemann (UNEP-WCMC) for scientific advice on analyses conducted; Lera Miles(UNEP-WCMC) for expert input on method and presentation of results; and Wendy Foden(IUCN) for expert input on data sourcing and method.
We lastly wish to express our gratitude to the following people for their support andcooperation to Task Report 4: Michaël Pierrot of The Windpower (www.thewindpower.net),Patrick Bradley of Platts Inc. (www.platts), John Coleman of LaTene Maps(www.latene.com), Morten Holmager of Offshore Center Danmark (www.offshorecenter.dk),Martin McCarthy of Sustainable Energy Ireland (www.sei.ie), José Carlos Matos of Instituto
de Engenharia Mecânica e Gestão Industrial (www.inegi.pt), Hannele Holttinen of VTTFinland (www.vtt.fi), Carsten Ender of DEWI (www.dewi.de), Glória Rodrigues and NicolasFichaux of the European Wind Energy Association (www.ewea.org) as well as Matthew Finnof the European Marine Energy Centre (www.emec.org.uk).
8/12/2019 Study NATURA 2000 Si Energia Alternativa
http://slidepdf.com/reader/full/study-natura-2000-si-energia-alternativa 4/32
Impacts of climate change and renewable energy infrastructures on EU biodiversity and Natura 2000
Table of contentsiv
Table of contents
1. Introduction
a. Direct impacts of climate change on biodiversity
b. Assessing and mitigating impacts from marine, wind and hydro energyinfrastructures
2. Impacts of climate change on EU biodiversity: evidence and modelling results
3. A framework for assessing the climate change vulnerability of European species offauna and flora: Methodology
a. Background
b. Determining surrogates for climate change impact
c. Determining and adding a surrogate for adaptive capacity
d. Combining impact and adaptive capacity scores to determine the vulnerabilitycategory
4. Results from the species vulnerability assessment and impacts of climate changeon the Natura 2000 network
a. Vulnerability assessment for species with analysis of geographic distribution
b. Temperature increases due to climate change in Natura 2000 sites and network
5. Wind, hydro and marine renewable energy infrastructures in the EU: anassessment of biodiversity impacts and suggestions for impact mitigation
6. Impacts of climate change on EU biodiversity policy and recommendations forpolicy and research
8/12/2019 Study NATURA 2000 Si Energia Alternativa
http://slidepdf.com/reader/full/study-natura-2000-si-energia-alternativa 5/32
Summary Report
Introduction 1
1. Introduction
a. Direct impacts of climate change on biodiversity
The 4th Assessment Report of the IPCC, the Millennium Ecosystem Assessment, the UNEP-World Conservation Monitoring Centre and similar authorities concur that climate change islikely to become the greatest threat to global biodiversity in the course of the 21st century. Asglobal mean annual temperature rises towards a critical threshold of 2 degrees Celsiusabove pre-industrial levels, the structure and function of both terrestrial and marineecosystems will experience substantial changes, and plant and animal species will beexposed to increasing extinction risks.
Looking at Europe in particular, Alcamo et al. (2007)1 concluded that climate related hazardsand water stress will mostly increase, and that regional differences of Europe‟s naturalresources and assets will get magnified. They also considered the effects of climate changeon the physiology, phenology and distribution of plant and animal species, and concluded
that natural ecosystems and biodiversity will be substantially affected, with many speciesexpected to have difficulties in adapting. Climate change has the potential, over a period of afew decades, to undermine our efforts relating to the conservation and sustainable use ofbiodiversity.
The centrepieces of the European Union‟s biodiversity and nature conservation policyframework are the Birds Directive2 and Habitats Directive3. Member States are legallybound to designate Special Protection Areas (SPAs) under the former and Special Areas ofConservation (SCAs) under the latter. These sites together form the Natura 2000 protectedarea network, which currently consists of more than 26,000 sites and covers an area ofaround 850,000 km2 (terrestrial and marine), corresponding to about 20% of the EU‟sterritory. One of the specific aims of the Natura 2000 network is to protect species and
habitats of Community Interest; the two Directives altogether list more than 869 species4
offlora and fauna, as well as 218 terrestrial and marine habitats of which around 70 have beengiven priority status.
In May 2006, the European Commission adopted a Communication on "Halting the lossof Biodiversity by 2010 – and Beyond: Sustaining ecosystem services for human well-being"5. The Communication underlined the importance of biodiversity conservation andincluded a detailed EU Biodiversity Action Plan (BAP) with ten overarching objectives, oneof which is to “support biodiversity adaptation to climate change”.
In 2008 the Biodiversity Action Plan underwent a mid-term assessment, the report6 of whichprovides essential reflections on the achievements of biodiversity and nature policy in the
EU. It is now clear that, for a number of reasons, the 2010 target will not be met. The roleplayed by climate change in this failure is not yet understood since the impacts of climatechange on species and habitats have only recently started to become visible.
It is obvious that future climate change impacts will not spare Natura 2000 sites or thespecies and habitats that they and surrounding landscapes contain. Climate change willaffect species distribution ranges, reproductive cycles, growing seasons and interactions withtheir biophysical environment. However, species and habitats react differently to climaticchanges - while some European species may benefit, others will suffer considerably. A rangeof projects and studies has therefore started to shed light on the more precise nature and
1 Alcamo, J. et al . 2007: Europe. Climate Change 2007: Impacts, Adaptation and Vulnerability. 4
th IPCC Assessment Report.
2 Council of the European Communities 1979 http://ec.europa.eu/environment/nature/legislation/index_en.htm 3 Council of the European Communities 1992 http://ec.europa.eu/environment/nature/legislation/index_en.htm
4 Some sources refer to up to 1150 species.
5 COM 2006/216, http://ec.europa.eu/environment/nature/biodiversity/comm2006/bap_2006.htm
6 http://ec.europa.eu/environment/nature/biodiversity/comm2006/bap_2008.htm
8/12/2019 Study NATURA 2000 Si Energia Alternativa
http://slidepdf.com/reader/full/study-natura-2000-si-energia-alternativa 6/32
Impacts of climate change and renewable energy infrastructures on EU biodiversity and Natura 2000
Introduction2
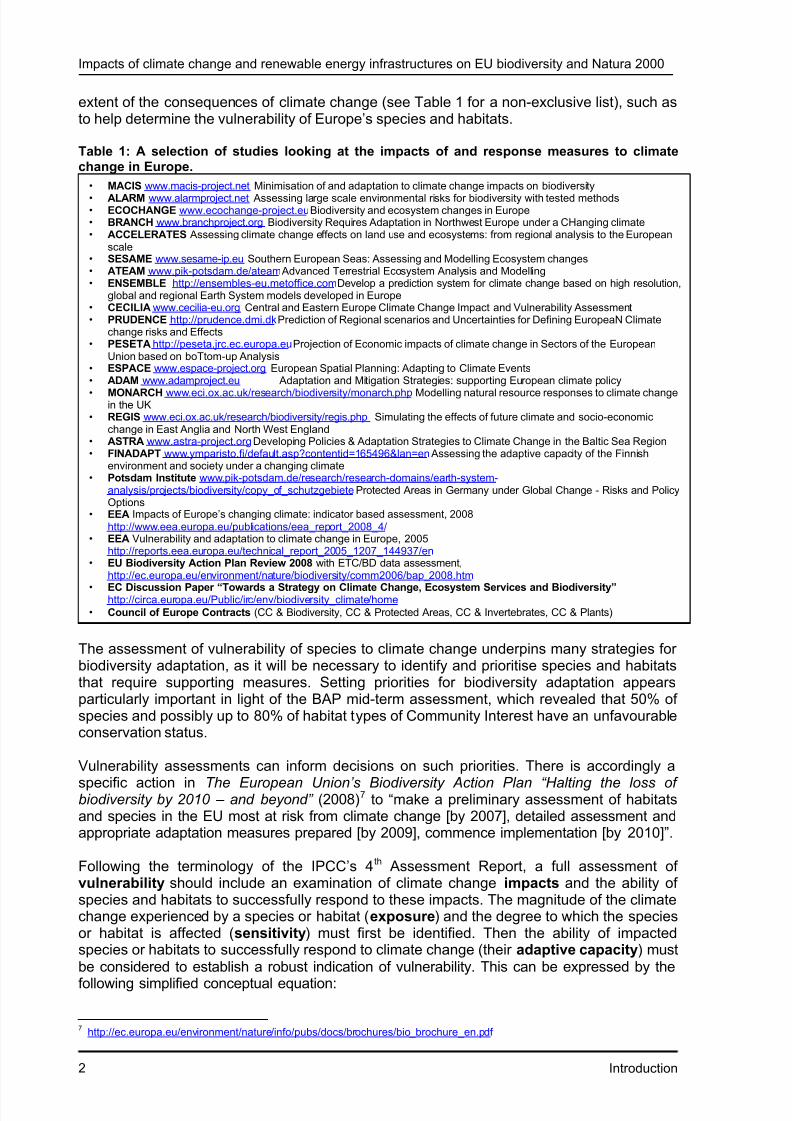
extent of the consequences of climate change (see Table 1 for a non-exclusive list), such asto help determine the vulnerability of Europe‟s species and habitats.
Table 1: A selection of studies looking at the impacts of and response measures to climatechange in Europe.
The assessment of vulnerability of species to climate change underpins many strategies forbiodiversity adaptation, as it will be necessary to identify and prioritise species and habitatsthat require supporting measures. Setting priorities for biodiversity adaptation appearsparticularly important in light of the BAP mid-term assessment, which revealed that 50% ofspecies and possibly up to 80% of habitat types of Community Interest have an unfavourableconservation status.
Vulnerability assessments can inform decisions on such priorities. There is accordingly a
specific action in The European Union’s Biodiversity Action Plan “Halting the loss ofbiodiversity by 2010 – and beyond” (2008)7 to “make a preliminary assessment of habitatsand species in the EU most at risk from climate change [by 2007], detailed assessment andappropriate adaptation measures prepared [by 2009], commence implementation [by 2010]”.
Following the terminology of the IPCC‟s 4th Assessment Report, a full assessment ofvulnerability should include an examination of climate change impacts and the ability ofspecies and habitats to successfully respond to these impacts. The magnitude of the climatechange experienced by a species or habitat (exposure) and the degree to which the speciesor habitat is affected (sensitivity) must first be identified. Then the ability of impactedspecies or habitats to successfully respond to climate change (their adaptive capacity) mustbe considered to establish a robust indication of vulnerability. This can be expressed by the
following simplified conceptual equation:
7 http://ec.europa.eu/environment/nature/info/pubs/docs/brochures/bio_brochure_en.pdf
• MACIS www.macis-project.net Minimisation of and adaptation to climate change impacts on biodiversity
• ALARM www.alarmproject.net Assessing large scale environmental risks for biodiversity with tested methods• ECOCHANGE www.ecochange-project.eu Biodiversity and ecosystem changes in Europe• BRANCH www.branchproject.org Biodiversity Requires Adaptation in Northwest Europe under a CHanging climate• ACCELERATES Assessing climate change effects on land use and ecosystems: from regional analysis to the European
scale• SESAME www.sesame-ip.eu Southern European Seas: Assessing and Modelling Ecosystem changes• ATEAM www.pik-potsdam.de/ateam Advanced Terrestrial Ecosystem Analysis and Modelling• ENSEMBLE http://ensembles-eu.metoffice.com Develop a prediction system for climate change based on high resolution,
global and regional Earth System models developed in Europe• CECILIA www.cecilia-eu.org Central and Eastern Europe Climate Change Impact and Vulnerability Assessment• PRUDENCE http://prudence.dmi.dk Prediction of Regional scenarios and Uncertainties for Defining EuropeaN Climate
change risks and Effects• PESETA http://peseta.jrc.ec.europa.eu Projection of Economic impacts of climate change in Sectors of the European
Union based on boTtom-up Analysis• ESPACE www.espace-project.org European Spatial Planning: Adapting to Climate Events• ADAM www.adamproject.eu Adaptation and Mitigation Strategies: supporting European climate policy
• MONARCH www.eci.ox.ac.uk/research/biodiversity/monarch.php Modelling natural resource responses to climate changein the UK
• REGIS www.eci.ox.ac.uk/research/biodiversity/regis.php Simulating the effects of future climate and socio-economicchange in East Anglia and North West England
• ASTRA www.astra-project.org Developing Policies & Adaptation Strategies to Climate Change in the Baltic Sea Region• FINADAPT www.ymparisto.fi/default.asp?contentid=165496&lan=en Assessing the adaptive capacity of the Finnish
environment and society under a changing climate• Potsdam Institute www.pik-potsdam.de/research/research-domains/earth-system-
analysis/projects/biodiversity/copy_of_schutzgebiete Protected Areas in Germany under Global Change - Risks and PolicyOptions
• EEA Impacts of Europe‟s changing climate: indicator based assessment, 2008http://www.eea.europa.eu/publications/eea_report_2008_4/
• EEA Vulnerability and adaptation to climate change in Europe, 2005http://reports.eea.europa.eu/technical_report_2005_1207_144937/en
• EU Biodiversity Action Plan Review 2008 with ETC/BD data assessment,http://ec.europa.eu/environment/nature/biodiversity/comm2006/bap_2008.htm
• EC Discussion Paper “Towards a Strategy on Climate Change, Ecosystem Services and Biodiversity” http://circa.europa.eu/Public/irc/env/biodiversity_climate/home
• Council of Europe Contracts (CC & Biodiversity, CC & Protected Areas, CC & Invertebrates, CC & Plants)
8/12/2019 Study NATURA 2000 Si Energia Alternativa
http://slidepdf.com/reader/full/study-natura-2000-si-energia-alternativa 7/32
Summary Report
Introduction 3
Vulnerability = Exposure x Sensitivity / Adaptive Capacity = Impact / Adaptive Capacity
Standardised data types and metrics for exposure, sensitivity and adaptive capacity arerequired in order to apply the vulnerability assessment framework across the EU and acrossa range of taxonomic groups.
Research into the exposure and sensitivity of EU species to climate change is fairlyabundant in the scientific literature, particularly for species in the northern and western EU(see Task 1 Report). These studies utilised a variety of approaches to understand climatechange impacts on species, including analyses of observed data and modelled projections,and knowledge-based expert assessments.
Various individual species and taxonomic groups have been used in models that project howthey might be impacted by climate change in the future. The emphasis on species has beendriven in part by the availability of spatial distribution data sets for a large number of speciesacross taxonomic groups. The spatial data are used in conjunction with Global ClimateModels (GCMs) to model the climatic envelope (aka climatic space) of a species or the
range of climatic conditions that enable the species‟ continued existence. Climatic envelopemodels are used to depict how a species‟ potential suitable climate space might shiftgeographically in response to climate change. Climate envelope data sets are becomingincreasingly available for a range of species. Climate envelope models use variousemissions scenarios to capture the range of possible climate futures.
While a large number of studies have considered the impacts of climate change on species,to date only a limited number of projects have moved beyond the assessment ofexposure and sensitivity to a structured approach that considers adaptive capacityand thereby vulnerability. Thuiller et al. (2005)8 used climate envelope models for morethan 1350 plant species to assess the amount of climate space lost (sensitivity) under arange of climate change (exposure) and dispersal scenarios (adaptive capacity: no migration
vs. full migration). It implicitly blends the assessments of exposure, impact and adaptivecapacity in its methods. The amount of climate space lost was then compared to IUCN threatcategories to assign threat category labels. Settele et al. (2008)9 used the WorldOrganisation for Animal Health‟s risk assessment process for butterflies to identify hazardsand assess risks from climate change. Neither of these two studies separated theassessment of impacts from that of adaptive capacity.
Very little work has been done to develop a structured approach to adaptive capacity.However, IUCN held a Species Vulnerability Traits workshop that was broadly focused onthe identification of life history traits that might pre-dispose species to extinction, includingvulnerability to climate change. This database is currently under revision and was notavailable for the present study. However, in the longer-term species vulnerability traits could
provide a good framework for assessing species‟ vulnerability to climate change and providea globally applicable, consistent approach10.
The vulnerability of habitats and ecosystems has been considered through a range ofapproaches, including expert knowledge, the use of surrogate plant and animal species andthe development of quantitative indices for specific impacts or habitats. The vulnerability ofbroad global ecosystem types and/or European biogeographical regions has beenqualitatively assessed using expert knowledge by a few studies11.
8 Thuiller, W. et al . (2005): Climate change threats to plant diversity in Europe. Proceedings of the National Academy ofSciences.
9 Settele, J. et al . (2008): Climatic risk atlas of European butterflies. Pensoft, Sofia.10
Berry, P. (2008): Climate change and the vulnerability of Bern Convention species and habitats. Council of Europe.11
Berry. P. (2008): as above. Berry P. (2004): Plant vulnerability to climate change. In Yearbook of Science and Technology,McGraw-Hill, NY, pp. 259-261. WGBU (2003): Climate Protection Strategies for the 21st Century: Kyoto and beyond. EEA(2004): Impacts of Europe's changing climate - an indicator-based assessment.
8/12/2019 Study NATURA 2000 Si Energia Alternativa
http://slidepdf.com/reader/full/study-natura-2000-si-energia-alternativa 8/32
Impacts of climate change and renewable energy infrastructures on EU biodiversity and Natura 2000
Introduction4
Other approaches to assess habitat vulnerability have included the use of expertknowledge of habitats and their vulnerability, and the use of selected species asindicators of climate change impacts on habitats. The MONARCH Project considered theimpacts and vulnerabilities of characteristic species as surrogates for habitat vulnerability toclimate change in Great Britain and Ireland. This approach is a simple and effective means ofusing the abundant species data sets to bypass the significant difficulties associated withmodelling habitat responses to climate change. The BRANCH Project developed the CoastalHabitat Vulnerability Index (CHVI) as a means of identifying those coastal habitat typesespecially vulnerable to sea-level rise; this is one of the few quantitative approaches used forhabitat vulnerability, but is unfortunately restricted to coastal habitats.
In an attempt to provide further guidance to the European Commission and EU memberstates, the aims of the first four Task Reports (1, 2a, 3a, 2b&3b) of the present study were to
Review the evidence and projections of the direct impacts of climate change onbiodiversity in the EU;
Develop a semi-quantitative assessment methodology for establishing thevulnerability of species and habitats;
Apply the vulnerability assessment methodology such as to identify species andhabitats of Community Interest that are vulnerable to climate change in the EU;
Evaluate the consequences of climate change for the overall Natura 2000 network;
Review the likely impact of climate change on the EU biodiversity target and ActionPlan, i.e. on the EU‟s ability to halt biodiversity loss by 2010 and beyond; and
Provide recommendations for policies and measures protecting the integrity of the
Natura 2000 network and promoting the adaptation of EU biodiversity to climatechange.
b. Assessing and mitigating impacts from marine, wind and hydro energyinfrastructures
Renewable energies are expected to become an ever increasing component of the energymix in the European Union. They contribute to energy security and at the same time areessential for the EU to meet its commitment to reduce greenhouse gas emissions by 20% by2020.
In order to promote the development and deployment of renewable energy generatingcapacity, the EU therefore adopted a new Renewable Energy Sources Directive (2009/28/EC) in 2009 as part of the overall EU Energy and Climate Package. The Directiverequires that, by the year 2020, 20% of the final total energy consumption in the EU‟s comefrom renewable sources (up from 8.5% by 2008). This effectively means that renewableenergy production will grow almost 2.5 fold by 2020.
While in a few European countries hydroelectric dams already provide a considerable portionof electricity, it is unavoidable that new infrastructures will need to be deployed across theEU member states for them to comply with the new mandatory targets. The renewableenergy sources that will contribute to meeting the 20% target are, in particular, onshore wind,
offshore wind, marine energy, photovoltaics, solar thermal, small and large hydro,geothermal and biomass.

8/12/2019 Study NATURA 2000 Si Energia Alternativa
http://slidepdf.com/reader/full/study-natura-2000-si-energia-alternativa 9/32
Summary Report
Introduction 5
Unfortunately, the environmental benefits of renewable energy come with a price: some ifnot many of the necessary infrastructures may pose an immediate risk to biodiversity;and conflicts with the objectives and management of individual Natura 2000 sites can beexpected. For example, the risks of intensification and expansion of agriculture associatedwith an increasing use of biomass (wood, feedstock crops) for providing electricity, heat andtransport fuels have been well documented and discussed in many recent assessments.
The present project reviewed impacts on biodiversity and the Natura 2000 network ofonshore and offshore wind farms, large hydro dams and infrastructures harnessingtidal and wave marine energy, including through a geospatial analysis. It also providedguidelines on how best to develop and implement a given project in order to minimise theseimpacts during the construction, operation and decommissioning of either of theseinfrastructures. Finally, it compared the environmental benefits and risks associatedwith the different technologies, which may guide further policies and investment.
8/12/2019 Study NATURA 2000 Si Energia Alternativa
http://slidepdf.com/reader/full/study-natura-2000-si-energia-alternativa 10/32
Impacts of climate change and renewable energy infrastructures on EU biodiversity and Natura 2000
Impacts of climate change on EU biodiversity: evidence and modelling results6
2. Impacts of climate change on EU biodiversity: evidence and modellingresults
Task 1 of this project took the form of a systematic review, synthesis and analysis of
published reports, information and data relating to the observed and projected impacts ofclimate change in Europe, with a particular focus on the species, habitats and ecosystemsin the EU 27 member states. The starting point was the IPCC‟s 4th Assessment Report,which provided a sound contextual setting and extensive reference lists. Additionally andsignificantly, members of the Project Team used wide-ranging knowledge and experience ofother relevant research programmes across Europe to feed into the study. Of particular notein this context was the EC-funded MACIS Project.
The review considered the impacts of climate change across the EU‟s terrestrial, freshwater,coastal and marine environments, focusing particularly on the nine biogeographic regionsand 23 „broad‟ habitat classes that characterise the Natura 2000 network.
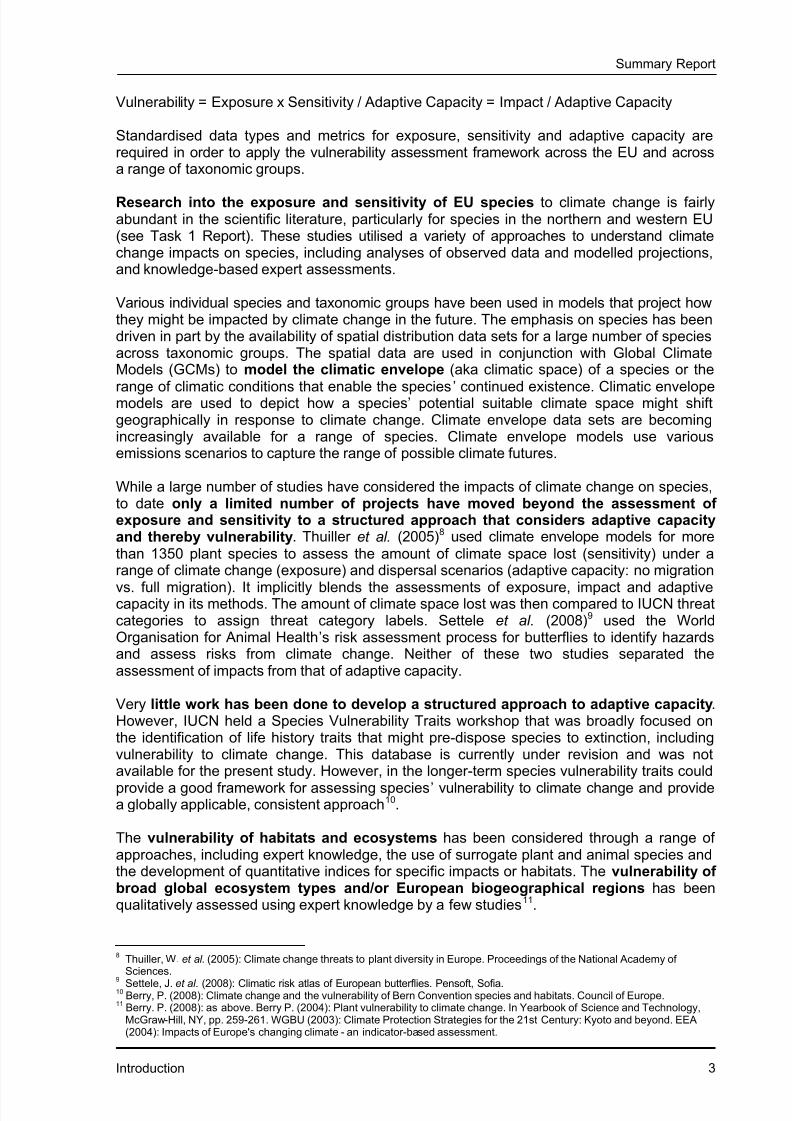
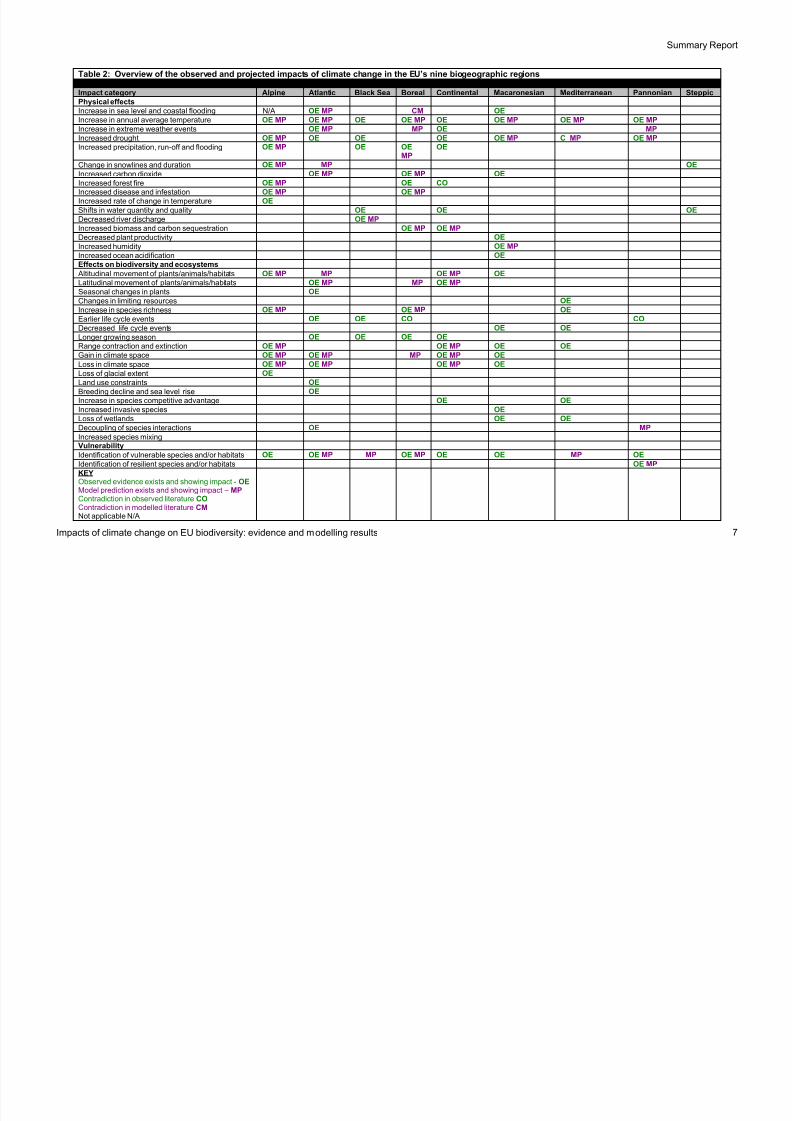
Table 2 provides an overview of the consequences of climate change recorded in the review.Evidence and modelled projections were found for the following key impacts on EUbiodiversity and the physical environment:
Species and ecosystem composition changes;
Range contraction and expansion;
Phenological changes;
Decoupling of events;
Land use constraints;
Sea-level rise;
Climate related stress and changes to disturbance regimes;
Hydrological and carbon sequestration changes.
Importantly, the quantity, quality and diversity of relevant data from across Europe werefound to be highly variable. A considerable amount of published material is available at arange of spatial and temporal scales and on a range of specific issues for some
biogeographic regions (e.g. Atlantic, Alpine, Boreal, and parts of the Continental region).
In contrast, comparatively little research and modelling results were available on climateimpacts from the Macaronesian and Mediterranean regions, and in particular from theeastern EU (esp. Black Sea, Pannonian and Steppic, but also Continental region).
Moreover, information was available only for a subset of the EU‟s species and habitats. Forthe majority, no data could be found on climate change impacts – notably for a significantproportion of species of Community Interest, which tend to be rarer and harder to study.
8/12/2019 Study NATURA 2000 Si Energia Alternativa
http://slidepdf.com/reader/full/study-natura-2000-si-energia-alternativa 11/32
Summary Report
Impacts of climate change on EU biodiversity: evidence and modelling results 7
Table 2: Overview of the observed and pro jected impacts of climate change in the EU’s nine biogeographic regions Biogeographic region
Impact category Alpine Atlantic Black Sea Boreal Continental Macaronesian Mediterranean Pannonian Steppic
Physical effects
Increase in sea level and coastal flooding N/A OE MP CM OE
Increase in annual average temperature OE MP OE MP OE OE MP OE OE MP OE MP OE MP
Increase in extreme weather events OE MP MP OE MP
Increased drought OE MP OE OE OE OE MP C MP OE MP
Increased precipitation, run-off and flooding OE MP OE OEMP
OE
Change in snowlines and duration OE MP MP OE
Increased carbon dioxide OE MP OE MP OE
Increased forest fire OE MP OE CO
Increased disease and infestation OE MP OE MP Increased rate of change in temperature OE
Shifts in water quantity and quality OE OE OE
Decreased river discharge OE MP
Increased biomass and carbon sequestration OE MP OE MP
Decreased plant productivity OE
Increased humidity OE MP
Increased ocean acidification OE
Effects on biodiversity and ecosystems
Altitudinal movement of plants/animals/habitats OE MP MP OE MP OE
Latitudinal movement of plants/animals/habitats OE MP MP OE MP Seasonal changes in plants OE
Changes in limiting resources OE Increase in species richness OE MP OE MP OE Earlier life cycle events OE OE CO CO
Decreased life cycle events OE OE
Longer growing season OE OE OE OE
Range contraction and extinction OE MP OE MP OE OE
Gain in climate space OE MP OE MP MP OE MP OE Loss in climate space OE MP OE MP OE MP OE Loss of glacial extent OE
Land use constraints OE
Breeding decline and sea level rise OE Increase in species competitive advantage OE OE
Increased invasive species OE Loss of wetlands OE OE
Decoupling of species interactions OE MP
Increased species mixingVulnerability
Identification of vulnerable species and/or habitats OE OE MP MP OE MP OE OE MP OE
Identification of resilient species and/or habitats OE MP
KEYObserved evidence exists and showing impact - OE Model prediction exists and showing impact – MP Contradiction in observed literature COContradiction in modelled literature CM Not applicable N/A
8/12/2019 Study NATURA 2000 Si Energia Alternativa
http://slidepdf.com/reader/full/study-natura-2000-si-energia-alternativa 12/32
Impacts of climate change and renewable energy infrastructures on EU biodiversity and Natura 2000
A framework for assessing the climate change vulnerability of European species: Methodology8
3. A framework for assessing the climate change vulnerability of Europeanspecies of fauna and flora: Methodology
One of the main objectives of the present project was to determine the vulnerability of the EU
species and habitats of Community Interest. The concurrent methodology was developedand described in Tasks 2a and 3a.
a. Background
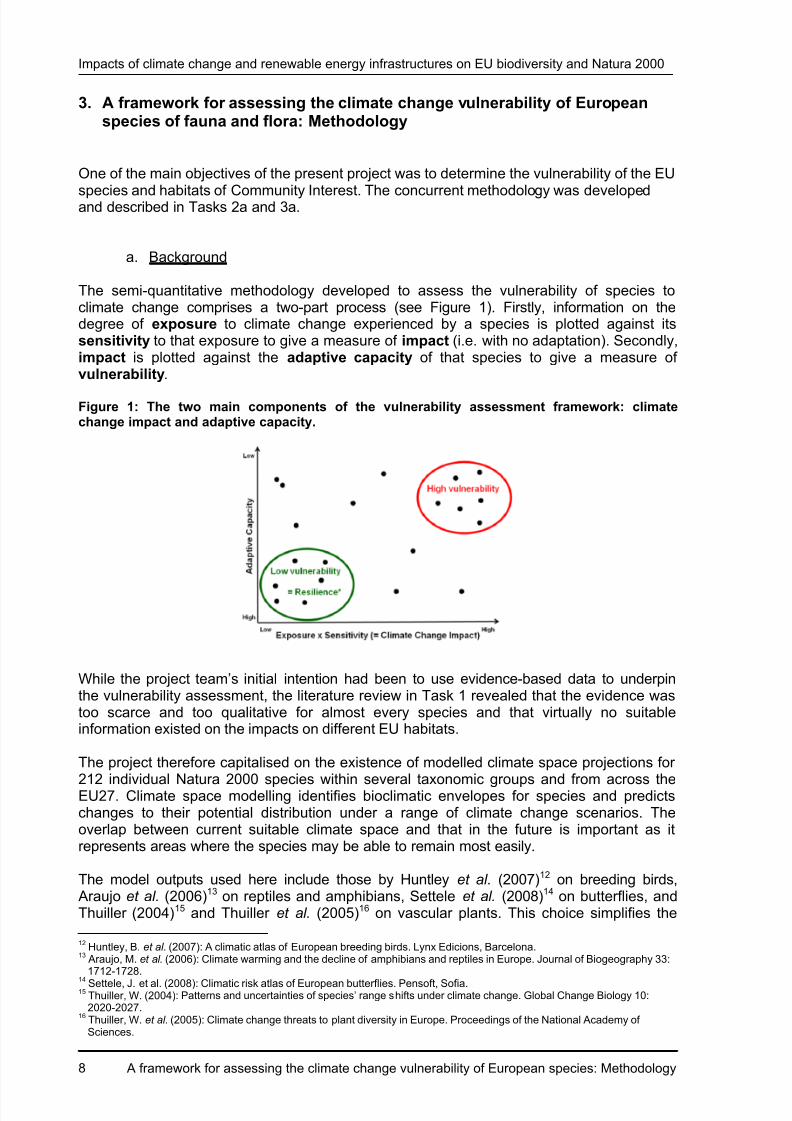
The semi-quantitative methodology developed to assess the vulnerability of species toclimate change comprises a two-part process (see Figure 1). Firstly, information on thedegree of exposure to climate change experienced by a species is plotted against itssensitivity to that exposure to give a measure of impact (i.e. with no adaptation). Secondly,impact is plotted against the adaptive capacity of that species to give a measure ofvulnerability.
Figure 1: The two main components of the vulnerability assessment framework: climatechange impact and adaptive capacity.
While the project team‟s initial intention had been to use evidence-based data to underpinthe vulnerability assessment, the literature review in Task 1 revealed that the evidence wastoo scarce and too qualitative for almost every species and that virtually no suitableinformation existed on the impacts on different EU habitats.
The project therefore capitalised on the existence of modelled climate space projections for
212 individual Natura 2000 species within several taxonomic groups and from across theEU27. Climate space modelling identifies bioclimatic envelopes for species and predictschanges to their potential distribution under a range of climate change scenarios. Theoverlap between current suitable climate space and that in the future is important as itrepresents areas where the species may be able to remain most easily.
The model outputs used here include those by Huntley et al. (2007)12 on breeding birds, Araujo et al. (2006)13 on reptiles and amphibians, Settele et al. (2008)14 on butterflies, andThuiller (2004)15 and Thuiller et al. (2005)16 on vascular plants. This choice simplifies the
12 Huntley, B. et al. (2007): A climatic atlas of European breeding birds. Lynx Edicions, Barcelona.
13 Araujo, M. et al. (2006): Climate warming and the decline of amphibians and reptiles in Europe. Journal of Biogeography 33:1712-1728.
14 Settele, J. et al. (2008): Climatic risk atlas of European butterflies. Pensoft, Sofia. 15
Thuiller, W. (2004): Patterns and uncertainties of species‟ range shifts under climate change. Global Change Biology 10:2020-2027.
16 Thuiller, W. et al. (2005): Climate change threats to plant diversity in Europe. Proceedings of the National Academy ofSciences.
8/12/2019 Study NATURA 2000 Si Energia Alternativa
http://slidepdf.com/reader/full/study-natura-2000-si-energia-alternativa 13/32
Summary Report
A framework for assessing the climate change vulnerability of European species: Methodology 9
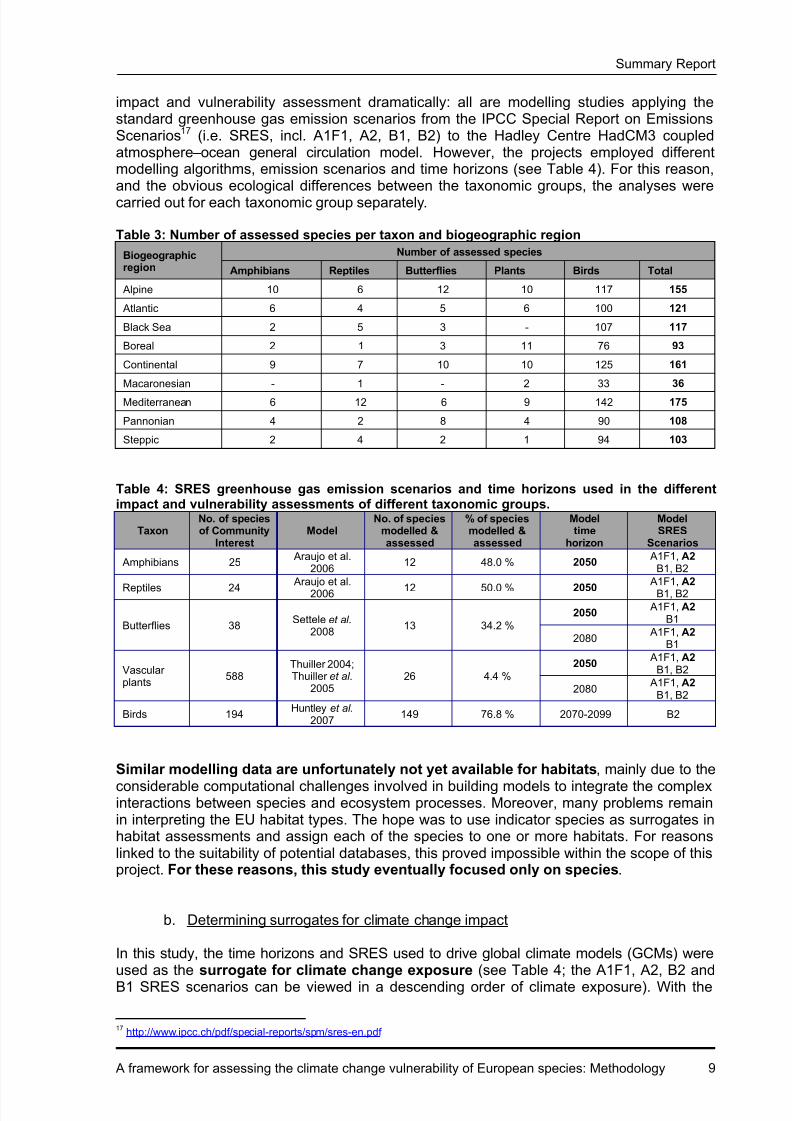
impact and vulnerability assessment dramatically: all are modelling studies applying thestandard greenhouse gas emission scenarios from the IPCC Special Report on EmissionsScenarios17 (i.e. SRES, incl. A1F1, A2, B1, B2) to the Hadley Centre HadCM3 coupledatmosphere –ocean general circulation model. However, the projects employed differentmodelling algorithms, emission scenarios and time horizons (see Table 4). For this reason,and the obvious ecological differences between the taxonomic groups, the analyses werecarried out for each taxonomic group separately.
Table 3: Number of assessed species per taxon and biogeographic region
Biogeographicregion
Number of assessed species
Amphibians Reptiles Butterflies Plants Birds Total
Alpine 10 6 12 10 117 155
Atlantic 6 4 5 6 100 121
Black Sea 2 5 3 - 107 117
Boreal 2 1 3 11 76 93
Continental 9 7 10 10 125 161
Macaronesian - 1 - 2 33 36
Mediterranean 6 12 6 9 142 175
Pannonian 4 2 8 4 90 108
Steppic 2 4 2 1 94 103
Table 4: SRES greenhouse gas emission scenarios and time horizons used in the differentimpact and vulnerability assessments of different taxonomic groups.
TaxonNo. of speciesof Community
InterestModel
No. of speciesmodelled &assessed
% of speciesmodelled &assessed
Modeltime
horizon
ModelSRES
Scenarios
Amphibians 25 Araujo et al.
200612 48.0 % 2050
A1F1, A2 B1, B2
Reptiles 24 Araujo et al.
2006 12 50.0 % 2050 A1F1, A2
B1, B2
Butterflies 38Settele et al .
200813 34.2 %
2050 A1F1, A2
B1
2080 A1F1, A2
B1
Vascularplants
588Thuiller 2004;Thuiller et al .
200526 4.4 %
2050 A1F1, A2
B1, B2
2080 A1F1, A2
B1, B2
Birds 194Huntley et al .
2007149 76.8 % 2070-2099 B2
Similar modelling data are unfortunately not yet available for habitats, mainly due to the
considerable computational challenges involved in building models to integrate the complexinteractions between species and ecosystem processes. Moreover, many problems remainin interpreting the EU habitat types. The hope was to use indicator species as surrogates inhabitat assessments and assign each of the species to one or more habitats. For reasonslinked to the suitability of potential databases, this proved impossible within the scope of thisproject. For these reasons, this study eventually focused only on species.
b. Determining surrogates for climate change impact
In this study, the time horizons and SRES used to drive global climate models (GCMs) wereused as the surrogate for climate change exposure (see Table 4; the A1F1, A2, B2 and
B1 SRES scenarios can be viewed in a descending order of climate exposure). With the
17 http://www.ipcc.ch/pdf/special-reports/spm/sres-en.pdf
8/12/2019 Study NATURA 2000 Si Energia Alternativa
http://slidepdf.com/reader/full/study-natura-2000-si-energia-alternativa 14/32
Impacts of climate change and renewable energy infrastructures on EU biodiversity and Natura 2000
A framework for assessing the climate change vulnerability of European species: Methodology10
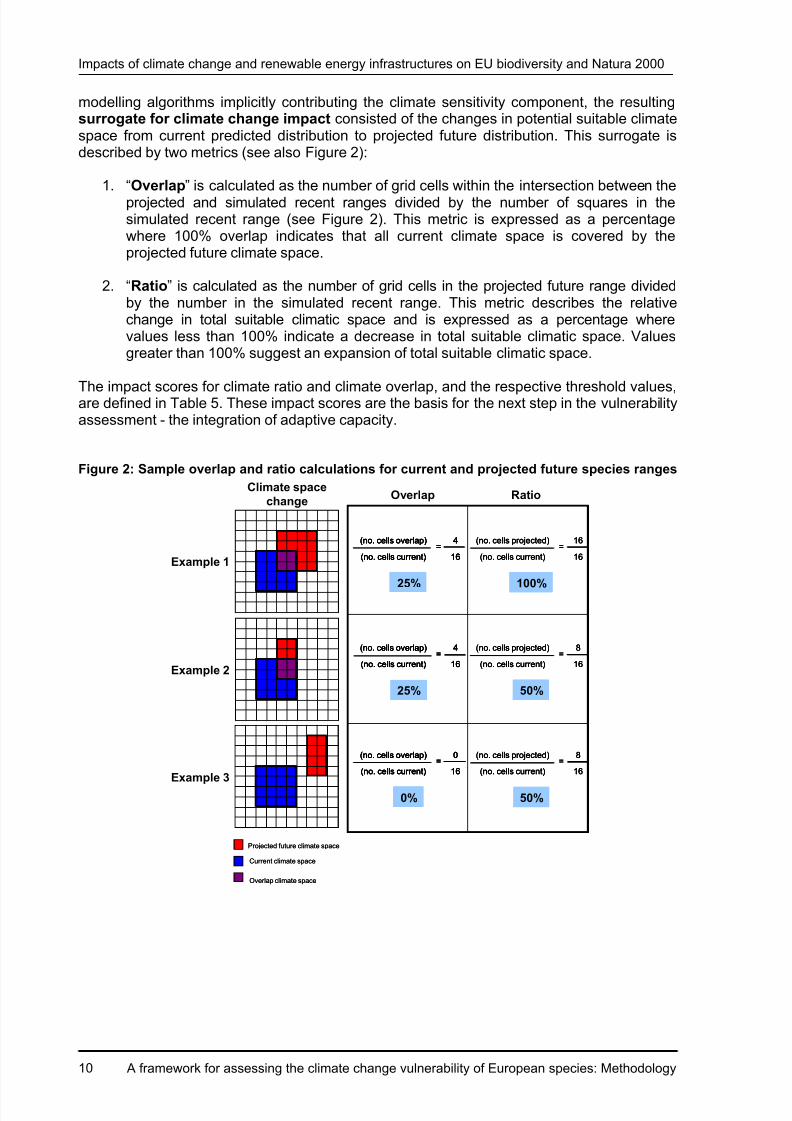
modelling algorithms implicitly contributing the climate sensitivity component, the resultingsurrogate for climate change impact consisted of the changes in potential suitable climatespace from current predicted distribution to projected future distribution. This surrogate isdescribed by two metrics (see also Figure 2):
1. “Overlap” is calculated as the number of grid cells within the intersection between theprojected and simulated recent ranges divided by the number of squares in thesimulated recent range (see Figure 2). This metric is expressed as a percentagewhere 100% overlap indicates that all current climate space is covered by theprojected future climate space.
2. “Ratio” is calculated as the number of grid cells in the projected future range dividedby the number in the simulated recent range. This metric describes the relativechange in total suitable climatic space and is expressed as a percentage wherevalues less than 100% indicate a decrease in total suitable climatic space. Valuesgreater than 100% suggest an expansion of total suitable climatic space.
The impact scores for climate ratio and climate overlap, and the respective threshold values,are defined in Table 5. These impact scores are the basis for the next step in the vulnerabilityassessment - the integration of adaptive capacity.
Figure 2: Sample overlap and ratio calculations for current and projected future species ranges
Projected future climate space
Current climate space
Overlap climate space
Projected future climate space
Current climate space
Overlap climate space
Example 1
Climate space
change
Example 2
Example 3
Overlap Ratio
25%
(no. cells overlap)
(no. cells current)
4
16
=
25%
(no. cells overlap)
(no. cells current)
4
16
=(no. cells overlap)
(no. cells current)
(no. cells overlap)
(no. cells current)
4
16
=4
16
=
25%
(no. cells overlap)
(no. cells current)
4
16
=
25%
(no. cells overlap)
(no. cells current)
4
16
=(no. cells overlap)
(no. cells current)
(no. cells overlap)
(no. cells current)
4
16
=4
16
=
0%
(no. cells overlap)
(no. cells current)
0
16
=
0%
(no. cells overlap)
(no. cells current)
0
16
=(no. cells overlap)
(no. cells current)
(no. cells overlap)
(no. cells current)
0
16
=0
16
=
100%
(no. cells projected)
(no. cells current)
16
16
=
100%
(no. cells projected)
(no. cells current)
(no. cells projected)
(no. cells current)
16
16
=16
16
=
50%
(no. cells projected)
(no. cells current)
8
16
=
50%
(no. cells projected)
(no. cells current)
(no. cells projected)
(no. cells current)
8
16
=8
16
=
50%
(no. cells projected)
(no. cells current)
8
16
=
50%
(no. cells projected)
(no. cells current)
(no. cells projected)
(no. cells current)
8
16
=8
16
=
8/12/2019 Study NATURA 2000 Si Energia Alternativa
http://slidepdf.com/reader/full/study-natura-2000-si-energia-alternativa 15/32
Summary Report
A framework for assessing the climate change vulnerability of European species: Methodology 11
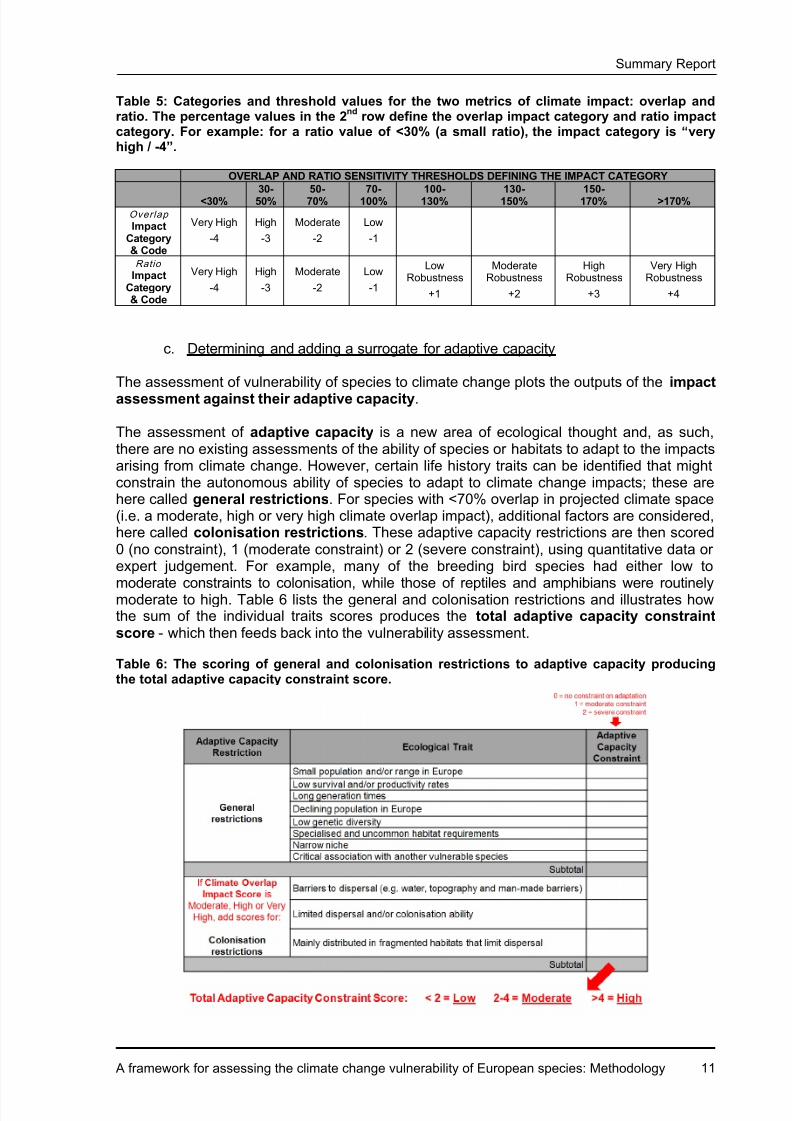
Table 5: Categories and threshold values for the two metrics of climate impact: overlap andratio. The percentage values in the 2
nd row define the overlap impact category and ratio impact
category. For example: for a ratio value of <30% (a small ratio), the impact category is “veryhigh / -4”.
OVERLAP AND RATIO SENSITIVITY THRESHOLDS DEFINING THE IMPACT CATEGORY
<30%30-50%
50-70%
70-100%
100-130%
130-150%
150-170% >170%
Overlap
ImpactCategory& Code
Very High
-4
High
-3
Moderate
-2
Low
-1
Ratio Impact
Category& Code
Very High
-4
High
-3
Moderate
-2
Low
-1
LowRobustness
+1
ModerateRobustness
+2
HighRobustness
+3
Very HighRobustness
+4
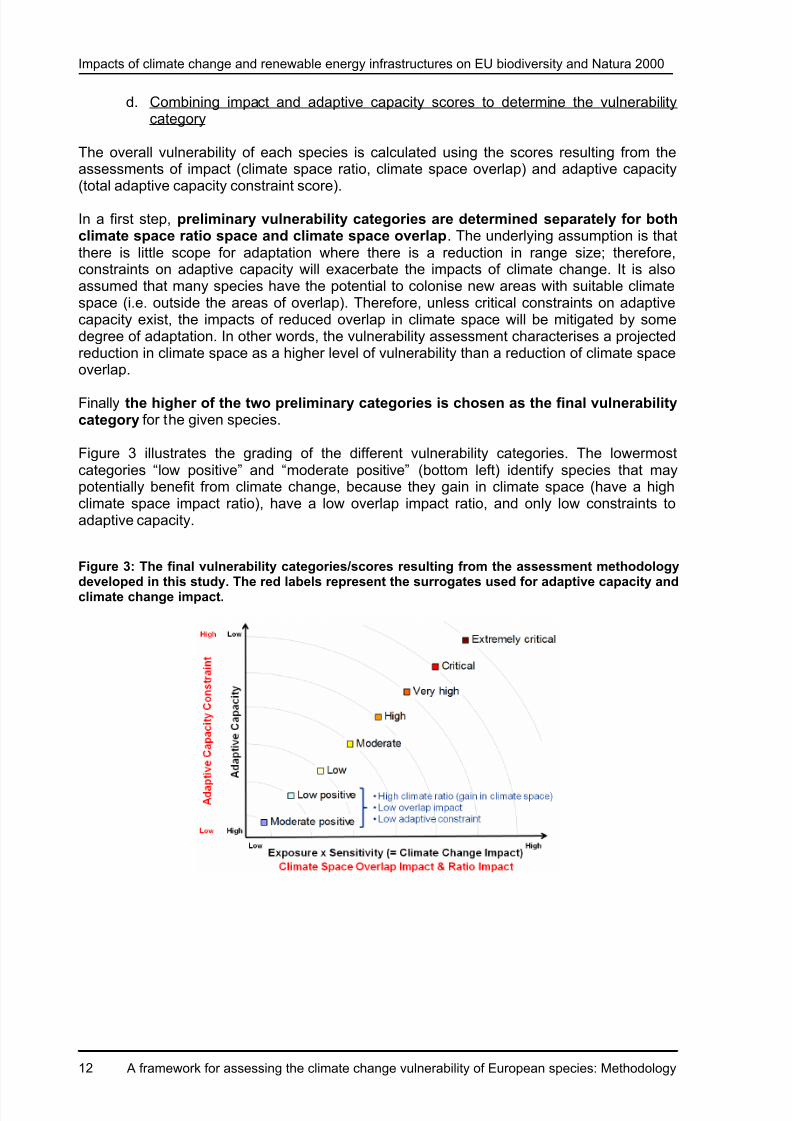
c. Determining and adding a surrogate for adaptive capacity
The assessment of vulnerability of species to climate change plots the outputs of the impactassessment against their adaptive capacity.
The assessment of adaptive capacity is a new area of ecological thought and, as such,there are no existing assessments of the ability of species or habitats to adapt to the impactsarising from climate change. However, certain life history traits can be identified that mightconstrain the autonomous ability of species to adapt to climate change impacts; these arehere called general restrictions. For species with <70% overlap in projected climate space(i.e. a moderate, high or very high climate overlap impact), additional factors are considered,here called colonisation restrictions. These adaptive capacity restrictions are then scored0 (no constraint), 1 (moderate constraint) or 2 (severe constraint), using quantitative data orexpert judgement. For example, many of the breeding bird species had either low to
moderate constraints to colonisation, while those of reptiles and amphibians were routinelymoderate to high. Table 6 lists the general and colonisation restrictions and illustrates howthe sum of the individual traits scores produces the total adaptive capacity constraintscore - which then feeds back into the vulnerability assessment.
Table 6: The scoring of general and colonisation restrictions to adaptive capacity producingthe total adaptive capacity constraint score.
8/12/2019 Study NATURA 2000 Si Energia Alternativa
http://slidepdf.com/reader/full/study-natura-2000-si-energia-alternativa 16/32
Impacts of climate change and renewable energy infrastructures on EU biodiversity and Natura 2000
A framework for assessing the climate change vulnerability of European species: Methodology12
d. Combining impact and adaptive capacity scores to determine the vulnerabilitycategory
The overall vulnerability of each species is calculated using the scores resulting from theassessments of impact (climate space ratio, climate space overlap) and adaptive capacity(total adaptive capacity constraint score).
In a first step, preliminary vulnerability categories are determined separately for bothclimate space ratio space and climate space overlap. The underlying assumption is thatthere is little scope for adaptation where there is a reduction in range size; therefore,constraints on adaptive capacity will exacerbate the impacts of climate change. It is alsoassumed that many species have the potential to colonise new areas with suitable climatespace (i.e. outside the areas of overlap). Therefore, unless critical constraints on adaptivecapacity exist, the impacts of reduced overlap in climate space will be mitigated by somedegree of adaptation. In other words, the vulnerability assessment characterises a projectedreduction in climate space as a higher level of vulnerability than a reduction of climate spaceoverlap.
Finally the higher of the two preliminary categories is chosen as the final vulnerabilitycategory for the given species.
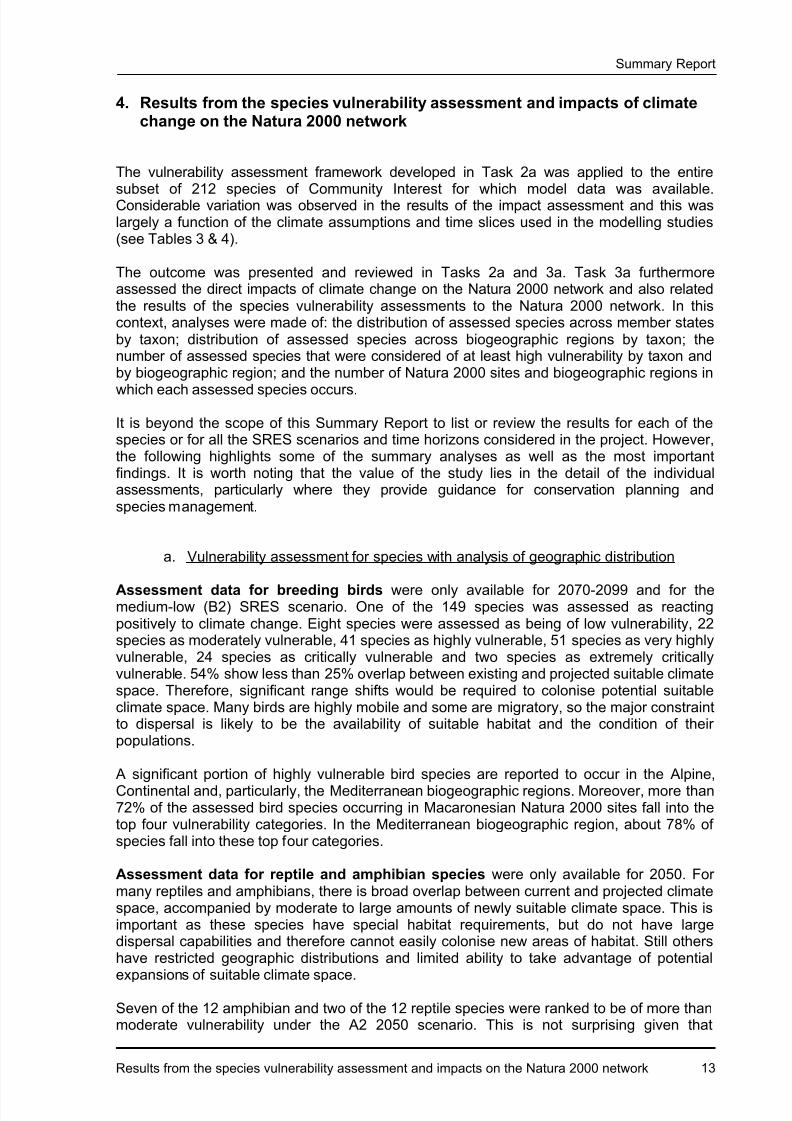
Figure 3 illustrates the grading of the different vulnerability categories. The lowermostcategories “low positive” and “moderate positive” (bottom left) identify species that maypotentially benefit from climate change, because they gain in climate space (have a highclimate space impact ratio), have a low overlap impact ratio, and only low constraints toadaptive capacity.
Figure 3: The final vulnerability categories/scores resulting from the assessment methodologydeveloped in this study. The red labels represent the surrogates used for adaptive capacity andclimate change impact.
8/12/2019 Study NATURA 2000 Si Energia Alternativa
http://slidepdf.com/reader/full/study-natura-2000-si-energia-alternativa 17/32
Summary Report
Results from the species vulnerability assessment and impacts on the Natura 2000 network 13
4. Results from the species vulnerability assessment and impacts of climatechange on the Natura 2000 network
The vulnerability assessment framework developed in Task 2a was applied to the entire
subset of 212 species of Community Interest for which model data was available.Considerable variation was observed in the results of the impact assessment and this waslargely a function of the climate assumptions and time slices used in the modelling studies(see Tables 3 & 4).
The outcome was presented and reviewed in Tasks 2a and 3a. Task 3a furthermoreassessed the direct impacts of climate change on the Natura 2000 network and also relatedthe results of the species vulnerability assessments to the Natura 2000 network. In thiscontext, analyses were made of: the distribution of assessed species across member statesby taxon; distribution of assessed species across biogeographic regions by taxon; thenumber of assessed species that were considered of at least high vulnerability by taxon andby biogeographic region; and the number of Natura 2000 sites and biogeographic regions in
which each assessed species occurs.
It is beyond the scope of this Summary Report to list or review the results for each of thespecies or for all the SRES scenarios and time horizons considered in the project. However,the following highlights some of the summary analyses as well as the most importantfindings. It is worth noting that the value of the study lies in the detail of the individualassessments, particularly where they provide guidance for conservation planning andspecies management.
a. Vulnerability assessment for species with analysis of geographic distribution
Assessment data for breeding birds were only available for 2070-2099 and for themedium-low (B2) SRES scenario. One of the 149 species was assessed as reactingpositively to climate change. Eight species were assessed as being of low vulnerability, 22species as moderately vulnerable, 41 species as highly vulnerable, 51 species as very highlyvulnerable, 24 species as critically vulnerable and two species as extremely criticallyvulnerable. 54% show less than 25% overlap between existing and projected suitable climatespace. Therefore, significant range shifts would be required to colonise potential suitableclimate space. Many birds are highly mobile and some are migratory, so the major constraintto dispersal is likely to be the availability of suitable habitat and the condition of theirpopulations.
A significant portion of highly vulnerable bird species are reported to occur in the Alpine,
Continental and, particularly, the Mediterranean biogeographic regions. Moreover, more than72% of the assessed bird species occurring in Macaronesian Natura 2000 sites fall into thetop four vulnerability categories. In the Mediterranean biogeographic region, about 78% ofspecies fall into these top four categories.
Assessment data for reptile and amphibian species were only available for 2050. Formany reptiles and amphibians, there is broad overlap between current and projected climatespace, accompanied by moderate to large amounts of newly suitable climate space. This isimportant as these species have special habitat requirements, but do not have largedispersal capabilities and therefore cannot easily colonise new areas of habitat. Still othershave restricted geographic distributions and limited ability to take advantage of potential
expansions of suitable climate space.
Seven of the 12 amphibian and two of the 12 reptile species were ranked to be of more thanmoderate vulnerability under the A2 2050 scenario. This is not surprising given that
8/12/2019 Study NATURA 2000 Si Energia Alternativa
http://slidepdf.com/reader/full/study-natura-2000-si-energia-alternativa 18/32
Impacts of climate change and renewable energy infrastructures on EU biodiversity and Natura 2000
Results from the species vulnerability assessment and impacts on the Natura 2000 network14
amphibian species are strongly associated with and depend on water and wetland habitatsand react more strongly to climate change than other taxa.
The largest number of assessed amphibian species occurs in the Natura 2000 sites of Italy.Those considered of high or very high vulnerability occur in Natura 2000 sites of the Alpine, Atlantic, Continental and Mediterranean biogeographic regions; five of the 10 speciesassessed for the Alpine biogeographic region belong to these two categories.
The largest number of assessed reptile species occurs in the Natura 2000 sites of Greeceand Italy. All of the 12 assessed reptile species occur in the Natura 2000 sites of theMediterranean biogeographic region, while only one occurs in the Boreal and Macaronesianregions.
Assessment data for butterflies were available for both the 2050s and 2080s. Small butnoticeable trends were observed between the low (B1) and high (A1F1) SRES scenarios forboth time horizons. Trends for butterflies are similar to other taxa modelled to 2050, wherethe majority exhibit low or moderate vulnerability to climate change. By 2080, increasing
numbers of species exhibit a high to critical vulnerability.
Of the 13 assessed butterfly species, 12 occur in Natura 2000 sites of the Alpinebiogeographic region, 10 in the Continental region and eight in the Pannonian region. Thethree biogeographic regions also host the largest number of species assessed as of highvulnerability, very high vulnerability or critical vulnerability.
Assessment data for vascular plants were available for both the 2050s and 2080s. Smallbut noticeable trends were observed from the medium-low (B2) to high (A1F1) SRESscenarios for both time horizons. Again, these trends were similar to other taxa modelled to2050, with the majority showing low vulnerability to climate change; however, trends by 2080shift towards moderate to high vulnerability. At the same time, many species exhibited small
to moderate declines in overlap between existing and projected suitable climate space and,in some instances, significant increases in overall suitable climate space. Notably, thevulnerability assessments for plants did not show a large number of highly vulnerablespecies.
The largest number of assessed plant species were from Natura 2000 sites in Sweden(Boreal biogeographic region, 11 species), followed by Spain, Italy and France with sixspecies each. Species assessed as more than moderately vulnerable in the period to 2050occur only in Hungary, Romania, Slovakia and Sweden.
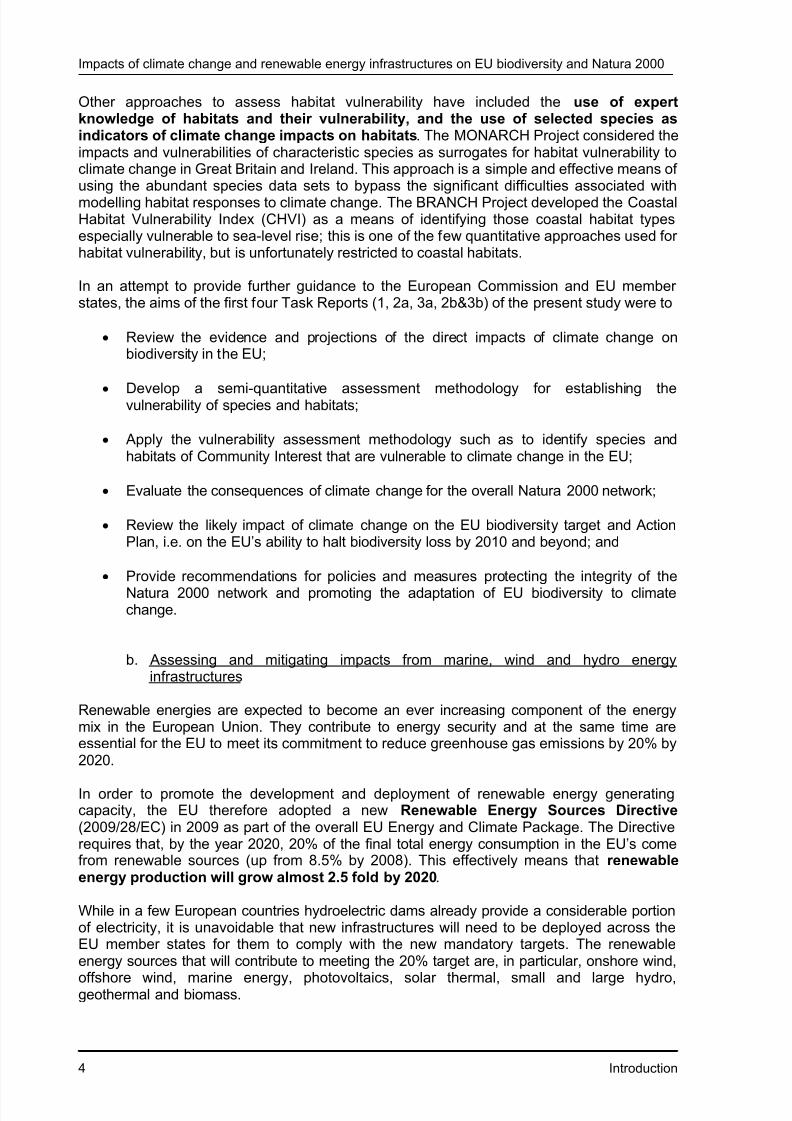
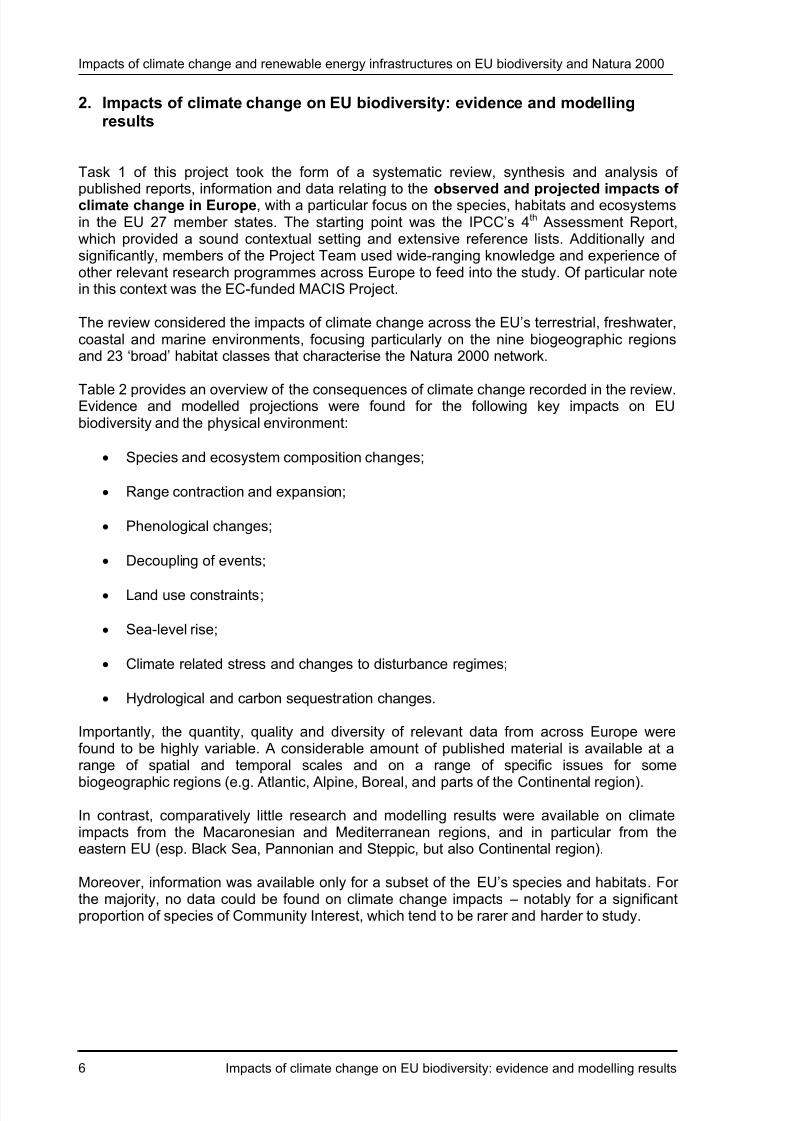
To provide an exemplary overview, Figure 4 brings together the respective vulnerabilityassessments for the A2 2050 scenario, which was shared by all taxonomic groups with the
exception of birds (B2 2070-2099). Figure 5 gives a regional analysis for the pool ofamphibian, reptile, butterfly and plant species assessed under the A2 2050 scenario. Itshows that Natura 2000 sites in the Alpine, Continental, Mediterranean and Pannonianbiogeographic regions host the greatest proportion of species considered to be more thanmoderately vulnerable – they are also the biogeographic regions in which the largestnumbers of assessed species are reported to occur (Macaronesia is notably under-represented).
8/12/2019 Study NATURA 2000 Si Energia Alternativa
http://slidepdf.com/reader/full/study-natura-2000-si-energia-alternativa 19/32
Summary Report
Results from the species vulnerability assessment and impacts on the Natura 2000 network 15
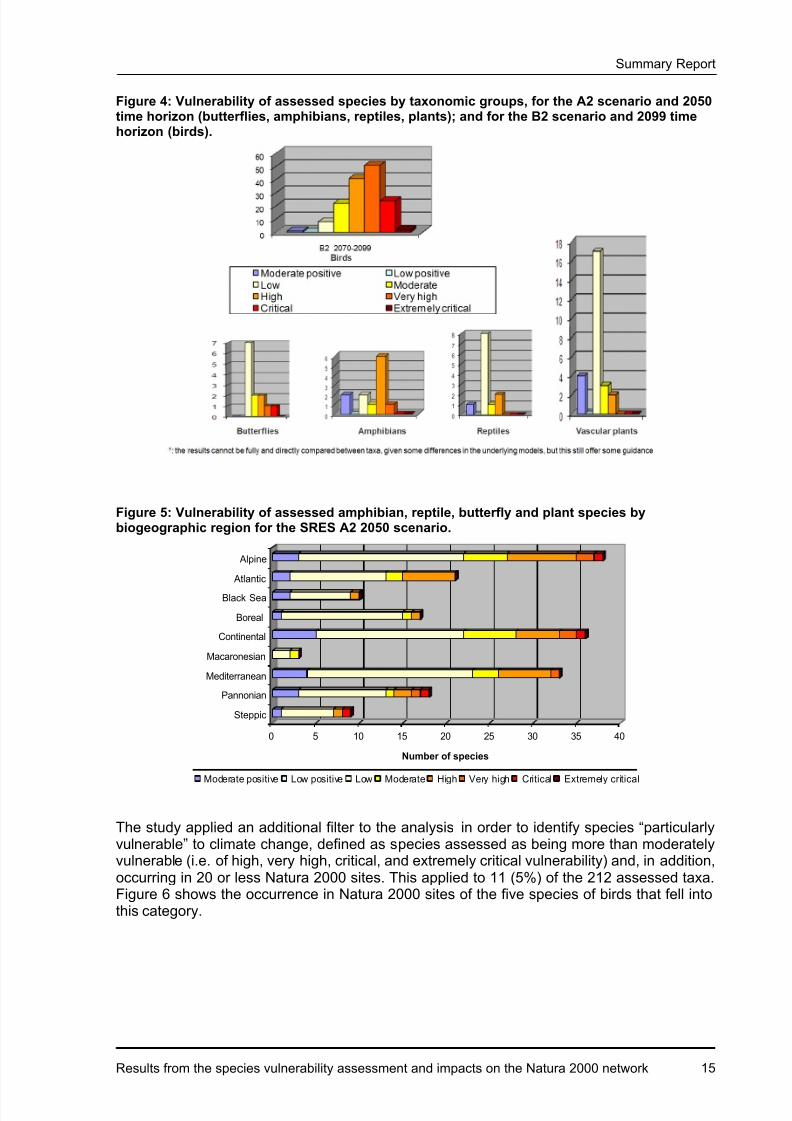
Figure 4: Vulnerability of assessed species by taxonomic groups, for the A2 scenario and 2050time horizon (butterflies, amphibians, reptiles, plants); and for the B2 scenario and 2099 timehorizon (birds).
Figure 5: Vulnerability of assessed amphibian, reptile, butterfly and plant species bybiogeographic region for the SRES A2 2050 scenario.
0 5 10 15 20 25 30 35 40
Number of species
Alpine
Atlantic
Black Sea
Boreal
Continental
Macaronesian
Mediterranean
Pannonian
Steppic
Moderate positive Low positive Low Moderate High Very high Critical Extremely critical
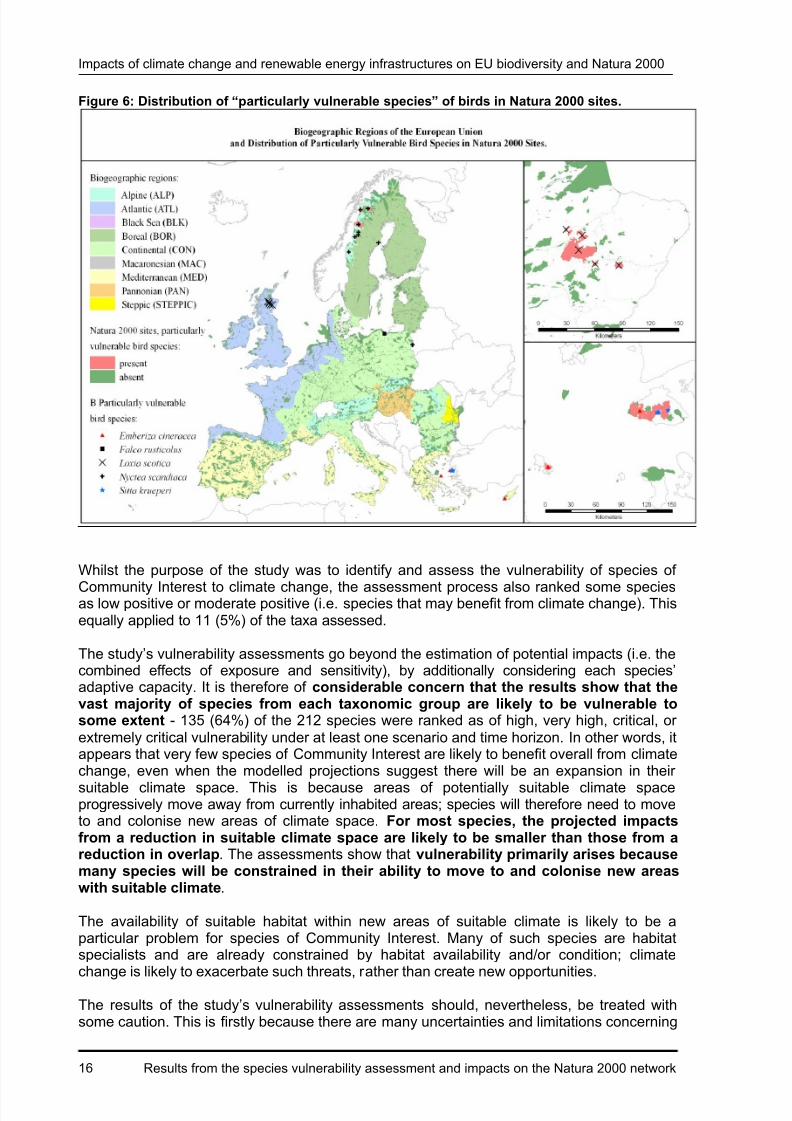
The study applied an additional filter to the analysis in order to identify species “particularlyvulnerable” to climate change, defined as species assessed as being more than moderatelyvulnerable (i.e. of high, very high, critical, and extremely critical vulnerability) and, in addition,occurring in 20 or less Natura 2000 sites. This applied to 11 (5%) of the 212 assessed taxa.Figure 6 shows the occurrence in Natura 2000 sites of the five species of birds that fell intothis category.
8/12/2019 Study NATURA 2000 Si Energia Alternativa
http://slidepdf.com/reader/full/study-natura-2000-si-energia-alternativa 20/32
Impacts of climate change and renewable energy infrastructures on EU biodiversity and Natura 2000
Results from the species vulnerability assessment and impacts on the Natura 2000 network16
Figure 6: Distribution of “particularly vulnerable species” of birds in Natura 2000 sites.
Whilst the purpose of the study was to identify and assess the vulnerability of species of
Community Interest to climate change, the assessment process also ranked some speciesas low positive or moderate positive (i.e. species that may benefit from climate change). Thisequally applied to 11 (5%) of the taxa assessed.
The study‟s vulnerability assessments go beyond the estimation of potential impacts (i.e. thecombined effects of exposure and sensitivity), by additionally considering each species‟adaptive capacity. It is therefore of considerable concern that the results show that thevast majority of species from each taxonomic group are likely to be vulnerable tosome extent - 135 (64%) of the 212 species were ranked as of high, very high, critical, orextremely critical vulnerability under at least one scenario and time horizon. In other words, itappears that very few species of Community Interest are likely to benefit overall from climatechange, even when the modelled projections suggest there will be an expansion in their
suitable climate space. This is because areas of potentially suitable climate spaceprogressively move away from currently inhabited areas; species will therefore need to moveto and colonise new areas of climate space. For most species, the projected impactsfrom a reduction in suitable climate space are likely to be smaller than those from areduction in overlap. The assessments show that vulnerability primarily arises becausemany species will be constrained in their ability to move to and colonise new areaswith suitable climate.
The availability of suitable habitat within new areas of suitable climate is likely to be aparticular problem for species of Community Interest. Many of such species are habitatspecialists and are already constrained by habitat availability and/or condition; climatechange is likely to exacerbate such threats, rather than create new opportunities.
The results of the study‟s vulnerability assessments should, nevertheless, be treated withsome caution. This is firstly because there are many uncertainties and limitations concerning
8/12/2019 Study NATURA 2000 Si Energia Alternativa
http://slidepdf.com/reader/full/study-natura-2000-si-energia-alternativa 21/32
Summary Report
Results from the species vulnerability assessment and impacts on the Natura 2000 network 17
the use of climate models in projecting impacts on biodiversity. Given that ecologicalconstraints and limiting factors are prone to be species-specific, modelling and the underlyingstandardised climate variables can only provide an approximation to real impact experiencedby a particular species or habitat. Secondly, and more importantly, the vulnerabilityassessments are of a preliminary nature as they essentially relied on an expert-basedsubjective assessment of adaptation constraints.
b. Temperature increases due to climate change in Natura 2000 sites and network
To evaluate the impact of climate change on the network of Natura 2000 sites, the projectran model simulations for annual average surface temperature in the EU under differentscenarios and for different time horizons, which were then overlaid with spatial data for theNatura 2000 network.
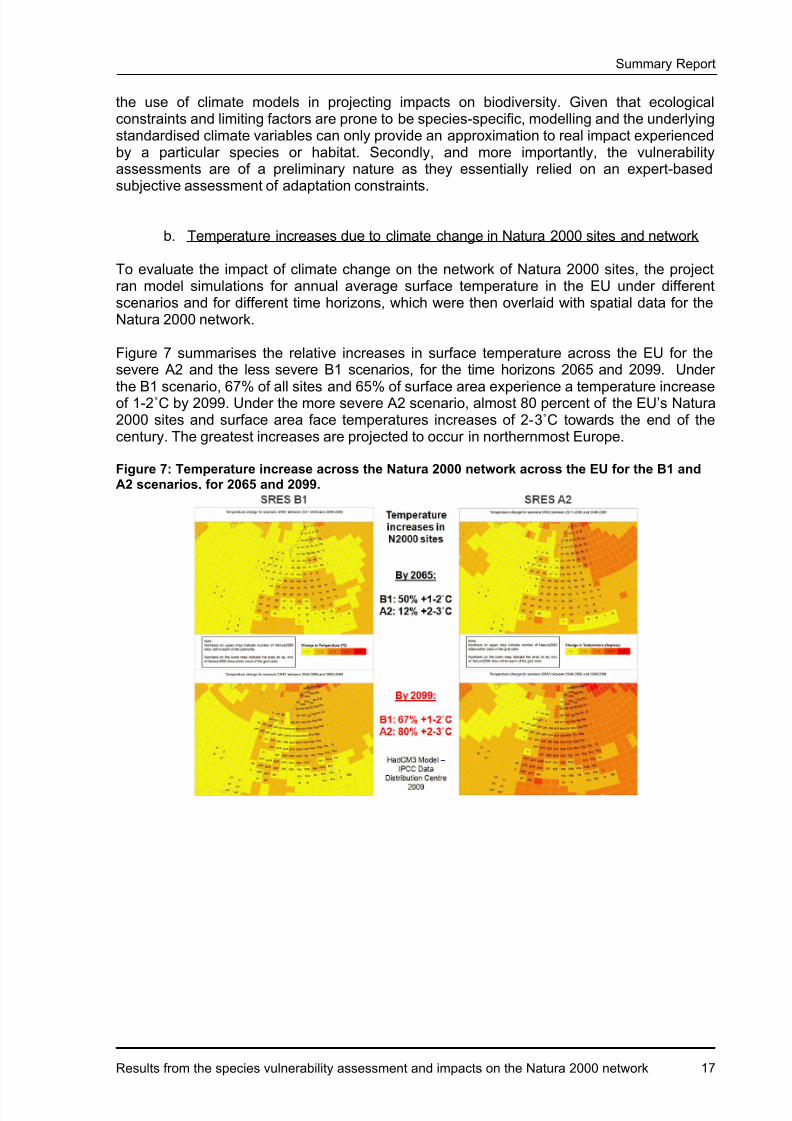
Figure 7 summarises the relative increases in surface temperature across the EU for thesevere A2 and the less severe B1 scenarios, for the time horizons 2065 and 2099. Under
the B1 scenario, 67% of all sites and 65% of surface area experience a temperature increaseof 1-2˚C by 2099. Under the more severe A2 scenario, almost 80 percent of the EU‟s Natura2000 sites and surface area face temperatures increases of 2-3˚C towards the end of thecentury. The greatest increases are projected to occur in northernmost Europe.
Figure 7: Temperature increase across the Natura 2000 network across the EU for the B1 andA2 scenarios, for 2065 and 2099.
8/12/2019 Study NATURA 2000 Si Energia Alternativa
http://slidepdf.com/reader/full/study-natura-2000-si-energia-alternativa 22/32
Impacts of climate change and renewable energy infrastructures on EU biodiversity and Natura 2000
Renewable energy infrastructures in the EU: biodiversity impacts and impact mitigation18
5. Wind, hydro and marine renewable energy infrastructures in the EU: anassessment of biodiversity impacts and suggestions for impact mitigation
Task 4 of the study conducted a biodiversity impact assessment for various existing and
prospective new renewable energy infrastructure types in the EU, focusing on onshore andoffshore wind farms, large hydro-energy dams, and marine energy – especially tidalbarrages. It reviewed the impacts of the construction, operation and decommissioningphases, and provided guidance as to how best avoid or mitigate the effects identified in boththe technical and the policy sense. The study also conducted a spatially explicit analysis ofthe placement of these renewable energy infrastructures in relation to the Natura 2000network. The study concluded with a summary expert comparison of the degree of impactsby infrastructure type and the mitigation options.
The biodiversity impacts of onshore and offshore wind farms can be summarised asfollows:
Footprint of turbines, cabling, roads and infrastructure – impacts on natural habitats;
Noise of construction and decommissioning and disturbance by human presence – leading to avoidance behaviour and direct damage (e.g. on marine mammal auditorysystems) potentially leading to displacement and death;
Collision with operating infrastructure – found to occur in birds and bats;
Disturbance from operating infrastructure – barrier effects leading to avoidancebehaviour during foraging bouts and migration (e.g. birds, bats), up to fulldisplacement (e.g. offshore wind farms may have above and below water effects(including electromagnetic effects), affecting the breeding and foraging of seabirds,
fish, marine mammals, etc.);
Operating infrastructures, especially in offshore settings, may also offer newsubstrates to establish new communities, including invasive alien species, leading toartificial reef effects with unknown consequences for recruitment, harvesting andpredation.
Opportunities to mitigate the negative impacts of onshore and offshore wind farms largelyarise during the planning and design stages. The correct choice of turbine location isparamount, wherefore biodiversity should be given full consideration in Environmental Impactand Strategic Environmental Assessments. The exact design of turbines (turbine size, height,
spacing, lighting and visibility) can be equally important. The timing of construction,maintenance and decommissioning activities also provides opportunities to reduce negativeimpacts on biodiversity.
While important local impacts on birds and bats have been demonstrated in a number of ill-placed wind farms, the study concludes that the overall impact of wind energy infrastructureson EU species and habitats has been rather limited, especially if one considers the hugegenerating capacity already installed.
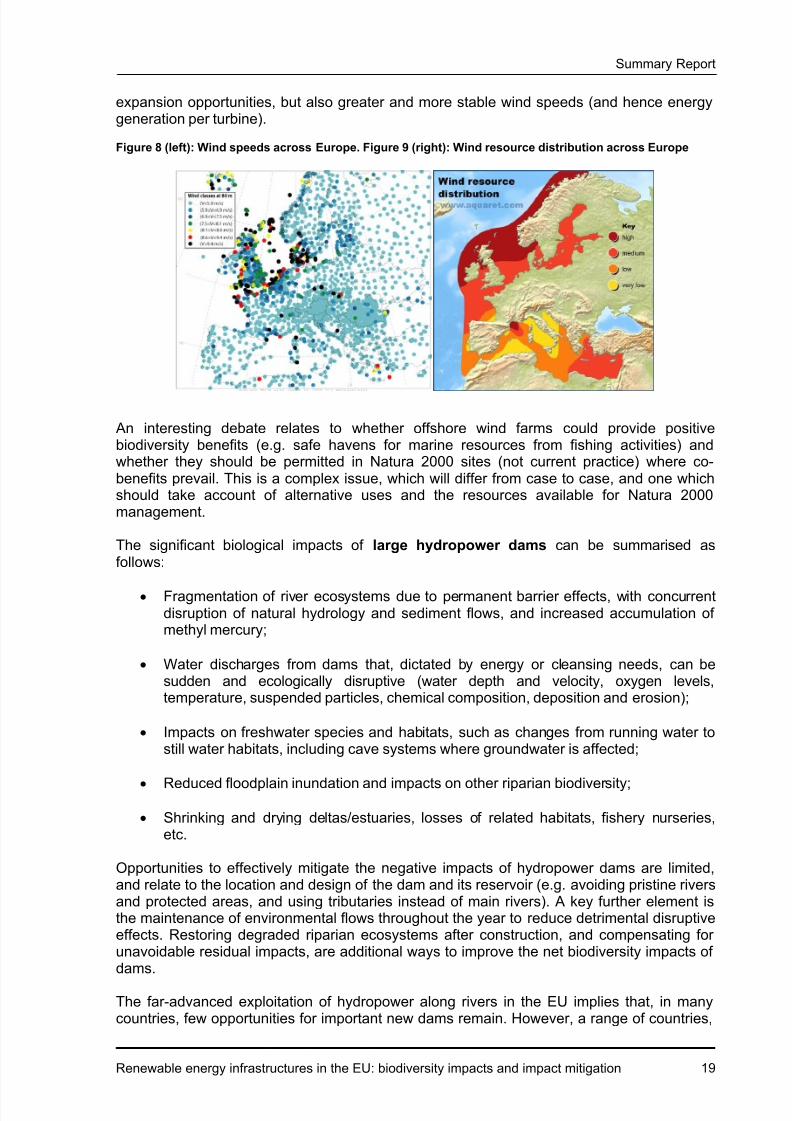
Figures 8 and 9 show the distribution of wind energy resources across EU land and seaareas. The greatest wind energy potential lies in north-western Europe. In some of thesecountries (e.g. Germany) locations suitable for onshore wind farms have already been largely
exploited. The biggest opportunities for additional wind power are located in the UnitedKingdom, Belgium and parts of Italy and Greece (onshore), along the coasts of the EnglishChannel, the Atlantic, the Baltic region and southern France, particularly around the Rhonedelta, and in large areas in the North Sea (offshore). Offshore locations offer not only greater
8/12/2019 Study NATURA 2000 Si Energia Alternativa
http://slidepdf.com/reader/full/study-natura-2000-si-energia-alternativa 23/32
Summary Report
Renewable energy infrastructures in the EU: biodiversity impacts and impact mitigation 19
expansion opportunities, but also greater and more stable wind speeds (and hence energygeneration per turbine).
Figure 8 (left): Wind speeds across Europe. Figure 9 (right): Wind resource distribution across Europe
An interesting debate relates to whether offshore wind farms could provide positivebiodiversity benefits (e.g. safe havens for marine resources from fishing activities) andwhether they should be permitted in Natura 2000 sites (not current practice) where co-benefits prevail. This is a complex issue, which will differ from case to case, and one whichshould take account of alternative uses and the resources available for Natura 2000management.
The significant biological impacts of large hydropower dams can be summarised asfollows:
Fragmentation of river ecosystems due to permanent barrier effects, with concurrentdisruption of natural hydrology and sediment flows, and increased accumulation ofmethyl mercury;
Water discharges from dams that, dictated by energy or cleansing needs, can besudden and ecologically disruptive (water depth and velocity, oxygen levels,temperature, suspended particles, chemical composition, deposition and erosion);
Impacts on freshwater species and habitats, such as changes from running water tostill water habitats, including cave systems where groundwater is affected;
Reduced floodplain inundation and impacts on other riparian biodiversity;
Shrinking and drying deltas/estuaries, losses of related habitats, fishery nurseries,etc.
Opportunities to effectively mitigate the negative impacts of hydropower dams are limited,and relate to the location and design of the dam and its reservoir (e.g. avoiding pristine riversand protected areas, and using tributaries instead of main rivers). A key further element isthe maintenance of environmental flows throughout the year to reduce detrimental disruptiveeffects. Restoring degraded riparian ecosystems after construction, and compensating forunavoidable residual impacts, are additional ways to improve the net biodiversity impacts ofdams.
The far-advanced exploitation of hydropower along rivers in the EU implies that, in manycountries, few opportunities for important new dams remain. However, a range of countries,
8/12/2019 Study NATURA 2000 Si Energia Alternativa
http://slidepdf.com/reader/full/study-natura-2000-si-energia-alternativa 24/32
Impacts of climate change and renewable energy infrastructures on EU biodiversity and Natura 2000
Renewable energy infrastructures in the EU: biodiversity impacts and impact mitigation20
especially in eastern and south-eastern Europe, have plans to increase their hydropowercapacity, putting in jeopardy some of the most pristine rivers. In addition, numerous sitesacross the EU may be suitable for the development of additional small hydropower, thecumulative impacts of which should undergo careful scrutiny (outside the scope of thisstudy).
In the context of hydropower dams, aspects that require further study and consideration are:
The degree to which methane emissions from the reservoir surface and, especially,through anaerobic deepwater discharges in the turbines undermine the achievementof greenhouse targets – one of the key drivers behind the continuing promotion ofhydropower dams (recent research has shown this factor could have been ignored orsignificantly underestimated);
The degree to which the plethora of out-dated smaller-scale hydropowerinfrastructures, with often very limited energy returns, could be decommissioned toimprove the ecological status of the EU‟s rivers;
The degree to which hydropower dams fulfil additional roles, such as flood controland water storage for agricultural purposes (the majority of river dams in the EU arenot built to generate electricity). It therefore appears sensible to widen the debate toinclude non-electricity producing dams, particularly as climate change will lead manysouthern states to increase their water storage capacity. Are there opportunities forsynergies, for retro-fitting, and for decommissioning inefficient structures?
The marine energy infrastructures that were assessed in the study comprised tidalimpoundment (barrage/lagoon; aka as tidal range), tidal stream and wave energy. Forsome of these infrastructures, this study represents the first-ever in-depth compilation of thedemonstrated and expected impacts.
Tidal barrages are typically very large installations that use existing geography to create anenclosure in which water is trapped. Tidal barrages may work both ways: the turbines canproduce electricity when the pool fills and when the pool empties; the pressure differentialsarising from tidal movements force water through the turbines. Tidal lagoons are like tidalbarrages, but where the enclosure is a man-made self-contained enclosure that does notstretch fully across an estuary. Tidal stream technology captures the tidal motion without theuse of a barrage or lagoon by placing water turbines in the tidal stream. These turbines arelocated under water and have a lot of similarity with wind turbines. Compared to windturbines, the power that can be harvested through a tidal stream turbine is greater and morepredictable. Wave energy is harvested in the open sea, using devices specifically designedfor the purpose. Different designs are currently being tested. In order to capture large
amounts of energy, wave energy collectors need to be large and need to be organised infarms, conceptually not unlike wind farms. There are currently no commercial wave farms inoperation, but a number of single-machine wave energy collectors are being tested in EUwaters.
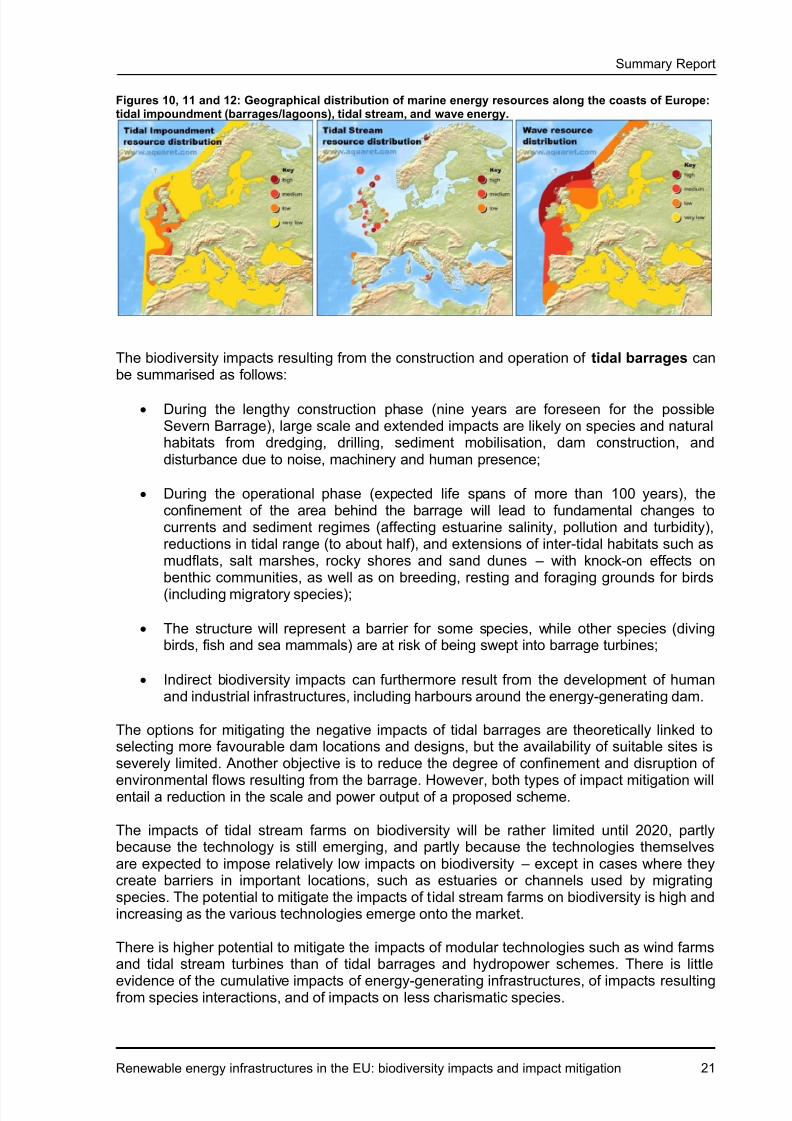
Figures 10 to 12 show the distribution of tidal and wave energy resources in the EU. Thegreatest potential for development lies along the western and north-western European coast,especially around the British Isles. It should be noted that the number of suitable sites fortidal barrages/lagoons is limited – the Rance Estuary near Saint-Malo on the northern Frenchcoast is home to the only operational large-scale tidal barrage globally. The controversialCardiff-Weston Tidal Barrage in the Severn Estuary in the United Kingdom is one of the few
other projects currently under consideration in the EU.
8/12/2019 Study NATURA 2000 Si Energia Alternativa
http://slidepdf.com/reader/full/study-natura-2000-si-energia-alternativa 25/32
Summary Report
Renewable energy infrastructures in the EU: biodiversity impacts and impact mitigation 21
Figures 10, 11 and 12: Geographical distribution of marine energy resources along the coasts of Europe:tidal impoundment (barrages/lagoons), tidal stream, and wave energy.
The biodiversity impacts resulting from the construction and operation of tidal barrages canbe summarised as follows:
During the lengthy construction phase (nine years are foreseen for the possibleSevern Barrage), large scale and extended impacts are likely on species and naturalhabitats from dredging, drilling, sediment mobilisation, dam construction, anddisturbance due to noise, machinery and human presence;
During the operational phase (expected life spans of more than 100 years), theconfinement of the area behind the barrage will lead to fundamental changes tocurrents and sediment regimes (affecting estuarine salinity, pollution and turbidity),reductions in tidal range (to about half), and extensions of inter-tidal habitats such asmudflats, salt marshes, rocky shores and sand dunes – with knock-on effects onbenthic communities, as well as on breeding, resting and foraging grounds for birds
(including migratory species);
The structure will represent a barrier for some species, while other species (divingbirds, fish and sea mammals) are at risk of being swept into barrage turbines;
Indirect biodiversity impacts can furthermore result from the development of humanand industrial infrastructures, including harbours around the energy-generating dam.
The options for mitigating the negative impacts of tidal barrages are theoretically linked toselecting more favourable dam locations and designs, but the availability of suitable sites isseverely limited. Another objective is to reduce the degree of confinement and disruption of
environmental flows resulting from the barrage. However, both types of impact mitigation willentail a reduction in the scale and power output of a proposed scheme.
The impacts of tidal stream farms on biodiversity will be rather limited until 2020, partlybecause the technology is still emerging, and partly because the technologies themselvesare expected to impose relatively low impacts on biodiversity – except in cases where theycreate barriers in important locations, such as estuaries or channels used by migratingspecies. The potential to mitigate the impacts of tidal stream farms on biodiversity is high andincreasing as the various technologies emerge onto the market.
There is higher potential to mitigate the impacts of modular technologies such as wind farmsand tidal stream turbines than of tidal barrages and hydropower schemes. There is little
evidence of the cumulative impacts of energy-generating infrastructures, of impacts resultingfrom species interactions, and of impacts on less charismatic species.
8/12/2019 Study NATURA 2000 Si Energia Alternativa
http://slidepdf.com/reader/full/study-natura-2000-si-energia-alternativa 26/32
Impacts of climate change and renewable energy infrastructures on EU biodiversity and Natura 2000
Renewable energy infrastructures in the EU: biodiversity impacts and impact mitigation22
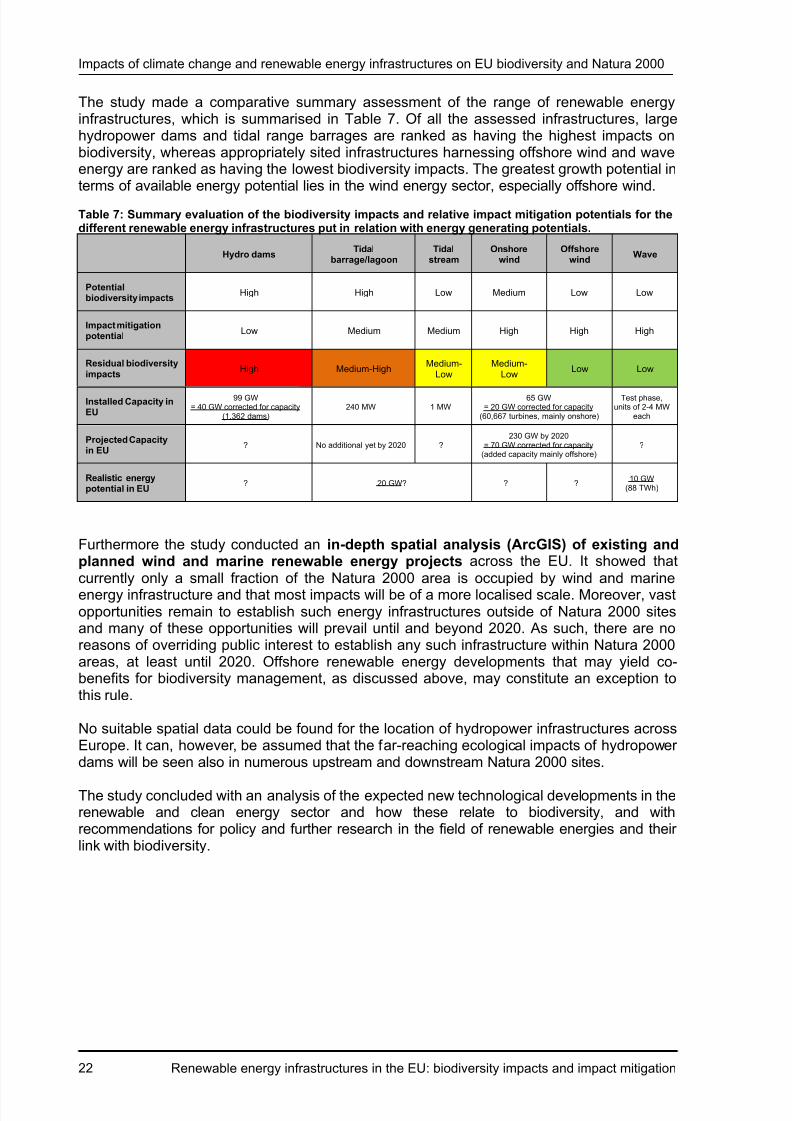
The study made a comparative summary assessment of the range of renewable energyinfrastructures, which is summarised in Table 7. Of all the assessed infrastructures, largehydropower dams and tidal range barrages are ranked as having the highest impacts onbiodiversity, whereas appropriately sited infrastructures harnessing offshore wind and waveenergy are ranked as having the lowest biodiversity impacts. The greatest growth potential interms of available energy potential lies in the wind energy sector, especially offshore wind.
Table 7: Summary evaluation of the biodiversity impacts and relative impact mitigation potentials for thedifferent renewable energy infrastructures put in relation with energy generating potentials.
Hydro damsTidal
barrage/lagoonTidal
streamOnshore
windOffshore
windWave
Potentialbiodiversity impacts
High High Low Medium Low Low
Impact mitigationpotential
Low Medium Medium High High High
Residual biodiversityimpacts
High Medium-HighMedium-
LowMedium-
LowLow Low
Installed Capacity inEU
99 GW= 40 GW corrected for capacity
(1,362 dams)240 MW 1 MW
65 GW= 20 GW corrected for capacity
(60,667 turbines, mainly onshore)
Test phase,units of 2-4 MW
each
Projected Capacityin EU
? No additional yet by 2020 ?230 GW by 2020
= 70 GW corrected for capacity(added capacity mainly offshore)
?
Realistic energypotential in EU
? 20 GW? ? ?10 GW
(88 TWh)
Furthermore the study conducted an in-depth spatial analysis (ArcGIS) of existing andplanned wind and marine renewable energy projects across the EU. It showed thatcurrently only a small fraction of the Natura 2000 area is occupied by wind and marineenergy infrastructure and that most impacts will be of a more localised scale. Moreover, vastopportunities remain to establish such energy infrastructures outside of Natura 2000 sitesand many of these opportunities will prevail until and beyond 2020. As such, there are noreasons of overriding public interest to establish any such infrastructure within Natura 2000areas, at least until 2020. Offshore renewable energy developments that may yield co-benefits for biodiversity management, as discussed above, may constitute an exception tothis rule.
No suitable spatial data could be found for the location of hydropower infrastructures acrossEurope. It can, however, be assumed that the far-reaching ecological impacts of hydropowerdams will be seen also in numerous upstream and downstream Natura 2000 sites.
The study concluded with an analysis of the expected new technological developments in therenewable and clean energy sector and how these relate to biodiversity, and withrecommendations for policy and further research in the field of renewable energies and theirlink with biodiversity.
8/12/2019 Study NATURA 2000 Si Energia Alternativa
http://slidepdf.com/reader/full/study-natura-2000-si-energia-alternativa 27/32
Summary Report
Impacts of climate change on EU biodiversity policy and recommendations for policy and research 23
6. Impacts of climate change on EU biodiversity policy and recommendationsfor policy and research
The study‟s Task Report 2b & 3b reviewed existing principles and guidelines devised to help
biodiversity adapt to climate change; summarised the sectoral policies affected; evaluatedthe impacts of climate change on the EU‟s biodiversity policy framework - most importantlythe 2006 EU Biodiversity Communication and related Biodiversity Action Plan (BAP); andoutlined a series of recommendations for actions and policies including on research.
The assessment of the impacts on the 2006 EU Biodiversity Communication andrelated Biodiversity Action Plan (BAP) came to the following conclusions:
1. Direct impacts of climate change on biodiversity and the EU BAP already exist and willbecome stronger. However, currently the effects of the indirect impacts of climatechange, most notably the financial implications and those associated with mitigationmeasures and (mal-)adaptation in other sectors require more attention and response
measures.
2. Funding for the conservation of biodiversity and ecosystem services, as well as forbiodiversity adaption to climate change, is prone to reduction as decision-makers andstakeholders at all levels (e.g. WTO, EU, EU member states, ODA-recipient countries,regional and local authorities, businesses, land owners, farmers, fishermen) will need toallocate significant resources to climate change mitigation and adaptation across allsectors.
3. The EU Overseas Entities (Outermost Regions and Overseas Countries and Territories)harbour the EU‟s greatest biodiversity and will experience severe climate changeimpacts; they are especially vulnerable to reduced conservation funding, given that their
economies are dependent on very few sectors (e.g. tourism).
4. The implementation of a wide range of actions may be delayed, weakened or impeded,as the direct and indirect impacts of climate change complicate scientific research andrelated policy procedures (e.g. the establishment of fisheries management plans wherethe evolution of fish stocks under climate change is uncertain).
5. Climate change is seen as an overriding environmental and political concern; there is arisk that the implementation and enforcement of existing biodiversity-friendly policies andmeasures may therefore be reduced, particularly where responsibility is devolved tonational, regional or local authorities.
6. Various climate change adaptation and mitigation measures may have significantnegative impacts on biodiversity and ecosystem services. The mandatory targets underthe Renewable Energy Sources Directive are a particular concern, as they may lead tosignificant impacts through the production of bioenergy feedstock within and outside theEU, the installation of new small and large hydro power infrastructures along EU rivers,and the installation of other high impact renewable energy infrastructures (e.g. tidalbarrages).
7. Despite this largely negative summary assessment, the rise of climate change to the topof the political agenda may provide an opportunity for biodiversity, if the criticallyimportant biodiversity-climate change interface is further exploited and recognised.
Properly planned ecosystem-based adaptation and mitigation measures offer significantopportunities for biodiversity to benefit indirectly from climate change action and funding.
8/12/2019 Study NATURA 2000 Si Energia Alternativa
http://slidepdf.com/reader/full/study-natura-2000-si-energia-alternativa 28/32
Impacts of climate change and renewable energy infrastructures on EU biodiversity and Natura 2000
Impacts of climate change on EU biodiversity policy and recommendations for policy and research24
To help the EU’s biodiversity adapt to climate change, measures to increase theresilience and facilitate the movement of species are paramount. In the first instance,the principal actions for increasing the resilience of existing populations of species andhabitats should be those that reduce existing threats and constraints, including: habitatchange and fragmentation; pollution; disturbance; predation and over-exploitation; as well asalien species and pathogens.
Where measures are necessary to facilitate the movement of species, these may include:increasing productivity and emigration rates (i.e. improve the condition of the population);improving the condition of individuals (to increase the likelihood of survival and colonisationduring dispersal); reducing habitat fragmentation (to facilitate long-distance dispersal); andremoving barriers to dispersal.
It is also apparent that, in practice, adaptation measures need to focus on existingconservation actions, such as: maintaining and increasing the area of core habitats (Natura2000 sites and other protected areas); reducing external impacts (e.g. by establishing bufferzones and controlling pollutant emissions); managing/enhancing the ecological quality of
habitats, especially in protected areas; managing species populations (e.g. controllingexploitation, and impacts of invasive alien species); and increasing/restoring connectivitythrough landscape-scale conservation measures (e.g. restoring habitat patches, enhancingthe wider habitat matrix, and where well-justified creating habitat corridors).
In essence therefore, biodiversity adaptation requires the redoubling and speeding upof current conservation efforts to protect and manage habitats and speciespopulations.
Further actions to increase the resilience of biodiversity and ecosystems, taken from the2009 EC White Paper on Adapting to Climate Change, the 2009 Message from Athens18, andthe 2009 discussion paper “Towards a strategy on climate change, ecosystem services and
biodiversity ” of the EU Ad Hoc Expert Working Group on Biodiversity and Climate Change,include:
Explore the possibilities to improve policies and develop measures which addressbiodiversity loss and climate change in an integrated manner to fully exploit co-benefits and avoid ecosystem feedbacks that accelerate global warming;
Explore the potential for policies and measures to boost ecosystem storage capacityfor water in Europe;
Draft guidelines by 2010 on dealing with the impact of climate change on themanagement of Natura 2000 sites;
Ensure that climate mitigation and adaptation measures are fully compatible with theobjective of conserving biodiversity;
Promote the implementation of “triple win” measures that conserve biodiversity whileactively contributing to climate mitigation and adaptation;
Develop and implement adaptation measures for nature conservation;
Use ecosystem-based approaches to address climate change and biodiversity lossand ecosystem service degradation in an integrated manner and develop strategies
that achieve mutually supportive outcomes. This implies addressing the widerecosystem challenges and potential in the climate change negotiations (e.g. by
18 http://ec.europa.eu/environment/nature/biodiversity/conference/pdf/message_final.pdf
8/12/2019 Study NATURA 2000 Si Energia Alternativa
http://slidepdf.com/reader/full/study-natura-2000-si-energia-alternativa 29/32
Summary Report
Impacts of climate change on EU biodiversity policy and recommendations for policy and research 25
establishing a REDD+ like mechanism, promoting a similar approach for other landuse and ecosystems and, by including ecosystem-based approaches as an integralpart in the UNFCCC Framework for Adaptation Action).
Take immediate action to conserve and restore terrestrial and marine biodiversity andecosystem services as these are the basis for cost-effective climate changeadaptation and mitigation and can provide multiple economic, social andenvironmental benefits;
Engage other sectors (e.g. agriculture, finance, transport, energy, regional planning,water management, fisheries, forestry, tourism, development policy, health, builtenvironment) to maintain and increase ecosystem resilience and to ensure that theiractivities do not further damage biodiversity and ecosystem services;
Raise awareness of the linkages between climate change, biodiversity andecosystem services through communication and education initiatives, make use oflocal knowledge and build institutional capacity and partnerships to facilitate
integration;
Strengthen the knowledge base on the climate change-biodiversity linkage throughincreased research efforts, long-term monitoring, and valuation;
Appropriately address the issue of biodiversity, ecosystem services and climatechange in upcoming financial reviews.
Building on these, the study‟s Task Report 2b & 3b concludes with detailed sector-specificpolicy recommendations for the EU aimed at avoiding or reducing the negative impacts ofclimate change on biodiversity, and in particular the integrity of the Natura 2000 network.These are summarised below.
1. Rapid and effective and implementation of the EU Biodiversity Action Plan, torequire and include:
Explicitly ring-fenced funding for biodiversity conservation and adaptation underall the funding mechanisms covered in the BAP (EU and EU member stateallocations, European Social Fund (ESF), cohesion/structural funds, CFP andCAP/RDPs, etc.), and proper attention in the upcoming EC Budget Review;
Appropriate specific funding for biodiversity conservation, biodiversity adaptationand ecosystem-based adaptation and mitigation measures in the EU OverseasEntities (Outermost Regions and Overseas Countries and Territories);
Subject sectoral climate change adaptation and mitigation measures that may
have negative impacts on biodiversity and ecosystem services to strictEnvironmental Impact and Strategic Environmental Assessments that fullyintegrate and respect biodiversity and ecosystem aspects, and closely andregularly monitor these measures;
Update and strengthen existing environmental legislation, where necessary andappropriate, and enhance implementation and enforcement;
Reach out to sectors responsible for the planning and implementation ofadaptation and mitigation measures, in order to maximise the use of opportunitiesfor biodiversity co-benefits and ensure that ecosystem-based measures are givenpriority;
Conduct new modelling, field research and review studies, as well as monitoringprogrammes and capacity-building on the climate change and biodiversity
interface, to better inform measures and policy-making;
8/12/2019 Study NATURA 2000 Si Energia Alternativa
http://slidepdf.com/reader/full/study-natura-2000-si-energia-alternativa 30/32
Impacts of climate change and renewable energy infrastructures on EU biodiversity and Natura 2000
Impacts of climate change on EU biodiversity policy and recommendations for policy and research26
Fast-track the implementation of no-regret measures that do not risk beingmaladaptive, such as conservation activities enhancing the resilience of existingspecies populations and habitats.
2. Development by EU member states of national climate change adaptationstrategies and action plans (where still required), extending these with biodiversityadaptation action plans that identify responsibilities for implementation. Such actionplans should be integrated with the requirements of the EU biodiversity policyframework and other sectoral strategies for climate change mitigation and adaptation,to take advantage of the potential co-benefits of combined actions with other sectors.
3. Designation of Natura 2000 sites and other protected areas and revision in thelight of climate change. The protection and management of a robust and coherentprotected area network, as is the aim of the Natura 2000 network, should continue toform the cornerstone of habitat and species protection and management in the EU.However, the Natura 2000 network, even when fully established, will not be sufficientto protect biodiversity in Europe according to all reasonable projections of climate
change. In most parts of Europe, protected areas are too small to accommodatechanges, and the matrix around them is too modified and intensively used. With theexception of some eastern EU member states in which suitable areas for protectedarea network expansion may be more easily found, the options for redesigning andextending the EU protected areas network are therefore limited. Instead, it is likely tobe more feasible to support the Natura 2000 network by improving functionalconnectivity, establishing „buffer zones‟ to increase the effective size of reserves,linking habitats in new suitable climate zones with existing relatively „climate-proof‟refugia, and including diverse protected area management strategies. Furthermore,although there is a strong case for retaining the vast majority of existing Natura 2000sites for the foreseeable future, there is also a case for re-examining their objectiveswith respect to their focus on specific species and habitats ( i.e. their “designated
features”). It is therefore recommended that guidance should be provided for memberstates on objective setting for, and monitoring of, designated habitats and speciesthat are being impacted by climate change. In the longer-term, the objectives for theNatura 2000 network may need to be more flexible, to accommodate change whilstmaximising the ecological value of each site and the network as a whole.
4. Increasing connectivity through corridors and ecological networks, by:
Assessing the need for, and planning measures on the basis of, functional (notstructural) connectivity;
Focusing on species that are most at risk from fragmentation and climate change;
Building network designs based on ecological science and evidence;
Protecting existing connectivity - following the precautionary principle when thereis doubt over its value;
Only increasing connectivity where it is necessary and carefully consider thepossible risks from such actions;
Considering all options for increasing functional connectivity and taking their cost-effectiveness into account;
Linking ecological networks to ecosystem-based adaptation and mitigationmeasures (e.g. the management of upland catchments for water resources andflood attenuation, of peatlands and natural forests for carbon storage andsequestration, of flood plains for flood alleviation, or of coastal wetlands forcoastal protection).
5. Control of invasive alien species (IAS). The EU should develop, implement andeffectively enforce a strong and comprehensive over-arching IAS strategy, whichaims to prevent the arrival of new IAS, control the spread and impacts of existing IAS,and where necessary eradicate existing IAS. The strategy should lead to increased
8/12/2019 Study NATURA 2000 Si Energia Alternativa
http://slidepdf.com/reader/full/study-natura-2000-si-energia-alternativa 31/32
Summary Report
Impacts of climate change on EU biodiversity policy and recommendations for policy and research 27
co-ordination between EU institutions, member states and regions on IAS preventionand response measures. It should moreover take into account the likely effects ofclimate change on the spread of IAS and the possible need for special and targetedmeasures for Natura 2000 sites, as well as for species and habitats of CommunityInterest in general. In the context of climate change, clarification will be necessary ondistinguishing unwanted IAS from species that extend their natural ranges whileadapting to climatic changes (which should therefore be considered benignimmigrants).
6. Delivery of conservation management, especially by enhanced implementation ofagri-environment and cross-compliance measures in agricultural landscapes and bystrengthening the role of forest management in the context of biodiversity-friendlyclimate change adaptation and mitigation.
7. Impact assessment and planning policy. There is a need to better addressbiodiversity conservation needs in Strategic Environmental Assessments andEnvironmental Impact Assessments, both inside and outside Natura 2000 areas, and
to ensure that they properly consider climate change related issues. StrategicEnvironmental Assessments may also be able to play an important role in identifyingstrategic opportunities for enhancing biodiversity resilience and allowing forbiodiversity adaptation. The possible benefits of the introduction of a no-net-losspolicy for biodiversity should also be considered. Such a policy would requirepractical measures to deliver, such as the promotion of offsets (e.g. through market-based habitat banking schemes). This could provide a useful mechanism fordelivering habitat enhancement and restoration measures, which could help reversehabitat fragmentation. However, the introduction of such compensation measureswould have to be introduced carefully with appropriate regulatory safeguards.
8. Research and monitoring. Further research and monitoring urgently needs to be
conducted in order to provide reliable species-specific, habitat-specific and site-specific guidance. Although, the information that is currently available can give anindication of the broad strategies that are likely to help with climate changeadaptation, the actual delivery of effective long-term actions will require much moredetailed ecological knowledge. It is therefore recommended that the followingbiodiversity related climate change research actions be given a high priority:
Carry out fundamental ecological research to improve our understanding of theeffects of climate change on biodiversity and interactions with other environmentalchanges and pressures. A particularly high priority should be given to examiningthe factors that affect resilience and the ability for species to move to and colonisenew areas. The research should be combined with long-term monitoring of the
impacts of climate and other abiotic factors on biodiversity at an appropriate rangeof spatial scales.
Undertake necessary field surveys and analyses to map the full spatial distributionof EU species and habitats of Community Interest, especially those likely to bevulnerable to climate change, to provide the necessary baseline for studies onclimate change vulnerability, on potential climate-related distributional changes,and on specific biodiversity adaptation measures.
Extend climate envelope mapping to all taxa groups and habitat types (especiallyHabitats of Community Interest listed in Appendix 1 of the Habitats Directive) withsuitable spatial distribution data. Link resulting climate envelope projection modelsto dispersal models and dynamic models of existing and potential habitat
availability. The aim should be to quantitatively and objectively extend theanalysis carried out in Task 2 of the present study, and provide clearer and morereliable assessments of vulnerability (i.e. that consider adaptation constraints) andprojected changes in distribution of species and habitats.
8/12/2019 Study NATURA 2000 Si Energia Alternativa
http://slidepdf.com/reader/full/study-natura-2000-si-energia-alternativa 32/32
Impacts of climate change and renewable energy infrastructures on EU biodiversity and Natura 2000
Further develop the spatial analysis of the impacts of climate change on theNatura 2000 network, by analysing the distribution of species of CommunityInterest that are vulnerable to the impacts of climate change in relation tomodelled projections of their suitable climate space. This analysis should besupported by the development of reliable spatial maps of the distribution ofspecies and habitats of Community Interest and the completion of inventories ofthe presence and relative abundance of habitats and species of CommunityInterest in all Natura 2000 sites. The studies should aim to identify Natura 2000sites that are likely to lose species and habitats of Community Interest, and sitesthat might gain species and habitats of Community Interest, taking into accountadaptation constraints. An integrated assessment should then be carried out toassess the potential coherence of the overall Natura network (and itsbiogeographic regions) in relation to projected losses and gains of species (takinginto account adaptation constraints) according to various climate scenarios andtimelines. This should consider the adequacy of representation of species andhabitats of Community Interest and requirements for functional connectivityamongst sites.
Develop and test methods for assessing functional connectivity requirements forspecies that are vulnerable to climate change. These should aim to reliablyestablish existing functional networks, assess their viability under various climatechange scenarios, and identify needs for increasing connectivity to increaseresilience and, where necessary, re-distribution to suitable habitats in areasprojected to have suitable climate space.
Carry out research and monitoring to improve our understanding of the potentialimpacts of extreme weather events on the viability of species populations andhabitats, and how such events may drive changes in their distribution. Incorporatethese findings into climate based models of species and habitat distribution.
Conduct detailed monitoring of appropriate sample species and habitats that areconsidered to be vulnerable to climate change to validate and calibrate model
based projections. Use the findings to identify indicators (species and otherwise)that will provide an early warning of climate change impacts in Natura 2000 sites.
Carry out controlled experiments to assess the risks and benefits of assistedmigration, learning from advances in IAS science.
Monitor the impacts and cost-benefit relationships of biodiversity adaptationmeasures that aim to support species and habitats of Community Interest inNatura 2000 sites and the wider environment (e.g. the effectiveness of habitatmanagement measures, increasing Natura 2000 site areas, buffer zones andconnectivity measures).
Conduct further research to identify practical, robust and cost-effective ecosystemmanagement measures that can significantly support biodiversity conservationand/or climate change mitigation and/or climate change adaptation for othersectors. Develop policy instruments to support such ecosystem-based adaptationand mitigation measures, in particular where they offer multiple benefits.
Model and monitor the impacts of land-use and biodiversity relevant climatechange adaptation and mitigation measures, such as flood control infrastructures,new agricultural crops, renewable energy infrastructures, and most importantlythe production of bioenergy feedstocks, including forest resources.