Embed Size (px)
Citation preview
II”‘ -
NASA Contractor Report 2825
Study of Advanced Composite Structural Design Concepts for an Arrow Wing Supersonic Cruise Configuration
M. J. Turner and D. L. Grande
CONTRACT NASl-12287 APRIL 1978
https://ntrs.nasa.gov/search.jsp?R=19780012173 2018-06-13T23:40:28+00:00Z
TECH LIBRARY KAFB, NM
IlllllIIIIIlll1lllllll~~llllR lllllnl llllbLb95
NASA Contractor Report 2825
Study of Advanced Composite Structural Design Concepts for an Arrow W ing Supersonic Cruise Configuration
M . J. Turner and D. L. Grande Boeivrg Commercial Airplavve Covnpaviy Seattle, Wasbivzgtotl
Prepared for Langley Research Center under Contract NASl-12287
National Aeronautics and Space Administration
Scientific and Technical Information Otfice
1978

CONTENTS
Page
SUMMARY. . . . . . . . . . . . . . . . . . . . . . . . . . . . . 1
INTRODUCTION . . . . . . . . . . . . . . . . . . . . . . . . . . 2
SYMBOLS . . . . . . . . . . . . . . . . . . . . . . . . . . . . . 4
CONCEPT AND MATERIAL SELECTION. ................ 6 Concept Design and Selection .................... 6 Material Properties and Allowables .................. 9 Material Selection ........................ 13
COMPOSITE ANALYSIS AND SIZING .................. 23 Structural Finite Elements ..................... 23 Failure Criteria ......................... 25 Optimization Procedure ...................... 27
THESTRUCTURALMODEL. ................. . . . 29 Wing ......................... . . . 29 Fuselage ........................ . . . 33
WING PANEL DESIGN AND STRUCTURAL MASS ANALYSIS .... . . . 38 Wing Panel Design Requirements ............... . . . 38 Wing Cover Panel Design .................. . . . 41 Additional Design Considerations .............. . . . 46 Mass Methodology ..................... . . . 47 Panel Mass Comparison .................. . . . 51
THERMAL ANALYSIS .................... . . . 52 Temperature Distributions in Composite Laminates ....... . . . 52 Thermal Analysis of a Simplified Model ............ . . . 52 Modeling of Light Gage and Heavy Gage Cross Sections ...... . . . 57 Determination of Temperature Distributions .......... . . . 57
STRENGTH DESIGN ......................... 67 Initial Panel Sizing ........................ 67 Allowables ........................... 70 Stress Analysis and Resize ..................... 75 Panel Stability Evaluation ..................... 77
FLUTTER ANALYSIS AND REDESIGN FOR STIFFNESS .......... 92 Flutter Appraisal and Redesign Procedure ............... 92 Stiffness Redesign of Composite Cover Panels .............. 92 Final Stiffness Design of Composite Wing Cover Panels .......... 96
. . . ill
CONTENTS (Concluded)
Page
FINAL MASS ANALYSIS ....................... 101 Revised Titanium Wing Mass .................... 101 Wing Section Mass Comparison ................... 102 Wing Mass Comparison Summary .................. 106 Group Mass and Balance Statement .................. 107
CONCLUDING REMARKS AND RECOMMENDATIONS . . . . . . . . . . . 109
REFERENCES . . . . . . . . . . . . . . . . . . . . . . . . . . . 111
iv
No.
TABLES
Page
1 2
3
4
5
6 7 8 9
10
11 12 13 14 15 16 17
18 19 20 21 22 23 24
25 26 27 28
Control Point Loads ..................... Estimated Properties of High Strength Graphite/Polyimide Available in 1986, [0] Lamina,Vf= 0.60 ................. Estimated Properties of High Modulus Graphite/Polyimide Available in 1986, [Ol Lamina, Vf= 0.60 ................. Estimated Properties of Boron/Polyimide Available in 1986, [Ol Lamina, Vf= 0.50. .................... Estimated Properties of Borsic/Aluminum Available in 1986, 0.145 mm (5.7 mil) Fibers in [O] Lamina, Vf= 0.50 ......... Specific Strength and Specific Modulus, [O] S Lay-Ups ........ Specific Strength and Specific Modulus, [+45] s Lay-Ups ....... Minimum Gage Considerations ................. Initial Number of Plies Per Lamina ................ Comparison of Titanium and Composite Fuselages, Station 54.87 m (2160.26 in.) ........................ Summary-Comparison of Metal and Composite Fuselage Structures ... ATLAS Input Data to Support Mass Calculations .......... Mass Comparison-Titanium and GR/PI Upper Surface Honeycomb Panels Properties Used for Thermal Analysis ............... Lay-Ups of Honeycomb Panels for Wing Structural Sections ...... Laminate Properties. ..................... Core Thickness Required to Develop Buckling Allowables Equal to Laminate Strength ...................... Estimated 1986 Properties of Titanium .............. Allowable Stress Ratios .................... Allowable Lamina Strains ................... Allowable Lamina Stresses ................... Energy Balance of Strength Design Hybrid Structure at Neutral Stability . Stiffness Redesign-Representative Advanced Composite Wing Cover Panels Estimated Mechanical Properties of Graphite/Polyimide Available in 1986,Vf=0.60 ....................... Comparison of Flutter Energy Balance for Stiffness Designs ...... Revised Reference 1 Titanium Wing Mass ............. Wing Mass Comparison Summary, Model 969-5 12B ......... Group Mass and Balance Statement, Model 969-5 12B .........
V
7
14
15
16
17 18 18 19 32
34 35 48 51 55 57 61
70 70 73 74 76 95 95
99 . 100 . 101 . 106 . 108
No.
FIGURES
Page
1 2 3 4 5 6 7 8 9
10 11 12 13 14 15 16 17 18 19 20 21
22 23 24 25 26 27 28 29
30
31
32 33 34 35 36 37 38
Configuration for Structural Analysis, Model 969-5 12B . . . . . . . . . 3 Wing and Body Control Points. . . . . . . . . . . . . . . . . . . 7 Borsic/Aluminum Concept Comparison . . . . . . . . _ . . . . _ . 8 Graphite/Polyimide Tension and Compression Moduli, [90] Lamina . . . . 12 Sandwich Panel Mass Per Unit Area for Spanwise Compressive Loading . . . 20 Sandwich Panel Mass Per Unit Area for Chordwise Compressive Loading . . 2 1 Sandwich Panel Mass Per Unit Area for Shear Loading . . . . _ . . . . 22 Triangular CPLATE Element . . . . _ . . . . . . . . . . . . . _ 24 CCOVER Element . . . . . . . . . _ . . . _ . . . _ . . . _ . 26 ATLAS Composite Design Subsets (Illustrative Only) . _ . . . . . _ . . 28 Basic Structural Model. . . . . . . . . . . . . . . _ . . . _ . _ 30 Zones Used for Resize . . . . . . . _ . . . . . . . _ . . . . . . 3 1 Average Stiffness Factors for Fuselage Shell . . . . . . . . . . . . . 37 Design for Actual/Theoretical Mass Factors, Panel Locations . . . _ . . . 40 Typical Lower Wing Panel, Medium Gage Bonded GR/PI Sandwich . . . . 42 Typical Lower Wing Panel, Medium Gage Brazed Titanium Sandwich . . . . 43 Composite Skin Layup Diagram, Medium Gage, Lower Wing Panel _ . . . . 44 Theoretical-to-Actual Factor, Titanium Honeycomb Panel Skin . . . . . . 49 Theoretical-to-Actual Factor, Graphite/Polyimide Honeycomb Panel Skin . . 50 Mission Profile (6190 km (3340 nmi)) . . . . . . . . . . . . . . . . 53 Thermal Analysis Model of High Strength Graphite Polyimide Laminate of 24 O.l-mm (0.004 in.) Plies . . . . . . . . . . . . . . . . . . . . $54 Basic Material Conductivities and Average Conductivity of Sample Laminate _ 56 Points for Thermal Analysis. . . . . . . . . . . . . . _ . . . . . 58 Structural Section . . _ . . . . . . . . . . . . . . . . . . . . 59 Average Thermal Conductivities for Light and Heavy Gage Designs. . . . . 60 Fuel Tank Temperatures, Light Gage, Dry Upper Panel; T 1, T2, T24, T25 . . 62 Fuel Tank Temperatures, Light Gage, Dry Upper Panel; T5, T6, T20, T21 . . 63 Fuel Tank Temperatures, Light Gage, Dry Upper Panel; T8, TlO, T12 . . . 64 Temperature Differences, Light Gage, Dry Upper Panel; Tl-T2, T5-T7, Tl9-T2 1, T24-T25 . . . . . . . . . . . . . . . . . . . . . . . 65 Fuel Tank Temperature Differences, Light Gage, Dry Upper Panel; T7-T8, T8-TlO,T8-T13 . . . . . . . . . . . . . . . . . . . . . 66 Initial Buckling Interaction Curves-Simply Supported Flat Rectangular Panels (a/b = 4) . . . . . . _ . . . . . . . . . . . . . . . . . 72 Element Sizes After Third Strength Resize . . . . . . . . . . . . . . 78 Theoretical Wing Mass, Wing Box Primary Structure, ATLAS Resizing . . . 84 Upper Surface Panel Stability Check After Resize Cycle 1 . . . . . . . . 86 Lower Surface Panel Stability Check After Resize Cycle 1 . . . . . . . . 87 Lay-Up Changes Required for Stability After Resize Cycle 1, Upper Surface . 88 Lay-Up Changes Required for Stability After Resize Cycle 1, Lower Surface . 89 Upper Surface Panel Stability Check After Resize Cycle 2 . . . . . . . . 90
vi
I -
No. Page
39 Lower Surface Panel Stability Check After Resize Cycle 2 ........ 91 40 Stiffness Constraints for Strength Design of Hybrid Structure. ...... 93 41 Mode Shapes and Frequencies of Strength Designed Hybrid Structure ... 94 42 Affect of Stiffness Design Changes on Flutter Speed .......... 97 43 Estimated Properties of Intermediate Graphite Fiber Available in 1986 ... 98 44 Upper Wing Cover Mass Comparison, Final Designs ........... 103 45 Lower Wing Cover Mass Comparison, Final Designs. .......... 104 46 Wing Structure Mass Comparison, Final Designs ............ 105
FIGURES (Concluded)
vii

I -
NOMENCLATURE
Bh
BJ1 Bs C D
e
h h min L
Pa R
tB
tt W
ga w
Bump height, mm (inch)
Bump length, mm (inch) Bump pitch, mm (inch)
Bearing radial clearance, mm (inch) Diameter of journal bearing, mm (inch)
Journal displacement, mm (inch)
Film thickness, u-m (pain.)
Minimum film thickness, porn (vein.)
Length of jpurnal bearing, mm (inch)
Ambient pressure, atmosphere (psia)
Bearing radius, mm (inch)
Bump foil thickness, mm (inch)
Smooth (top) foil thickness, mm (inch) Bearing load, N (LB)
Attitude angle
Angular velocity, radians-set -1
xi
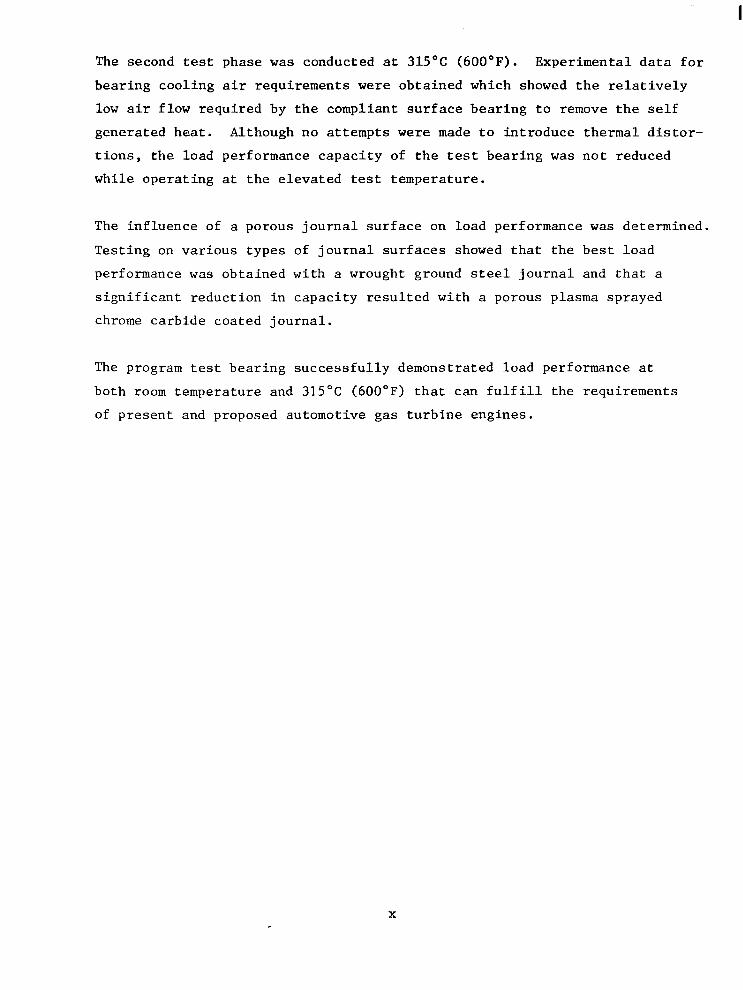
The second test phase was conducted at 315°C (600°F). Experimental data for
bearing cooling air requirements were obtained which showed the relatively
low air flow required by the compliant surface bearing to remove the self
generated heat. Although no attempts were made to introduce thermal distor-
tions, the load performance capacity of the test bearing was not reduced
while operating at the elevated test temperature.
The influence of a porous journal surface on load performance was determined.
Testing on various types of journal surfaces showed that the best load
performance was obtained with a wrought ground steel journal and that a
significant reduction in capacity resulted with a porous plasma sprayed
chrome carbide coated journal.
The program test bearing successfully demonstrated load performance at
both room temperature and 315°C (600°F) that can fulfill the requirements
of present and proposed automotive gas turbine engines.
SUMMARY
The principal objectives of the present study were to assess the relative merits of various advanced compdsite structural concepts and materials suitable for a 1986 advanced super- sonic aircraft designed to cruise at Mach 2.7, to select the structural approaches best suited for the Mach 2.7 environment, and to provide construction details and structural mass estimates based on structural design studies of representative wing structures.
The configuration, structural arrangement, and loads developed for a prior study of a titanium structure (NASA CR-2743, CR-132576-2) were used without modification. Allowable stresses and strains, based on estimated fiber properties to be available in the next decade, were established for advanced composite materials using boron and graphite fibers. Stiffened panel and conventional sandwich panel concepts were designed and analyzed, using graphite/ polyimide and boron/polyimide materials. The conventional sandwich panel was selected as the structural concept to be used in the modified wing structure.
Upper and lower surface panels of the arrow wing structure were then redesigned, using high strength graphite/polyimide sandwich panels, retaining the titanium spars and ribs that had been designed in the prior study. The ATLAS integrated analysis and design system was used for stress analysis and automated resizing of surface panels, using the design loads that were developed in the prior study of the metallic structure.
Flutter analysis of the hybrid structure showed a significant decrease in flutter speed relative to the baseline strength designed titanium wing structure. The flutter speed was increased to that of the final titanium design by selectively increasing the thickness of wing panel laminates and by substituting a graphite/polyimide material with properties intermediate between high strength and high modulus materials. The final mass of the hybrid wing structure was significantly less than that of the titanium wing with equal flutter speed.
It is concluded that advanced composite materials offer significant mass savings for design of the thin low aspect ratio wings that are required for large supersonic cruise aircraft. Also it appears desirable to develop graphite fibers covering a range of strengths and stiffnesses for diverse applications.
INTRODUCTION
This document presents an evaluation of the potential benefits that could be realized by application of advanced composite materials and structural concepts, representative of a 1986 level of technology, to an advanced supersonic aircraft designed to cruise at Mach 2.7. An earlier study on this type of aircraft (refs. 1 and 2) provided an assessment of the relative merits of metallic materials and concepts representative of a 1975 level of technology. Con- struction details and structural mass estimates, based on in-depth structural design studies of representative wing and fuselage structures, were also provided in the earlier work.
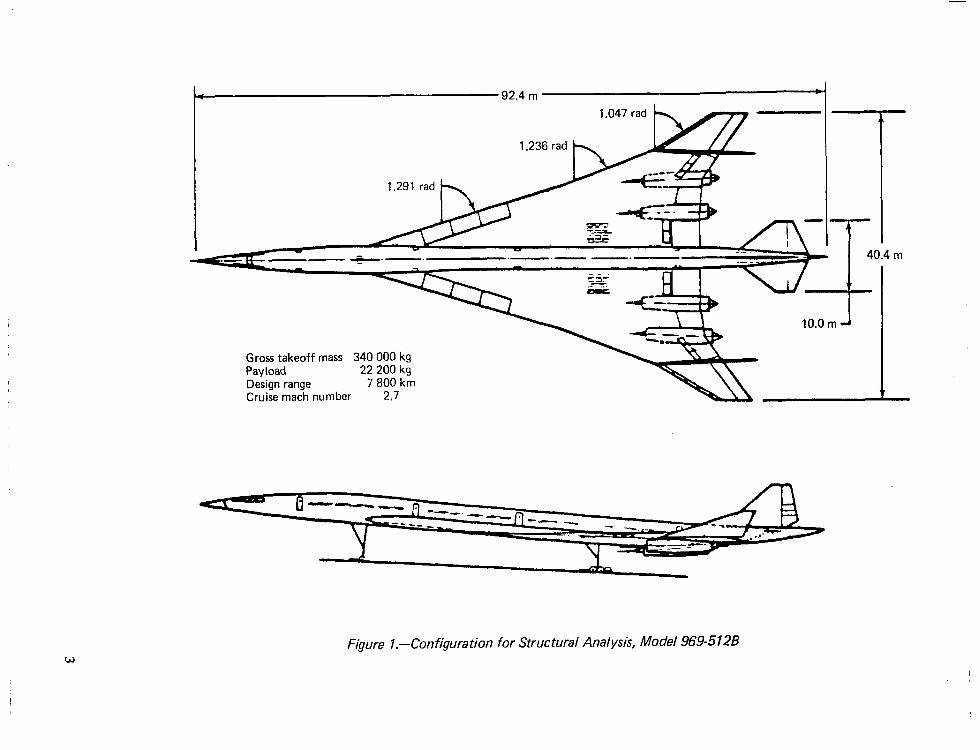
The arrow wing configuration employed throughout this study, model 969-5 12B, is depicted in figure 1. It is designed for a maximum taxi gross mass of 340 200 kg (750 000 lbm) a payload of 22 200 kg (49 000 lbm), representing 234 passengers in tourist accommodations, and a cruise Mach number of 2.7. The structure, stability and control characteristics, and systems have been defined to meet the requirements of the Federal Aviation Regulations, Part 25, and the Tentative Airworthiness Requirements for supersonic transports.
Since supersonic cruise aircraft tend to be large and flexible, aeroelasticity is a major design consideration. Realistic aeroelastic considerations (based on analysis of finite element struc- tural models and sophisticated aerodynamic loading analysis) are required, even in a pre- liminary design study of such a vehicle. Strong interaction of the various technical disciplines in aeroelastic analysis requires the use of computer-aided design methods to improve and expedite the aeroelastic and structural resizing cycle. The importance of computer-aided design methods is further accentuated by the large number of material parameters that must be accommodated in designing a composite structure. The computerized system that was used in performing this work, described in reference 1, was organized around an interim version of the ATLAS structural analysis and design system (ref. 3), interfaced with external programs for flutter analysis and with the FLEXSTAB system (ref. 4) for loads analysis.
For the present study, properties of candidate advanced composite materials were estimated for the 1986 time period, based on assumptions regarding development work to be accomplished in the intervening time period. Estimated material properties were then used in structural concept design studies and in concept and material evaluation and selection. Following material and concept selection a finite element model of the complete structure was defined, retaining the structural arrangement and finite element geometry from the prior study of the metallic structure.
The report describes the design and analytical work, resizing of the wing cover panels to satisfy strength and flutter criteria (while retaining the titanium internal structure from refs. 1 and 2), and evaluation of the reduction in structural wing mass relative to the all titanium wing. Recommendations are also presented relating to further research and develop- ment work that will be needed to achieve the anticipated benefits from application of advanced composite materials in primary structure of large supersonic cruise aircraft. Details of the study are given in reference 5.
92.4 m c
1.047 rad k
40.4
I P
- --Es= I --I
I I
10.0 m J
1
Gross takeoff mass 340 000 kg Payload 22 200 kg Design range 7 800 km Cruise math number 2.7
m
Figure 1 .-Configuration for Strut tural Analysis, Model 969-5128 w
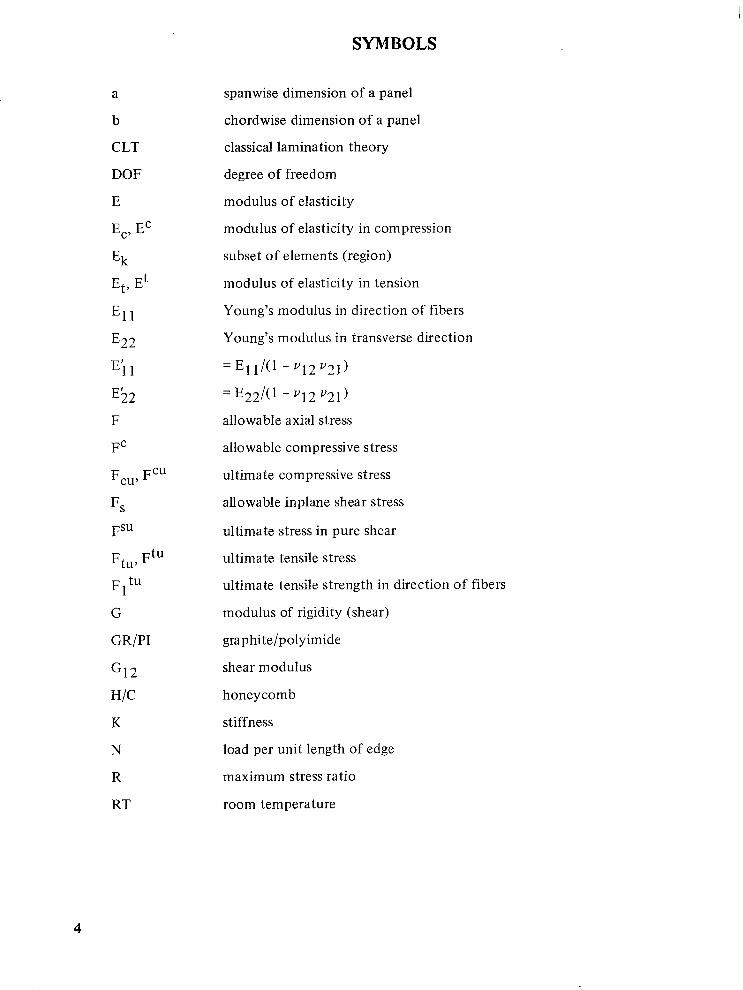
SYMBOLS
a
b
CLT
DOF
E
EC, EC
Ek
Et, Et
El1
E22
E’11
E22 F
FC
F CU’ FCU
Fs
FSU
FtLly Ft u
Fl tu
G
GR/PI
G12
WC
K
N
R
RT
spanwise dimension of a panel
chordwise dimension of a panel
classical lamination theory
degree of freedom
modulus of elasticity
modulus of elasticity in compression
subset of elements (region)
modulus of elasticity in tension
Young’s modulus in direction of fibers
Young’s modulus in transverse direction
= El 141 - ~12 91)
= E22/(’ - ~“12 ~21)
allowable axial stress
allowable compressive stress
ultimate compressive stress
allowable inplane shear stress
ultimate stress in pure shear
ultimate tensile stress
ultimate tensile strength in direction of fibers
modulus of rigidity (shear)
graphite/polyimide
shear modulus
honeycomb
stiffness
load per unit length of edge
maximum stress ratio
room temperature

t f Tik TI
vD
Y
e
I-1
0
7
vf
P
[e 1, +-I
Subscript
L
T
X
Y
SYMBOLS (Concluded)
skin thickness or face thickness
equivalent thickness
allowables matrix
titanium
dive speed
shear strain
tensile strain
Poisson’s ratio
axial stress
shear stress
fiber fraction of composite lamina
density
laminae orientations in degrees
longitudinal
transverse
spanwise
chordwise
5
CONCEPT AND MATERIAL SELECTION
It has been assumed that the earliest flight of a large arrow wing airplane, designed to cruise at Mach 2.7, will occur in about the year 1990. The engineering freeze on the design will occur about 4 years earlier. Thus, 1986 is the year in which the engineering properties of an advanced composite material would have to be firmly established to be of use on the program.
The advanced composites design study began with a review of currently available materials and structural concepts. Then material suppliers and research personnel were contacted for discussions of material limitations, research, and anticipated future developments. From this background, material properties that could be achieved in the 1986 time period were defined and these postulated material properties were then used in material and concept selection studies to provide a basis for structural analysis and design.
The titanium arrow wing structure that was developed in reference 1 was redesigned to utilize advanced composite material in the wing surfaces to assess the potential impact on strength, flutter characteristics, and mass. Because of limited budget, it was decided to retain the titanium substructure as previously designed and to develop a new design for the external wing shell. Elastic and mass properties of the fuselage model were modified to provide representative dynamic characteristics of a hybrid fuselage structure with a strength designed composite shell. This representation was retained throughout the study without further modification.
CONCEPT DESIGN AND SELECTION
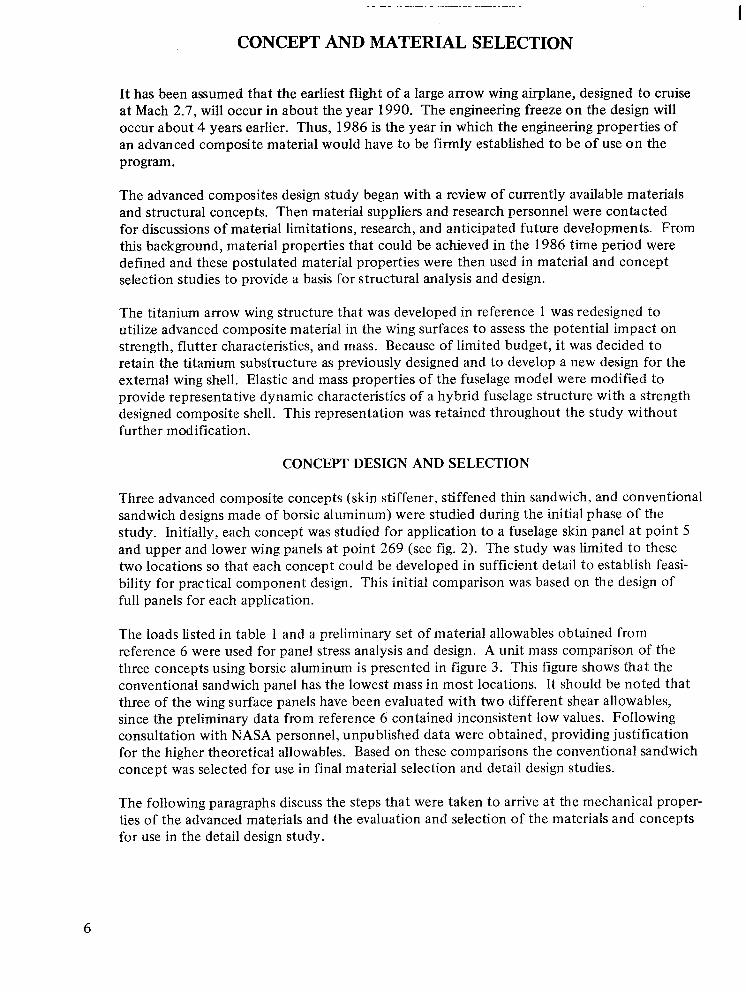
Three advanced composite concepts (skin stiffener, stiffened thin sandwich, and conventional sandwich designs made of borsic aluminum) were studied during the initial phase of the study. Initially, each concept was studied for application to a fuselage skin panel at point 5 and upper and lower wing panels at point 269 (see fig. 2). The study was limited to these two locations so that each concept could be developed in sufficient detail to establish feasi- bility for practical component design. This initial comparison was based on the design of full panels for each application.
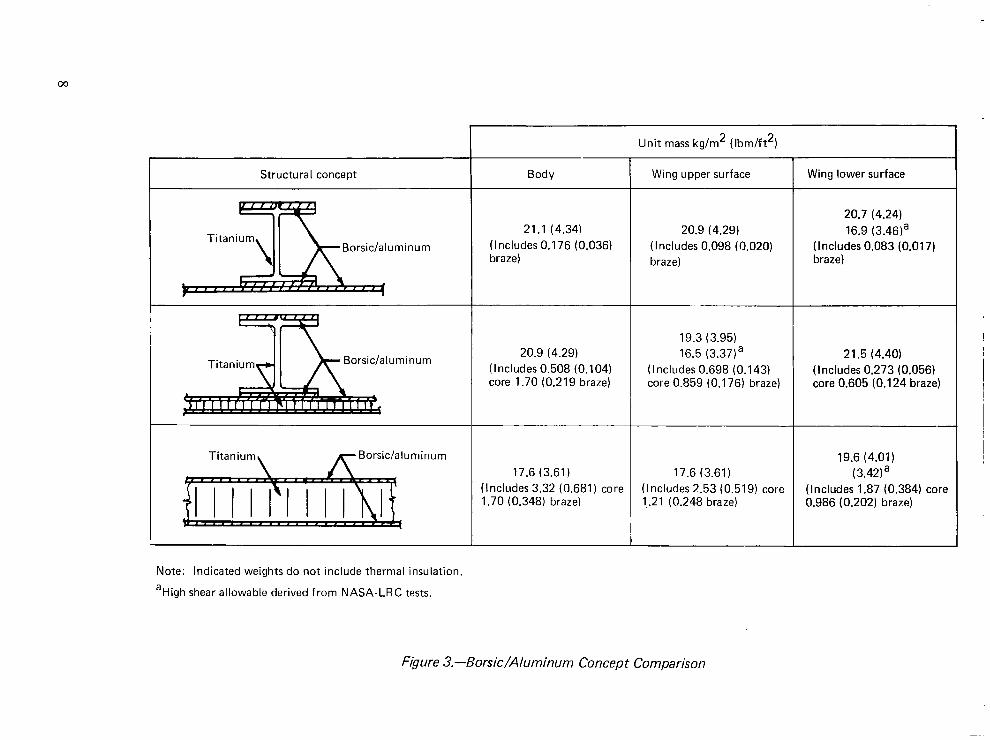
The loads listed in table 1 and a preliminary set of material allowables obtained from reference 6 were used for panel stress analysis and design. A unit mass comparison of the three concepts using borsic aluminum is presented in figure 3. This figure shows that the conventional sandwich panel has the lowest mass in most locations. It should be noted that three of the wing surface panels have been evaluated with two different shear allowables, since the preliminary data from reference 6 contained inconsistent low values. Following consultation with NASA personnel, unpublished data were obtained, providing justification for the higher theoretical allowables. Based on these comparisons the conventional sandwich concept was selected for use in final material selection and detail design studies.
The following paragraphs discuss the steps that were taken to arrive at the mechanical proper- ties of the advanced materials and the evaluation and selection of the materials and concepts for use in the detail design study.
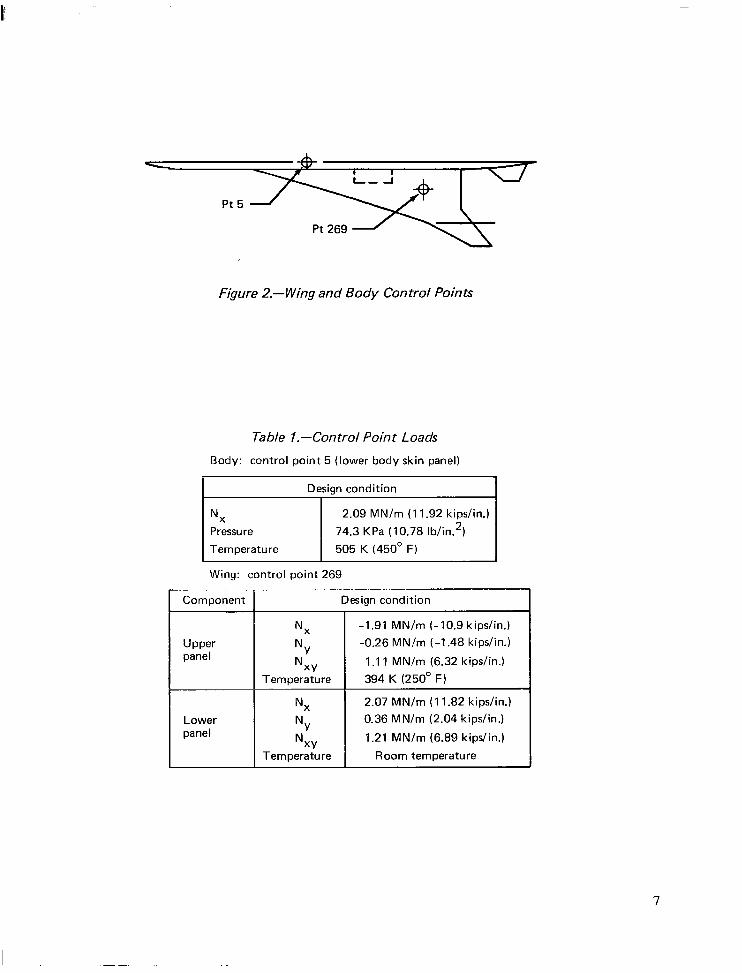
Figure 2.-Wing and Body Control Points
Table I.-Control Point Loads
Body: control point 5 (lower body skin panel)
I Desian condition
Nx Pressure
Temperature
2.09 MN/m (11.92 kipshn.1
74.3 KPa (10.78 Ib/h2)
505 K (450° F)
Wing: control point 269
Component Design condition
Upper panel
Lower panel
Nx
NY N
XY Temperature
NX
NY N
XY Temperature
-1.91 MN/m (-10.9 kips/in.)
-0.26 MN/m (-1.48 kips/in.)
1 .l 1 MN/m (6.32 kips/in.)
394 K (250° F)
2.07 MN/m (11.82 kipshn.)
0.36 MN/m (2.04 kips/in.)
1.21 MN/m (6.89 kips/in.)
Room temperature
7
Structural concept
Borsic/aluminum
2 Titanium -=I=5 Borsic/aluminum
Titanium, r Borsic/aluminum
Body
21.1 (4.34) (Includes 0.176 (0.036) braze)
20.9 (4.29) (Includes 0.508 (0.104) core 1.70 (0.219 braze)
17.6 (3.61) (Includes 3.32 (0.681) core 1.70 (0.348) braze)
Note: Indicated weights do not include thermal insulation.
aHigh shear allowable derived from NASA-LRC tests.
Unit mass kg/m2 ( Ibm/ft2)
Wing upper surface
20.9 (4.29) (Includes 0.098 (0.020) braze)
19.3 (3.95) 16.5 (3.37)a
(Includes 0.698 (0.143) core 0.859 (0.176) braze)
17.6 (3.61) (Includes 2.53 (0.519) core 1.21 (0.248 braze)
1 Wing lower surface
20.7 (4.24) 16.9 (3.46)a
(Includes 0.083 (0.017) braze)
21.5 (4.40) (Includes 0.273 (0.056) core 0.605 (0.124 braze)
19.6 (4.01) (3.42)a
(Includes 1.87 (0.384) core 0.986 (0.202) braze)
Figure 3.-Borsic/Aluminum Concept Comparison

MATERIAL PROPERTIES AND ALLOWABLES
The advanced composite materials in current use are boron-epoxy and graphite-epoxy. These materials are limited to a maximum service temperature of 450 K (350” F) for continuous service and 489 K (420” F) for intermittent service. The boron and graphite fibers retain their strength at higher temperatures, but the matrix material must be changed from epoxy to a metal such as aluminum or a higher temperature organic material, such as polyimide. Four materials selected for detailed evaluation were:
0 High strength graphite/polyimide
0 High modulus graphite/polyimide
0 Boron/polyimide
0 Borsic aluminum
Initially, interest centered on borsic-aluminum since this material showed great promise of maintaining significant strength at the required operating temperature of 505 K (450” F). Subsequently, however, interest in organic matrix materials increased because of ease of fabrication and lower thermal conductivity. Fuel heating is a critical design consideration for supersonic cruise since the fuel is used as a heat sink for the environmental control system and other heat sources within the airplane. Because of lower thermal conductivity the organic materials will alleviate the thermal problem. There has been only limited develop- ment work on high temperature polymers, with the polyimide resins currently getting the greatest emphasis and there is considerable promise that polyimide development problems will be overcome. The development risk is offset by the attractive characteristics of relatively low cost, low density, high shear strength, and moderate manufacturing complexity, compared to the metal matrix composites.
An abbreviated account of the procedure for making the required projections to the 1986 time period is presented in the following paragraphs. A more detailed discussion of the procedure is presented in reference 5. This phase of the study began with a literature search to detemline the state of development of stable high temperature advanced composites, and the data base for composite mechanical properties was taken from references 7 through 14. Interpretation of the data was complicated considerably by differences in test specimens, test procedures, and test conditions; such as sandwich beam versus coupon test methods and differences in composite fiber fractions, resin systems, test temperatures, and exposure times.
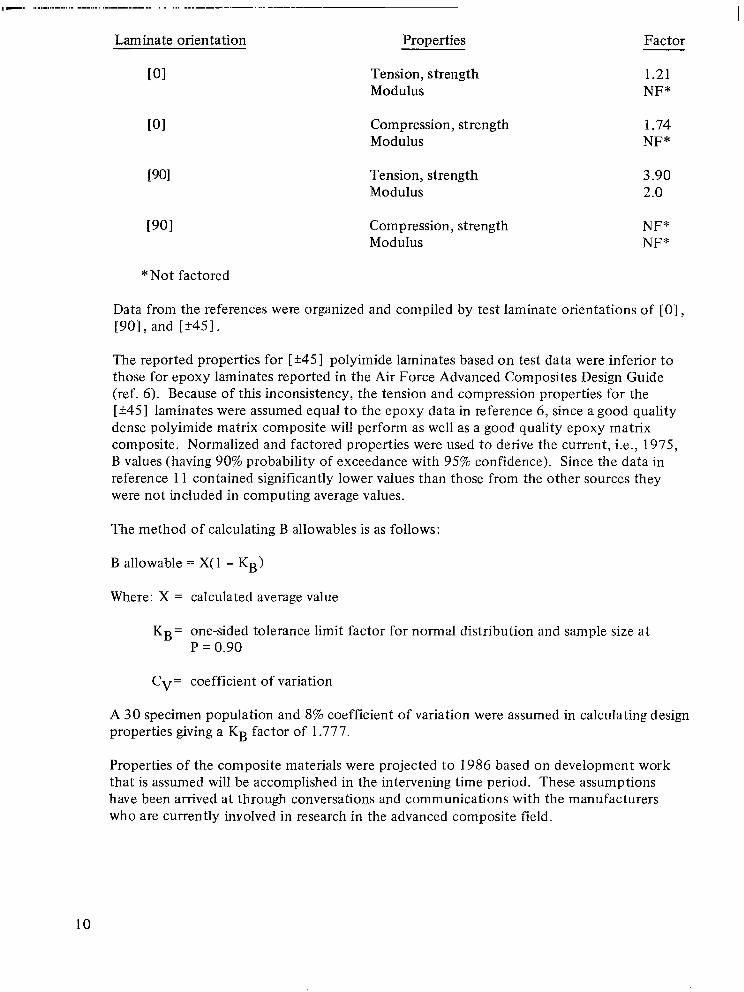
The mechanical properties from each source were scaled to a 60% fiber volume for graphite and a 50% fiber volume for boron. The scaled coupon test values were subsequently con- verted to equivalent sandwich beam values. These factors (from ref. 10) are listed on the following page.
9
Laminate orientation Properties Factor
101 Tension, strength Modulus
1.21 NF*
LOI Compression, strength Modulus
1.74 NF”
WI Tension, strength Modulus
3.90 2.0
WI Compression, strength NF” Modulus NF*
*Not factored
Data from the references were organized and compiled by test laminate orientations of [0] , [901, and [?451.
The reported properties for [ +45] polyimide laminates based on test data were inferior to those for epoxy laminates reported in the Air Force Advanced Composites Design Guide (ref. 6). Because of this inconsistency, the tension and compression properties for the [+45] laminates were assumed equal to the epoxy data in reference 6, since a good quality dense polyimide matrix composite will perform as well as a good quality epoxy matrix composite. Normalized and factored properties were used to derive the current, i.e., 1975, B values (having 90% probability of exceedance with 95% confidence). Since the data in reference 11 contained significantly lower values than those from the other sources they were not included in computing average values.
The method of calculating B allowables is as follows:
B allowable = X( 1 - KB)
Where: X = calculated average value
KB= one-sided tolerance limit factor for normal distribution and sample size at P = 0.90
C,= coefficient of variation
A 30 specimen population and 8% coefficient of variation were assumed in calculating design properties giving a KB factor of 1.777.
Properties of the composite materials were projected to 1986 based on development work that is assumed will be accomplished in the intervening time period. These assumptions have been arrived at through conversations and communications with the manufacturers who are currently involved in research in the advanced composite field.
10
The manufacturers of graphite fibers are continuing to develop fibers with improved proper- ties. They currently have in the laboratory high strength and high modulus fibers that can be expected to be available on the market by 1986. However, no comparable forecast of improved properties has been obtained from the manufacturers of boron fibers. The basic process involving boron deposition on tungsten wire core has reached the upper limits of optimization. Boron has been successfully deposited on carbon monofilaments in the labora- tory (ref. 15), demonstrating a possible approach for development of lower density boron fibers. However, this work is in a preliminary stage, and there is no known program for further development and production of fibers in commercial quantities. Because of these circumstances, no further improvements in boron or borsic fiber properties have been assumed in estimating allowables of boron polyimide and borsic aluminum materials for the 1986 time period.
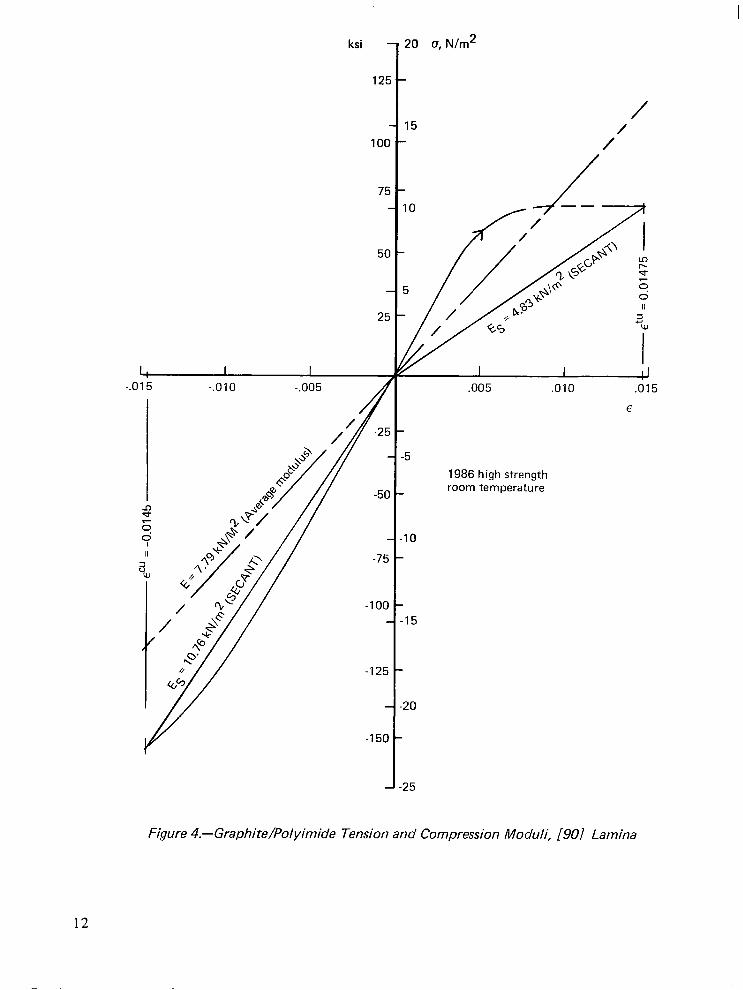
One of the basic problems associated with advanced composites utilizing organic matrices is localized cracking of the matrix produced by externally applied tensile loads. Matrix crack- ing results primarily from a combination of resin brittleness, fiber-to-fiber contact or proximi- ty, and tensile stress components acting perpendicular to the fibers. This problem was recognized several years ago in fiberglass/epoxy systems (ref. 16). Attempts to eliminate micro cracking have been successful through blending of low percentages (< 10%) of elasto- meric polymers into the matrix. The addition of elastomers is thought to greatly increase the fracture surface work in the matrix preventing the initiation of micro cracks. The technical personnel of Narmco, a major supplier of prepreg tapes, have stated that they foresee the application of high-temperature stable elastomers to polyimide or similar resin matrices to eliminate the micro cracking problem. Based on this information it has been assumed that development of polyimide matrix systems will permit design and fabrication of advanced composite material systems that are truly fiber critical within the next decade. Throughout the remainder of this study the composite laminates have been treated as fiber critical systems. This approach requires some adjustments of elastic properties and allowables of unidirectional laminae (specifically those involving shear stresses and normal stresses trans- verse to the fiber direction) to provide an approximation of nonlinear structural properties for use by a linear structural analysis program. When developing elastic moduli for use with the ATLAS stress and design modules (ref. 3) it was required that they be constant throughout the total range of loading at any given temperature. Thus, for example, the modulus of elasticity for tensile loads should be equal to that for compressive loads. The approach used to estab- lish elastic and mechanical properties is illustrated below, using the high-strength graphite/ polyimide values for illustrative purposes. In this discussion, a unidirectional lamina loaded parallel to the fibers is identified as a [ 0] lamina, and if loaded transverse to the fibers it is identified as a [90] lamina.
The tensile and compressive stress-strain relations for a [90] lamina are displayed graphically by the solid line in figure 4. The data are from a current-technology, matrix-critical system. For present purposes, the secant moduli at the critical fiber strains in tension and compression for a [90] lamina have been averaged (see fig. 4) to obtain a new value for use in analysis of multilayer laminates. While this change in modulus appears quite large, it should be emphasized that the contributions of the fibers to the stiffness of a fiber critical laminate is much greater than that of the matrix, and therefore this alteration of matrix property is inconsequential in predicting the stiffness of a [ 0, +45, or 901 laminate.
11
ksi -
125
100
75
50
25
-125
20 (5, N/m2
/ 15
/’
/
.005 .OlO .015
f
1986 high strength room temperature
.lO
-15
.20
,25
Figure 4.-Graphite/Polyimide Tension and Compression Moduli, [90/ Lamina
12

The data obtained from literature research did not identify shear properties of the candidate materials because of the difficulties typically encountered in rail and picture-frame shear testing. Data from properly conducted,.buckle-free torque tube tests were not available. Consequently, the shear properties were calculated using classical lamination theory (see ref. 17, sec. 4.2, pp 147 through 156). Poisson’s ratio for the [901 lamina was determined from the elastic moduli for [ 0] and [ 901 laminae and the value of Poisson’s ratio for the [0] lamina was calculated, using a theoretical relation for orthotropic materials (ref. 17, eq. (2.26), p 38).
A complete set of projected 1986 allowables and relevant physical properties of unidirec- tional laminae for the candidate advanced composite material systems are listed in tables 2 through 5.
MATERIAL SELECTION
Specific strengths and specific moduli of the candidate materials at room temperature are compared for symmetric laminates, [ 01 S and [ k451 S, in tables 6 and 7, based on the prop- erties shown previously in tables 2 through 5. This comparison indicates that high strength graphite has the highest specific strength while high modulus graphite has higher specific stiffness. Similar relations are found for 232 K (450” F). These materials were next used in the design of skins for honeycomb panels to provide a broader basis for engineering evaluation.
The minimum gages selected in reference 1 for titanium honeycomb skins were 0.254 and 0.381 mm (0.010 and 0.015 in.) for inner and outer face sheets, respectively, on the wing upper surface; corresponding values were 0.254 and 0.508 mm (0.010 and 0.020 in.) for the lower surface. These values were based on experience relating to effects of walking loads, material handling, hail damage, runway debris, practical fabrication limits, and lightning strike. It was recognized that the advanced composite materials are more susceptible to damage from impact and in general less forgiving than metals. Because of this, a somewhat arbitrary decision was made requiring that the local moment of inertia of each laminate shall be at least four times that of the titanium equivalent.
Ply thicknesses that were expected to be available by 1986 are 0.132 mm (5.2 mil), 0.178 mm (7.0 mil), and thicker for boron/polyimide; corresponding values for high strength graphite/polyimide are 0.0151 mm (2 mil), 0.076 mm (3 mil), 0.102 mm (4 mil), and thicker. Selected minimum gages and corresponding mass densities are presented in table 8 for symmetric laminates, [O/+45/90] , using the above ply thicknesses.
A review of the final wing structure from the study reported in reference 1 showed that approximately 50% of the titanium surface was minimum gage. The resized area is bounded generally by the rear spar, leading edge spar, side of body, and wing mounted fin. The control surfaces and the fixed leading edge structure were also minimum gage.
When using high strength graphite it was estimated that 30% to 35% of the resized portion would be minimum gage, and when using boron/polyimide 70% would be minimum gage.
13

Table 2.-Estimated Properties of High Strength Graphite/Polyimide Available in 1986 [Ol Lamina, Vf = 0.60
Design strengths B values
Elastic properties (typical)
Physical constants (typical)
Longitudinal tensile ultimate MPa (Ksi)
Transverse tensile ultimate MPa (Ksi)
Longitudinal compression MPa (Ksi) ultimate
Transverse compression MPa (Ksi) ultimate
lnplane shear ultimate MPa (Ksi)
lnterlaminar shear ultimate MPa (Ksi)
Ultimate longitudinal tensile @n/in strain
Compressive strain pin/in
Longitudinal tension modulus GPa (Msi)
Transverse tension modulus GPa (Msi)
Longitudinal compression GPa (Msi) modulus
Transverse compression GPa (Msi) modulus
lnplane shear modulus GPa (Msi)
Longitudinal Poisson’s ratio
Transverse Poisson’s ratio
Density kg/m3 ( Ib/in3)
Longitudinal coefficient PinlinPF of thermal expansion
Transverse coefficient /An/in/ OF of thermal expansion
Longitudinal thermal w BTU-in
conductivity mK hr-ft OF
Transverse thermal W BTU-in
conductivity mK hr-ft OF
Emissivity
tu FL
tu FT
cu FL
cu FT
su FLT
Fisu
tu EL
cu EL
E:
GLT
pLT
PTL
P
aL
aT
KL
KT
E
Room 506 K temperature (45O’F)
2034 (295)
115 (16.7)
1999
(290)
113 (16.4)
143 (20.8)
143 (20.8)
14 750
1827
(265) 94.5
(13.7)
1793
(260)
92.4 ( 13.4)
82.7 (12.0)
82.7 (12.0)
13 250
14 500 13 000
138 138 (20.0) (20.0)
7.79 7.10 (1.13) (1.03
138 138 (20.0) (20.0)
7.79 7.10 (1.13) (1.031
4.94 3.18 (0.717) (0.46:
0.31 0.31
0.018 0.011
1550.1 (0.056)
-0.17
17.0
1550.1 (0.05f
-0.17
17.0
23.1 (160)
2.3
(16)
0.85
14

Table 3.-Estimated Properties of High Modulus Graphite/Polyimide Available in 1986, [Ol Lamina, Vf = 0.60
Design strengths B values
Elastic properties (typical)
Physical constants (typical)
Longitudinal tensile ultimate MPa (Ksi)
Transverse tensile ultimate MPa (Ksi)
Longitudinal compression MPa (Ksi) ultimate
Transverse compression MPa (Ksi) ultimate
lnplane shear ultimate MPa (Ksi)
lnterlaminar shear ultimate MPa (Ksi)
Ultimate longitudinal tensile @n/in strain
Ultimate longitudinal pin/in compressive strain
Longitudinal tension modulus GPa (Msi)
Transverse tension modulus GPa (Msi)
Longitudinal compression GPa (Msi) modulus
Transverse compression GPa (Msi) modulus
I nplane shear modu Ius GPa (Msi)
Longitudinal Poisson’s ratio
Transverse Poisson’s ratio
Density kg/m3 (lb/in3
Longitudinal coefficient pin/in/ OF of thermal expansion
Transverse coefficient pinlinl OF of thermal expansion
Longitudinal thermal w B1 - conductivity mK hr-f
Transverse thermal W B- --
conductivity mK hr-f
Absorptivity
Emissivity
F:”
F:”
Fcu L
Fcu T
Fsu LT
Fisu
GLT
I-lLT
PTL
P
ffL
9
KL
KT
a
E
Room temperature
506 K (45OOF)
1020 (148)
46.2 (6.7)
869 (126)
39.3 (5.7)
42.7 (6.2)
42.7 (6.2)
3700
917 (133)
36.5 (5.3)
779 (113)
31.0 (4.5)
31.7 (4.6)
31.7 (4.6)
3325
3150 2825
276 (40.0)
12.4 ( 1.8)
276 (40.0)
12.4 (1.8)
6.76 (0.98)
0.29
0.013
276 (40.0)
11.0 (1.6)
276 (40.0)
11.0 (1.6)
5.65 (0.82)
0.29
0.012
1605 1605 (0.058) (0.058)
-0.4 -0.4
17.0 17.0
53.3 (370)
2.9 PO)
0.85
15
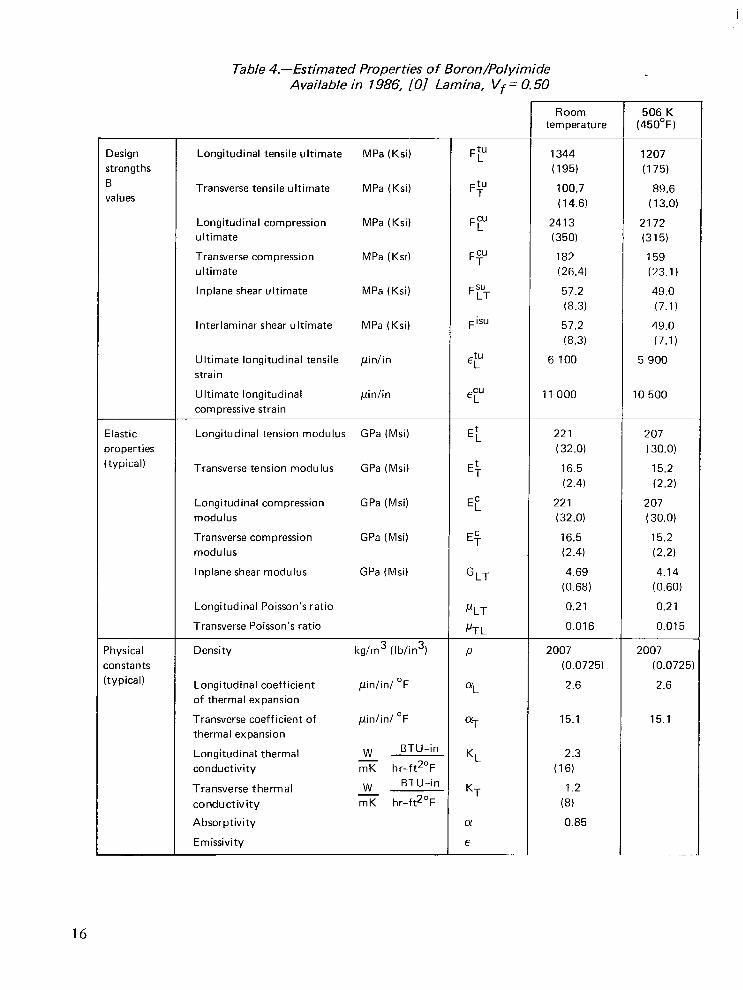
Table 4.-Estimated Properties of Boron/Polyimide Available in 1986, [Ol Lamina, Vf = 0.50
Design strengths B values
Elastic properties (typical)
Physical constants [typical)
Longitudinal tensile ultimate MPa (Ksi)
Transverse tensile ultimate MPa (Ksi)
Longitudinal compression MPa (Ksi) ultimate
Transverse compression MPa (Ksi) ultimate
lnplane shear ultimate MPa (Ksi)
lnterlaminar shear ultimate MPa (Ksi)
Ultimate longitudinal tensile pin/in strain
Ultimate longitudinal pin/in compressive strain
Longitudinal tension modulus GPa (Msi)
Transverse tension modulus GPa (Msi)
Longitudinal compression GPa (Msi) modulus
Transverse compression GPa (Msi) modulus
lnplane shear modulus GPa (Msi)
Longitudinal Poisson’s ratio
Transverse Poisson’s ratio
Density kg/m3 (lb/in31
Longitudinal coefficient ~inlinl OF of thermal expansion
Transverse coefficient of pin/in/ OF thermal expansion
Longitudinal thermal W BTU-in -
conductivity mK hr-ft20F
Transverse thermal W BTU-in
conductivity mK hr-ft2’F
Absorptivity
Emissivity
Ftu L
Ftu T
Fcu L
Fcu T
Fsu LT
F isu
EL
E:
ECL
GLT
I-1LT
PTL
P
%
QT
KL
KT
a
E
Room 506 K temperature (45O’F)
1344 (195)
100.7 (14.6)
2413 (350)
182 (26.4)
57.2 (8.3)
57.2 (8.3)
6 100
1207 (175)
89.6 (13.0)
2172 (315)
159 (23.1)
49.0 (7.1)
11000
49.0 (7.1)
5 900
10 500
221 207 (32.0) (30.0)
16.5 15.2 (2.4) (2.2)
221 207 (32.0) (30.0)
16.5 15.2 (2.4 (2.2) 4.69 4.14
(0.68) (0.60)
0.21 0.21
0.016 0.015
2007 2007 (0.0725) (0.0725)
2.6 2.6
15.1 15.1
2.3 (16)
1.2 (8) 0.85
16
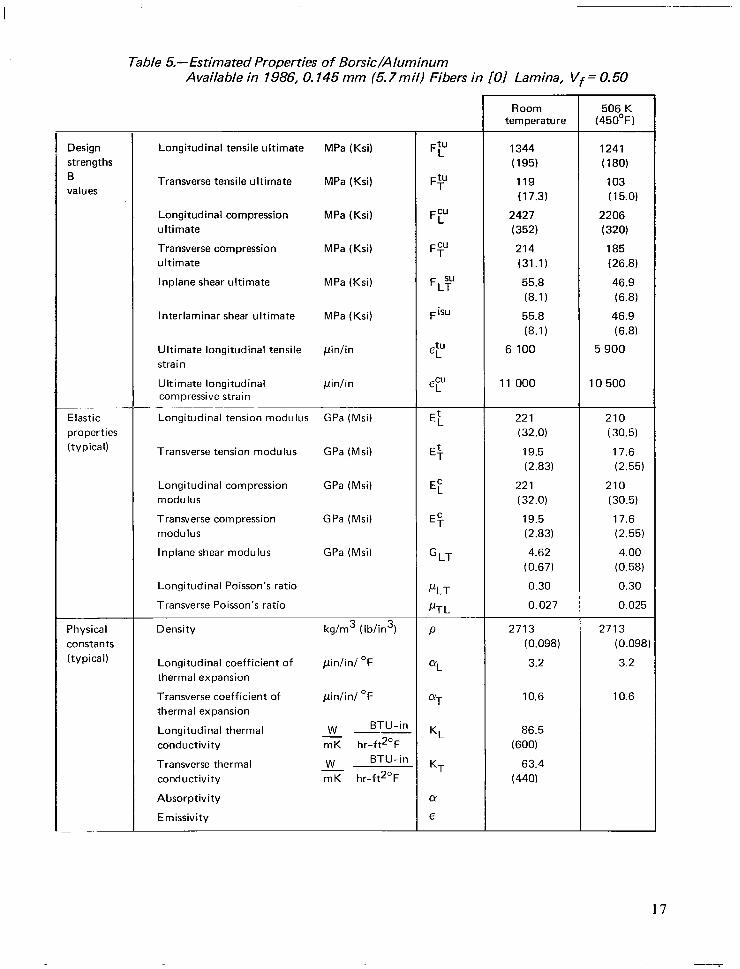
Table h-Estimated Properties of Borsic/Aluminum Available in 1986, 0.745 mm (5.7mil) Fibers in [Ol Lamina, Vf = 0.50
Design strengths B values
Elastic properties (typical)
Physical constants (typical)
Longitudinal tensile ultimate
Transverse tensile ultimate
Longitudinal compression ultimate
Transverse compression ultimate
lnplane shear ultimate
lnterlaminar shear ultimate
Ultimate longitudinal tensile stra i n
Ultimate longitudinal compressive strain
_- - Longitudinal tension modulus
Transverse tension modulus
Longitudinal compression modulus
Transverse compression modulus
lnplane shear modulus
Longitudinal Poisson’s ratio
Transverse Poisson’s ratio
MPa (Ksi)
MPa (Ksi)
MPa (Ksi)
MPa (Ksi)
MPa (Ksi)
MPa (Ksi)
/.linlin
pin/in
GPa (Msi)
GPa (Msi)
GPa (Msi)
GPa (Msi)
GPa (Msi)
Density kg/m3 ( Ib/in3)
Longitudinal coefficient of ~inlinl OF thermal expansion
Transverse coefficient of @n/in/ OF thermal expansion
Longitudinal thermal W BTU-in -- - conductivity mK hr-ft20F
Transverse thermal W BTU-in
conductivity mK hr-ft2’F
Absorptivity
Emissivity
Ffi”
F:”
Fcu L
Fcu T
FL?
F isu
GLT
PLT
I*TL
P
9
ffT
KL
KT
cd
E
Room temperature
1344 (195)
119 (17.3)
2427 (352) 214 (31.1)
55.8 (8.1)
55.8 (8.1)
6 100
11 000
221 (32.0)
19.5 (2.83)
221 (32.0)
19.5 (2.83)
4.62 (0.67)
0.30
0.027
2713 2713 (0.098) (0.098
3.2 3.2
10.6 10.6
86.5 (600)
63.4 (440)
506 K (45O’F)
1241 (180)
103 (15.0)
2206 (320)
185 (26.8)
46.9 (6.8)
46.9 (6.8)
5 900
10 500
210 (30.5)
17.6 (2.55)
210 (30.5)
17.6 (2.55)
4.00 (0.58)
0.30
0.025
17
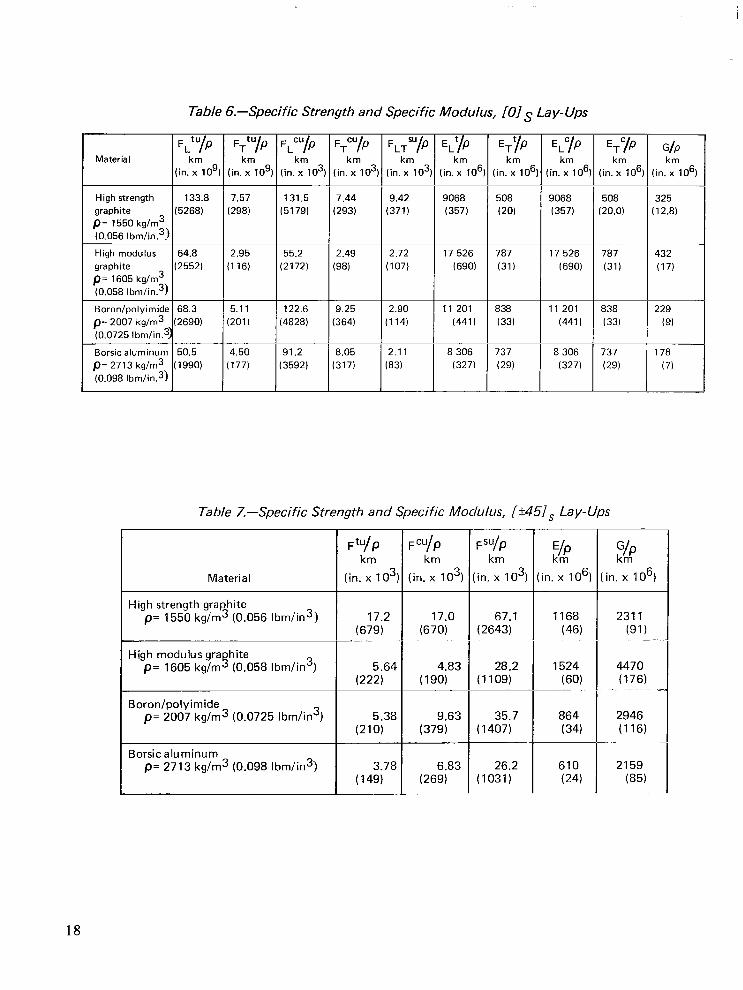
Table 6.-Specific Strength and Specific Modulus, [O] S La y-Ups - ‘) l
I T
EL% km
in. x lo6
ETfIP km
in. x lo6
FT tu
/p
(ifxk~lOg)
FLT “/p
(in.kxm103
EL”/P km
(in. x 10”
ETc/p km
[in. x lo61
G/P (in.kr106
325 (12.8)
High strength 133.8 graphite (5268) P= 1550 kg/m3 (0.056 Ibm/in.3!
High modulus 64.8 graphite P= 1605 kg/m3
(2552)
(0.058 Ibm/im3)
Boronlpolyimide 68.3 /I= 2007 kg/m3 (2690) (0.0725 Ibm/in.3)
Borsic aluminum 50.5 /I= 2713 kg/m3 (1990) (0.098 Ibm/in.3)
7.57 (298)
2.95 (116)
131.5 7.44 (5179) (293)
9.42 (371)
2.72 (1071
2.90 (114)
2.11 (83)
9068 (357)
17 526 (690)
8 306 (327)
508 (20)
787 (31)
838 (33)
737 (29)
9068 (357)
17 526 (690)
508 ‘20.0)
787 (31)
838 (33)
432 (17)
55.2 2.49 (2172) (98)
I 122.6 9.25 :4828) (364)
5.11 (201)
4.50 (177)
11 201 (441 I
8 306 (3271
229 (9)
178 (7)
737 (29)
Table 7.-Specific Strength and Specific Modulus, [?451, Lay-Ups
FfU!P Fcu/P Fsu/P km km km
(in. x 1 031 (in. x 103) ‘(in. x 103:
E/P km
in. x IO’)
1168 (46)
1524 (60)
864 (34)
610 (24)
%
in. x 10’)
2311 (91)
_
4470 (176)
2946 (116)
2159 (85)
Material
High strength graphite p= 1550 kg/m3 (0.056 Ibm/in3) 17.2
(679) 17.0
(670) 67.1
(2643)
High modulus gra hite p= 1605 kg/m (0.058 Ibm/in3) s
Boron/polyimide p= 2007 kg/m3 (0.0725 Ibm/in3)
28.2 (1109)
4.83 (190)
5.64 (222)
5.38 (210)
9.63 (379)
Borsic aluminum p= 2713 kg/m3 (0.098 Ibm/in3) 3.78
(149) 6.83
(269) 26.2
(1031)
18
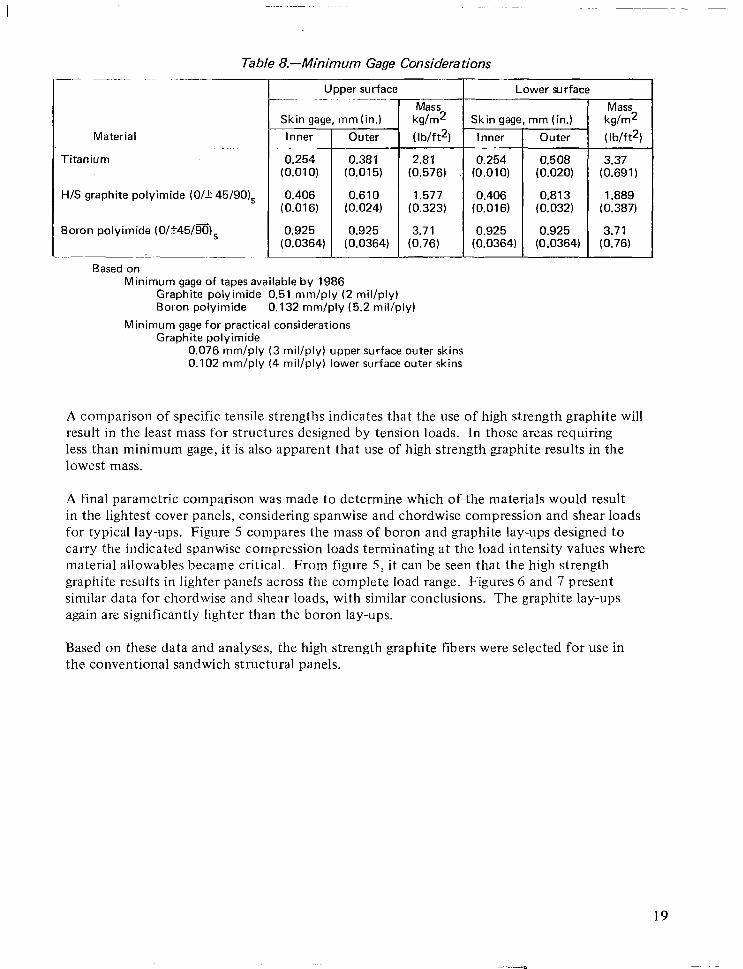
Table 8.-Minimum Gage Considerations
T Upper surface
Material
Titanium
Skin gag1
Inner
mm (in.)
Outer
0.254 0.381 (0.010) (0.015)
H/S graphite polyimide (O/k 45/90), 0.406 (0.016)
Boron polyimide (O/*45/!%), 0.925 (0.0364)
Based on Minimum gage of tapes available by 1986
T
0.610 (0.024)
0.925 (0.0364)
Mass kg/m2
( Ib/ft2)
t
2.81 (0.576)
1.577 (0,323)
3.71 (0.76)
Lower surface
Skin gagf
Inner
0.254 (0.010)
0.406 (0.016)
0.925 (0.0364)
2, I
mm (in.)
Outer
0.508 (0.020)
0.813 (0.032)
0.925 (0.0364)
T 1
Mass kg/m2
( Ib/ft2)
3.37 (0.691)
1.889 (0.387)
3.71 (0.76)
Graphite polyimide 0.51 mm/ply (2 mil/ply) Boron polyimide 0.132 mm/ply (5.2 mil/ply)
Minimum gage for practical considerations Graphite polyimide
0.076 mm/ply (3 mil/ply) upper surface outer skins 0.102 mm/ply (4 mil/ply) lower surface outer skins
A comparison of specific tensile strengths indicates that the use of high strength graphite will result in the least mass for structures designed by tension loads. In those areas requiring less than minimum gage, it is also apparent that use of high strength graphite results in the lowest mass.
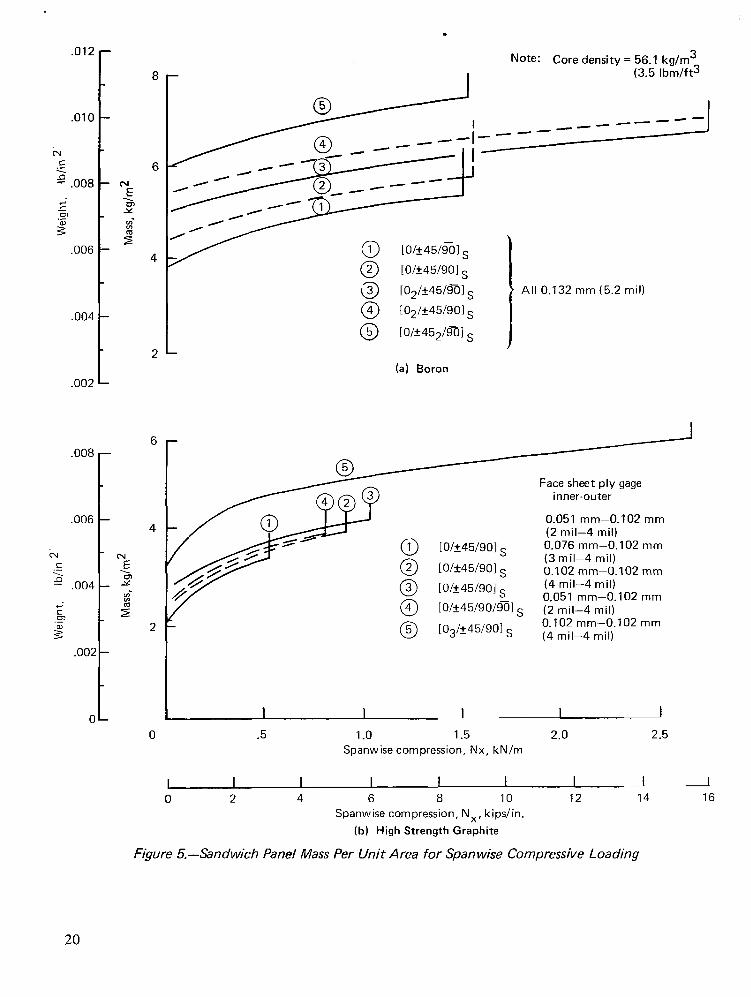
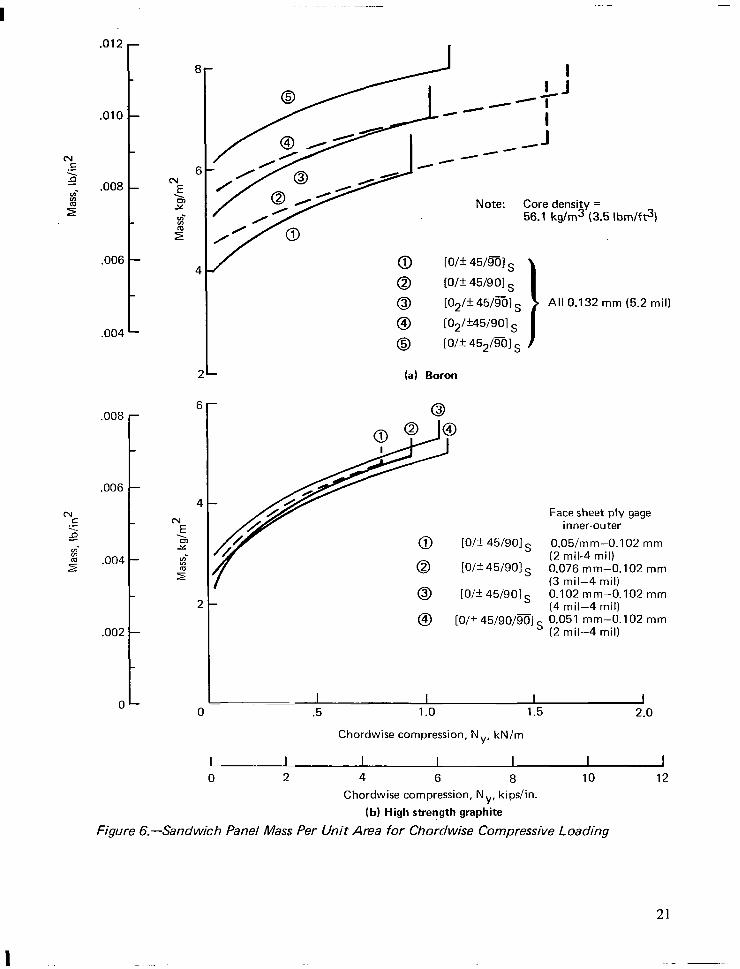
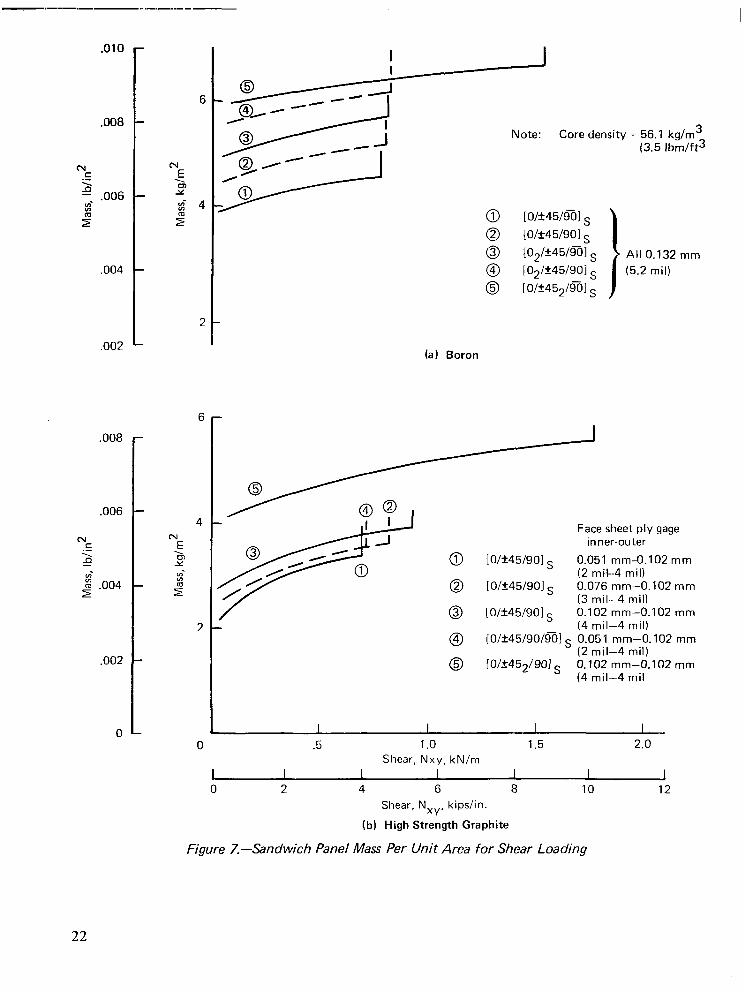
A final parametric comparison was made to determine which of the materials would result in the lightest cover panels, considering spanwise and chordwise compression and shear loads for typical lay-ups. Figure 5 compares the mass of boron and graphite lay-ups designed to carry the indicated spanwise compression loads terminating at the load intensity values where material allowables became critical. From figure 5, it can be seen that the high strength graphite results in lighter panels across the complete load range. Figures 6 and 7 present similar data for chordwise and shear loads, with similar conclusions. The graphite lay-ups again are significantly lighter than the boron lay-ups.
Based on these data and analyses, the high strength graphite fibers were selected for use in the conventional sandwich structural panels.
19
.012
.OlO
.004
.002
.008
,006
,-
l-
8
6
4
“E
- 3
2 5
2
0
Note: Core density = 56.1 kg/m3
I
(3.5 Ibm/ft3
(2J [o/*45/901 s
3 [02/f45/%)1 s
@ [O$f45/901 s
[o/k&2/~] s
(a) Boron
i
All 0.132 mm (5.2 mil)
I
Face sheet ply gage inner-outer
0.051 mm-O.102 mm (2 mil-4 mil)
[O/%45/901 s 0.076 mm-O.102 mm
[0/*45/901 s (3 mil-4 mil) 0.102 mm-O.102 mm
[0/~45/901 s (4 mil-4 mil)
[0/+45/90/9~1 S 0.051 mm-O.102 mm (2 mil-4 mil)
[02J&45/901 s 0.102 mm-O.102 mm (4 mil-4 mil)
.5 1.0 1.5 Spanwise compression, Nx, kN/m
2.0 2.5
I I I I I I I I 0 2 4 6 8 IO 12 14
Spanwise compression, N,, kips/in.
(b) High Strength Graphite
Figure h-Sandwich Panel Mass Per Unit Area for Spanwise Compressive Loading
I 16
20
.012
.OlO
cv .E 4 m- .008
2
.006
,004
,008
.006
cv 4 P In-
2 .004
.002
0
S-
4d
2-
/ 0 [O/f 45/!TOls
0 [O/k 45/901 s
0 [02B 45/!BI s
@ [op45/901 s
0 [o/f 4s2/m] s
(a) Boron
0
Face sheet ply gage inner-outer
0 [O/f 451901 c O.O5/mm-0.102 mm - J
0 (2 mil-4 mil)
[O/k 451901 c 0.076 mm-O. 102 mm ” (3 mil-4 mil)
0 [O/f 451901 s 0.102 mm-O.102 mm (4 mil-4 mill
@ [O/f 45/90/!%1 s r);O;;l~4-n--i; 102 mm
I I I I .5 1.0 1.5 2.0
Chordwise compression, NY, kN/m
-/-- J
Note: Core density = 56.1 kg/m3 (3.5 Ibm/ft3)
1 All 0.132 mm (5.2 mil)
0 2 4 6 8 10 Chordwise compression, NY, kips/in.
(b) High streygth graphite
Figure 6.-Sandwich Panel Mass Per Unit Area for Chordwise Compressive Loading
12
21
.--.--.-- . ..-- .-__ -__-
.OlO
.008
m .G B ,- .006
2
.004
,002
.006
6
6
Note: Core density = 56.1 kg/m3 (3.5 Ibm/ft3
0 [0/~45/rnl s @ [o/*45/901 s @ [02/f45ml s All 0.132 mm @I [02/‘45/901 s (5.2 mil)
@ [0/f452/%jl s
(a) Boron
Face sheet ply gage inner-outer
[o/*45/901 s 0.051 mm-O.102 mm (2 mil-4 mil)
10/+45/901 s 0.076 mm-O.102 mm (3 mil-4 mill
[o/*45/901 s 0.102 mm-O.102 mm (4 mil-4 mil)
[O/*45/90/931 s 0.051 mm-O. 102 mm (2 mil-4 mil)
LO/-e452/901 s 0.102 mm-O.102 mm (4 mil-4 mil
I 0
I I I I .5 1.0 1.5 2.0
Shear, Nxy, kN/m I I I I I I
2 4 6 8 10 12 Shear, Nxy, kips/in.
(b) High Strength Graphite
Figure 7.-Sandwich Panel Mass Per Unit Area for Shear Loading
22
COMPOSITE ANALYSIS AND SIZING
The analysis of composite structure has several significant differences from that of conven- tional metal structure. The composite is made up of plies, each being strongly orthogonal in properties, possessing the mechanical properties of the fibers in the longitudinal direc- tion, and the properties of the matrix material in the lateral direction. Because of this orthogonal nature, the analysis and design of composite lay-ups must recognize the quantity of material in each ply, as well as the angular orientation of the plies making up the laminate. This, of course, required the development of new elements for use in the ATLAS program. Also, the implementation requires the definition of failure criteria for use in resizing and an optimization procedure that will lead to a proper design. The following sections describe the structural elements used in the ATLAS analysis and the design and optimization procedure.
STRUCTURAL FINITE ELEMENTS
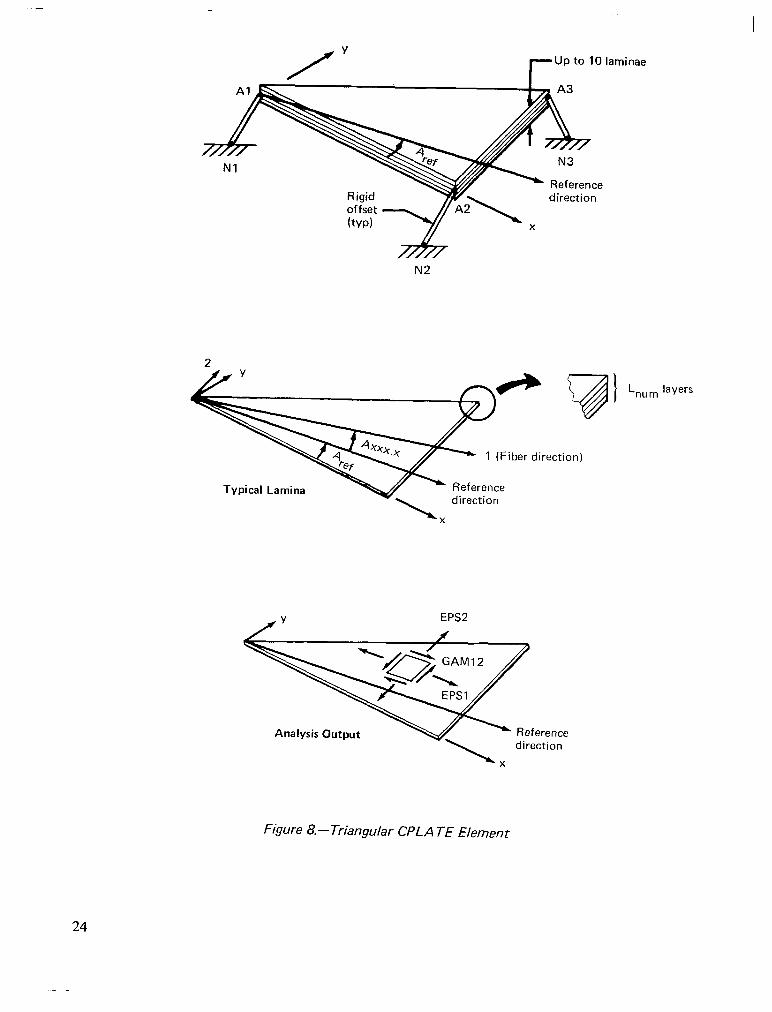
Two special purpose elements, CPLATE and CCOVER, were added to the ATLAS system under the ATLAS development contract, NAS l-l 29 11. The CPLATE element shown in figure 8 is used to model advanced composite membrane elements. The triangular or quad- rilateral membrane element may be composed of as many as 10 orthotropic laminae. Each lamina is composed of a number of uniaxial plies having a common fiber direction. The triangular CPLATE is a constant strain element. The quadrilateral CPLATE is composed of four constant strain triangles intersecting at an internal unloaded node. Displacements at the internal unloaded node are eliminated by a static condensation process. If warped, the quadrilateral CPLATE is equilibrated by transverse forces. As indicated at the top of figure 8, the element may be offset from its structural nodes. AREF defines the reference direction for the element. A typical lamina, illustrated in the middle of figure 8 is defined by the following properties:
Axxx.x = fiber direction of the lamina relative to the reference direction of the element
Txxx = temperature increment of the lamina relative to the element
Lnum = specifies the number of uniaxial plies
Ccode = identifies the composite material
Output from the analysis consists of the following three quantities, illustrated at the bottom of figure 8:
EPSl = axial strain in the reference direction
EPS2 = axial strain perpendicular to the reference direction
GAM12 = shear strain
23
r Up to 10 laminae
Nl k RZZrence
.7\ direction
2
Tvoical I amina
EPS2
Analysis Output
Figure 8.-Triangular CPLA TE Element
24
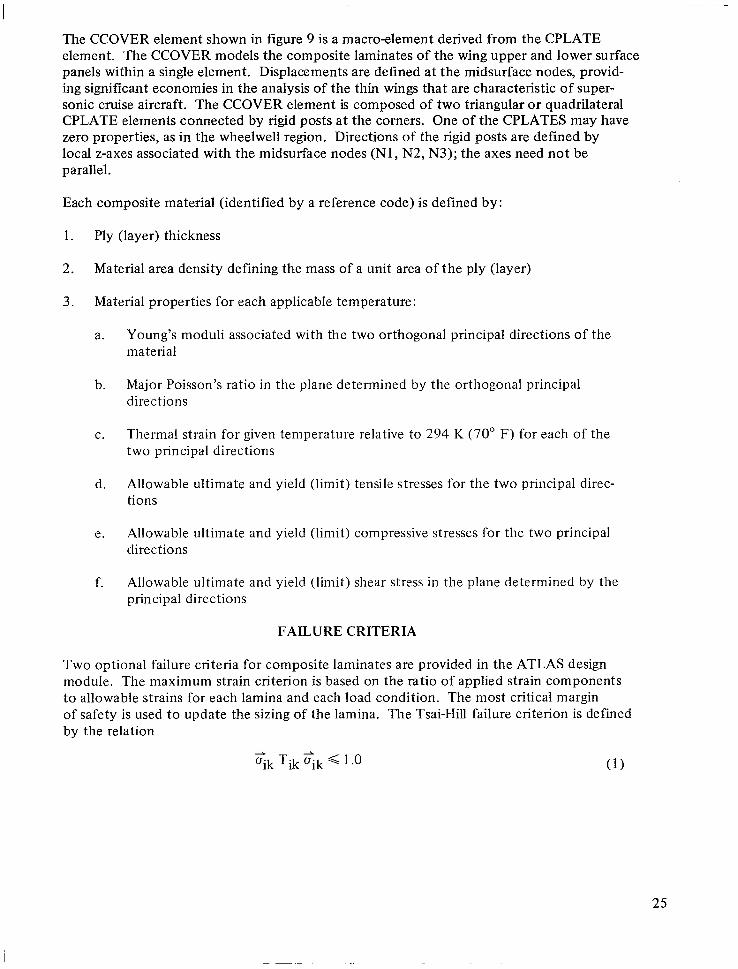
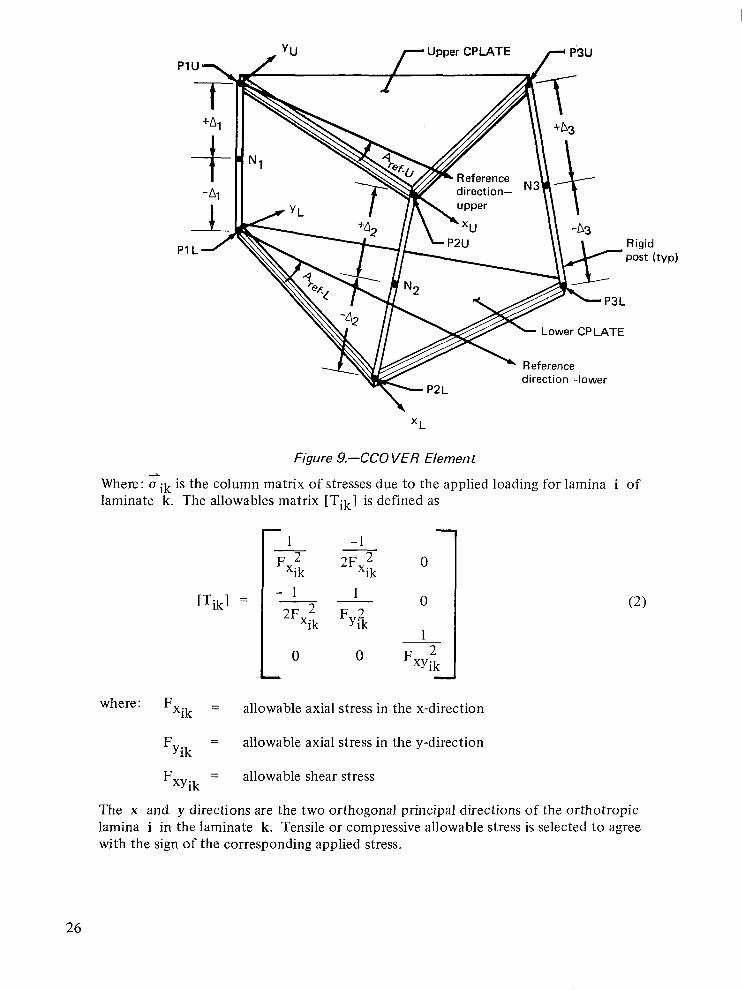
The CCOVER element shown in figure 9 is a macro-element derived from the CPLATE element. The CCOVER models the composite laminates of the wing upper and lower surface panels within a single element. Displacements are defined at the midsurface nodes, provid- ing significant economies in the analysis of the thin wings that are characteristic of super- sonic cruise aircraft. The CCOVER element is composed of two triangular or quadrilateral CPLATE elements connected by rigid posts at the corners. One of the CPLATES may have zero properties, as in the wheelwell region. Directions of the rigid posts are defined by local z-axes associated with the midsurface nodes (Nl, N2, N3); the axes need not be parallel.
Each composite material (identified by a reference code) is defined by:
1. Ply (layer) thickness
2. Material area density defining the mass of a unit area of the ply (layer)
3. Material properties for each applicable temperature:
a. Young’s moduli associated with the two orthogonal principal directions of the material
b. Major Poisson’s ratio in the plane determined by the orthogonal principal directions
C. Thermal strain for given temperature relative to 294 K (70” F) for each of the two principal directions
d. Allowable ultimate and yield (limit) tensile stresses for the two principal direc- tions
e. Allowable ultimate and yield (limit) compressive stresses for the two principal directions
f. Allowable ultimate and yield (limit) shear stress in the plane determined by the principal directions
FAILURE CRITERIA
Two optional failure criteria for composite laminates are provided in the ATLAS design module. The maximum strain criterion is based on the ratio of applied strain components to allowable strains for each lamina and each load condition. The most critical margin of safety is used to update the sizing of the lamina. The Tsai-Hill failure criterion is defined by the relation
~ik Tik ~ik G 1.0 (1)
25
r Upper CPLATE
Rigid post (1
Lower CPLATE
Figure 9.-CC0 VER Element
Where: ~ik is the column matrix of stresses due to the applied loading for lamina i of laminate k. The allowables matrix [Tik] is defined as
[Q] = -1 - 1 2F2
0 ‘ik
F2 yik
(2)
where: F Xik = allowable axial stress in the x-direction
F Yik = allowable axial stress in the y-direction
F XYik = allowable shear stress
The x and y directions are the two orthogonal principal directions of the orthotropic lamina i in the laminate k. Tensile or compressive allowable stress is selected to agree with the sign of the corresponding applied stress.
VP)
26
The allowables matrix must be positive definite; otherwise for certain stress fields the expression on the left of equation (1) would remain negative for any lamina thickness. It is sufficient that the determinant of the matrix [Tik] , given by
ITikI = k& [<(tik - &)I C3) shall be positive. It follows that we must have
which implies that the axial stress allowable of the lamina (fiber direction) are associated with the x-direction.
OPTIMIZATION PROCEDURE
Optimization of advanced composite in ATLAS is restricted to the sizing of CPLATE and CCOVER elements. The structure is divided into a number of regions and independent optimization procedures are implemented for each region. A region may be defined as any portion of the structure, ranging from a single element to the entire structure. Mass is the merit function. Optimization of the structure thus involves the minimization of mass for each of the regions comprising the complete structure.,
The optimization process for a single region may be defined in the following manner (see fig. 10). Within the region containing a set of elements (Ek), a design subset (Eks) is selected. It is required that all elements in Ek have the same number of laminae and identical lamina orientations. Lamina thicknesses are treated as real variables. For the first iteration, laminate element loads and stresses or strains are determined for the design load cases and an initial set of lamina thicknesses. Each cycle involves a screening or definition, phase, and a solution phase. During the screening phase, the subset Eks is examined to locate the critical element and load case for each lamina of the laminate. The lamina thicknesses are then varied during the solution process to minimize the laminate mass while laminate elements loads, determined with initial sizing, are held constant. The optimization procedure requires repeated evalua- tion of stresses or strains as the design variables (lamina thicknesses) change. Optimization is based on the method of feasible directions, Zoutendyk’s method, described in reference 17.
After the optimization cycle is completed, the screening operation is repeated. If the same element and load case is critical for each lamina, the solution is complete. Otherwise, another optimization is performed, subject to the newly defined constraints. This iteration is repeated until the constraint definitions have stabilized or for a maximum of 10 times for each region.
After the optimization problem has been solved for real values of the design variables, each value is then transformed to an integer number of layers (plies) to describe the actual laminate. Since the primary purpose is to establish theoretical structural mass, the real-to- integer transformation is based on an averaging concept. For example, 6.3 layers would be rounded to 6 layers. This obviously does not insure positive margins throughout the structure, but is expected to yield a realistic estimate of total structural mass.
27
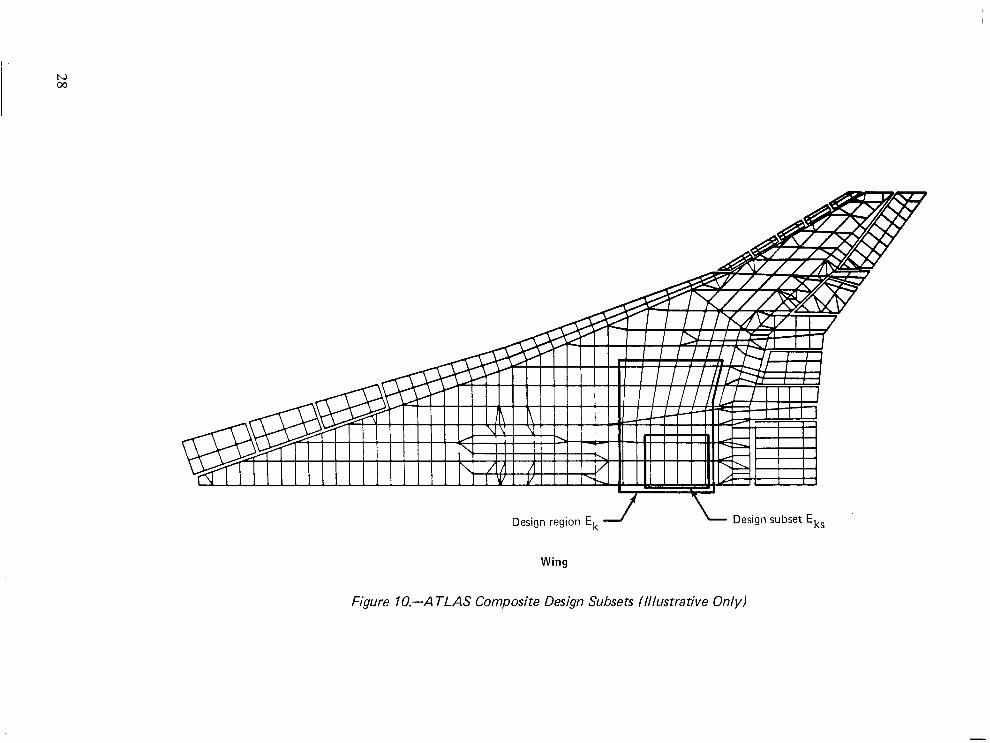
Design region Ek J Design subset Eks
Wing
Figure 1 O.-A TLAS Composite Design Subsets (lllustra tive Only)
THE STRUCTURAL MODEL
The geometry of the structural model tM was developed for the study of metallic structural design concepts (refs. 1 and 2) was used without change for the present study. The major portion of this model is shown in figure 11. The half-airplane model contains approximately 2000 nodes, 4200 elements, and 8500 active degrees of freedom; for dynamic analyses a much smaller number of degrees of freedom were retained (22.5 for symmetric conditions and 260 for antisymmetric conditions). The complexity of the model results from (1) the use of one model for stress, loads, and flutter analyses, and (2) the detail requirements for meaningful flutter analysis. For the wing, these requirements include structural modeling of the engine beams (allowing complete c.g. motion of the engines), leading- and trailing-edge controls, wing secondary structure, landing gear and wheelwell cut-outs, major access doors, and wing mounted fins as well as wing primary structure. For the rest of the aircraft, these include a detailed body idealization for wing attachment and a less sophisticated representa- tion of the remaining fuselage and the empennage.
WING
The cover panels of the main wing box were replaced by honeycomb sandwich panels with face sheets and core composed of high strength graphite/polyimide material. It was assumed that the face sheets were laid up in balanced symmetrical arrays of laminae to avoid problems of bending-stretching coupling under load and during manufacturing. The material properties previously discussed, and listed in table 1, were used for analysis and design.
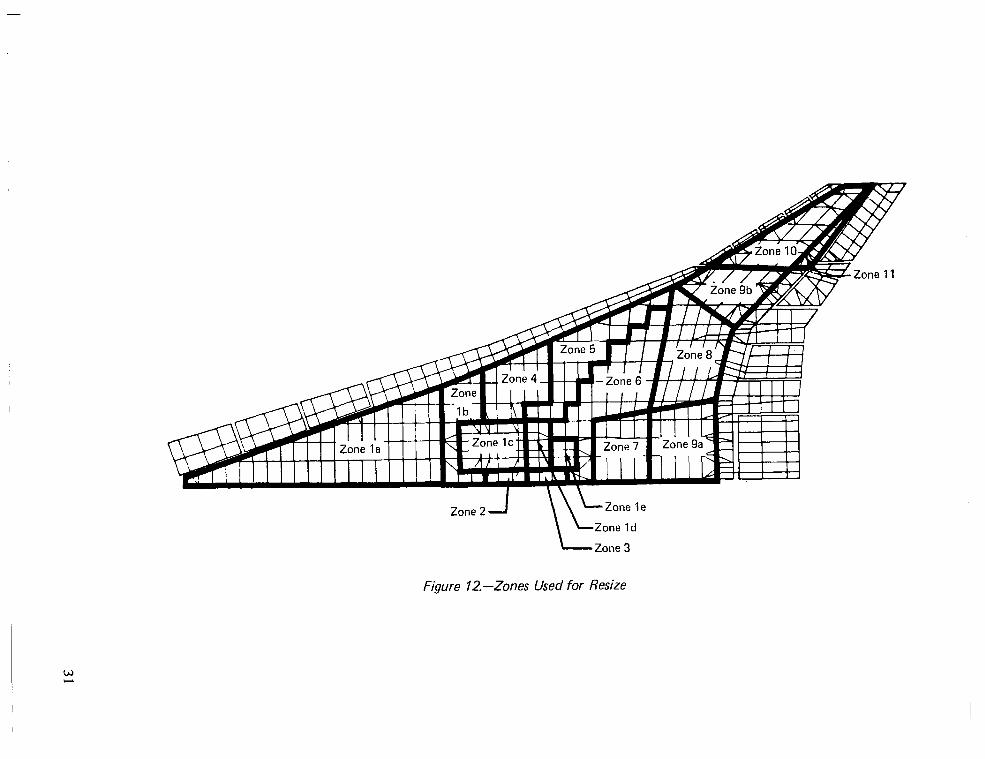
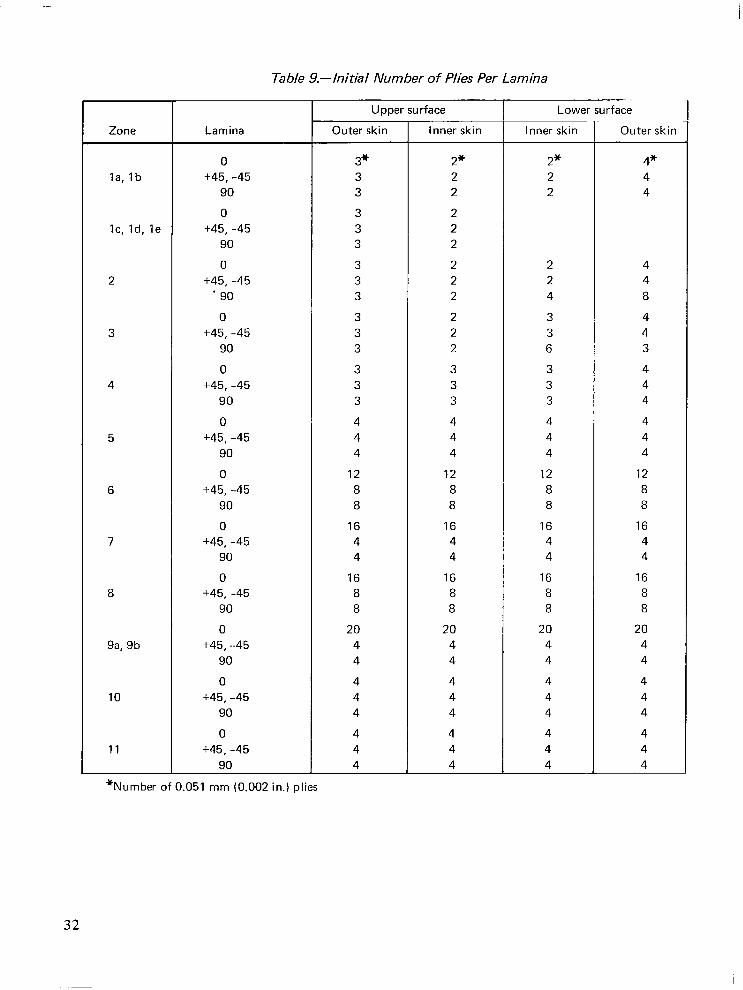
Loads from the design study of the metallic structure were used for preliminary hand sizing of the composite wing shell. The wing surface panels of the main wing box were divided into 16 zones for preliminary sizing input. Each zone was defined to include a number of panels that would be subjected to similar spanwise, chordwise, and shear load components or that would be designed by the same constraint conditions, such as minimum gage. These zones are shown in figure 12. Zones 10 and 11 on the wing tip are in a region of minimum gage; they were also included to be used at a later stage of the design process in resizing for stiffness to satisfy flutter criteria. Preliminary sizing estimates for the wing panels are listed in table 9.
The structure of the wing mounted fin was not changed in this study, except by substitution of equivalent properties of a quasi-isotropic layup of high strength graphite/polyimide.
Graphite/polyimide sandwich construction was used in modeling leading - and trailing-edge structures. Since design loads were not available for these components, the advanced composite surfaces were designed to have the same inplane stiffnesses as the final titanium structure, i.e.;
- EtTi = E7GR/PI (4)
Composite surfaces with about one and one-half times the compressive strength and twice the shear strength of the titanium surfaces were obtained, using this procedure.
29
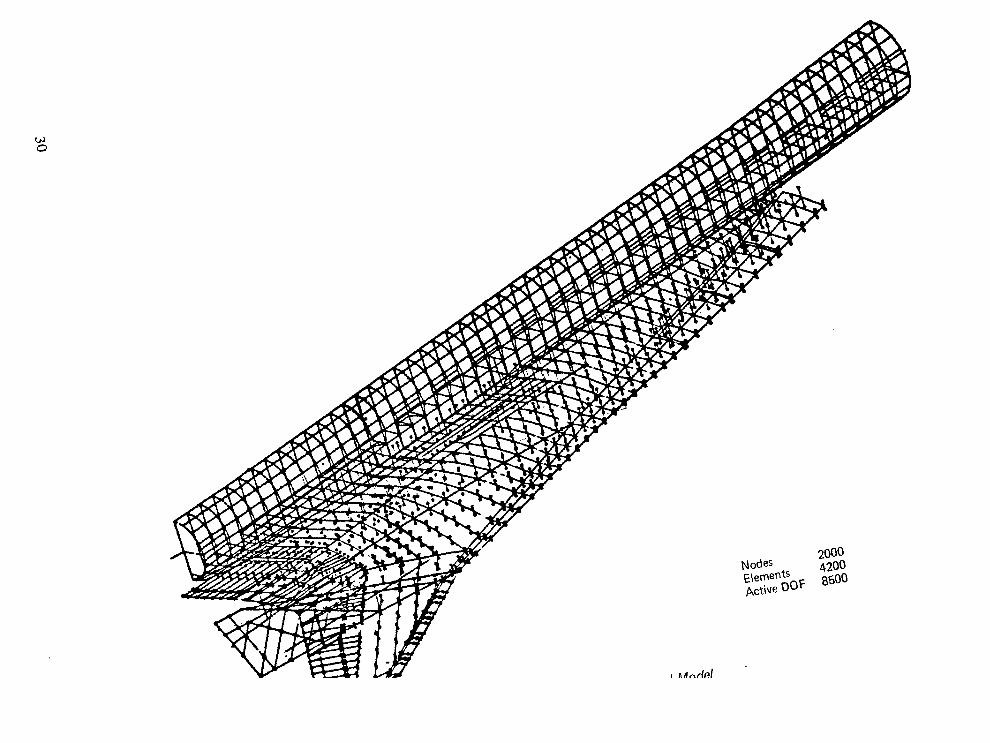
Nodes 2000
E\ementS 4200
Active t)oF 8500
-
Figure 12.-Zones Used for Resize
Zone Lamina Outer skin inner skin Inner skin Outer skin
la, lb 2’ 2 2
4* 4 4
Ic, Id, Ie
2
3
4
5
6
7
8
9a, 9b
10
II
0 3” 2” +45, -45 3 2
90 3 2
0 3 2 +45, -45 3 2
90 3 2
0 3 2 +45, -45 3 2
* 90 3 2
0 3 2 +45, -45 3 2
90 3 2
0 3 3 +45, -45 3 3
90 3 3
0 4 4 +45, -45 4 4
90 4 4
0 I2 I2 +45. -45 8 8
90 8 8
0 16 I6 +45, -45 4 4
90 4 4
0 I6 I6 +45, -45 8 8
90 8 8
0 20 20 +45, --45 4 4
90 4 4
0 4 4 +45, -45 4 4
90 4 4
0 4 4 +45, -45 4 4
90 4 4
2 4 2 4 4 8
3 4 3 4 6 3
3 4 3 4 3 4
4 4 4 4 4 4
12 I2 8 8 8 8
I6 I6 4 4 4 4
16 I6 8 8 8 8
20 20 4 4 4 4
4 4 4 4 4 4
4 4 4 4 4 4
Table 9.-Initial Number of Plies Per Lamina
T Upper surface T Lower surface 1 1
*Number of 0.051 mm (0.002 in.) plies
FUSELAGE
The principal requirement in modifying the fuselage model was to provide equivalent vibra- tion characteristics of a strength designed composite fuselage. It was also necessary that the strain under static load conditions be properly simulated in regions where the wing and body structures interact. Effective skin and lumped stringer cross-sectional areas were introduced to simulate stringers and beams in the fuselage of the titanium model. Alternate frames were modeled with equivalent area for two frames and effective skin, since the frame spacing is 0.89 m (35 in.) in the model and half that value in the airplane. Skins were repre- sented in the ATLAS model as S plates, which only carry shear.
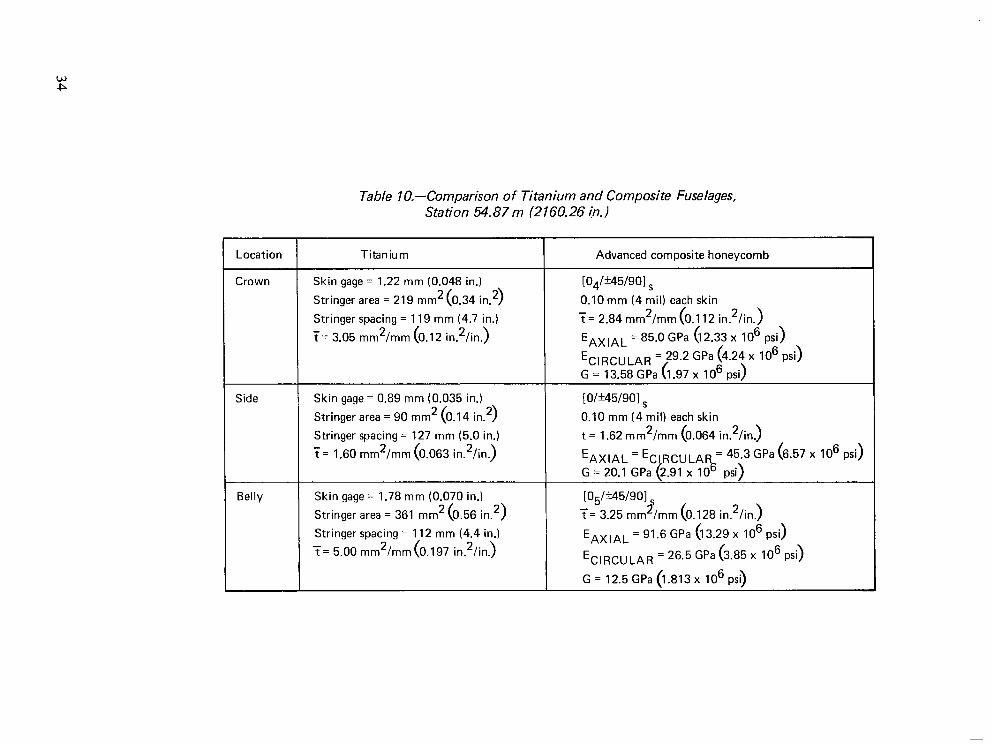
Section properties of the titanium elements from the prior analysis were retained in the present study and stiffness changes were accounted for by altering elastic properties of the material. Comparative values of titanium and composite skin gages, stringer areas and spacings, effective moduli, and thicknesses for a representative fuselage station are presented in table 10 and summarized for five stations in table 11.
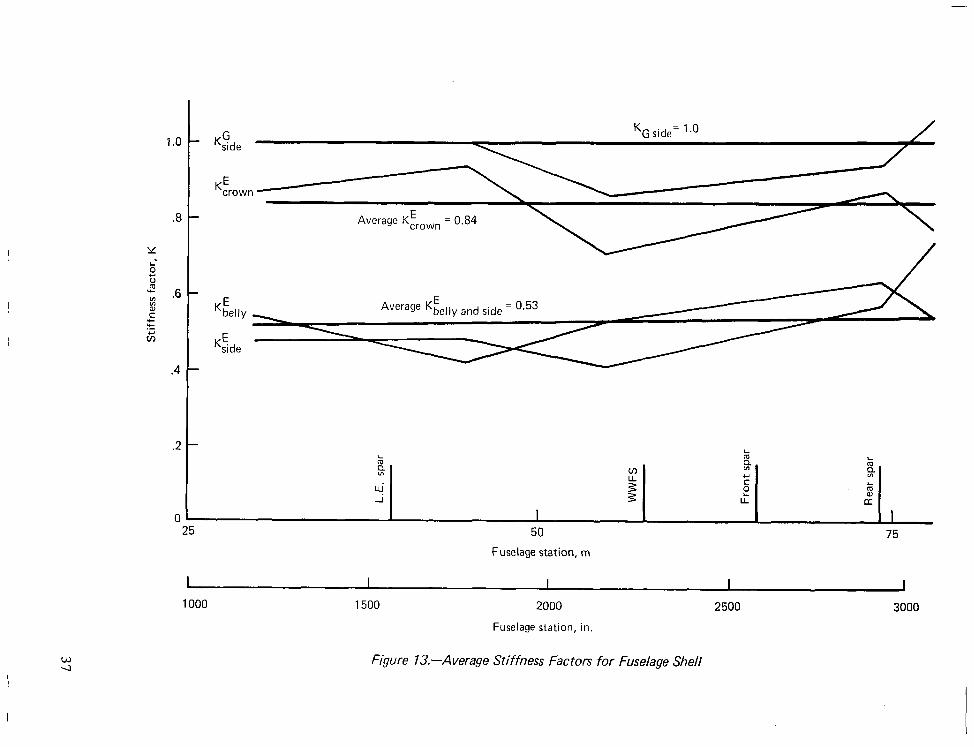
Other significant considerations are the variations of crown and belly stiffness distributions as functions of load factor. Because of the effect of buckling, as the load factor increases, the compression side of the skin-stringer fuselage becomes less effective. Generally the criteria for the National SST prototype was no skin buckling up to a load factor of 1 .l for aero- dynamic reasons. The sandwich panels, on the other hand, are sized for no buckling up to ultimate load, and, therefore, will show little effect of variations in load factor. Based on these considerations, it is concluded that the stiffness characteristics of the skin-stringer fuselage are representative of the airplane in unaccelerated flight but are somewhat high as limit load factor is approached. On the other hand, the stiffness characteristics of the metallic fuselage with sandwich panels are unaffected up to limit load.
Based on the previous discussion, the modulus of elasticity of titanium was ratioed to achieve the correct value of Et for the composite fuselage. The ratios are listed in table 1 1 and presented graphically in figure 13. After reviewing these data, it was decided to use the average ratios shown in figure 13 in modifying the fuselage model.
33
w P
Table lO.-Comparison of Titanium and Composite Fuselages, Station 54.87 m (2160.26 in.)
Location
Crown
Titanium
Skin gage = 1.22 mm (0.048 in.)
Stringer area = 219 mm 2( 9 0.34 in.
Stringer spacing = 119 mm (4.7 in.)
T= 3.05 mm2/mm ( 0.12 in.2/in .>
Advanced composite honeycomb
[04/*45/901 s 0.10 mm (4 mil) each skin
y= 2.84 mm2/mm ( 0.112 in.2/in. > E AXlAL = 85.0 GPa (12.33 x 10 6 3 PSI
EC,BCULAR = 29.2 GPa (4.24 x lo6 psi)
G = 13.58 GPa (1.97 x lo6 psi)
Side
Belly
Skin gage = 0.89 mm (0.035 in.)
Stringer area = 90 mm2 (0.14 in.2)
Stringer spacing = 127 mm (5.0 in.)
? = 1.60 mm2/mm (0.063 in2/in.)
Skin gage = 1.78 mm (0.070 in.)
Stringer area = 361 mm2 (0.56 in.2)
Stringer spacing = 112 mm (4.4 in.)
( i= 5.00 mm2/mm 0.197 in.2/in .)
[O/M5/90] s
0.10 mm (4 mil) each skin
t = 1.62 mm2/mm 0.064 in.2/in ( .I E &y.;LAy ,,‘,c(,Ry;AY=, GPa (6.57 x lo6 psi)
~~‘~~~‘/rnrn (0.128 in.2/in.)
E AX,AL = 91.6 GPa (13.29 x IO6 PSI 9
ECIRCULAR = 26.5 GPa (3.85 x lo6 psi)
G = 12.5 GPa (1.813 x lo6 psi)
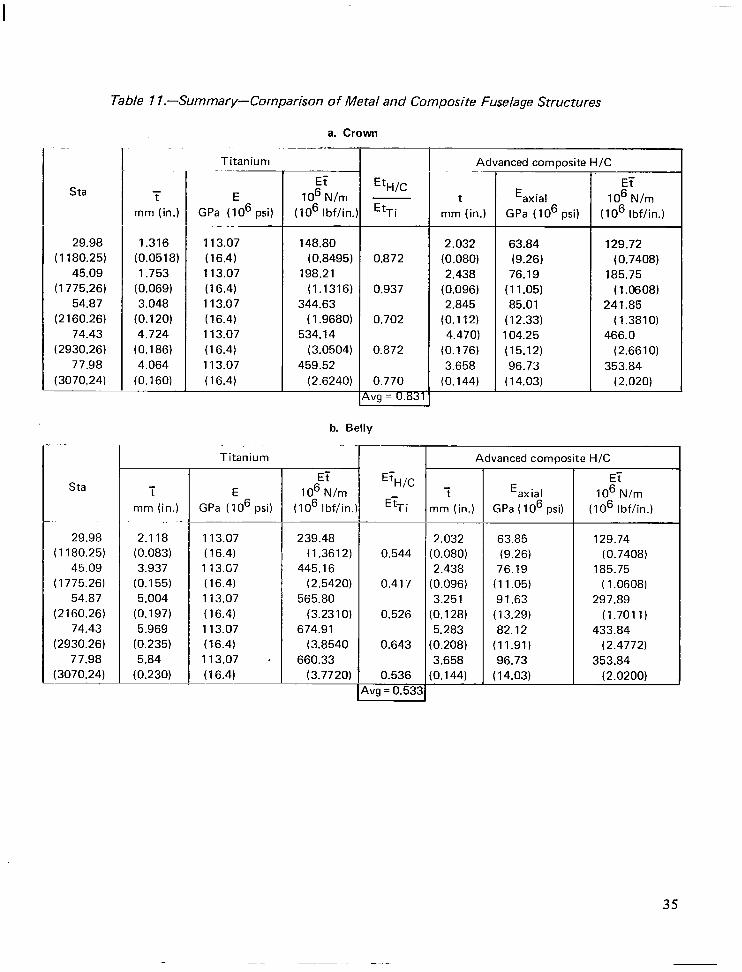
Table I I.-Summary-Comparison of Metal and Composite Fuselage Structures
a. Crown
T Sta
29.98 ( 1180.25)
45.09 (1775.26)
54.87 (2160.26)
74.43 (2930.26)
77.98 (3070.24) ~~
Titanium Advanced composite H/C
ET lo6 N/m
(lo6 Ibf/in.
148.80 (0.8495)
198.21 (1.1316)
344.63 ( 1.9680)
534.14 (3.0504)
459.52 (2.6240)
EtH/C
EtTi
0.872
0.937
0.702
0.872
0.770 rvg = 0.831
b. Belly
T
ET lo6 N/m
( IO6 Ibfh.)
129.72 (0.7408)
185.75 (1.0608)
241.85 (1.3810)
466.0 (2.6610)
353.84 (2.020)
Eaxial GPa (lo6 psi)
63.84 (9.26)
76.19 (11.05) 85.01
(12.33) 104.25 (15.12) 96.73
( 14.03)
E GPa (lo6 psi)
i mm (in.)
1.316 (0.0518) 1.753
(0.069) 3.048
(0.120) 4.724
(0.186) 4.064
(0.160)
t mm (in.)
2.032 (0.080) 2.438
(0.096) 2.845
(0.112) 4.470)
(0.176) 3.658
(0.144)
113.07 (16.4) 113.07 (16.4) 113.07 (16.4) 113.07 (16.4) 113.07 (16.4)
Sta
29.98 ( 1180.25)
45.09 (1775.26)
54.87 (2160.26)
74.43 (2930.26)
77.98 (3070.24)
1 Titanium Advanced composite H/C
E’H/C
EtTi
ET lo6 N/m
(IO6 Ibf/in.
239.48 (1.3612)
445.16 (2.5420)
565.80 (3.2310)
674.91 (3.8540
660.33 (3.7720)
ET lo6 N/m
(IO6 Ibfh.)
129.74 (0.7408)
185.75 ( 1.0608)
297.89 (1.7011)
433.84 (2.4772)
353.84 (2.0200)
Eaxial GPa ( 1 O6 psi)
63.85 (9.26)
76.19 (11.05) 91.63
(13.29) 82.12
(11.91) 96.73
(I 4.03)
E GPa ( lo6 psi)
T mm (in.)
2.118 (0.083) 3.937
(0.155) 5.004
(0.197) 5.969
(0.235) 5.84
(0.230)
T mm (in.)
2.032 (0.080) 2.438
(0.096) 3.251
(0.128) 5.283
(0.208) 3.658
(0.144)
13.07 16.4) 13.G7 16.4) 13.07 16.4)
0.544
0.417
0.526
0.643
0.536 4vg = 0.532
113.07 (16.4) 113.07 - (16.4)
35
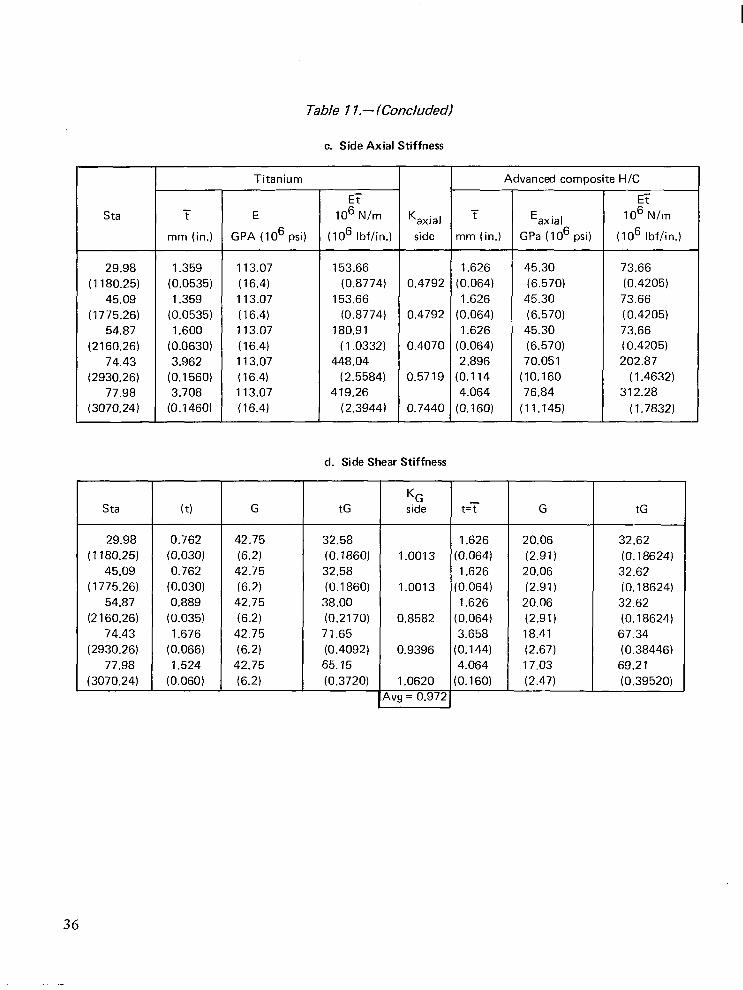
Table I I.- lConcluded)
c. Side Axial Stiffness
l- 1 1 Advanced composite H/C Titanium
E
GPA ( lo6 psi)
113.07 (16.4) 113.07 (I 6.4) 113.07 (16.4) 113.07 (16.4) 113.07 (16.4)
T
mm (in.) Eaxial
GPa ( IO6 psi)
ET IO6 N/m
( IO6 Ibf/in.)
153.66 (0.8774)
153.66 (0.8774)
180.91 (I .0332)
448.04 (2.5584)
419.26 (2.3944)
ET IO6 N/m
(IO6 Ibfhn.)
73.66 (0.4205)
73.66 (0.4205) 73.66 (0.4205) 202.87
(1.4632) 312.28
( 1.7832)
Kaxial side
i
mm (in.)
Sta
29.98 (I 180.25)
45.09 (1775.26)
54.87 (2160.26)
74.43 (2930.26)
77.98 (3070.24)
1.359 (0.0535) 1.359
(0.0535) 1.600
(0.0630) 3.962
(0.1560) 3.708
(0.1460)
1.626 (0.064)
1.626 (0.064)
1.626 (0.064) 2.896
(0.114 4.064
(0.160)
45.30 (6.570)
45.30 (6.570)
45.30 (6.570)
70.051 (10.160 76.84
(11.145)
0.4792
0.4792
0.4070
0.5719
0.7440
d. Side Shear Stiffness
(t) G tG KG side
0.762 42.75 32.58 (0.030) (6.2) (0.1860) 0.762 42.75 32.58
(0.030) (6.2) (0.1860) 0.889 42.75 38.00
(0.035) (6.2) (0.2170) 1.676 42.75 71.65
(0.066) (6.2) (0.4092) 1.524 42.75 65.15
(0.060) (6.2) (0.3720)
1.0013
1.0013
0.8582
0.9396
1.0620 rvg = 0.972
Sta t=T G
1.626 20.06 (0.064) (2.91)
1.626 20.06 (0.064) (2.91)
1.626 20.06 (0.064) (2.91) 3.658 18.41
(0.144) (2.67) 4.064 17.03
(0.160) (2.47)
tG
32.62 (0.18624)
32.62 (0.18624)
32.62 (0.18624)
67.34 (0.38446)
69.21 (0.39520)
29.98 (I 180.25)
45.09 (I 775.26)
54.87 (2 160.26)
74.43 (2930.26)
77.98 (3070.24)
36
1.0
.8
Average K;,,,,, anr, s;de = 0.53
50
Fuselage station, m
75
I 1000
I
1500
I
2000
Fuselage station, in.
I I 2500 3000
figure 13.-Average Stiffness Factors for Fuselage Shell
II I.IIII I I.. III, III., I I I, ,
W ING PANEL DESIGN AND STRUCTURAL MASS ANALYSIS
A requirement for aeroelastic analysis and design of the arrow wing structure was the develop- ment of a mathematical model of the airframe that could be used to study mass sensitivity to changes in airplane configuration, materials, and structural concepts. Sufficient structural detail must be included to reflect the effects of variations in the internal load distribution and to permit the development of structural allowables that are sensitive to changes in structural concepts and materials.
Conventional methods used to estimate mass in prelim inary design are based on data from existing airplanes. Historically, these methods have evolved from analysis of detail designs of the smallest structural elements. These mass predictions have been evaluated by compari- son with actual masses and the methodology has been altered to bring the predictions into agreement with the measured data. Also, larger assemblies were subjected to this same procedure, with the ultimate test being the comparison of complete airplane mass with the predicted value. The data base and methodology are strongly influenced by current engineering and manufacturing state of the art.
In the earlier design study (ref. 1), Ti-6Al-4V alloy was selected as the primary structural material. This raised a number of questions with respect to the applicability of the conven- tional data base, derived mainly from experience with aluminum alloys in fabrication of subsonic aircraft. The National SST program, although it did not result in a completed airplane, did furnish a significant data base for estimating the mass of titanium structure from the extensive analyses of detail designs. Some complex parts, such as titanium honeycomb sandwich panels, were actually built, affording an opportunity to correlate analyses with actual mass measurements.
The current study using advanced composite materials presents even more form idable prob- lems with respect to the estimation of mass data, since there is little experience with such designs, and no substantial data base from which to develop methodology and confidence. For these reasons, it was decided to design two sets of wing cover panels for the same conditions, using titanium for one set and advanced composites for the second. These panels were designed in sufficient detail to illustrate practical problems associated with advanced composite design and also to provide a realistic comparison between metallic and composite designs. The following paragraphs describe the design of these two sets of panels and the procedure for modifying the titanium mass data for use on the composite cover panels.
WING PANEL DESIGN REQUIREMENTS
The objectives of the panel design effort were:
0 To identify and evaluate problems in developing a rational detail design using the 1986 high strength graphite/polyim ide composite in bonded honeycomb sandwich wing panels.
0 To develop detailed designs of the panel edge and joint features to support the theoretical-to-actual factors for mass calculations
38
. _ . . .._.. _ _ -_. -- __._.... ---_---___
The ATLAS analysis provided the theoretical size and mass of the covers, spar and rib chords, spar and rib webs, and stiffeners of the wing structural box. Total wing structural mass must also include the mass of a number of other elements in the structural box and others external to the box, e.g.; leading edge, trailing edge, control surfaces, etc. Features for which additional mass must be calculated include the following:
Skin pad-up Honeycomb core Core to skin adhesive Core edging (splice and sealing) Lightning protection and surface finish Spar and rib pad-up
In the prior study (ref. I), “theoretical-to-actual” factors were derived from data on the National SST program to account for these additional mass items. Five graphite/polyimide honeycomb sandwich panels were designed for mass evaluation and development of new factors for composite panel mass analysis. It was also necessary to design five aluminum brazed titanium honeycomb sandwich panels, equivalent in strength and environmental requirements, to provide a valid comparison of the composite design to the titanium data base.
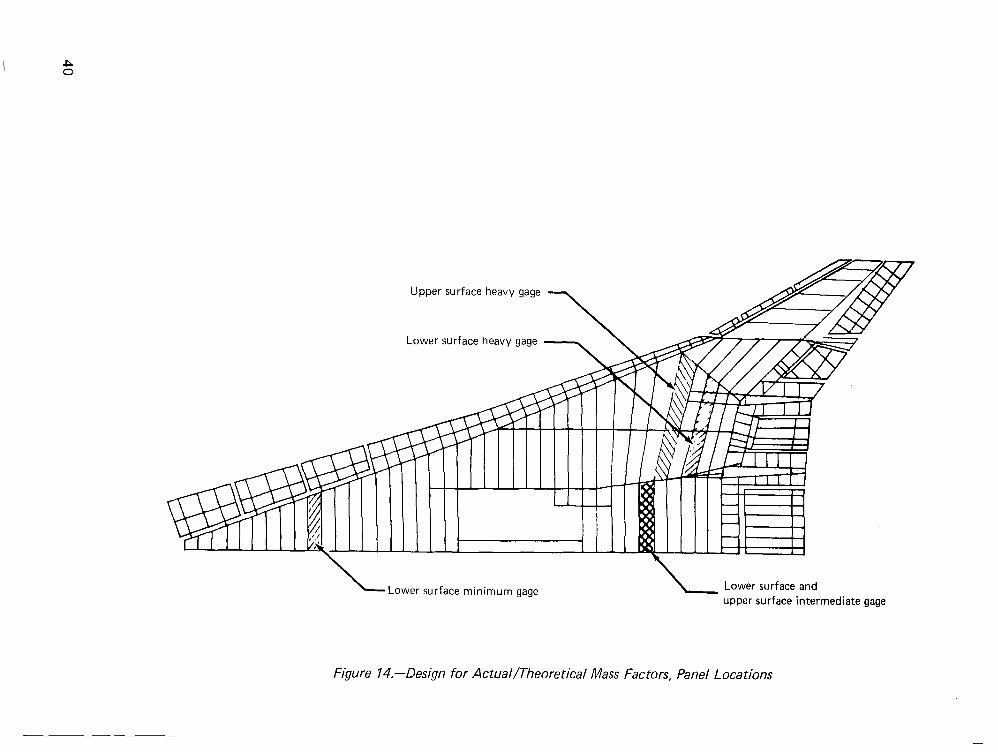
Five primary wing panels were selected for detail design to cover a representative load range. These include a lower surface minimum gage panel, upper and lower surface intermediate gage panels, and upper and lower surface heavy gage panels. Figure 14 shows the locations of these panels.
It should be noted that the structural arrangement for model 969-5 12B was developed for the use of titanium as the primary structural material and it is probably not optimum for the use of composites. Reconfiguring the structural arrangement to further exploit the composite materials would probably result in further improvement in producibility and mass reduction.
The five titanium and five graphite/polyimide panels were designed with production type edge attachments. None of the panels, however, included wing lower surface access doors, provisions for fitting attachments, or fully detailed corner construction.
There are, of course, a number of design requirements for panels such as these that could not be fully represented in the panel drawings, such as lightning protection, paint and surface protection, and certain producibility factors. The effects of these requirements are covered in the description of panel designs and in the mass estimations.
The loads for the wing panels were taken from reference 2. It was assumed that a difference in the ratio of spar area to panel area would not change the panel loads nor affect the theoretical-to-actual mass conversion factor. Twenty-five load cases were evaluated for combined stresses, bukling interaction, and critical joint running loads.
39
I P 0
IIllllII )I/ /, .I
Y”“” Lower surface minimum gage Lower surface and upper surface intermediate gage
Figure 14.-Design for Actual/Theoretical Mass Factors, Panel Locations
WING COVER PANEL DESIGN
Figures 15 and 16 show representative detail design for a composite and a titanium sandwich panel, respectively. The detail shown is limited to the basic panels and their interfaces at joints and supports. Details are omitted for comers, concentrated load points, and access provisions that depend on the detail design of the inner structure and systems. These details were outside the scope of this design effort. Both sets of panels were given consistent treatment for purposes of comparative evaluation.
The inner and outer skins of composite panels are fiber-critical laminates, made of 1986 high strength graphite/polyimide unidirectional tapes having orientations of [0] , [ *45] and [go]. These tapes have a fiber volume fraction of 0.6 and are laid up in an order that is symmetrical about the centerline of each skin thickness. The tapes are O.lOl-mm (0.004 in.) thick in most areas; however, 0.05 l-mm (0.002 in.) tapes are used in the upper and lower panel inner skins in the minimum gage and low load areas. Skins were tapered to meet changing load requirements by adding or terminating lamina symmetrically in each skin.
The skins are bonded to the core using a polyimide adhesive. The adhesive formulation is based upon improved addition-reaction polyimide resins which have thermal and processing characteristics superior to present systems. The weight of the adhesive is assumed to be 415 g/m2 (0.085 lbm/ft2) per bond line in the skin to core application.
Figure 17 shows a typical lay-up order in more detail. The titanium interleaves are installed only at joints and supports and are included to show relative location with respect to the basic composite laminae. Other panel edge design details are shown in figure 15.
The external lamina for each skin were consistently oriented in the spanwise direction. The orientations of the remaining laminae were alternated as far as possible to reduce the chances of suffering damage to all the laminae of a given orientation in the event of a severe surface scratch.
The core consists of honeycomb made of 1986 high strength graphite fiber in a polyimide matrix. The fiber orientation is tailored for different applications of shear and tension- compression for optimum design. Shear applications will rely on [ +45] fiber orientation. Tension-compression applications will utilize [0] and [ 901 oriented fibers. A density of 56 kg/m3(3.5 lbm/ft3) was selected for the basic center core for all panels.
The majority of the wing upper surface is designed by high spanwise compression, medium shear, and low chordwise compression loading. Significant chordwise compression strains exist near the body on the wing lower surface and on both wing surfaces near the wing ribs. Large portions of the wing lower surface skins are designed by combined tension and shear stresses but the core thickness is still established by the wing down-bending conditions which are primarily compression-compression-shear.
During the process of selecting the structural concept and the material, an evaluation of buckling strength versus core thickness was made. Although each specific lay-up was dif- ferent, the general conclusions reached were: (1) 2.54-cm (1 in.) core was required to prevent
41
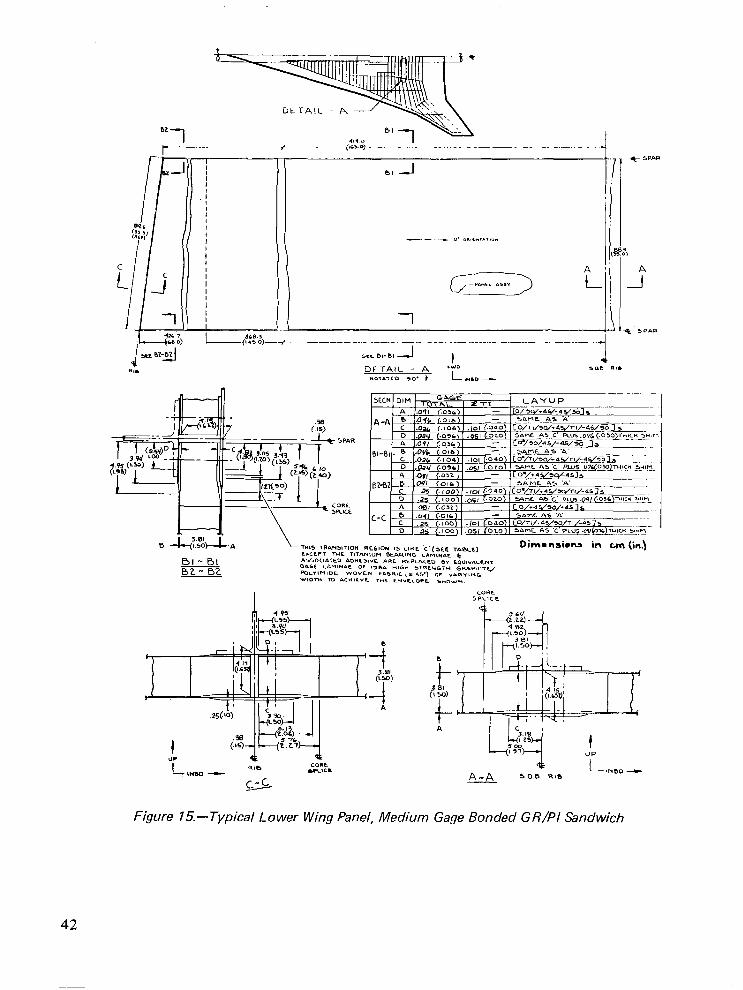
Figure 75.-Typical Lower Wing Panel, Medium Gage Bonded G R/PI Sandwich
42
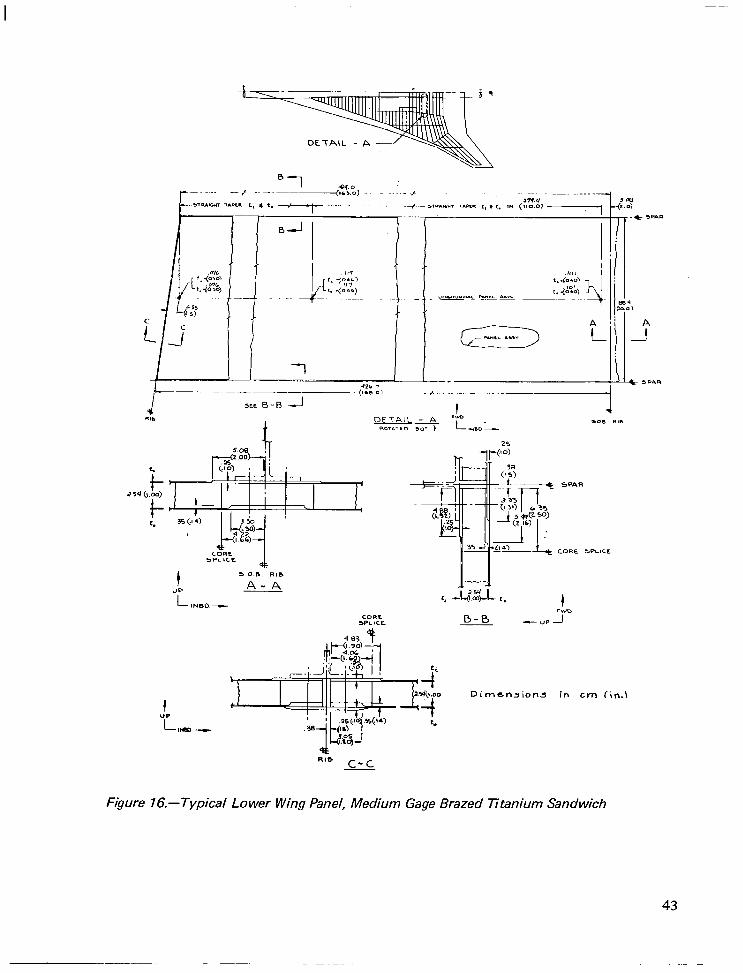
DETAIL - A -
1 - 0-J
4
1
I “I’ INKI -
0-B - UP
Dimensions in ttm (in.1
Figure 16.-Typical Lower W ing Panel, Medium Gage Brazed Titanium Sandwich
43
_-.---._
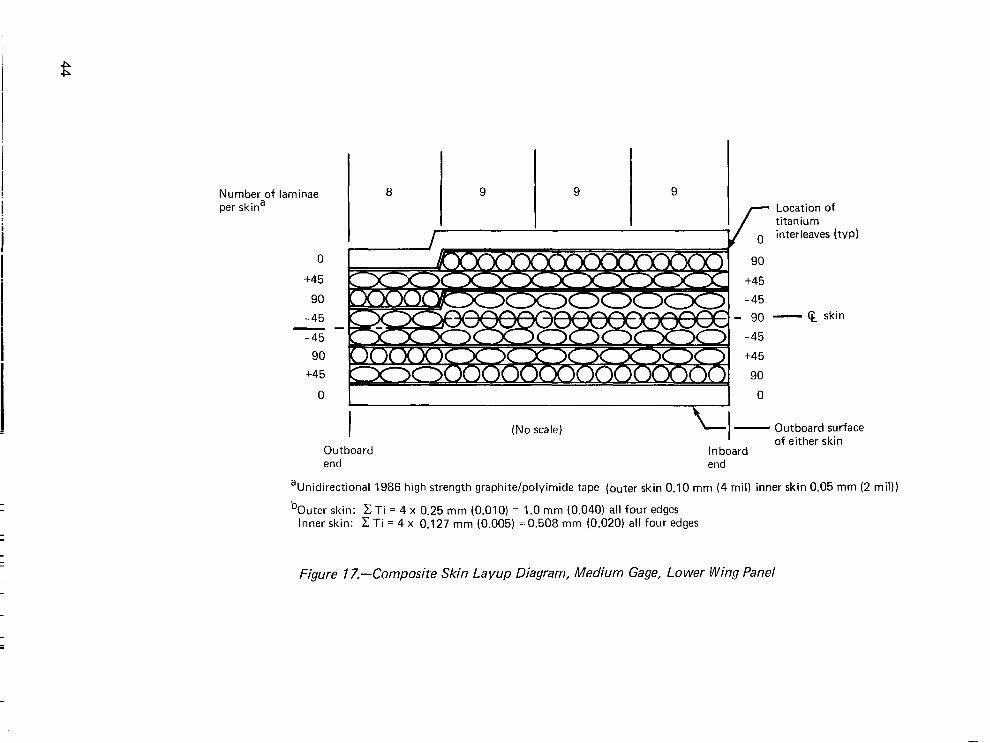
Number of laminae per skina
8 9 9 9
0
+45
90
-45 --
-45
90
t45
cl I
f
Location of titanium
0 interleaves (tvp)
90
t45
-45 - g0 - Q skin
-45
+45
90
0
(No scale) - Outboard surface of either skin
Outboard In board end end
aUnidirectional 1986 high strength graphite/polyimide tape (outer skin 0.10 mm (4 mil) inner skin 0.05 mm (2 mil))
bOuter skin: c Ti = 4 x 0.25 mm (0.010) = 1.0 mm (0.040) all four edges Inner skin: c Ti = 4 x 0.127 mm (0.005) =0.508 mm (0.020) all four edges
Figure 17.-Composite Skin Layup Diagram, Medium Gage, Lower Wing Panel
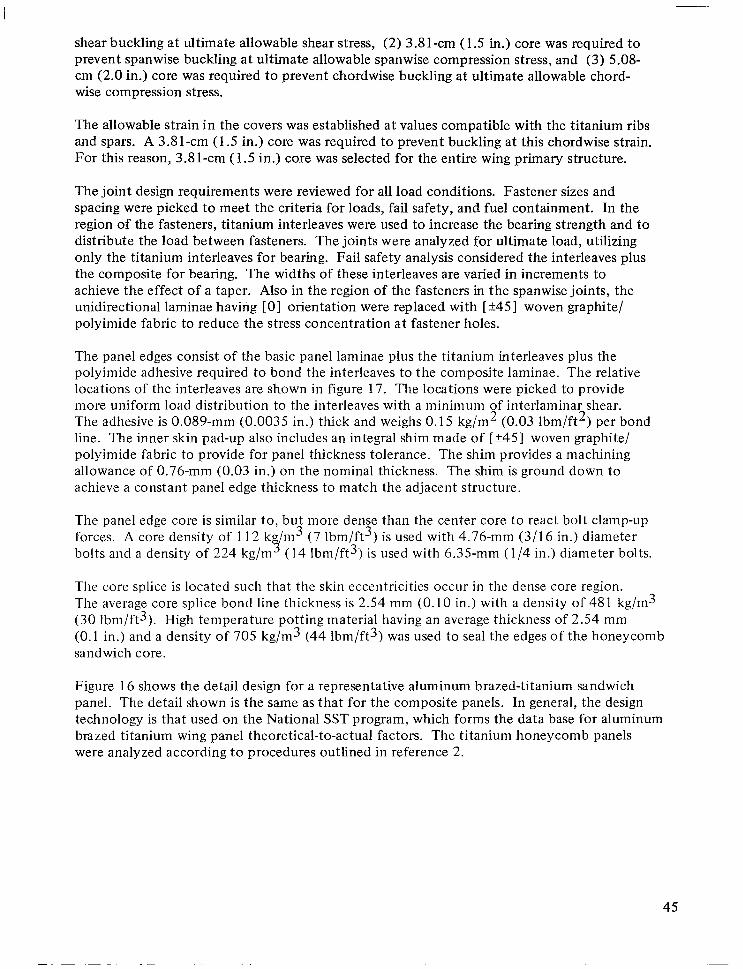
shear buckling at ultimate allowable shear stress, (2) 3.81-cm (1.5 in.) core was required to prevent spanwise buckling at ultimate allowable spanwise compression stress, and (3) 5.08- cm (2.0 in.) core was required to prevent chordwise buckling at ultimate allowable chord- wise compression stress.
The allowable strain in the covers was established at values compatible with the titanium ribs and spars. A 3.81-cm (1.5 in.) core was required to prevent buckling at this chordwise strain. For this reason, 3.8 l-cm ( 1.5 in.) core was selected for the entire wing primary structure.
The joint design requirements were reviewed for all load conditions. Fastener sizes and spacing were picked to meet the criteria for loads, fail safety, and fuel containment. In the region of the fasteners, titanium interleaves were used to increase the bearing strength and to distribute the load between fasteners. The joints were analyzed for ultimate load, utilizing only the titanium interleaves for bearing. Fail safety analysis considered the interleaves plus the composite for bearing. The widths of these interleaves are varied in increments to achieve the effect of a taper. Also in the region of the fasteners in the spanwise joints, the unidirectional laminae having [ 01 orientation were replaced with [ +45 I woven graphite/ polyimide fabric to reduce the stress concentration at fastener holes.
The panel edges consist of the basic panel laminae plus the titanium interleaves plus the polyimide adhesive required to bond the interleaves to the composite laminae. The relative locations of the interleaves are shown in figure 17. The locations were picked to provide more uniform load distribution to the interleaves with a minimum of interlaminar shear. The adhesive is 0.089-mm (0.0035 in.) thick and weighs 0.15 kg/m2 (0.03 lbm/ft2) per bond line. The inner skin pad-up also includes an integral shim made of [?45] woven graphite/ polyimide fabric to provide for panel thickness tolerance. The shim provides a machining allowance of 0.76-mm (0.03 in.) on the nominal thickness. The shim is ground down to achieve a constant panel edge thickness to match the adjacent structure.
The panel edge core is similar to, but more dense than the center core to react bolt clamp-up forces. A core density of 112 ko/m3 (7 lbm/ft3) is used with 4.76-mm (3/16 in.) diameter bolts and a density of 224 kg/m 9 (14 lbm/ft3) is used with 6.35-mm (l/4 in.) diameter bolts.
The core splice is located such that the skin eccentricities occur in the dense core region. The average core splice bond line thickness is 2.54 mm (0.10 in.) with a density of 481 kg/m3 (30 lbm/ft3). High temperature potting material having an average thickness of 2.54 mm (0.1 in.) and a density of 705 kg/ m3 (44 lbm/ft3) was used to seal the edges of the honeycomb sandwich core.
Figure 16 shows the detail design for a representative aluminum brazed-titanium sandwich panel. The detail shown is the same as that for the composite panels. In general, the design technology is that used on the National SST program, which forms the data base for aluminum brazed titanium wing panel theoretical-to-actual factors. The titanium honeycomb panels were analyzed according to procedures outlined in reference 2.
45
The titanium inner and outer skins are them-milled Ti-6A1-4V sheet. The skins are aluminum bmzed to the core. The total braze alloy thickness per panel is 0.41 mm (0.016 in.) and 1.12 mm (0.044 in.) for the center core and edge core, respectively. The basic core used in the panel center consists of 6.35-mm (0.25 in.) cell honeycomb core with a density of 78.5 kg/m3 (4.9 Ibm/ft3). The core depth is 2.54 cm (1.00 in.).
The titanium panel joints and supports were designed for the conditions that were used for the composite panels, resulting in the same fastener sizes and spacings. The skins are them-milled, leaving a padded up strip at all joints and supports to account for the flush external splice strap recess, to provide adequate bearing strength and to distribute the bolt crushing forces to the core.
The core in the region of the fasteners is more dense to withstand the crushing loads due to bolt clamp-up forces. A 3.18-mm (l/8 in.) cell honeycomb core with a density of 226 kg/m3 (14.1 lbm/ft3) is used with 4.76-mm (3/l 6 in.) diameter fasteners in minimum gage panels. The heavier gage panels also use a 3.18-mm (l/8 in.) cell edge core but with a density of 450 kg/m3 (28.1 lbm/ft3) and 6.35-mm ( l/4 in.) diameter fasteners. The joints between the center and edge core are spotwelded and are located so that all of the local eccentricities are in the region of the denser core. The exposed edges of the panels at joints are given two coats of primer to inhibit corrosion.
ADDITIONAL DESIGN CONSIDERATIONS
Lightning strikes on metallic airplanes generally occur at the extremities and utilize the structure in between a conductive path. Similar behavior would be expected for an all composite structure, but unique problems are anticipated for structure utilizing various mixtures of metallic and composite materials. The joint concept selected for this study employs titanium splice plates which will act as a grid work of bus bars on both wing surfaces, running spanwise at 89-c, (35 in.) spacing and connected together at the leading edge spar, the wing ribs, and the body. The lightning strike protection system is designed to con- duct a 200 000 amp discharge. The mass of the lightning protection system will range up to 0.49 kg/m2 (0.1 lbm/ft2), depending on location. An average allowance of 0.24 kg/m2 (0.05 lbm/ft2) was used for mass analysis. Protective material may be incorporated as an integral part of the structure or applied to the exterior surface in operations subsequent to fabrication.
Consideration was given to producibility in arriving at the panel designs. Because of this, each skin is a balanced symmetrical laminate to reduce the tendency for warpage. An integral shim with excess machining allowance is included on the inner skin at joints and supports to account for panel thickness tolerances. This skin could be ground to provide a constant pad thickness at the edges.
46
MASS METHODOLOGY
The ATLAS finite element analysis provides the theoretical size and mass of the modeled structural members required for strength. These modeled members include the chords and webs of the spars, ribs, and beams as well as the skin of the cover panels of the wing box. In order to compile the total mass of the wing box, inputs must be provided for the non- modeled structure as well as the theoretical-to-actual mass factors of the modeled structure. Table 12 gives a comparative summary of ATLAS input data, for titanium and graphite/ polyimide honeycomb panels, to support the wing box mass calculations. Data for the five titanium and five composite honeycomb panels together with design information from the National SST program provide the basis for table 12.
Figures 18 and 19 show the theoretical-to-actual factors for the skin of titanium and com- posite honeycomb panels as a function of the combined inner and outer skin thickness,. t. These factors include such items as chordwise skin edge pad-up, door cutout reinforcement, comer treatment, fuel system provisions, material tolerance, etc. There are two sets of curves in each figure. The lower set of curves gives the factors for the higher loaded areas of the wing where the spanwise skin edge pad-up is included as part of the effective spar chord material. The upper set of curves are applicable to the lightly loaded areas of the wing where the spar chord areas are dictated by minimum practical dimensions of the spar cap flanges and skin spanwise pad-up is included in the skin theoretical-to-actual factors.
The honeycomb core is not modeled in ATLAS but the mass is input as 2.035-kg/m2 (0.4167 lbm/ft2 for the basic 2.54 cm (1 in.)) thick titanium core. The corresponding composite core mass is 2.136 kg/m2 (0.43 75 lbm/ft2) for core thickness of 3.8 1 cm (1.5 in.)
The incremental mass of the dense core around the panel edges discussed in previous para- graphs is accounted for by a factor applied to the basic core mass. Values of this factor are 1.25 and 1.30 for the upper and lower surface, respectively, of titanium panels. The values for the composite edge core are 1.20 and 1.25, respectively, for upper and lower surfaces. These factors are based on an average perimeter-to-area ratio of a typical wing panel. The lower surface has a higher factor due to additional dense core around the access doors on the lower surface. The aluminum braze material for joining titanium skin to the basic core is 0.401-mm (0.0158 in.) thick and has a mass of 1.097 kg/m2 (0.2246 lbm/ft2). This must be multiplied by a factor of 1.25 on the upper surface and 1.30 on the lower surface near the panel edges to provide for the thicker braze material for the dense edge core. The graphite/polyimide panels use a uniform 0.38-mm (0.015 in.) thick adhesive over the total surface for each bondline between the core and the skin with no factor for dense edge core. This adhesive has a mass of 0.830 kg/m2 (0.170 Ibm/ft2) for the two bond lines of each panel.
The mass of adhesive required to splice dense core to basic core and mass of the composite panel edge seal are functions of the panel perimeter-to-area ratio, as well as the thickness and density of the material. In this case, however, both core splice adhesive and the panel edge seal are included as functions of panel area. This assumes an average panel perimeter- to-area ratio and results in a core splice adhesive mass of 0.122 kg/m2 (0.025 lbm/ft2) on the additional dense core splice around access doors. The panel edge seal mass increment is estimated to be 0.225 kg/m2 (0.046 lbm/ft2) for an average panel geometry.
47

Table 12.-ATLAS Input Data to Support Mass Calculations
Item
Basic skin t
Factor for skin
Basic H/C core
Factor for edge core
Basic core to skin braze or adhesive
Factor for edge core braze or adhesive
Core splice adhesive
Panel edge seal
Lightning strike protective coating
Surface finish
Basic spar structure
Factor for spar (including stiffeners)
Basic rib structure
Factor for rib (including stiffeners)
48
T T T T T T I
Reference 1 study titanium H/C panels
Input t which is resized by ATLA! analysis
Values from figure 18
2.54~cm (1 in.) thick 80.092 kg/m3 (5.0 Ibm/ft3) 2.035 kg/m2 (0.4167 Ibm/ft2)
Upper surface 1.25 Lower surface 1.30
Aluminum braze/surface 1.097 kg/m2 (0.2246 Ibm/ft2)
Upper surface 1.25 Lower surface 1.30
Input structure which is resized by ATLAS analysis
Flat spar webs Sine wave spar webs and
chords
1.725
1.15
Input structure which is resized by ATLAS analysis
Flat rib webs Sine wave rib webs and
chords
1.77
1.18
Present study composite H/C panels
Input t which is resized by ATLAS analysis
Values from figure 19
3.81~cm ( 1.5 in.) thick 56.065 kg/m3 (3.5 Ibm/ft3) 2.136 kg/m2 (0.4375 Ibm/ft2)
Upper surface 1.20 Lower surface 1.25
Polyimide adhesive/surface 0.830 kg/m2 (0.170 Ibm/ft2)
Upper surface 1 .OO Lower surface 1 .OO
Upper surface 0.122 kg/m2 (0.025 Ibm/ft2) Lower surface 0.146 kg/m2 (0.030 Ibm/ft2)
0.225 kg/m2 (0.046 Ibm/ft2)
0.244 kg/m2 (0.050 Ibm/ft2)
0.132 kg/m2 (0.027 Ibm/ft2)
Input structure which is resized by ATLAS analysis
Flat spar webs 1.725 Sine wave spar webs
and chords 1.15
Input structure which is resized by ATLAS analysis
Flat rib webs 1.77 Sine wave rib webs and
chords 1.18
-.__- . . ._ -.. . . _.. . ,a .*a , , a.- , . , . . I . I . . . ,I- . . I
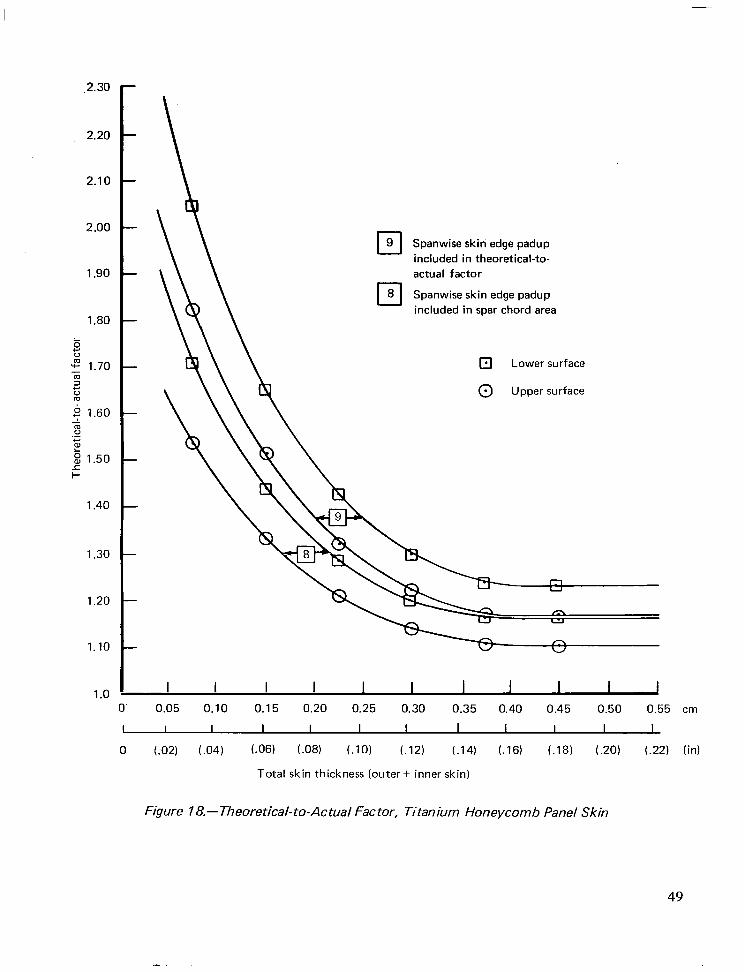
,2.30
2.20
2.10
2.00
1.90
1.80
5 w
; 1.70 2 i ,b 1.60 L 8
‘E 2 8 1.50
t
1.40
1.30
1.20
1.10
1.0
cl 9 Spanwise skin edge padup included in theoretical-to- actual factor
cl 8 Spanwise skin edge padup
included in spar chord area
m Lower surface
0 Upper surface
0‘ 0.05 0.10 0.15 0.20 0.25 0.30 0.35 0.40 0.45 0.50 0.55 cm
I I I I I I I I I I I I
0 t.021 l.04) (.W t.08) i.10) t.121 t.141 t.16) t.18) t.201 (.22) (in)
Total skin thickness (outer + inner skin)
Figure 18.-Theoretical-to-Actual Factor, Titanium Honeycomb Panel Skin
49
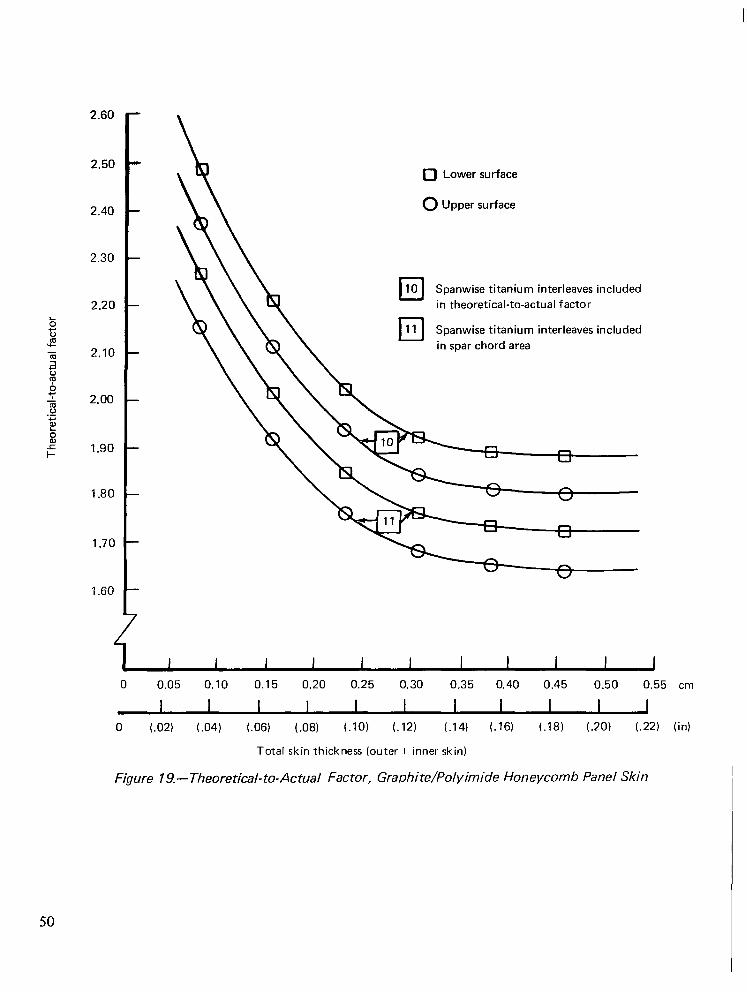
2.60
2.50
2.40
2.30
2.20
b z 2 m 2.10 2 ii 6 +: is 2.00 .z 2 & E 1.90
1.80
1.60
L
0 Lower surface
0 Upper surface
Spanwise titanium interleaves included in theoretical-to-actual factor
Spanwise titanium interleaves included in spar chord area
0 0.05 0.10 0.15 0.20 0.25 0.30 0.35 0.40 0.45 0.50 0.55 cm
I I I I I I I I I I I 0 l.02) i.04) t.06) f.08) (.lO) l.12) t.141 f.16) l.18) (.20) t.22) (in)
Total skin thickness (outer + inner skin)
Figure 19.-Theoretical-to-Actual Factor, Graohite/Polyimide Honeycomb Panel Skin
50
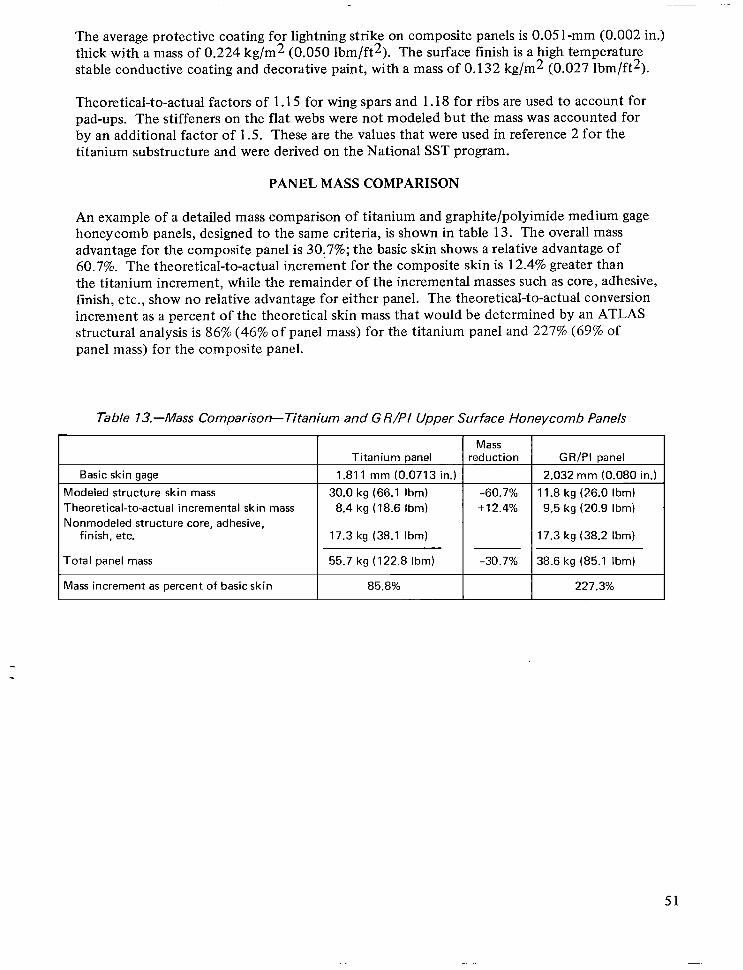
The average protective coating for lightning strike on composite panels is 0.05 l-mm (0.002 in.) thick with a mass of 0.224 kg/m2 (0.050 Ibm/ft2). The surface finish is a high temperature stable conductive coating and decorative paint, with a mass of 0.132 kg/m2 (0.027 lbm/ft2).
Theoretical-to-actual factors of 1.15 for wing spars and 1.18 for ribs are used to account for pad-ups. The stiffeners on the flat webs were not modeled but the mass was accounted for by an additional factor of 1.5. These are the values that were used in reference 2 for the titanium substructure and were derived on the National SST program.
PANEL MASS COMPARISON
An example of a detailed mass comparison of titanium and graphite/polyimide medium gage honeycomb panels, designed to the same criteria, is shown in table 13. The overall mass advantage for the composite panel is 30.7%; the basic skin shows a relative advantage of 60.7%. The theoretical-to-actual increment for the composite skin is 12.4% greater than the titanium increment, while the remainder of the incremental masses such as core, adhesive, finish, etc., show no relative advantage for either panel. The theoretical-to-actual conversion increment as a percent of the theoretical skin mass that would be determined by an ATLAS structural analysis is 86% (46% of panel mass) for the titanium panel and 227% (69% of panel mass) for the composite panel.
Table 13.-Mass Comparison-Titanium and G R/PI Upper Surface Honeycomb Panels
1 Basic skin aace
Modeled structure skin mass Theoretical-to-actual incremental skin mass Nonmodeled structure core, adhesive,
finish, etc.
Total panel mass
I Mass increment as percent of basic skin
I Mass Titanium oanel reduction GR/PI oanel I
1.811 mm (0.0713 in.) 1 1 2.032 mm (0.080 in.) 1
30.0 kg (66.1 Ibm) -60.7% 11.8 kg (26.0 Ibm) 8.4 kg (18.6 Ibm) +12.4% 9.5 kg (20.9 Ibm)
17.3 kg (38.1 Ibm) 17.3 kg (38.2 Ibm)
55.7 kg (122.8 Ibm) -30.7% 38.6 kg (85.1 Ibm)
85.8% 227.3%
51
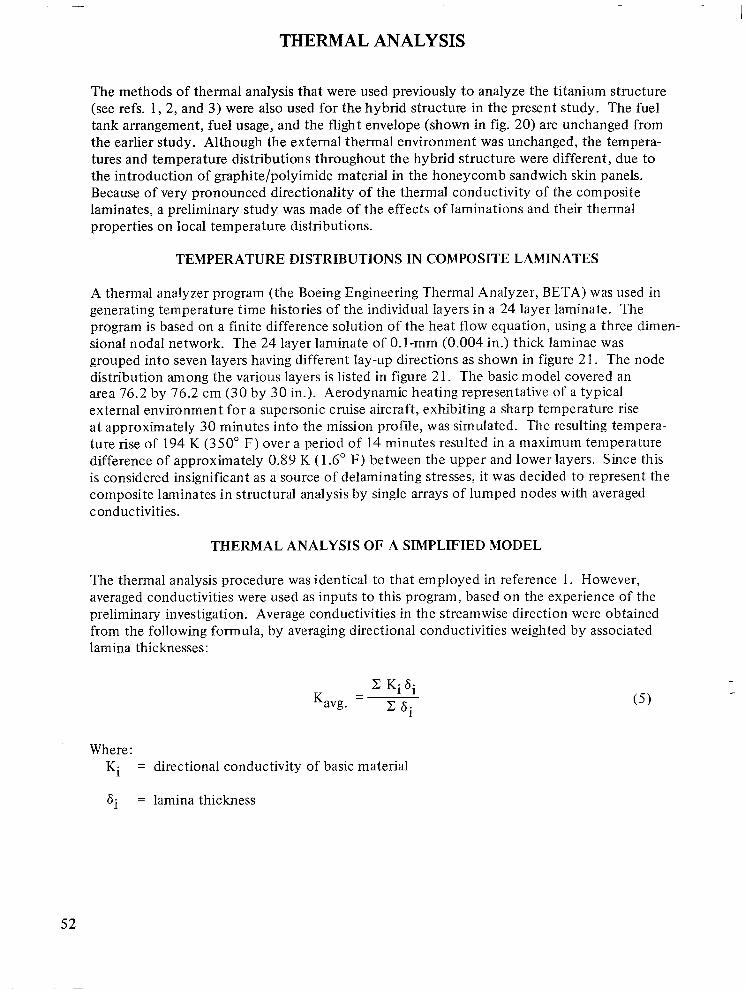
-
THERMAL ANALYSIS
The methods of thermal analysis that were used previously to analyze the titanium structure (see refs. 1, 2, and 3) were also used for the hybrid structure in the present study. The fuel tank arrangement, fuel usage, and the flight envelope (shown in fig. 20) are unchanged from the earlier study. Although the external thermal environment was unchanged, the tempera- tures and temperature distributions throughout the hybrid structure were different, due to the introduction of graphite/polyimide material in the honeycomb sandwich skin panels. Because of very pronounced directionality of the thermal conductivity of the composite laminates, a preliminary study was made of the effects of laminations and their thermal properties on local temperature distributions.
TEMPERATURE DISTRIBUTIONS IN COMPOSITE LAMINATES
A thermal analyzer program (the Boeing Engineering Thermal Analyzer, BETA) was used in generating temperature time histories of the individual layers in a 24 layer laminate. The program is based on a finite difference solution of the heat flow equation, using a three dimen- sional nodal network. The 24 layer laminate of 0.1 -mm (0.004 in.) thick laminae was grouped into seven layers having different lay-up directions as shown in figure 2 1. The node distribution among the various layers is listed in figure 2 1. The basic model covered an area 76.2 by 76.2 cm (30 by 30 in.). Aerodynamic heating representative of a typical external environment for a supersonic cruise aircraft, exhibiting a sharp temperature rise at approximately 30 minutes into the mission profile, was simulated. The resulting tempera- ture rise of 194 K (350” F) over a period of 14 minutes resulted in a maximum temperature difference of approximately 0.89 K (1.6” F) between the upper and lower layers. Since this is considered insignificant as a source of delaminating stresses, it was decided to represent the composite laminates in structural analysis by single arrays of lumped nodes with averaged conductivities.
THERMAL ANALYSIS OF A SIMPLIFIED MODEL
The thermal analysis procedure was identical to that employed in reference 1. However, averaged conductivities were used as inputs to this program, based on the experience of the preliminary investigation. Average conduetivities in the streamwise direction were obtained from the following formula, by averaging directional conductivities weighted by associated lamina thicknesses:
(5)
Where : Ki = directional conductivity of basic material
‘i = lamina thickness
52

70x 103
60
50
c w-
40
2 = a
30
20
10
0 L
20x 103
15
E
fz 2
z IO
5
0 20 40 60 80 100 120 140 160 180
2.0
.8
Time, min
Figure 20.~Mission Profile (6190 km (3340 nmi))
2.8
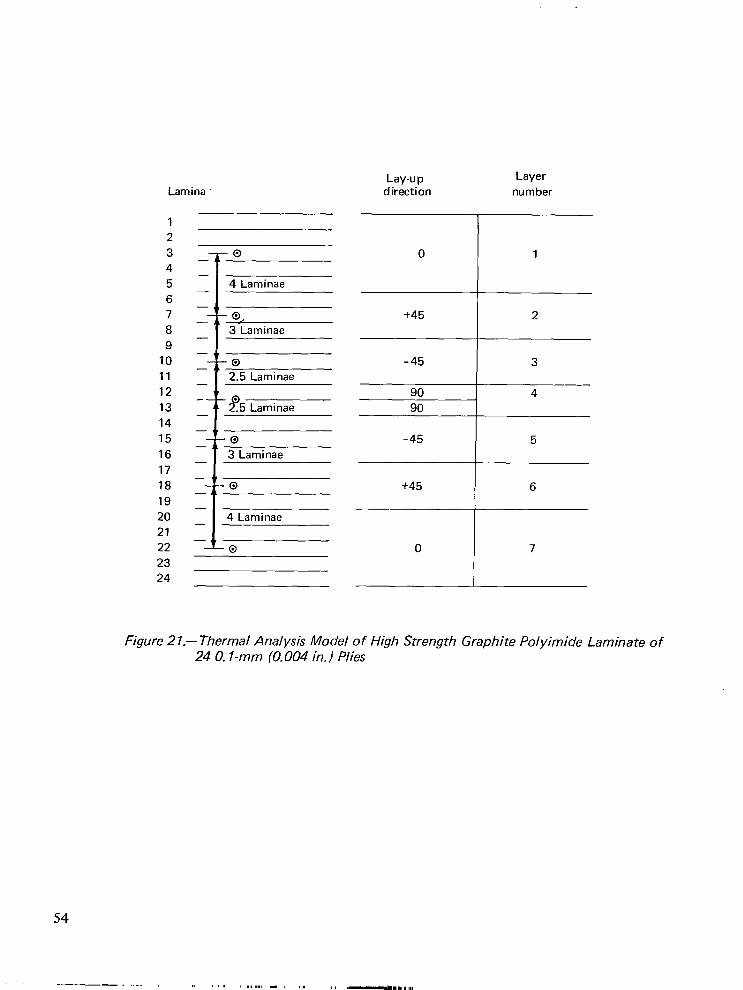
Lamina Lay-up Layer
direction number
1 2 3 4 5 6 7 8 9
10 11 12 13 14 15 16 17 18 19 20 21 22 23 24
T 0 - - I 4 Laminae - - 0 -
t -’ 3 Laminae -
- - 1
t - -
t
0 0
3 Laminae 3 Laminae - -
- -
f
0 - -
4 Laminae -
--f_.
0
+45
-45
90 90
-45
+45
0
1
2
3
4
5
Figure 2 7.-Thermal Analysis Model of High Strength Graphite Polyimide Laminate of 24 0. l-mm (0.004 in.) Plies
54
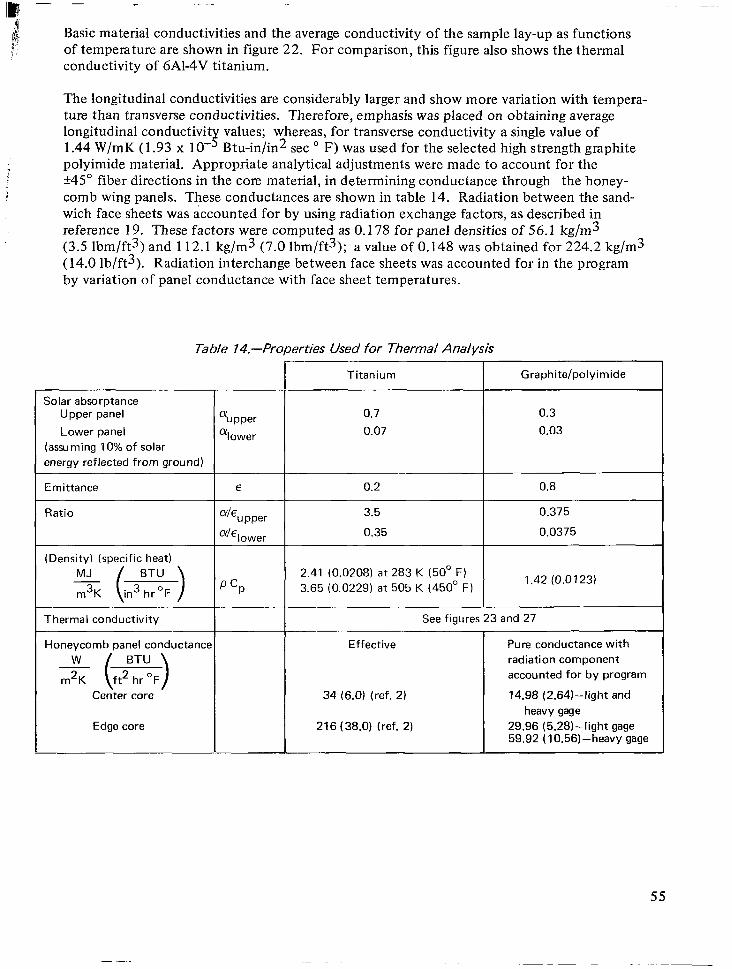
Basic material conductivities and the average conductivity of the sample lay-up as functions of temperature are shown in figure 22. For comparison, this figure also shows the thermal conductivity of 6Al-4V titanium.
The longitudinal conductivities are considerably larger and show more variation with tempera- ture than transverse conductivities. Therefore, emphasis was placed on obtaining average longitudinal conductivit values; whereas, for transverse conductivity a single value of 1.44 W/mK (1.93 x lo- I!! Btu-in/in2 set ’ F) was used for the selected high strength graphite polyimide material. Appropriate analytical adjustments were made to account for the +45” fiber directions in the core material, in determining conductance through the honey- comb wing panels. These conductances are shown in table 14. Radiation between the sand- wich face sheets was accounted for by using radiation exchange factors, as described in reference 19. These factors were computed as 0.178 for panel densities of 56.1 kg/m3 (3.5 lbm/ft3) and 112.1 kg/m3 (7.0 lbm/ft3); a value of 0.148 was obtained for 224.2 kg/m3 (14.0 lb/ft3). Radiation interchange between face sheets was accounted for in the program by variation of panel conductance with face sheet temperatures.
Table 74.-Properties Used for Thermal Analysis
Solar absorptance Upper panel
Lower panel (assuming 10% of solar energy reflected from ground)
Emittance
Ratio
(Density) (specific heat) MJ BTU
-( > m3K in3 hr OF
Thermal conductivity
Honeycomb panel conductance iv BTU
-( ) m2K ft2 hr OF Center core .
Edge core
kwer ‘lower
E
“upper X/E lower
Titanium Graphite/polyimide
0.7 0.3
0.07 0.03
0.2 0.8
3.5 0.375
0.35 0.0375
2.41 (0.0208) at 283 K (50° F) 3.65 (0.0229) at 505 K (450’ F) 1.42 (0.0123)
See figures 23 and 27
Effective Pure conductance with radiation component accounted for by program
34 (6.0) (ref. 2)
216 (38.0) (ref. 2)
14.98 (2.64)-light and heavy gage
29.96 (5.28)-light gage 59.92 (10.56)-heavy gage
55
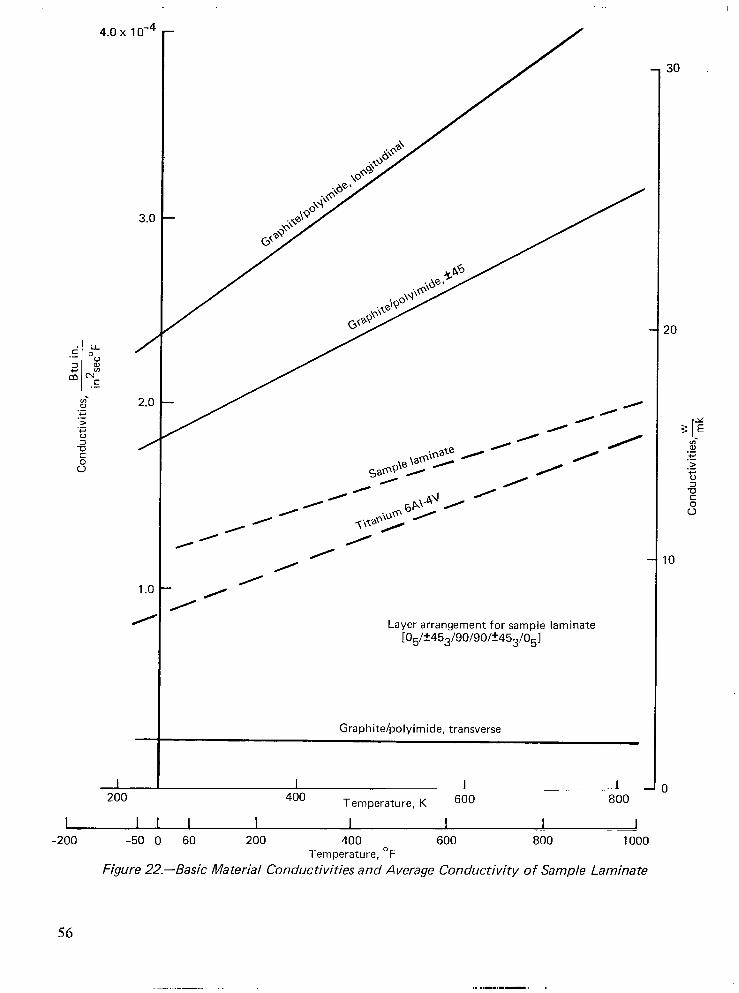
3.0
/
2.0
/
1.0
I 200
Layer arrangement for sample laminate lo,/+453/90/90/+453/051
Graphite/polyimide, transverse
I I 400 Temperature, K 600 800
-200 -50 0 60 200 400 600 800 1000 Temperature, OF
Figure 22.43asic Material Conductivities and Average Conductivity of Sample Laminate
56
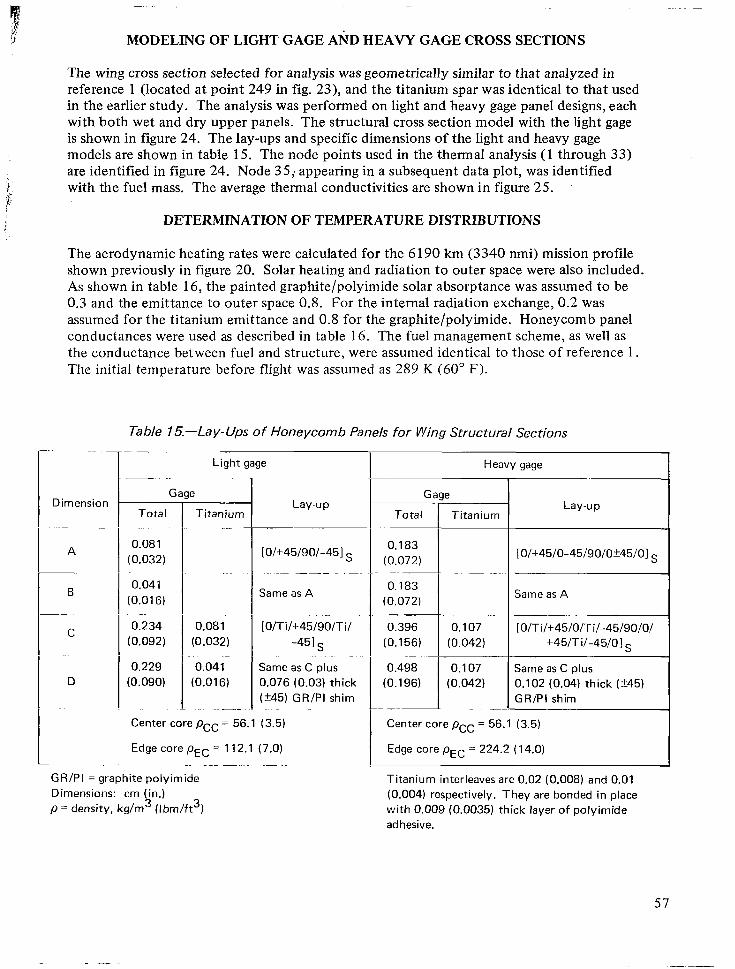
MODELING OF LIGHT GAGE AtiD HEAVY GAGE CROSS SECTIONS
The wing cross section selected for analysis was geometrically similar to that analyzed in reference 1 (located at point 249 in fig. 23), and the titanium spar was identical to that used in the earlier study. The analysis was performed on light and heavy gage panel designs, each with both wet and dry upper panels. The structural cross section model with the light gage is shown in figure 24. The lay-ups and specific dimensions of the light and heavy gage models are shown in table 15. The node points used in the thermal analysis (1 through 33) are identified in figure 24. Node 35; appearing in a subsequent data plot, was identified with the fuel mass. The average thermal conductivities are shown in figure 25.
DETERMINATION OF TEMPERATURE DISTRIBUTIONS
The aerodynamic heating rates were calculated for the 6190 km (3340 nmi) mission profile shown previously in figure 20. Solar heating and radiation to outer space were also included. As shown in table 16, the painted graphite/polyimide solar absorptance was assumed to be 0.3 and the emittance to outer space 0.8. For the internal radiation exchange, 0.2 was assumed for the titanium emittance and 0.8 for the graphite/polyimide. Honeycomb panel conductances were used as described in table 16. The fuel management scheme, as well as the conductance between fuel and structure, were assumed identical to those of reference 1. The initial temperature before flight was assumed as 289 K (60” F).
Dimension
A
~~
B
C
D
Table 15.-Lay-Ups of Honeycomb Panels for Wing Structural Sections
__ Gage
Total Titanium
0.081 (0.032)
0.041 (0.016)
0.234 (0.092)
0.229 (0.090)
0.081. (0.032)
0.041- (0.016)
Light gage
Lay-up
[O/+45/90/-451 s
Same as A
[O/Ti/+45/90/Ti/ -451 s
Same as C plus 0.076 (0.03) thick (*45) GR/PI shim
Center core pCC = 56.1 (3.5)
Edge core pEC = 112.1 (7.0)
GR/PI = graphite polyimide Dimensions: cm (in.) p = density, kg/m3 (Ibm/ft3)
Heavy gage
G
Total
0.183 (0.072)
0.183 (0.072)
0.396 (0.156)
0.498 (0.196)
w Titanium
0.107 (0.042)
0.107 (0.042)
T Lay-up
[O/+45/0-45/90/0~45/01 s
Same as A
[O/T i/+45/O/T i/-45/90/0/ +45/Ti/-45/O] s
Same as C plus 0.102 (0.04) thick (?45) GR/PI shim
Center core pCC = 56.1 (3.5)
Edge core pEC = 224.2 ( 14.0)
Titanium interleaves are 0.02 (0.008) and 0.01 (0.004) respectively. They are bonded in place with 0.009 (0.0035) thick layer of polyimide adhesive.
57
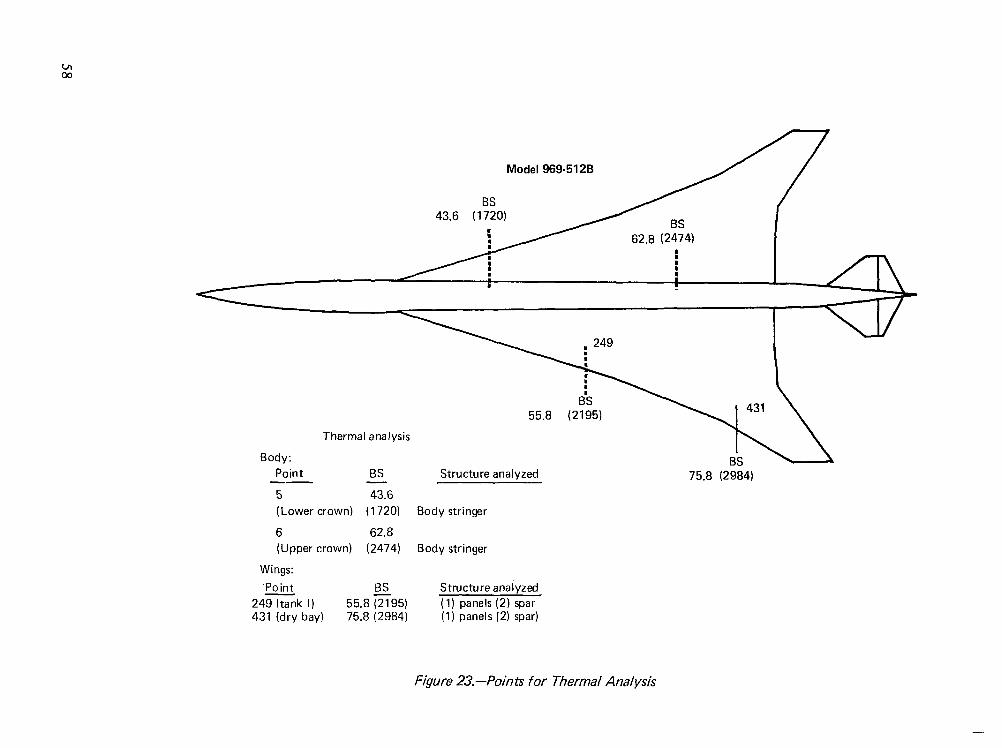
Model 969-5128
BS 43.6 (1720)
Thermal analysis
Body: B\ Point BS Structure analyzed
-- - 5 43.6
(Lower crown) (1720) Body stringer
75.8 (2984)
6 62.8 (Upper crown) (2474) Body stringer
Wings:
‘Point BS Structure analyzed
249 ltank I) 55.8 12195) (1) panels (2) spar 431 (dry bay) 75.8 (2984) (1) panels (2) spar)
Figure 23.-Points for Thermal Analysis
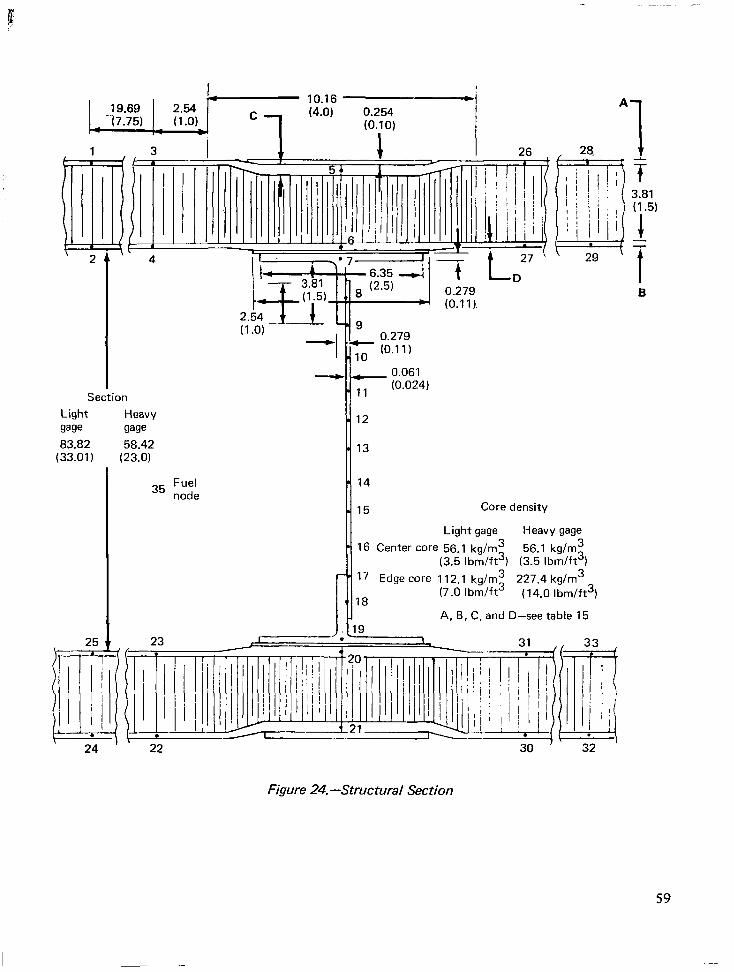
Section Light Heavy we gage 83.82 58.42
(33.01) (23.0)
35 Fuel node
, 28.
0.061 (0.024)
15 Core density
Light gage Heavy gage
16 Center core 56.1 kg/m3 56.1 kg/m3 (3.5 Ibm/ft3) (3.5 Ibm/ft3)
17 Edge core 112.1 kg/m3 227.4 kg/m3
18 (7.0 Ibm/ft3 (14.0 Ibm/ft3)
A, B, C, and D-see table 15
22 30 ’ 32
Figure 24.~Structural Section
3.81 (1.5)
59
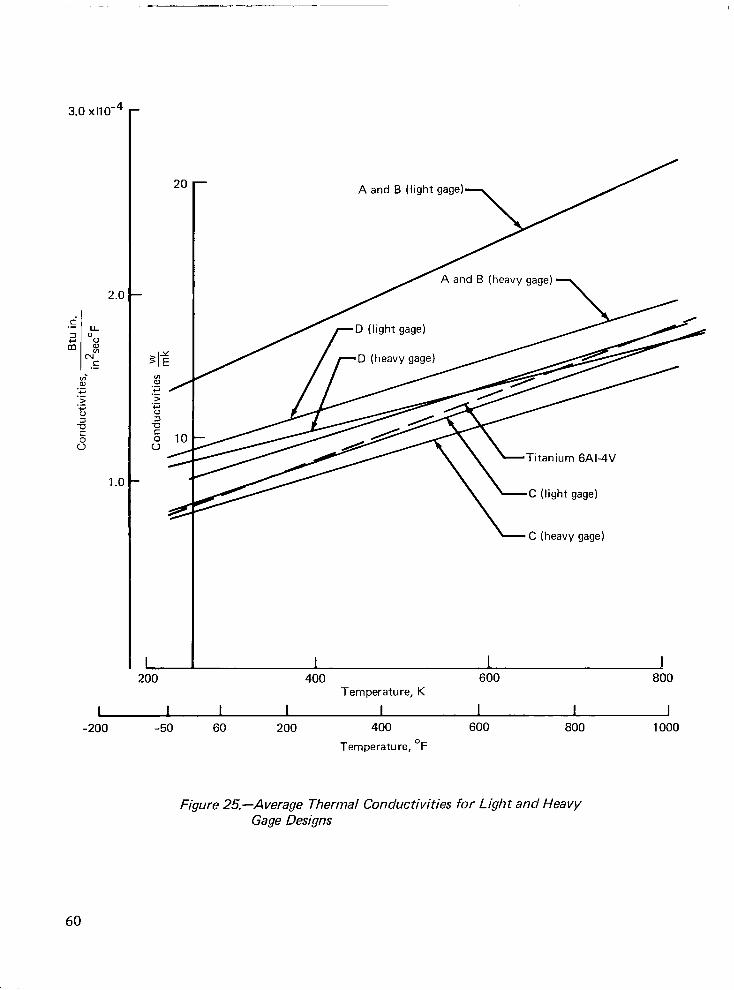
3.0 xi10w4
1.c
A and B (heavy gage) 1
\ -y~~~~g~~’
C (heavy gage)
400 600 800 Temperature, K
-200 -50 60 200 400
Temperature, OF
600 800 1000
Figure 25.-Average Thermal Conductivities for Light and Heavy Gage Designs
60
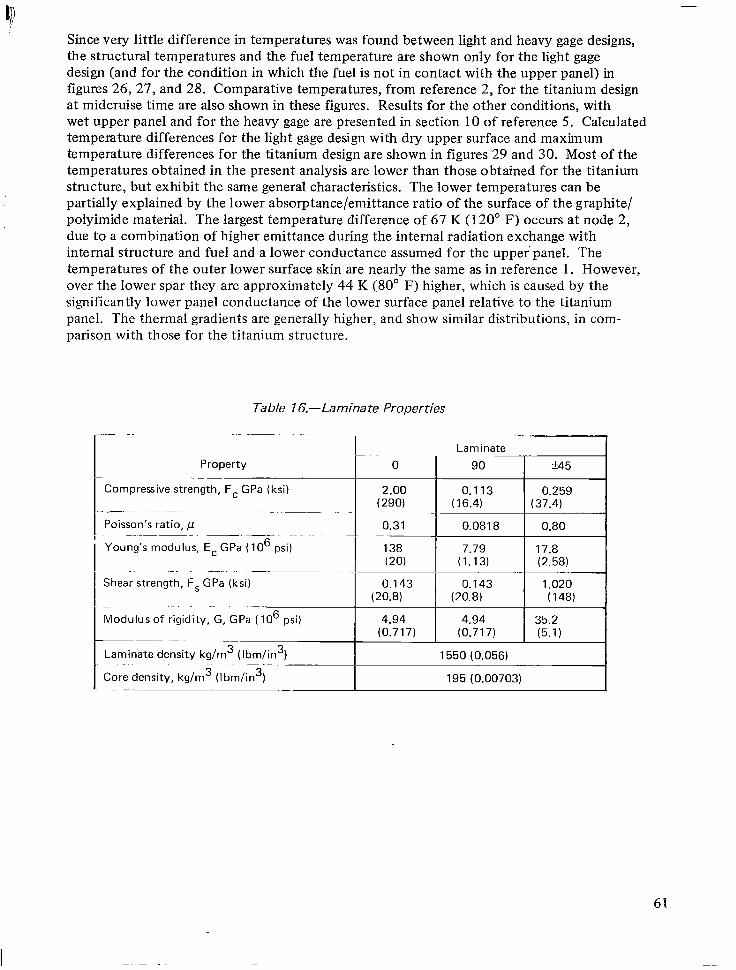
Since very little difference in temperatures was found between light and heavy gage designs, the structural temperatures and the fuel temperature are shown only for the light gage design (and for the condition in which the fuel is not in contact with the upper panel) in figures 26, 27, and 28. Comparative temperatures, from reference 2, for the titanium design at midcruise time are also shown in these figures. Results for the other conditions, with wet upper panel and for the heavy gage are presented in section 10 of reference 5. Calculated temperature differences for the light gage design with dry upper surface and maximum temperature differences for the titanium design are shown in figures 29 and 30. Most of the temperatures obtained in the present analysis are lower than those obtained for the titanium structure, but exhibit the same general characteristics. The lower temperatures can be partially explained by the lower absorptance/emittance ratio of the surface of the graphite/ polyimide material. The largest temperature difference of 67 K (120” F) occurs at node 2, due to a combination of higher emittance during the internal radiation exchange with internal structure and fuel and a lower conductance assumed for the upper’ panel. The temperatures of the outer lower surface skin are nearly the same as in reference 1. However, over the lower spar they are approximately 44 K (80” F) higher, which is caused by the significantly lower panel conductance of the lower surface panel relative to the titanium panel. The thermal gradients are generally higher, and show similar distributions, in com- parison with those for the titanium structure.
Table 16.-Laminate Properties
Property
Compressive strength, F, GPa (ksi)
Poisson’s ratio, p
Laminate
90 *45
0.113 0.259 (16.4) (37.4)
0.0818 0.80
Shear strength, F, GPa (ksi)
Modulus of rigidity, G, GPa ( lo6 psi) 4.94 4.94 35.2 (0.717) (0.717) (5.1)
I. Laminate density kg/m3 ( Ibm/in3) 1550 (0.056)
Core density, kg/m3 (I bm/in3) 195 (0.00703)
61
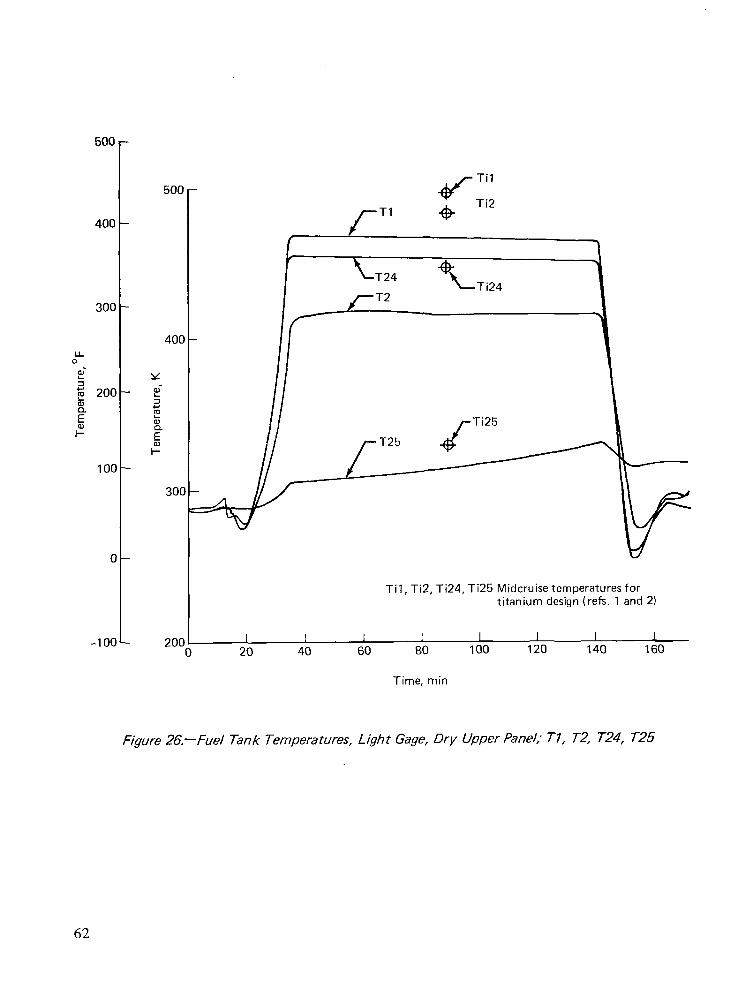
5oc
40(
30(
LL 0
w- 2 2 20( x E
F
101
l
-lO(
500
200
5
/ j
T24 %Ti24
Til, Ti2, Ti24, Ti25 Midcruise temperatures for titanium design (refs. 1 and 2)
I I 20 40
I I I I I 1 60 80 100 120 140 160
Time, min
Figure 26.-Fuel Tank Temperatures, Light Gage, Dry Upper Panel; TI, T2, T24, T25
62
500
100
0
-100
500 c I i6
. rT5 T6
400
Y 2 3 k-!! B E
c
3oc
2oc
4 Ti21
4- Ti20
-/- T20
Ti5, Ti6, Ti20, Ti21 Midcru ise temperatures for titanium design
I 1 20 40
I I I I I I 60 80 100 120 140 160
Time, min
Figure 27.-Fuel Tank Temperatures, Light Gage, Dry Upper Panel; T5, T6, T20, T21
63
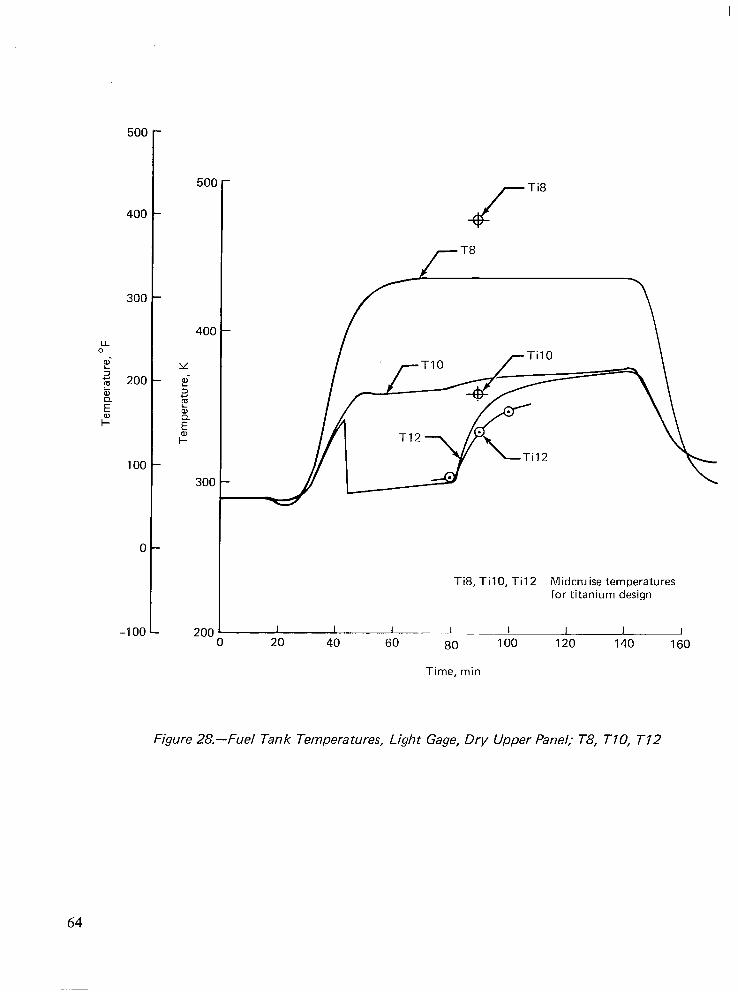
5oc
400
300
100
0
-100
500
400
Y
n! a F al E
F
300
6 Ti8
Ti8, TilO, Ti12 Midcruise temperatures for titanium design
I I I I I I I I 20 40 60 80 100
Time, min
120 140 160
Figure 28.-Fuel Tank Temperatures, Light Gage, Dry Upper Panel; T8, TIO, T 12
64
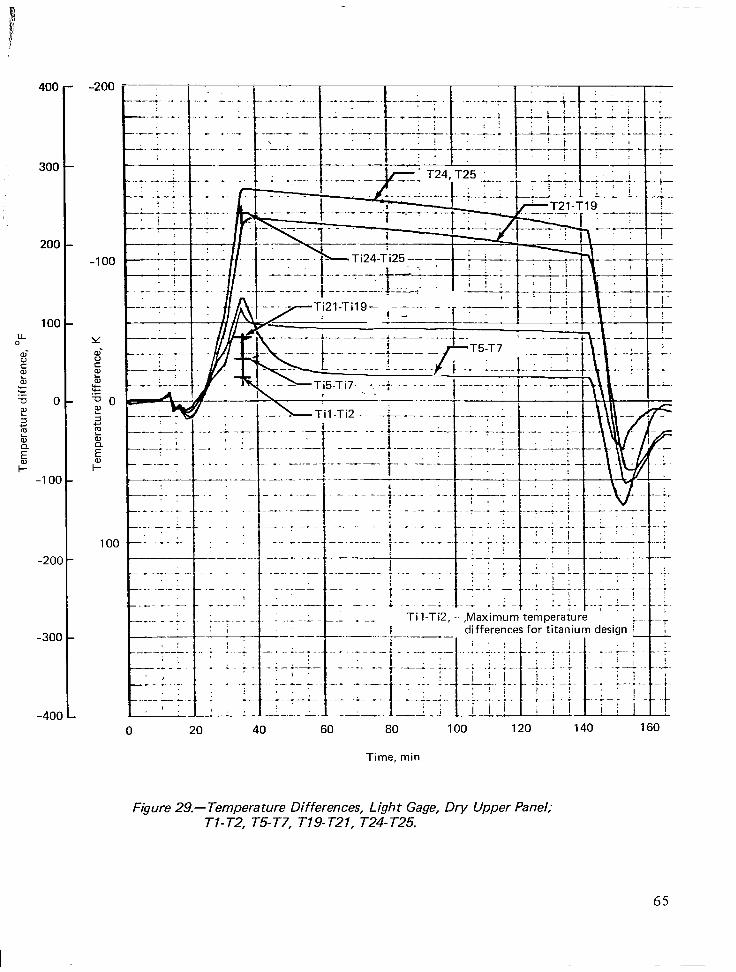
400 -
300 -
200 -
100 - LL 0
5 ii b
z -0 O- F? 3 z t a E
F -100.
-200
-300
-400
t734- :
_~__ ----+-
I i
-100
-- .-_- ..*.
--:’ --- .. -.- .~_.._ ____ . . --_ ._ .-.
---- . _.
_ .-.-- -.. . . . . . .-.- -. - .- -. .
__--.- - -----.
.r-.- -... .-7--b-;-.. _---- --
:
_- :. ._-- ---_ .: -I ..-;. _. -
___ -,L.-
; ;
_ L, -I __.- . . ..L
: j I
I+%
- _--
I
- ---- - _----- 1.
; I :
; :
.,-.L L -..---L
- -L -1 : :- -,Maximum temperaturk :-. L differences for tit:
i ! f .J-L :‘
0 20 40 60 80 100 120 140 160
Time, min
Figure 29.-Temperature Differences, Light Gage, Dry Upper Panel; Tl-T2, T5T7, T19-T21, T24-T25.
65
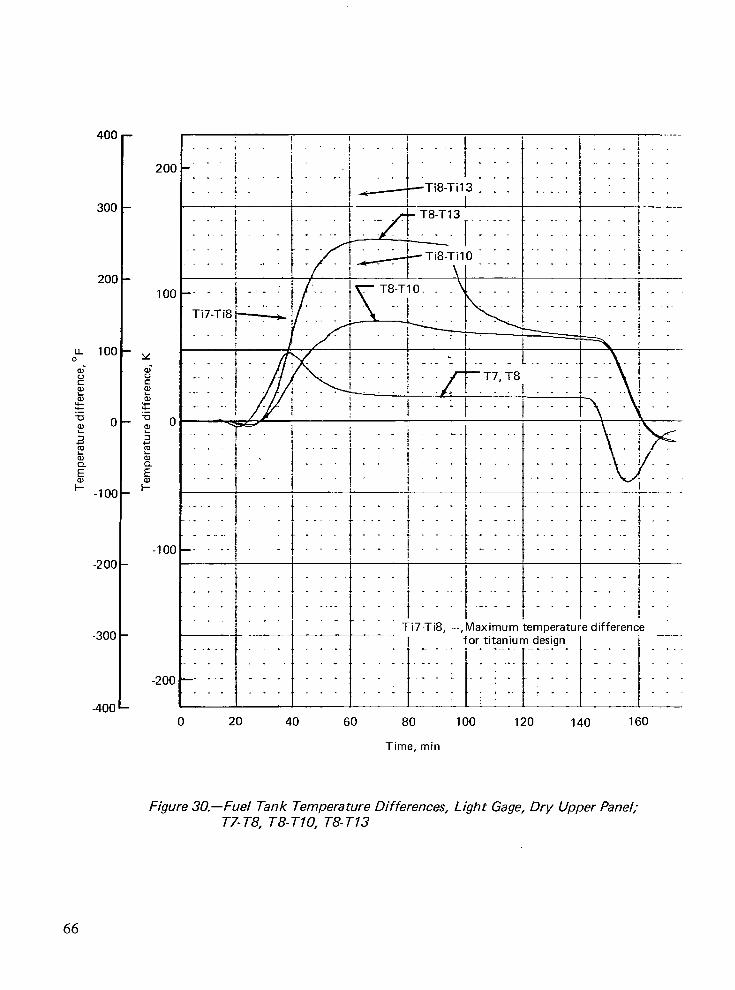
400
300
200
LL 100 0 6 2 $
?E u E 0
2 2 d E
c -100
-200
-300
-400
200
-200
_ . i i 1 dTi8-Ti1,3 . _ _
I - I .
T 3 .- ._-
t -
t
t
difference
. -.._. . .._... . _ . . . . . . - _ -. . . . . . . _
_. -.- - _ * . . _ - . _ - - _ . . . _ . . . _ . . .._ ._. . . . ,_.I._ . . . . . ~ . . . . . . .
0 20 40 60
Figure 30.-Fuel Tank Temperature Differences, T7-T8, T8-TIO, T8-T13
80
Time, min
100 120 140 160
Light Gage, Dry Upper Panel;
66
STRENGTH DESIGN
Internal loads and stresses in the composite wing panels were calculated and these members were resized in ATLAS to satisfy strength criteria. The loads used for this stress analysis were taken from reference 2, based on an aeroelastic analysis of the titanium airframe. Although the substitution of strength designed composite wing cover panels would alter the stiffness distribution, and thus the airload distribution, it was anticipated that the hybrid wing would have to be stiffened to a level comparable to that of the titanium wing to satisfy flutter criteria (see sect. entitled Flutter Analysis and Redesign for Stiffrzess).
The initial sizing of composite panels was calculated by hand, based on the internal loads in the titanium panels. This was done in order to have a set of initial panel sizes that were reasonably close to the final requirement. It was felt that this would be advantageous be- cause of the likelihood that the automated resizing would converge more rapidly. This initial sizing was described previously and listed in table 8.
The main wing box covers were resized automatically based on material allowables and using the design procedure described previously. The stresses in the composite surface panels were reviewed following each resize cycle to determine if the buckling allowables of the panels were exceeded. In those instances where the buckling stresses were being exceeded, the laminate thickness was increased to raise the buckling allowable appropriately.
As was discussed previously, the composite panels were designed using the high strength graphite fibers with mechanical properties projected to 1986. It was recognized that the use of such material would probably result in somewhat reduced stiffness properties of the structure, with the attendant risk of adversely affecting the flutter problem. Also, because of the difference in ultimate strain between the high-strength fibers and the titanium sub- structure, the full strength of the fibers could not be developed without exceeding the ulti- mate strain of the titanium. It was also apparent that the use of high modulus fibers, because of lower strength, and the inability to load up the titanium substructure, would not offer a significant mass reduction relative to the titanium wing.
The following sections describe in greater detail the procedure and the results of the design process for the composite panels.
INITIAL PANEL SIZING
The face sheets of the wing box covers were sized initially using the panel loads from the titanium wing stress analysis described in reference 2. These panels were initially sized assuming that full laminate strength could be developed in both tension and compression. Then typical panels were checked for stability in compression. The preliminary stability analysis of the composite sandwich cover panels was carried out using abbreviated analysis procedures for general instability based on the assumption that the core was rigid. Based on these analyses, a core thickness was selected that was sufficient to develop the full spanwise compression strength and the shear strength for the panels but slightly deficient for the full strength in chordwise compression since large chordwise loads occur over only a small part of the wing. The abbreviated formulae for panel general instability are given on the following page.
67
For unequal face gages the allowable spanwise compressive stress is given by
F; = KE, 12t1 t2 d
(tl + t2)2 (ba1/4)2
The allowable chordwise compressive stress is given by
d 2
0 b cf
The allowable shear stress is given by
F G = 2KS 7r2 - t1 t2 d 2 XY l -pe (tl + t2> 27 0
(4)
(5)
(6)
where : E=2(1 +p,)G
I-(, = (Px Py)"
A= 1 -PxPy
KS = a function of a/b
a = spanwise dimension of panel
b = chordwise dimension of panel
t, = 2x43
9 +t2 d& for unequal face sheet thicknesses
It should be noted that the 1986 high-strength graphite/polyimide was assumed to be avail- able in 2-, 3-, and 4-mil thickness tapes, and that 0.041 cm (0.016 in.) was selected as the minimum gage for the inner face sheet, and 0.082 cm (0.032 in.) and 0.061 cm (0.024 in.) for the outer face sheets on the lower and upper surfaces, respectively. The inner and outer face sheets will be constrained to exhibit the same stress-strain relations. For the subsequent calculations, the component laminates are assumed to have the properties shown in table 16.
For the spanwise compression allowable, consider equation (4). Since the value of the corrected aspect ratio is much larger than unity, the value of K is taken as the asymptotic value, 3.62 (ref. 20). Additionally, the loaded width b is the spar spacing, 88.9 cm (35 in.). Substituting these values in equation (4) yields
68
FC = 55 t1 t2 d2 X
(t 1 + t2j2 Ex fi (7)
Considering next the chordwise compression allowable, the chordwise dimension of the panel is 88.9 cm (35 in.) and an end tixity factor of 2 is assumed. Substituting in equation (5) yields:
F; = 25’ t1 t2 d2 E (fl + tg2 x y
(8)
Now consider the inplane allowable shear stress from equation (6). For large panel aspect ratio, the buckling factor K is 4.83 (ref. 20). Substituting this and the value of 88.9 cm (35 in.) for b gives
F t1 t2 d2 XY = 133.3
01 + t2j2 (l-P,) Gh (9)
Based on these equations, allowable stresses for a range of core thicknesses and face sheet laminates were calculated, and table 17 presents a summary of the core thicknesses required to develop each of the allowable stresses for the laminates shown. Due to the limited scope of the study, only a single core thickness was selected, although this parameter is known to effect optimum theoretical mass significantly. A core thickness of 3.8 1 cm ( 1.50 in.) was chosen since it develops the allowable spanwise compressive stress up to the material strength for all panels except those with thick face sheets and a preponderance of spanwise-oriented plies. It is more than sufficient to develop the allowable inplane shear strength. A core of nearly 5.08 cm (2.00 in.) thickness would be required, however, to develop the chordwise compressive allowable stresses up to the material strength. Chordwise compression loads are small except near the side-of-body, near the landing trunnions and other such points where localized loads are introduced. The possible addition of some face sheet material over a very limited portion of the wing seemed advantageous compared to the relatively large increase in core depth throughout the wing box.
Following the simplified analysis described previously, typical panels were checked using the more exact formula from reference 3 that accounts for the actual core mechanical properties. These checks indicated that the spanwise and chordwise allowable stresses predicted by the simplified equations were high, i.e., unconservative, by less than 2%, and the predicted shear allowables were low, i.e., conservative, by 8%. Also, the shear and compression intracell buckling were checked using the minimum gage face sheets. This check showed that the local instability allowable stresses exceeded the basic material strength for the [O/+45/90/-45 1 laminates with the 0.0508 mm (0.002 in.) ply thickness, while the corresponding allowable for the [O/+45/90] laminate was appreciably less than the basic strength of the laminate in chordwise compression.
69
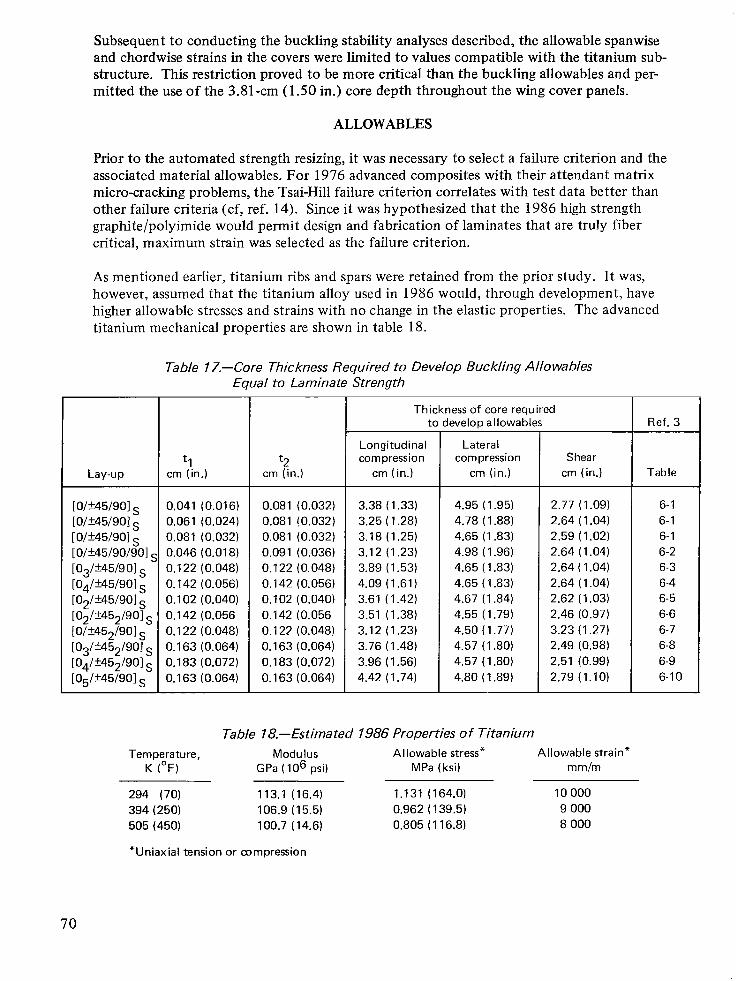
Subsequent to conducting the buckling stability analyses described, the allowable spanwise and chordwise strains in the covers were limited to values compatible with the titanium sub- structure. This restriction proved to be more critical than the buckling allowables and per- mitted the use of the 3.81 -cm (1.50 in.) core depth throughout the wing cover panels.
ALLOWABLES
Prior to the automated strength resizing, it was necessary to select a failure criterion and the associated material allowables. For 1976 advanced composites with their attendant matrix micro-cracking problems, the Tsai-Hill failure criterion correlates with test data better than other failure criteria (cf, ref. 14). Since it was hypothesized that the 1986 high strength graphite/polyimide would permit design and fabrication of laminates that are truly fiber critical, maximum strain was selected as the failure criterion.
As mentioned earlier, titanium ribs and spars were retained from the prior study. It was, however, assumed that the titanium alloy used in 1986 would, through development, have higher allowable stresses and strains with no change in the elastic properties. The advanced titanium mechanical properties are shown in table 18.
Table 17.-Core Thickness Required to Develop Buckling Allowables Equal to Laminate Strength
Lay-up f 1
cm (in.) t2
cm (in.)
Thickness of core required to develop allowables Ref. 3
Longitudinal Lateral compression compression Shear
cm (in.) cm (in.) cm (in.) Table
[0/Ik45/901 s 0.041 (0.016) 0.081 (0.032) 3.38 (1.33) 4.95 (1.95) 2.77 (1.09) 6-l [0/~45/901 s 0.061 (0.024) 0.081 (0.032) 3.25 ( 1.28) 4.78 (1.88) 2.64 (1.04) 6-1 [o/*45/901 s 0.081 (0.032) 0.081 (0.032) 3.18 (1.25) 4.65 (1 .83) 2.59 (1.02) 6-1 [0/?45/90/90] s 0.046 (0.018) 0.09 1 (0.036) 3.12 (1.23) 4.98 (1.96) 2.64 (1.04) 6-2 [03/k45/90]s 0.122 (0.048) 0.122 (0.048) 3.89 (1.53) 4.65 (1.83) 2.64 ( 1.04) 6-3 [04/W5/90] s 0.142 (0.056) 0.142 (0.056) 4.09 (1.61) 4.65 (1.83) 2.64 (1.04) 6-4 [02/W5/901 s 0.102 (0.040) 0.102 (0.040) 3.61 ( 1.42) 4.67 (1 .84) 2.62 (1.03) 6-5 [02/k452/90] s 0.142 (0.056 0.142 (0.056 3.51 (1.38) 4.55 (1.79) 2.46 (0.97) 6-6 [O/W5,/90] s 0.122 (0.048) 0.122 (0.048) 3.12 (1.23) 4.50 (1.77) 3.23 (1.27) 6-7 [03/*452/90] s 0.163 (0.064) 0.163 (0.064) 3.76 (1.48) 4.57 (1.80) 2.49 (0.98) 6-8 [04/W52/90] s 0.183 (0.072) 0.183 (0.072) 3.96 (1.56) 4.57 (1.80) 2.51 (0.99) 6-9 [05/k45/90] s 0.163 (0.064) 0.163 (0.064) 4.42 (1.74) 4.80 (1.89) 2.79 (1.10) 6-10
Table lg.-Estimated 7986 Properties of Titanium Temperature, Modulus Allowable stress* Allowable strain*
K (OF) GPa ( lo6 psi) MPa (ksi) mm/m
294 (70) 113.1 (16.4) 1.131 (164.0) 10 000 394 (250) 106.9 (15.5) 0.962 ( 139.5) 9 000 505 (450) 100.7 (14.6) 0.805 ( 116.8) 8 000
“Uniaxial tension or compression
70
The high strength graphite/polyimide properties have been presented earlier in table 1. It should be noted that the allowable strains for the high strength graphite/polyimide are sig- nificantly larger than those for the titanium alloy. To retain strain compatibility with the titanium spar and rib chords, the strains of the high strength graphite/polyimide must be limited to the allowable titanium strain. The mathematical model of the structure in ATLAS specifies different materials for the [Ol , [+451 and [9Ol laminae on the upper and lower surfaces. Thus, different strain limitations may be imposed on each of these laminae.
The [0] and [90] laminae allowable tensile strains were reduced to the allowable titanium tensile strain for the appropriate temperature. The allowable compressive strain for the [Ol laminae (spanwise) was also reduced to these same strain limits. Based on these strain limits the maximum stress ratios for uniaxial spanwise loading are:
R spanwise = Fzpplied 1.38 GPa = = Fzllowable 2.00 GPa .69 at 294K (70’ F)
1 24 GPa _L-- 2.00 GPa = .621 at 394 K (250” F)
1.10 GPa = 1.79 GPa .615 at 505 K (450” F)
The interaction relationship used for buckling failure under combined biaxial compression and shear is shown in figure 3 I. This is used solely to establish the allowable strains. From figure 3 1 it can be seen that if Rx absence of any shear loading.
= 0.69, then Ry (chordwise) is limited to 0.767, in the The selected core thickness of 3.8 cm ( 1.5 in.) develops only
about 67% of the material allowable as an allowable buckling stress for chordwise compres- sion loads. Thus for a chordwise-oriented ply, the allowable stress for the biaxial com- pressive loading (Rx = 0.69 and Ry = 0.767) is
Fb = 0.767 (0.67) 2.0 (290) = 1.027 GPa (149 ksi)
The decision was made to reduce the chordwise compressive stress from 1.027 GPa (149 ksi) to 0.924 GPa (134 ksi) to permit some allowance for shear loading in conjunction with the biaxial compression. Thus, the maximum chordwise compressive stress ratio becomes
0.924 RY = 0.67(2.0) = 0.69
For spanwise compression and shear loading only the maximum shear stress ratio Rx would be 0.55. For chordwise compressive and shear loading only, the maximum +45 ply s Y ress of 1.378 GPa (200 ksi) was selected which gives
R 1 38 XY
= L ~0.69 2.0
I -
71
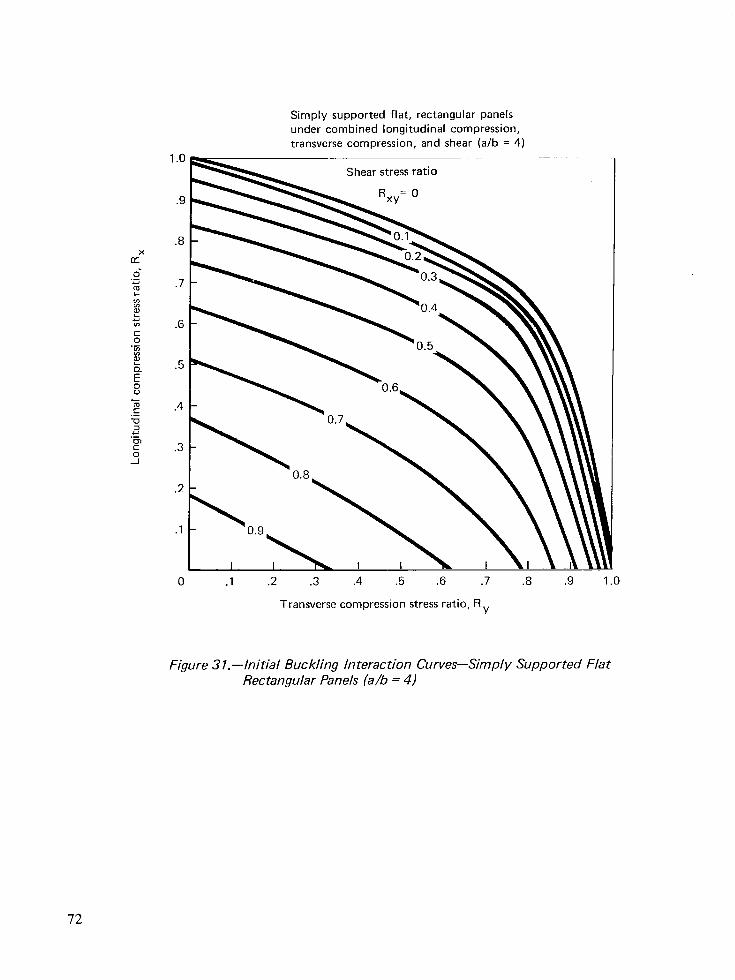
.2 .3 .4 .5 .6 .7 .8 .9 1.0
Transverse compression stress ratio, R y
Figure 3 I.-Initial Buckling Interaction Curves-Simply Supported Flat Rectangular Panels (a/b = 4)
72
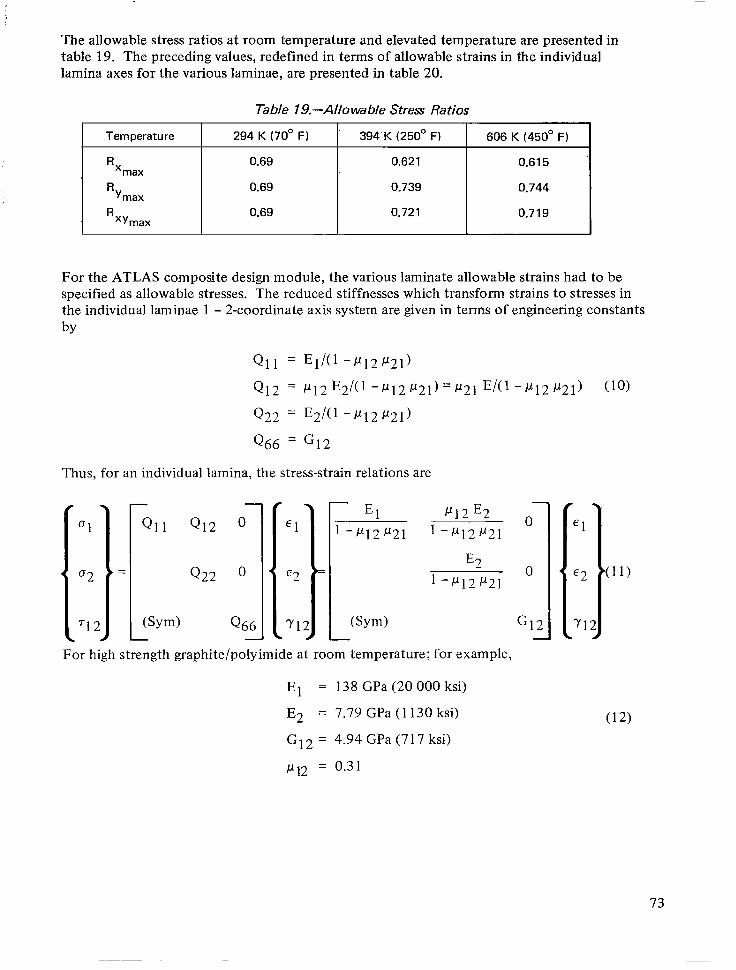
The allowable stress ratios at room temperature and elevated temperature are presented in table 19. The preceding values, redefined in terms of allowable strains in the individual lamina axes for the various laminae, are presented in table 20.
Table 19.-Allowable Stress Ratios
I Temperature 294 K (70’ F) 394.K (250° F) 606 K (450’ F)
R ‘max 0.69 0.621 0.615
5 0.69 0,739 0.744 max
R ‘Ymax 0.69 0.721 0.719
For the ATLAS composite design module, the various laminate allowable strains had to be specified as allowable stresses. The reduced stiffnesses which transform strains to stresses in the individual laminae 1 - 2-coordinate axis system are given in terms of engineering constants by
Ql] = El/(] 3q21-121)
Q12 = 1”12E2/U -1-1 I~ ~2~) = 1121 WI -1~12 i-91) (10)
Q22 = E2/(1 -1-112 1121)
Q66 = G12
Thus, for an individual lamina, the stress-strain relations are
[;f::;: l--J “)-I--; ::;I ;
For high strength graphite/polyimide at room temperature; for example,
El = 138 GPa (20 000 ksi)
J32 = 7.79 GPa (1130 ksi)
G 12 = 4.94 GPa (7 17 ksi)
I-1 12 = 0.31
e1
‘I
E2 (11)
?I2
(12)
73
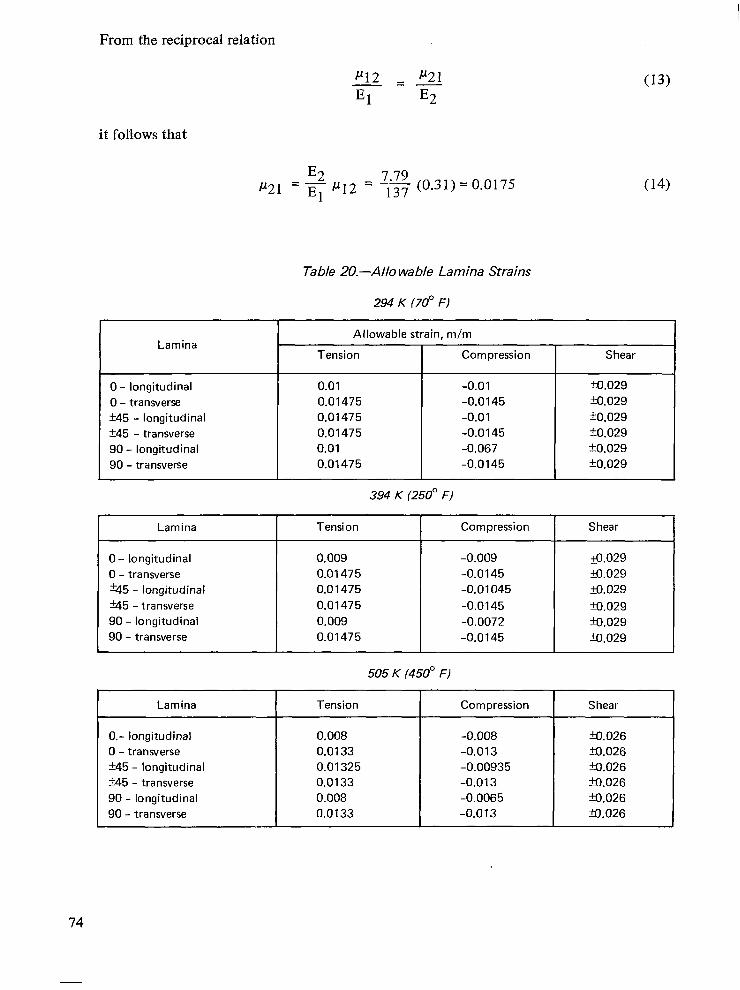
From the reciprocal relation
(13)
it follows that
p21 E2 =- El PI2 = 7.79
137 (0.31) = 0.0175
Table 20.-All0 wable Lamina Strains
294 K (70’ F)
(14)
Lamina
0 - longitudinal 0 - transverse k45 - longitudinal W5 - transverse 90 - longitudinal 90 - transverse
Allowable strain, m/m
Tension Compression
0.01 -0.01 0.01475 -0.0145 0.01475 -0.01 0.01475 -0.0145 0.01 -0.067 0.01475 -0.0145
394 K (250° F)
Shear
a.029 3029 kO.029 kO.029 kO.029 f0.029
Lamina Tension Compression Shear
0 - longitudinal 0 - transverse %5 - longitudinal +115 -transverse 90 - longitudinal 90 - transverse
0.009 -0.009 8.029 0.01475 -0.0145 ko.029 0.0 1475 -0.01045 a.029
0.01475 -0.0145 a.029 0.009 -0.0072 m.029 0.01475 -0.0145 3029
505 K (450” F/
Lamina Tension Compression Shear
O.- longitudinal 0.008 -0.008 9.026 0 - transverse 0.0133 -0.013 XI.026 k45 - longitudinal 0.01325 -0.00935 XI.026 k45 - transverse 0.0133 -0.013 XI.026 90 - longitudinal 0.008 -0.0065 XI.026 90 - transverse 0.0133 -0.013 3.026
1
74
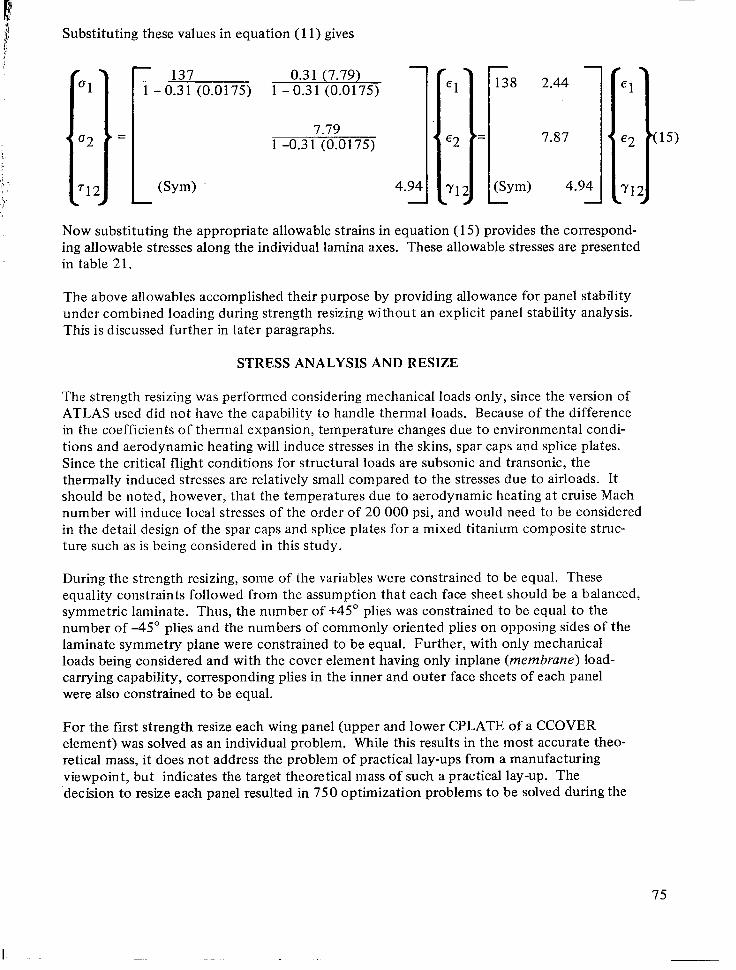
Substituting these values in equation (11) gives
7.79 1 -0.31 (0.0175)
Wm) 4.94 - -
137 0.3 1 (7.79) 1 - 0.31 (0.0175) 1 -0.31 (0.0175)
Now substituting the appropriate allowable strains in equation (15) provides the correspond- ing allowable stresses along the individual lamina axes. These allowable stresses are presented in table 2 1.
The above allowables accomplished their purpose by providing allowance for panel stability under combined loading during strength resizing without an explicit panel stability analysis. This is discussed further in later paragraphs.
STRESS ANALYSIS AND RESIZE
The strength resizing was performed considering mechanical loads only, since the version of ATLAS used did not have the capability to handle thermal loads. Because of the difference in the coefficients of thermal expansion, temperature changes due to environmental condi- tions and aerodynamic heating will induce stresses in the skins, spar caps and splice plates. Since the critical flight conditions for structural loads are subsonic and transonic, the thermally induced stresses are relatively small compared to the stresses due to airloads. It should be noted, however, that the temperatures due to aerodynamic heating at cruise Mach number will induce local stresses of the order of 20 000 psi, and would need to be considered in the detail design of the spar caps and splice plates for a mixed titanium composite struc- ture such as is being considered in this study.
During the strength resizing, some of the variables were constrained to be equal. These equality constraints followed from the assumption that each face sheet should be a balanced, symmetric laminate. Thus, the number of +45” plies was constrained to be equal to the number of -45’ plies and the numbers of commonly oriented plies on opposing sides of the laminate symmetry plane were constrained to be equal. Further, with only mechanical loads being considered and with the cover element having only inplane (membrane) load- carrying capability, corresponding plies in the inner and outer face sheets of each panel were also constrained to be equal.
For the first strength resize each wing panel (upper and lower CPLATE of a CCOVER element) was solved as an individual problem. While this results in the most accurate theo- retical mass, it does not address the problem of practical lay-ups from a manufacturing viewpoint, but indicates the target theoretical mass of such a practical lay-up. The decision to resize each panel resulted in 750 optimization problems to be solved during the
75
II
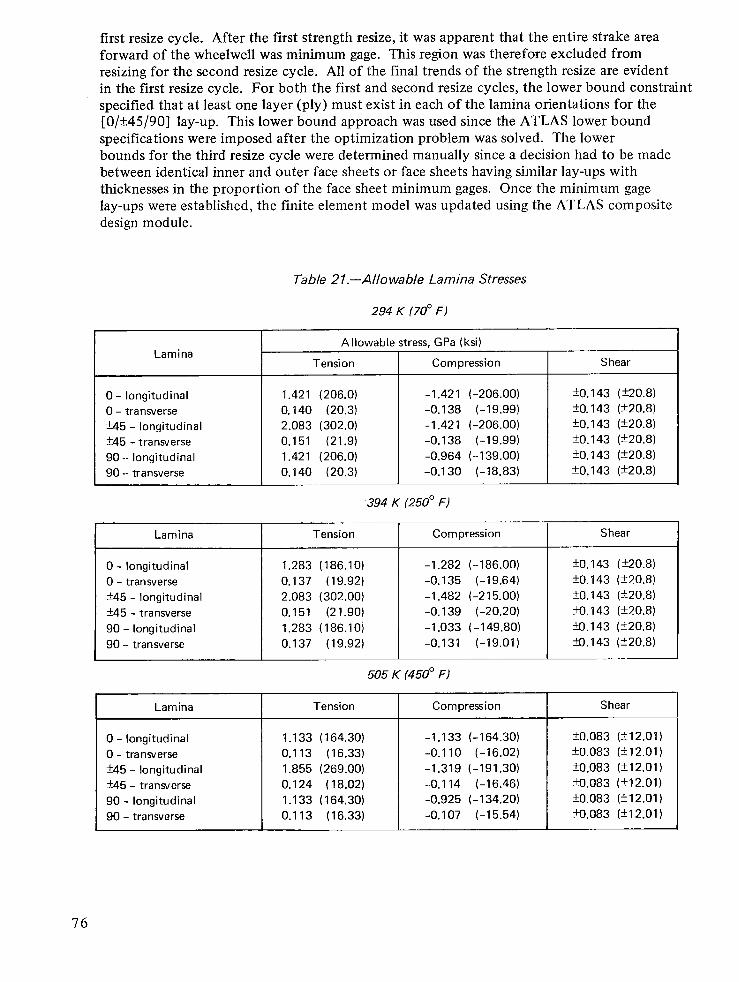
first resize cycle. After the first strength resize, it was apparent that the entire strake area forward of the wheelwell was minimum gage. This region was therefore excluded from resizing for the second resize cycle. All of the final trends of the strength resize are evident in the first resize cycle. For both the first and second resize cycles, the lower bound constraint specified that at least one layer (ply) must exist in each of the lamina orientations for the [O/+45/901 lay-up. This lower bound approach was used since the ATLAS lower bound specifications were imposed after the optimization problem was solved. The lower bounds for the third resize cycle were determined manually since a decision had to be made between identical inner and outer face sheets or face sheets having similar lay-ups with thicknesses in the proportion of the face sheet minimum gages. Once the minimum gage lay-ups were established, the finite element model was updated using the ATLAS composite design module.
Table 21.-All0 wable Lamina Stresses
294 K (70’ F)
Lamina
0 - longitudinal 0 - transverse ti5 - longitudinal
M5 -transverse 90 -- longitudinal 90 -- transverse
Allowable stress, GPa (ksi)
Tension Compression
1.421 (206.0) -1.421 (-206.00) 0.140 (20.3) -0.138 (-19.99) 2.083 (302.0) -1.421 (-206.00) 0.151 (21.9) -0.138 (-19.99) 1.421 (206.0) -0.964 (-139.00) 0.140 (20.3) -0.130 (-18.83)
394 K (250° F)
Shear
f0.143 (f20.8) +O. 143 (220.8) f0.143 (f20.8) f0.143 (k20.8) f0.143 (k20.8) kO.143 (f20.8)
Lamina
0 - longitudinal 0 - transverse ?45 - longitudinal *45 - transverse 90 - longitudinal 90 - transverse
Tension Compression Shear
1.283 (186.10) -1.282 (-186.00) f0.143 (f20.8) 0.137 (19.92) -0.135 (-19.64) f0.143 (k20.8) 2.083 (302.00) -1.482 (-215.00) f0.143 (k20.8) 0.151 (21.90) -0.139 (-20.20) ?Oo. 143 (f20.8) 1.283 (186.10) -1.033 ( -149.80) XI.143 (f20.8) 0.137 (19.92) -0.131 (-19.01) xl.1 43 (f20.8)
505 K (450” F)
Lamina Tension Compression Shear
0 - longitudinal 1.133 (164.30) -1.133 (-164.30) kO.083 (?12.01) 0 - transverse 0.113 (16.33) -0.110 (-16.02) kO.083 (f12.01) ti5 - longitudinal 1.855 (269.00) -1.319 (-191.30) xl.083 (+I 2.01) ti5 - transverse 0.124 (18.02) -0.114 (-16.46) xl.083 (H2.01) 90 - longitudinal 1.133 (164.30) -0.925 (-134.20) f0.083 (fl2.01) 90 - transverse 0.113 (16.33) -0.107 (-15.54) XI.083 (fl2.01)
76
A review of the resizing results in reference 3 shows that the regions outboard and forward of the wheelwell and outboard of the wing-mounted fin were sized by minimum gage con- straints. Results for other regions of the structure (see fig. 12) are presented in figures 32a through 32f. In these figures the numbers in the panels are lamina sizing values, i/j/k, that define subscripts in the standard laminate code for a [Oi/*45j/9OkI laminate composed of O-051-mm (0.002 in.) thickness plies. The lower panel sizing is shown without parentheses, and the upper panel sizing is shown in parentheses.. If a single set is shown for either an upper or lower panel, it applies equally to the inner and outer face sheets. Otherwise, the two sets of values are shown in braces with the thinner laminate being the inner face sheet. For all face sheets not defined in these figures, the following sizes apply:
Upper Surface Outer = 3/3/3 Upper Surface Inner = 2/2/2 Lower Surface Outer = 4/4/4 Lower Surface Inner = 21212
With the exception of the lower surface just inboard of the outboard engine beams, the panels adjacent to the rear spar are predominantly undirectional laminates oriented parallel to the rear spar. Along the side-of-body on the wing lower surface, the body bending induces chordwise loads that peak inboard of the wheelwell where up to six chordwise plies are required. The largest strength requirement for [ +45] laminae occurs six spars forward of the rear spar midway between the engine beams on the upper surface, i.e., panel number 182 in figure 32b. Note that the corresponding lower panel does not require these [ ?45] plies. The sizing of these latter lower surface panels, relative to those located immediately aft, requires comment. These two groups of panels were included in different zones and had different original sizes, resulting in a step across the zone boundary. With two resize cycles, the relative sizes appear more disparate than the initial values. This leads to the conclusion that a preferred approach would be to use a uniform size (uniformly varying would require too much input) over the entire wing and let the ATLAS composite design module determine the varying sizing requirements.
Figure 33 illustrates the relative theoretical mass for each cycle of resize. The relatively small mass increment between the first and second resize cycles indicates that for mass estimation purposes, the resizing has converged acceptably. The relatively larger increment of mass added from the second to the third resize cycle indicates that the minimum gages selected have a significant mass impact.
PANEL STABILITY EVALUATION
After each cycle of strength sizing, the Boeing-developed COOPB, Laminated Composite Analysis program, was used to evaluate the resized wing panels. An orthotropic plate buckling analysis for simply supported plates subjected to inplane biaxial compression and shear loads was performed including the effect of core shear stiffnesses.
77
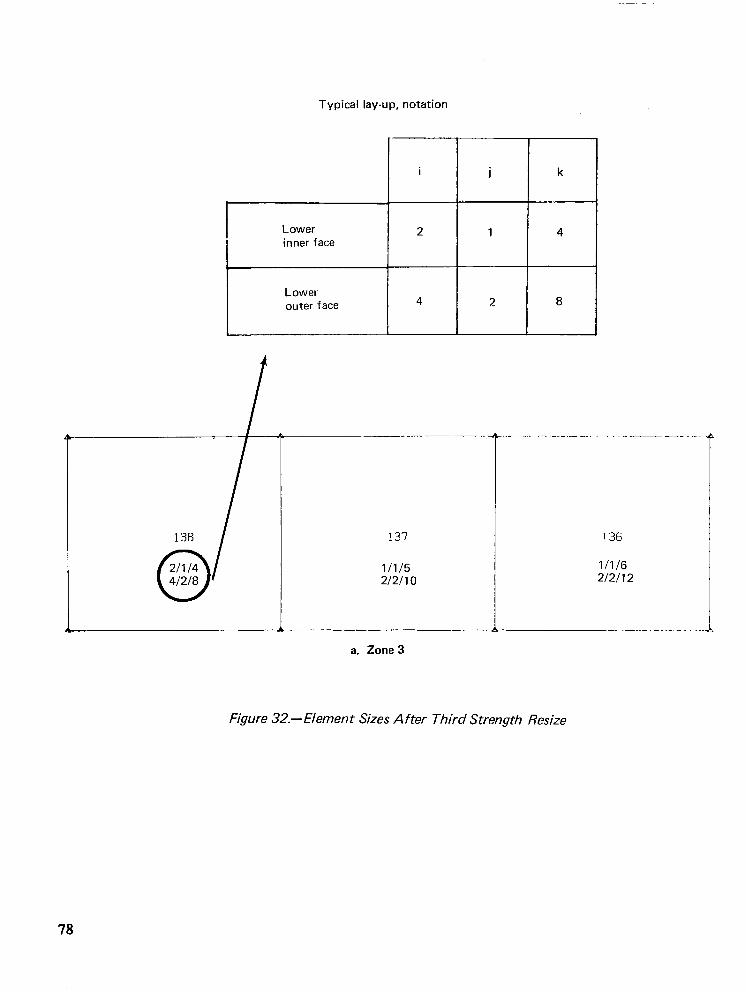
Typical lay-up, notation
i
Lower inner face
2
Lower outer face 4
__-_------ --
137
l/l/5 2/2/I 0
---
a. Zone 3
-- -_
136
l/l/6 212112
Figure 32.-Element Sizes A fter Third Strength Resize
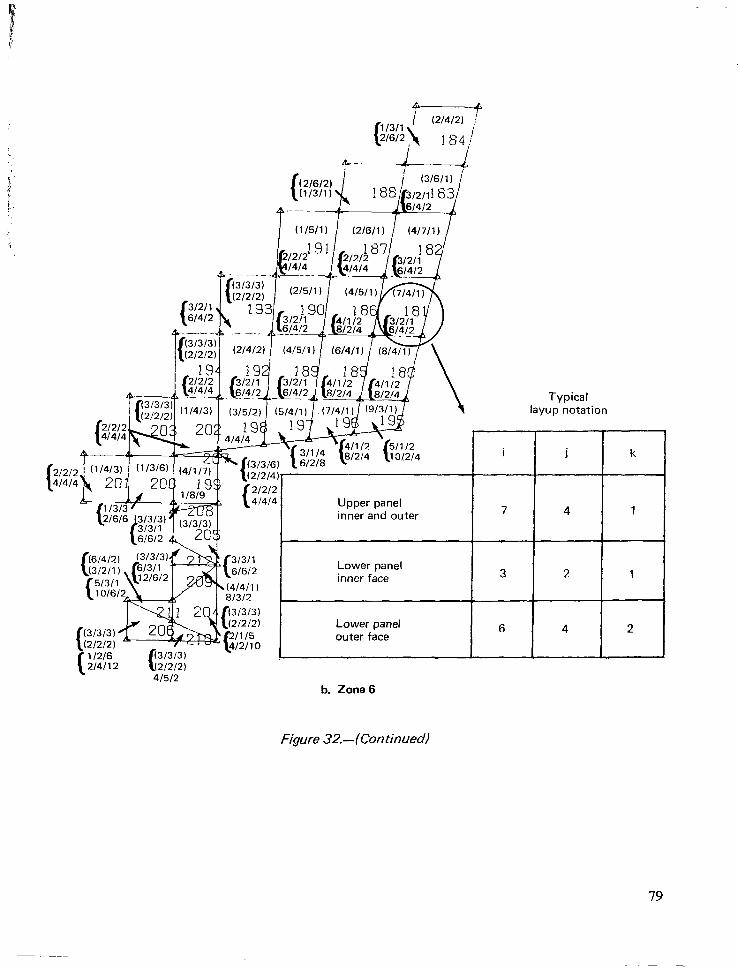
I (l/5/1) (2/6/l) (4/7/l) /
layup notation
Lower panel outer face
6 4 2
b. Zone 6
Figure 32.~(Continued)
79
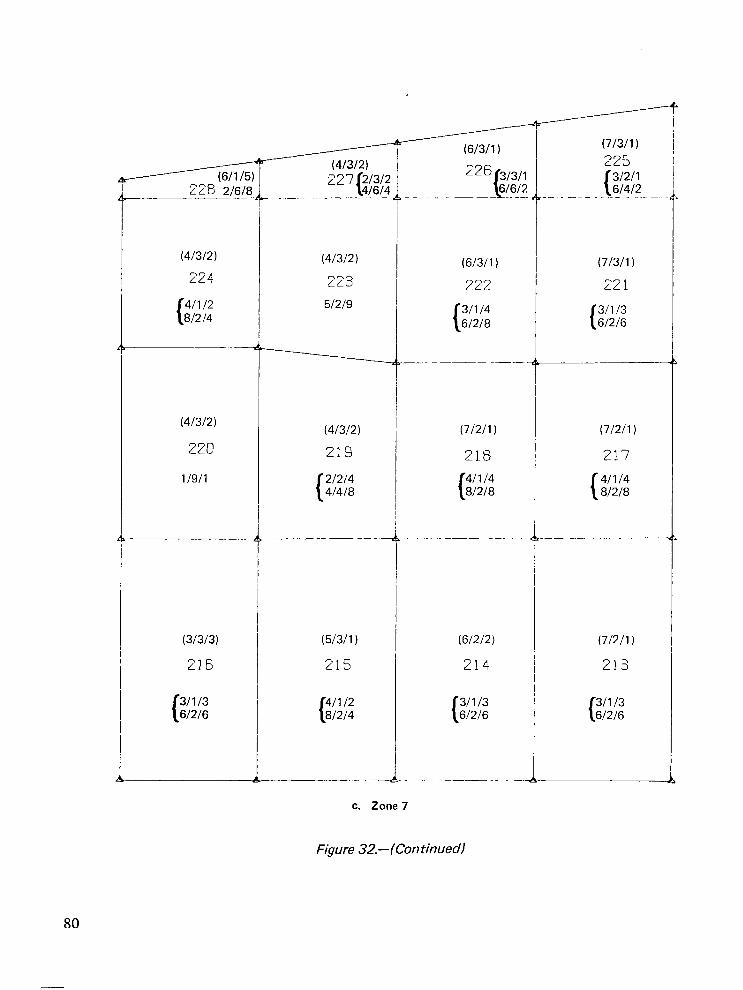
------i6/1/5: L”28 21618 -___-__--
(41312)
224
4/l I2 81214
(41312)
220
1/9/l
(31313)
216
3/l I3 61216
(41312)
223 51219
(41312)
219
21214 41418
(5/3/l 1
215
4/l I2 I 81214
4% P
1
4
i
----Gz- Z6 3/3/l
I~.__ 61614
(6/3/l 1
222
3/l I4 61218
(7/2/l) (7/2/l 1
218 217 4/l I4 81218
4/l/4 81218
(61212) (7/2/l 1
214 213
3/l/3 61216
___I_ ._. --
f
4
a
I (7/3/l) / 225
(7/3/l 1
221
3/l I3 61216
3/l I3 61216
C. Zone 7
Figure 32.- (Con tinuedl
80
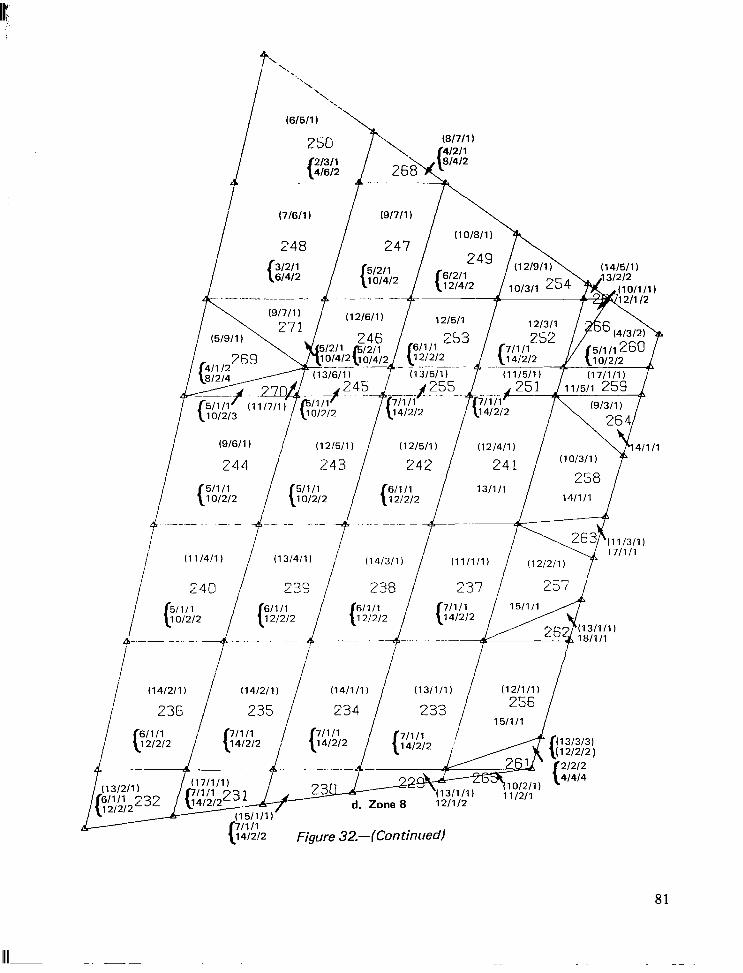
I -. \ (6/5/l)
25G
2/3/l 41612
I I
(9/7/l ) \
(10/8/l) 247
Figure 32.- (Con timed)
81
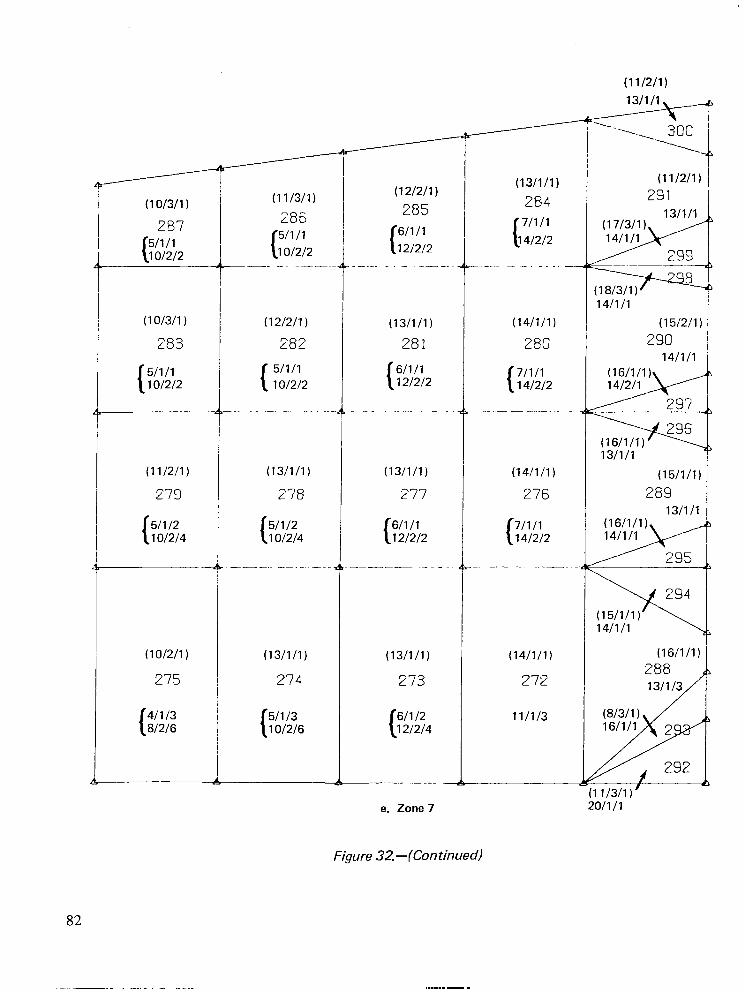
(11/2/l)
(10/3/l)
287 5/l/l
t 1 O/2/2
(1 o/3/1 )
283
(11/2/l)
279
5/l/2 1 O/2/4
(1 o/2/1 )
275
1 4/l I3 81216
82
-.. - . . .._ _ . _ . _
(11/3/l)
286
t
5/l/l 1 o/2/2
__-. -~
(12/2/l )
282
(
5/l/l 1 o/2/2
__--- -.
(13/1/l)
278
( 5/l/2 1 O/2/4
--- -.-. -.
(13/1/l)
274
5/l I3 10/2/6
(12/2/l 1
285
(
6/l /I 121212
(13/1/l)
281
( 6/1/l 121212
---- .
(13/1/l)
277
1 6/l /I 121212
-__ .----
(13/1/l)
273
6/l/2 121214
e. Zone 7
-
(13/1/l)
284
t
7/l/l 141212
(14/1/l)
280
I 7/l/l 141212
- - - ..-. . . _~
(14/1/l)
276
I 7/1/l 141212
- -. ..___.. -
(14/1/l)
272
1 l/1/3
Figure 32.~(Con timed)
13/l/l
-.
-
“----, 300
(11/2/l) 1
291 I 13/1/l
(17/3/l 1 14/1/l 4 299
s (18/3/l) 14/l/l
(15/2/l) 290
H
>
(15/1/l)
289 13/l I1
!0/1/1
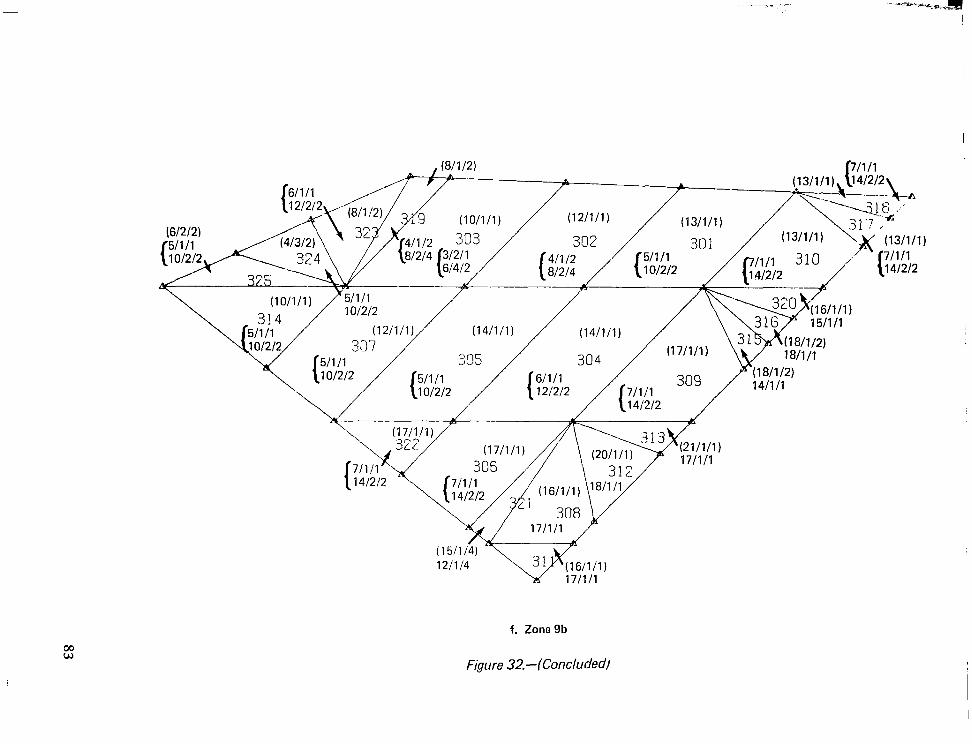
6/l/’ 1212
212 \ -._-_ 4
:’ (13/l/l)
\I41212
f. Zone 9b
Figure 32.~(Concluded)
0.6
Normalized
theoretical
weight Minimum gage criteria used
0.4
0.2 -
Upper surface Outer face 0.2 mm (0.008 in.) 0.2 mm (0.008 in.) 0.61 mm (0.024 in.) Inner face 0.2 mm (0.008 in.) 0.2 mm (0.008 in.) 0.41 mm (0.016 in.)
Lower surface Outer face 0.2 mm (0.008 in.) 0.2 mm (0.008 in.) 0.41 mm (0.016 in.) Inner face 0.2 mm (0.008 in.) 0.2 mm (0.008 in.) 0.81 mm (0.032 in.)
0.863
0.8 -
I I I 0 1 2 3
resize cycle
Figure 33.-Theoretical Wing Mass, Wing Box Primary Structure, A TLAS Resizing
After the first resize cycle, panels for the stability checks were selected based on (1) the lay-ups of the panels after the strength optimization and (2) an assessment of the loads and change of loads in that region. For example, on the wing upper surface near the rear spar and side-of-body where high spanwise compressive stresses exist, if adjacent panels were several layers different in 0” (spanwise) layers, the lighter panel was selected for a stability check. In this manner a total of 86 upper and lower surface panels were selected and checked. When a panel was found to be unstable for the design loads, additional panels in the im- mediate region were also evaluated. This resulted in another 18 panels being checked. As a result of this investigation, nine panels were found which were unstable for the design loads. The location of these panels and the critical design load case(s) are shown in figures 34 and 35. For six of the unstable panels, sufficient stiffness to render them stable for the critical load case was achieved by adding one 0.051-cm (0.002 in.) layer to each of the face sheet laminates. Two 0.05 l-cm (0.002 in.) layers per face sheet were required for the.other three panels. The lay-up changes required to stabilize the strength-sized upper and lower surface panels are presented in figures 36 and 37, respectively.
After the second cycle of stress analysis and strength-optimized resize, panel stability was again evaluated using the first cycle results as a guide for selecting panels for evaluation. One upper surface panel near the rear spar at the side of body lacked sufficient stiffness to preclude instability failure. Figures 38 and 39 summarize the results of the panel stability evaluation performed after the second strength resize.
The third strength resize cycle imposed the actual minimum gage constraints on the various face sheets as opposed to the single layer minimum constraints in the first and second resize cycles. Thus, each face sheet lay-up had the same or increased stiffness, which pre- cluded the necessity for further panel stability evaluation.
85
Note: Panels failing stability check have critical load case identified within panel. Three panels buckle for more than one load case.
Load cases 1 Positive maneuver at VA, g ross weight = 332 Mg (732 kips)
2 Positive maneuver at VA, gross weight = 325 Mg (7 17 kips)
3 Positive maneuver at VA, gross weight = 319 Mg (704 kips)
4 Flaps down maneuver at VF, gross weight =337 Mg (743 kips)
Figure 34.-Upper Surface Panel Stability Check After Resize Cycle 1
Note: Panels failing stability check have critical load case identified within panel.
i i i
Load cases 1.
Wing
Taxi ground loads at 3g ultimate vertical acceleration, gross weight = 340 Mg (750 kips)
Figure 35.-Lower Surface Panel Stability Check After Resize Cycle 1
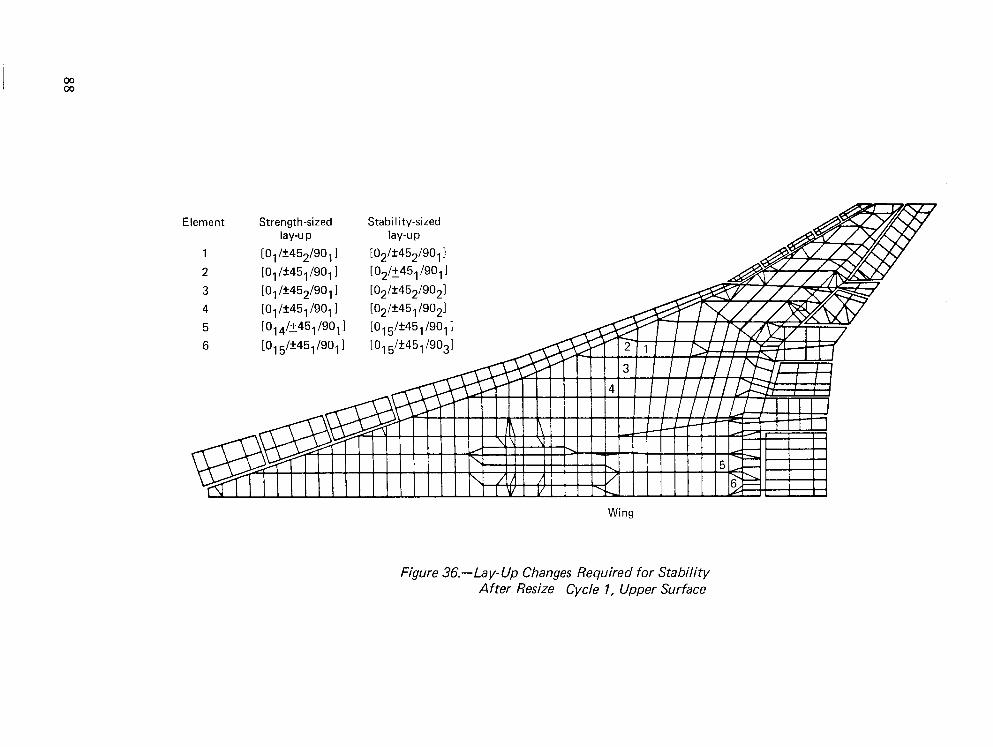
Element
1
2 3
4 5
6
Strength-sized lay-up
[O,/f452/9011
[0@45,/90,1 [O, /f452/90,1
LO, /f45,/9Oj 1 [0,4/+45,/90,1
101 5/f45,/90, 1
Stability-sized
Wing
lay-up
Figure 36.-Lay-Up Changes Required for Stability After Resize Cycle 1, Upper Surface
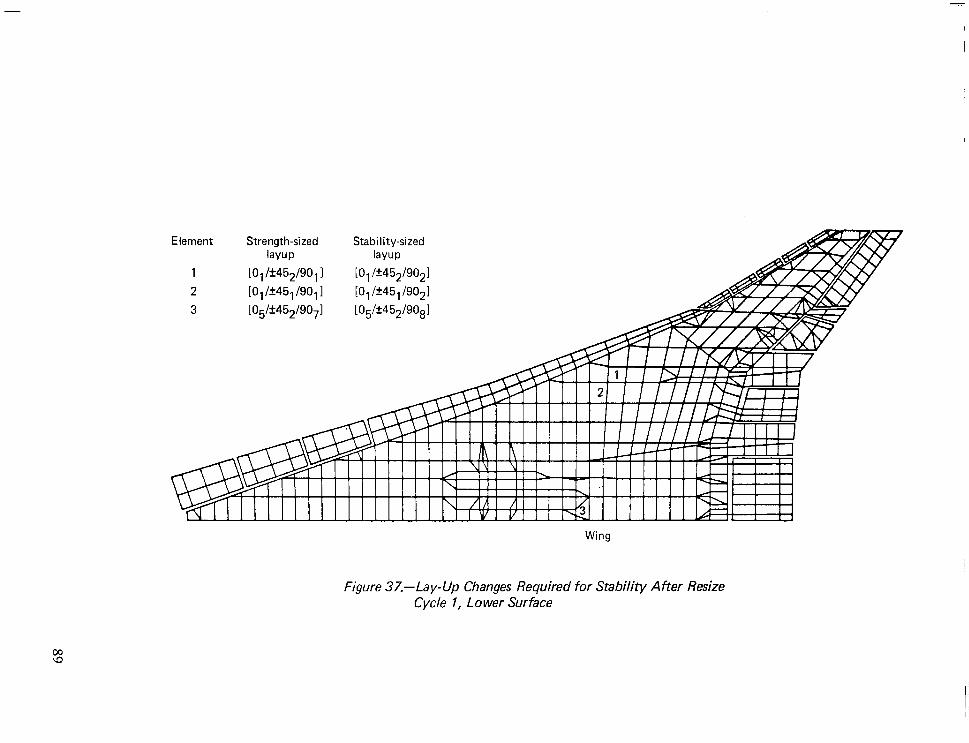
-
Element Strength-sized Stability-sized layup W-w
1 LO, /i452/90,1 [O,/f452/9021 2 [O,/f45, /go, 1 LO, /f45, /go21 3 [05/f452/9071 [05/+452/9081
Wing
Figure 37.-Lay-Up Changes Required for Stability After Resize Cycle 1, Lower Surface
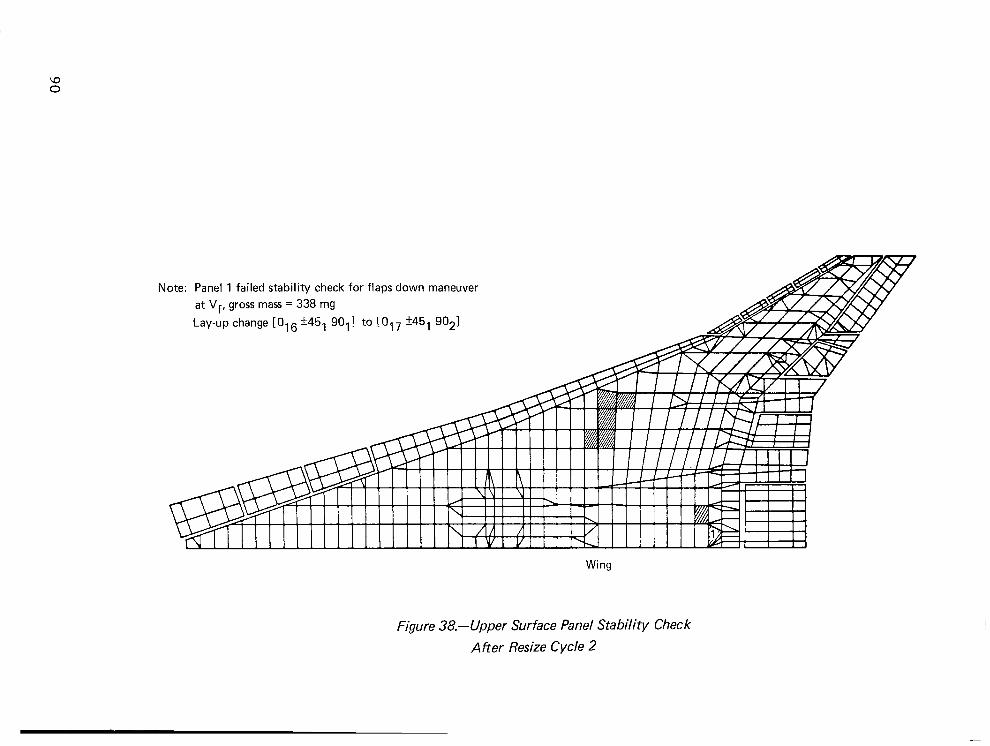
Note: Panel 1 failed stability check for flaps down maneuver at Vf, gross mass = 338 mg
Lay-up change [016 f45, 90,l to [017 f451 9021
I I I
I I
IlllIVIV1III\MlII1III~ ;; i ;I
Wing
Figure 38.~Upper Surface Panel Stability Check
After Resize Cycle 2
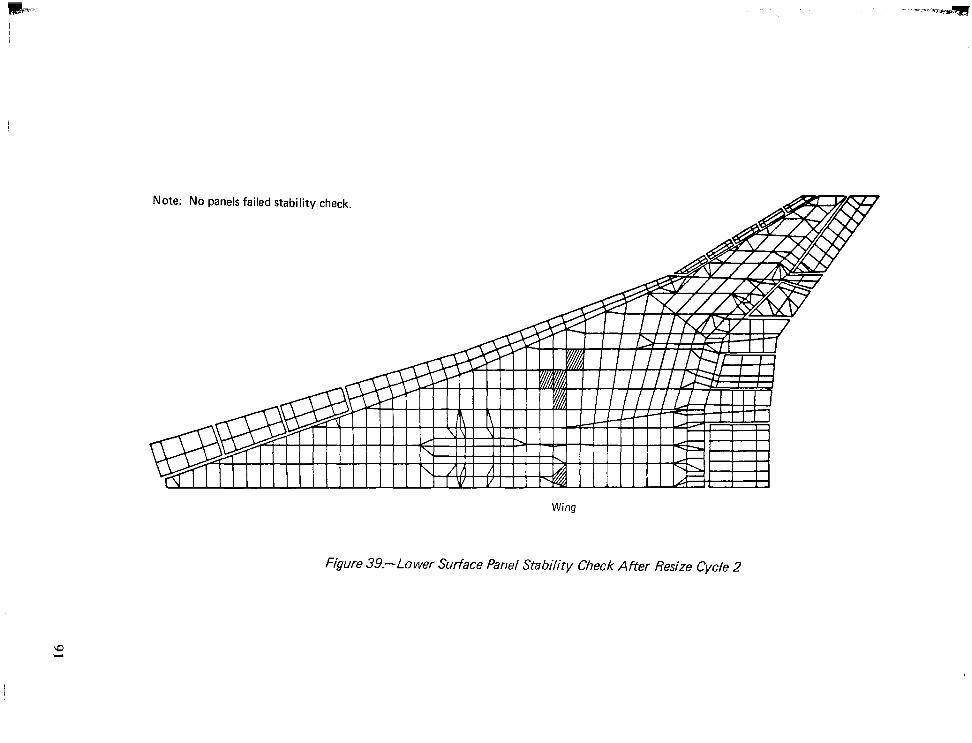
Note: No panels failed stability check.
I I I IllllYzu ! !-I
I I Al
Wing
Figure 39.-Lower Surface Panel Stability Check After Resize Cycle 2
FLUTTER ANALYSIS AND REDESIGN FOR STIFFNESS
In the study of the metal airplane (ref. l), a preliminary flutter analysis of the initially sized structure indicated that a significant increase in stiffness would be required to satisfy flutter criteria, and it was decided to increase stiffness in three areas prior to the loads analysis, in order to obtain a set of design loads that would be reasonably consistent with the final design. These changes included a general stiffening of the wing tip structure outboard aileron covers, and stiffening of nacelle support beams. Subsequent to the loads analysis and strength resize, a sequence of nine stiffness variations were made in arriving at the final design. These changes included a general stiffening of the wing tip structure outboard of the wing mounted fin, increased thickness of outboard aileron covers, and stiffening of nacelle support beams. Subsequent to the loads analysis and strength resize, a sequence of nine stiffness variations were made in arriving at the final design.
The titanium internal wing structure used for this study retained most of the stiffness modi- fications added for flutter prevention in reference 1. These modifications and an increase in wing-tip cover thickness were applied as stiffness constraints for the strength design hybrid structure with graphite/polyimide wing shell and are shown in figure 40.
FLUTTER APPRAISAL AND REDESIGN PROCEDURE
Flutter analysis of the hybrid structure with strength designed composite wing panels gave a relatively low flutter speed, 148 m/set EAS, for the critical symmetric, high gross mass condition at Mach 0.9, well below the requirement of 228 m/set EAS. The first six mode shapes and natural frequencies of the hybrid structure are shown for comparison in figure 41. The appearance of large torsional deflections in the wing tip region in mode six of the hybrid wing is obviously a factor contributing to the low flutter speed of that structure. This characteristic is attributed to predominantly unidirectional spanwise lay-ups resulting from strength design of the composite wing cover panels.
Further insight into the mechanism of the critical flutter mode of the hybrid structure and suggestions for modification to raise its flutter speed were obtained from the energy balance tabulations presented in table 22. Natural frequencies of the two rigid body freedoms and the first 18 elastic modes of the two structures are tabulated in the second and third columns of this table; these modes were used as coordinate shapes in the flutter analyses. Relative energy inputs to the structure from the generalized aerodynamic forces associated with indi- vidual degrees of freedom, at neutral stability, are listed in the last two columns of the table. Positive values indicate net positive work done on the structure by oscillatory forces during a single cycle of oscillation. At neutral stability the total energy input from the airstream is zero; at slightly higher airspeed the net balance would be positive. It will be noted that the sixth mode of the hybrid structure is a major contributor of positive energy, indicating the need for greater stiffness, particularly torsional stiffness, in the wing tip region.
STIFFNESS REDESIGN OF COMPOSITE COVER PANELS
Four stiffness redesign cycles, with modifications to the advanced composite cover panels, were required to satisfy the M = 0.9 flutter requirement. Successive changes in lay-up of representative wing panels during the redesign process are presented in table 23.
92
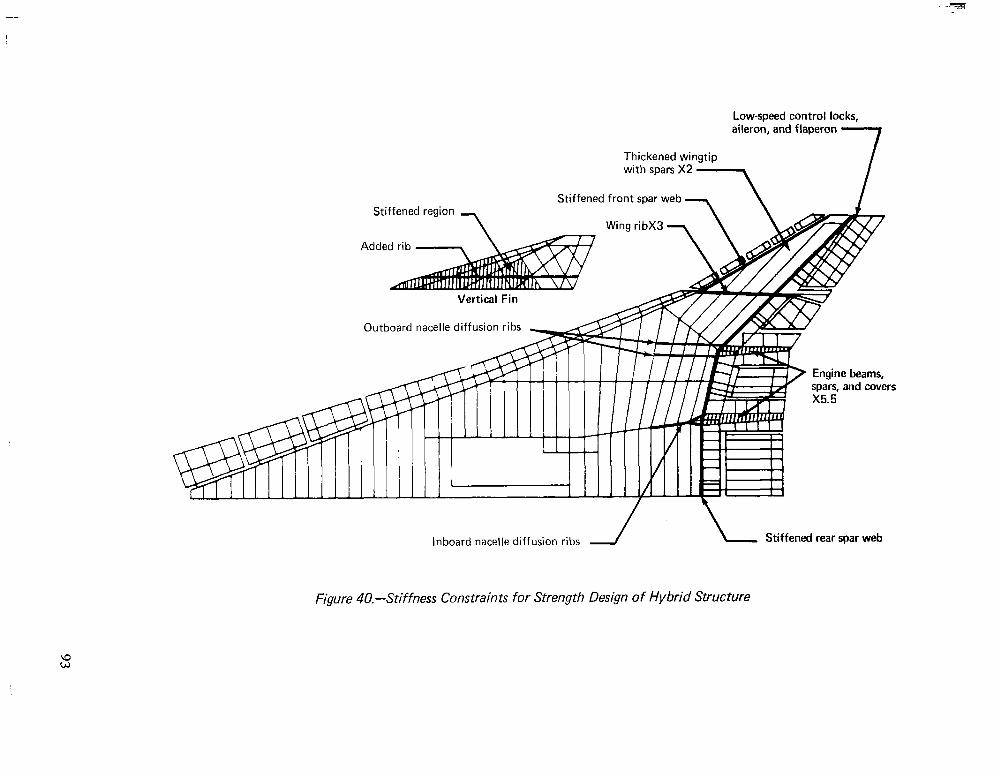
-
Low-speed control locks, aileron, and flaperon
Thickened wingtip with snare KJ -,
Stiffened region
7 Added rib-,
Stiffened front spar web -
Wil 1g ribX3
Vertical Fin
Outboard nacelle diffusion
Engine beams, spars. and covers
Inboard nacelle diffusion ribs Stiffened rear spar web
Figure 40.~-Stiffness Cons train ts for Strength Design of Hybrid Structure
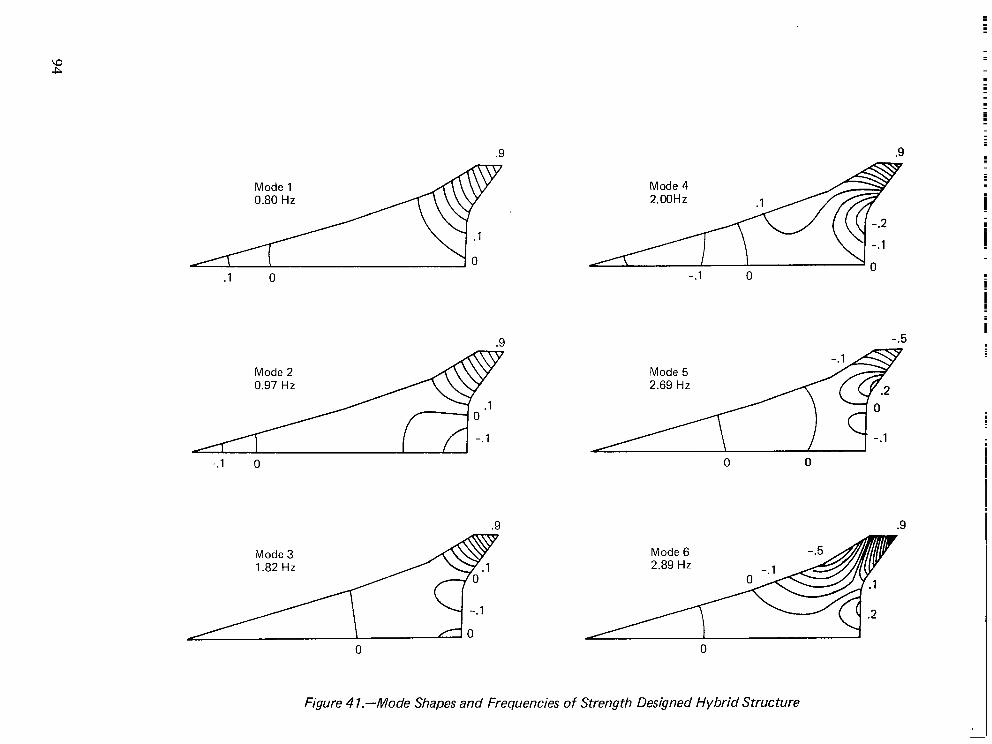
Mode 1 0.80 Hz
Mode 4
Mode 2 0.97 Hz
Mode 5 2.69 Hz
0 0
Mode 3 1.82 Hz
Mode 6 2.89 Hz
Figure 4 I.-Mode Shapes and Frequencies of Strength Designed Hybrid Structure
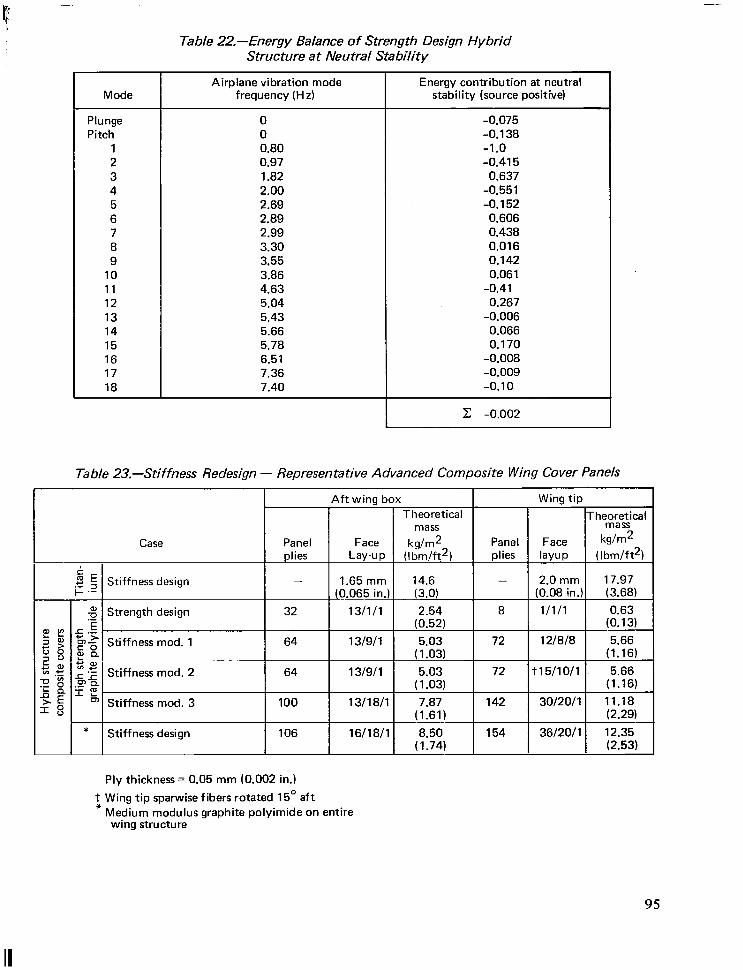
Table 22.-Energy Balance of Strength Design Hybrid Structure at Neutral Stability
Mode
Plunge Pitch
1 2 3 4 5 6 7 8 9
10 11 12 13 14 15 16 17 18
Airplane vibration mode frequency (Hz)
0 0 0.80 0.97 1.82 2.00 2.69 2.89 2.99 3.30 3.55 3.86 4.63 5.04 5.43 5.66 5.78 6.51 7.36 7.40
Energy contribution at neutral stability (source positive)
-0.075 -0.138 -1.0 -0.415
0.637 -0.551 -0.152
0.606 0.438 0.016 0.142 0.061
-0.41 0.267
-0.006 0.066 0.170
-0.008 -0.009 -0.10
c -0.002
Table 23.-Stiffness Redesign - Representative Advanced Composite Wing Cover Panels
Aft wing box Wing tip Theoretical
mass T heEaesfsical
Case Panel Face kg/m2 Panel Face kg/m2 plies Lay-up (I bm/ft2) plies W-v (lbm/ft2)
Is F 5 .z E Stiffness design - 1.65 mm 14.6 - 2.0 mm 17.97 (0.065 in.) (3.0) (0.08 in.) (3.68)
.s Strength design 32 13/l/l 2.54 8 l/l/l 0.63 E (0.52) (0.13)
E!r L .- $5 m gz Stiffness 30 s”,
mod. 1 64 13/9/l 5.03 72 121818 5.66
ea zs-
(1.03) (1.16)
EO ‘G Lr .9 a Stiffness mod. 2 64 13/9/l 5.03 72 t15/10/1 5.66
&naI (1.03) (1.16)
12i m Stiffness mod. 3 100 13/18/l 7.87 142 30/20/l 11.18 (1.61) (2.29)
* Stiffness design 106 16/18/l 8.50 154 36/20/l 12.35 (1.74) (2.53)
Ply thickness = 0.05 mm (0.002 in.)
t, Wing tip sparwise fibers rotated 15O aft Medium modulus graphite polyimide on entire
wing structure
95

In the first modification balanced, symmetric (orthotropic) composite panel lay-ups were maintained and ?4S’ plies were added in the heavily loaded aft wing box to provide greater effective shear stiffness. Five 90” plies were added near the engine beam diffusion ribs to obtain more efficient load diffusion into the cover panels. In addition, both bending and torsional stiffnesses were increased in the wing tip region to about half the corresponding stiffness levels of the titanium stiffness design by using a uniform [ 12/8/g] S lay-up. As shown in figure 42, the first modification increased the critical flutter speed to 79 m/set EAS (337 KEAS) and the flutter speed of the second mode to approximately 1 .~VD.
The second modification was an unsuccessful attempt to exploit an anisotropic lay-up in the wing tip region. The findings of Austin and others (ref. 21), were confirmed for an isolated composite cover panel, in that unbalancing the *45” plies lowers the effective shear modulus unduly, whereas limited reorientation of the spanwise plies of an otherwise balanced lay-up provides favorable anisotropic behavior in terms of both increased effective shear modulus and favorable bending-to-torsion coupling (when the panel is incorporated in a wing box). A [ 15/ 1 O/ 1 ] S lay-up with spanwise fibers reoriented 15” aft, with the same overall thickness as the preceding lay-up, provided a 22% increase in effective shear modulus together with a 15% decrease in the twist-bending coupling parameter. However, the critical flutter speed was increased by only 0.93 m/set EAS (4 KEAS). No further anisotropic effects were studied.
The third modification raised the wing stiffness levels to approximately the values for the titanium stiffness design. The typical [ 13/18/l ] S lay-up in the aft wing box contained a further increase of 100% in the *45” plies, and the typical [ 30/20/ 1 I lay-up in the wing tip region contained the same percentage increase in both 0” and *45’ plies. However, this increased the critical flutter speed to only 89 m/set EAS (382 KEAS). This is believed to be a consequence of the reduction in bending stiffness of the hybrid fuselage structure.
FINAL STIFFNESS DESIGN OF COMPOSITE WING COVER PANELS
From the analyses of results obtained by addition of high strength material to the strength design, it was apparent that a significant mass increment would be required to satisfy flutter criteria. Since the high strength fibers have higher strain capability than titanium, the resulting design would contain considerably more material than required for strength. There- fore, a study was initiated to evaluate possible applications of higher modulus, lower strength material.
Material suppliers have indicated that for the 1986 time period fibers with strength and moduli intermediate to values for high strength and high modulus fibers could be provided, as indicated by the dashed line in figure 43. For final stiffness design of the hybrid structure medium modulus graphite/polyimide cover panels were used, based on material properties identified by the intersection of the radial and dashed lines in figure 43. This selection was regarded as a favorable choice for the hybrid structure from consideration of strain compatibility between titanium and composite components. Material properties are presented in table 24. Because of the moderate reduction in tensile strength of the intermediate fibers, a 20% increase in spanwise plies was required to maintain adequate wing strength; numbers of +45” and 90” plies were unchanged from those defined for modification 3, as indicated in table 23.
96
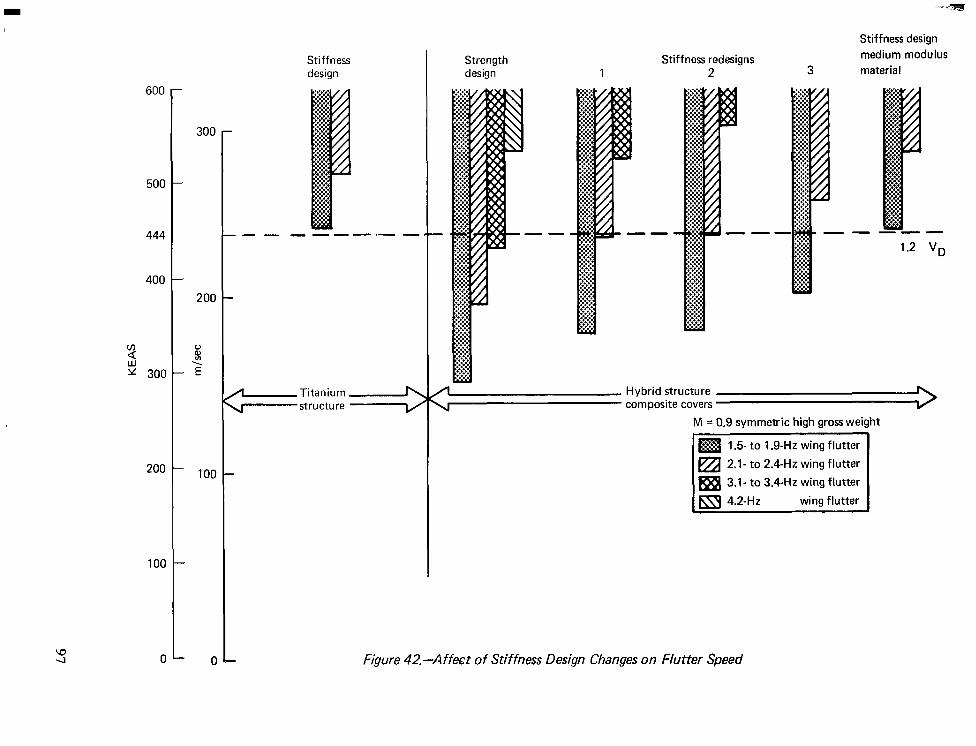
Stiffness design
Strength design
Stiffness redesigns 2
Stiffness design medium modulus
3 material
M = 0.9 symmetiic high gross weight
m 1.5- to 1.9-Hz wing flutter
500
444
400
3 y 300
200
100
0
-
300
-
-
200
ii -2
- 100
-
Figure 42.~Affect of Stiffness Design Changes on Flutter Speed
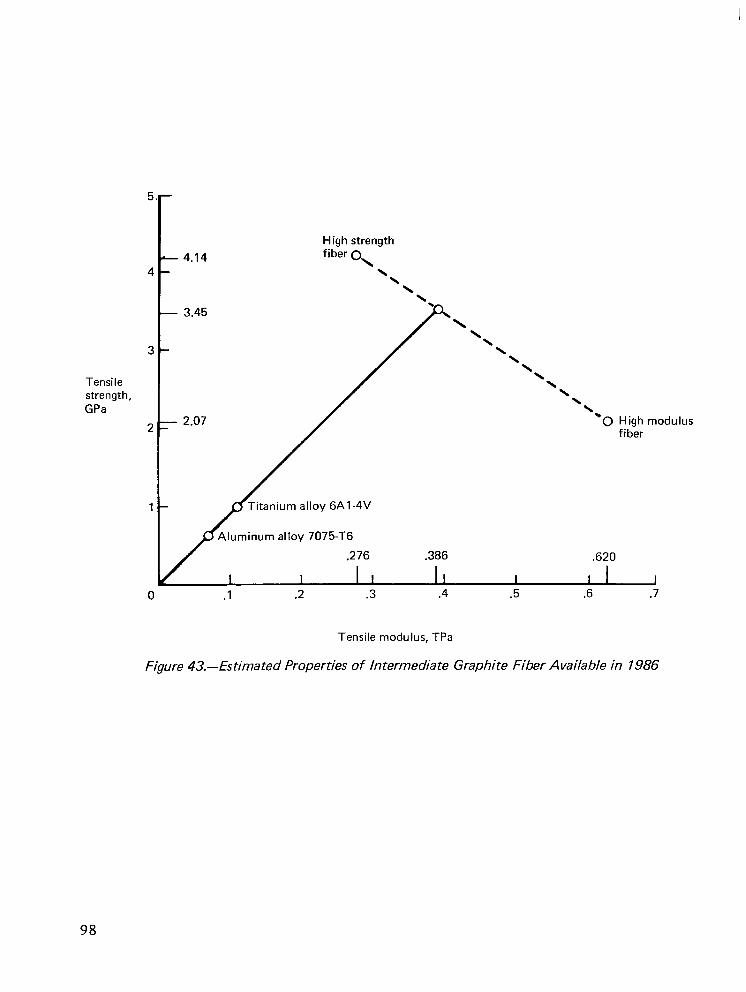
5
4
3
Tensile strength, GPa
2
1
L - 4.14 - 4.14
- 3.45 - 3.45
- 2.07 - 2.07
High strength High strength fiber 0 fiber 0
\ \
‘. ‘. \ \
\ \
\ \ \ \
\ \ \ \
\ \ \ \
\ \ \ \
\ \ \ \
\ \ -0 High modulus -0 High modulus
fiber fiber
.276 .276 .386 .386 .620 .620
I I I I I -I .6 .7
Tensile modulus, TPa
Figure 43.-Estimated Properties of Intermediate Graphite Fiber Available in 7986
98
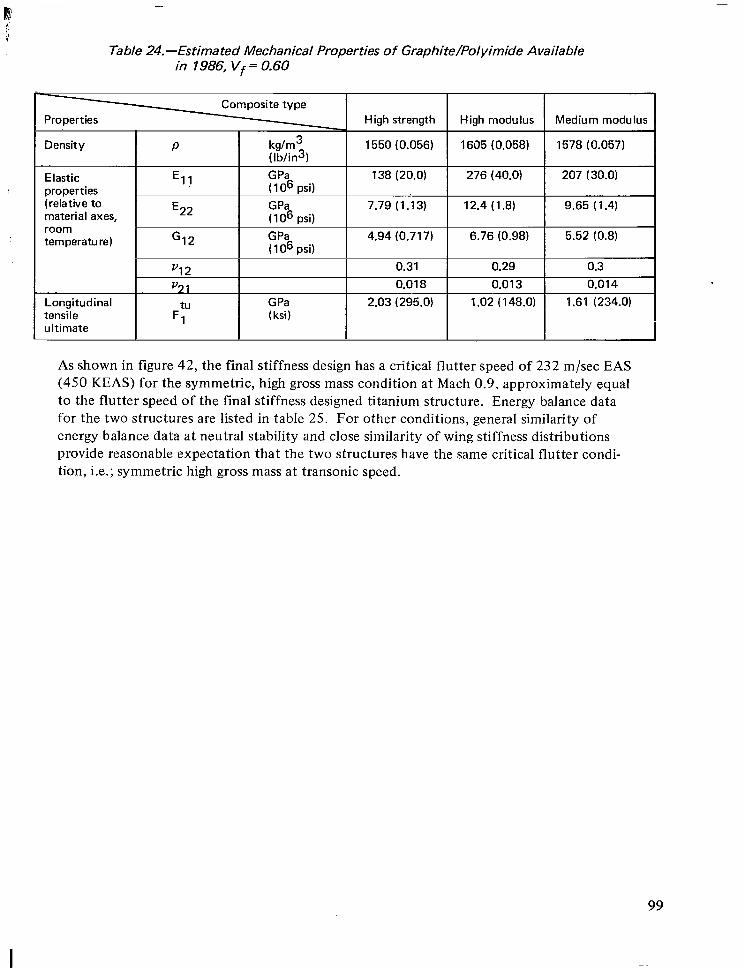
Properties
Table 24.-Estimated Mechanical Properties of Graphite/Polyimide Available in 1986, Vf = 0.60
Density P
Elastic properties (relative to material axes, room temperature)
Longitudinal tensile ultimate
I kg/m3 ( lb/in31
1550 (0.056) 1665 (0.058) I
1578 (0.057) I
Composite type \ High strength High modulus Medium modulus
El1 GPa 138 (1 O6
(20.0) 276 (40.0) 207 (30.0) psi)
E22 GPa 7.79 ( lo6
(1.13) 12.4 (1.8) 9.65 (1.4) psi)
G12 GPa 4.94 ( 1 O6
(0.717) 6.76 (0.98) 5.52 (0.8) psi)
L I
I
“12
1.‘21
tu
PI
GPa (ksi)
0.31 0.29 0.3
0.014
2.03 (295.0) 1.02 (148.0)
0.018 t 0.013
1.61 (234.0)
I
As shown in figure 42, the final stiffness design has a critical flutter speed of 232 m/set EAS (450 KEAS) for the symmetric, high gross mass condition at Mach 0.9, approximately equal to the flutter speed of the final stiffness designed titanium structure. Energy balance data for the two structures are listed in table 25. For other conditions, general similarity of energy balance data at neutral stability and close similarity of wing stiffness distributions provide reasonable expectation that the two structures have the same critical flutter condi- tion, i.e.; symmetric high gross mass at transonic speed.
99

Table 25.-Comparison of Flutter Energy Balance for Stiffness Designs
Mode T frc Jency (Hz)
Hybrid structure
T Energy contribution at neutral stability (source positive)
Titanium Titanium Hybrid structure
Plunge 0 0 -0.097 -0.069 Pitch 0 0 -0.111 -0.046
1 0.97 0.87 -0.744 -0.104 2 1.18 1.14 -1.0 -1.0 3 2.18 1.92 0.524 0.511 4 2.43 2.49 0.467 0.027 5 2.79 2.93 0.035 0.012 6 3.00 3.39 0.040 0.137 7 3.37 3.53 0.377 0.225 8 3.63 3.56 0.003 0.137 9 3.81 4.23 0.110 0.067
10 4.00 4.36 -0.051 -0.001 11 4.41 5.09 0.200 0.050 12 4.68 5.78 -0.002 -0.006 13 6.22 5.97 0.112 0.037 14 6.35 6.06 0.036 -0.008 15 6.75 6.91 0.005 0,000 16 7.21 7.50 0.105 0.031 17 8.03 7.84 0.015 -0.000 18 8.62 8.15 -0.024 0.00
Airplane vibration mode
c 0.000
1
c 0.000
100
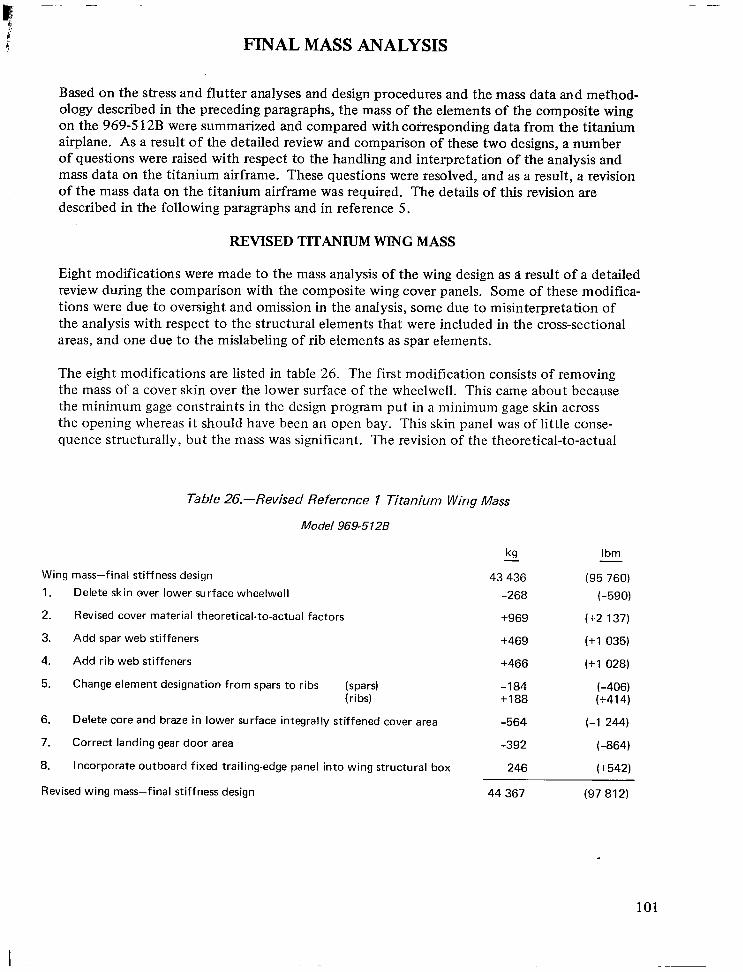
FINAL MASS ANALYSIS
Based on the stress and flutter analyses and design procedures and the mass data and method- ology described in the preceding paragraphs, the mass of the elements of the composite wing on the 969-5 12B were summarized and compared with coriesponding data from the titanium airplane. As a result of the detailed review and comparison of these two designs, a number of questions were raised with respect to the handling and interpretation of the analysis and mass data on the titanium airframe. These questions were resolved, and as a result, a revision of the mass data on the titanium airframe was required. The details of this revision are described in the following paragraphs and in reference 5.
REVISED TITANIUM WING MASS
Eight modifications were made to the mass analysis of the wing design as B result of a detailed review during the comparison with the composite wing cover panels. Some of these modifica- tions were due to oversight and omission in the analysis, some due to misinterpretation of the analysis with respect to the structural elements that were included in the cross-sectional areas, and one due to the mislabeling of rib elements as spar elements.
The eight modifications are listed in table 26. The first modification consists of removing the mass of a cover skin over the lower surface of the wheelwell. This came about because the minimum gage constraints in the design program put in a minimum gage skin across the opening whereas it should have been an open bay. This skin panel was of little conse- quence structurally, but the mass was significant. The revision of the theoretical-to-actual
Table 26.-Revised Reference 1 Titanium Wing Mass
Model 969-5128
Wing mass-final stiffness design
1.
2.
3.
4.
5.
6.
7.
8.
Delete skin over lower surface wheelwell
Revised cover material theoretical-to-actual factors
Add spar web stiffeners
Add rib web stiffeners
Change element designation from spars to ribs (spars) (ribs)
Delete core and braze in lower surface integrally stiffened cover area
Correct landing gear door area
Incorporate outboard fixed trailing-edge panel into wing structural box
Revised wing mass-final stiffness design
kg -
43 436
-268
+969
+469
+466
-184 +I88
-564
-392
246
44 367
Ibm
(95 760)
(-590)
(+2 137)
(+1 035)
(+l 028)
(-406) (+414)
(-1 244)
(-864)
(+542)
(97 812)
101
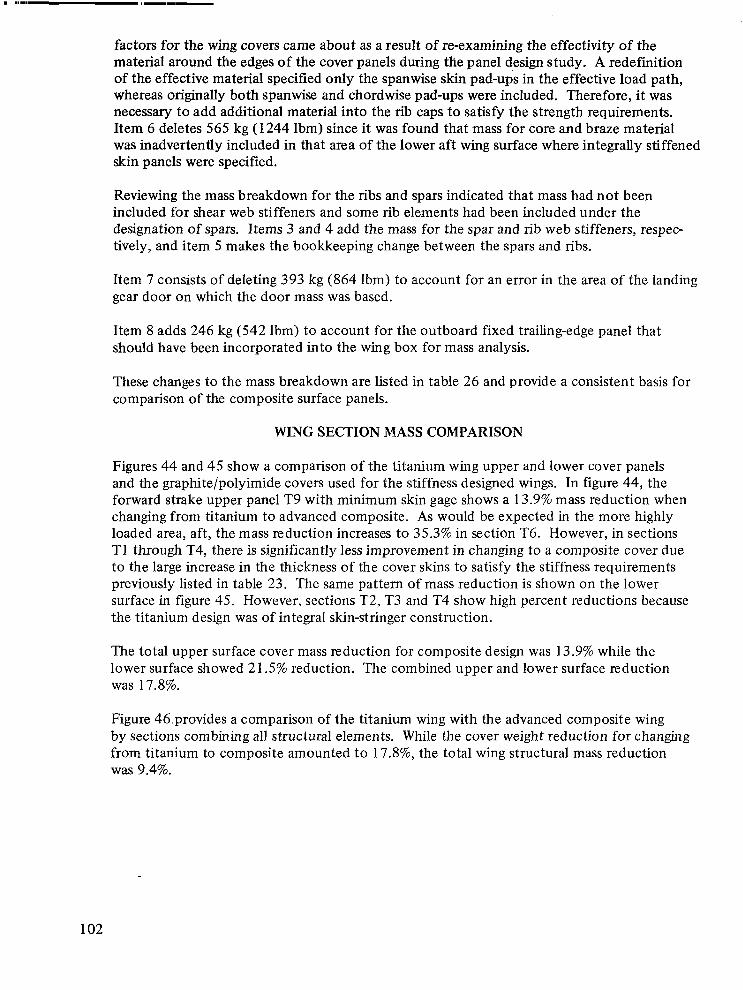
factors for the wing covers came about as a result of re-examining the effectivity of the material around the edges of the cover panels during the panel design study. A redefinition of the effective material specified only the spanwise skin pad-ups in the effective load path, whereas originally both spanwise and chordwise pad-ups were included. Therefore, it was necessary to add additional material into the rib caps to satisfy the strength requirements. Item 6 deletes 565 kg (1244 Ibm) since it was found that mass for core and braze material was inadvertently included in that area of the lower aft wing surface where integrally stiffened skin panels were specified.
Reviewing the mass breakdown for the ribs and spars indicated that mass had not been included for shear web stiffeners and some rib elements had been included under the designation of spars. Items 3 and 4 add the mass for the spar and rib web stiffeners, respec- tively, and item 5 makes the bookkeeping change between the spars and ribs.
Item 7 consists of deleting 393 kg (864 lbm) to account for an error in the area of the landing gear door on which the door mass was based.
Item 8 adds 246 kg (542 lbm) to account for the outboard fixed trailing-edge panel that should have been incorporated into the wing box for mass analysis.
These changes to the mass breakdown are listed in table 26 and provide a consistent basis for comparison of the composite surface panels.
WING SECTION MASS COMPARISON
Figures 44 and 45 show a comparison of the titanium wing upper and lower cover panels and the graphite/polyimide covers used for the stiffness designed wings. In figure 44, the forward strake upper panel T9 with minimum skin gage shows a 13.9% mass reduction when changing from titanium to advanced composite. As would be expected in the more highly loaded area, aft, the mass reduction increases to 35.3% in section T6. However, in sections Tl through T4, there is significantly less improvement in changing to a composite cover due to the large increase in the thickness of the cover skins to satisfy the stiffness requirements previously listed in table 23. The same pattern of mass reduction is shown on the lower surface in figure 45. However, sections T2, T3 and T4 show high percent reductions because the titanium design was of integral skin-stringer construction.
The total upper surface cover mass reduction for composite design was 13.9% while the lower surface showed 2 1.5% reduction. The combined upper and lower surface reduction was 17.8%.
Figure 46.provides a comparison of the titanium wing with the advanced composite wing by sections combining all structural elements. While the cover weight reduction for changing from titanium to composite amounted to 17.8%, the total wing structural mass reduction was 9.4%.
102
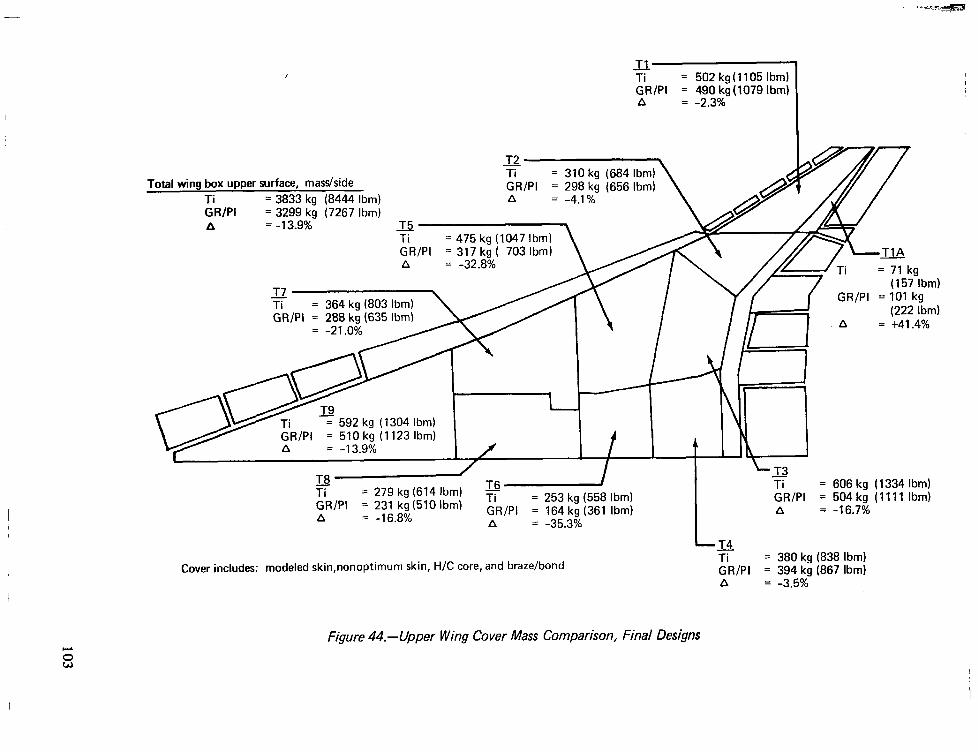
11 Ti = 502 kg(l105 Ibm) GR/PI = 490 kg (1079 Ibm) A
-7
= -2.3%
IL Ti = 310 kg (684 Ibm) GR/PI = 298 kg (656 Ibm) A = -4.1%
Total wing box upper surface, mass/side Ti = 3833 kg (8444 Ibm) GR/PI = 3299 kg (7267 Ibm) A = -13.9%
GR/PI = 101 kg
= 592 kg (1304 Ibm) GR/PI = 510 kg (1123 Ibm)
T8d B------J 77 = 279 kg (614 lbm) GR/PI = 231 kg (510 Ibm)
Ti = 253 kg (558 Ibm)
A = -16.8% GR/PI = 164 kg (361 Ibm) A = -35.3%
Ti = 606 kg (1334 Ibm) GR/PI = 504 kg (1111 Ibm) A = -16.7%
Cover includes: modeled skin,nonoptimum skin, H/C core, and braze/bond Ti = 380 kg (838 Ibm) tR/Pl = 394 kg (867 Ibm)
= -3.5%
Figure 44.~Upper Wing Cover Mass Comparison, Final Designs
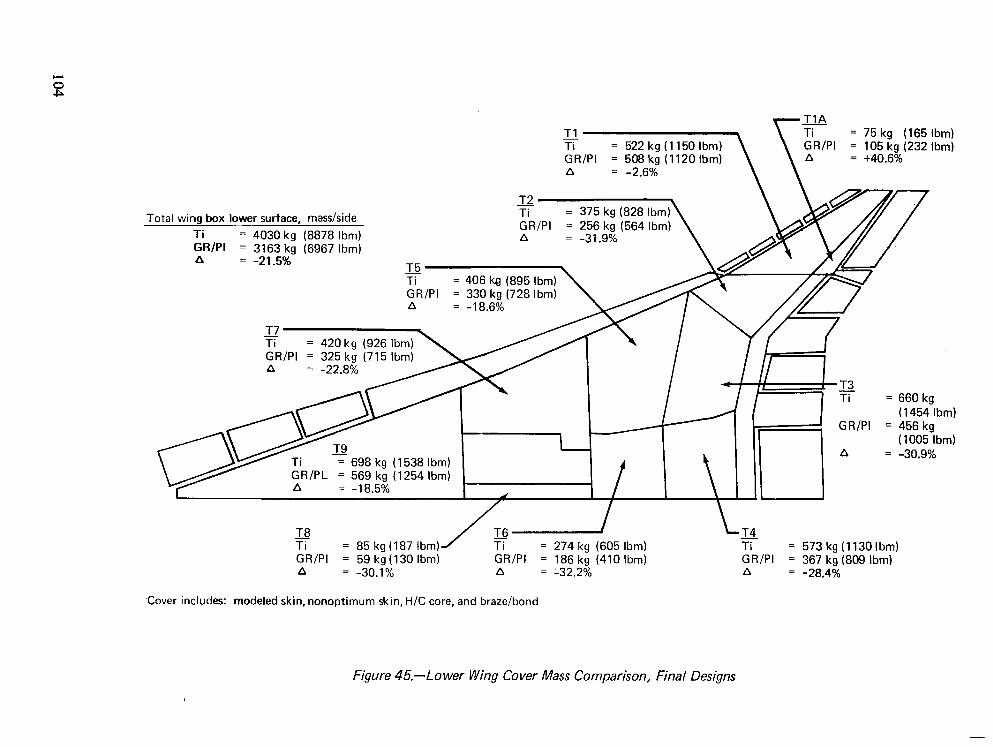
Total wing box lower surface, mass/side Ti = 4030 kg (8878 lbm) GRIP1 = 3163 ka (6967 lbm) A = -21.5%” 7-E
T7 -’ Ti = 420 kg (926 Ibm) /A x GR/PI = 325 kg (715 Ibm) ‘/ A = -22.8%
d \ u
= 660 kg (1454 Ibm)
= 456 kg (1005 Ibm)
= -30.9%
I8 Ti = 85 kg (187 Ibm) /?405lbm) ‘? = 573kg(1130Ibm) GRIPI = 59 kg(130 Ibm) GR/PI = 186 kg (410 Ibm) GRIPI = 367 kg (809 Ibm) A = -30.1% A = ‘32.2% A = -28.4%
‘Cover includes: modeled skin, nonoptimum skin, H/C core, and braze/bond
Figure 45.-Lower Wing Cover Mass Comparison, Final Designs
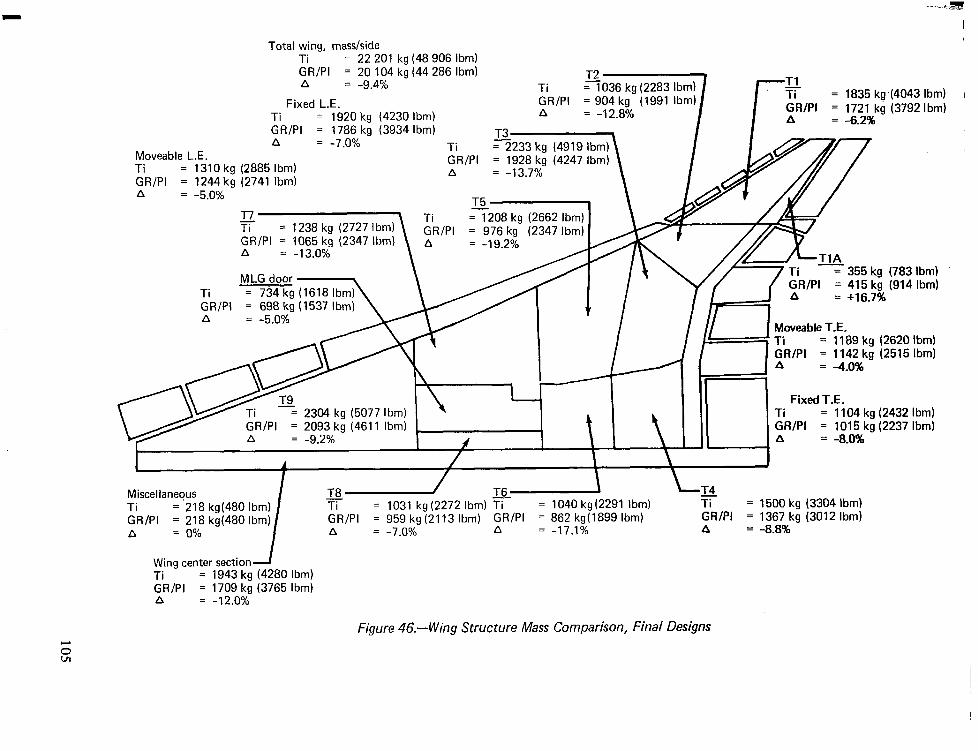
Total wing, mass/side Ti = 22 201 ka (48 906 Ibm) GR/PI = 20 104 kg (44 286 Ibm) A = -9.4%
Fixed L.E. Ti = 1920 kg (4230 Ibm) GR/PI = 1786 kg (3934 Ibm) A = -7.0%
Moveable L.E.
Ti ~233 ~;;,iifgEiy
\
Ti = 1310 kg (2885 Ibm) GR/PI = 1921 A =
GWPI = 1244kg (2741 Ibm) -13.8 /U
\ / A = -5.0%
T7 -r-
$ = 1238 kg (2727 Ibm) = IL”0 Icy \LO”L I”,,,
GR/PI = 1065 kg (2347 Ibm)
\
&I = 976 kg 17'247 Ihm
A = -19.2% A = -13.0%
MLG door ‘-\ \ //I I
I.2 -
Moveable T.E.
Fixed T.E. Ti = 1104 kg (2432 Ibm)
II = 734=kg (1618 Ibm)\ \ GR/PI = 698 kg (1537 Ibm) A = -5.0%
zR/PI 1 D$,,kg (4611 Ibm) .oo \ I \ I II
GWPI = 1015 kg (2237 Ibm) A = -8.0%
\ \
Miscellanequs T8 Ti = 218 kg(480 Ibm) Ti = 1031 c GR/PI = 218 kg(480 Ibm)
I
GR/PI = 959 ki A = 0% A = -7.0%
I
J =- \T4 (g (2272 Ibm) Ti = 1040 kg (2291 lbm) Ti = 1500 kg (3304 Ibm) 1(2113 Ibm) GR/PI = 862 kg(1899 Ibm) GR/PI = 1367 kg (3012 Ibm)
A = -17.1% A = -8.8%
Wing center section--l Ti = 1943 kg (4280 Ibm) GR/PI = 1709 kg (3765 Ibm) A = -12.0%
Figure 46.-Wing Structure Mass Comparison, Final Designs
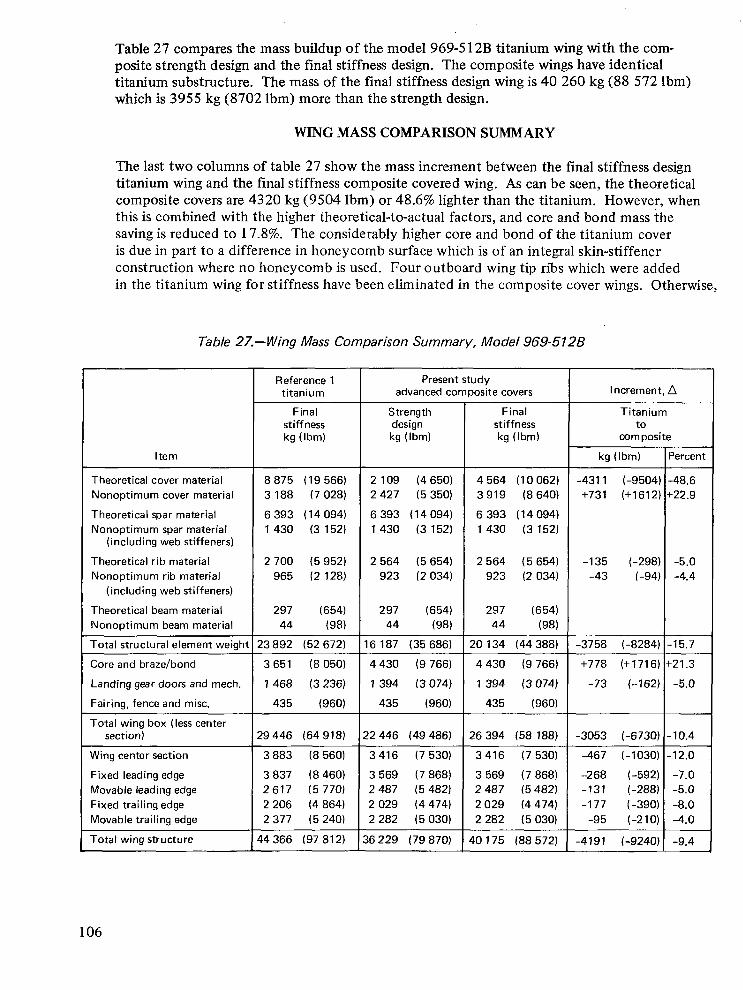
Table 27 compares the mass buildup of the model 969-5 12B titanium wing with the com- posite strength design and the final stiffness design. The composite wings have identical titanium substructure. The mass of the final stiffness design wing is 40 260 kg (88 572 lbm) which is 3955 kg (8702 Ibm) more than the strength design.
WING MASS COMPARISON SUMMARY
The last two columns of table 27 show the mass increment between the final stiffness design titanium wing and the final stiffness composite covered wing. As can be seen, the theoretical composite covers are 4320 kg (9504 lbm) or 48.6% lighter than the titanium. However, when this is combined with the higher theoretical-to-actual factors, and core and bond mass the saving is reduced to 17.8%. The considerably higher core and bond of the titanium cover is due in part to a difference in honeycomb surface which is of an integral skin-stiffener construction where no honeycomb is used. Four outboard wing tip ribs which were added in the titanium wing for stiffness have been eliminated in the composite cover wings. Otherwise,
Table 27.-Wing Mass Comparison Summary, Model 969-5126
Item
Theoretical cover material Nonoptimum cover material
Theoretical spar material Nonoptimum spar material
(including web stiffeners)
Theoretical rib material Nonoptimum rib material
(including web stiffeners)
Theoretical beam material Nonoptimum beam material
Total structural element weighi
Core and braze/bond
Landing gear doors and mech.
Fairing, fence and misc.
Total wing box (less center section)
Wing center section
Fixed leading edge Movable leading edge Fixed trailing edge Movable trailing edge
Total wing structure
Reference 1 titanium
Final stiffness kg (h-n)
8 875 (19 566) 3 188 (7 028)
6 393 (14 094) 1 430 (3 152)
2 700 (5 952) 965 (2 128)
297 (654) 44 (98)
!3 892 (52 672)
3651 (8 050)
1 468 (3 236)
435 (960)
!9 446 (64 918)
3 883 (8 560)
3 837 (8 460) 2 617 (5 770) 2 206 (4 864) 2 377 (5 2401
14 366 (97 812)
T Present study advanced composite covers
Strength design kg (Ibm)
2 109 (4 650) 2 427 (5 350)
6 393 (14 094) 1 430 (3 152)
2 564 (5 654) 923 (2 034)
297 (654) 44 (98)
6 187 (35 686)
4 430 (9 766)
1 394 (3 074)
435 (960)
12 446 (49 486)
3 416 (7 530)
3 569 (7 868) 2 487 (5 482) 2 029 (4 474) 2 282 (5 030)
16 229 (79 870)
Final stiffness kg (Ibml
4 564 (I 0 062) 3 919 (8 640)
6 393 (14 094) 1 430 (3 152)
2 564 (5 654) 923 (2 034)
297 (654) 44 (98)
20 134 (44 388)
4 430 (9 766)
1 394 (3 074)
435 (960)
26 394 (58 188)
3 416 (7 530)
3 569 (7 868) 2 487 (5 482) 2 029 (4 474) 2 282 (5 030)
40 175 (88 572)
t
Increment, A
Titanium to
corn posite
Percent
-48.6 k22.9
kg (Ibm)
-4311 (-9504) +731 (+1612)
-135 (-298) -5.0 -43 i-94) -4.4
-3758 (-8284)
+778 (+ 1716)
-73 (-- 162)
-15.7
-21.3
-5.0
-3053 (-6730)
-467 (-1030)
-268 (-592) -131 (-288) -177 (-390)
-95 (-210)
-10.4
-12.0
-7.0 -5.0 -8.0 -4.0
-4191 (-9240) -9.4
106
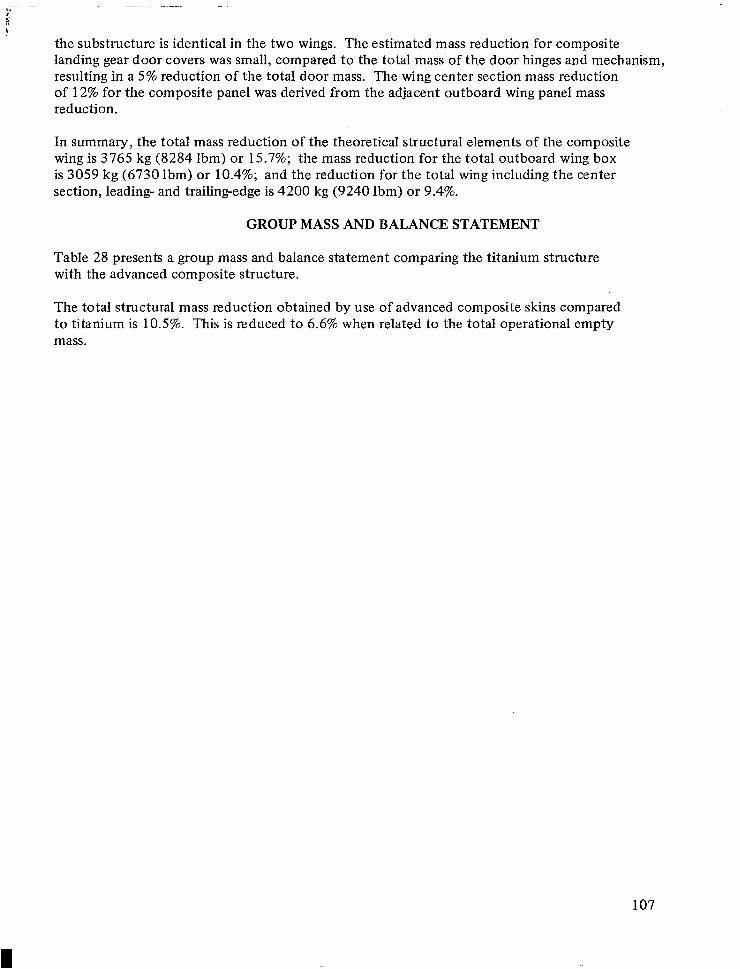
the substructure is identical in the two wings. The estimated mass reduction for composite landing gear door covers was small, compared to the total mass of the door hinges and mechanism, resulting in a 5% reduction of the total door mass. The wing center section mass reduction of 12% for the composite panel was derived from the adjacent outboard wing panel mass reduction.
In summary, the total mass reduction of the theoretical structural elements of the composite wing is 3765 kg (8284 Ibm) or 15.7%; the mass reduction for the total outboard wing box is 3059 kg (6730 Ibm) or 10.4%; and the reduction for the total wing including the center section, leading- and trailing-edge is 4200 kg (9240 lbm) or 9.4%.
GROUP MASS AND BALANCE STATEMENT
Table 28 presents a group mass and balance statement comparing the titanium structure with the advanced composite structure.
The total structural mass reduction obtained by use of advanced composite skins compared to titanium is 10.5%. This is reduced to 6.6% when related to the total operational empty mass.
107
Table 28.-Group Mass and Balance Statement, Model 969-512B
Revised reference 1 increment, A Present study
Mass, Mass, Arm, Arm, Mass, Mass, Mass, Mass, Arm, Arm, Group kg Ibm m in. kg Ibm Percent kg Ibm m in,
Wing 44 402 97 812 66.14 2604.0 -4191 -9240 -9.4 40 175 88 572 66.14 2604.0 Horizontal tail 2 964 6 530 92.02 3623.0 -415 -914 -14.0 2 547 5616 92.02 3623.0 Vertical tail (body and wing mounted) 2 656 5 850 86.51 3406.0 -265 -585 -10.0 2 388 5 265 86.51 3406.0 Body 25 485 56 140 53.77 2117.0 -3820 -8421 -15.0 21 645 47 719 53.77 2117.0 Main gear 16941 37 320 64.72 2548.0 -1439 -3173 -8.5 15489 34 148 64.72 2548.0 Nose gear 1 707 3 760 29.92 1178.0 -145 -330 -8.5 1 560 3 440 29.92 1178.0 Nacelle 8 661 19 080 69.82 2949.0 -476 -1049 -5.5 8 179 18 031 74.90 2949.0
Total structure 102 735 226 492 64.249 2529.5 -10751 -23 701 -10.5 91984 202 791 64.402 2535.5
Engine (incl. T R, S S and nozzle) 20 502 45 200 78.13 3076.0 20 502 45 200 78.13 3076.0 Engine accessories 612 1 350 74.78 2944.0 612 1 350 74.78 2944.0 Engine control 354 780 58.62 2308.0 354 780 58.62 2308.0 Starting system 136 300 74.14 2919.0 136 300 74.14 2919.0 Fuel system 432 9 110 63.37 2495.0 4 132 9 110 63.37 2495.0
Total propulsion 25 737 56 740 75.392 2968.2 25 737 56 740 75.392 2968.2
Instruments 846 1 865 43.43 1710.0 846 1 865 43.43 1710.0 Flight controls 6 667 14 700 68.05 2679.0 6 667 14 700 68.05 2679.0 Hydraulics 2 629 5 795 72.49 2854.0 2 629 5 795 72.49 2854.0 Electrical 2 341 5 100 53.14 2092.0 2 341 5 160 53.14 2092.0 Electronics 1 309 2 895 32.56 1202.0 1 309 2 885 32.56 1282.0 Furnishings 8 622 19 010 46.15 1817.0 8 622 19 010 46.15 1817.0 ECS 3 824 8 430 61.98 2440.0 3 824 8 430 61.98 2440.0 Anti-icing 61 135 14.17 558.0 61 135 14.17 558.0 APU 113 280 75.64 2978.0 113 250 75.64 2978.0 Insulation 1315 2 900 48.59 1973.0 1 315 2 900 48.59 1913.0
Total systems and equipment 27 728 61 130 56.126 2209.7 27 728 61 130 56.126 2209.7
Options 1 134 2 500 63.27 2491 .o 1 134 2 500 63.27 2491.0
Manufacturer’s empty mass 157 333 346 862 64.633 2544.6 -10 751 -23 701 -6.8 146 582 323 161 64.757 2549.5
Standard items 3 719 8 200 55.70 2193.0 3 719 8 200 55.70 2193.0 Operational items 2 386 5 260 43.59 1716.0 2 386 5 260 43.59 1716.0
Operational empty mass 163 438 360 322 64.122 2524.5 -10 751 -23 701 -6.6 152 688 336 621 64.206 2527.8
Payload 22 183 48 906 47.80 1882.0 22 183 48 906 47.80 1882.0
Zero fuel mass 185 622 409 228 62.172 2447.7 -10 751 -23 701 -5.8 174 871 385 527 62.126 2445.9
CONCLUDING REMARKS AND RECOMMENDATIONS
An in-depth structural design study of an arrow wing supersonic aircraft, designed to cruise at Mach 2.7, has been completed utilizing advanced composite materials with material properties that are believed to be achievable in the 1986 time period. An advanced com- puterized system, ATLAS, has been used in this study, in conjunction with a relatively complex finite element model. Analysis and design of the composite wing shell has provided a successful demonstration of automated sizing capability for application of an advanced composite material to a complex structure, yielding a 17.8% reduction in the mass of the wing skin (less center section), relative to an all-titanium wing. Titanium ribs and spars were retained, without resizing, from a prior study of a metallic structure. Consequently, reduc- tion of total wing mass was only 10.4%. Undoubtedly a substantially greater mass reduction could be achieved with an all-composite wing structure, or by optimizing the hybrid struc- ture without constraints on sizing of titanium spars and ribs.
Experience gained in conducting this study has added further emphasis to the need for design and development of innovative methods for efficient load transfer between members of composite structures. The use of mechanical fasteners requires that the joint design be given special attention with respect to the types of fiber orientation used around the fasteners, and the use of metal interleaves to develop bearing allowables sufficiently high to transfer the load. There is also the possibility of using a bonded joint; however, the fracture charac- teristics of the structure with bonded joints is not understood. It is recommended that design and test studies be undertaken to develop the understanding of joint design and the effects of fracture on fail safety. Mass associated with edge reinforcement for load transfer through bolted joints was a significant contributing factor in limiting the mass reduction that could be achieved with the composite wing shell. Added mass for joint reinforcement, edge pad- ups, adhesive, sandwich core, etc., accounted for 46% of the composite wing shell; the corresponding figure for the titanium shell was 26%.
A survey of research programs on high temperature stable advanced composites indicated major areas where technical information is lacking to predict performance of these materials in a Mach 2.7 cruise environment. Time-temperature-stress relationships simulating future supersonic cruise requirements for more than 5000 hours are nonexistent for com- posite materials. Many of the polyimide systems are not thermally stable, or are difficult to process for the manufacture of high quality, uniform reproducible composites. Much of the data generated in past programs emphasized interlaminar shear and/or flexure properties for material evaluation. These data cannot be translated directly into other design properties. The test programs intended to generate design data have used a combination of test coupons and sandwich beam methods which must be factored for correlation between test methods and test programs. Development of standardized test specimens and test procedures for composite laminates is an urgent requirement.
One of the basic problems associated with advanced composites utilizing organic matrices is localized cracking of the matrix produced by externally applied tensile loads. Matrix cracking results primarily from a combination of resin brittleness, fiber-to-fiber contact or proximity, and tensile stress components acting perpendicular to the fibers. This
109
problem was recognized several years ago in fiberglass/epoxy systems. Attempts to eliminate micro cracking have been successful through blending of low percentages (< 10%) of elastomeric polymers into the matrix. The addition of elastomers is thought to greatly increase the fracture surface work in the matrix preventing the initiation of micro cracks. This same kind of modification appears feasible and practical for polyimide matrix composites by 1986. Research should be implemented to achieve this objective without unduly com- promising the allowable compressive stress of the composite material.
Efficient solution of aeroelastic problems in the design of structures using advanced composite materials will require a range of fiber properties intermediate between the extreme values represented by the T600, high strength, and the T90, high modulus, graphite. Research workers at Union Carbide have indicated that this can be achieved through experimentation to determine the proper processing parameters. It is recommended that the necessary research be conducted to determine the range of fiber characteristics that can be achieved through process control.
The following conclusions are considered generally applicable to the structural design of large supersonic cruise aircraft; they should be given added emphasis if advanced composite materials are being considered, because of the increased number of design variables:
1.
2.
3.
4.
An integrated design system should be used in the preliminary design phase.
Static aeroelastic effects and flutter should be considered as early as possible in the design process.
Automated modeling methods and sophisticated graphics capability are desirable to decrease manpower and flow time for generation and validation of the structural model.
Automated resizing for strength is an important factor in reducing design cycle time. Capability for automated resizing to satisfy buckling criteria should be provided.
110
1.
2.
3.
4.
5.
6.
7.
8.
9.
10.
11.
12.
13.
REFERENCES
Turner, M.J.; and Grande, D. L.: Study of Metallic Structural Design Concepts for an Arrow Wing Supersonic Cruise Configuration, NASA CR-2743, 1977.
Boeing Staff: Study of Structural Design Concepts for an Arrow Wing Supersonic Transport Configuration, NASA CR-132576-1 and -2, 1976.
Thomas, R. M.; Backman, B. F.; Flood, F.. D.; Gray, R. P.; Hansteen, H. B.; Pratt- Barlow, C. R.; and Wahlstrom, S. 0.: Aircraft Strength and Stiffness Design Automation. US-Japan Design Automation Symposium, Tokyo, Japan, August 1975.
Dusto, A. R.; Brune, G. W.; Dornfeld, G. M.; Mercer, J. E.; Pilet, S. C.; Rubbert, P. E.; Schwanz, R. C.; Smutny, P.; Tinoco, E. N.; and Weber, J. A.: A Method for Predicting the Stability Charactetistics of an Elastic Airplane. Vol. I-FLEXSTAB Theoretical Description, NASA CR-l 14712, 1976.
Boeing Staff: Study of Advanced Composite Structural Design Concepts for an Arrow Wing Supersonic Transport Configuration, NASA CR-145 192, 1977.
Anon: Advanced Composites Design Guide. Los Angeles Aircraft Division of the North American Rockwell Corporation, USAF Contractor Report, third ed., 1973.
Scheck, W. G.: Development of Design Data for Graphite Reinforced Epoxy and Polyimide Composites, NASA CR-l 204 13, 1974.
Haskins, J. F.; Kerr, J. R.; and Stein, B. A.: Time-Temperature-Stress Capabilities of Composite Materials for Advanced Supersonic Technology Applications, Proceedings of the SCAR Conference, NASA CP-001, 1976.
Birchfield, E. B.; and Kollmansberger, R.: Develop Fabrication/Processing Techniques for High Temperature Advanced Composites for Use in Aircraft Structures, AFML- TR-71-91, 1972.
Nadler, M. A.; and Darms, F. J.: Development and Fabrication of a Graphite Polyimide Box Beam, NASA CR-l 23959, 1972.
Cavano, P. J.: Resin/Graphite Fiber Composites, NASA CR-1 21275, 1974.
Hanson, M. P.; and Serafini, T. T.: Effects of Thermal and Environmental Exposure on the Mechanical Properties of GraphitelPolyimide Composites, NASA TN D-6604, 1971.
Stein, B. A.; and Pride, R. A.: Effect of 450’ Fand 600” F Exposures on the Mechanical Properties of PolyimidelGlass-Fiber Honeycomb Sandwiches and Laminated Beams. Journal of Aircraft, vol.V., no. 1, January-February 1968.
111
14. Hofer, K. E., Jr.; Rao, N.; and Larsen, D.: Development of Engineering Data on the Mechanical and Physical Properties of Advanced Composite Materials, AFML-TR-72- 205, 1974.
15. De Bolt, H; Prescott, R.; McKee, J.; and Sharpe, G.: Carbon Monofilament Produc- tion, AFML-TR-76-23 1, 1976.
16. McGarry, F. J.: Crack Propagation in Fiber Reinforced Plastic Composites. Funda- mental Aspects of Fiber Reinforced Plastic Composites, R. T. Schwartz and H. S. Schwartz, eds., Inter Science Publishers, 1968.
17. Jones, R. M.: Mechanics of Composite Materials, McGraw-Hill Book Co., Inc. 1975.
18. Wilde, D.; and Beightler, C.: Foundation of Optimization, Prentice-Hall, Inc., 1967.
19. Swan, R. T.; and Pittman, C. M.: Analysis of Effective Conductivities of Honeycomb- Core and Corrugated-Core Sandwich Panels, NASA TN D-7 14, 196 1.
20. Perry, D. J.: Aircraft Structures, McGraw-Hill Book Co., Inc., 1950.
21. Austin, F.; Hadcock, R.; Hutchings, D.; Sharp D.; Tang S.; and Waters, C.: Aeroelastic Tailoring of Advanced Composite Lifting Surfaces in Preliminary Design. AIAAl ASME/SAE 17th Structures, Structural Dynamics and Materials Conference, King of Prussia, Pennsylvania, 1976.
112
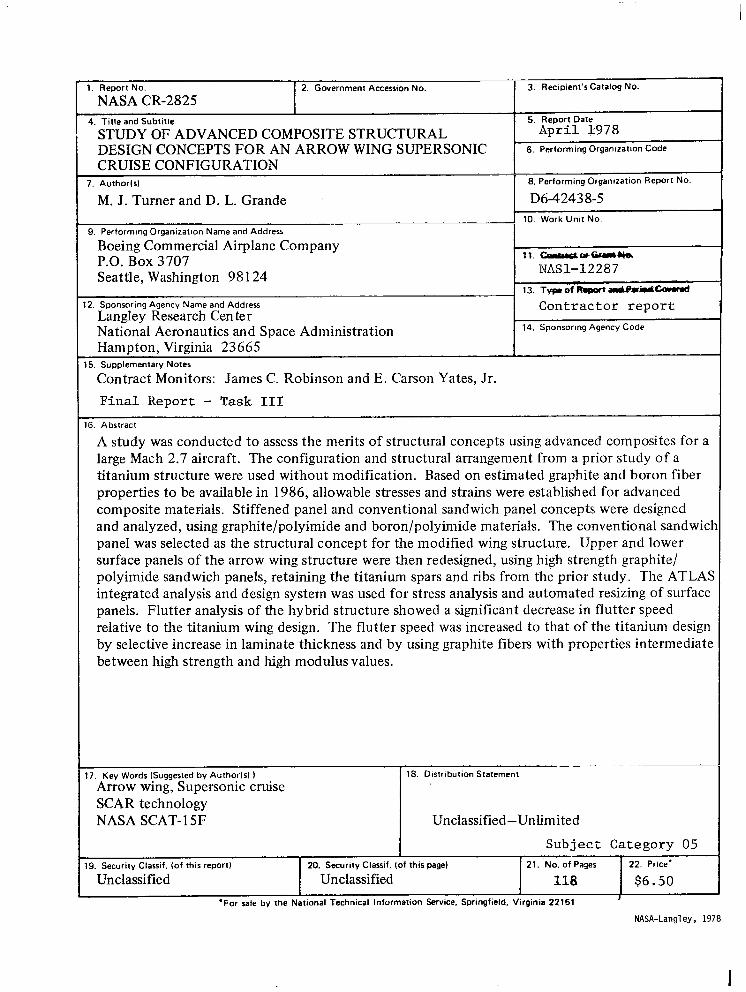
1. Reporr No.
NASA CR-2825 2. Government Accession No. 3. Recipient’s Catalog NO.
I 4. Title and Subtitle
STUDY OF ADVANCED COMPOSITE STRUCTURAL DESIGN CONCEPTS FOR AN ARROW W ING SUPERSONIC
5. Report Date April 1978
6. Performing Orgamzatmn Code
CRUISE CONFIGURATION 7. Author(s)
I ~ 1 8. Performing Orgamzatlon Report NO.
M . J. Turner and D. L. Grande I D6-42438-5 10. Work Umt No.
9. Performmg Organization Name and Address I
Boeing Commercial Airplane Company P.O. Box 3707 Seattle, Washington 98 124
11. NlwGu,L)a
i \JASl-12287 13. TypeofRa@vortu+FrW~
2. Sponsoring Agency Name and Address
Langley Research Center National Aeronautics and Space Administration Hampton, Virginia 23665
5. Supplementary Notes
Contractor report 14. Sponsormg Agency Code
Contract Mon itors: James C. Robinson and E. Carson Yates, Jr. F inal Report - Task III
G. Abstract
A study was conducted to assess the merits of structural concepts using advanced composites for a large Mach 2.7 aircraft. The configuration and structural arrangement from a prior study of a titanium structure were used without mod ification. Based on estimated graphite and boron fiber properties to be available in 1986, allowable stresses and strains were established for advanced composite materials. Stiffened panel and conventional sandwich panel concepts were designed and analyzed, using graphite/polyimide and boron/polyimide materials. The conventional sandwicl panel was selected as the structural concept for the mod ified wing structure. Upper and lower surface panels of the arrow wing structure were then redesigned, using high strength graphite/ polyimide sandwich panels, retaining the titanium spars and ribs from thk prior study. The ATLAS integrated analysis and design system was used for stress analysis and automated resizing of surface panels. F lutter analysis of the hybrid structure showed a significant decrease in flutter speed relative to the titanium wing design. The flutter speed was increased to that of the titanium design by selective increase in laminate thickness and by using graphite fibers with properties intermediate between high strength and high modu lus values.
17. Key Words (Suggested by Author(s) 1 18. Distribution Statement
Arrow wing, Supersonic cruise SCAR technology NASA SCAT-l 5F Unclassified-Unlimited
Subject Category 05 9. Security Classif. (of this report) 20. Security Classif. (of this page) 21. No. of Pages 22. Price’
Unclassified Unclassified 118 $6.50 ‘For sale by the National Technical Information Service. Springfield, Virginia 22151 I
NASA-Langley, 1978
I