Embed Size (px)
Citation preview
Study of alpha backgrounds
using flash ADC in the XMASS experiment
Feb. 22nd , 2013ICRR, Suzuki-Lab.
M2 Osamu Takachio
Dark matter
XMASS experiment
DAQ system
Study of alpha backgrounds using flash ADC
Contents
Dark matter
Dark matter
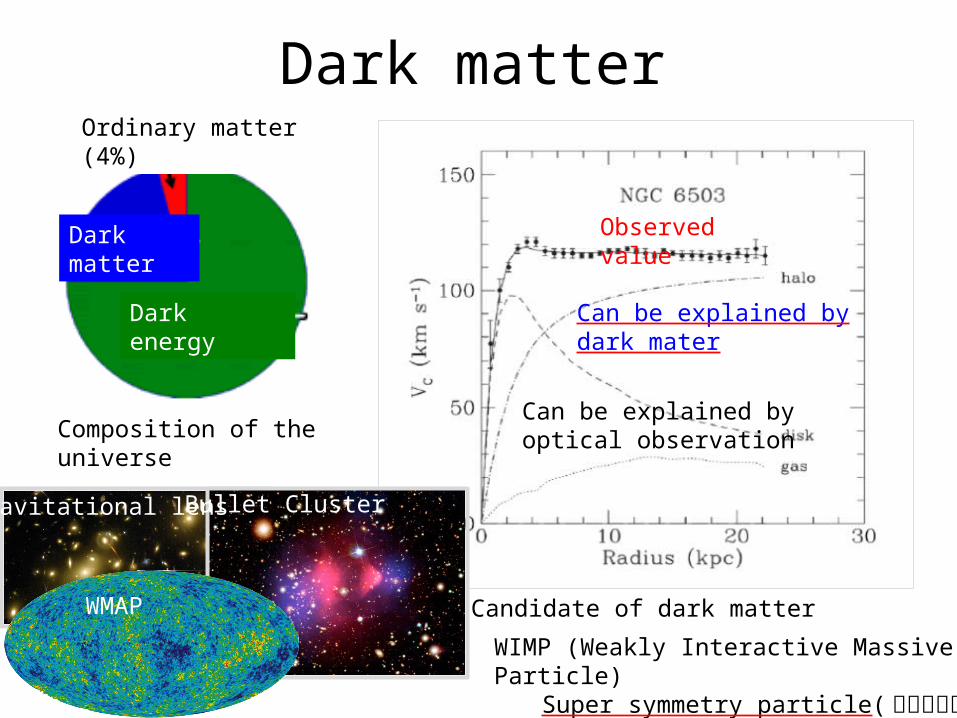
Observed value
Can be explained by optical observation
Can be explained by dark mater
WIMP (Weakly Interactive Massive Particle)Super symmetry particle( 超対称性粒子 )
Candidate of dark matter
Gravitational lens Bullet Cluster
WMAP
Composition of the universe
Dark energy
Dark matter
Ordinary matter (4%)
XMASS experiment
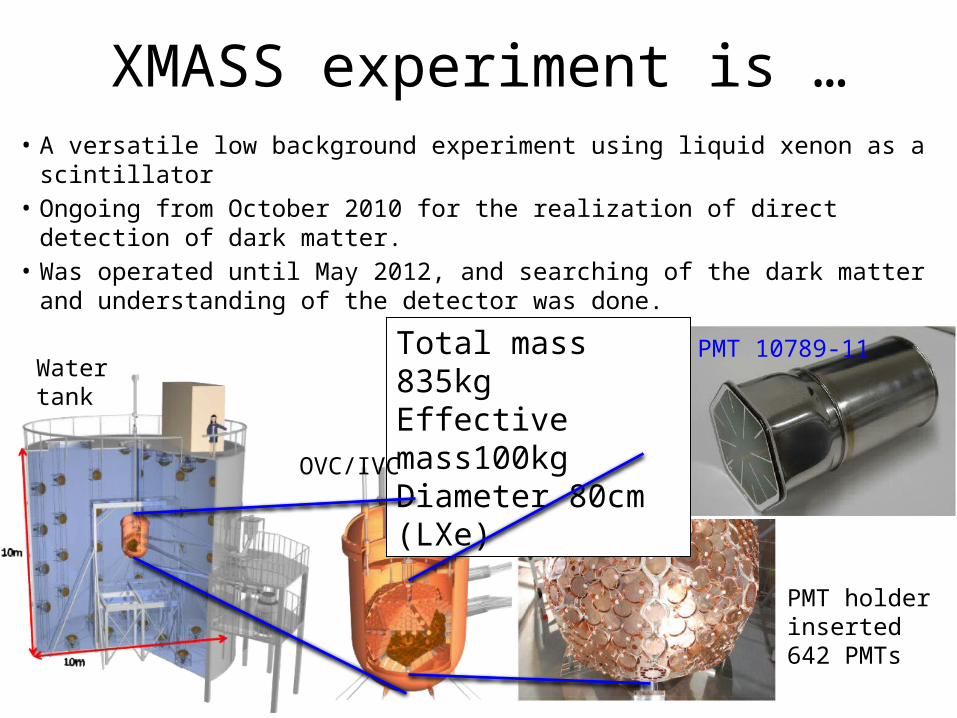
XMASS experiment is …• A versatile low background experiment using liquid xenon as a scintillator• Ongoing from October 2010 for the realization of direct detection of dark
matter.• Was operated until May 2012, and searching of the dark matter and
understanding of the detector was done.
PMT holder inserted 642 PMTs
PMT 10789-11Total mass 835kgEffective mass100kgDiameter 80cm (LXe)
Water tank
OVC/IVC

DAQ systems
DAQ system
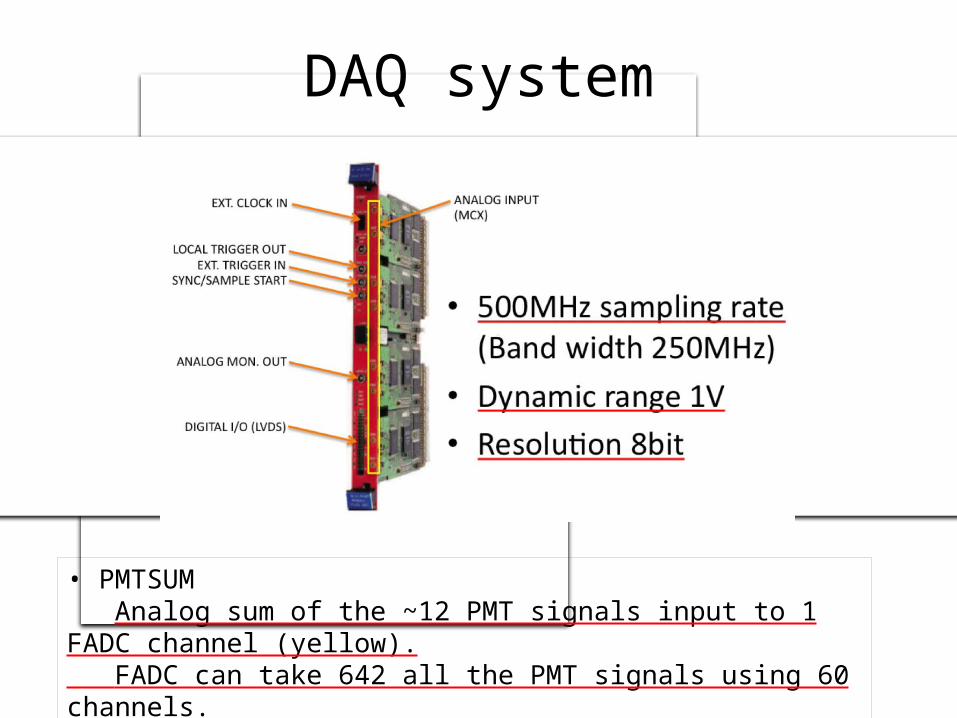
Trigger is generated from ATM HITSUM• PMTSUM
Analog sum of the ~12 PMT signals input to 1 FADC channel (yellow). FADC can take 642 all the PMT signals using 60 channels.
Study of alpha backgrounds using flash ADC in the XMASS experiment
Motivation
• Using waveform information available from FADC, we may be able to discriminate alpha events and gamma events.– We want to know how much alpha background
exists in the detector.– With the information about alpha events (energy,
position etc…), we want to identify and estimate the quantity of the cause of the background.
– Then, we can move to the removal work of the causative substance from the detector, etc.
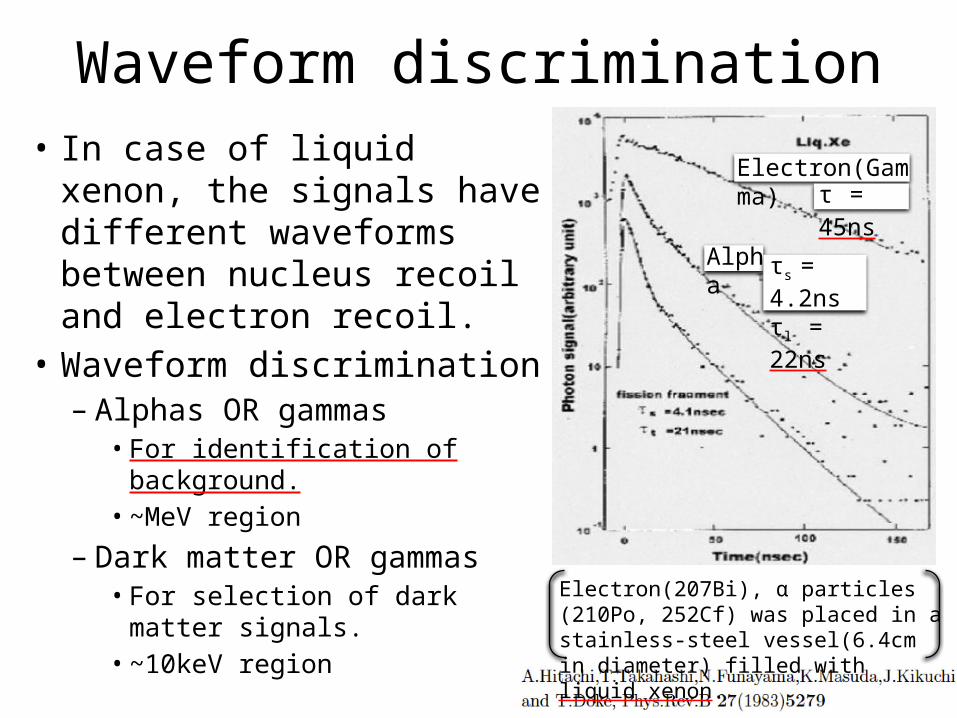
Waveform discrimination• In case of liquid xenon, the
signals have different waveforms between nucleus recoil and electron recoil.
• Waveform discrimination– Alphas OR gammas
• For identification of background.
• ~MeV region
– Dark matter OR gammas• For selection of dark matter
signals.• ~10keV region
Alpha
Electron(Gamma)
τs = 4.2nsτl = 22ns
τ = 45ns
Electron(207Bi), α particles (210Po, 252Cf) was placed in a stainless-steel vessel(6.4cm in diameter) filled with liquid xenon.

Peak search
• Peak search method– Time window is 4us.– Baseline is the average of the first
100 samples.– Starting point is the crossing point
of +20 ADC count.– Ending point is the crossing point
of +10 ADC count. – Search next start point.
Waveform Example
(First peak)
(Second peak)
• Get parameters of the peak• Area
– Integrate between the starting point and ending point.
– 1count~22.4eV according to Co57 detector center calibration
• Time constant (τ)– Fit exponential function
(peak+10ns to peak+150ns).€
y = eax−b,τ = −1
a
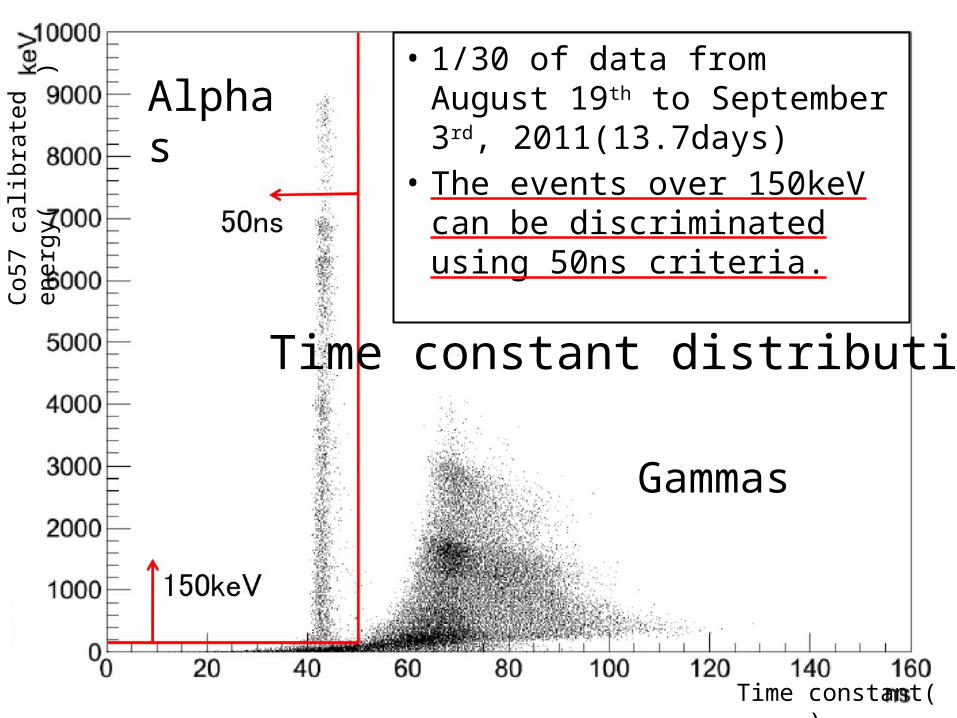
Time constant distribution
Co57
cal
ibra
ted
ener
gy(
)
Time constant( )
Gammas
• 1/30 of data from August 19th to September 3rd, 2011(13.7days)
• The events over 150keV can be discriminated using 50ns criteria.
Alphas
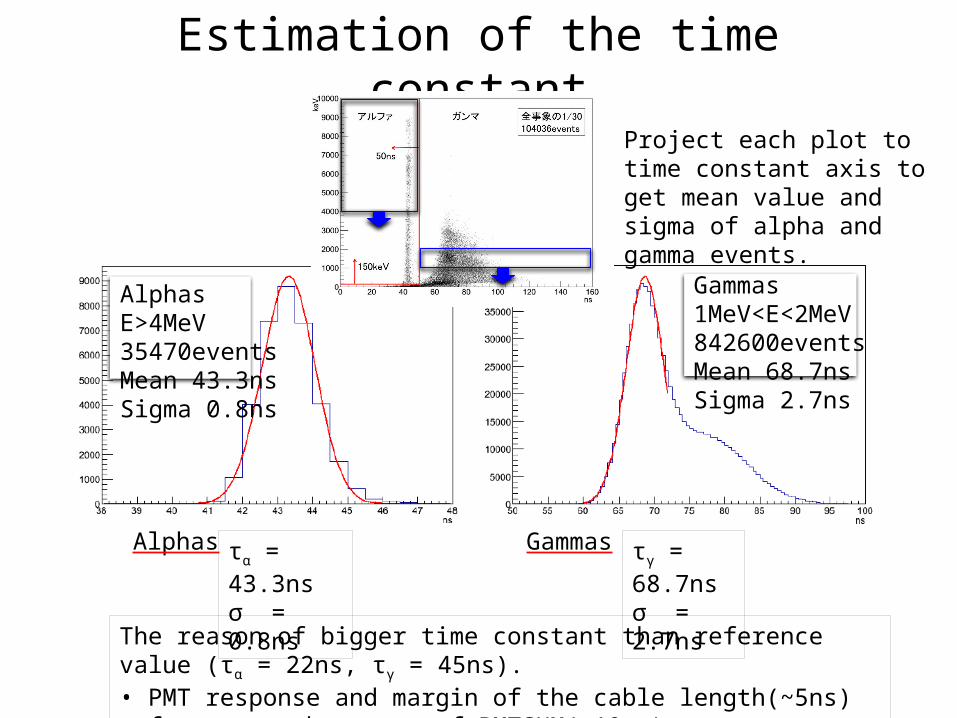
Estimation of the time constant
τα = 43.3nsσ = 0.8ns
τγ = 68.7nsσ = 2.7ns
AlphasE>4MeV35470eventsMean 43.3nsSigma 0.8ns
Gammas1MeV<E<2MeV842600eventsMean 68.7nsSigma 2.7ns
The reason of bigger time constant than reference value (τα = 22ns, τγ = 45ns).• PMT response and margin of the cable length(~5ns)• frequency character of PMTSUM(~10ns) • discrepancy btw. Boards etc…
Project each plot to time constant axis to get mean value and sigma of alpha and gamma events.
Alphas Gammas
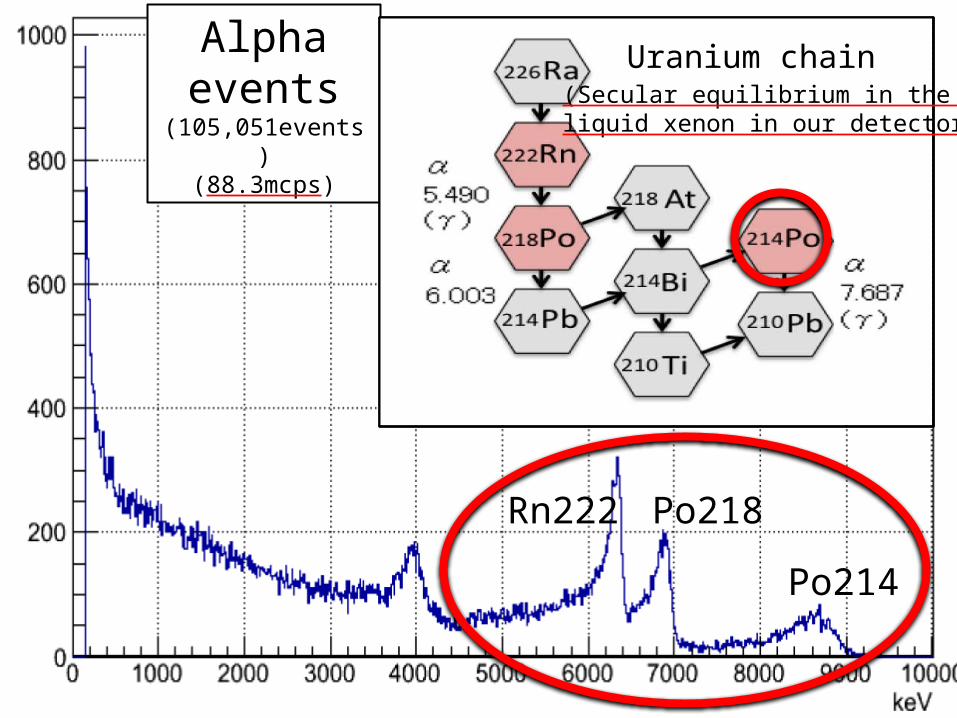
Energy spectrum of the alpha events
Po214
Po218Rn222
Alpha events
(105,051events)(88.3mcps)
Uranium chain(Secular equilibrium in the liquid xenon in our detector)
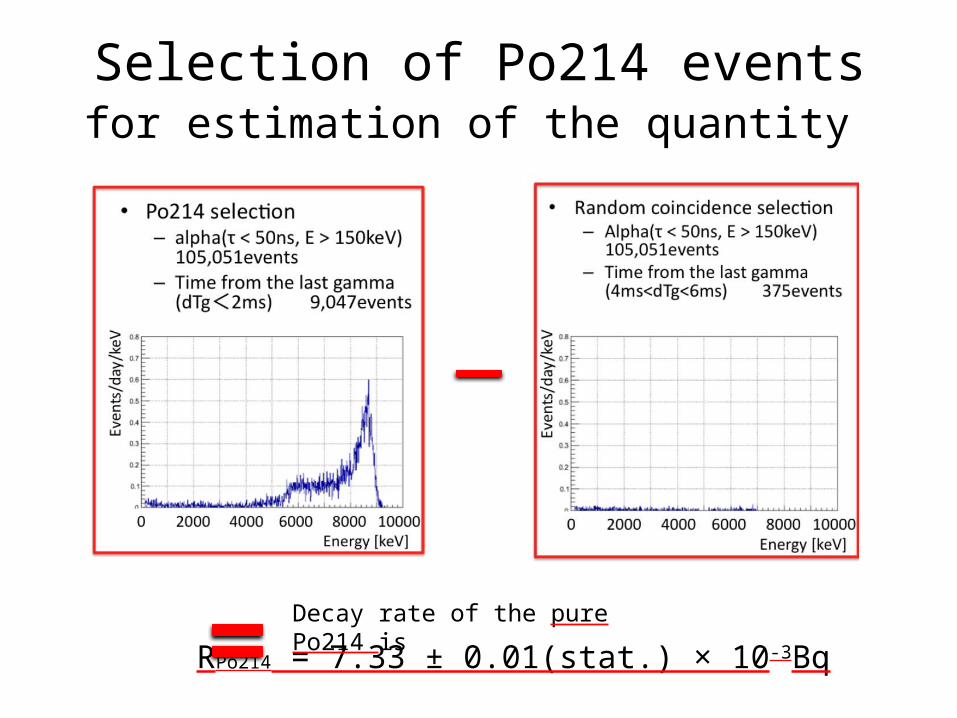
Selection of Po214 events
RPo214 = 7.33 ± 0.01(stat.) × 10-3BqDecay rate of the pure Po214 is
for estimation of the quantity
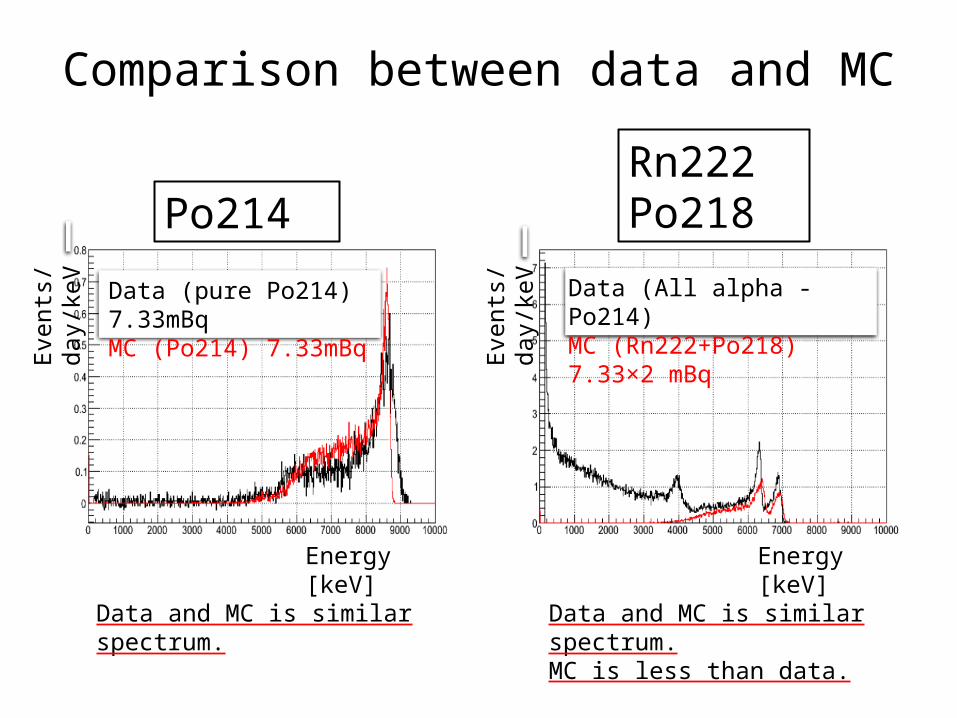
Comparison between data and MC
Energy [keV] Energy [keV]
Even
ts/d
ay/k
eV
Even
ts/d
ay/k
eV
Data (pure Po214) 7.33mBqMC (Po214) 7.33mBq
Data (All alpha - Po214)MC (Rn222+Po218) 7.33×2 mBq
Data and MC is similar spectrum. Data and MC is similar spectrum.MC is less than data.
Po214Rn222Po218
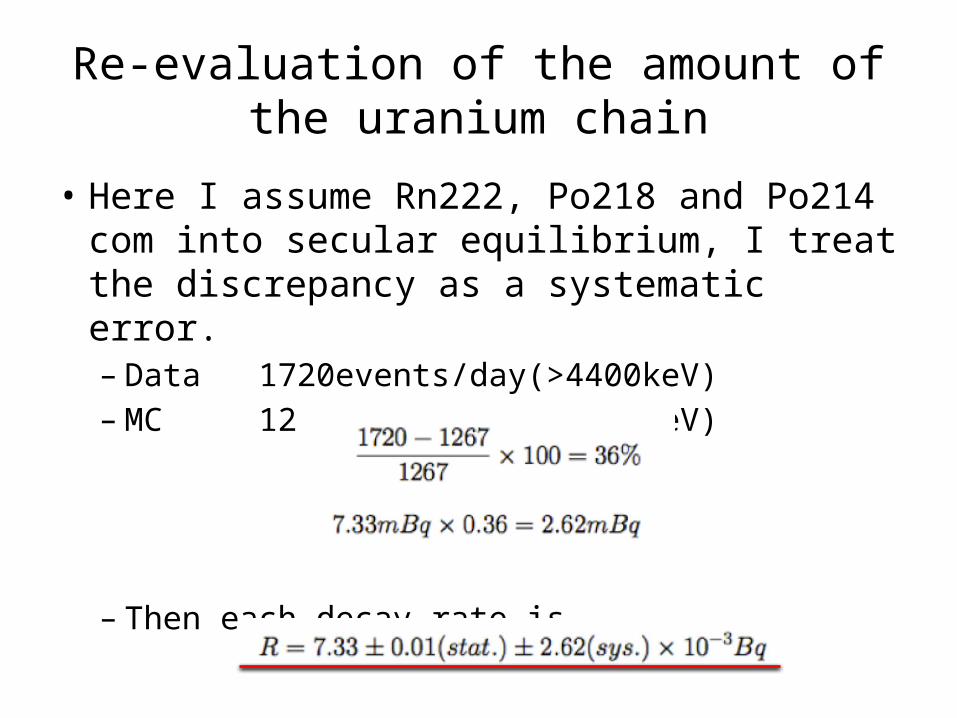
Re-evaluation of the amount of the uranium chain
• Here I assume Rn222, Po218 and Po214 com into secular equilibrium, I treat the discrepancy as a systematic error. – Data 1720events/day(>4400keV) – MC 1267events/day(>4400keV)
– Then each decay rate is,

Light center is …• The way to identify the
position of the events using 642 PMT’s light information.
Equations
XMASS detector
Where ??
?
Light quantity of channel nX-coordinate of channel nY-coordinate of channel nZ-coordinate of channel n
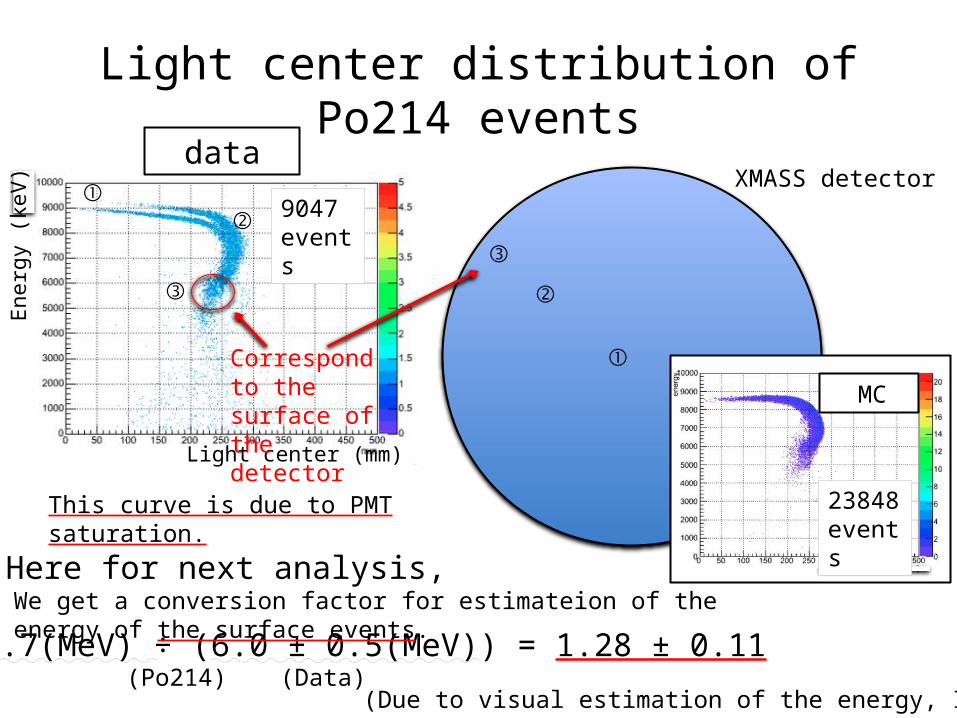
Light center distribution ofPo214 events
Light center (mm)
Energ
y (
keV
)
data
MC
9047events
23848events
Correspond to the surface of the detector
7.7(MeV) ÷ (6.0 ± 0.5(MeV)) = 1.28 ± 0.11We get a conversion factor for estimateion of the energy of the surface events.
(Due to visual estimation of the energy, I set the error larger)
①
②
③
①②
③
XMASS detector
This curve is due to PMT saturation.
Here for next analysis,
(Po214) (Data)
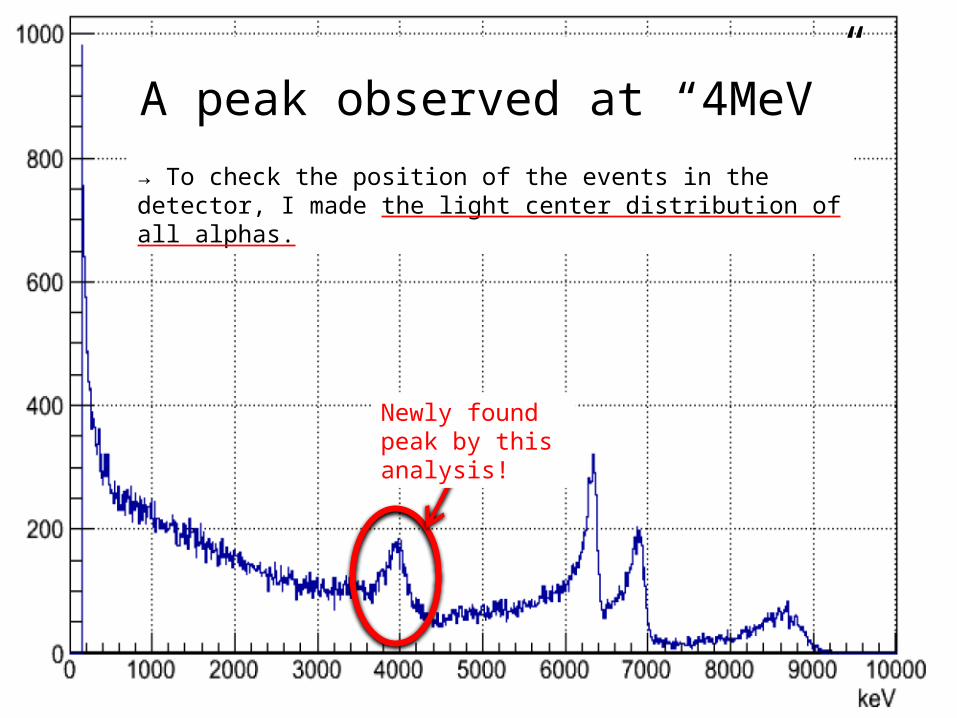
A peak observed at “4MeV”→ To check the position of the events in the detector, I made the light center distribution of all alphas.
Newly found peak by this analysis!
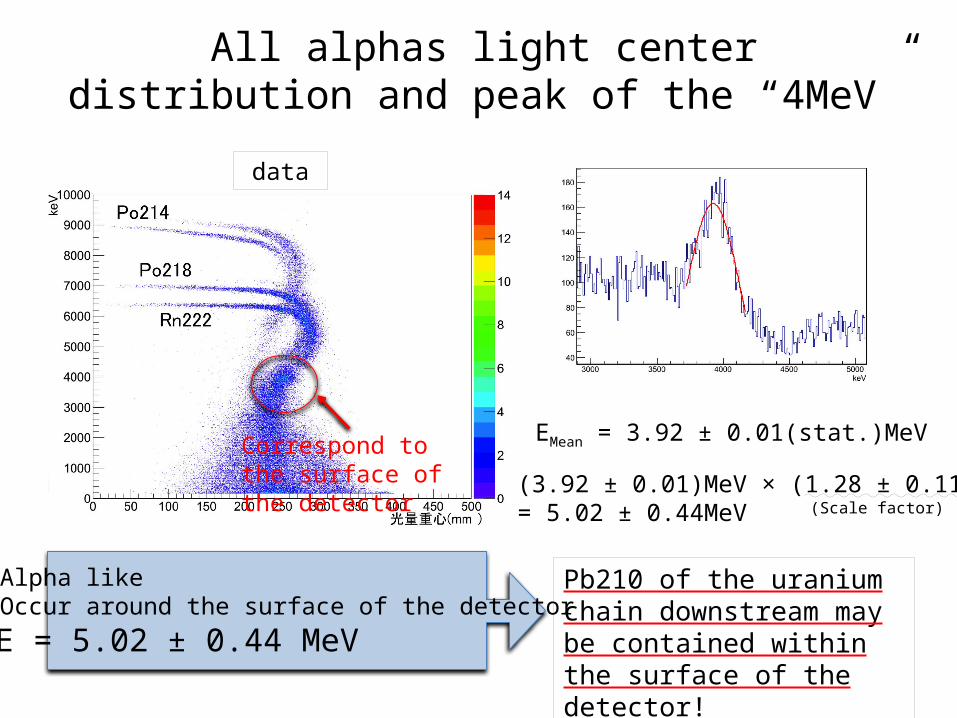
All alphas light center distribution and peak of the “4MeV”
EMean = 3.92 ± 0.01(stat.)MeV
(3.92 ± 0.01)MeV × (1.28 ± 0.11)= 5.02 ± 0.44MeV
• Alpha like• Occur around the surface of the detector
• E = 5.02 ± 0.44 MeV
Pb210 of the uranium chain downstream may be contained within the surface of the detector!
Correspond to the surface of the detector
data
(Scale factor)
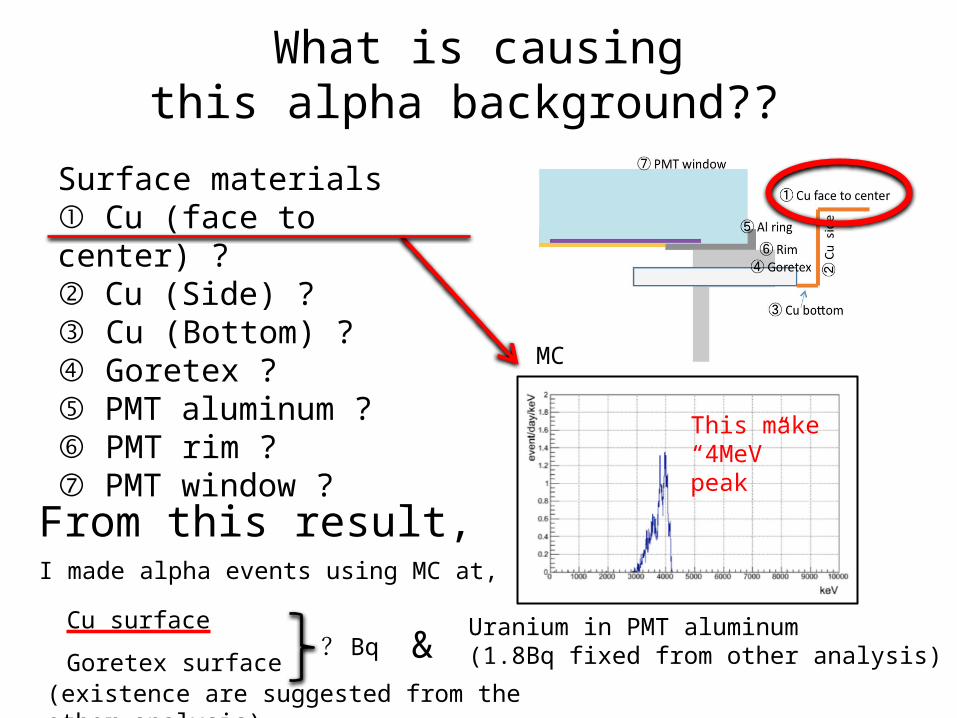
What is causingthis alpha background??
Surface materials① Cu (face to center) ?② Cu (Side) ?③ Cu (Bottom) ?④ Goretex ?⑤ PMT aluminum ?⑥ PMT rim ?⑦ PMT window ?
MC
This make “4MeV” peak
From this result,I made alpha events using MC at,
Cu surface
Goretex surface
Uranium in PMT aluminum(1.8Bq fixed from other analysis)&? Bq
(existence are suggested from the other analysis)
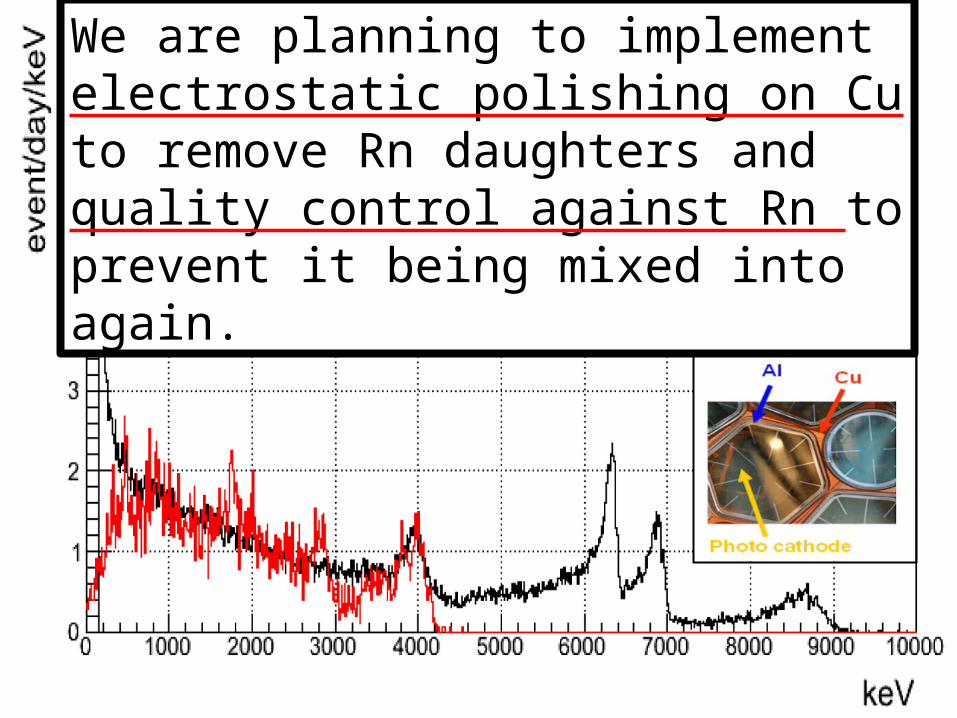
MC : Uranium alpha(1.8Bq) + Pb210 alpha(0.025Bq)
DATA : All alpha spectrum
From the best fit between data and MC,I got this value.
Cu surface Pb210
Goretex surface Pb2100.025±0.004Bq
We are planning to implement electrostatic polishing on Cu to remove Rn daughters and quality control against Rn to prevent it being mixed into again.
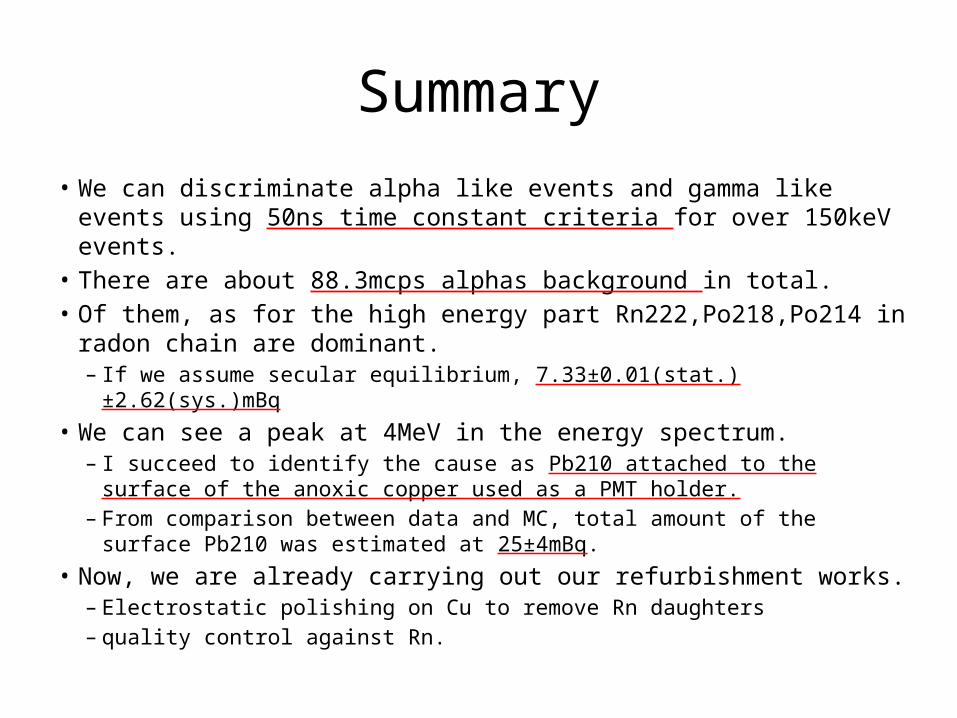
Summary• We can discriminate alpha like events and gamma like events using
50ns time constant criteria for over 150keV events. • There are about 88.3mcps alphas background in total.• Of them, as for the high energy part Rn222,Po218,Po214 in radon
chain are dominant.– If we assume secular equilibrium, 7.33±0.01(stat.)±2.62(sys.)mBq
• We can see a peak at 4MeV in the energy spectrum.– I succeed to identify the cause as Pb210 attached to the surface of the
anoxic copper used as a PMT holder.– From comparison between data and MC, total amount of the surface Pb210
was estimated at 25±4mBq.• Now, we are already carrying out our refurbishment works.
– Electrostatic polishing on Cu to remove Rn daughters– quality control against Rn.