Embed Size (px)
Citation preview
Study of Arabidopsis’ Copper RegulationStudy of Arabidopsis’ Copper Regulationby High Throughput Sequence Data Analysisby High Throughput Sequence Data Analysis
Study of Arabidopsis’ Copper RegulationStudy of Arabidopsis’ Copper Regulationby High Throughput Sequence Data Analysisby High Throughput Sequence Data Analysis
Steven A. Cardenas, SoCal BSI
Dr. Pellegrini, PI, UCLA
Dr. Casero Diaz-Cano, Post Doc, UCLA
Steven A. Cardenas, SoCal BSI
Dr. Pellegrini, PI, UCLA
Dr. Casero Diaz-Cano, Post Doc, UCLA
Objective of ProjectObjective of ProjectObjective of ProjectObjective of Project
Analysis of Sets of Differentially Expressed Genes in
Plus and Minus Copper Conditions For Arabidopsis WT
Identify Spl7 Regulated Genes
Potential Upstream Motifs That Regulate the Genes
Project SignificanceProject SignificanceProject SignificanceProject Significance
To Further the Development of Techniques Used in High
Throughput Analysis.
The Study of Copper Regulation in Arabidopsis.
This Data Could Be Used to Help Increase Our
Understanding of Copper Regulation in the Human
Body.
Arabidopsis Thaliana
Tools Used
Solexa Sequencing
Low Level Data Analysis
Downstream Data Analysis
Future Work
Outline of PresentationOutline of Presentation
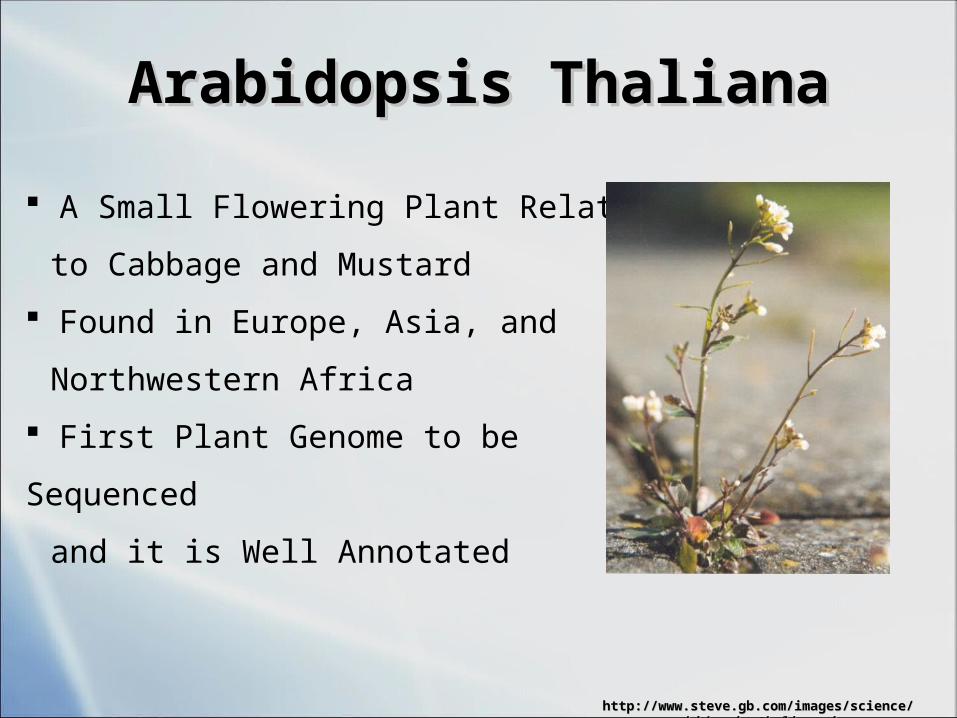
Arabidopsis ThalianaArabidopsis Thaliana
A Small Flowering Plant Related
to Cabbage and Mustard
Found in Europe, Asia, and
Northwestern Africa
First Plant Genome to be Sequenced
and it is Well Annotated
http://www.steve.gb.com/images/science/arabidopsis_thaliana.jpghttp://www.steve.gb.com/images/science/arabidopsis_thaliana.jpg
TAIR
Tools UsedTools Used
SOAP
www.arabidopsis.org
http://soap.genomics.org.cn
MATLAB
www.mathworks.com
Excelwww.microsoft.comwww.pythonwin.org
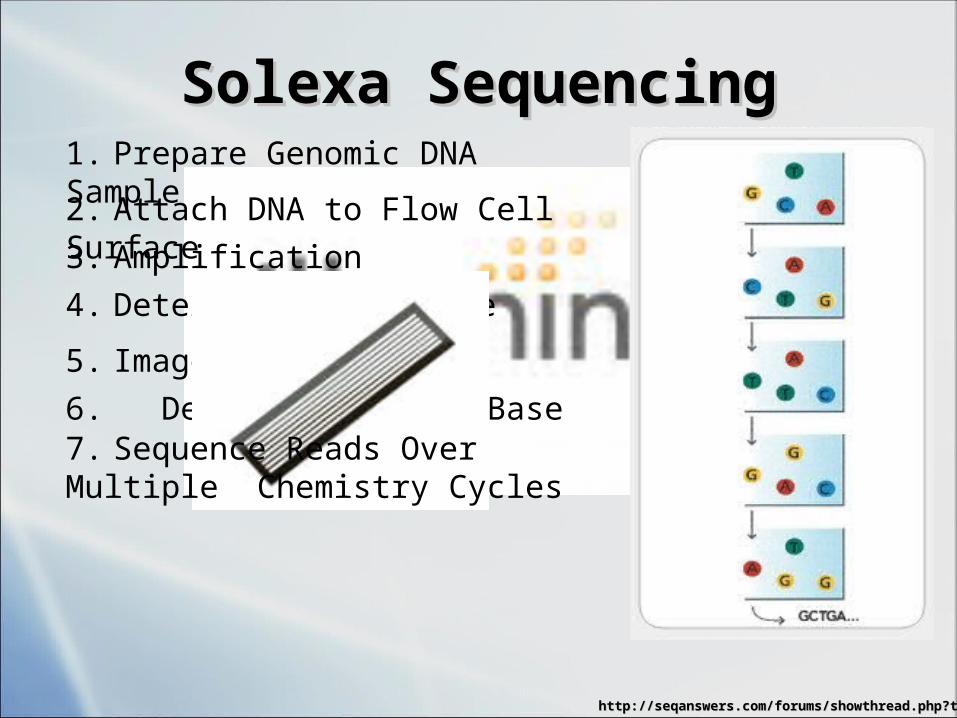
Solexa SequencingSolexa Sequencing1. Prepare Genomic DNA Sample
2. Attach DNA to Flow Cell Surface
3. Amplification
4. Determine First Base
5. Image First Base
6. Determine Second Base7. Sequence Reads Over Multiple
Chemistry Cycles
http://seqanswers.com/forums/showthread.php?t=21http://seqanswers.com/forums/showthread.php?t=21
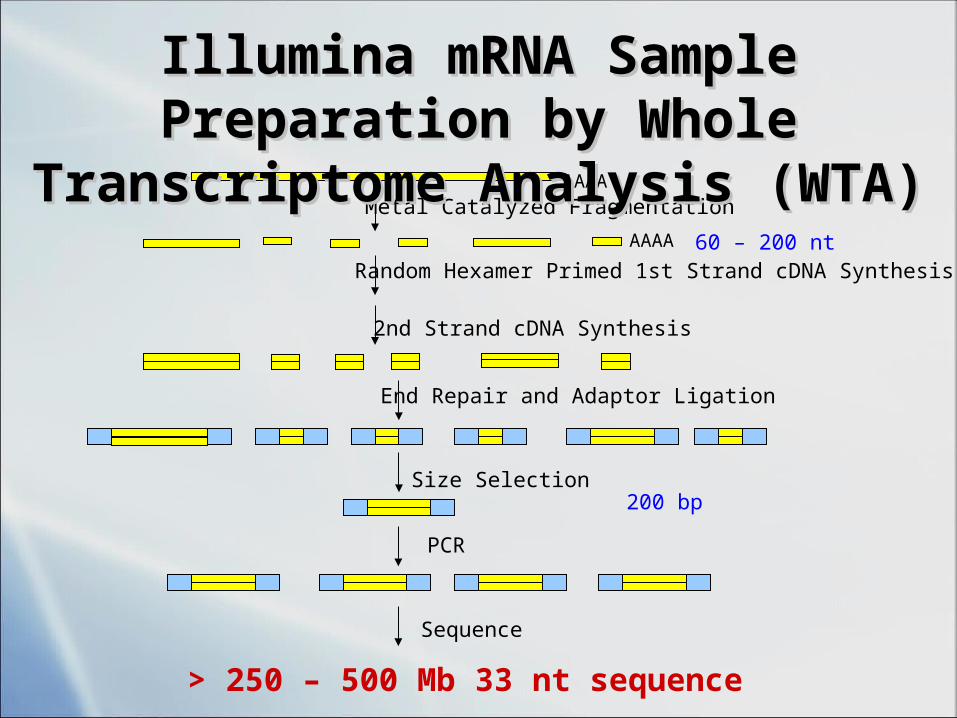
AAAA
> 250 – 500 Mb 33 nt sequence
Random Hexamer Primed 1st Strand cDNA Synthesis
End Repair and Adaptor Ligation
PCR
AAAA
2nd Strand cDNA Synthesis
Metal Catalyzed Fragmentation
Sequence
60 – 200 nt
Size Selection200 bp
Illumina mRNA Sample Preparation by Illumina mRNA Sample Preparation by Whole Transcriptome Analysis (WTA)Whole Transcriptome Analysis (WTA)
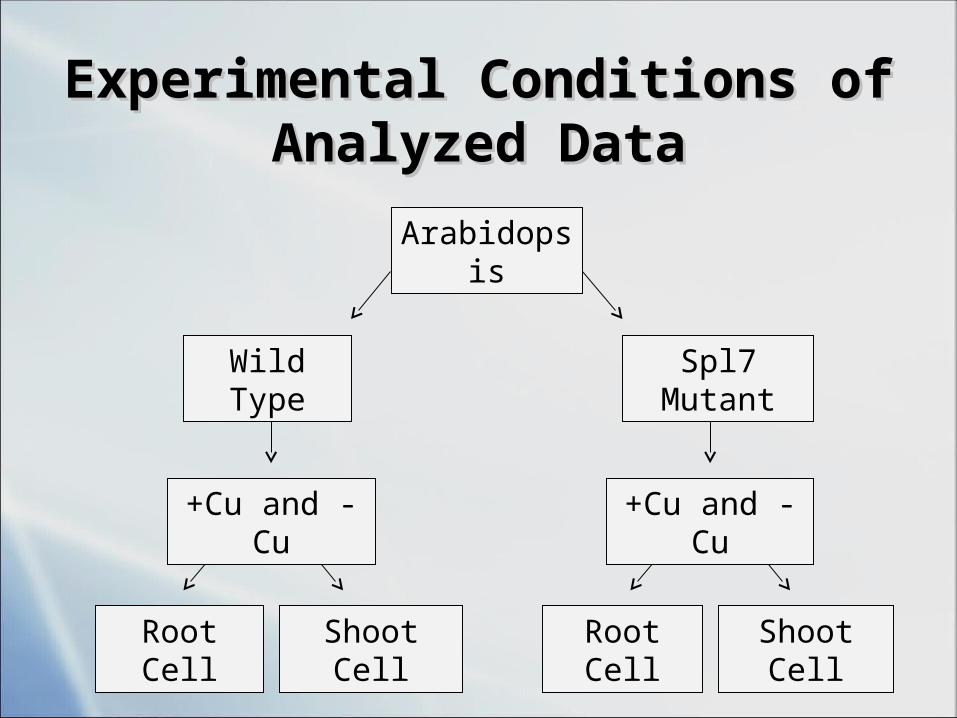
Experimental Conditions of Analyzed Experimental Conditions of Analyzed DataData
Root Cell Shoot Cell
Arabidopsis
Wild Type Spl7 Mutant
+Cu and -Cu +Cu and -Cu
Root Cell Shoot Cell
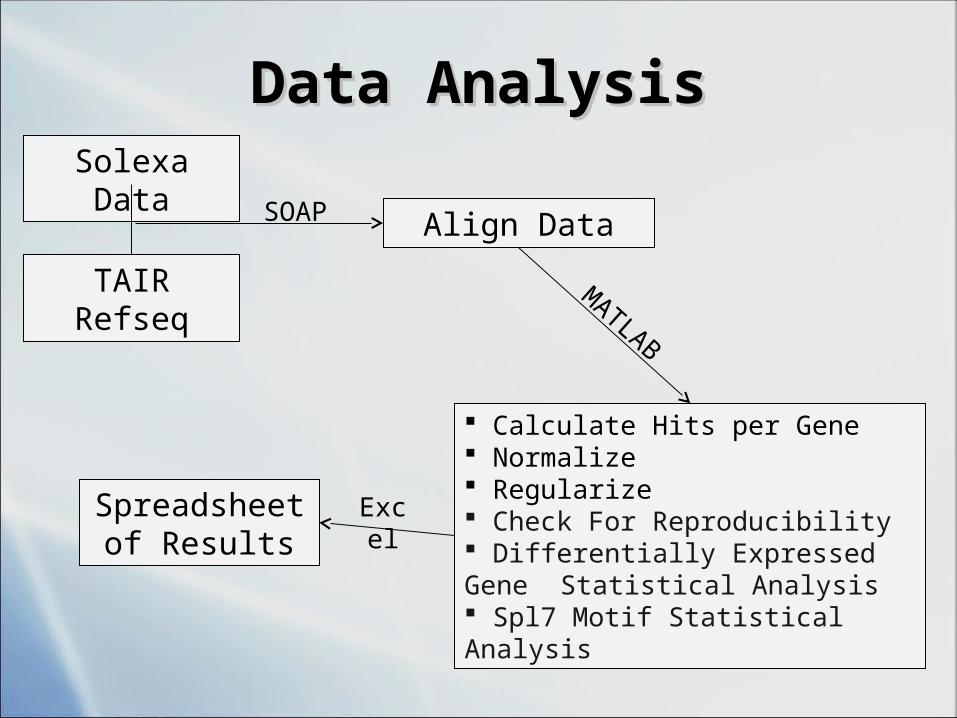
Data AnalysisData AnalysisSolexa Data
Align Data
TAIR Refseq
Calculate Hits per Gene Normalize Regularize Check For Reproducibility Differentially Expressed Gene Statistical Analysis Spl7 Motif Statistical Analysis
Spreadsheet of Results
SOAP
MATLAB
Excel
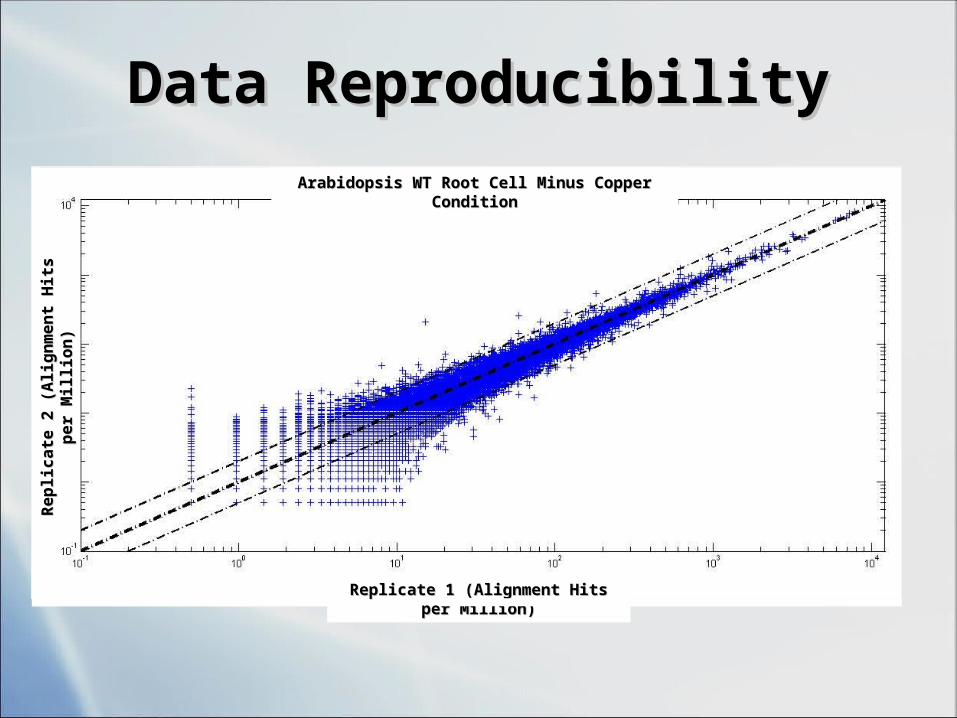
Data ReproducibilityData Reproducibility
Replicate 1 (Alignment Hits per Million)Replicate 1 (Alignment Hits per Million)
Rep
lica
te 2
(A
lign
men
t H
its
per
Mil
lion
)R
epli
cate
2 (
Ali
gnm
ent
Hit
s p
er M
illi
on)
Arabidopsis WT Root Cell Minus Copper ConditionArabidopsis WT Root Cell Minus Copper Condition
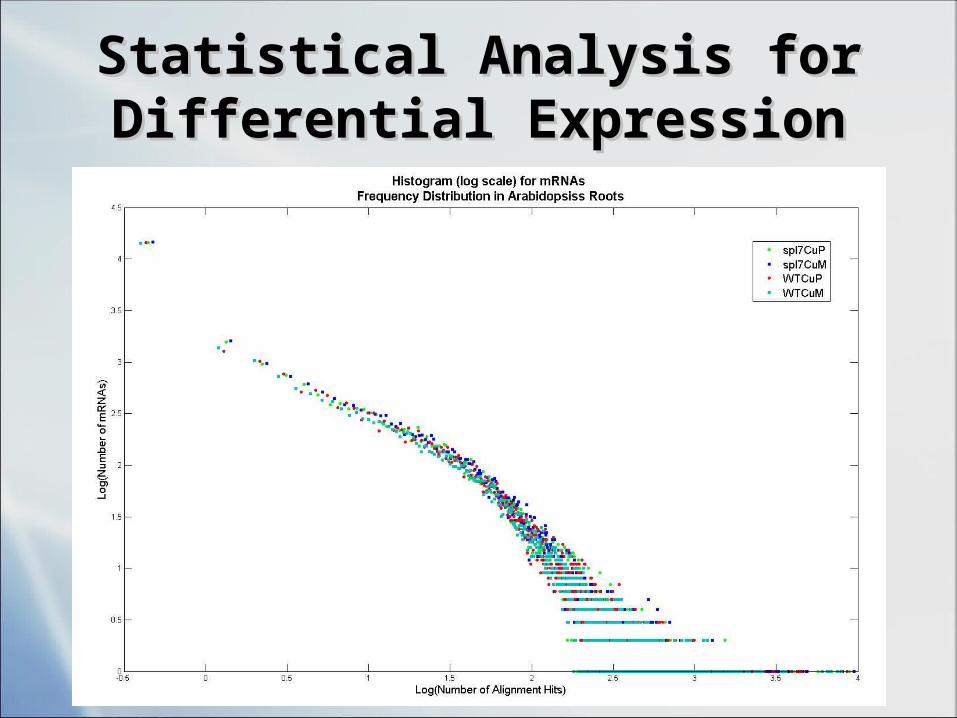
Statistical Analysis for Differential Statistical Analysis for Differential ExpressionExpression
Differential Expression of Genes in
Plus Copper vs. Minus Copper
Statistical Problems
Only Two Replicates
Large Dynamic Range of Data
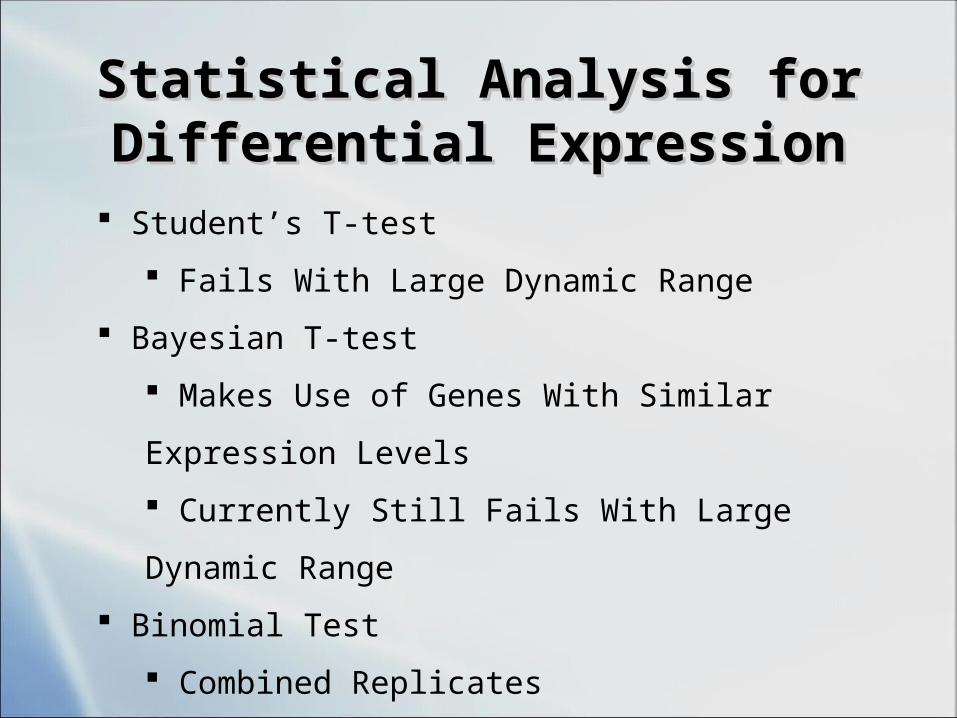
Student’s T-test
Fails With Large Dynamic Range
Bayesian T-test
Makes Use of Genes With Similar Expression Levels
Currently Still Fails With Large Dynamic Range
Binomial Test
Combined Replicates
Fails When Reproducibility is Bad
Statistical Analysis for Differential Statistical Analysis for Differential ExpressionExpression
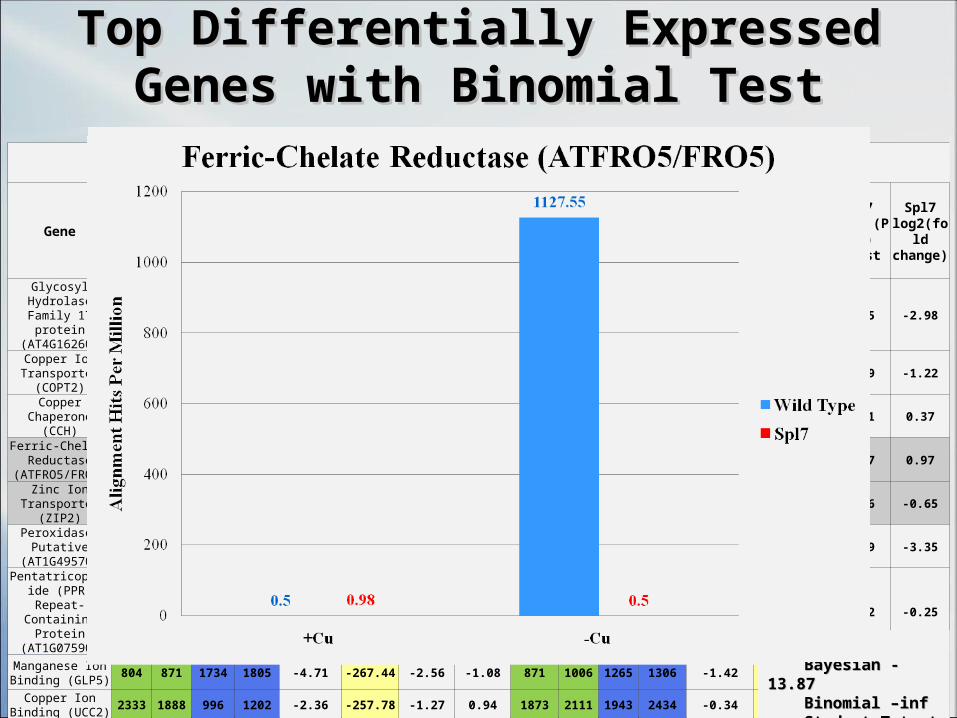
Top Differentially Expressed Genes with Top Differentially Expressed Genes with Binomial TestBinomial Test
Root Reference mRNA Sequence Hits per million (unique hits)
GeneWT +Cu
GAN1
WT +Cu
GAN5
WT -Cu
GAN2
WT -Cu
GAN6
WT log10 (P value) Bayesian
WT log10 (P value) Binomial
WT log10 (P value)
t-test
WT log2 (fold
change)
spl7 +Cu GAN4
spl7 +Cu
GAN8
spl7 -Cu
GAN3
spl7 -Cu
GAN7
Spl7 log10 (P value) Bayesian
spl7 log10 (P value) Binomial
Spl7 log10 (P value) t-
test
Spl7 log2(fold change)
Glycosyl Hydrolase Family 17 protein
(AT4G16260)591 336 934 1833 -2.93 -400.00 -0.73 -1.58 352 444 3133 3133 -8.53 -400.00 -3.55 -2.98
Copper Ion Transporter (COPT2) 14 26 478 531 -8.61 -400.00 -2.51 -4.66 11 20 33 38 -2.83 -7.17 -1.29 -1.22
Copper Chaperone (CCH) 218 155 1032 1055 -7.44 -400.00 -2.81 -2.49 141 130 94 116 -0.94 -4.19 -0.91 0.37
Ferric-Chelate Reductase
(ATFRO5/FRO5)0.50 0.50 1114 1141 -8.49 -400.00 -3.84 -11.14 0.50 1.45 0.50 0.50 -0.43 -0.38 -0.37 0.97
Zinc Ion Transporter (ZIP2) 21 32 425 486 -8.23 -308.36 -2.28 -4.10 2.87 4.32 6.34 4.97 -0.63 -0.91 -0.76 -0.65
Peroxidase, Putative (AT1G49570) 273 195 734 985 -5.43 -280.62 -1.38 -1.88 261 209 2144 2635 -6.94 -400.00 -1.89 -3.35
Pentatricopeptide (PPR) Repeat-
Containing Protein (AT1G07590)
5162 4478 6953 6625 -3.96 -279.75 -1.45 -0.49 3649 4474 3649 5982 -0.68 -55.87 -0.22 -0.25
Manganese Ion Binding (GLP5) 804 871 1734 1805 -4.71 -267.44 -2.56 -1.08 871 1006 1265 1306 -1.42 -46.38 -1.41 -0.45
Copper Ion Binding (UCC2) 2333 1888 996 1202 -2.36 -257.78 -1.27 0.94 1873 2111 1943 2434 -0.34 -9.03 -0.26 -0.14
Peroxidase, Putative (AT5G19890) 1209 1620 2077 2586 -2.24 -184.61 -0.97 -0.72 1309 1595 3998 4478 -6.88 -400.00 -2.00 -1.55
Min: Min: Bayesian -13.87Bayesian -13.87Binomial –infBinomial –infStudent T-test -5.63Student T-test -5.63
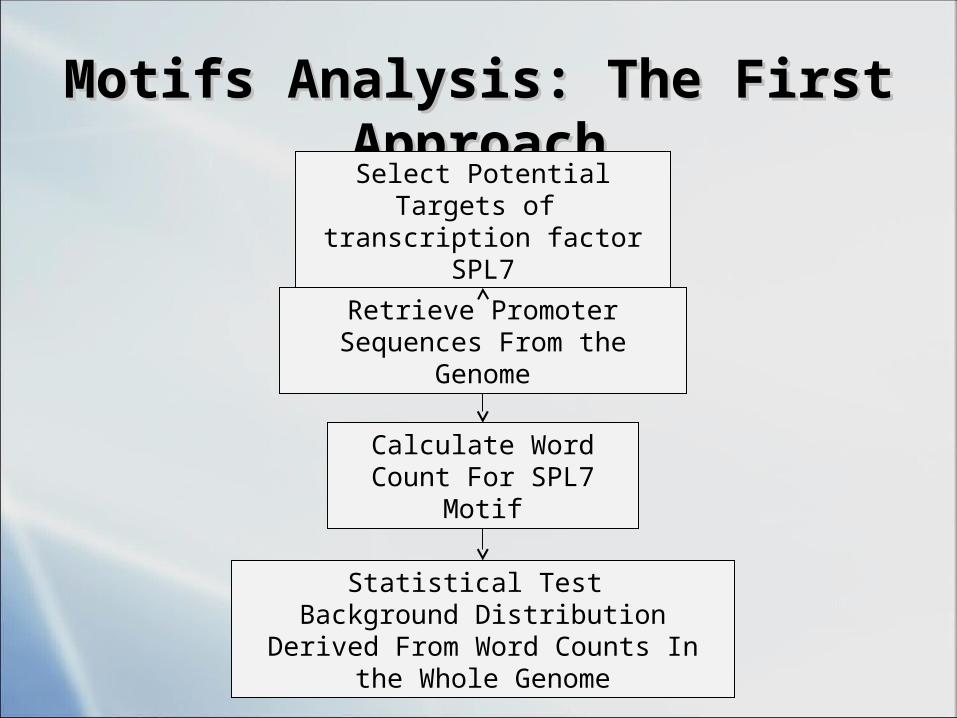
Motifs Analysis: The First ApproachMotifs Analysis: The First Approach
Select Potential Targets of transcription factor SPL7
Statistical Test Background Distribution Derived From
Word Counts In the Whole Genome
Retrieve Promoter Sequences From the Genome
Calculate Word Count For SPL7 Motif
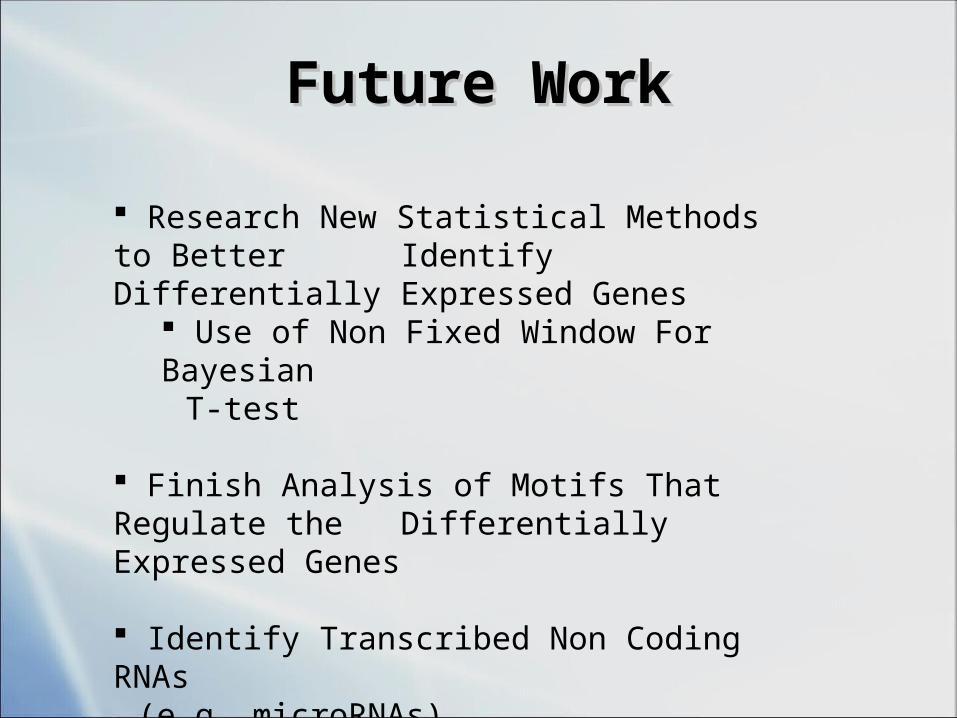
Future WorkFuture Work
Research New Statistical Methods to Better Identify Differentially Expressed Genes
Use of Non Fixed Window For Bayesian T-test
Finish Analysis of Motifs That Regulate the Differentially Expressed Genes
Identify Transcribed Non Coding RNAs (e.g. microRNAs)
AcknowledgementsAcknowledgements UCLA and the Pellegrini Lab
Dr. Matteo Pellegrini Dr. David Casero Díaz-Cano Dr. Shawn Cokus
Collaborators Ute Krammer University of Heidelberg, Germany Sabeeha Merchant University of California Los Angeles
SoCalBSI Instructors and Fellow Researchers
Funding
www.ucla.edu
National Institutes of Health National Science Foundation Economic & Workforce Development The Department of Energy
http://instructional1.calstatela.edu/jmomand2/index.html