Embed Size (px)
Citation preview
Study of Cluster Ions by MassSpectrometry and Optical
Spectroscopy
A THESIS
submitted for the Award of Ph. D. degree of
MOHANLAL SUKHADIA UNIVERSITY
in the
Faculty of Science
by
Arvind Kumar Saxena
Under the Supervision of
Bhas Bapat, Associate ProfessorPhysical Research Laboratory, Ahmedabad, INDIA
DEPARTMENT OF PHYSICS
FACULTY OF SCIENCE
MOHANLAL SUKHADIA UNIVERSITY
UDAIPUR2013
To
My Parents
and
My Elder Brother
Late Krishna Kumar Saxena
DECLARATION
I, Mr. Arvind Kumar Saxena, S/O Late Shyam Swaroop Saxena, permanent resi-
dent of Mohalla mohammad zai, H. No. 521, Shahjahanpur (U.P.)-242001, hereby
declare that the research work incorporated in the present thesis entitled “Study of
cluster ions by Mass spectrometry and optical spectroscopy ”is my own work and
is original. This work (in part or in full) has not been submitted to any University
for the award of a Degree or a Diploma. I have properly acknowledged the material
collected from secondary sources wherever required. I solely own the responsibility
for the originality of the entire content.
Date: (Arvind Kumar Saxena)
CERTIFICATE
I feel great pleasure in certifying the thesis entitled “Study of Cluster Ions by
Mass Spectrometry and Optical Spectroscopy” by Arvind Kumar Saxena under
my guidance. He has completed the following requirements as per Ph.D. regula-
tions of the University
(a) Course work as per the university rules.
(b) Residential requirements of the university.
(c) Regularly submitted six monthly progress report.
(c) Presented his work in the departmental committee.
(d) Published/accepted minimum of one research paper in a referred research jour-
nal.
I am satisfied with the analysis of data, interpretation of results and conclusionsdrawn.
I recommend submission of the thesis.
Date: 2013 Bhas Bapat(Thesis Supervisor)Associate Professor
Physical Research LaboratoryAhmedabad, India.
Countersigned byHead of the Department
Acknowledgments
My thesis would not have been possible without the help of several persons
from different aspects such as financial support, scientific discussions, setting up
and performing experiments, and emotional support. During the time of my PhD
studies in Physical Research Laboratory (PRL), plenty of ups and downs occurred
in my academic carrier. But this is all past, the time has come when I must thank
all the persons who have provided me their affection, care and helped me in my
academic carrier when it was much needed.
It has been a great privilege to spend several years in Physical Research Labora-
tory, a reputed institute, where I was given an extremely academically competitive
yet homely atmosphere throughout my entire PhD tenure. All the members of Phys-
ical Research Laboratory, under the esteemed leadership of the Director, Prof J. N.
Goswami, have carved a niche in the various emerging fields of science and tech-
nology and all of them will always remain like a family member to me.
First and foremost, I am deeply indebted and grateful to my supervisor Prof
Bhas Bapat, for being so inspirational and supportive to me. I am grateful to him for
his thorough and detailed revision of my work. He nurtured a great sense of freedom
in me and allowed it to nourish to the highest possible extent. Apart from being my
PhD mentor, I must thank him for the stimulating broad discussions that not only
helped me to understand the subject but also enlightened me on the basic values
and ethics in scientific activities. He brought confidence in me by showing his
trust in my abilities for leading the experiments, to exchange ideas during scientific
discussions, and writing the manuscripts. He walked with me during the ups and
downs in developing the experimental setups. I must thank him for supporting,
guiding and motivating me at adverse stages of my life during the PRL stay. I hope
that I can in turn pass on the research values that he has given to me.
I would also like to thank Prof K. P. Subramanian for providing encouraging
and constructive feedback. Apart from fruitful scientific discussions, he was always
present for me to support emotionally. His simplistic way of teaching basic ideas
of experiments and science reminds me my college teachers, his help in this aspect
would be unforgettable to me. His thorough help, with his insightful thought on
expressing scientific work, is gloriously reflected in my thesis.
My sincere and heartfelt gratitude goes to Prof Ajai Kumar, Institute of Plasma
Research (IPR), for allowing me to use the facilities available in their laboratory.
i
I must thank him for encouraging as well as helping me during experiments in
IPR. In this context, I would also like to thank Dr Rajesh Kumar Singh, IPR, for
fruitful scientific discussions and his help during experiments in IPR. My heartfelt
thanks goes to him for showing his patience to listen my ideas, appreciating as
well as modifying them. He was always there for me to help scientifically as well
as emotionally. I would like to thank Plasma Science Society of India (PSSI) for
providing me partial financial support during experiments in IPR. I would like to
thank Vishnu for helping in setting up the synchronization of different pulses.
My debt of gratitude also goes to Prof Rama Shankar, Banaras Hindu University,
who provided me necessary advices which became useful to proceed through my
research.
My special thanks go to the academic committee for thoroughly reviewing my
work. I would also like to express my gratitude to faculty members in the Space
and Atmospheric Science division, Prof D. Pallamraju, Prof Shyam Lal, Prof R.
Sekar, Prof Harish Chandra, Prof S. Ramachandran, Prof S. A. Haidar, Dr Som
Sharma, Dr Lokesh Sahu, Dr Smitha Thampi, Dr Dibyendu Chkarabarty for tak-
ing part in stimulating discussions and providing an outstanding flavor of doing
research. My thanks are due to T. A. Rajesh (Rajesh bhai), R. P. Bhai, Sunil Bhai
and S. Venkataramani for encouraging me. Along with that I would like to thank
faculty members of PRL, Prof Utpal Sarkar, Prof N. Mahajan, Prof Joshipura, Prof
D. Angom, Prof Prashanta Panigrahi, Prof K. K. Marhas, Dr R. P. Singh, Dr Gautam
Samanta and Dr Bhushit Vaishnav. Their guidance and support has served me well
and I owe them my heartfelt appreciation.
I would like to thank V. K. Lodha and I. A. Prajapati (Ishwar Bhai) for providing
me untiring technical help in developing the experimental set-ups in our laboratory.
My heartfelt gratitude goes to my lab-mates, Rajesh Kushwaha, Bhavesh Patel,
Amrendra and Koushik for helping me and for making my stay comfortable. I can
not proceed further without giving my heartfelt thank to S. B. Banerjee (Swaroop
Da) and Prashant Kumar, who are more than a staff to me. They always provided
me their help– personally as well as professionally.
Research life in the field of instrumentations is never possible without the help
and support of persons who can make the essential parts of Instruments. In this
aspect, I would like to thank all staff members of PRL Workshop including G. P.
Ubale, H. R. Vaghela, Rajesh Kaila, Vishnu Patel and Bipin Kaila.
ii
I thank all the present and past members of the Computer Center, PRL Library,
Administration and Canteen. I thankfully acknowledge the help from all members
of computer center Jigar Bhai, Tejas Bhai, Mishra ji and Alok Bhai. I thank Nishtha
madam, Pragya, Alam and other library staff members for their cooperation and
facilitating me with the required books and journals. Thanks are due to Parul Ben,
Pauline madam, Priti madam, Nandini madam, Jayashree madam, Ranganathan sir,
R. S. Gupta (Gupta ji), Mehta sir, Hota ji, Pradeep Bhai, Senthil Babu, Yadav ji and
Sivadasan ji for their help in various stages. The six year journey of research in
PRL would not have been possible without the help from Dispensary. I would like
to give my thanks to Dr Shital Patel and Dr Sameer Dani for their co-operation and
help.
I would like to thanks Anil Mishra Sir for teaching me informative concepts of
physics, supporting, and motivating me. A very special gratitude goes to Shailendra
Kumar Singh, Anish Parwage (Anna) and Rohit Srivastava for standing beside me
in times of need and for being a pillar of strength for me all throughout. They have
been like the surrogate family to me, bearing the pain of my frustrations and sharing
the moments of success.
I thank my batch-mates: Ashish, Neeraj, Prashant, Srinivas, Satindar, Subrata
and Tapas, Juniors: Ashim, Anirban, Apurva, Newton, Chinmay, Siddharth, Shashi,
Fazlul, Shradha, Ikshu, Manu, Naveen Negi, Kuldeep, Abhay, S. R. Reddy, Daamu,
Arun, Sunil, Aadhi, Monojit, Avdesh, Yashpal and Seniors: Mala, Kirpa Ram, Ra-
biul, Bhaskar, Suman, Vineet, Ashok, Jitendra, Arvind and Tyagi ji for making my
stay at PRL comfortable.
I would not have been possible to complete the long road of PhD without the
freedom provided by my family who always stood by my side with immense sup-
port and encouragement. Words are not enough to express my gratitude towards
my family members. I would like to give my heartfelt thanks to Maina for always
standing beside me to share the moments of happiness as well as antagonistic situa-
tions, and for igniting a strong confidence in me. Last but not the least, life is never
easy without the company of friends, I offer my sincere thanks to Arvind Kumar,
Nitya, Anuj, Manish, Vimal, Rajesh, Moin, Santosh, Satyendra, Umang, Vishwapal
and Bhupesh for showering me with their moral and emotional support in every step
of life.
At the end, I thank all the persons who have helped me during my Ph.D. Thesis.
iii
Abstract
The course of experiments described in thesis are focused to provide insight into
the production of atomic, molecular and mixed clusters from solid and gas, and the
investigation of difference in ionization mechanism of clusters subjected to high in-
tensity photon beam. Carbon cluster sources based on sputtering and laser ablation
are developed to generate a beam of carbon cluster. The formation of carbon clus-
ters in the sooting environment of these sources is confirmed using optical emission
spectroscopy (OES). It is found that the dominant mechanism for cluster formation
in sputtering source is the three body collision between the carbon ejecta and Ar-
gon atoms, and in laser ablation source three body collision is sole responsible for
cluster formation. The detection of clusters heavier than dimer is not possible using
emission spectroscopy due to the unavailability of spectroscopic data. For this pur-
pose, time-of-flight (TOF) mass spectrometry is adopted. The detection of heavy
carbon clusters and mixed clusters of carbon and Argon is confirmed using TOF
technique.
To generate clusters from gas, a pulsed nozzle source is developed. Clusters
from pulsed nozzle source are ionized using IR and UV irradiation of Nd:YAG
laser. Using pulsed nozzle source, Xenon clusters, Ethyl alcohol clusters and mixed
clusters of Ethyl alcohol, Water vapor and Benzene are produced.
Apart from developing the cluster sources, the difference in the ionization mech-
anism of Xenon clusters under IR and UV irradiation is studied. Multi-photon ion-
ization of Xenon clusters produced by pulsed nozzle source has been investigated
under two different wavelength ionization (IR and UV irradiation) using TOF spec-
trometer. Under IR, singly charged cluster ions beyond the dimer are not formed
in the mass spectra, but multiply-charged atomic ions up to charged state 5+ are
present. Under UV, singly charged heavy cluster ions (upto Xe+80) are detected,
but no multiply charged ions are seen in the mass spectrum. The difference in
the ionization mechanism of Xenon clusters is exploited to understand the effect
of cluster size on the formation of multiply charged atomic ions. The cluster size
in the supersonic beam is manipulated by changing the stagnation pressure. The
mean cluster ion size (under UV) shows an increasing trend with the stagnation
iv
pressure. The mean cluster ion size is used as a proxy for neutral clusters. Mass
spectra are recorded under different stagnation pressures with IR irradiation. The
dependence of mean kinetic energy and mean charged state of multiply charged ions
with pressure, or indirectly with the cluster size has been studied. The difference
in ionization mechanism of Xenon clusters provides a tool to investigate the effect
of cluster size on the ionization processes and kinematics of Xenon clusters. This
study also describes the formation of multiply charged atomic ions on the basis of
electron re-collision model.
Keywords: Sputtering, Laser ablation, Supersonic expansion, Optical emission
spectroscopy, Time-of-flight mass spectrometry, Multiphoton ionization, Multiply
charged ions.
v
List of Publications
1. Optical Emission Spectroscopy of Carbon Clusters Produced in a Hollow
Cathode Sputter Source
Arvind Saxena, Prashant Kumar, Swaroop Banerjee, K. P. Subramanian and
Bhas Bapat
Spectroscopy Letters, 2013 (In press).
DOI:10.1080/00387010.2013.783872
Details are discussed in Chapter 3.
2. Dependence of ion kinetic energy and charge on cluster size in multi-photon
ionisation of xenon clusters
Arvind Saxena, Prashant Kumar, S B Banerjee, K P Subramanian, B Bapat,
R K Singh and Ajai Kumar
International Journal of Mass Spectrometry, 2013 (In press).
http://dx.doi.org/10.1016/j.ijms.2013.09.002
Details are discussed in Chapters 4 and 5.
vi
Contents
Acknowledgments i
Abstract iv
1 Introduction 1
1.1 An overview . . . . . . . . . . . . . . . . . . . . . . . . . . . . . . 1
1.2 Issues addressed in the present work . . . . . . . . . . . . . . . . . 3
1.3 Outline of the thesis . . . . . . . . . . . . . . . . . . . . . . . . . . 4
2 Cluster production techniques 5
2.1 Breakdown-based methods . . . . . . . . . . . . . . . . . . . . . . 5
2.2 Aggregation-based methods . . . . . . . . . . . . . . . . . . . . . 11
3 Optical emission spectroscopy of carbon clusters 18
3.1 Optical emission spectroscopy . . . . . . . . . . . . . . . . . . . . 18
3.2 OES investigation of sputtering source . . . . . . . . . . . . . . . . 20
3.3 OES investigation of laser ablation source . . . . . . . . . . . . . . 26
4 Mass spectrometric study of clusters 30
4.1 Time-of-Flight (TOF) Mass Spectrometry . . . . . . . . . . . . . . 30
4.2 Graphite sputtering source . . . . . . . . . . . . . . . . . . . . . . 38
4.3 Clusters from pulsed nozzle source . . . . . . . . . . . . . . . . . . 39
4.4 Molecular and mixed clusters from pulsed nozzle . . . . . . . . . . 46
5 Multiply charged ion formation in MPI of Xenon clusters 49
5.1 IR irradiation: Multiple ionization . . . . . . . . . . . . . . . . . . 49
vii

5.2 Characteristics of atomic ions resulting from MPI of clusters . . . . 52
6 Summary and future prospects 57
6.1 Summary . . . . . . . . . . . . . . . . . . . . . . . . . . . . . . . 57
6.2 Future prospects . . . . . . . . . . . . . . . . . . . . . . . . . . . . 58
Bibliography 60
viii
Chapter 1
Introduction
1.1 An overview
Atomic or molecular clusters are aggregation of a few to million number of atoms or
molecules held together by a binding force. Depending upon the bonding between
atoms in a cluster they are classified into four categories such as ionic clusters, co-
valent clusters, metallic clusters and van der Waals clusters. Atomic and molecular
clusters are often called a new phase of matter since they exhibit properties which
are neither those of the corresponding bulk nor those of their isolated constituents.
This is due to their large value of number of surface atoms to volume atoms ratio.
Among other clusters, carbon clusters play an important role in many branches
of science. Neutral carbon clusters present in the atmospheric soot plays an
important role in the occurrence of heterophase chemical reactions between gas
molecules. From small clusters to large clusters, (such as C60), carbon clusters pro-
vide a good tool to study how material properties evolve. Small carbon clusters play
an important role in astrophysics and combustion [1]. They are expected to play an
important role in the formation, mechanism and properties of cosmic dust [2]. There
is a renewed interest in cluster science due to applications in nanotechnology [2].
Another branch where clusters play a significant role is in heterophase reactions,
such as their use as catalyst in chemical industry. The collision of a cluster with
atoms or molecules may lead to the adsorption of atoms onto the cluster resulting
in the formation of a mixed cluster [3].
1
Chapter 1. Introduction
The size distribution of large neutral clusters cannot be determined experimen-
tally without ionizing them. The general schemes for the ionization of clusters are
CW UV ionization, charged particle impact ionization and multiphoton ionization
(MPI) using high power lasers. Due to poor duty cycles of pulsed cluster sources,
CW UV ionization is generally not used. High energy charged particle impact ion-
ization of weakly bound van der Waals clusters leads to the fragmentation of clus-
ters. For the production of singly charged cluster ions, MPI of clusters is generally
used in the mass spectrometric measurements. In MPI scheme, depending upon the
wavelength various ionization channels in clusters are observed.
The interaction of high intensity photon beam with a cluster is different com-
pared to constituent atom or molecule. It has been found in earlier experiments that
the energy coupling between a target and a short pulse laser is more efficient in case
of a cluster target as compared to an atomic target [4, 5], Ions with kinetic energy
1 MeV has been observed by Ditmire et al. [6, 7] in the ionization of Xe clusters
and formation of multi-keV electron with energies up to 5 keV was observed by
Mcpherson et al. in ionization of Xe clusters [5]. The interaction of a photon beam
with clusters may also lead to the formation of singly charged cluster ions and mul-
tiply charged atomic ions. The ion distribution in such experiments depends upon
the power density and wavelength of laser beam [8–10]. The production of multiply
charged ions using highly intense (1015−1019 Wcm−2) ultrashort laser pulses has
been studied extensively. At such high intensities, heavy cluster ions dissociate to
generate atomic ions and thus singly charged heavy cluster ions are not observed in
the mass spectrum. However at moderate intensities (109− 1011 Wcm−2), largest
Xenon cluster ion of size 16 was reported by a Luo et al. [8]. The size of neutral
clusters play an important role in the formation of ion distribution. It was found
that the formation of highly charged atomic ions depends on the size of the neutral
clusters [8, 10–12].
2
Chapter 1. Introduction
1.2 Issues addressed in the present work
The central theme of the thesis is the development of cluster sources to generate
atomic, molecular and mixed clusters, and to study the interaction of clusters with
atoms and high intensity photon beam. The primary step for the investigations of
cluster-atom and cluster-intense photon beam interaction is the development of ex-
perimental setups for the production and detection of clusters. To generate a cluster
beam from solid as well as from gas, development of cluster sources is essential.
The interaction of carbon clusters with atoms or molecules may lead to several
processes, atoms may get adsorbed onto cluster leading to the formation of mixed
cluster or atoms may carry the excess energy away from cluster leading to cooling
and formation of heavy cluster. In presence of UV radiation, molecules adsorbed
onto the surface of a carbon cluster may initiate a chemical reaction. The study of
such complex heterophase reactions on carbon clusters are not well understood and
demand more attention for the experimental as well as theoretical developments.
The primary step in this direction would be the development of cluster source to
produce a beam of carbon cluster. In the present thesis, development of carbon
cluster source is discussed. Optical emission spectroscopy and time-of-flight mass
spectrometry techniques are used to detect the carbon clusters.
The interaction of clusters with highly intense photon beam may lead to the
formation of multiply charged ions and singly charged cluster ions. The cluster
size plays a crucial role in the formation of multiply charged ions. The cluster
size is generally estimated on the basis of the Hagena’s theory [13]. In the present
thesis, ionization mechanism of Xenon clusters subjected to IR and UV irradiation
of ns pulsed Nd:YAG laser has been studied. The dependence of kinetic energy and
charge state of multiply charged atomic ions on the cluster size has been investigated
and presented in the thesis.
In brief, the following investigations are presented in thesis:
• Optical emission spectroscopic study of carbon soot for the formation of car-
bon clusters
• Production and detection of carbon clusters, Xenon clusters, Ethyl alcohol
3
Chapter 1. Introduction
clusters, mixed clusters composed of carbon and Argon, and Ethyl alcohol,
Benzene and Water vapor.
• Investigation on the interaction of Xenon clusters with IR and UV irradiation
of Nd:YAG laser
• Dependence of mean kinetic energy and charge state of multiply charged ions
on the cluster size.
1.3 Outline of the thesis
The thesis has been organized into seven chapters and the outline of thesis is as
follows. Chapter 1 gives the introduction of the thesis. Chapter 2 provides a brief
detail of methods for the cluster production from solid as well as gas target. The
cluster sources developed on these methods are also discussed in detail. Chapter 3,
4 and 5 include results from the optical emission spectroscopy and mass spectrom-
etry of clusters. In Chapter 3, the optical emission spectroscopic technique used
for the detection of carbon clusters and the emission spectroscopic investigation of
carbon cluster sources are discussed. It contains discussions on the interaction of
the energetic carbon ejecta with the ambient Argon gas as well as the effect of the
experimental parameters of cluster source on the carbon cluster formation. Chapter
4 describes the time-of-flight mass spectrometric technique used for the detection
of heavy cluster ions. Outcomes from the mass spectrometric detection of atomic,
molecular and mixed cluster are discussed in this chapter. Chapter 5 includes the
significant outcomes from the multiphoton ionization of Xe clusters exposed to ns
pulsed IR irradiation. The formation of multiply charged atomic ions has been
briefly discussed on the basis of electron re-collision model. Chapter 7 briefly sum-
marizes the outcomes from the thesis. It also briefly outlines the possibilities for
further study .
4
Chapter 2
Cluster production techniques
2.1 Breakdown-based methods
Clusters can be generated from solid by breaking it into miniature fragments. Frag-
mentation of solid can be achieved by imparting adequate energy, greater than the
binding energy of atoms in solid. In order to fracture a solid surface and to produce
clusters, there are basically two methods, namely, sputtering and laser ablation.
In general, ions can be either from an accelerator [14–16] or from the plasma
generated in low pressure ambient [17, 18]. The cluster source based on ion bom-
bardment is known as hollow cathode sputtering source. Plasma ion bombardment
is a very simple technique as compared to the ion bombardment from an accelerator.
The ion bombardment technique is generally employed for either generating
ions or for thin film deposition. For producing a beam of neutral clusters, laser
ablation technique accompanied by supersonic expansion is generally used. In this
method, intense laser pulse is focused on to a target. The ejecta in plasma plume is
cooled by a synchronized high pressure gas pulse.
Plasma ion sputtering
The first experimental observation of sputtering by low energy ion bombardment
was by Wehner et al. in 1953 [19]. In D.C. discharge plasma ion sputtering, an
inert gas is passed between two electrodes. Cathode is made from the material
5
Chapter 2. Methods of cluster production
Electron
Gas cation
Atom
+
-V
++ + +Gas
Pumping
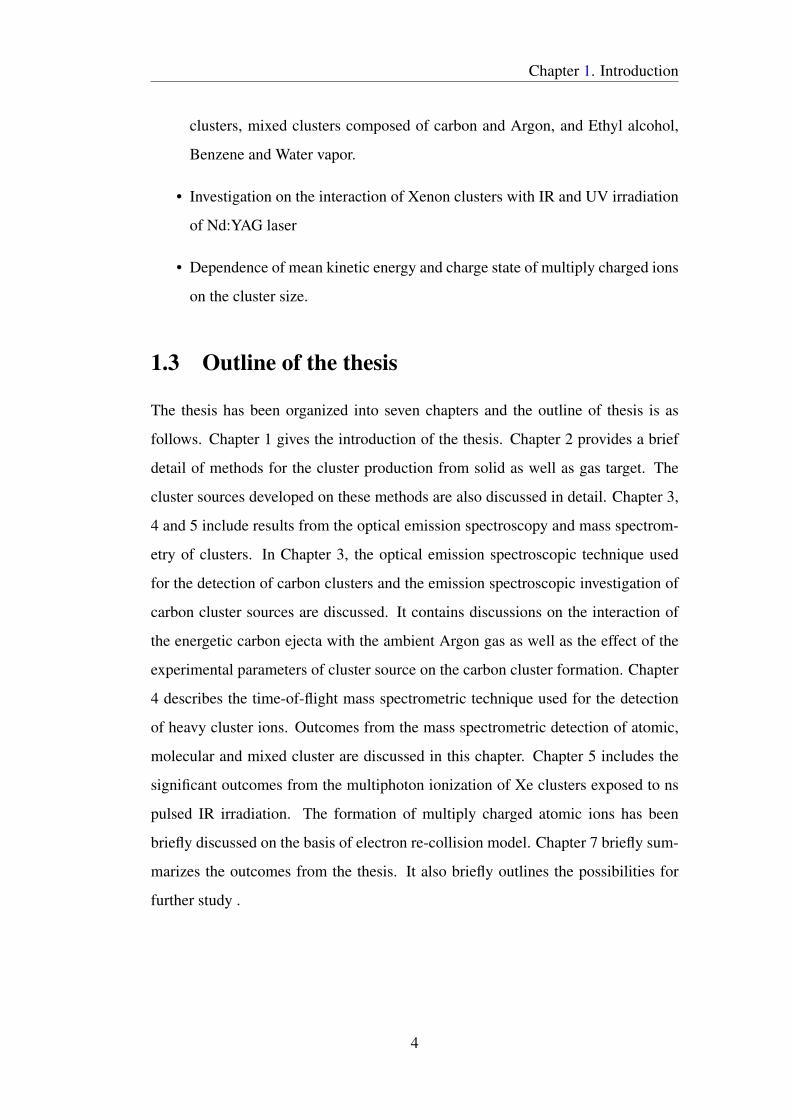
Figure 2.1: Schematic diagram of D.C. discharge sputtering source. The dashed line rep-resents the vacuum enclosure. Gas enters between the electrodes made from the materialof interest. Due to the applied field, breakdown of gas occurs resulting in the formation ofplasma. Cation from the plasma strikes the cathode and atoms, molecules and clusters areejected from the surface.
of interest and is negatively biased. The bombardment of energetic cations on the
cathode surface results in the ejection of energetic atoms, electrons and clusters.
This ejection process from the solid surface is known as sputtering. The energy
of cations plays a crucial role in sputtering. The minimum energy required for
sputtering depends on the surface binding energy of solid. The number of atoms
sputtered with respect to an ion bombardment is generally known as sputter yield.
A schematic diagram for D.C. discharge sputtering is shown in Figure (2.1).
The sputtering source generates a mixture of neutral and ionized clusters [18,
20–22]. For producing a beam of neutral clusters, cooling of sputtered species as
well as a jet formation is essential. Sputtering source is generally used either for
thin film deposition or for cluster ion production. To generate a beam of neutral
clusters, modifications in the design of sputtering source is required.
Hollow cathode sputtering source
Hollow cathode sputtering sources are considered to be very efficient sources for
creating the sooting environment which can lead to the formation of carbon clusters
6
Chapter 2. Methods of cluster production
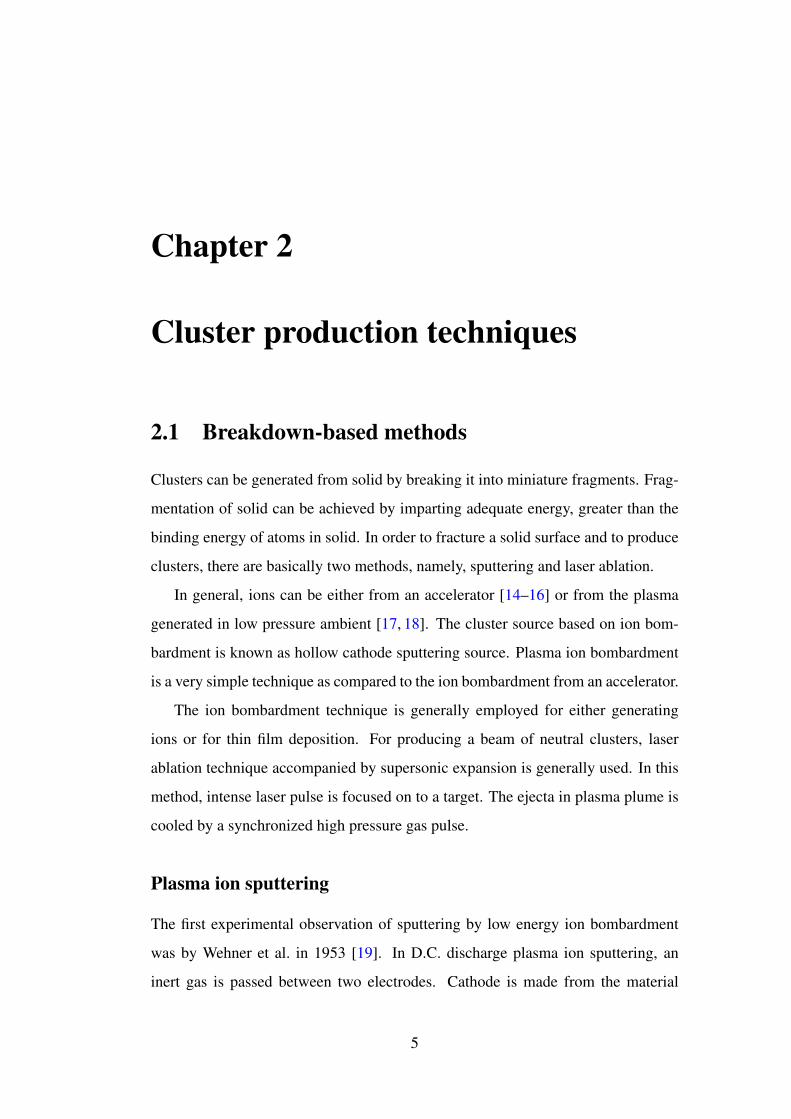
Figure 2.2: Schematic diagram of the hollow cathode carbon cluster source. The sputteringregion is 4 mm in length and 4 mm in diameter; the figure is approximately to scale. Thesource resides entirely in vacuum, the vacuum coupling being made via a KF-40 flangewhich serves as the (grounded) anode and has a provision for admitting gas. High voltageconnection to the cathode is made via an auxiliary electrical feedthrough.
[18, 23]. The sputtering sources are bulky in size and they are used for thin film
deposition [24,25], spectroscopic study of the soot [26] and production of ions [18].
In order to generate a beam of neutral clusters, significant modifications are needed.
We have implemented the modifications in the design of cluster source which makes
it more versatile, in terms of beam production, than other sources [17, 18].
A schematic diagram of the carbon cluster source is shown in Figure (2.2). The
cluster source is made from graphite and is in the form of a cylinder with an axial
cavity of 4 mm length and 4 mm diameter. Graphite is kept at a negative voltage of
0.5–1.2 kV and works as a cathode. The cathode is axially coupled via a ceramic
spacer to an aluminium flange. It is grounded and acts as an anode. An ambient
Argon atmosphere at a pressure of 1.0–3.5 mbar, monitored using a Pirani gauge,
is maintained within the cavity to ensure a stable discharge. Differential pumping
is maintained in the source chamber. The cluster beam is extracted by a skimmer
of 1.0 mm aperture. The source chamber is pumped by a turbo pump (210 ls−1),
backed by a rotary and Roots pump. The lowest pressure obtained in the source
chamber is 5 ×10⁻⁶ mbar.
The source is compact (25 mm in length and 38 mm in diameter) compared to
7
Chapter 2. Methods of cluster production
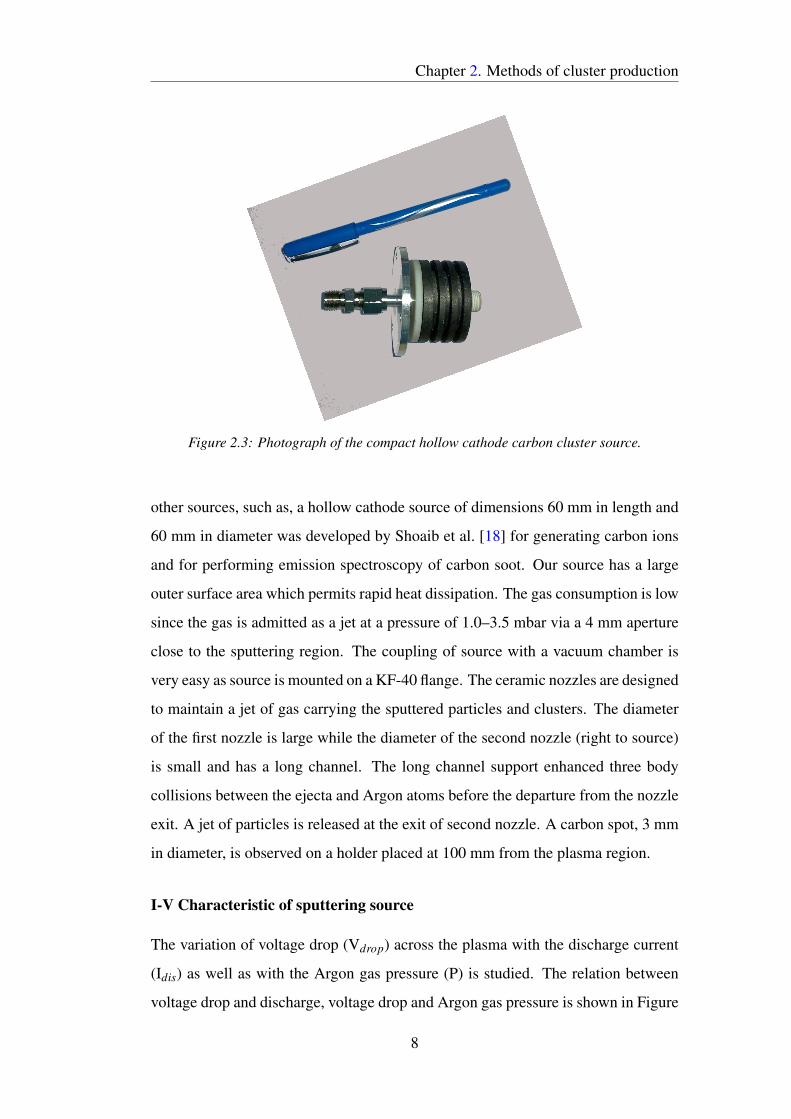
Figure 2.3: Photograph of the compact hollow cathode carbon cluster source.
other sources, such as, a hollow cathode source of dimensions 60 mm in length and
60 mm in diameter was developed by Shoaib et al. [18] for generating carbon ions
and for performing emission spectroscopy of carbon soot. Our source has a large
outer surface area which permits rapid heat dissipation. The gas consumption is low
since the gas is admitted as a jet at a pressure of 1.0–3.5 mbar via a 4 mm aperture
close to the sputtering region. The coupling of source with a vacuum chamber is
very easy as source is mounted on a KF-40 flange. The ceramic nozzles are designed
to maintain a jet of gas carrying the sputtered particles and clusters. The diameter
of the first nozzle is large while the diameter of the second nozzle (right to source)
is small and has a long channel. The long channel support enhanced three body
collisions between the ejecta and Argon atoms before the departure from the nozzle
exit. A jet of particles is released at the exit of second nozzle. A carbon spot, 3 mm
in diameter, is observed on a holder placed at 100 mm from the plasma region.
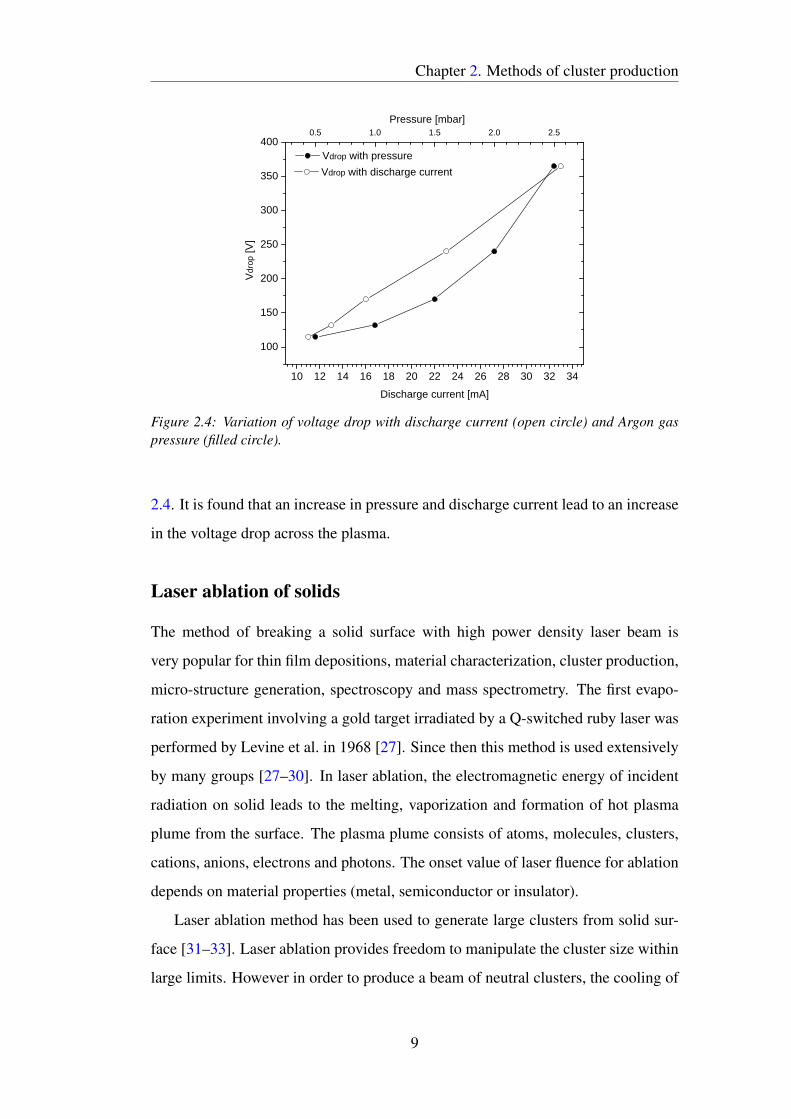
I-V Characteristic of sputtering source
The variation of voltage drop (Vdrop) across the plasma with the discharge current
(Idis) as well as with the Argon gas pressure (P) is studied. The relation between
voltage drop and discharge, voltage drop and Argon gas pressure is shown in Figure
8
Chapter 2. Methods of cluster production
0.5 1.0 1.5 2.0 2.5
Pressure [mbar]
Vdrop with pressure
10 12 14 16 18 20 22 24 26 28 30 32 34
100
150
200
250
300
350
400
Vdr
op [V
]
Discharge current [mA]
Vdrop with discharge current
Figure 2.4: Variation of voltage drop with discharge current (open circle) and Argon gaspressure (filled circle).
2.4. It is found that an increase in pressure and discharge current lead to an increase
in the voltage drop across the plasma.
Laser ablation of solids
The method of breaking a solid surface with high power density laser beam is
very popular for thin film depositions, material characterization, cluster production,
micro-structure generation, spectroscopy and mass spectrometry. The first evapo-
ration experiment involving a gold target irradiated by a Q-switched ruby laser was
performed by Levine et al. in 1968 [27]. Since then this method is used extensively
by many groups [27–30]. In laser ablation, the electromagnetic energy of incident
radiation on solid leads to the melting, vaporization and formation of hot plasma
plume from the surface. The plasma plume consists of atoms, molecules, clusters,
cations, anions, electrons and photons. The onset value of laser fluence for ablation
depends on material properties (metal, semiconductor or insulator).
Laser ablation method has been used to generate large clusters from solid sur-
face [31–33]. Laser ablation provides freedom to manipulate the cluster size within
large limits. However in order to produce a beam of neutral clusters, the cooling of
9
Chapter 2. Methods of cluster production
hot ejecta in the plasma plume is essential. For this purpose, a combination of laser
ablation and high pressure gas is widely used by many groups [31–35].
Laser ablation source
Laser ablation source accompanied by high pressure gas expansion is a very popular
technique for producing clusters from solid. The first laser vaporization source was
developed in 1981 by R. E. Smalley and his co-workers at Rice University [36]. The
versatility of Smalley source has proven to be quite remarkable. For the efficient
cooling of plasma plume, a channel is often provided in the laser ablation source.
The channel brings gas at the point of ablation. The Smalley group proposed an
improved design of the ablation source for the cluster formation. They introduced
a waiting room for the ablated species. In their design, there is a section of reduced
channel diameter followed by an extended diameter exit. The gas undergoes rapid
collisions with the plume ejecta before exit from the channel. Thus rate of three
body collisions is higher with this design leading to production of larger clusters.
The discovery of C60 was using this source by Smalley et al. [31]. It was found that
the deposition of ablated species inside the channel of cluster source may affect the
cluster formation [32]. To prevent the degradation of cluster formation, de Heer et
al. proposed an improved and compact design in which they introduced a cavity for
the plume confinement. The channel was designed so that gas turbulence prevails
leading to enormous collisions between ejecta and gas and formation of clusters
[32].
Owing to the simplicity and advantage of rapid collisions for cluster formation
in cluster source by de Heer et al. , a cluster source based on this design is developed
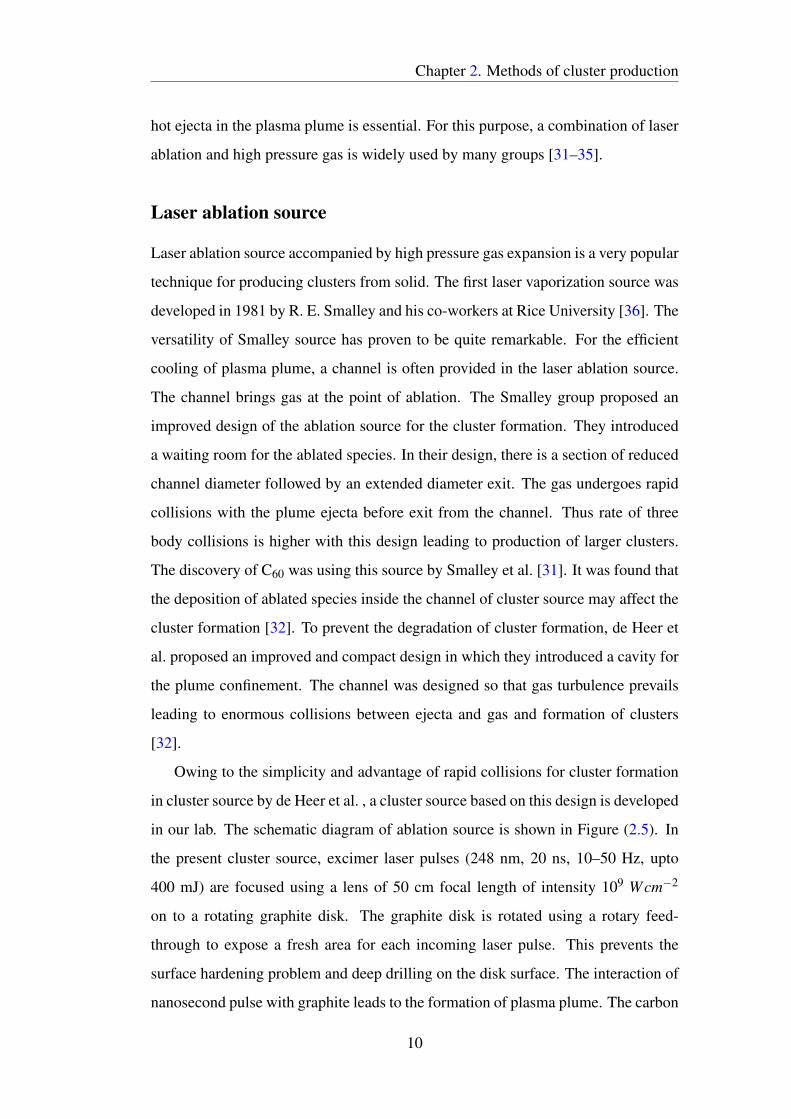
in our lab. The schematic diagram of ablation source is shown in Figure (2.5). In
the present cluster source, excimer laser pulses (248 nm, 20 ns, 10–50 Hz, upto
400 mJ) are focused using a lens of 50 cm focal length of intensity 109 Wcm−2
on to a rotating graphite disk. The graphite disk is rotated using a rotary feed-
through to expose a fresh area for each incoming laser pulse. This prevents the
surface hardening problem and deep drilling on the disk surface. The interaction of
nanosecond pulse with graphite leads to the formation of plasma plume. The carbon
10
Chapter 2. Methods of cluster production
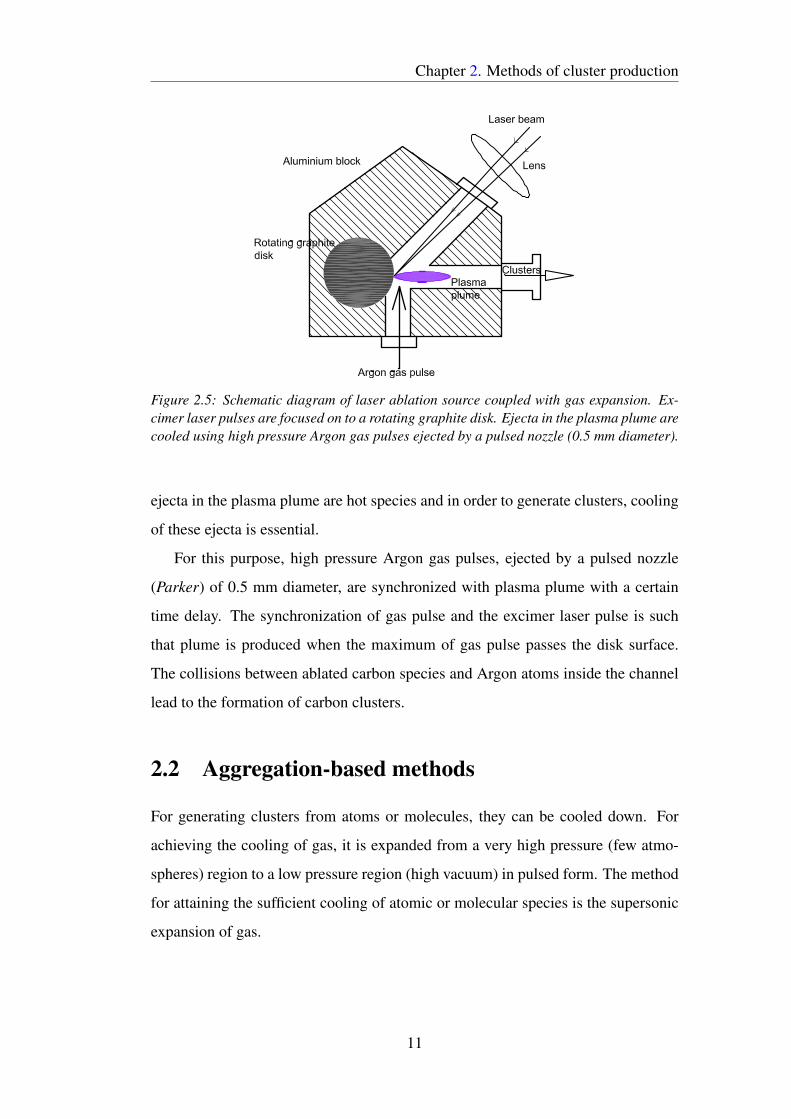
Figure 2.5: Schematic diagram of laser ablation source coupled with gas expansion. Ex-cimer laser pulses are focused on to a rotating graphite disk. Ejecta in the plasma plume arecooled using high pressure Argon gas pulses ejected by a pulsed nozzle (0.5 mm diameter).
ejecta in the plasma plume are hot species and in order to generate clusters, cooling
of these ejecta is essential.
For this purpose, high pressure Argon gas pulses, ejected by a pulsed nozzle
(Parker) of 0.5 mm diameter, are synchronized with plasma plume with a certain
time delay. The synchronization of gas pulse and the excimer laser pulse is such
that plume is produced when the maximum of gas pulse passes the disk surface.
The collisions between ablated carbon species and Argon atoms inside the channel
lead to the formation of carbon clusters.
2.2 Aggregation-based methods
For generating clusters from atoms or molecules, they can be cooled down. For
achieving the cooling of gas, it is expanded from a very high pressure (few atmo-
spheres) region to a low pressure region (high vacuum) in pulsed form. The method
for attaining the sufficient cooling of atomic or molecular species is the supersonic
expansion of gas.
11
Chapter 2. Methods of cluster production
Supersonic expansion of gas
Supersonic beam is characterized by a quantity which is the ratio of average flow
velocity of atoms (v) to the local speed of sound (vs). This quantity is known as
Mach number (M). For an expansion to be supersonic, M should be greater than 1.
M =vvs
= v√
mγRT
(2.1)
here v is average flow the velocity of atoms, vs is the local speed of sound, R is gas
constant, T is the temperature in the stagnation region, m is the molar mass . The
maximum terminal velocity (vmax) of an ideal gas for an isentropic nozzle expansion
can be calculated by employing first law of thermodynamics.
vmax =
√2CpT
m(2.2)
The specific heat (Cp) at constant pressure is given as,
Cp =
(γ
γ−1
)R (2.3)
Therefore the maximum terminal velocity can be given as,
vmax =
√2RT
m× γ
γ−1= vmp×
√γ
γ−1(2.4)
where R is gas constant, T is the temperature in the stagnation region, m is the
molar mass and Cp is the heat capacity at constant pressure, γ is ratio of specific
heat, T is local translational temperature and vmp is the most probable Maxwellian
speed in the reservoir.
When atoms having mean free path λ in an enclosure expands through an aper-
ture of diameter d in a regime λ << d, atoms escaping from the aperture suffer
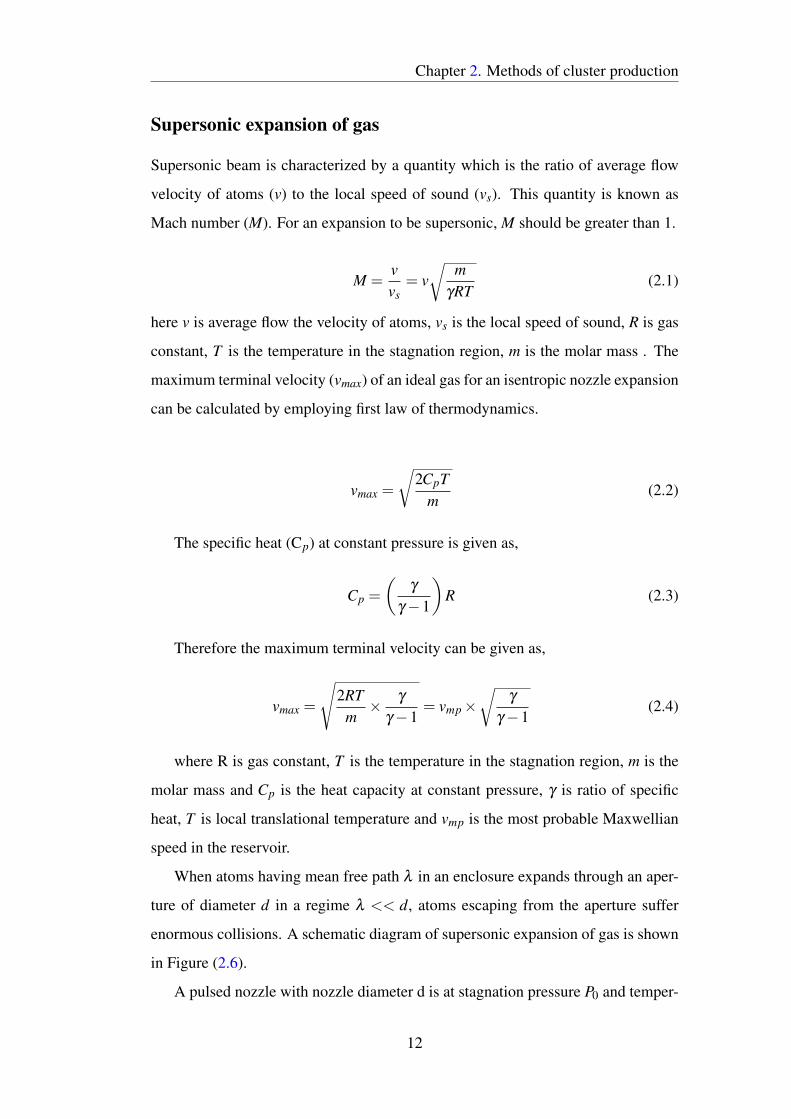
enormous collisions. A schematic diagram of supersonic expansion of gas is shown
in Figure (2.6).
A pulsed nozzle with nozzle diameter d is at stagnation pressure P0 and temper-
12
Chapter 2. Methods of cluster production
Pumping
Figure 2.6: Schematic diagram of supersonic expansion of gas from a pulsed nozzle.Source: M. Barr et al. Meas. Sci. Technol. 23, 105901 (2012).
ature T0. It ejects gas pulses from high pressure (few atmosphere to several atmo-
sphere) reservoir into a low background pressure (Pb) environment. The adiabatic
expansion of gas triggers collision cascade between the atoms leading to cooling
and cluster formation. Thus the random thermal energy of particle is converted in
to directed kinetic energy.
After the ejection of gas pulse from pulsed nozzle, gas enters into a region where
the velocity of atoms exceeds the local speed of sound and M > 1, this region is
known as silence zone. The boundary of this zone is called as Mach disk.
Beyond the Mach disk location the local speed of sound overcomes the velocity
of atoms and M becomes less than 1. To avoid the scattering and attenuation of
cluster beam the dense core of beam must be extracted before it crosses the Mach
disk. The core of beam is generally extracted by putting a skimmer before Mach
disk location. The position of Mach disk depends only on the ratio of stagnation
pressure to background pressure (P0/Pb) and the nozzle diameter (d). The location
of Mach disk (Xm) is given in equation 2.5.
13
Chapter 2. Methods of cluster production
Xm = 0.67d√
P0/Pb (2.5)
Nozzle geometry influences the cluster formation. Cluster formation occurs in
the vicinity of nozzle aperture, within few nozzle aperture distance. It was inves-
tigated experimentally that growth of cluster, in the vicinity of nozzle aperture, is
influenced by different nozzle geometries, but beyond the clustering region expan-
sion is identical for all nozzle shape [13,37]. Thus, nozzle shape has great influence
on the clustering of atoms occurring close to the nozzle exit.
Cluster formation in supersonic expansion
The first observation of cluster formation was in an experiment of gas dynamics
expansion of atoms conducted by Becker et al. (1956) [38]. This method has further
been used by many groups to generate weakly bound clusters from different gaseous
atoms or molecules [8–10, 13, 39–43]. Cluster formation in free jet expansion has
led to great advancement in understanding the weakly bound ensembles of atoms
or molecules. The translational cooling rely on binary collisions and total number
of binary collisions during the expansion is proportional to the P0d. For cluster
formation, the primary process is the production of a dimer by condensation of
monomer via three body collisions with third body carrying the excess energy. The
total number of three body collisions between the atoms during the expansion is
proportional to P20d whereas mass throughput is proportional to P0d2.
The stagnation pressure, temperature of gas, nozzle size and its geometry affect
the average cluster size in a gas jet [44]. The onset of cluster formation and the
average cluster size can be estimated using Hagena’s parameter [13]. The Hagena
parameter (Γ∗) is defined as
Γ∗ = k
(d/tanα)0.85
T 2.29 p0 (2.6)
Where d is the diameter of pulsed nozzle (µm), α is the half angle of expansion,
p0 is the stagnation pressure (mbar) and k is an empirical constant which depends
on type of gas (k = 5500 for Xe, 2890 for Kr, 1650 for Ar, 185 for Ne, and 3.85 for
14

Chapter 2. Methods of cluster production
He [45]). Clustering begins when Γ∗ > 1000 [42]. The formation of large clusters
(> 104 atoms per cluster) begins when Γ∗ > 5×10⁴ [42].
To generate clusters from atomic or molecular vapor, it is mixed with a carrier
gas. The carrier gas is, generally, an inert non-condensible gas such as He or Ne
[46]. Other carrier gas can also be used but in that case condensation of atoms from
solution may get affected by the excess heat released from the clustering of carrier
gas. The technique of vapor mixing in a carrier gas is used to generate molecular
and mixed clusters. The production of mixed clusters from different gas species is
studied in many experiments [47–49]. Mixed clusters are generally produced in the
supersonic expansion when the interaction energy between two atoms of injected
sample is not very different from the interaction energy between injected sample
atom and carrier gas atom [3].
Pulsed nozzle source
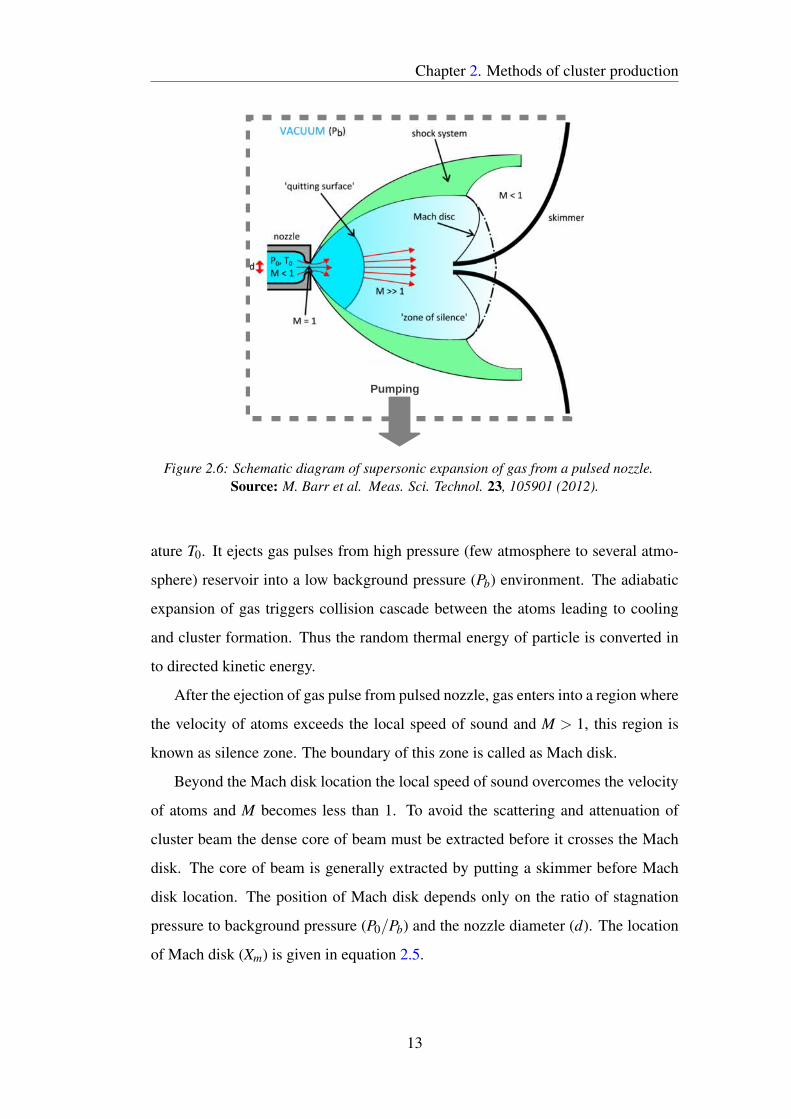
A pulsed nozzle source based on the supersonic expansion of gas is developed. The
schematic diagram is shown in Figure (2.7). For the pressure conditions of present
pulsed nozzle source, Mach number (M) is greater than 1, it ensures the validity
of supersonic expansion. In present source, high pressure (1-8 bar) gas pulses,
either Argon or Xenon, are injected by a pulsed nozzle (Parker, series 9) of 0.5 mm
nozzle diameter into a low background pressure chamber (2×10⁻⁶mbar). The gas
pulse duration is set to 300µs and repetition rate at 30 Hz for all measurements.
The core of cluster beam is extracted by a home made aluminium skimmer with
1.2 mm aperture. In the present setup at 3 bar of stagnation pressure, the Mach disk
is located at 366 mm from the pulsed nozzle. For ensuring the absence of shock
waves during the supersonic expansion in present setup, the beam is extracted by
placing a skimmer at 20 mm from the pulsed valve. It was found that the positioning
of skimmer far from 20 mm distance degrade the beam quality.
The pulsed valve was mounted in a six way cross chamber with a stainless steel
quarter inch pipe via top ISO-63 flange. The bottom CF-63 flange is coupled to a
mass spectrometer via an aluminium barrel with base serving as a gasket. The barrel
accommodates a skimmer on the top face with four screws. The top ISO-63 flange
15
Chapter 2. Methods of cluster production
Cluster beam
Skimmer
Pulsed nozzle
2 × 10⁻³mbar
2-8 bar 1mm
Pumping
Source chamber
Figure 2.7: Schematic diagram of pulsed nozzle source for producing clusters from gas.Dashed line represents a vacuum enclosure. The cluster beam produced by nozzle is ex-tracted by a skimmer of 1.2 mm aperture.
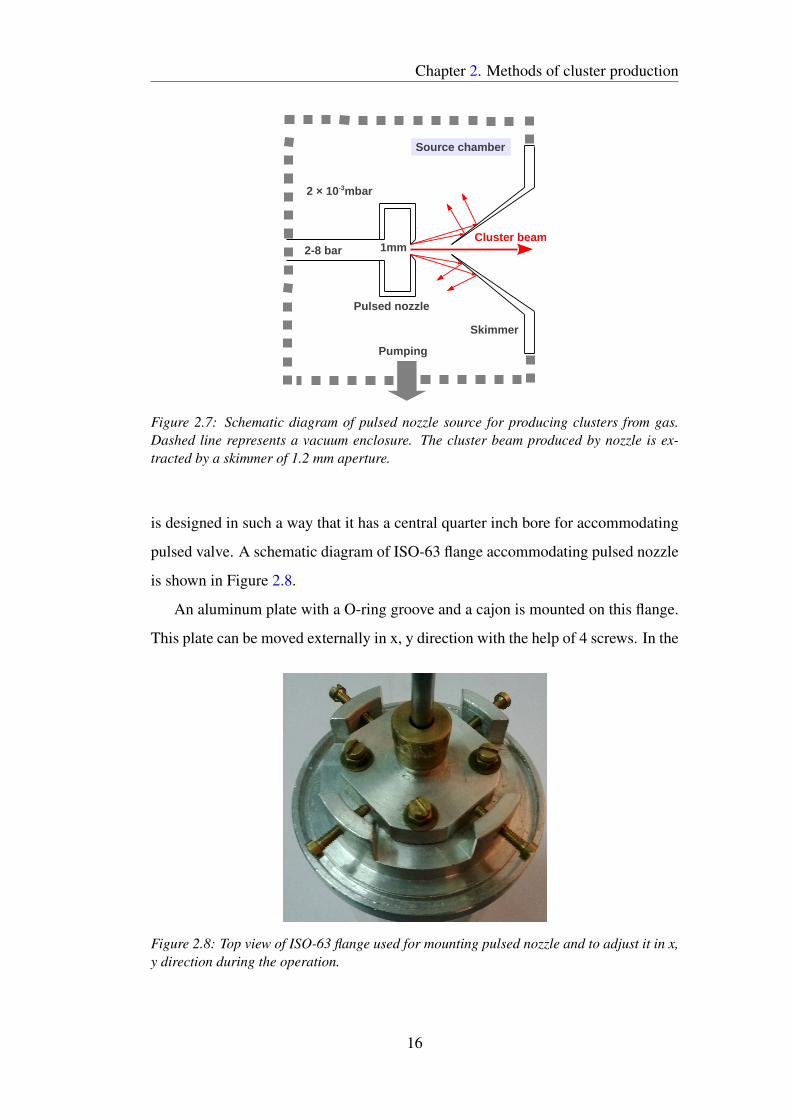
is designed in such a way that it has a central quarter inch bore for accommodating
pulsed valve. A schematic diagram of ISO-63 flange accommodating pulsed nozzle
is shown in Figure 2.8.
An aluminum plate with a O-ring groove and a cajon is mounted on this flange.
This plate can be moved externally in x, y direction with the help of 4 screws. In the
Figure 2.8: Top view of ISO-63 flange used for mounting pulsed nozzle and to adjust it in x,y direction during the operation.
16
Chapter 2. Methods of cluster production
present setup, the pulsed valve mount is designed in such a way that it has a great
freedom to move the pulsed valve, for aligning with the skimmer, even during the
operation.
The electrical connection for pulsed valve is done by using an auxiliary KF-
25 electrical feed-through. A turbo pump (230ls−1) backed by a scroll pump is
incorporated for creating vacuum via a ISO-100 flange. A Penning gauge (Edwards)
is used to monitor the pressure in source chamber. The minimum pressure achieved
in the source chamber is 2×10⁻⁶ mbar.
With the aim of the production of a carbon cluster beam, cluster sources based
on plasma ion sputtering and laser ablation are discussed. A pulsed nozzle source
based on the supersonic expansion of gas is developed to generate clusters from
gas. In the next two Chapters, optical emission spectroscopy and time-of-flight
mass spectrometry of clusters are discussed.
17
Chapter 3
Optical emission spectroscopy of
carbon clusters
3.1 Optical emission spectroscopy
It is discussed in Chapter 2 that sputtering source and laser ablation source are
used to generate a beam of carbon clusters. In both sources, sooting environment
is necessary for the production of carbon clusters. The energetic carbon ejecta in
hollow cathode sputtering source and laser ablation source emit characteristic radi-
ation during de-excitation. Due to the suitability and simplicity of optical emission
spectroscopy, this technique is adopted to detect carbon clusters from the sooting
environment of cluster sources.
Basic principle
The emission spectrum of a chemical element is an electromagnetic spectrum at dis-
crete wavelengths due to the transition of electrons in an atom from higher energy
energy level to the lower energy level. Each chemical element emits distinctive set
of discrete wavelengths, and the elemental composition of the unknown sample can
be easily determined by observing these wavelengths. Thus detection of the emit-
ted radiation is a simple method for the identification of the atomic or molecular
ejecta. The basic components of an emission spectrometer include monochroma-
18
Chapter 3. Optical emission spectroscopy of carbon clusters
tor or wavelength selector and a photon detector, generally, photomultiplier tube or
charged couple device (CCD). The photon source in present case is hollow cath-
ode sputtering source or laser ablation source, wavelength selector is a diffraction
grating, and photon detector is a CCD.
Optical emission spectrometer
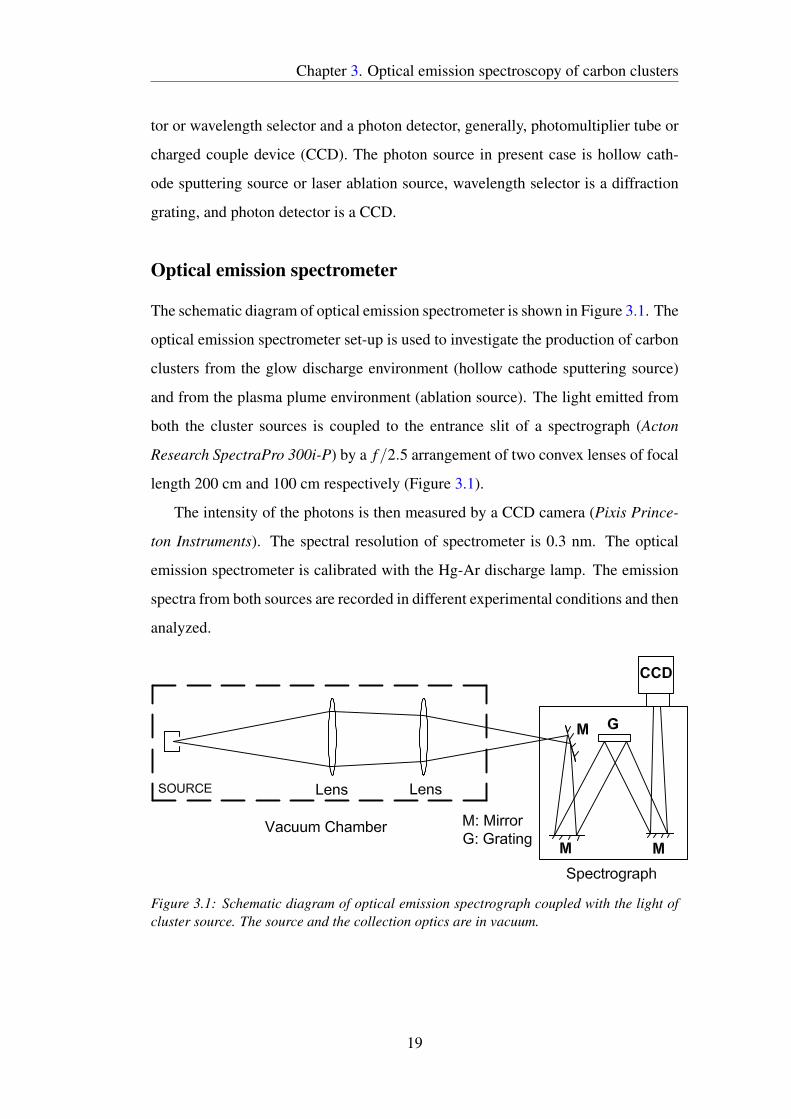
The schematic diagram of optical emission spectrometer is shown in Figure 3.1. The
optical emission spectrometer set-up is used to investigate the production of carbon
clusters from the glow discharge environment (hollow cathode sputtering source)
and from the plasma plume environment (ablation source). The light emitted from
both the cluster sources is coupled to the entrance slit of a spectrograph (Acton
Research SpectraPro 300i-P) by a f/2.5 arrangement of two convex lenses of focal
length 200 cm and 100 cm respectively (Figure 3.1).
The intensity of the photons is then measured by a CCD camera (Pixis Prince-
ton Instruments). The spectral resolution of spectrometer is 0.3 nm. The optical
emission spectrometer is calibrated with the Hg-Ar discharge lamp. The emission
spectra from both sources are recorded in different experimental conditions and then
analyzed.
Figure 3.1: Schematic diagram of optical emission spectrograph coupled with the light ofcluster source. The source and the collection optics are in vacuum.
19
Chapter 3. Optical emission spectroscopy of carbon clusters
3.2 OES investigation of sputtering source
In the present study, optical emission spectroscopy is used to detect carbon clusters
in hollow cathode source. The formation of carbon clusters can be either by ejection
from graphite surface due to plasma ion bombardment or by the three body colli-
sion between the atomic ejecta and ambient gas atoms. The understanding of the
competitive process for the cluster production as well as control over Tvib with gas
pressure can help to control the cluster yield by tuning the discharge parameters,
such as, discharge current and gas pressure.
Emission spectra from sputtering source
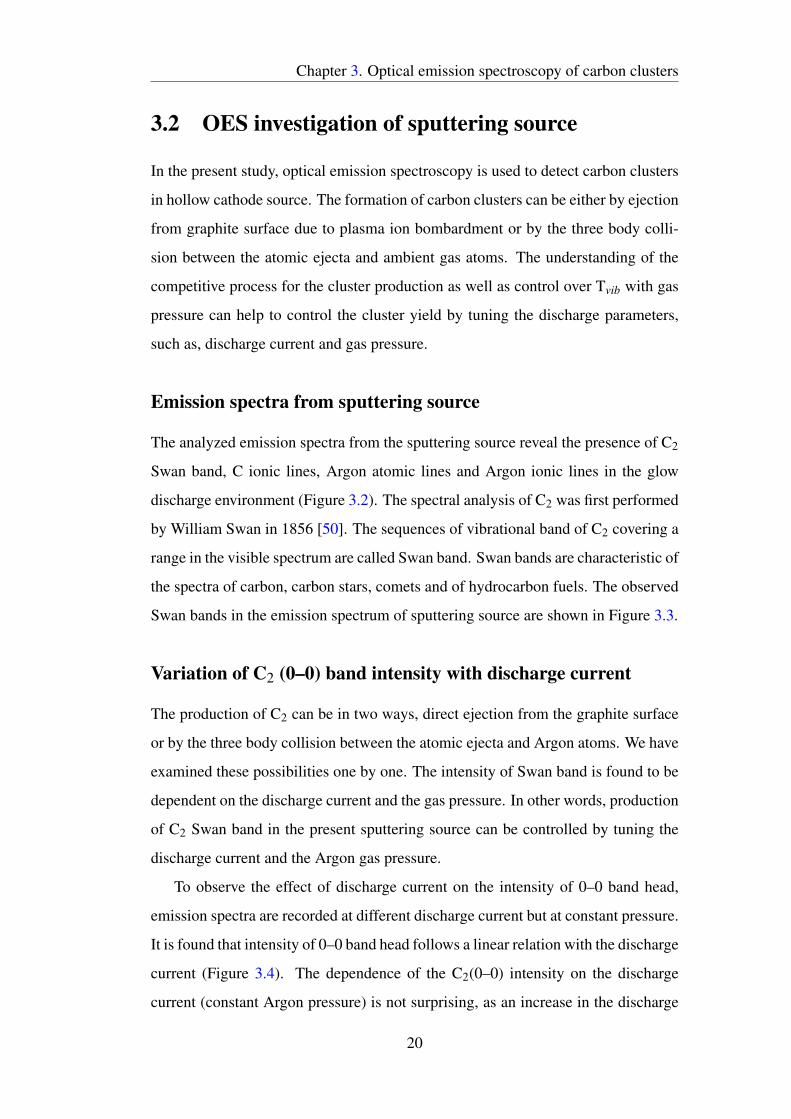
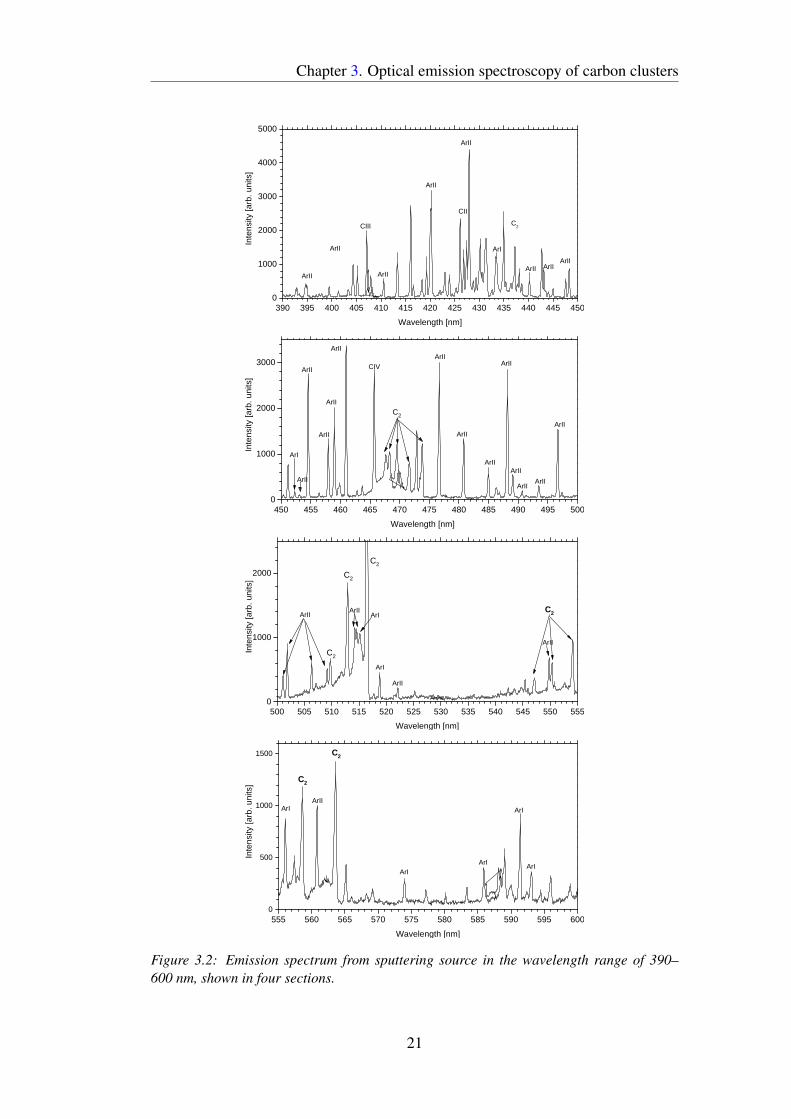
The analyzed emission spectra from the sputtering source reveal the presence of C2
Swan band, C ionic lines, Argon atomic lines and Argon ionic lines in the glow
discharge environment (Figure 3.2). The spectral analysis of C2 was first performed
by William Swan in 1856 [50]. The sequences of vibrational band of C2 covering a
range in the visible spectrum are called Swan band. Swan bands are characteristic of
the spectra of carbon, carbon stars, comets and of hydrocarbon fuels. The observed
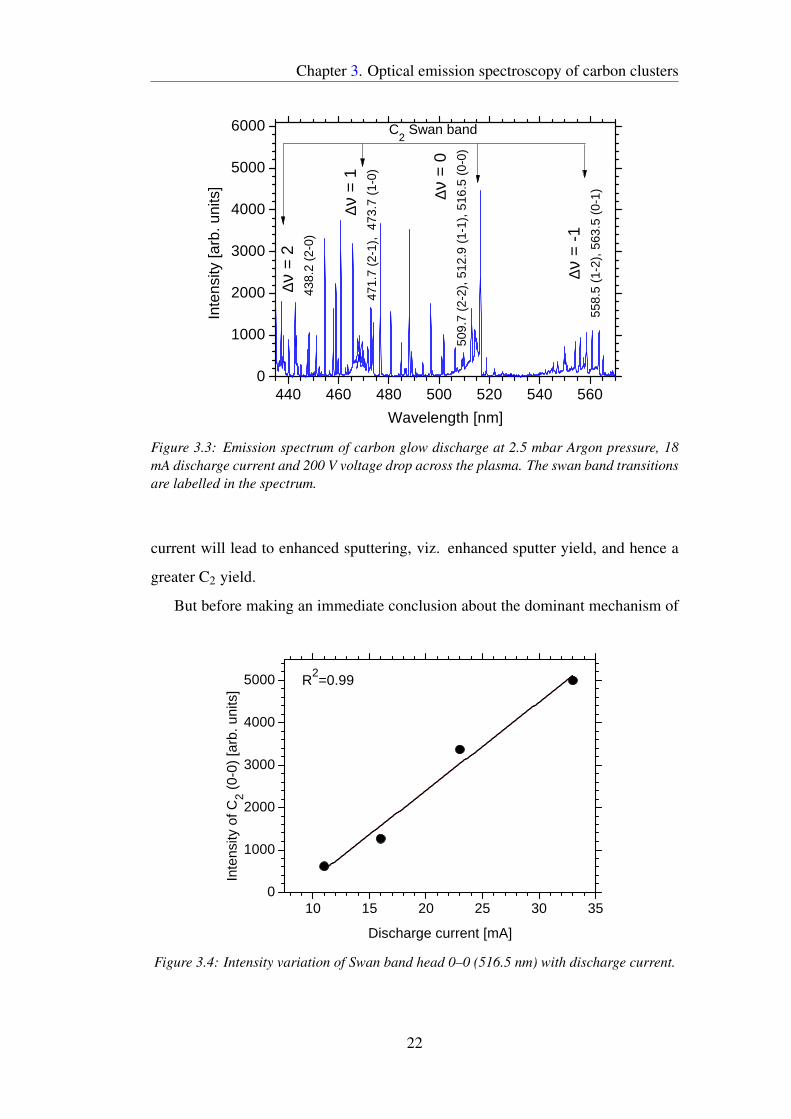
Swan bands in the emission spectrum of sputtering source are shown in Figure 3.3.
Variation of C2 (0–0) band intensity with discharge current
The production of C2 can be in two ways, direct ejection from the graphite surface
or by the three body collision between the atomic ejecta and Argon atoms. We have
examined these possibilities one by one. The intensity of Swan band is found to be
dependent on the discharge current and the gas pressure. In other words, production
of C2 Swan band in the present sputtering source can be controlled by tuning the
discharge current and the Argon gas pressure.
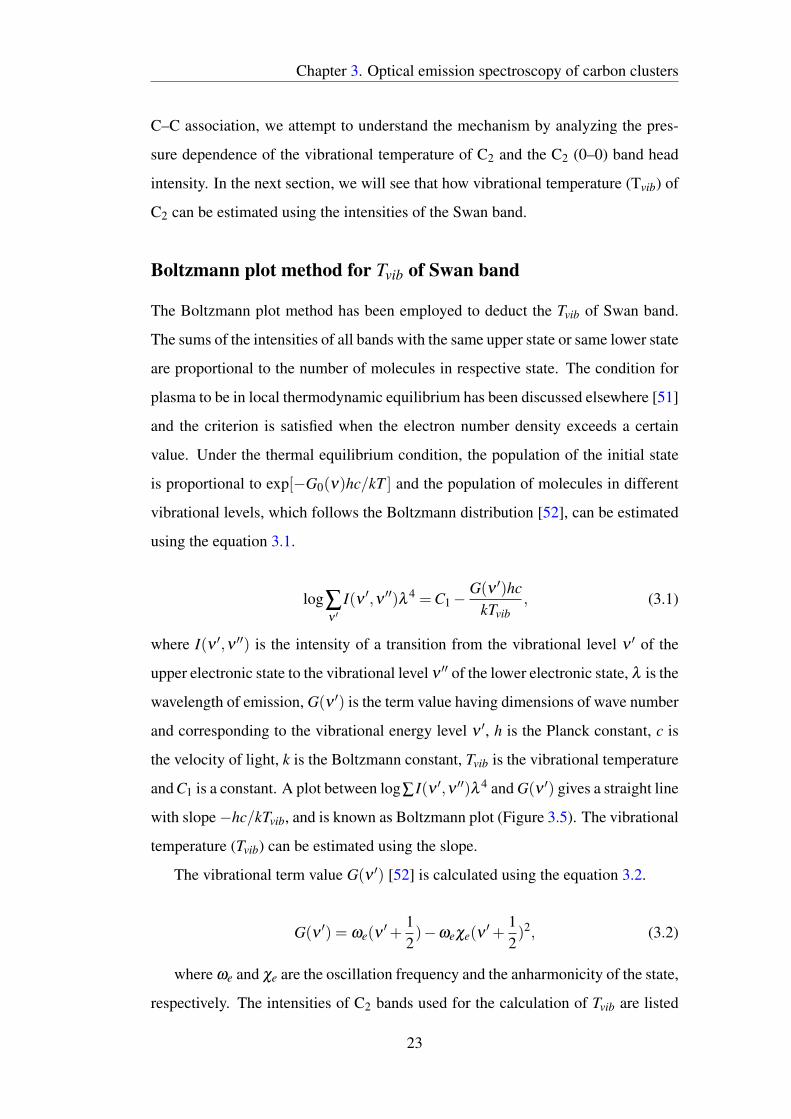
To observe the effect of discharge current on the intensity of 0–0 band head,
emission spectra are recorded at different discharge current but at constant pressure.
It is found that intensity of 0–0 band head follows a linear relation with the discharge
current (Figure 3.4). The dependence of the C2(0–0) intensity on the discharge
current (constant Argon pressure) is not surprising, as an increase in the discharge
20
Chapter 3. Optical emission spectroscopy of carbon clusters
390 395 400 405 410 415 420 425 430 435 440 445 4500
1000
2000
3000
4000
5000
ArII
ArII
ArIIArII
ArI
ArII
C2
CII
CIII
ArII
ArIIArII
Inte
nsity
[arb
. uni
ts]
Wavelength [nm]
450 455 460 465 470 475 480 485 490 495 5000
1000
2000
3000
ArIIArII
ArIIArII
ArII
ArII
ArII
ArIIArII
ArII
ArI
ArII
C2
CIV
ArII
Inte
nsity
[arb
. uni
ts]
Wavelength [nm]
ArII
500 505 510 515 520 525 530 535 540 545 550 5550
1000
2000
C2
C2
C2
ArII
ArII
ArI
C2
ArIIArII ArI
Inte
nsity
[arb
. uni
ts]
Wavelength [nm]
555 560 565 570 575 580 585 590 595 6000
500
1000
1500
ArI
C2
ArI
ArI
ArI
C2
ArII
ArI
Inte
nsity
[arb
. uni
ts]
Wavelength [nm]
Figure 3.2: Emission spectrum from sputtering source in the wavelength range of 390–600 nm, shown in four sections.
21
Chapter 3. Optical emission spectroscopy of carbon clusters
440 460 480 500 520 540 5600
1000
2000
3000
4000
5000
6000
∆ν
= 2
438.
2 (2
-0)
∆
ν =
1 4
71.7
(2-
1),
473.
7 (1
-0)
∆
ν =
050
9.7
(2-2
), 5
12.9
(1-
1), 5
16.5
(0-
0)
∆
ν =
-1
558.
5 (1
-2),
563
.5 (
0-1)
Inte
nsity
[arb
. uni
ts]
Wavelength [nm]
C2 Swan band
Figure 3.3: Emission spectrum of carbon glow discharge at 2.5 mbar Argon pressure, 18mA discharge current and 200 V voltage drop across the plasma. The swan band transitionsare labelled in the spectrum.
current will lead to enhanced sputtering, viz. enhanced sputter yield, and hence a
greater C2 yield.
But before making an immediate conclusion about the dominant mechanism of
10 15 20 25 30 350
1000
2000
3000
4000
5000
Inte
nsity
of C
2 (0-
0) [a
rb. u
nits
]
Discharge current [mA]
R2=0.99
Figure 3.4: Intensity variation of Swan band head 0–0 (516.5 nm) with discharge current.
22
Chapter 3. Optical emission spectroscopy of carbon clusters
C–C association, we attempt to understand the mechanism by analyzing the pres-
sure dependence of the vibrational temperature of C2 and the C2 (0–0) band head
intensity. In the next section, we will see that how vibrational temperature (Tvib) of
C2 can be estimated using the intensities of the Swan band.
Boltzmann plot method for Tvib of Swan band
The Boltzmann plot method has been employed to deduct the Tvib of Swan band.
The sums of the intensities of all bands with the same upper state or same lower state
are proportional to the number of molecules in respective state. The condition for
plasma to be in local thermodynamic equilibrium has been discussed elsewhere [51]
and the criterion is satisfied when the electron number density exceeds a certain
value. Under the thermal equilibrium condition, the population of the initial state
is proportional to exp[−G0(ν)hc/kT ] and the population of molecules in different
vibrational levels, which follows the Boltzmann distribution [52], can be estimated
using the equation 3.1.
log∑ν ′
I(ν ′,ν ′′)λ 4 =C1−G(ν ′)hc
kTvib, (3.1)
where I(ν ′,ν ′′) is the intensity of a transition from the vibrational level ν ′ of the
upper electronic state to the vibrational level ν ′′ of the lower electronic state, λ is the
wavelength of emission, G(ν ′) is the term value having dimensions of wave number
and corresponding to the vibrational energy level ν ′, h is the Planck constant, c is
the velocity of light, k is the Boltzmann constant, Tvib is the vibrational temperature
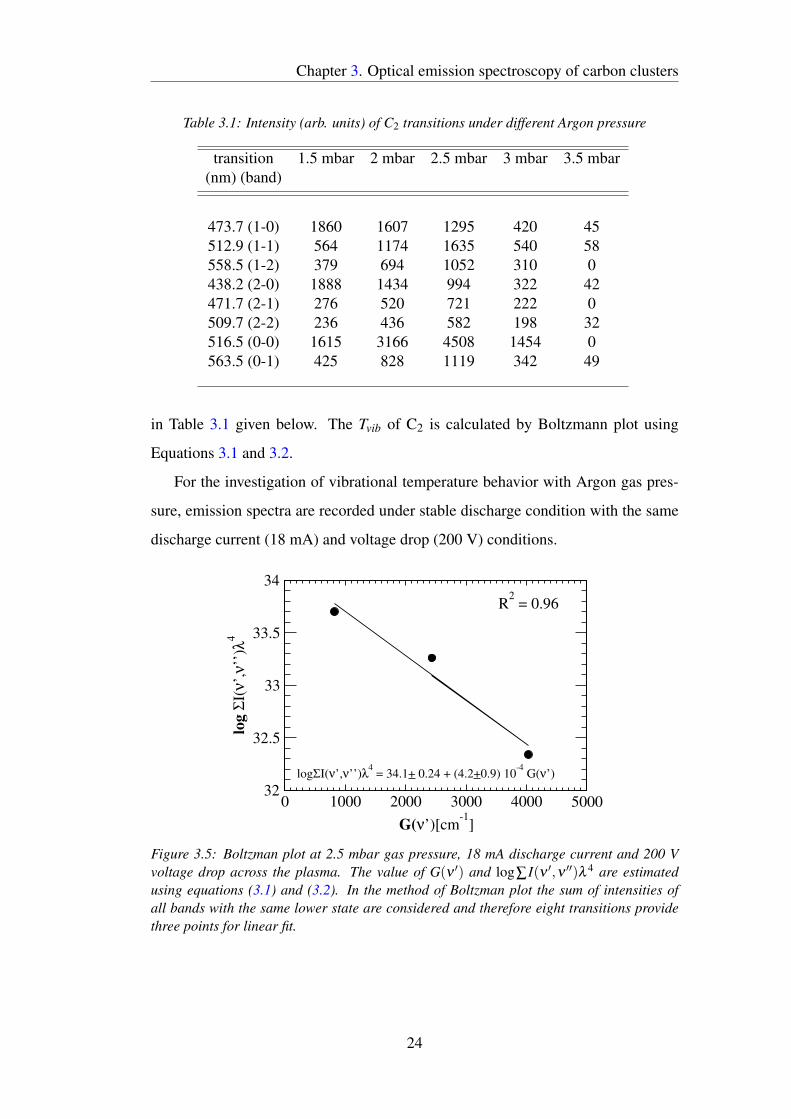
and C1 is a constant. A plot between log∑ I(ν ′,ν ′′)λ 4 and G(ν ′) gives a straight line
with slope−hc/kTvib, and is known as Boltzmann plot (Figure 3.5). The vibrational
temperature (Tvib) can be estimated using the slope.
The vibrational term value G(ν ′) [52] is calculated using the equation 3.2.
G(ν ′) = ωe(ν′+
12)−ωeχe(ν
′+12)2, (3.2)
where ωe and χe are the oscillation frequency and the anharmonicity of the state,
respectively. The intensities of C2 bands used for the calculation of Tvib are listed
23
Chapter 3. Optical emission spectroscopy of carbon clusters
Table 3.1: Intensity (arb. units) of C2 transitions under different Argon pressure
transition 1.5 mbar 2 mbar 2.5 mbar 3 mbar 3.5 mbar(nm) (band)
473.7 (1-0) 1860 1607 1295 420 45512.9 (1-1) 564 1174 1635 540 58558.5 (1-2) 379 694 1052 310 0438.2 (2-0) 1888 1434 994 322 42471.7 (2-1) 276 520 721 222 0509.7 (2-2) 236 436 582 198 32516.5 (0-0) 1615 3166 4508 1454 0563.5 (0-1) 425 828 1119 342 49
in Table 3.1 given below. The Tvib of C2 is calculated by Boltzmann plot using
Equations 3.1 and 3.2.
For the investigation of vibrational temperature behavior with Argon gas pres-
sure, emission spectra are recorded under stable discharge condition with the same
discharge current (18 mA) and voltage drop (200 V) conditions.
0 1000 2000 3000 4000 5000
G(ν’)[cm-1
]
32
32.5
33
33.5
34
log
ΣI(
ν’,
ν’’
)λ4
logΣI(ν’,ν’’)λ4 = 34.1+ 0.24 + (4.2+0.9) 10
-4 G(ν’)
R2 = 0.96
Figure 3.5: Boltzman plot at 2.5 mbar gas pressure, 18 mA discharge current and 200 Vvoltage drop across the plasma. The value of G(ν ′) and log∑ I(ν ′,ν ′′)λ 4 are estimatedusing equations (3.1) and (3.2). In the method of Boltzman plot the sum of intensities ofall bands with the same lower state are considered and therefore eight transitions providethree points for linear fit.
24
Chapter 3. Optical emission spectroscopy of carbon clusters
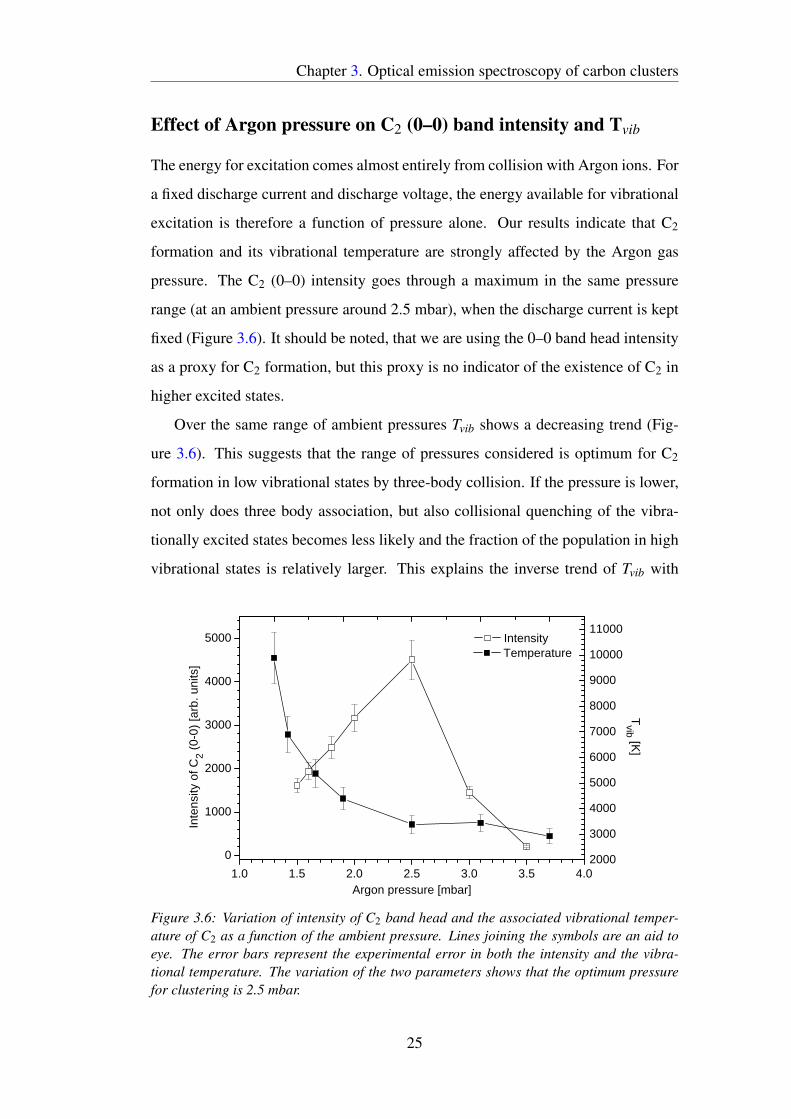
Effect of Argon pressure on C2 (0–0) band intensity and Tvib
The energy for excitation comes almost entirely from collision with Argon ions. For
a fixed discharge current and discharge voltage, the energy available for vibrational
excitation is therefore a function of pressure alone. Our results indicate that C2
formation and its vibrational temperature are strongly affected by the Argon gas
pressure. The C2 (0–0) intensity goes through a maximum in the same pressure
range (at an ambient pressure around 2.5 mbar), when the discharge current is kept
fixed (Figure 3.6). It should be noted, that we are using the 0–0 band head intensity
as a proxy for C2 formation, but this proxy is no indicator of the existence of C2 in
higher excited states.
Over the same range of ambient pressures Tvib shows a decreasing trend (Fig-
ure 3.6). This suggests that the range of pressures considered is optimum for C2
formation in low vibrational states by three-body collision. If the pressure is lower,
not only does three body association, but also collisional quenching of the vibra-
tionally excited states becomes less likely and the fraction of the population in high
vibrational states is relatively larger. This explains the inverse trend of Tvib with
1.0 1.5 2.0 2.5 3.0 3.5 4.0
0
1000
2000
3000
4000
5000
2000
3000
4000
5000
6000
7000
8000
9000
10000
11000 Intensity
Tvib [K
]
Inte
nsity
of C
2 (0-
0) [a
rb. u
nits
]
Argon pressure [mbar]
Temperature
Figure 3.6: Variation of intensity of C2 band head and the associated vibrational temper-ature of C2 as a function of the ambient pressure. Lines joining the symbols are an aid toeye. The error bars represent the experimental error in both the intensity and the vibra-tional temperature. The variation of the two parameters shows that the optimum pressurefor clustering is 2.5 mbar.
25
Chapter 3. Optical emission spectroscopy of carbon clusters
pressure.
We have repeated our experiment with N2 ambient, instead of Argon, and in that
experiment we observed intense emission corresponding to the C–N (0–0) band,
but not the C–C (0–0) band. Under identical conditions of discharge current and
ambient pressure, the C–N emission (under nitrogen ambient) is at least an order of
magnitude higher than the C2 Swan band (under Argon ambient). The appearance
of the CN band can be understood as arising from a C–N2 three-body association,
while the suppression of C–C association in N2 ambient could be because the three-
body association preferentially leads to C–N association at the expense of C–C
association. This gives credence to the inference, that three-body association is the
dominant mode of clustering in the present set-up.
3.3 OES investigation of laser ablation source
The interaction of high intensity laser pulse (109 Wcm−2) with solid surface lead to
the formation of plasma plume. The ejecta in the plume are hot species and in order
to form clusters, they need to be cooled down. High pressure gas pulses may serve
this purpose. The laser pulse and gas pulse should be synchronized such that there
must be an overlap between the plume and gas pulse. The collisions between the
gas atoms and carbon ejecta may lead to the production of clusters.
The primary process in cluster formation is the production of a dimer by three
body collision. The yield of clusters heavier than dimer strongly depends upon the
yield of a dimer. In this section, formation of carbon clusters resulting from the
interaction of ablated carbon atoms with ambient Argon atoms is discussed. The
effect of the type of gas, delay and gas pulse duration on cluster formation are also
points of discussion.
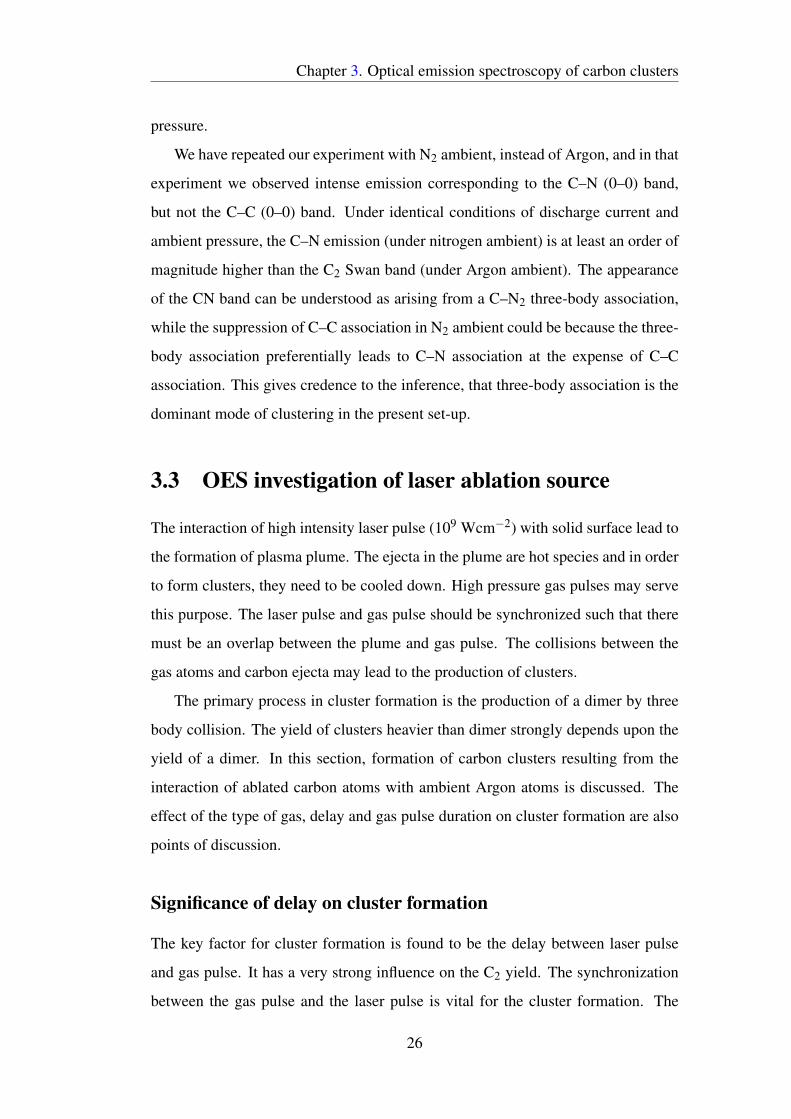
Significance of delay on cluster formation
The key factor for cluster formation is found to be the delay between laser pulse
and gas pulse. It has a very strong influence on the C2 yield. The synchronization
between the gas pulse and the laser pulse is vital for the cluster formation. The
26
Chapter 3. Optical emission spectroscopy of carbon clusters
1 2 3 4 5 6 7 8200
240
280
320
360
400
440
480
Inte
nsity
of C
2 (0-
0) [a
rb. u
nits
]
Delay [ms]
Figure 3.7: Intensity variation of Swan band head 0–0 (516.5 nm) with the delay betweengas pulse and laser pulse.
synchronization need to be such that plasma plume should be produced when the
peak of the gas pulse passes the target surface. We have systematically changed the
delay for maximum C2 yield. The optimized delay for maximum C2 yield is found
to be 1.8 ms in the present source. The variation of C2 (0–0) Swan band head with
the delay is shown in Figure 3.7.
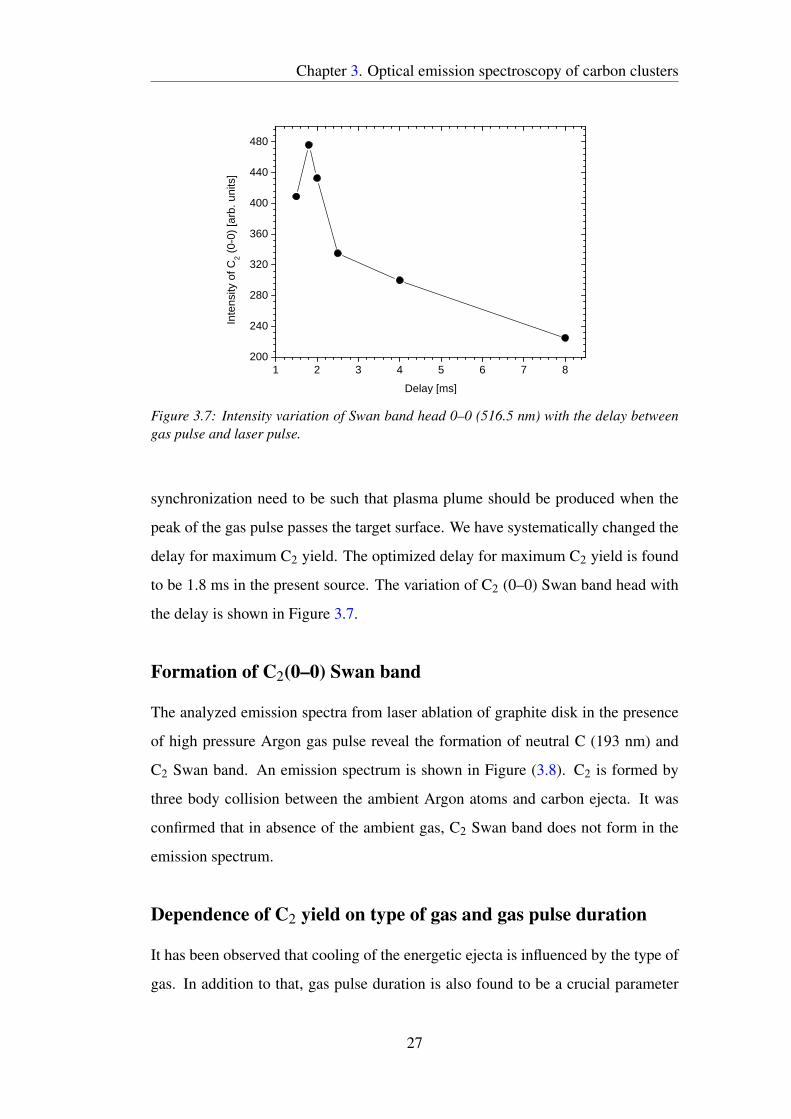
Formation of C2(0–0) Swan band
The analyzed emission spectra from laser ablation of graphite disk in the presence
of high pressure Argon gas pulse reveal the formation of neutral C (193 nm) and
C2 Swan band. An emission spectrum is shown in Figure (3.8). C2 is formed by
three body collision between the ambient Argon atoms and carbon ejecta. It was
confirmed that in absence of the ambient gas, C2 Swan band does not form in the
emission spectrum.
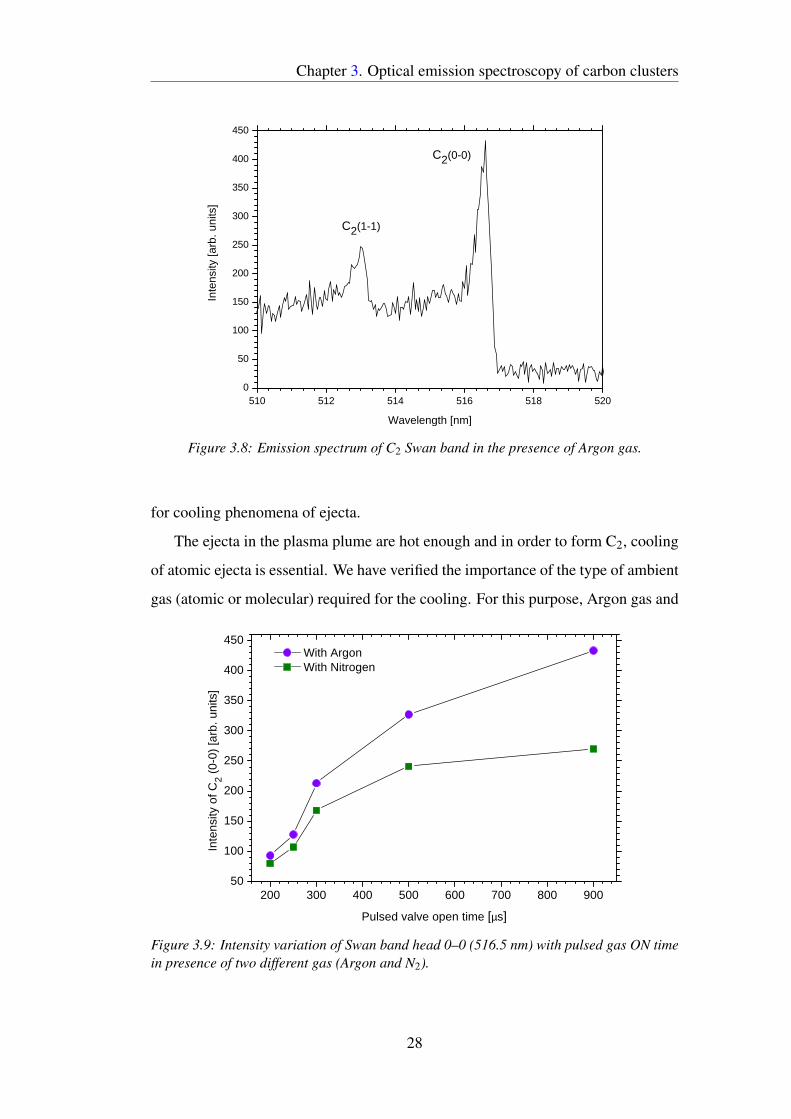
Dependence of C2 yield on type of gas and gas pulse duration
It has been observed that cooling of the energetic ejecta is influenced by the type of
gas. In addition to that, gas pulse duration is also found to be a crucial parameter
27
Chapter 3. Optical emission spectroscopy of carbon clusters
510 512 514 516 518 5200
50
100
150
200
250
300
350
400
450
C2(1-1)
Inte
nsity
[arb
. uni
ts]
Wavelength [nm]
C2(0-0)
Figure 3.8: Emission spectrum of C2 Swan band in the presence of Argon gas.
for cooling phenomena of ejecta.
The ejecta in the plasma plume are hot enough and in order to form C2, cooling
of atomic ejecta is essential. We have verified the importance of the type of ambient
gas (atomic or molecular) required for the cooling. For this purpose, Argon gas and
200 300 400 500 600 700 800 90050
100
150
200
250
300
350
400
450 With Argon With Nitrogen
Inte
nsity
of C
2 (0-
0) [a
rb. u
nits
]
Pulsed valve open time [µs]
Figure 3.9: Intensity variation of Swan band head 0–0 (516.5 nm) with pulsed gas ON timein presence of two different gas (Argon and N2).
28
Chapter 3. Optical emission spectroscopy of carbon clusters
N2 gas have been used to cool down the atomic ejecta in plume. It is observed that
cooling is more prominent under Argon gas environment than N2 gas (Figure 3.9).
It has also been found that the intensity of C2 increases with the gas pulse duration
(ON time), as the number density of ambient gas also increases (Figure 3.9).
As a concluding remark of this chapter, control over the formation of C2 in
hollow cathode sputtering source and laser ablation source would be helpful for
performing the mass spectrometric study of carbon clusters. The mass spectrometric
analysis from these sources are discussed in the chapter 4.
29
Chapter 4
Mass spectrometric study of clusters
4.1 Time-of-Flight (TOF) Mass Spectrometry
Optical emission spectroscopy has been used to detect carbon clusters in the soot-
ing environment. But emission spectroscopy has its own limitation as not more
than carbon dimer can be detected due to the unavailability of spectroscopic infor-
mation. Thus for detecting large mass clusters, time-of-flight (TOF) mass spectro-
metric technique is our choice because it is suitable for a continuous beam source
(sputtering source) as well as for a pulsed source (laser ablation and pulsed noz-
zle). In time-of-flight mass spectrometer (TOFMS), there is no upper mass limit
provided a suitable ionization method is used, a complete mass spectrum can be
recorded with very fast speed (within µs), and its efficiency depends on the elec-
tronic settings rather than depending on the mechanical alignment and formation of
uniform and stable magnetic fields.
Working principle
The most common TOFMS configuration is Wiley-McLaren [53] type. The
schematic diagram of a two field Wiley-McLaren TOFMS is shown in Figure 4.1.
Ions are produced in the first region, this region is called the interaction region.
Ions are pushed in to the second region by applied electric field (Es). The second
region is called acceleration region, ions are pushed by the applied field (Ed) into
30

Chapter 4. Mass spectrometric study of clusters
Figure 4.1: Schematic diagram of TOF mass spectrometer. The blue circle represents theionization volume, red dashed line represents the plane for incoming ionizing beam andtarget beam. First plate (r) is used to repel ions and second plate (p) is used to push theions towards the detector. The plates have high transmission meshes.
a region which is field free and is known as the drift region. Ions are separated in
the field free region according to their mass to charge ratio. Thus TOFMS is used
for separating ions according to their mass to charge ratio by measuring their flight
time.
Ions are produced either by a continuous ionizing source or by a pulsed ionizing
source. The flight time measurement of ions is either triggered by the detection of
electron, produced due to ionization, or by the pulse from the ionizing source (such
time reference is derived from electron pulse or laser pulse) and is stopped by the
ion detection. When the flight time measurement is carried out using electron as
start and ion as stop, the TOFMS is said to be operated in electron-ion coincidence
mode and when the flight time measurement is triggered by the ionizing pulse then
the TOFMS is said to be operated in pulsed mode.
Detectors
For the detection of ions and electrons, microchannel plate (MCP) and channeltron
electron multiplier (CEM) detectors are generally used. Both the detectors work
on the principle of electron multiplication. The schematic diagrams of a two stage
MCP (known as Chevron MCP) is shown in Figure 4.2. A MCP is made from
highly resistive material and is an array of millions of miniature electron multipliers
oriented parallel to one another [54]. Each channel can be considered as a separate
31
Chapter 4. Mass spectrometric study of clusters
Ion hitting MCP
Metallic anodeOutput
-V
Secondary electrons
R1
R2
MCP 1
MCP 2
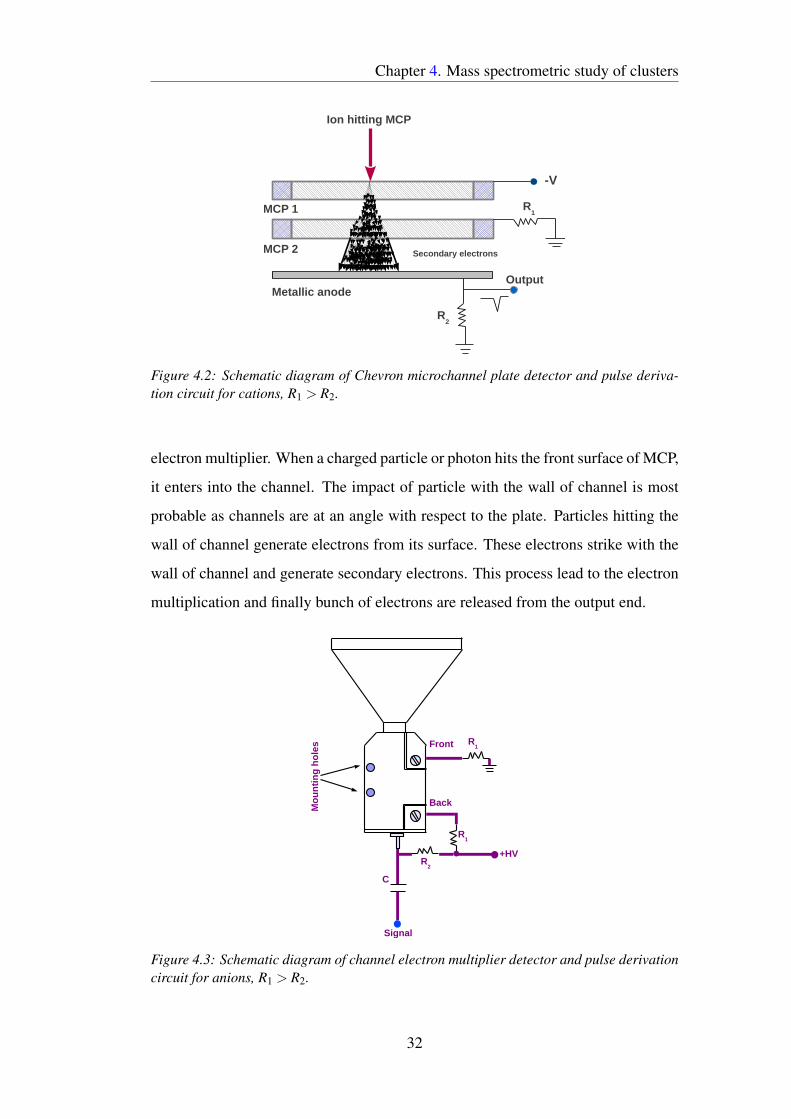
Figure 4.2: Schematic diagram of Chevron microchannel plate detector and pulse deriva-tion circuit for cations, R1 > R2.
electron multiplier. When a charged particle or photon hits the front surface of MCP,
it enters into the channel. The impact of particle with the wall of channel is most
probable as channels are at an angle with respect to the plate. Particles hitting the
wall of channel generate electrons from its surface. These electrons strike with the
wall of channel and generate secondary electrons. This process lead to the electron
multiplication and finally bunch of electrons are released from the output end.
Mo
un
tin
g h
ole
s
Signal
Front
Back
+HV
R1
R2
C
R1
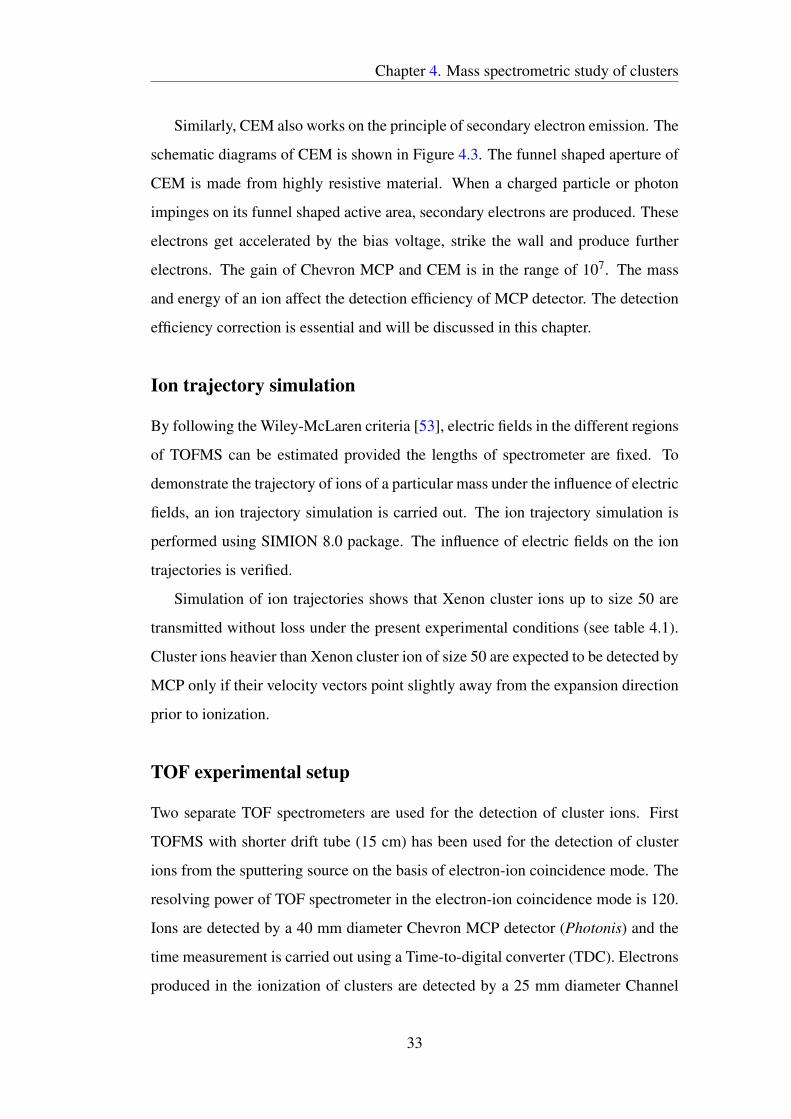
Figure 4.3: Schematic diagram of channel electron multiplier detector and pulse derivationcircuit for anions, R1 > R2.
32
Chapter 4. Mass spectrometric study of clusters
Similarly, CEM also works on the principle of secondary electron emission. The
schematic diagrams of CEM is shown in Figure 4.3. The funnel shaped aperture of
CEM is made from highly resistive material. When a charged particle or photon
impinges on its funnel shaped active area, secondary electrons are produced. These
electrons get accelerated by the bias voltage, strike the wall and produce further
electrons. The gain of Chevron MCP and CEM is in the range of 107. The mass
and energy of an ion affect the detection efficiency of MCP detector. The detection
efficiency correction is essential and will be discussed in this chapter.
Ion trajectory simulation
By following the Wiley-McLaren criteria [53], electric fields in the different regions
of TOFMS can be estimated provided the lengths of spectrometer are fixed. To
demonstrate the trajectory of ions of a particular mass under the influence of electric
fields, an ion trajectory simulation is carried out. The ion trajectory simulation is
performed using SIMION 8.0 package. The influence of electric fields on the ion
trajectories is verified.
Simulation of ion trajectories shows that Xenon cluster ions up to size 50 are
transmitted without loss under the present experimental conditions (see table 4.1).
Cluster ions heavier than Xenon cluster ion of size 50 are expected to be detected by
MCP only if their velocity vectors point slightly away from the expansion direction
prior to ionization.
TOF experimental setup
Two separate TOF spectrometers are used for the detection of cluster ions. First
TOFMS with shorter drift tube (15 cm) has been used for the detection of cluster
ions from the sputtering source on the basis of electron-ion coincidence mode. The
resolving power of TOF spectrometer in the electron-ion coincidence mode is 120.
Ions are detected by a 40 mm diameter Chevron MCP detector (Photonis) and the
time measurement is carried out using a Time-to-digital converter (TDC). Electrons
produced in the ionization of clusters are detected by a 25 mm diameter Channel
33
Chapter 4. Mass spectrometric study of clusters
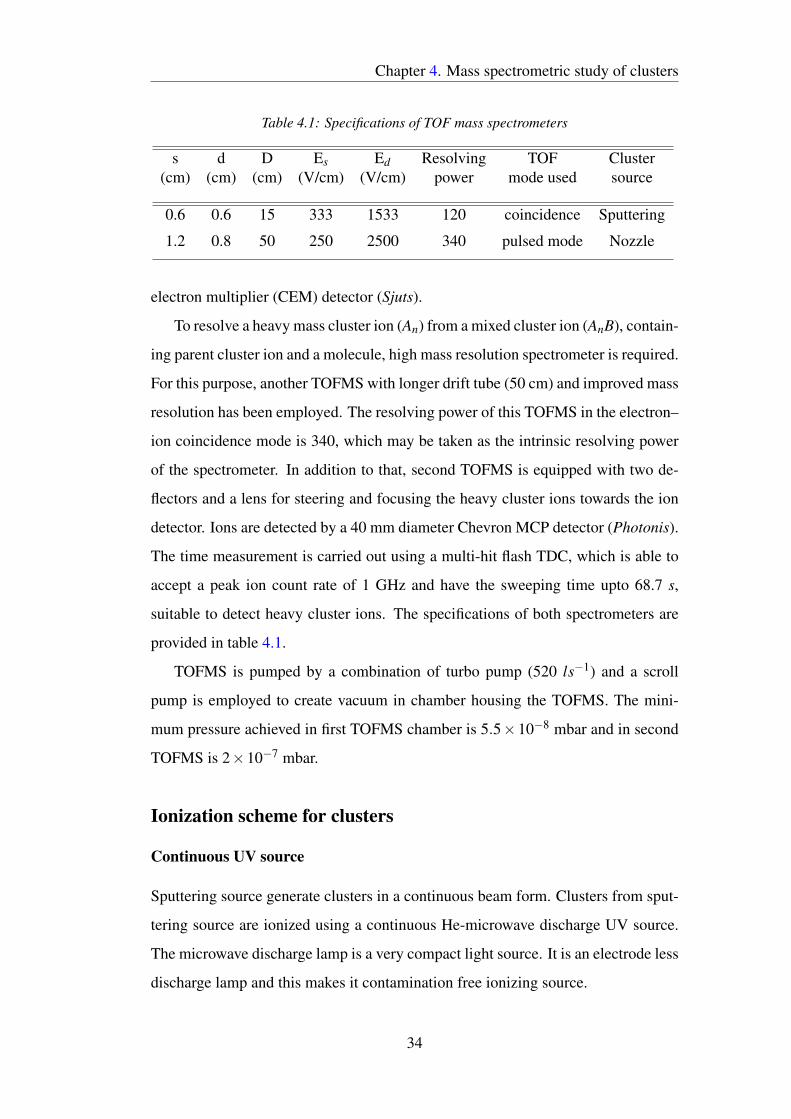
Table 4.1: Specifications of TOF mass spectrometers
s d D Es Ed Resolving TOF Cluster(cm) (cm) (cm) (V/cm) (V/cm) power mode used source
0.6 0.6 15 333 1533 120 coincidence Sputtering
1.2 0.8 50 250 2500 340 pulsed mode Nozzle
electron multiplier (CEM) detector (Sjuts).
To resolve a heavy mass cluster ion (An) from a mixed cluster ion (AnB), contain-
ing parent cluster ion and a molecule, high mass resolution spectrometer is required.
For this purpose, another TOFMS with longer drift tube (50 cm) and improved mass
resolution has been employed. The resolving power of this TOFMS in the electron–
ion coincidence mode is 340, which may be taken as the intrinsic resolving power
of the spectrometer. In addition to that, second TOFMS is equipped with two de-
flectors and a lens for steering and focusing the heavy cluster ions towards the ion
detector. Ions are detected by a 40 mm diameter Chevron MCP detector (Photonis).
The time measurement is carried out using a multi-hit flash TDC, which is able to
accept a peak ion count rate of 1 GHz and have the sweeping time upto 68.7 s,
suitable to detect heavy cluster ions. The specifications of both spectrometers are
provided in table 4.1.
TOFMS is pumped by a combination of turbo pump (520 ls−1) and a scroll
pump is employed to create vacuum in chamber housing the TOFMS. The mini-
mum pressure achieved in first TOFMS chamber is 5.5×10⁻⁸ mbar and in second
TOFMS is 2×10⁻⁷ mbar.
Ionization scheme for clusters
Continuous UV source
Sputtering source generate clusters in a continuous beam form. Clusters from sput-
tering source are ionized using a continuous He-microwave discharge UV source.
The microwave discharge lamp is a very compact light source. It is an electrode less
discharge lamp and this makes it contamination free ionizing source.
34
Chapter 4. Mass spectrometric study of clusters
He-gas is used as a discharge gas with 2.45 GHz microwave up to microwave
power of 50 W. The discharge is established in a quartz tube (8 mm o.d. and 4 mm
i.d.) intersecting a microwave cavity. A needle valve is used to control the He gas
flow inside the quartz tube. The discharge is initially triggered by a Tesla coil. In the
present case, radiation of 21.21 eV energy is produced using He as a discharge gas.
For preventing the heating and breaking of quartz tube, tube is cooled by flowing
air around the discharge region.
Pulsed Nd:YAG laser
Laser ablation source and pulsed nozzle source generate clusters in pulsed form.
Ionization of these clusters by a continuous ionizing source will lead to an en-
hanced false ion count in the mass spectrum due to the low duty cycle of cluster
beam. In this case, clusters from a pulsed cluster source are ionized using a pulsed
ionizing source, Nd:YAG laser. An Nd:YAG (Continuum) laser is employed to ion-
ize the supersonic gas pulses from the pulsed nozzle in the ionization region of
TOFMS. Frequency tripled output of the Nd:YAG laser at 355 nm having a fluence
of 61 Jcm−2 has been used in most cases. Pulse width of 8 ns and repetition rate of
30 Hz is fixed for all measurements. In order to attain efficient ionization of clus-
ters, gas pulse is synchronized with the laser pulse. The correct timing is essential
between these two pulses are important for the cluster ion production.
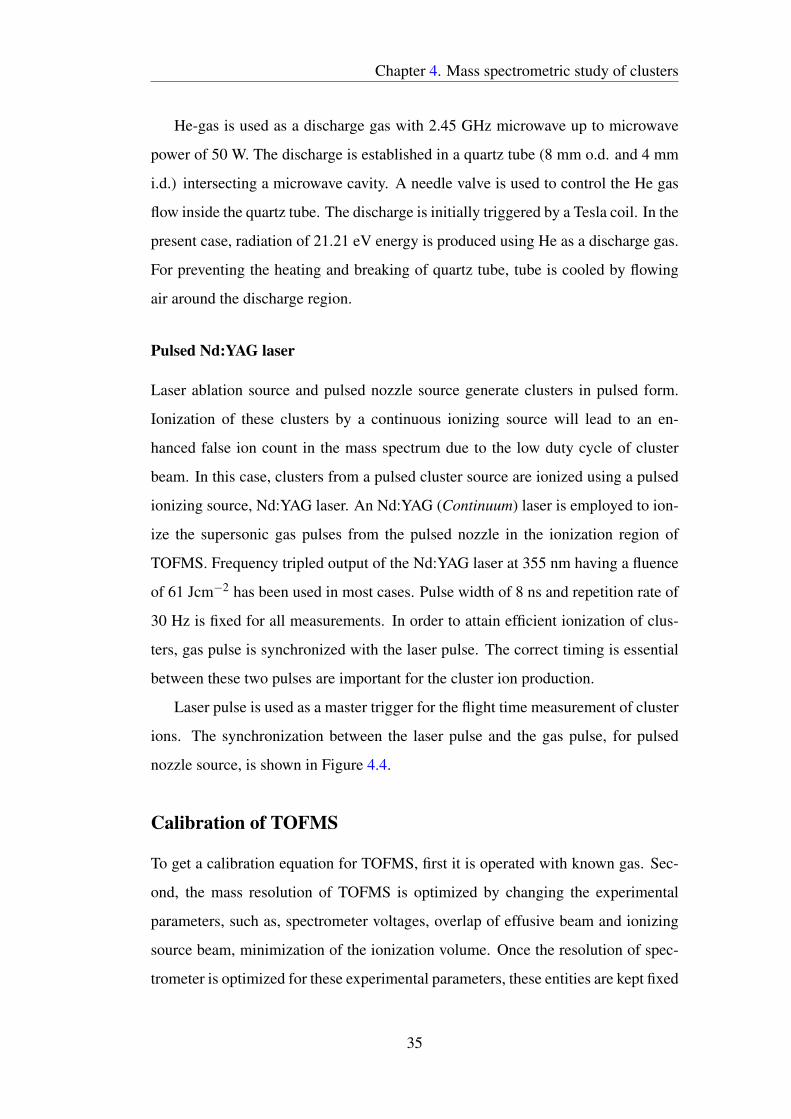
Laser pulse is used as a master trigger for the flight time measurement of cluster
ions. The synchronization between the laser pulse and the gas pulse, for pulsed
nozzle source, is shown in Figure 4.4.
Calibration of TOFMS
To get a calibration equation for TOFMS, first it is operated with known gas. Sec-
ond, the mass resolution of TOFMS is optimized by changing the experimental
parameters, such as, spectrometer voltages, overlap of effusive beam and ionizing
source beam, minimization of the ionization volume. Once the resolution of spec-
trometer is optimized for these experimental parameters, these entities are kept fixed
35
Chapter 4. Mass spectrometric study of clusters
Laser pulse (Master trigger)
Delay (~1.3ms)
Gas pulse
0.3 ms
33.33 ms
1st pulse 2nd pulse
time axis
Figure 4.4: Schematic diagram of gas pulse and laser pulse synchronization, for cluster ionproduction, using pulsed nozzle source and Nd:YAG laser, Figure not to scale.
for the unknown gas sample. To get a precise calibration equation for TOFMS, it is
better to have many known ions over a wide mass range in the mass spectrum. For
this purpose, generally, a gas with many isotopes (Krypton or Xenon) is used.
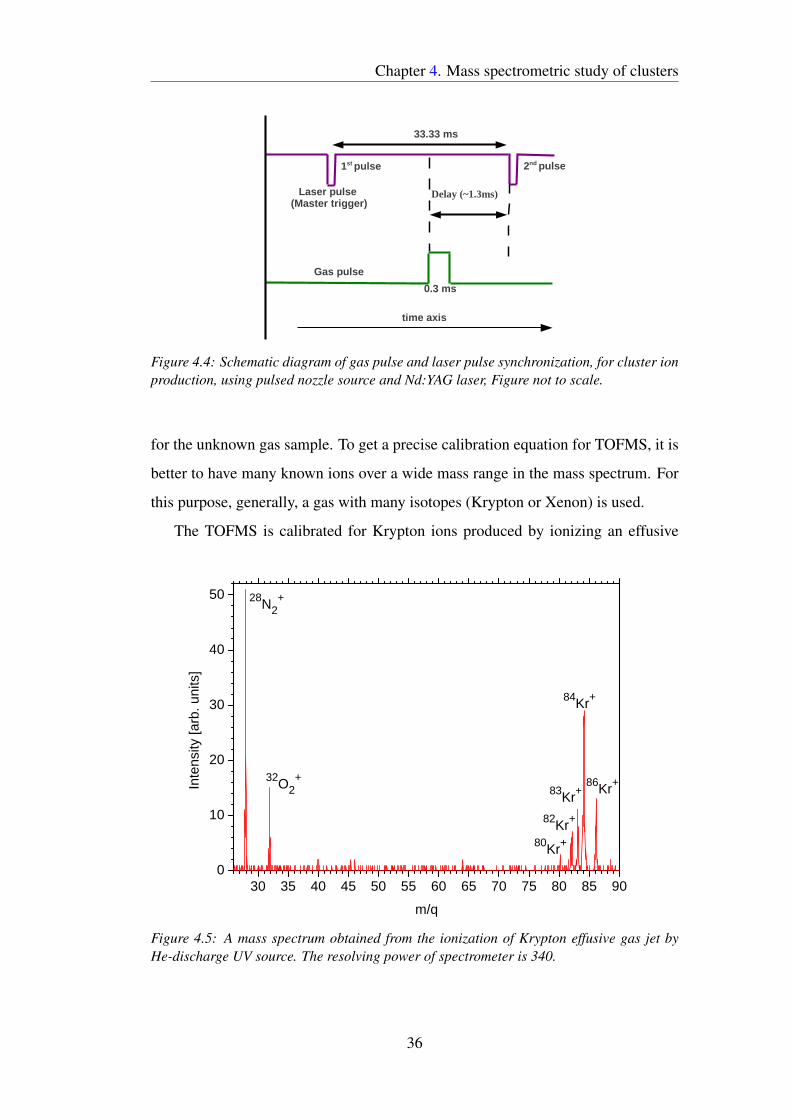
The TOFMS is calibrated for Krypton ions produced by ionizing an effusive
30 35 40 45 50 55 60 65 70 75 80 85 900
10
20
30
40
50
86Kr+
84Kr+
83Kr+
82Kr+
80Kr+
32O2+
28N2+
Inte
nsity
[arb
. uni
ts]
m/q
Figure 4.5: A mass spectrum obtained from the ionization of Krypton effusive gas jet byHe-discharge UV source. The resolving power of spectrometer is 340.
36
Chapter 4. Mass spectrometric study of clusters
Krypton beam using a He-discharge UV source. A mass spectrum of Krypton ions
has been shown in Figure 4.5. Nitrogen and Oxygen ions are also present in the
mass spectrum due to the impurity in Krypton gas.
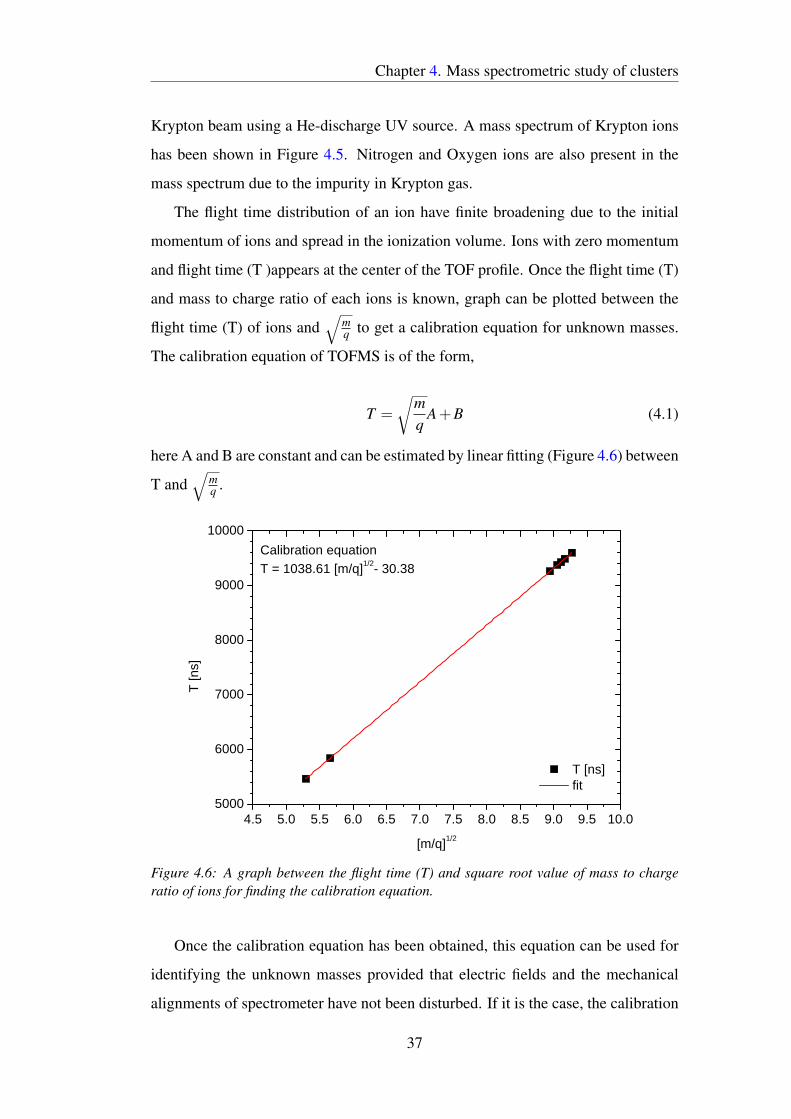
The flight time distribution of an ion have finite broadening due to the initial
momentum of ions and spread in the ionization volume. Ions with zero momentum
and flight time (T )appears at the center of the TOF profile. Once the flight time (T)
and mass to charge ratio of each ions is known, graph can be plotted between the
flight time (T) of ions and√
mq to get a calibration equation for unknown masses.
The calibration equation of TOFMS is of the form,
T =
√mq
A+B (4.1)
here A and B are constant and can be estimated by linear fitting (Figure 4.6) between
T and√
mq .
4.5 5.0 5.5 6.0 6.5 7.0 7.5 8.0 8.5 9.0 9.5 10.05000
6000
7000
8000
9000
10000
T [ns] fit
T [n
s]
[m/q]1/2
Calibration equationT = 1038.61 [m/q]1/2- 30.38
Figure 4.6: A graph between the flight time (T) and square root value of mass to chargeratio of ions for finding the calibration equation.
Once the calibration equation has been obtained, this equation can be used for
identifying the unknown masses provided that electric fields and the mechanical
alignments of spectrometer have not been disturbed. If it is the case, the calibration
37
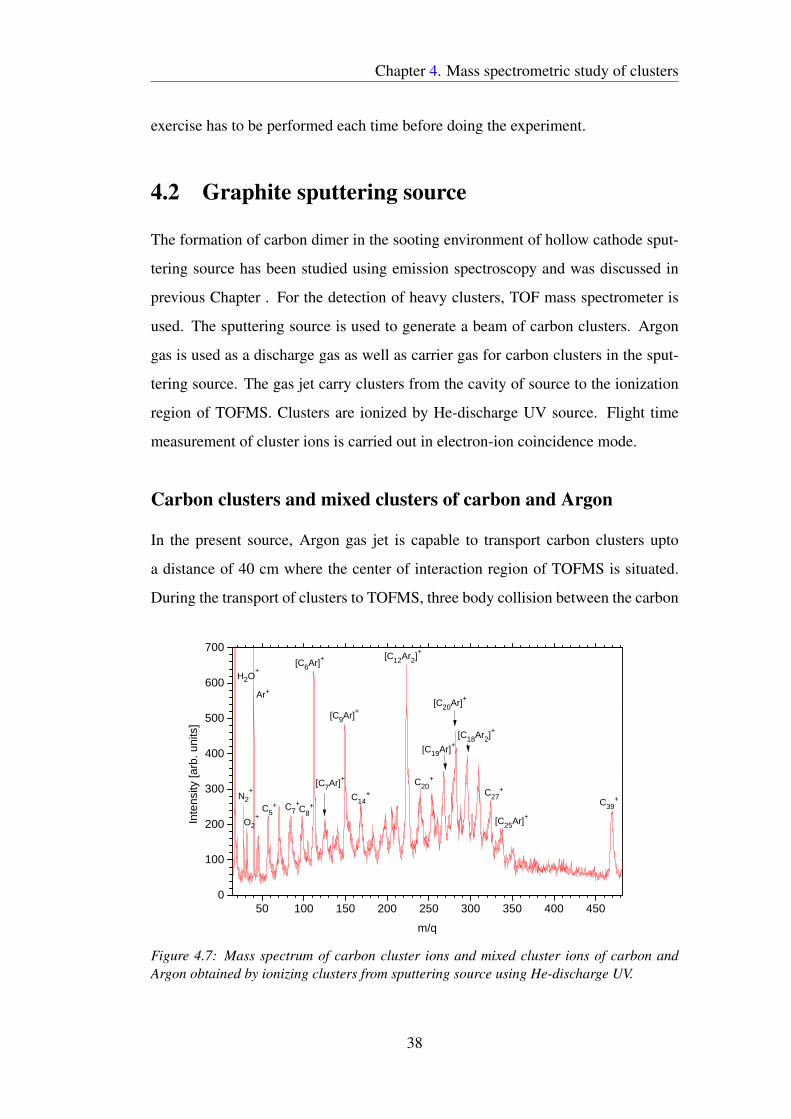
Chapter 4. Mass spectrometric study of clusters
exercise has to be performed each time before doing the experiment.
4.2 Graphite sputtering source
The formation of carbon dimer in the sooting environment of hollow cathode sput-
tering source has been studied using emission spectroscopy and was discussed in
previous Chapter . For the detection of heavy clusters, TOF mass spectrometer is
used. The sputtering source is used to generate a beam of carbon clusters. Argon
gas is used as a discharge gas as well as carrier gas for carbon clusters in the sput-
tering source. The gas jet carry clusters from the cavity of source to the ionization
region of TOFMS. Clusters are ionized by He-discharge UV source. Flight time
measurement of cluster ions is carried out in electron-ion coincidence mode.
Carbon clusters and mixed clusters of carbon and Argon
In the present source, Argon gas jet is capable to transport carbon clusters upto
a distance of 40 cm where the center of interaction region of TOFMS is situated.
During the transport of clusters to TOFMS, three body collision between the carbon
50 100 150 200 250 300 350 400 4500
100
200
300
400
500
600
700
O2+
N2+
[C9Ar]+
C7+C8
+ C39+
[C25Ar]+
C27+
[C18Ar2]+
[C20Ar]+
[C19Ar]+
C20+
C14+
[C12Ar2]+
[C7Ar]+
[C6Ar]+
C5+
Ar+
H2O+
Inte
nsity
[arb
. uni
ts]
m/q
Figure 4.7: Mass spectrum of carbon cluster ions and mixed cluster ions of carbon andArgon obtained by ionizing clusters from sputtering source using He-discharge UV.
38
Chapter 4. Mass spectrometric study of clusters
clusters and Argon atoms may also lead to the adsorption of Argon atoms on the
surface of clusters. A mass spectrum of cluster ions is shown in Figure 4.7.
The spectrum is acquired when the voltage drop across the plasma and discharge
current are 300 V and 17 mA respectively, an Argon pressure of 1.7 mbar is main-
tained for stable plasma formation. In addition to the formation of carbon clusters,
mixed clusters of carbon and Argon are also observed.
4.3 Clusters from pulsed nozzle source
Pulsed nozzle source has been used for generating clusters from gas species. High
pressure gas pulses are ejected by a pulsed nozzle (1 mm diameter), these pulses
are extracted through a conical skimmer (1.2 mm diameter) placed at 20 mm from
the nozzle. For a mass spectrometric analysis of the clusters, it is necessary to have
a pulsed ionization source. This is achieved by the use of 355 nm Nd:YAG laser
pulses downstream the expansion at a distance of 17 cm in the ionization gap of the
TOFMS described earlier. Before going to the results of this study, we look at the
ionization mechanism under intense laser pulses.
Multi-photon ionization (MPI)
The discovery of high intensity pulsed laser laid the foundation of an ionization
scheme in which an atom may get ionized by the absorption of photons even when
the photon energy is less than the ionization energy of atom. This ionization scheme
is popularly known as multiphoton ionization (MPI). The interaction of an atom
with high intensity laser pulse (107-1015 Wcm−2) may lead to the simultaneous ab-
sorption of more than one photons by the virtual states of atom. The life time of
these states is very short and is of the order of one optical pulse. When the energy of
the photons absorbed by an atom overcome the ionization barrier, atom gets ionized
and this process is known as multiphoton ionization (MPI). The multiphoton ioniza-
tion process was first observed by Voronov et al. in the ionization of Xenon atoms
via seven photon absorption [55]. The laser parameters, such as, intensity, pulse
width and wavelength play a significant role in MPI. Optical energy absorption is
39
Chapter 4. Mass spectrometric study of clusters
more prominent in clusters than their constituent atom or bulk.
The intensity (I) of a laser pulse can be calculated using equation 4.2.
I =ε0cE2
2(4.2)
where c is the speed of light, ε0 is the permittivity of space and E is the magnitude
of electric field. When an atom interacts with laser pulse, the influence of laser field
strength on the electron cloud in atom is more prominent when the laser intensity
approaches or exceeds the nuclear electric field experienced by the electron in the
first Bohr orbit of atomic hydrogen. In this case, bound electrons in the outermost
orbit of atom overcome the ionization barrier and this type of ionization is known
as field ionization. The Coulomb field (Ea) experienced by an electron in the first
Bohr orbit of atomic hydrogen is given in equation 4.3.
Ea =e
4πε0a20= 5.1×10⁹ V cm−1 (4.3)
The field strength of laser at intensity 3.5× 10¹⁶ W cm−2 corresponds to the
Coulomb field (Ea) experienced by an electron in the first Bohr orbit of atomic
hydrogen. The probability per unit time (P) of ionizing an atom or ionization rate
[56] depends on the intensity (I) of laser and number of photons (N) per pulse and
is given in equation 4.4,
P = σNIN (4.4)
The number of photons in a coherence volume (λ 3) can be estimated using equation
4.5,
N =Iλ 3
ch̄ω(4.5)
where I is the intensity of laser, h̄ω is the energy of photon and λ is the wavelength
of laser.
The ionization mechanism can be further separated into two different ionization
regime, MPI and tunneling ionization, on the basis of Keldysh parameter (γ) [57].
The Keldysh parameter (γ) is defined as,
40
Chapter 4. Mass spectrometric study of clusters
γ =
√Ip
2Up(4.6)
where Ip is the ionisation potential of atom in eV and Up is the pondermotive
energy of the quivering electron in the laser field [57]. The ponderomotive energy
or the quivering energy of the quasi-free electron in a laser field is given as,
Up =e2E2
4mω2 = 9.33×10⁻¹⁴× I×λ2 eV (4.7)
where E is the laser field strength, ω is the photon angular frequency, I is the
intensity in W/cm2 of the optical pulse and λ is the wavelength in µm [58].
If γ > 1, the ionization is via non-resonant multiphoton ionization followed by
the simultaneous absorption of many photons [8–10, 59].
A+Nh̄ω = A++ e−
In this interaction, the energy of Nh̄ω is greater than the ionization potential (Ip) of
atom. For γ < 1, the ionization is explained by tunnel ionization [58] and is not the
case in present study.
Atomic clusters: Xenon
The first target chosen for the study was Xenon clusters. Since the setup consist
of a pulsed gas and a pulsed laser, correct timing synchronization between the two
pulses is very important to achieve a cluster ion mass spectrum. The timing between
two pulses may change according to the mass and ratio of specific heat of the gas
used. To check the influence of delay (see Figure 4.4) between laser pulse and gas
pulse on the mass spectra, delay has been varied between 1.0–1.6 ms in the present
experiment, based on the delay range estimated from calculations. By changing the
delay in step of 0.1 ms, laser pulse may collide with any portion of the gas pulse
as the gas pulse remains open for 0.3 ms (Figure 4.8). It is found that changing
41
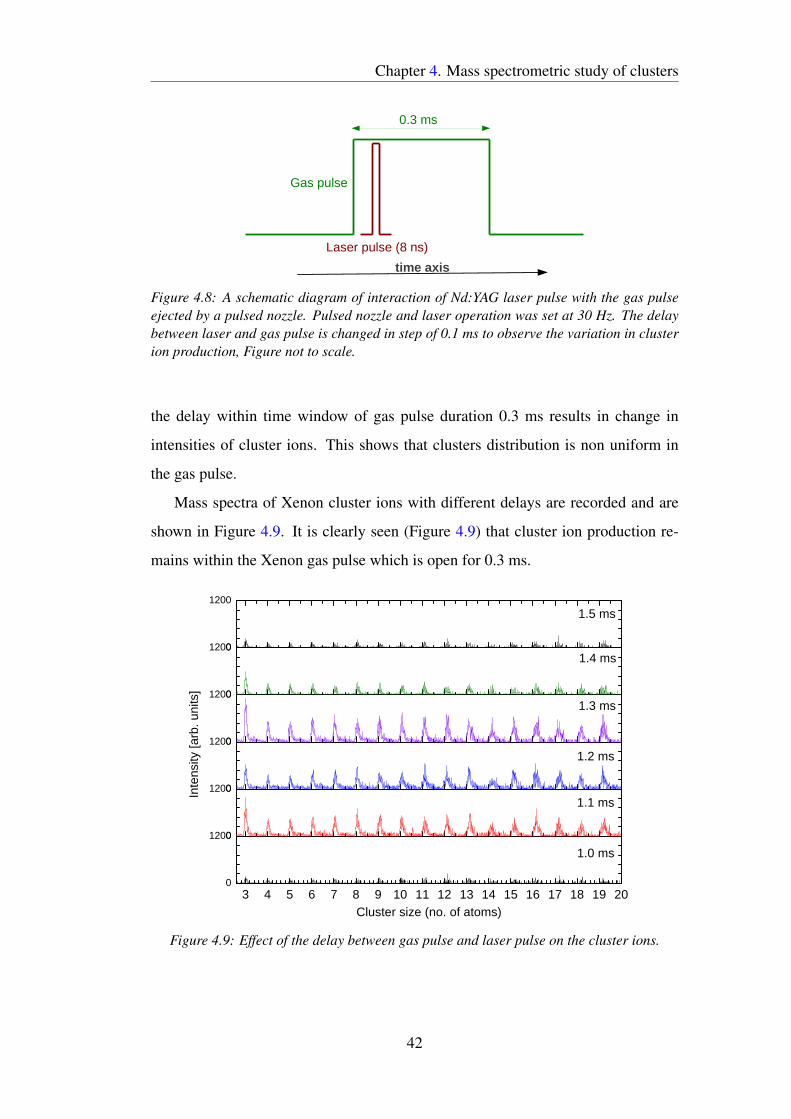
Chapter 4. Mass spectrometric study of clusters
Laser pulse (8 ns)
Gas pulse
0.3 ms
time axis
Figure 4.8: A schematic diagram of interaction of Nd:YAG laser pulse with the gas pulseejected by a pulsed nozzle. Pulsed nozzle and laser operation was set at 30 Hz. The delaybetween laser and gas pulse is changed in step of 0.1 ms to observe the variation in clusterion production, Figure not to scale.
the delay within time window of gas pulse duration 0.3 ms results in change in
intensities of cluster ions. This shows that clusters distribution is non uniform in
the gas pulse.
Mass spectra of Xenon cluster ions with different delays are recorded and are
shown in Figure 4.9. It is clearly seen (Figure 4.9) that cluster ion production re-
mains within the Xenon gas pulse which is open for 0.3 ms.
3 4 5 6 7 8 9 10 11 12 13 14 15 16 17 18 19 200
12000
12000
12000
12000
12000
1200
1.0 ms
1.1 ms
1.2 ms
Inte
nsity
[arb
. uni
ts]
Cluster size (no. of atoms)
1.5 ms
1.4 ms
1.3 ms
Figure 4.9: Effect of the delay between gas pulse and laser pulse on the cluster ions.
42
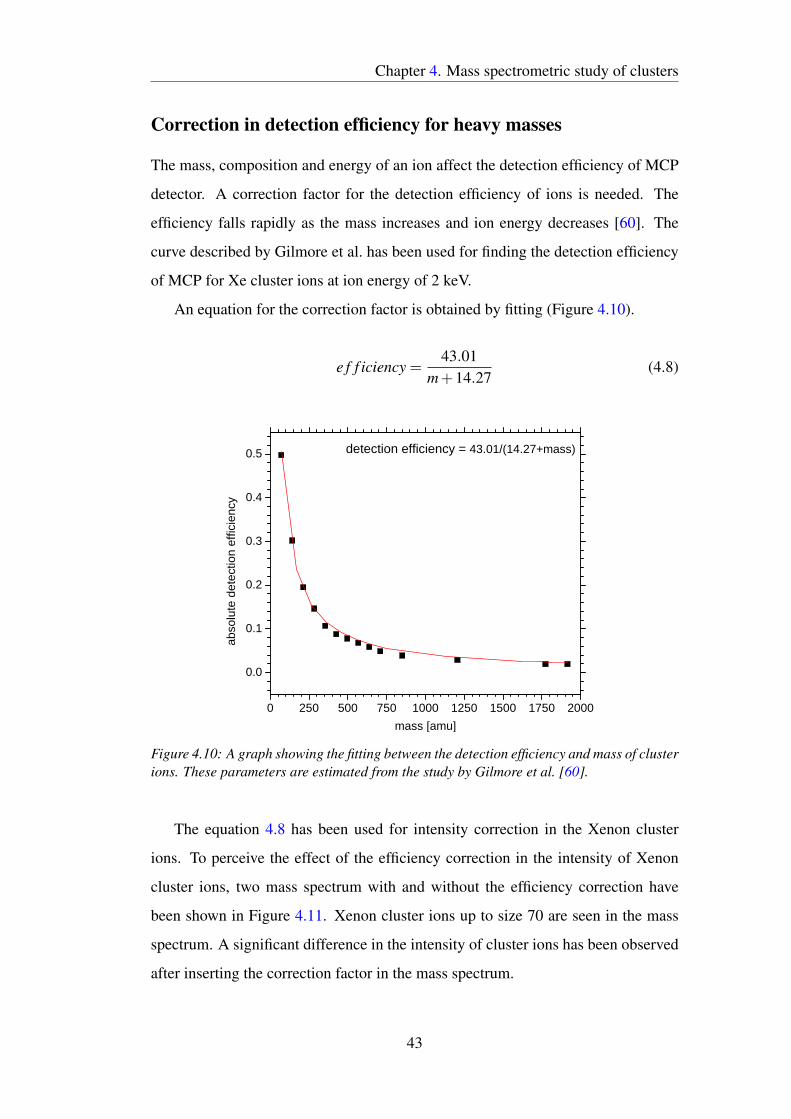
Chapter 4. Mass spectrometric study of clusters
Correction in detection efficiency for heavy masses
The mass, composition and energy of an ion affect the detection efficiency of MCP
detector. A correction factor for the detection efficiency of ions is needed. The
efficiency falls rapidly as the mass increases and ion energy decreases [60]. The
curve described by Gilmore et al. has been used for finding the detection efficiency
of MCP for Xe cluster ions at ion energy of 2 keV.
An equation for the correction factor is obtained by fitting (Figure 4.10).
e f f iciency =43.01
m+14.27(4.8)
0 250 500 750 1000 1250 1500 1750 2000
0.0
0.1
0.2
0.3
0.4
0.5
detection efficiency = 43.01/(14.27+mass)
abso
lute
det
ectio
n ef
ficie
ncy
mass [amu]
Figure 4.10: A graph showing the fitting between the detection efficiency and mass of clusterions. These parameters are estimated from the study by Gilmore et al. [60].
The equation 4.8 has been used for intensity correction in the Xenon cluster
ions. To perceive the effect of the efficiency correction in the intensity of Xenon
cluster ions, two mass spectrum with and without the efficiency correction have
been shown in Figure 4.11. Xenon cluster ions up to size 70 are seen in the mass
spectrum. A significant difference in the intensity of cluster ions has been observed
after inserting the correction factor in the mass spectrum.
43
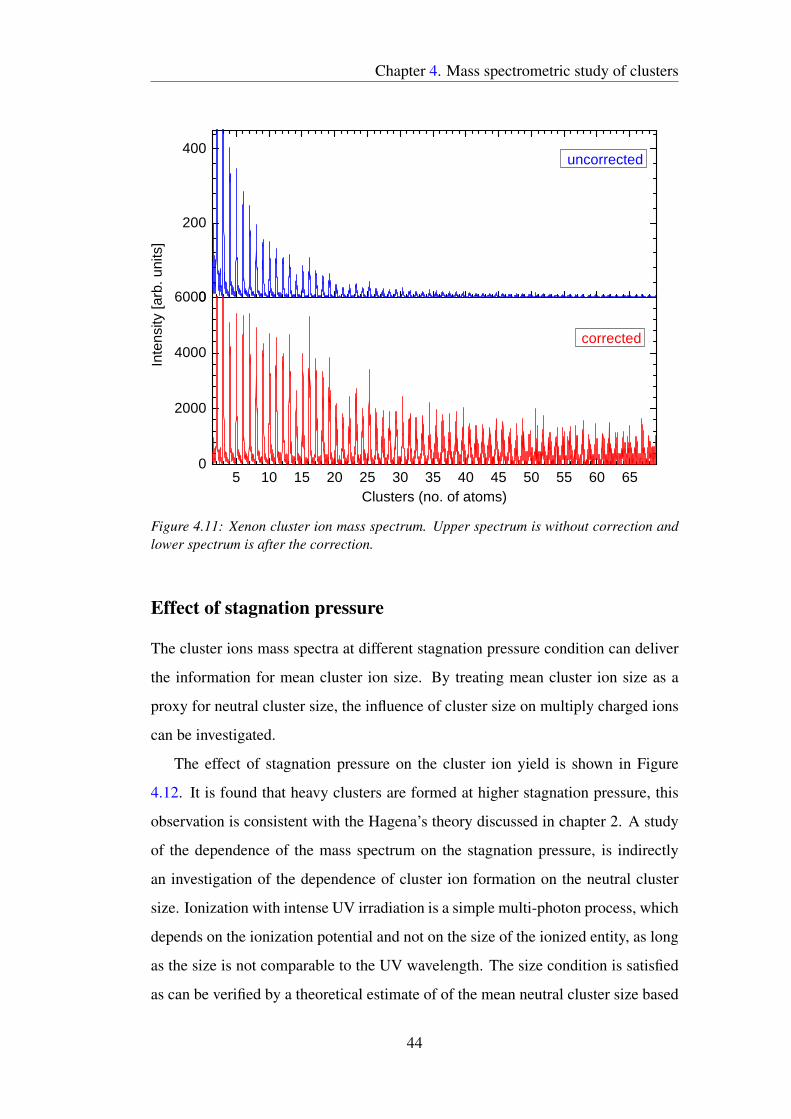
Chapter 4. Mass spectrometric study of clusters
5 10 15 20 25 30 35 40 45 50 55 60 650
2000
4000
60000
200
400
Clusters (no. of atoms)
corrected
uncorrectedIn
tens
ity [a
rb. u
nits
]
Figure 4.11: Xenon cluster ion mass spectrum. Upper spectrum is without correction andlower spectrum is after the correction.
Effect of stagnation pressure
The cluster ions mass spectra at different stagnation pressure condition can deliver
the information for mean cluster ion size. By treating mean cluster ion size as a
proxy for neutral cluster size, the influence of cluster size on multiply charged ions
can be investigated.
The effect of stagnation pressure on the cluster ion yield is shown in Figure
4.12. It is found that heavy clusters are formed at higher stagnation pressure, this
observation is consistent with the Hagena’s theory discussed in chapter 2. A study
of the dependence of the mass spectrum on the stagnation pressure, is indirectly
an investigation of the dependence of cluster ion formation on the neutral cluster
size. Ionization with intense UV irradiation is a simple multi-photon process, which
depends on the ionization potential and not on the size of the ionized entity, as long
as the size is not comparable to the UV wavelength. The size condition is satisfied
as can be verified by a theoretical estimate of of the mean neutral cluster size based
44
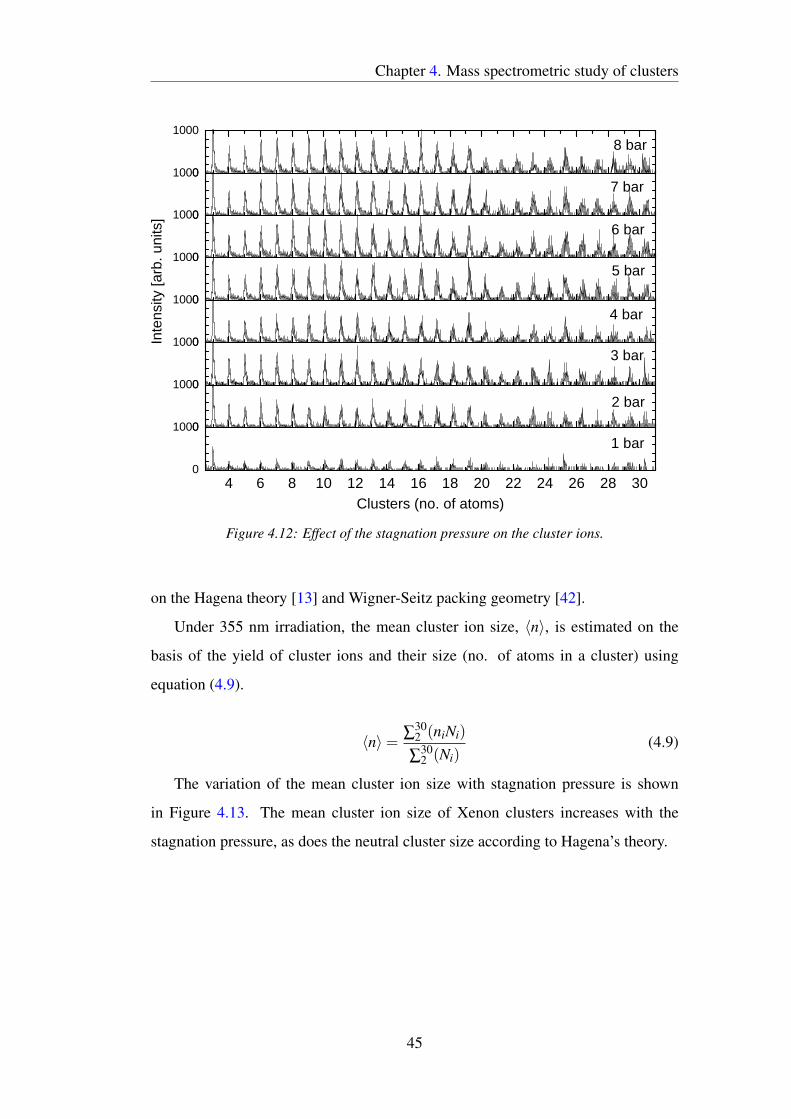
Chapter 4. Mass spectrometric study of clusters
4 6 8 10 12 14 16 18 20 22 24 26 28 300
10000
10000
10000
10000
10000
10000
10000
1000
Clusters (no. of atoms)
1 bar
2 bar
3 bar
4 bar
5 bar
6 bar
7 bar
Inte
nsity
[arb
. uni
ts]
8 bar
Figure 4.12: Effect of the stagnation pressure on the cluster ions.
on the Hagena theory [13] and Wigner-Seitz packing geometry [42].
Under 355 nm irradiation, the mean cluster ion size, 〈n〉, is estimated on the
basis of the yield of cluster ions and their size (no. of atoms in a cluster) using
equation (4.9).
〈n〉= ∑302 (niNi)
∑302 (Ni)
(4.9)
The variation of the mean cluster ion size with stagnation pressure is shown
in Figure 4.13. The mean cluster ion size of Xenon clusters increases with the
stagnation pressure, as does the neutral cluster size according to Hagena’s theory.
45
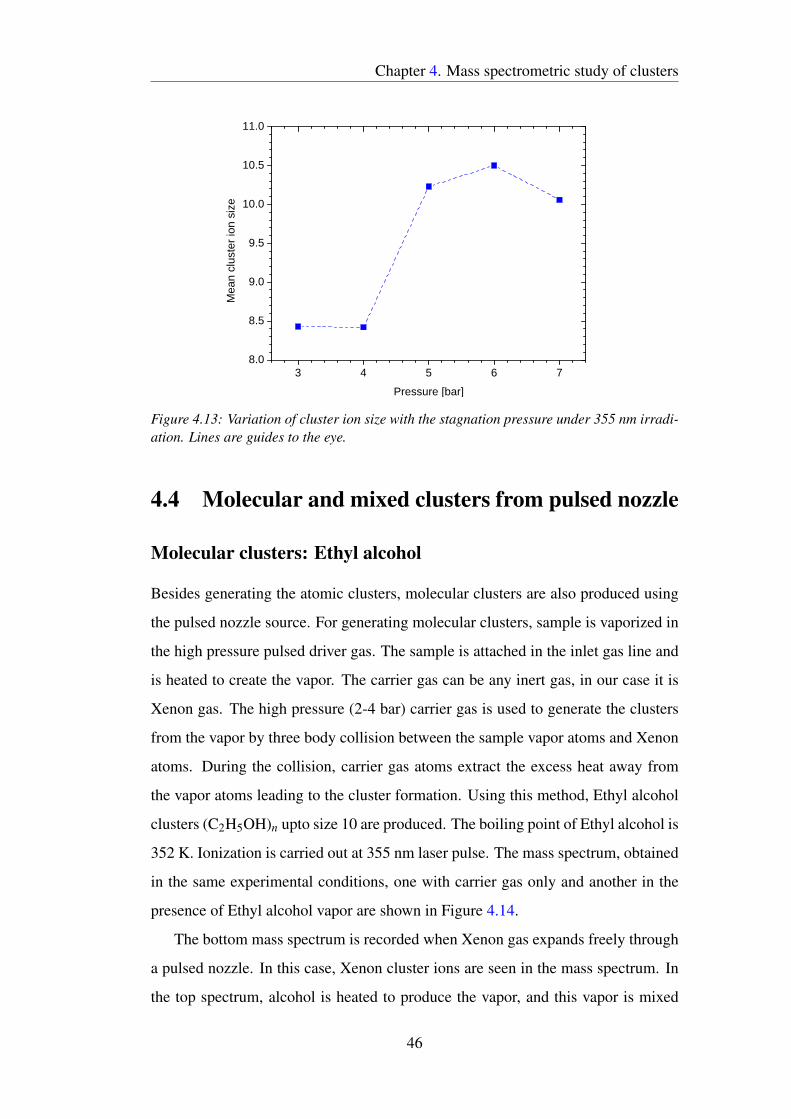
Chapter 4. Mass spectrometric study of clusters
3 4 5 6 78.0
8.5
9.0
9.5
10.0
10.5
11.0
Mea
n cl
uste
r io
n si
ze
Pressure [bar]
Figure 4.13: Variation of cluster ion size with the stagnation pressure under 355 nm irradi-ation. Lines are guides to the eye.
4.4 Molecular and mixed clusters from pulsed nozzle
Molecular clusters: Ethyl alcohol
Besides generating the atomic clusters, molecular clusters are also produced using
the pulsed nozzle source. For generating molecular clusters, sample is vaporized in
the high pressure pulsed driver gas. The sample is attached in the inlet gas line and
is heated to create the vapor. The carrier gas can be any inert gas, in our case it is
Xenon gas. The high pressure (2-4 bar) carrier gas is used to generate the clusters
from the vapor by three body collision between the sample vapor atoms and Xenon
atoms. During the collision, carrier gas atoms extract the excess heat away from
the vapor atoms leading to the cluster formation. Using this method, Ethyl alcohol
clusters (C2H5OH)n upto size 10 are produced. The boiling point of Ethyl alcohol is
352 K. Ionization is carried out at 355 nm laser pulse. The mass spectrum, obtained
in the same experimental conditions, one with carrier gas only and another in the
presence of Ethyl alcohol vapor are shown in Figure 4.14.
The bottom mass spectrum is recorded when Xenon gas expands freely through
a pulsed nozzle. In this case, Xenon cluster ions are seen in the mass spectrum. In
the top spectrum, alcohol is heated to produce the vapor, and this vapor is mixed
46
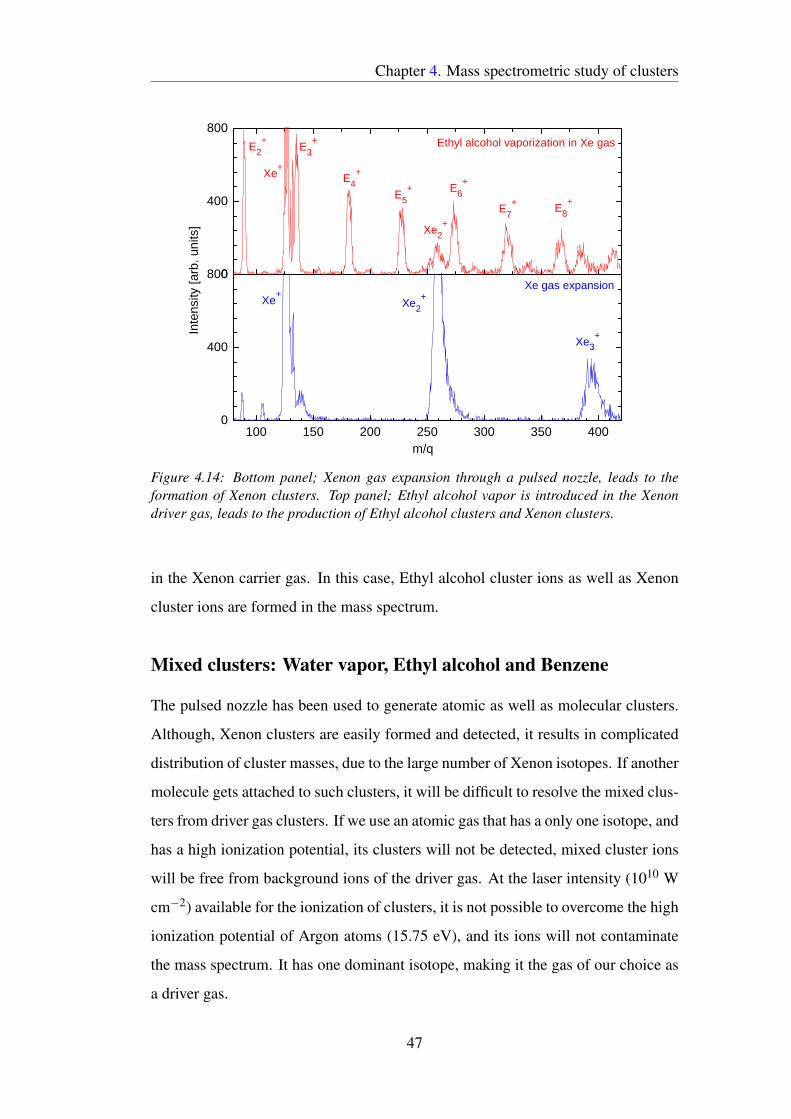
Chapter 4. Mass spectrometric study of clusters
100 150 200 250 300 350 4000
400
8000
400
800
Inte
nsity
[arb
. uni
ts]
m/q
Xe3+
Xe2+Xe
+
Xe2+
Xe+
E8+
E7+
E6+
E5+
E4+
E3+
E2+
Xe gas expansion
Ethyl alcohol vaporization in Xe gas
Figure 4.14: Bottom panel; Xenon gas expansion through a pulsed nozzle, leads to theformation of Xenon clusters. Top panel; Ethyl alcohol vapor is introduced in the Xenondriver gas, leads to the production of Ethyl alcohol clusters and Xenon clusters.
in the Xenon carrier gas. In this case, Ethyl alcohol cluster ions as well as Xenon
cluster ions are formed in the mass spectrum.
Mixed clusters: Water vapor, Ethyl alcohol and Benzene
The pulsed nozzle has been used to generate atomic as well as molecular clusters.
Although, Xenon clusters are easily formed and detected, it results in complicated
distribution of cluster masses, due to the large number of Xenon isotopes. If another
molecule gets attached to such clusters, it will be difficult to resolve the mixed clus-
ters from driver gas clusters. If we use an atomic gas that has a only one isotope, and
has a high ionization potential, its clusters will not be detected, mixed cluster ions
will be free from background ions of the driver gas. At the laser intensity (1010 W
cm−2) available for the ionization of clusters, it is not possible to overcome the high
ionization potential of Argon atoms (15.75 eV), and its ions will not contaminate
the mass spectrum. It has one dominant isotope, making it the gas of our choice as
a driver gas.
47
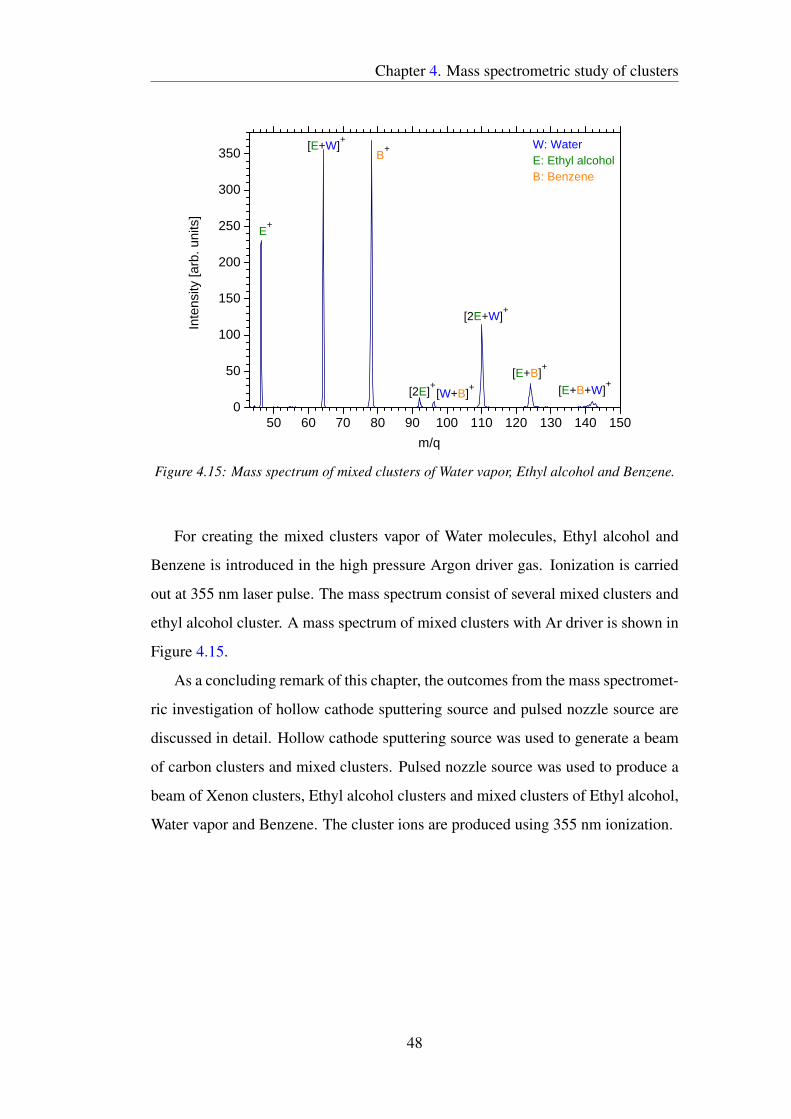
Chapter 4. Mass spectrometric study of clusters
50 60 70 80 90 100 110 120 130 140 1500
50
100
150
200
250
300
350
[E+B+W]+
[E+B]+
[2E+W]+
[W+B]+[2E]
+
Inte
nsity
[arb
. uni
ts]
m/q
E+
[E+W]+
B+ W: Water
E: Ethyl alcoholB: Benzene
Figure 4.15: Mass spectrum of mixed clusters of Water vapor, Ethyl alcohol and Benzene.
For creating the mixed clusters vapor of Water molecules, Ethyl alcohol and
Benzene is introduced in the high pressure Argon driver gas. Ionization is carried
out at 355 nm laser pulse. The mass spectrum consist of several mixed clusters and
ethyl alcohol cluster. A mass spectrum of mixed clusters with Ar driver is shown in
Figure 4.15.
As a concluding remark of this chapter, the outcomes from the mass spectromet-
ric investigation of hollow cathode sputtering source and pulsed nozzle source are
discussed in detail. Hollow cathode sputtering source was used to generate a beam
of carbon clusters and mixed clusters. Pulsed nozzle source was used to produce a
beam of Xenon clusters, Ethyl alcohol clusters and mixed clusters of Ethyl alcohol,
Water vapor and Benzene. The cluster ions are produced using 355 nm ionization.
48
Chapter 5
Multiply charged ion formation in
MPI of Xenon clusters
In the previous chapter, the formation of singly charged cluster ions by MPI using
355 nm laser pulse has been discussed . Apart from 355 nm ionization, cluster ion
formation using Nd:YAG 1064 nm pulse has been studied. When we compared the
Xenon cluster ions mass spectrum under IR and UV irradiation, some interesting
results are found. In this chapter, the difference in the ionization mechanism of
Xenon clusters subjected to IR and UV irradiation are discussed.
5.1 IR irradiation: Multiple ionization
When 1064 nm radiation is employed for Xenon cluster ionization, the TOF mass
spectrum shows singly ionized peaks of the monomer and the dimer, but, more
interestingly, there are several multiply charged atomic ions (Xeq+,q =1–5). A
sample mass spectrum with IR ionization at 3 bar stagnation pressure is shown in
Figure 5.1.
The presence of clusters is vital for the production of multiply charged atomic
ions. This was confirmed by obtaining a mass spectrum with the pulsed nozzle
beam replaced by a low number density effusive beam of Xe gas (which is devoid
of clusters). The mass spectrum in the case of effusive beam shows only Xe+ peak,
and no multiply charged ions.
49
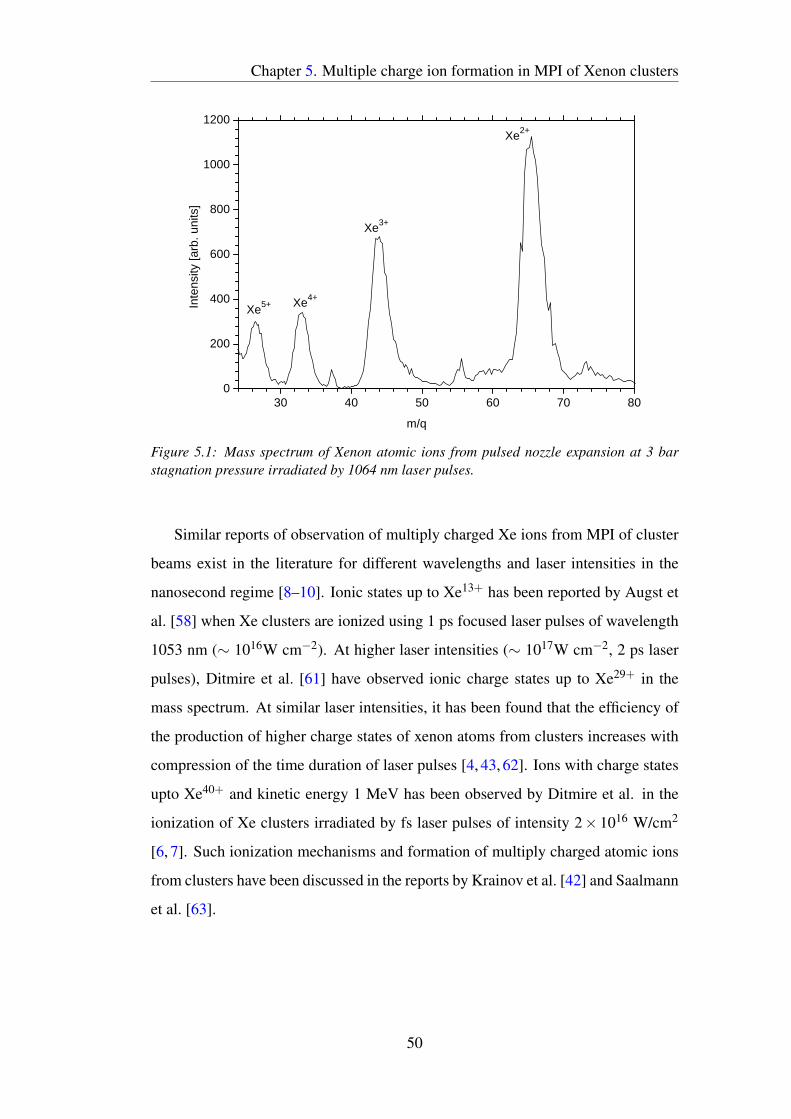
Chapter 5. Multiple charge ion formation in MPI of Xenon clusters
30 40 50 60 70 800
200
400
600
800
1000
1200
Xe5+ Xe4+
Xe3+
Xe2+
Inte
nsity
[arb
. uni
ts]
m/q
Figure 5.1: Mass spectrum of Xenon atomic ions from pulsed nozzle expansion at 3 barstagnation pressure irradiated by 1064 nm laser pulses.
Similar reports of observation of multiply charged Xe ions from MPI of cluster
beams exist in the literature for different wavelengths and laser intensities in the
nanosecond regime [8–10]. Ionic states up to Xe13+ has been reported by Augst et
al. [58] when Xe clusters are ionized using 1 ps focused laser pulses of wavelength
1053 nm (∼ 1016W cm−2). At higher laser intensities (∼ 1017W cm−2, 2 ps laser
pulses), Ditmire et al. [61] have observed ionic charge states up to Xe29+ in the
mass spectrum. At similar laser intensities, it has been found that the efficiency of
the production of higher charge states of xenon atoms from clusters increases with
compression of the time duration of laser pulses [4, 43, 62]. Ions with charge states
upto Xe40+ and kinetic energy 1 MeV has been observed by Ditmire et al. in the
ionization of Xe clusters irradiated by fs laser pulses of intensity 2× 10¹⁶ W/cm2
[6, 7]. Such ionization mechanisms and formation of multiply charged atomic ions
from clusters have been discussed in the reports by Krainov et al. [42] and Saalmann
et al. [63].
50
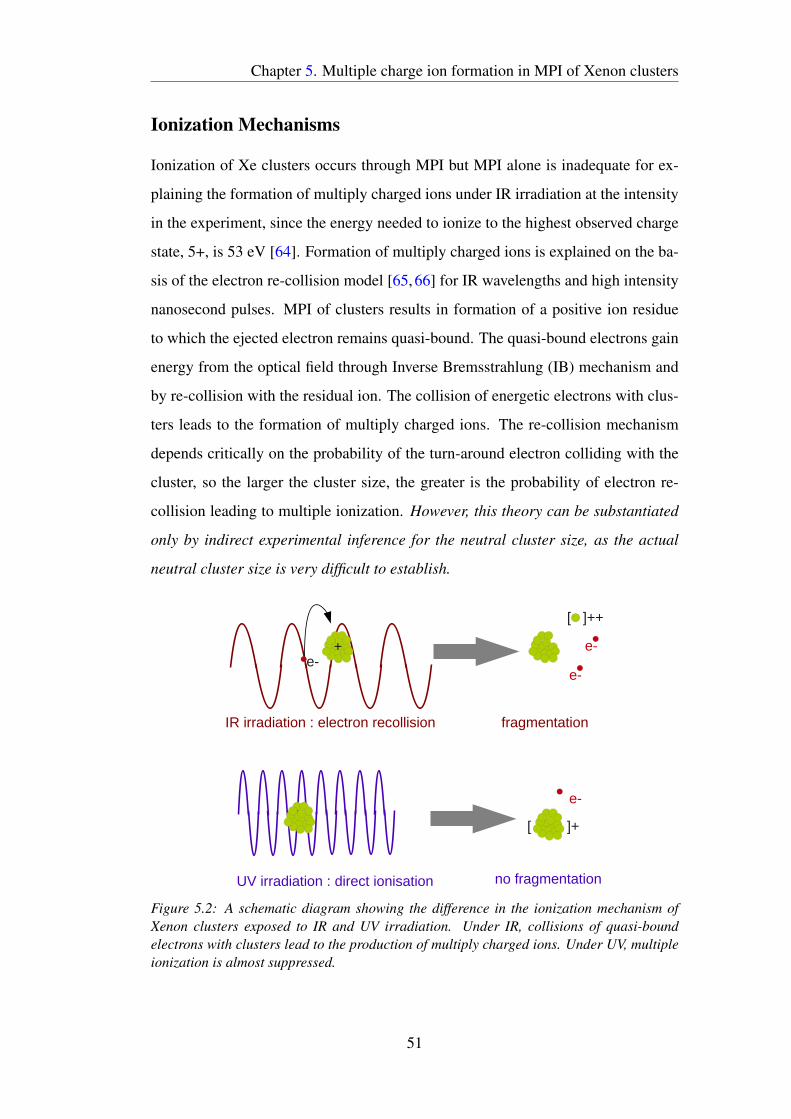
Chapter 5. Multiple charge ion formation in MPI of Xenon clusters
Ionization Mechanisms
Ionization of Xe clusters occurs through MPI but MPI alone is inadequate for ex-
plaining the formation of multiply charged ions under IR irradiation at the intensity
in the experiment, since the energy needed to ionize to the highest observed charge
state, 5+, is 53 eV [64]. Formation of multiply charged ions is explained on the ba-
sis of the electron re-collision model [65, 66] for IR wavelengths and high intensity
nanosecond pulses. MPI of clusters results in formation of a positive ion residue
to which the ejected electron remains quasi-bound. The quasi-bound electrons gain
energy from the optical field through Inverse Bremsstrahlung (IB) mechanism and
by re-collision with the residual ion. The collision of energetic electrons with clus-
ters leads to the formation of multiply charged ions. The re-collision mechanism
depends critically on the probability of the turn-around electron colliding with the
cluster, so the larger the cluster size, the greater is the probability of electron re-
collision leading to multiple ionization. However, this theory can be substantiated
only by indirect experimental inference for the neutral cluster size, as the actual
neutral cluster size is very difficult to establish.
+e-
e-
[ ]++
e-
IR irradiation : electron recollision
UV irradiation : direct ionisation
fragmentation
no fragmentation
e-
[ ]+
Figure 5.2: A schematic diagram showing the difference in the ionization mechanism ofXenon clusters exposed to IR and UV irradiation. Under IR, collisions of quasi-boundelectrons with clusters lead to the production of multiply charged ions. Under UV, multipleionization is almost suppressed.
51
Chapter 5. Multiple charge ion formation in MPI of Xenon clusters
A schematic diagram of Xe cluster ionization under IR and UV irradiation is
shown in Figure 5.2.
In the nanosecond regime, the production of multiply charged atomic ions is
based on the heating of quasi-free electrons by the optical field. In the majority of
experiments, Xe cluster beam is generated by nozzle expansion and the size distri-
bution of neutral clusters is inferred on the basis of Hagena’s theory [13], which
predicts that the average cluster size increases with the nozzle diameter and the
stagnation pressure.
It was observed that the maximum kinetic energy of ions increases with increas-
ing cluster size [6, 67]. A model has been developed to explain the large kinetic
energies of the atomic ions thus formed [68]. An important point emerging from
reports [8,10] is that the production of multiply charged atomic ions increases with
laser wavelength and neutral cluster size.
In view of the above, it is interesting to investigate how the yield of multiply
charged ions depends on the cluster size. Furthermore, some relationship may also
be expected between the kinetic energy and charge state carried by fragment ions
as a function of the neutral cluster size as more electrons are quasi-bound to larger
cluster surface [8]. For the investigation of the dependence of multiply charged ions
and their kinematics on the neutral cluster size, mean cluster ion size is calculated
from the mass spectra under UV irradiation (discussed in chapter 4). The mean
cluster ion size determined from the mass spectrum under UV irradiation is treated
as a proxy for neutral cluster size.
5.2 Characteristics of atomic ions resulting from MPI
of clusters
For investigating the dependence of mean kinetic energy and mean charge state
of fragment ions on cluster size, mass spectra of multiply charged Xe atomic ions
are recorded under different stagnation pressures. These investigations reveal the
dependence of distribution of fragment ions on cluster size.
52
Chapter 5. Multiple charge ion formation in MPI of Xenon clusters
Mean charge state of atomic ions
For quantifying the efficiency of multiple ionization, the yield (Ni) of each charge
state (qi) formed in the mass spectrum can be a useful parameter, provided a robust
normalization method is available. However this is not the case, as even if the mass
spectra are recorded for fixed parameters of Nd:YAG laser with the same number
of shots, the flux of the cluster beam will not be constant for all the stagnation
pressures. This prevents the proper normalization for the yield of multiply charged
ions. The mean charge state, 〈q〉, of multiply charged atomic ions is estimated using
equation (5.1).
〈q〉=5
∑2(qiNi)/
5
∑2(Ni) (5.1)
Charge state 1 (monomer ions) is not included in the sum, since it can arise from
the dissociative as well as the non-dissociative processes.
Mean kinetic energy of fragment ions
The Coulomb explosion of a multiply charged cluster ion leads the formation of
atomic ions. The fragment ions with forward velocity (towards the detector) will
arrive earlier at detector than the fragment ions with initial velocity away from the
detector. The spread in the TOF profile due to the initial kinetic energy of ions can
be used to calculate the mean kinetic energy of fragments. It is often the case, that
a given ion may be formed by fragmentation of a variety of precursors. In such a
situation, the TOF line shape corresponding to each fragmentation channel will be
different. However, the individual line shapes will be symmetric about the same
mean value, and the variance of the TOF profile will be the weighted average of the
individual variances. The prescription for determining mean KE 〈K〉 following von
Busch [69] is,
〈K〉= 32m
q2E2σ
2 (5.2)
where σ2 is the variance of the TOF peak of mass m, charge q and E is the
53
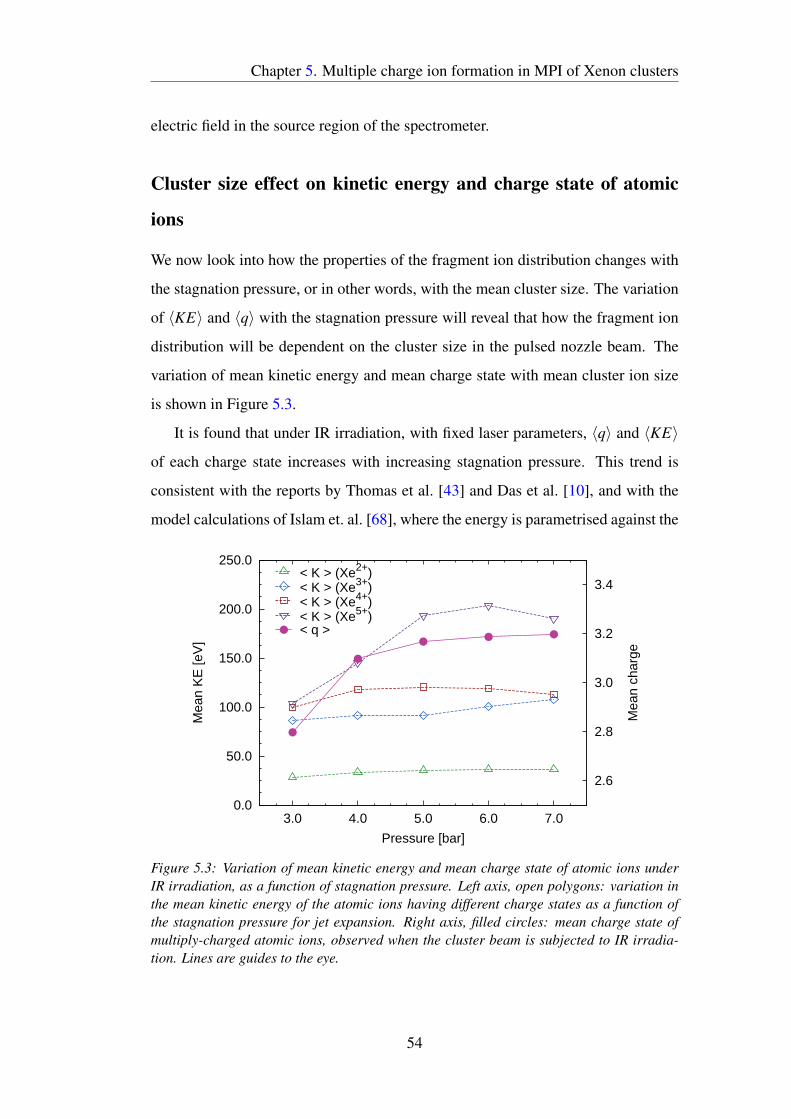
Chapter 5. Multiple charge ion formation in MPI of Xenon clusters
electric field in the source region of the spectrometer.
Cluster size effect on kinetic energy and charge state of atomic
ions
We now look into how the properties of the fragment ion distribution changes with
the stagnation pressure, or in other words, with the mean cluster size. The variation
of 〈KE〉 and 〈q〉 with the stagnation pressure will reveal that how the fragment ion
distribution will be dependent on the cluster size in the pulsed nozzle beam. The
variation of mean kinetic energy and mean charge state with mean cluster ion size
is shown in Figure 5.3.
It is found that under IR irradiation, with fixed laser parameters, 〈q〉 and 〈KE〉
of each charge state increases with increasing stagnation pressure. This trend is
consistent with the reports by Thomas et al. [43] and Das et al. [10], and with the
model calculations of Islam et. al. [68], where the energy is parametrised against the
0.0
50.0
100.0
150.0
200.0
250.0
3.0 4.0 5.0 6.0 7.0
2.6
2.8
3.0
3.2
3.4
Mea
n K
E [e
V]
Mea
n ch
arge
Pressure [bar]
< K > (Xe2+)< K > (Xe3+)< K > (Xe4+)< K > (Xe5+)< q >
Figure 5.3: Variation of mean kinetic energy and mean charge state of atomic ions underIR irradiation, as a function of stagnation pressure. Left axis, open polygons: variation inthe mean kinetic energy of the atomic ions having different charge states as a function ofthe stagnation pressure for jet expansion. Right axis, filled circles: mean charge state ofmultiply-charged atomic ions, observed when the cluster beam is subjected to IR irradia-tion. Lines are guides to the eye.
54
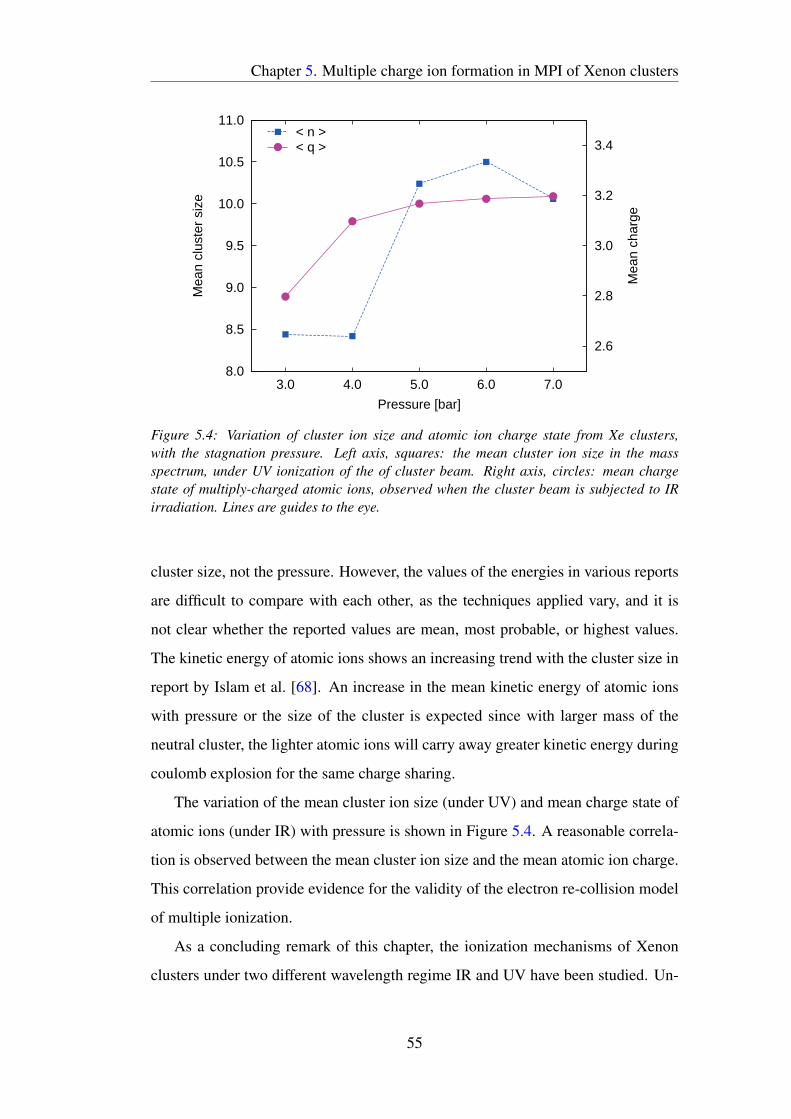
Chapter 5. Multiple charge ion formation in MPI of Xenon clusters
8.0
8.5
9.0
9.5
10.0
10.5
11.0
3.0 4.0 5.0 6.0 7.0
2.6
2.8
3.0
3.2
3.4
Mea
n cl
uste
r si
ze
Mea
n ch
arge
Pressure [bar]
< n >< q >
Figure 5.4: Variation of cluster ion size and atomic ion charge state from Xe clusters,with the stagnation pressure. Left axis, squares: the mean cluster ion size in the massspectrum, under UV ionization of the of cluster beam. Right axis, circles: mean chargestate of multiply-charged atomic ions, observed when the cluster beam is subjected to IRirradiation. Lines are guides to the eye.
cluster size, not the pressure. However, the values of the energies in various reports
are difficult to compare with each other, as the techniques applied vary, and it is
not clear whether the reported values are mean, most probable, or highest values.
The kinetic energy of atomic ions shows an increasing trend with the cluster size in
report by Islam et al. [68]. An increase in the mean kinetic energy of atomic ions
with pressure or the size of the cluster is expected since with larger mass of the
neutral cluster, the lighter atomic ions will carry away greater kinetic energy during
coulomb explosion for the same charge sharing.
The variation of the mean cluster ion size (under UV) and mean charge state of
atomic ions (under IR) with pressure is shown in Figure 5.4. A reasonable correla-
tion is observed between the mean cluster ion size and the mean atomic ion charge.
This correlation provide evidence for the validity of the electron re-collision model
of multiple ionization.
As a concluding remark of this chapter, the ionization mechanisms of Xenon
clusters under two different wavelength regime IR and UV have been studied. Un-
55
Chapter 5. Multiple charge ion formation in MPI of Xenon clusters
der IR irradiation, formation of multiply charged ions are observed while under UV
irradiation singly charged heavy cluster ions are seen in the mass spectrum. The for-
mation of multiply charged ions shows agreement with electron re-collision model.
Ionization schemes of clusters are employed to investigate the effect of cluster size
on the mean kinetic energy and mean charge state of fragment ions. It is found that
the mean kinetic energy and mean charge state of fragment ions increases with the
increasing cluster ions size.
56
Chapter 6
Summary and future prospects
6.1 Summary
To generate a beam of neutral clusters from solid, hollow cathode sputtering source
and laser ablation source are developed. For producing carbon clusters, a rich envi-
ronment of carbon soot is vital in hollow cathode sputtering source and laser abla-
tion source. Optical emission spectroscopic study of carbon soot from these sources
reveal the formation of carbon dimer.
Control over the formation of C2 with the discharge current and Argon gas pres-
sure in sputtering source is investigated using OES. It is found that C2 yield in-
creases with an increase in discharge current. An increase in gas pressure lead to
an increase in three body collision thus cooling of ejecta improves and therefore
Tvib preserves a decreasing trend with increase in gas pressure. It is found that the
dominant process for C2 production in the present source is the three body collision
between carbon ejecta and Argon atoms. Emission spectroscopy of laser ablation
source reveal the formation of C2 and neutral C. Variation of C2 intensity with delay,
type of gas (Argon and N2) and gas pulse duration have been studied. It is found
that an increase in gas pulse duration lead to enhanced C2 yield. Increase in gas
pulse duration lead to increase number density of Argon atoms and thus cooling of
C2 gets improved.
Mass spectrometric study of sputtering source reveal the production of carbon
clusters and mixed clusters of carbon and Argon. There are more complexities,
57
Chapter 6. Summary and future prospects
such as alignment of plume with gas and synchronization of three pulses (laser
pulse used for ablation, gas pulse and ionizing pulse), involved in the laser ablation
source. Due to any of these difficulties, we could not get TOF mass spectrum of
carbon cluster ions using laser ablation source.
For generating clusters from gas, a pulsed nozzle source is developed. Using this
source Xenon clusters, Ethyl alcohol clusters and mixed clusters of Water vapor,
Ethyl alcohol and Benzene are produced. The effect of experimental parameters,
such as delay, stagnation pressure and distance between nozzle and skimmer on
cluster formation have been studied.
The multi-photon ionization (MPI) of Xenon clusters under IR irradiation and
UV irradiation of an Nd:YAG laser with intensity ∼1010 W/cm2 has been studied.
Clusters are generated by a pulsed nozzle source. Clusters under IR irradiation
lead to copious multiple ionization, giving atomic ions of charge states up to Xe5+.
When clusters are ionized using UV irradiation, the ion yield is found to be nearly
free of multiply charged ions, and comprises mainly of singly charged clusters ions.
Xenon cluster ions up to size 70 are seen in the mass spectrum under UV irradiation.
The mean cluster ion size observed in the mass spectrum is found to increase with
the increasing stagnation pressure. The mean detected cluster ion size under UV
irradiation is a reasonable proxy for the variation in the neutral cluster size distri-
bution. As the effectiveness of the re-collision mechanism hinges on the size of the
cluster, the observed positive trends in the mean cluster ion size, mean atomic ion
charge state and the the mean kinetic energy of the atomic ion with the stagnation
pressure provides support to the electron re-collision model for explaining multiple
ionization.
6.2 Future prospects
The hollow cathode sputtering source can be used to generate beam of carbon clus-
ters and pulsed nozzle source can be used to produce H2O, NOX , SOX , CO2 clus-
ters. The collision of clusters with atoms, molecules as well as photo-ionization of
different clusters can be studied using these sources.
58
Chapter 6. Summary and future prospects
The investigation of hetero-phase chemical reaction between the molecules ad-
sorbed onto the surface of carbon clusters and exposed to UV photons can reveal the
role of carbon clusters for the production of reaction product. For performing such
experiments, a carbon cluster beam generated by sputtering source can be passed
through a gas cell containing molecular vapor. The interaction between carbon clus-
ter and molecule may lead to the adsorption of molecule on the surface of cluster
resulting in the formation of mixed clusters. In the presence of UV irradiation,
chemical reaction between the adsorbed molecules can be studied using TOF. The
understanding of such complex reactions could be helpful to model the atmospheric
reactions.
59
Bibliography
[1] L. Belau, S. E. Wheeler, B. W. Ticknor, M. Ahmed, S. R. Leone, W. D. Allen,
H. F. Schaefer and M. A. Duncan, J. Am. Chem. Soc. 129, 10229–10243
(2007).
[2] P. G. Reinhard and E. Suraud, Introduction to cluster dynamics: Hardcover
Edition; Wiley-VchVerlag Gmbh (2004).
[3] H Pauly, Atom, molecule and cluster beams part2: Hardcover Edition;
Springer Berlin Heidelberg (2000).
[4] Y. L. Shao, T. Ditmire, J. W. G. Tisch, E. Springate, J. P. Marangos, and M. H.
R. Hutchinson, Phys. Rev. Lett. 77, 16 (1996).
[5] A. McPherson, B. D. Thompson, A. B. Borisov, K. Boyer and C. K. Rhodes,
Nature 370, 631–634 (1994).
[6] T. Ditmire, J. W. G. Tisch, E. Springate, M. B. Mason, N. Hay, R. A. Smith, J.
Marangos, M. H. R. Hutchinson, Nature 54, 386 (1997).
[7] T. Ditmire, J. W. G. Tisch, E. Springate, M. B. Mason, N. Hay, J. P. Marangos,
M. H. R. Hutchinson, Phys. Rev. Lett. 78, 2732 (1997).
[8] X. Luo, H. Li, D. Niu, L. Wen, F. Liang, B. Wang, and X. Xiao, Phys. Rev. A
76, 013201 (2005).
[9] D. Niu, H. Li, F. Liang, X. Luo and L. Wen, Appl. Phys. Lett. 87, 034103
(2005).
60
Bibliography
[10] S. Das, P. M. Badani, P. Sharma and R. K. Vatsa, Chem. Phys. Lett. 552, 13–19
(2012).
[11] K. Nagaya, H. Iwayama, H. Murakami, M. Yao, H. Fukuzawa, K. Motomura,
K. Ueda, N. Saito, L. Foucar, M. Nagasono, A. Higashiya, M. Yabashi, T.
Ishikawa, H. Kimura, H. Ohashi, Journal of Electron Spectroscopy and Re-
lated Phenomena 181, 125–128 (2010).
[12] H. Wabnitz, L. Bittner, A. R. B. de Castro, R. Dohrmann, P.Gurtler, T. Laar-
mann, W. Laasch, J. Schulz, A. Swiderski, K. von Haeften, T. Moller, B. Faatz,
A. Fateev, J. Feldhaus, C. Gerth, U. Hahn, E. Saldin, E. Schneidmiller, K.
Sytchev, K. Tiedtke, R. Treusch M. Yurkovk, Nature 420, 482–485 (2002).
[13] O. F. Hagena and W. Obert, J. Chem. Phys. 56, 1793 (1972).
[14] P. Fayet and L. Woste, Surf. Sci. 156, 134 (1985).
[15] W. Begemann, S. Dreihofer, K. H. Meiwes-Broer and H. O. Lutz, Z. Phys. D
3, 183 (1986).
[16] T. F. Maguera, D. E. David and J. Michel, J. Chem. Soc. Faraday Trans. 86,
2427 (1992).
[17] A. C. Xenoulis, P. Trouposkiadis, C. Papastaikoudis, A. A. Katsansos and A.
Clouvas, Nanostructured Materials 7, 473 (1996).
[18] S. Ahmad, Eur. Phys. J. D 18, 309–318 (2002).
[19] G. K. Wehner, Adv. Electron. Electron Phys. 7, 258 (1955).
[20] A. P. M. Baede, W. F. Jungman and J. Los, Physica 54, 459 (1971).
[21] P. Fayet and L. Woste, Z. Phys. D. 3, 177 (1986).
[22] D. M. Lindsay, F. Meyer and W. Harbich, Z. Phys. D 12, 15 (1989).
[23] S. A. Janjua, M. Ahmad, S. Khan, R. Khalid, A. Aleem and S. Ahmad, J. Phys.
D: Appl. Phys.40, 1416–1421 (2007).
61
Bibliography
[24] R. S. Pessoa, G. Murakami, G. Petraconi, H. S. Maciel, I. C. Oliveira, and K.
G. Grigorov, Braz. J. Phys. 36, 332 (2006).
[25] A. C. Xenoulis, G. Doukellis, P. Tsouris, A. Karydas, C. Potiriadis, A. A.
Katsanosc and Th. Tsakalakos, Vacuum 51, 357 (1998).
[26] S. Ahmad, Eur. Phys. J. D 15, 349–354 (2001).
[27] L. P. Levine, J. F. Ready and E. Bernal, J. Quantum Electron. 4, 18 (1968).
[28] J. F. Friichtenicht, Rev. Sci. Instrum. 45, 51 (1974).
[29] J. C. Miller, Laser ablation, Springer, Berlin (1994).
[30] D. J. Elliiot, Ultraviolet laser technology and applications, Academic press-
New York (1995).
[31] H. W. Kroto, J. R. Heath, S. C. O’Brien, R. F. Curl, R. E. Smalley, Nature 318,
162 (1985).
[32] W. A. de Heer and P. Milani, Z. Phys. D 20, 437–439 (1991).
[33] M. A. Duncan, Rev. Sci. Instrum. 83, 041101 (2012).
[34] E. A. Rohlfing, D. M. Cox and A. Kaldor, J. Chem. Phys 81, 3322 (1984).
[35] S. Maruyama, L. R. Anderson and R. E. Smalley, Rev. Sci. Instrum. 61, 3686
(1990).
[36] T. G. Dietz, M. A. Duncan, D. E. Powers, and R. E. Smalley, J. Chem. Phys.
74, 6511 (1981).
[37] H. Murphy and D. Miller, J. Phys. Chem. 88, 4474 (1984).
[38] E. W. Becker, K. Bier and W. Henkes, Z. Phys. 146, 333 (1956)
[39] O. F. Hagena, Rev. Sci. Instrum. 63, 2374 (1992).
[40] M. Lezius, S. Dobosz, D. Normand and M. Schmidt, Phys. Rev. Lett. 80, 261
(1998).
62
Bibliography
[41] A. V. Malakhovskii, J. Phys. D 33, 556–563 (2000).
[42] V. P. Krainov and M. B. Smirnov, Physics Reports 370, 237–331 (2002).
[43] H. Thomas, A. Helal, K. Hoffmann, N. Kandadai, J. Keto, J. Andreasson, B.
Iwan, M. Seibert, N. Timneanu, J. Hajdu, M. Adolph, T. Gorkhover, D. Rupp,
S. Schorb, T. Moller, G. Doumy, L. F. DiMauro, M. Hoener, B. Murphy, N.
Berrah, M. Messerschmidt, J. Bozek, C. Bostedt, and T. Ditmire, Phys. Rev.
Lett. 108, 133401 (2012).
[44] G. Chen, B. Kim, B. Ahn, and D. Eon Kim, J. App. Phys. 106, 053507 (2009).
[45] R. A. Smith, T. Ditmire and J. W. G. Tisch, Rev Sci Instrum (1998), 69, 3798–
3804.
[46] O. F. Hagena, Surf. Sci. 106, 101 (1981).
[47] T. Gough, D. Knight and G. Scoles, Chem. Phys. Lett. 97, 155 (1983).
[48] S. Leutwyler, J. Chem. Phys. 81, 5480 (1984).
[49] C. P. Schulz, R. Haugstatter, H. U. Tittes and I. V. Hertel, Z. Phys. D 10,
279–290 (1988).
[50] W. Swan, Transactions of the Royal Society of Edinburgh 21, 411–430 (1857).
[51] R. W. P. McWhirter, Spectral intensities, Plasma Diagnostic Technique, R.H.
Huddlestone, S.L. Leonard (Eds.), Accademic Press, New York (1965).
[52] G. Herzberg. Spectra of Diatomic Molecules (Molecular Spectra and Molecu-
lar Structure)–Vol.1. NewYork: Van Nostrand, 2nd ed (1950).
[53] W. C. Wiley and I. H. McLaren, Rev. Sci. Instrum. 26, 1150–1156 (1955).
[54] J. L. Wiza, Nuclear Instum. and Methods 162, 587–601 (1979).
[55] G. S. Voronov and N. B. Delone, Soviet Phys. JETP Letters 1, 66 (1965).
[56] S. L. Chin, Phys. Rev. A 4,992–996 (1971).
63
Bibliography
[57] L.V. Keldysh, Sov. Phys. JETP 20, 1307 (1965).
[58] S. Augst, D. Strickland, D. D. Meyerhofer, S. L. Chin and H. Eberly, Phys.
Rev. Lett. 63, 2212 (1989).
[59] S. Das, P. Sharma and R. K. Vatsa, J. Chem. Sci. 121, 965–972(2009).
[60] I. S. Gilmore and M. P. Seah, Int. J. Mass Spec. 202, 217 (2002).
[61] T. Ditmire, P. K. Patel, R. A. Smith, J. S. Wark, S. J. Rose, D. Milathianaki, R.
S. Marjoribanks and M. H. R. Hutchinson, J. Phys. B 31, 2825–2831 (1998).
[62] T. Ditmire, T. Donnelly, A. M. Rubenchik, R. W. Falcone and M. D. Perry,
Phys. Rev A 53, 3379–3402 (1996).
[63] U. Saalmann, Ch. Siedschlag and J. M. Rost, J. Phys. B 39, 39–77 (2006).
[64] L. A. LaJohn, P. A. Christiansen, R. B. Ross, T. Atashroo, and W. C. Ermler,
J. Chem. Phys. 87, 2812 (1987).
[65] K. C. Kulander, K. J. Schafer and J. L. Krause, Laser Physics 3, 359-364
(1993).
[66] W. Wang, H. Li, D. Niu, L. Wen and N. Zhang, Chem. Phys. 352, 111 (2008).
[67] E. Springate, N. Hay, J. W. G. Tisch, M. B. Mason, T. Ditmire, J. P. Marangos
and M. H. R. Hutchinson, Phys. Rev. A 61, 063201 (2000).
[68] Md. R. Islam, U. Saalmann and J. M. Rost, Phys. Rev. A 73, 041201 (2006).
[69] F von Busch, J. Phys. B 34, 431 (2001).
64