Embed Size (px)
Citation preview
PERPUSTAKAAN UMP STUDY OF CONCRETE GR 111111
"11111111111
lAGE PROVIDES BY
]TrsiF:[.II
1111
0000098341
MOHAMAD FARHAN BIN ABU SAMAH
Report submitted in fulfillment of the requirements for the award of the degree of
Bachelor of Engineering (Hons) in Civil Engineering
Faculty of civil Engineering and Earth Resources
UNIVERSITI MALAYSIA PAHANG
JANUARY 2015
iv
ABSTRACT
Infrared thermography (IRT) has been used in the civil engineering field for different applications such as highway, bridge and concrete structures. Infrared have been using worldwide in non-destructive methods to evaluate bridges, building, highway pavement and airport. Previous research has shown that IRT can detect cracking, void and leaking on the structure. IRT systems provide a new non-destructive method to test every failure that occurs in the structure of building. Besides easy to perform, IRT also accurate and detail if the data required are supplied enough. With nowadays technological advances it is required to find a new method that are more users friendly. The main advantage of IRT than the others destructive testing techniques is that big scale areas can be scanned easily and practically with no need to destroy any building structure during testing. These will results to the main reduce in time, worker, work and machinery. The IRT device is no risky, as it does not release any radiation; it only records the infrared radiation release by the material that is under testing. The procedure is to scan the concrete cube under same stress and produce the infrared thermography image. This procedure will use different concrete's grade which are 25, 30, 35, 40, 45 and 50. Every changes of colour due to the load apply and difference grade of concrete will be recorded. Test was performed in the lab to have more quality image. All the data that been gather must be analysed using Colour Detector software and the result should be shown by using IRT analysis system.
ABSTRAK
Termografi inframerah telah digunakan dalam bidang kejuruteraan awam bagi aplikasi yang berbeza seperti di lebuhraya, jambatan dan struktur bangunan konkrit. Infrarnerah telah digunakan di seluruh dunia dalam kaedah tanpa musnah untuik menilai jambatan, bangunan, kaki lima lebuhraya dan lapangan terbang. Kajian sebelum mi menunjukkan bahawa IRT boleh mengesan keretakan, kelembapan dan kebocoran di struktur bangunan. Infrared Termografi (IRT) merupakan kaedah tanpa musnah yang barn untuk menguji setiap kegagalan yang berlaku di dalam struktur bangunan. Selain daripada mudah untuk dilaksanakan, IRT juga menghasilkan data yang tepat dan terperinci jika data yang diperlukan mencukupi. Dengan kemajuan teknologi pada masa kini, IRT amat diperlukan untuk mencari kaedah barn yang lebih kepada mesra pengguna. Kelebihan utama IRT daripada teknik-teknik ujian tanpa musnah ialah kawasan berskala besar dan luas boleh diimbas dengan mudah dan praktikal tanpa perlu untuk memusnahkan mana-mana struktur bangunan semasa ujian. mi dapat mengurangkan masa, pekerja, kerja dan jentera. Peralatan IRT tidak berisiko, kerana ia tidak melepaskan sebarang radiasi, ia hanya mencatat pelepasan radiasi inframerah. Kajian mi adalah untuk mengimbas kiub konkrit di bawah tekanan yang sarna iaitu 50 kN dan menganalisis data imej termografi inframerah yang terhasil. Prosedur im menggunakan gred konkrit yang berbeza seperti berikut gred konkrit 25, 30, 35, 40, 45 dan 50. Setiap perubahan warna disebabkan oleh tekanan pada gred konkrit yang berbeza direkodkan. Ujian dilaksanakan di dalam makmal untuk menghasilkan imej yang lebih bermutu. Semua data yang telah terkumpul dianalisis menggunakan perisian pengesan warna dan hasilnya dipaparkan dengan mengunakan'IRT analysis system'.
TABLES OF CONTENTS
SUPERVISOR'S DECLARATION
STUDENT'S DECLARATION
ACKNOWLEDGEMENTS
ABSTRACT
ABSTRAK
TABLES OF CONTENTS
LIST OF TABLES
LIST OF FIGURES
LIST OF SYMBOLS
LIST OF ABBREVIATIONS
LIST OF APPENDICES
CHAPTER 1 INTRODUCTION
1.1 BACKGROUND 1
1.2 PROBLEM STATEMENT 3
1.3 OBJECTIVES OF THE STUDY 3
1.4 SCOPE OF STUDY 4
1.5 SIGNIFICANCE OF STUDY 4
CHAPTER 2 LITERATURE REVIEW
2.1 TESTING FOR HARDENED CONCRETE 6
2.2 DESTRUCTIVE TEST 7
2.2.1 Compression Strength of Concrete using Cube Test 8
2.2.2 Tensile Strength of Concrete using Direct Tension Test 9
2.2.3 Tensile Strength of Concrete using Split-Cylinder Test 10
vi
I
11
111
Iv
V
A
ix
x
xi
xi
VII
2.2.4 Tensile Strength of Concrete using Flexural Test 10
2.3 NON DESTRUCTIVE TEST (NDT) 11
2.3.1 Rebound Hammer Test 12
2.3.2 Ultrasonic Pulse Velocity (UPV) 13
2.3.3 Penetration Test 13
2.3.4 Pull Out Test 14
2.3.5 Infrared Thermography 15
2.3.5.1 Active and Passive Thermography 16
2.3.5.2 Theoretical Consideration 17
2.3.5.3 Advantages of Infrared Thermography 19
CHAPTER 3 METHODOLOGY
3.1 INTRODUCTION 20
3.2 EXPERIMENTAL PROSEDUR 21
3.3 RESEARCH EQUIPMENT 22
3.3.1 Infrared Thermography 22
3.3.2 Types of IRT 24
3.3.2.1 Cooled Infrared Detectors 24
3.3.2.2 Uncooled Infrared Detectors 25
3.3.2.3 Specifications 26
3.4 LAB PROSEDURE 26
3.5 ANALYSIS OF DATA 27
3.5.1 IRT Analysis System 27
CHAPTER 4 RESULTS AND DISCUSSION
4.1 INTRODUCTION 28
4.2 IRT IMAGE 29
4.3 RED, GREEN, BLUE (RBG) VALUE FROM IRT IMAGE 31
VIII
4.3.1 RGB Value for concrete cube during compression 31
4.4 DATA ANALYSIS 44
4.5 GRAPH OF RGB VALUE 47
CHAPTER 5 CONCLUSION AND RECOMMENDATION
5.1 CONCLUSION 49
5.2 RECOMMENDATION 50
REFERENCES
APPENDICES
Al Research Methodology
A2 IRT Camera
A3 Image Captured by IRT Camera.
LIST OF TABLES
Table No. Page
Table 4.1 IRT Image before and during compress 29
Table 4.2 IRT Image before and during compress 30
Table 4.3 Concrete Grade 25 MPa for Sample One (1) 31
Table 4.4 Concrete Grade 25 MPa for Sample Two (2) 32
Table 4.5 Concrete Grade 30 MPa for Sample One (1) 33
Table 4.6 Concrete Grade 30 MPa for Sample Two (2) 34
Table 4.7 Concrete Grade 35 MPa for Sample One (1) 35
Table 4.8 Concrete Grade 35 MPa for Sample Two (2) 36
Table 4.9 Concrete Grade 40 MPa for Sample One (1) 37
Table 4.10 Concrete Grade 40 MPa for Sample Two (2) 38
Table 4.11 Concrete Grade 45 MPa for Sample One (1) 39
Table 4.12 Concrete Grade 45 MPa for Sample Two (2) 40
Table 4.13 Concrete Grade 45MPa for Sample Three (3) 41
Table 4.14 Concrete Grade 50 MPa for Sample One (1) 42
Table 4.15 Concrete Grade 50 MPa for Sample Two (2) 43
ix
LIST OF FIGURES
Figure No. Page
Figure 2.1 Transient thermal NDT approaches 17
Figure 3.1 Flow chart of experimental study 21
Figure 3.2 A thermal image showing temperature variation in a hot air 23
balloon.
Figure 3.3 Athermography image of several lizards 25
Figure 4.1 Raw image from IRT camera 44
Figure 4.2 Image with grid numbering 44
Figure 4.3 Produce RGB value using Colour Detector. 45
Figure 4.4 IRT Calculation System before key in the RGB Value 45
Figure 4.5 Key in process of RGB value for each 15 point in IRT analysis 46
system
Figure 4.6 Result shown after click the "Show Result". 46
Figure 4.7 Graph of concrete grade under stress 50 kN versus RGB Values 47
x

LIST OF SYMBOLS
pm Micrometre
°C Celsius
lambda
xi
LIST OF ABBREVIATION
NDT Non Destructive Method
kN Kilo Newton
min Millimetre
m Meter
RGB Red, Green, Blue
IRT Infrared Thermography
ITAR International Traffic in Arms Regulations
NETD Noise-equivalent temperature difference
MRTD Minimum resolvable temperature difference
CPWD Central Public Works Department of India
PT pulsed thermography
PPT pulsed phase thermography
TM thermal modelling
XII
CHAPTER 1
INTRODUCTION
1.1 BACKGROUND
In the early 19th century, an astronomer William Herschel discovers the concept of
an infrared radiation. Herschel showcased the outcome of his experiment in 1800 in front of
the Royal Society of London. Herschel took a prism to deflect light from the sun and
identified the infrared that got past the red part of the spectrum with the support of an
enhancement in the temperature displayed on a thermometer. He was astonished with the
outcome and termed them "Calorific Rays". The word 'Infrared' failed to prove its
significance and it was only after late 19th century, people gradually came to know the term
after understanding its manifold applications in diverse industry verticals (Rao, 2008).
A thermal imaging device gives the ability to see targets in darkness or smoke.
During an interview at the International Robots & Vision Show, Dr Austin Richards
(Indigo Systems) stated that thermal imaging is a technology that creates a photographic
image or video sequence of light emitted by an object at terrestrial temperatures. Infrared
thermography is not the same as night vision. Night vision operates on the principle of light
amplification, so in a totally dark environment light amplification would yield no image
where as a thermal imager would (Rao, 2008).
2
Infrared thermography is equipment or method, which detects infrared energy
emitted from object, converts it to temperature, and displays image of temperature
distribution. To be accurate, the equipment and the method should be called differently, the
equipment to be called as infrared thermograph and the method to be called as infrared
thermography. Recently, however, more and more public literatures show tendency not to
pay attention to such appellative. The equipment call as infrared thermography considering
such generalization of the terminology. Thermal imaging devices were first developed for
military purposes. According to Bullard Thermal Imaging, "In the late 1950s and 1960s,
Texas Instruments, Hughes Aircraft, and Honeywell developed single element detectors
that scanned scenes and produced line images. These basic detectors led to the development
of modem thermal imaging (Cannas, 2012).
Most materials absorb infrared radiation over a wide range of wavelengths, causing
an increase in their temperature. All objects with a temperature greater than absolute zero
emit infrared energy, and even glowing objects usually emit far more infrared energy than
visible radiation. Thermal imaging is a technique for converting a thermal radiation pattern,
which is invisible to the human eye, into a visual image. To achieve this, an infrared
camera is used to measure and image the emitted infrared radiation from an object. Since
this radiation is dependent upon the object surface temperature, it makes it possible for the
camera to calculate and display this temperature. However, radiation measured by the
camera does not only depend on the temperature of the object, but also its emissivity and its
absorption by the atmosphere. Further radiation (e.g. reflected from the sun) may be
introduced by the surroundings, which may be reflected on the object (Wild, 2007).
Infrared thermography (IRT) is a modem tool for examination of nondestructive
Structural building. Thermography is determination surface temperature of objects with
help of infrared camera. Infrared camera provides a visual of temperature measurement in
building from inside and outside. IRT used to check the concrete condition during the
concrete under stress using the image and visual that provided by the IRT. The measurement presented performed by using compression machine given certain load to the
Concrete. Image from IRT show several of colour's pattern causes of the stress happen on
3
the concrete. Difference colour on the image show difference load react to the concrete's
structure, IRT image been taken before the compression test, during the compression test
and after the compression test to achieve good result and data (Rao, 2008).
It captures as a temperature distribution on a surface, and it can display as a visible
information. Temperature can be measured from a distance without contacting an object.
Temperature can be measured in real time. Relative comparison of distribution of surface
temperature can be made over a wide area. Temperature can be measured easily for a
moving object or an object which is dangerous to get close to. Temperature of small object
can be measured without confusing the temperature. Temperature of food, medicine or
chemicals can be measured in a sanitary fashion. Temperature of an object with drastic
temperature change or a phenomenon during a short period of time can be measured.
1.2 PROBLEM STATEMENT
Infrared thermography is contactless measurement for analysis of building
structures. By using IRT that can be used in real situation with non-destructive method to
check the stress happen on structural of the building. The method more accurate, easy and
economical since only use IRT that can be handling by single person than using destructive
method that can damage the structure or need to operate by skill worker.
1.3 OBJECTIVES
Based on research problem statement, this research aims to achieve two (2) objectives.
i. To determine concrete grade under stress using image provides by Infrared
thermography Camera (IRT).
ii. To produce and come out set of data by using Colour Detector and IRT Analysis
System.
4
1.4 SCOPE OF STUDY
In particular, this research will be conducted following these five (5) scopes of study.
i. Determine concrete grade under stress of 50 kN by image provides by using
Infrared Thermography IRT.
ii. Determine concrete grade under stress for concrete grade 25, 30, 35, 40,45 and 50.
iii. Using Compression Test for concrete cube testing.
iv. Sample using 2 (two) to 3 (three) concrete cube for each concrete's grade.
V. Develop set of data from image captured by infrared camera by using IRT Analysis
System based on Colour Detector software.
1.5 RESEARCH SIGNIFICANCE
Within recent years there has been an increase in the use of Non-Destructive
Technique (NDT) methods to detect defects and anomalies in various civil engineering
structures. Infrared thermography, which has been successfully used in the United State of
America (USA) in civil engineering applications, is being increasingly applied in the
United Kingdom(UK) as a NDT. For example, the technique is now included in the
Building Regulations for the assessment of thermal insulation for all new non-domestic
buildings from April 2002. One of the perceived limitations of infrared thermography is
that in temperate climates it is too cold to use this technique since there is rarely the
extreme solar exposure that has enabled the successful use of thermography to detect render
deboning and concrete spilling utilizing solar heating. However, with the advancements in
modem technology it is now possible to detect smaller changes in temperature,(down to 0.08 C C to8°C). This paper shows that even with the low ambient temperatures experienced
in Europe it is possible to use infrared thermography to identify correctly known areas of delimitation in a concrete bridge structure and also to investigate the internal structure of a
masonry bridge (Maldague, 2002).
Infrared thermography and impulse radar have been used together on a number of
occasions in the civil engineering industry for different applications such as concrete
structure sand on highway bridges in the USA. Weil has shown that bridges, highway and
airport pavement have been tested with both infrared and radar finding a variety of faults
ranging from cracks on airport pavements to delimitation on concrete bridges. Infrared
Thermography (IRT) systems provide a new nondestructive method to test every failure
that occurs in the structure of building. Besides easy to perform, IRT also accurate and
detail if the data required are supplied enough. With nowadays technological advances it is
required to find a new method that are more users friendly that even unskilled worker can
conduct the test (Maldague, 2002).
CHAPTER 2
LITERATURE REVIEW
2.1 TESTING FOR HARDENED CONCRETE
The standard method of determining strength of hardened concrete consists of
testing concrete cubes in compression. The quality of entire concrete of a structure cannot
be fully assessed by testing a few concrete cubes. The results obtained in testing cubes do
not always reflect the actual strength of concrete in construction. In a whole day, concreting
work cubes are cast in a few batches, the differences (unintentional and intentional) in the
composition are not uncommon, their compaction and their hardening conditions always
differ more or less from those of the structure. In addition, the number of test cubes is
generally so small that they can only be considered as random tests. Sometimes, in case of
failure of cubes, doubtful concrete, cracks, deterioration of concrete, etc. it becomes
necessary to assess the quality and strength of concrete of the structure. As far back as early
thirties, the necessity was felt to develop instruments by which in-situ strength of concrete
may be obtained (Verma, 2013).
7
Various non-destructive methods of testing concrete have been developed, which
include, Rebound hammer, Pull out techniques, Windsor probe, Ultrasonic pulse velocity
methods, Radioactive and nuclear methods, Magnetic and electrical methods. In all these
methods of tests, due to simplicity, rebound hammer test based on surface hardness
becomes most popular in the world for non-destructive testing of in-situ concrete.
2.2 DESTRUCTIVE TEST
In destructive testing, tests are carried out to the specimen's failure, in order to
understand a specimen's structural performance, composition of structure or material
behavior under different loads and stress. These tests are generally much easier to carry out,
yield more information, and are easier to interpret than non-destructive testing. Destructive
testing is most suitable, and economic, for objects which will be mass-produced, as the cost
of destroying a small number of specimens is negligible. It is usually not economical to do
destructive testing where only one or very few items are to be produced (for example, in the
case of a building). Analyzing and documenting the destructive failure mode is often
accomplished using a high-speed camera recording continuously (movie-loop) until the
failure is detected (Oussama, 2008).
Detecting the failure can be accomplished using a sound detector or stress gauge
which produces a signal to trigger the high-speed camera. These high-speed cameras have
advanced recording modes to capture almost any type of destructive failure. After the
failure the high-speed camera will stop recording. The capture images can be played back
in slow motion showing precisely what happen before, during and after the destructive
event, image by image. There are three type of destructive method which is compression
strength concrete using cube test, tensile strength of concrete using direct tension test, split-
cylinder test and flexural test and flexural strength. Building structures or large non-
building structures such as dams and bridges are rarely subjected to destructive testing due to the prohibitive cost of constructing a building (Oussama, 2008).
8
2.2.1 Compression Strength of Concrete using Cube Test
Compression test of the concrete specimen is most widely used test to measure its
compressive strength. Two types of concrete specimen: Cubes & Cylinders are used for this
purpose. Cubes of size 150mm are more common in Asia, Russia & European countries
while Cylinders of 150mm in diameter & 300mm high are common in U.S and Australia.
Cubes for compression test are casted in a steel or cast-iron mould of prescribed
dimensions. BS 1881: Part 108: 1983 requires filling the mould in layers of approximately
50 mm. Compaction of each layer is achieved by not less than 35 strokes for 150mm cubes
or 25 strokes for 100 mm cubes. A standard tamping bar of a 25mm square of steel section
is used for this purpose. Compaction by vibration may also be used (Ephraim, 2012).
After finishing the cube, it should be stored at a temperature of 150°C to 250°C,
when the cubes are to be tested at or more than 7 days. When the test days is less than 7
days the temperature to be maintained is 180T to 220°C. Also, relative humidity of 90
percent is to be maintained always. The cube is remolded just before testing at 24 hours.
For greater ages at test, remolding takes place between 16 to 28 hours after adding water in
a concrete mix and the specimens are stored in a curing tank at 180°C to 220°C until the
required age (Ephraim, 2012).
The most common age at testing is 28 days, but tests can be made at 1, 3, 7 & 14
days also. At the time of testing the specimen is placed in a "Compression Testing
Machine" with the position of cubes at right angles to the position of cast. The load is
applied at a constant rate of stress within the range of 0.2 to 0.4 MPaJsec. Under pure
uniaxial compression loading, the failure cracks generated are approximately parallel to the
direction of applied load with some cracks formed at an angle to the applied load.
Practically, the compression testing system rather develops a complex system of stresses
due to end restraints by steel plates (Ephraim, 2012).
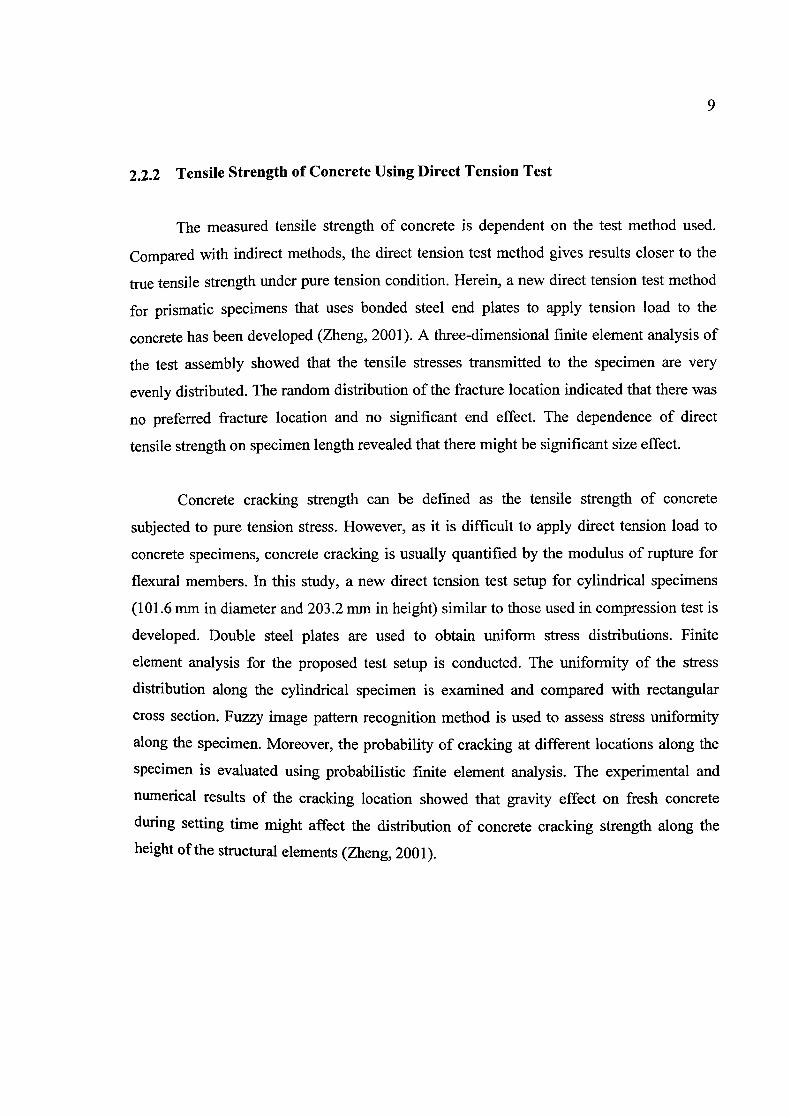
2.2.2 Tensile Strength of Concrete Using Direct Tension Test
The measured tensile strength of concrete is dependent on the test method used.
Compared with indirect methods, the direct tension test method gives results closer to the
true tensile strength under pure tension condition. Herein, a new direct tension test method
for prismatic specimens that uses bonded steel end plates to apply tension load to the
concrete has been developed (Zheng, 2001). A three-dimensional finite element analysis of
the test assembly showed that the tensile stresses transmitted to the specimen are very
evenly distributed. The random distribution of the fracture location indicated that there was
no preferred fracture location and no significant end effect. The dependence of direct
tensile strength on specimen length revealed that there might be significant size effect.
Concrete cracking strength can be defined as the tensile strength of concrete
subjected to pure tension stress. However, as it is difficult to apply direct tension load to
concrete specimens, concrete cracking is usually quantified by the modulus of rupture for
flexural members. In this study, a new direct tension test setup for cylindrical specimens
(101.6 mm in diameter and 203.2 mm in height) similar to those used in compression test is
developed. Double steel plates are used to obtain uniform stress distributions. Finite
element analysis for the proposed test setup is conducted. The uniformity of the stress
distribution along the cylindrical specimen is examined and compared with rectangular
cross section. Fuzzy image pattern recognition method is used to assess stress uniformity
along the specimen. Moreover, the probability of cracking at different locations along the
specimen is evaluated using probabilistic finite element analysis. The experimental and
numerical results of the cracking location showed that gravity effect on fresh concrete
during setting time might affect the distribution of concrete cracking strength along the
height of the structural elements (Zheng, 2001).
10
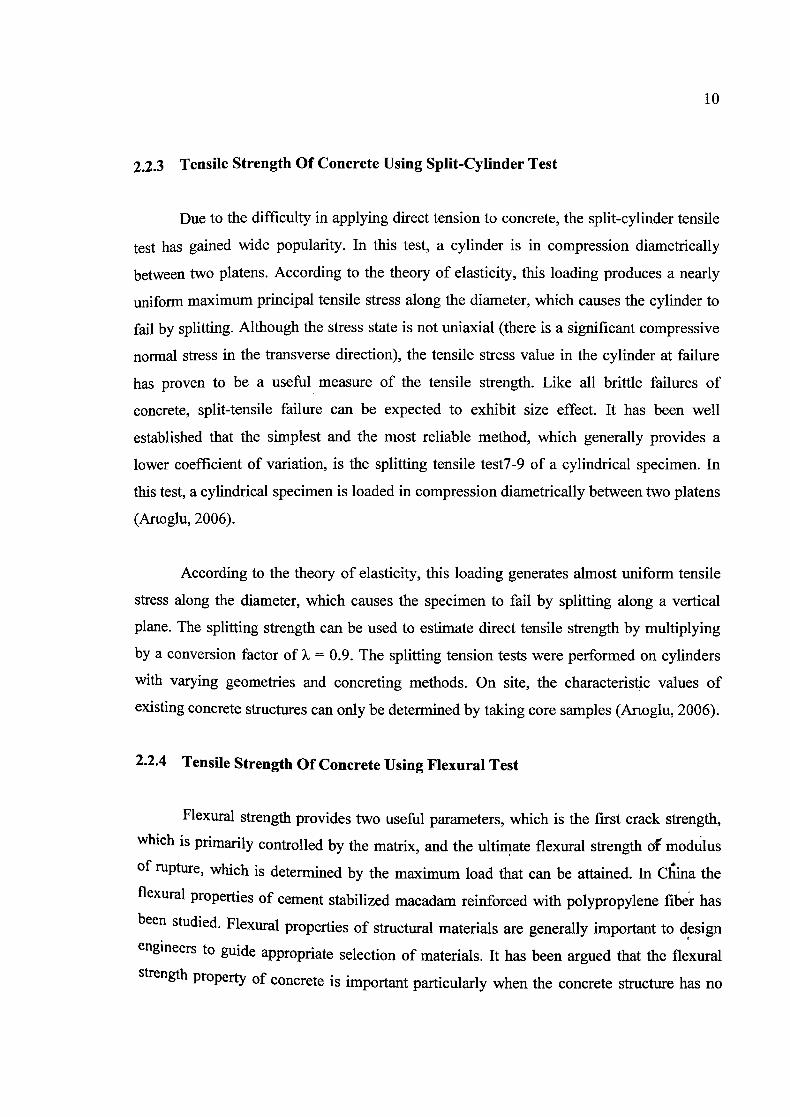
2.2.3 Tensile Strength Of Concrete Using Split-Cylinder Test
Due to the difficulty in applying direct tension to concrete, the split-cylinder tensile
test has gained wide popularity. In this test, a cylinder is in compression diametrically
between two platens. According to the theory of elasticity, this loading produces a nearly
uniform maximum principal tensile stress along the diameter, which causes the cylinder to
fail by splitting. Although the stress state is not uniaxial (there is a significant compressive
normal stress in the transverse direction), the tensile stress value in the cylinder at failure
has proven to be a useful measure of the tensile strength. Like all brittle failures of
concrete, split-tensile failure can be expected to exhibit size effect. It has been well
established that the simplest and the most reliable method, which generally provides a
lower coefficient of variation, is the splitting tensile test7-9 of a cylindrical specimen. In
this test, a cylindrical specimen is loaded in compression diametrically between two platens
(Artoglu, 2006).
According to the theory of elasticity, this loading generates almost uniform tensile
stress along the diameter, which causes the specimen to fail by splitting along a vertical
plane. The splitting strength can be used to estimate direct tensile strength by multiplying
by a conversion factor of ?. = 0.9. The splitting tension tests were performed on cylinders
with varying geometries and concreting methods. On site, the characteristic values of
existing concrete structures can only be determined by taking core samples (Anoglu, 2006).
2.2.4 Tensile Strength Of Concrete Using Flexural Test
Flexural strength provides two useful parameters, which is the first crack strength,
which is primarily controlled by the matrix, and the ultimate flexural strength of modulus
Of rupture, which is determined by the maximum load that can be attained. In China the
flexural properties of cement stabilized macadam reinforced with polypropylene fiber has
been studied. Flexural properties of structural materials are generally important to design engineers to guide appropriate selection of materials. It has been argued that the flexural
Strength property of concrete is important particularly when the concrete structure has no
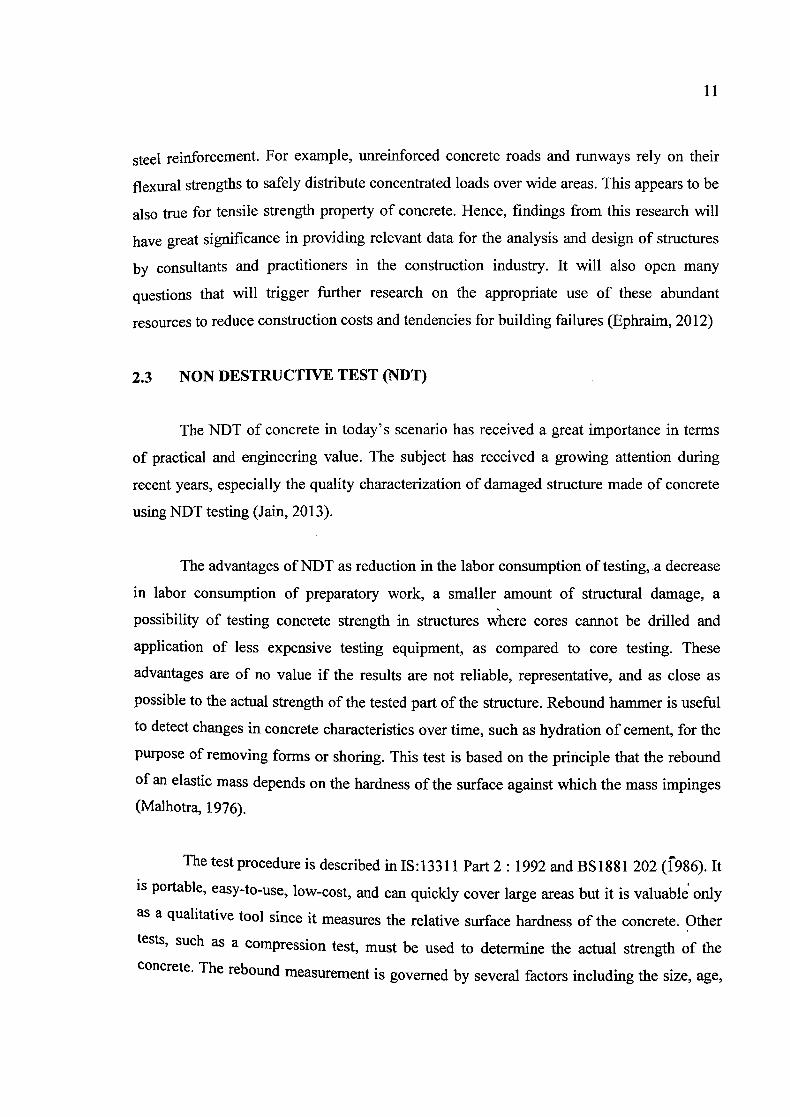
11
steel reinforcement. For example, unreinforced concrete roads and runways rely on their
flexural strengths to safely distribute concentrated loads over wide areas. This appears to be
also true for tensile strength property of concrete. Hence, findings from this research will
have great significance in providing relevant data for the analysis and design of structures
by consultants and practitioners in the construction industry. It will also open many
questions that will trigger further research on the appropriate use of these abundant
resources to reduce construction costs and tendencies for building failures (Ephraim, 2012)
2.3 NON DESTRUCTIVE TEST (NDT)
The NDT of concrete in today's scenario has received a great importance in terms
of practical and engineering value. The subject has received a growing attention during
recent years, especially the quality characterization of damaged structure made of concrete
using NDT testing (Jam, 2013).
The advantages of N1)T as reduction in the labor consumption of testing, a decrease
in labor consumption of preparatory work, a smaller amount of structural damage, a
possibility of testing concrete strength in structures where cores cannot be drilled and
application of less expensive testing equipment, as compared to core testing. These
advantages are of no value if the results are not reliable, representative, and as close as
possible to the actual strength of the tested part of the structure. Rebound hammer is useful
to detect changes in concrete characteristics over time, such as hydration of cement, for the
purpose of removing forms or shoring. This test is based on the principle that the rebound
of an elastic mass depends on the hardness of the surface against which the mass impinges
(Maihotra, 1976).
The test procedure is described in IS: 1331 1 Part 2 : 1992 and BS1881 202 (1986). It
is portable, easy-to-use, low-cost, and can quickly cover large areas but it is valuable only
as a qualitative tool since it measures the relative surface hardness of the concrete. Other
tests, such as a compression test, must be used to determine the actual strength of the
Concrete. The rebound measurement is governed by several factors including the size, age,
12
and finish of the concrete, as well as the aggregate type and the moisture content. A handy
non-destructive testing instrument should be cheap, easy to operate and should have
reproducibility for, fairly accurate results. In 1948, a Swiss Engineer, Ernst Schmidt
developed a test hammer for measuring the hardness of concrete by the rebound principle
(Malhotra, 1976).
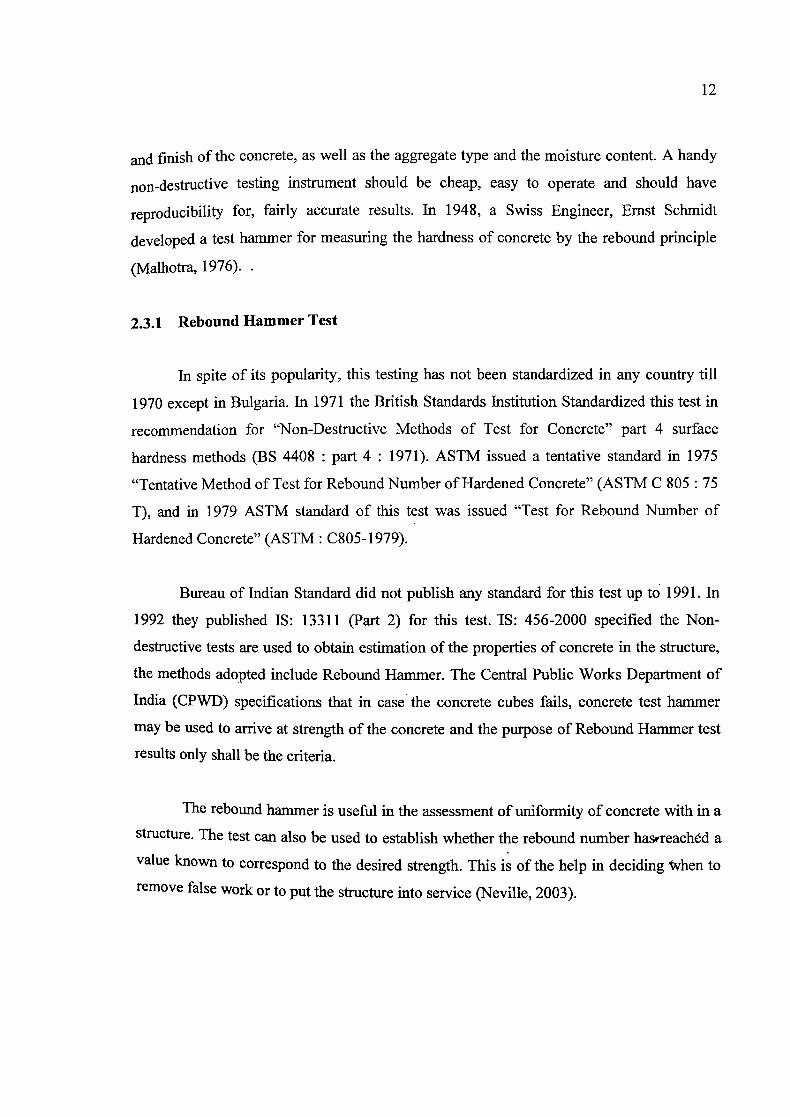
2.3.1 Rebound Hammer Test
In spite of its popularity, this testing has not been standardized in any country till
1970 except in Bulgaria. In 1971 the British Standards Institution Standardized this test in
recommendation for "Non-Destructive Methods of Test for Concrete" part 4 surface
hardness methods (BS 4408 : part 4 : 1971). ASTM issued a tentative standard in 1975
"Tentative Method of Test for Rebound Number of Hardened Concrete" (ASTM C 805 : 75
T), and in 1979 ASTM standard of this test was issued "Test for Rebound Number of
Hardened Concrete" (ASTM: C805-1979).
Bureau of Indian Standard did not publish any standard for this test up to 1991. In
1992 they published IS: 13311 (Part 2) for this test. iS: 456-2000 specified the Non-
destructive tests are used to obtain estimation of the properties of concrete in the structure,
the methods adopted include Rebound Hammer. The Central Public Works Department of
India (CPWD) specifications that in case the concrete cubes fails, concrete test hammer
may be used to arrive at strength of the concrete and the purpose of Rebound Hammer test
results only shall be the criteria.
The rebound hammer is useful in the assessment of uniformity of concrete with in a
structure. The test can also be used to establish whether the rebound number hasvreachëd a
value known to correspond to the desired strength. This is of the help in deciding vhen to
remove false work or to put the structure into service (Neville, 2003).
13
2.3.2 Ultrasonic Pulse Velocity (UPV)
Longitudinal ultrasonic waves are an attractive tool for investigating concrete. Such
waves have the highest velocity so it is simple to separate them from the other wave modes.
The equipment is portable, usable in the field for in situ testing, is truly nondestructive and
has been successful for testing materials other than concrete. The ultrasonic pulse velocity
tester is the most commonly used ones in practice. Test is described in (IS: 13311 Part 1;
1992 and BS 1881-203; 1986). Nevertheless, there are intrinsic and practical factors that
may interfere with the determination of concrete strength by ultrasonic means. Concrete is a
mixture of four materials: Portland cement, coarse aggregate, fine aggregate and water.
This complexity makes the behavior of ultrasonic waves in concrete highly irregular, which
in turn hinders non-destructive testing (Popovics, 1998).
In the view of the complexities of the problem it would appear to be overly
optimistic to attempt to formulate an ultrasonic test method for the determination of
concrete strength. However, considering the seriousness of the infrastructure problem and
the magnitude of the cost of rehabilitation, major advancement is desperately needed to
improve the current situation. For instance, it has been demonstrated repeatedly that the
standard ultrasonic method using longitudinal waves for testing concrete can estimate the
concrete strength only with ± 20 percent accuracy under laboratory conditions The use of
UPV and rebound har-mer has been experimentally investigated by inducing voids in the
sample by and result showed the NDT data can be used to make trustworthy guess about
concrete condition with damaging structural elements, if the defects are sizeablë enough
(Lorenzi, 2009).
2.3.3 Penetration Test
The penetration resistance method is well known. The Windsor probe system, introduced in the US in 1960, is based on the determination of the depth penetration of a
steel pin fired into the concrete. The depth of penetration of the pins is correlated with the
14
compressive strength of the concrete. Subsequently, in 1970, According to (Arni
,1972) reported the results of a detailed investigation into the evaluation of the Windsor
probe. The Windsor probe (Pucinotti, 2005), like the rebound hammer is basically a
hardness tester that provides a quick means of determining the relative strength of the
concrete. The exposed length of the probe is measured by a depth gauge and related by a
calibration table to the compressive strength of the concrete. For each exposed length value
of the depth gauge, different values for the compressive strength of concrete are given,
depending on the hardness of the aggregate. This hardness is measured by the Mohs' scale.
The correlations published by several researchers working upon concrete made with
different types of aggregates, but having similar Mohs' hardness values, had, however,
shown different relationships (Burt, 1969 and Malhotra, 1971).
A series of non-destructive tests were performed in situ with the purpose of
investigating the mechanical characteristics of materials of 'ancient' reinforced concrete
structures; the correlation between the values of experimental strengths was determined
using the Windsor Probe System with satisfactory core strengths. The strength values in the
rectangular window refer to a very old concrete, and in this case the tests indicate a higher
strength than actually exists in the structure. In this case where the actual strength is less
than approximately 15 MPa, the correlation between the probe penetration and .in
situ strength becomes more uncertain. In fact, the degree of carbonation present
considerably affects the accuracy of the probe penetration, and hence indicates the concrete
strength for some structural elements in reinforced concrete buildings (Pucinotti, 2005).
2.3.4 Pull Out Test
A pullout test consists of casting a specially-shaped steel insert with an enlarged Send
into fresh concrete This steel insert is then pulled-out from the concrete and tháe force
required for pullout is measured using a dynamometer. A bearing ring is used to cdnfine
failure to a well-defined shape. As the steel insert is pulled out, a cone of concrete is also
removed, there by damaging the concrete surface (which must be repaired after the test).


![I~I 11 1 1111111JIIiii]IIIIIWI~ · 111111 111111 1' 11111 111111 11~11 11111111 1111 11 RI 00000008 Cm""'"" ~ ( l;ono J ... reajustáveis as prestações n~ título. Valor do Imóvel](https://img.pdfslide.net/doc/110x75/5f621cb9f0b0b91eb81f8cd7/ii-11-1-1111111jiiiiiiiiiiwi-111111-111111-1-11111-111111-1111-11111111-1111.jpg)