Embed Size (px)
Citation preview
STUDY OF COPPER ALLOY CORROSION IN
FLOWING WATER ENVIRONMENTS AT
TEMPERATURE BETWEEN 20 AND 45°C
BY
MAHMOOD HAMEED MAHMOOD
A dissertation submitted in fulfilment of the requirement for
the degree of Master of Science in Manufacturing and
Materials Engineering
Kulliyyah of Engineering
International Islamic University Malaysia
AUGUST 2014
ii
ABSTRACT
Transfer of copper metal by boiler feed water from the condenser tubes to other
critical equipment parts of the industrial plant, like steam turbine blades, boiler tubes,
can cause serious problems, such as reduction of electricity generation in power
plants, boiler failure, and increase production costs, which may ultimately lead to loss
of economic viability. Among the factors which affect the corrosion rate of copper
alloys in flowing water environments, the relationship between the velocity of feed
water and the corrosion rate of copper alloy has not been studied in detail. Therefore,
this study investigates the effect of the flow rate of water on the corrosion of copper
alloy at different combinations of temperature (between 20 and 45 °C) and dissolved
oxygen concentration (between 6.1 and 9.2 mg/l). All other operating condition
variables which have effect on flow rate were also considered. The effect of different
flow rates on copper alloy corrosion, such as laminar, transition, and turbulent flows,
were investigated. It was found that the flow rate condition has a significant effect on
the protective copper oxide layer in the inner surface of copper alloy tubes. Surface
metallographic characterization by FESM, SEM, and EDX, demonstrated that the
copper oxide surface layer cannot withstand the turbulences at the beginning of the
turbulent flow condition, while the oxide layer erosion is much less during fully
developed turbulent flow condition. Therefore, the corrosion rate values is maximum
during the initial phases of the turbulent flow condition, but becomes very low at fully
developed turbulent flow conditions associated high water velocity. This indicates that
the overall flow rate conditions, which include physical properties of the fluid,
hydrodynamic parameters, and dimensions of the pipe, have the dominant influence
on corrosion rate.
iii
iv
APPROVAL PAGE
I certify that I have supervised and read this study and that in my opinion, it conforms
to acceptable standards of scholarly presentation and fully adequate, in scope and
quality, as a dissertation for the degree of Master of Science (Material Engineering).
………………………………….
Suryanto
Supervisor
………………………………….
Souad A. Mohamad
Co-supervisor
I certify that I have read this study and that in my opinion, it conforms to acceptable
standards of scholarly presentation and is fully adequate, in scope and quality, as a
dissertation for the degree of Master of Science (Material Engineering).
………………………………….
Hadi Purwanto
Internal Examiner
………………………………….
Syarif Junadi
External Examiner
This dissertation was submitted to the Department of Manufacturing and Material
Engineering and is accepted as a fulfilment of the requirement for the degree of
Master of Science (Material Engineering).
………………………………….
Mohammad Yeakub Ali
Head of Department of
Manufacturing and Material
Engineering
This dissertation was submitted to the Kulliyyah of Engineering and is accepted as a
fulfilment of the requirement for the degree of Master of Science (Material
Engineering).
………………………………….
Md Noor bin Salleh
Dean Kulliyyah of Engineering
v
DECLARATION
I hereby declare that this dissertation is the result of my own investigation, except
where otherwise stated. I also declare that it has not been previously or concurrently
submitted as a whole for any degrees at IIUM or other institutions.
Mahmood Hameed Mahmood
Signature………………….. Date……………………

vi
INTERNATIONAL ISLAMIC UNIVERSITY MALAYSIA
DECLARATION OF COPYRIGHT AND AFFIRMATION OF
FAIR USE OF UNPUBLISHED RESEARCH
Copyright © 2014 by International Islamic University Malaysia. All rights reserved.
STUDY OF COPPER ALLOY CORROSION IN FLOWING
WATER ENVIRONMENTS AT TEMPERATURE BETWEEN 20
AND 45°C
No part of this unpublished research may be reproduced, stored in a retrieval system, or
transmitted, in any form or by means, electronic, mechanical, photocopying, recording or
otherwise without prior written permission of the copyright holder except as provided
below.
1. Any material contained in or derived from this unpublished research may only be
used by others in their writing with due acknowledgment.
2. IIUM or its library will have the right to make and transmit copies (print or
electronic) for institutional and academic purposes.
3. The IIUM library will have the right to make, store in a retrieval system and supply
copies of this unpublished research if requested by other universities and research
libraries.
Affirmed by Mahmood Hameed Mahmood
………………………. …………………..
Signature Date

vii
Seek knowledge from the cradle to the grave
viii
ACKNOWLEDGEMENTS
In the name of Allah, Most Gracious, Most Merciful, Alhamdulillah thanks to Allah
(S. W. T.) for His blessings, guidance, and plentiful bounties. Prayers and salutations
for Prophet Muhammad (peace-and blessing may be upon him), his family, and his
companions (may Allah bless them).
I would like to take this opportunity to express my deepest gratitude to those
who have helped me in completing this dissertation.
Firstly, I would like to express my heartfelt appreciation to my supervisor Dr.
Suryanto for his invaluable lessons and continuous solid support in making this study
become a sound research. His determination in pioneering a research, in this crucial
area, should be followed. I would also like to express my thankfulness to my co-
supervisor, Dr. Souad for giving me beneficial advice in making this research an
accomplishment.
I would also like to express my sincere gratitude and appreciation for Dr.
Mohd. Hanafi Ani, who supported and advised me during my research, also, I would
like to express my heartfelt appreciation and thanks to all my lab mates for their help,
moral support, and understanding, especially Br. Hairy.
Special thanks are dedicated to Dr. Mohamed al Saady for helping me with
instrumentation, technical support, and advice as well as assisting me in doing this
research. The same appreciation goes to Br. Ibrahim for helping me with SEM and
EDX, and to Br. Sanady for guiding me in using FESM.
I also would like to take this opportunity to thank my mother for her prayers
and for her encouragement which made me believe in myself and to work hard for
successfully completing this dissertation.
ix
TABLE OF CONTENTS
Abstract ...................................................................................................................... ii Abstract in Arabic ...................................................................................................... iii
Approval Page ............................................................................................................ iv Declaration ................................................................................................................. v
Copyright Page ........................................................................................................... vi
Dedication .................................................................................................................. vii
Acknowledgements .................................................................................................... viii List of Tables ............................................................................................................. xi List of Figures ............................................................................................................ xii
List of Abbreviations ................................................................................................. xv
CHAPTER 1: INTRODUCTION ........................................................................... 1
1.1 Back ground ............................................................................................ 1 1.1.1 Overview ....................................................................................... 1 1.1.2 Copper Alloy ................................................................................. 2
1.1.3 The influence of some environmental factors ............................... 3 1.2 Problem Statement and Its Significance ................................................. 5 1.3 Research Objectives ................................................................................ 6
1.4 Research Methodology............................................................................ 6 1.5 Research scope ........................................................................................ 7
CHAPTER 2: LITERATURE REVIEW ............................................................... 9 2.1 Introduction ............................................................................................. 9
2.2 Corrosion Process ................................................................................... 10
2.3 Corrosion Types ...................................................................................... 10 2.3.1 Galvanic Corrosion in Copper Alloys ........................................... 11 2.3.2 Erosion Corrosion .......................................................................... 11 2.3.3 Pitting Corrosion ............................................................................ 12
2.3.4 Dezincification ............................................................................... 12 2.4 Mass Transfer and Corrosion .................................................................. 12
2.4.1 Polarization and Mass Transfer ..................................................... 13 2.4.2 Anodic Process under Mass Transfer Control ............................... 15
2.5 Mechanism of Copper Corrosion ............................................................ 17
2.5.1 Formation of Copper Oxide Film .................................................. 18 2.6 FLOWING WATER FACTORS ............................................................ 18
2.6.1 Fluid Flow Rate ............................................................................. 19 2.6.2 Temperature ................................................................................... 29
CHAPTER 3: EXPERIMENTAL PROCEDURE ................................................ 31
3.1 Introduction ............................................................................................. 32 3.2 Hydrodynamic Corrosion Test System ................................................... 32 3.3 Sample Preparation ................................................................................. 34 3.4 Experimental Work ................................................................................. 34 3.5 Effect Of Water FlowRate On Corrosion ............................................... 35
x
3.6 Effect Of Temperature On Corrosion ..................................................... 35
3.7 Effect Of Dissolved Oxygen On Corrosion ............................................ 35 3.8 Characterization Using Sem .................................................................... 36 3.9 Characterization Using Edx .................................................................... 36
3.10 Characterization Using Fesm .................................................................. 37
CHAPTER 4: RESULTS AND DISCUSSION ..................................................... 38 4.1 Introduction ............................................................................................. 38 4.2 Effects Of Water Flow Rate .................................................................... 39
4.2.1 Effect of flowing velocity .............................................................. 39 4.2.2 Effect of flowing condition ............................................................ 44
4.3 Effects Of Water Temperature ................................................................ 54 4.4 Effects Of Dissolved Oxygen Concentration .......................................... 57 4.5 MetalogRaphic Analysis ......................................................................... 60
4.5.1 Pitting Effect .................................................................................. 64
4.5.2 The Effect of Oxide Layer ............................................................. 65
CHAPTER 5: CONCLUSIONS AND RECOMMENDATION .......................... 66 5.1 Conclusions ............................................................................................. 66 5.2 Recommendations ................................................................................... 67
REFERENCES ......................................................................................................... 71
APPENDIX I ............................................................................................................. 71 APPENDIX II ............................................................................................................ 81
xi
LIST OF TABLES
Table No. Page No.
2.1 Common Copper alloys used in the industry (Mc Donald, 2011) 31
2.2 Copper alloy corrosion rate in salt water in mpy at different
velocities and pH 7.3-7.4 (Mc Donald, 2011) 31
4.1 Copper alloy corrosion rates at various velocities and temperatures 40
4.2 Corrosion rate as a function of Reynolds’ number and temperature 45
4.3 Corrosion rate as a function of water flowing conditions at various
temperatures 48
4.4 Average corrosion rate at various temperatures and flowing
conditions 51
4.5 Average corrosion rate for different water velocities 52
4.6 Corrosion rate at different temperatures and water velocities 54
4.7 Corrosion rate at various dissolved oxygen concentrations 58
4.8 Average corrosion rate as a function of DOC, at different flowing
conditions 59
xii
LIST OF FIGURES
Figure No Page No
1.1 Process flow chart 8
2.2 Schematic diagram of cathodic polarization vs stream
velocity(ASTM, 2012) 14
2.2 Schematic diagram of anodic polarization vs stream velocity
(ASTM, 2012) 15
2.3 Velocity profile in laminar and turbulent flow 20
2.4 Schematic diagram of pressure drop across pipe diameter in laminar
and turbulent flow (Holland, 2001) 21
2.5 Turbulent flow rate profile (Zevenhoven, 2012) 23
2.6 Schematic diagram of the pipe’s boundary layer velocity profile
(Cengel, 2004) 23
2.7 Schematic representation of the wall shear stress along the pipe
(Cengel, 2004) 25
2.8 Velocity profile around pipe cross section (Cengel, 2004) 27
2.9 Laminar flow shear stress across a pipe’s cross section (Kinas, 1997) 28
2.10 Copper’s solubility as a function of water acidity at different
temperatures (Dortwegt, 2003) 29
2.11 Copper solubility as a function of water temperature at different
acidity (Dortwegt, 2003) 30
2.12 Cupric oxide solubility in water in (m°Cu) in units of molkg-1
(H2O)
as a function of water acidity pH°t at various temperatures (Donald,
2008) 30
3.1 Schematic diagram of the hydrodynamic corrosion test system:
Water tank, (2)pump, (3)valves, (4)flow indicators, (5)copper tube
test samples, (6)temperature indicator and controller, (7)oxygen gas
cylinder, (8)heater, and (9)drain 33
3.2 Picture of the temperature indicator and controller used 33
3.3 Flow chart of the experimental work 34
xiii
4.1 Copper alloy corrosion rate as a function of water velocity at 30°C 41
4.2 Copper alloy corrosion rate as a function of water velocity at 20°C 42
4.3 Copper alloy corrosion as a function of water velocity at 45°C 42
4.4 Corrosion rate as a function of water velocity at various temperatures 43
4.5 Copper alloy corrosion as a function of water volumetric flow rate at
various temperatures 43
4.6 Copper alloy corrosion as a function of Re at various temperatures 46
4.7 Effect of water flow condition on the corrosion rate of copper alloy 47
4.8 Effect of water flowing condition on the corrosion rate of copper at
20 °C 49
4.9 Effect of water flowing condition on the corrosion rate of copper at
30 °C 49
4.10 Effect of water flowing condition on the corrosion rate of copper at
45 °C 50
4.11 Average copper corrosion rate as a function of flowing condition at
various temperatures 51
4.12 Average corrosion rates as a function of water velocities at various
temperatures 52
4.13 Comparison between copper corrosion rates as a function of
temperature at selected water velocities 55
4.14 Dissolved oxygen concentration as a function of water temperature 57
4.15 Comparison of copper corrosion rate for different combinations of
water velocity and DOC 58
4.16 Comparison between copper corrosion rates as a function of DOC
for different water velocities 59
4.17 Average copper corrosion rate as a function of flowing conditions at
various DOC 60
4.18 EDX results of copper alloy’s surface 61
4.19 SEM and FESM metallographic results of the test sample at 30 °C
temperature, 0.12 m/s water velocity, and 0.07 mmpy corrosion rate 61
4.20 SEM and FESM metallographic results of the experimental work at
30 °C temperature, 0.29 m/s water velocity, and 0.12 mmpy
corrosion rate 62
xiv
4.21 SEM and FESM metallographic results of the experimental work at
30 °C temperature, 0.47 m/s water velocity, and 0.09 mmpy
corrosion rate 63
4.22 SEM and FESM metallographic results of the experimental work at
30 °C temperature, 3.5 m/s water velocity, and 0.02 mmpy corrosion
rate. 64
xv
LIST OF ABBREVIATIONS
GNP
GDP
Gross National Product
Gross Domestic Product
mpy mils per year
DOC
EDX
FESM
SEM
Dissolved Oxygen Concentration
Energy Dispersive X-ray
Field emission source microscope
Scanning Electron Microscope
RDS
JO2
KO2
XPS
Rate Determining Step
Mass transfer flux (mole/m2s)
Mass transfer coefficient (m/s)
X-ray photoelectron spectroscopy
u Velocity
ρ Density
µ Dynamic viscosity
Re Reynolds number
d Pipe diameter
Lh Hydrodynamic entry length
D Characteristic length of the geometry (diameter in case of pipe), m
ὐ Kinematic viscosity of the fluid =μ/ρ, m 2 /s
Vm Mean velocity, m/s
Vmax Maximum velocity
δ Boundary layer region thickness
τ
Viscosity shear stress
APS
CDA
EPA
Accelerators Photon Source
Copper Development Association Inc
U S Environmental Protection Agency
1
CHAPTER 1
INTRODUCTION
1.1 BACK GROUND
1.1.1 Overview
Corrosion in industry is usually considered as a destructive attack on a metal by a
corrosive agent, in its surrounding environment, through chemical or electrochemical
reaction. Metallic corrosion is one of the most common problems in the industry.
Thus, some industrialized nations, like Australia, Great Britain, and Japan, spend close
to 4% of their Gross National Product (GNP) on replacement of corroded products,
corrosion prevention processes, and maintenance (Winston, 2008).
In America, the total annual direct costs related to metallic corrosion has been
estimated to USD $ 276 billion or approximately 3.1% of the nation’s Gross Domestic
Product (GDP). A two year extensive study (1999 to 2001) was done by CC
Technologies Laboratories Inc., and entitled (Corrosion Costs and Preventive
Strategies in the United State). The report investigated costs incurred due to metallic
corrosion in diverse sectors of the American economy such as the industrial sector,
infrastructure, transportation, manufacturing, and production. It concluded that
although significant steps have been taken in managing corrosion, 25-30% greater
savings of the total expense could be realized by the implementation of newer and
better ways of controlling and/or preventing corrosion (Gerhardus, 2002). In
Malaysia, the nation’s Gross Domestic Product (GDP) in (2009) was USD $207.4
billion, according to this the total annual direct costs related to metallic corrosion has
2
been estimated to USD $6.7 billion (A&E Systems, 2002), which is equivalent to 3%
of (GDP) for the country.
In general, the corrosion rate of copper is less than that of steel under the same
water environment In fresh water, most copper alloys have corrosion rates in the range
of 1 to 3 mils per year (mpy) (Mc Donald, 2011). However, copper tubes are usually
thinner than steel tubes and are used in heat transfer equipment, where even low
corrosion rates can affect the effective working lifetime of equipment. Experiments
showed that during severe conditions, the corrosion rates could reach 20 mpy (Mc
Donald, 2011), leading to dramatic reduction in the equipment lifetime.
1.1.2 Copper Alloy
Copper alloys are the most common material used in the manufacturing of heat
exchangers and cooling towers because of their good heat transfer and corrosion
resistance properties. For this reason, most of the copper alloys have become
associated with particular types of cooling equipment which use freshwater. Also,
copper alloys are widely employed in systems which are exposed to seawater.
When copper alloys come in contact with water, they directly form cuprous
oxide films, Cu2O. This film is considered as a protective layer as it prevents further
oxidation of copper. However, this thin film is affected by certain flow conditions
such as water’s temperature, velocity, and dissolved oxygen content (Gallegos, 2005).
The removal of the protective oxide layer exposes the metal surface to the
environment and leads to rapid corrosion.
Copper alloy corrosion may occur between metal and its surrounding
environment. The environment has stagnant or dynamic nature. In the dynamic state,
the flow is laminar, transitional, or turbulent.
3
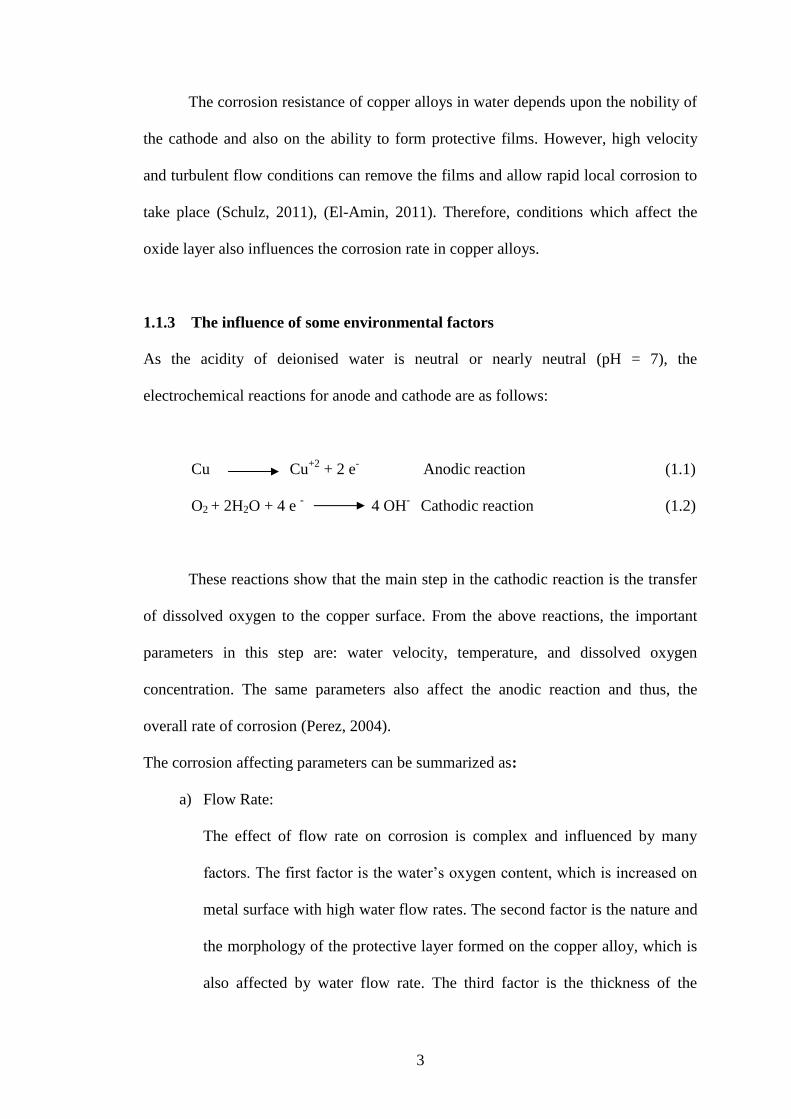
The corrosion resistance of copper alloys in water depends upon the nobility of
the cathode and also on the ability to form protective films. However, high velocity
and turbulent flow conditions can remove the films and allow rapid local corrosion to
take place (Schulz, 2011), (El-Amin, 2011). Therefore, conditions which affect the
oxide layer also influences the corrosion rate in copper alloys.
1.1.3 The influence of some environmental factors
As the acidity of deionised water is neutral or nearly neutral (pH = 7), the
electrochemical reactions for anode and cathode are as follows:
Cu Cu+2
+ 2 e-
Anodic reaction (1.1)
O2 + 2H2O + 4 e - 4 OH
- Cathodic reaction (1.2)
These reactions show that the main step in the cathodic reaction is the transfer
of dissolved oxygen to the copper surface. From the above reactions, the important
parameters in this step are: water velocity, temperature, and dissolved oxygen
concentration. The same parameters also affect the anodic reaction and thus, the
overall rate of corrosion (Perez, 2004).
The corrosion affecting parameters can be summarized as:
a) Flow Rate:
The effect of flow rate on corrosion is complex and influenced by many
factors. The first factor is the water’s oxygen content, which is increased on
metal surface with high water flow rates. The second factor is the nature and
the morphology of the protective layer formed on the copper alloy, which is
also affected by water flow rate. The third factor is the thickness of the
4
water’s boundary layer with higher flow rates, the thickness becomes less
and this affects the mass transfer coefficient of both: the diffusion of oxygen
from water to the metal surface, and the transfer of the corrosion products
from the metal surface to the bulk Finally, the flow velocity of water, which
is related to the Reynolds number, plays an important role in the transition
from laminar to turbulent flow, thus affecting the protective copper oxide
layer.
b) Temperature:
Temperature influences the physical properties of water leading to change in
the degree of flow rate condition, diffusivity, viscosity, and amount of
dissolved oxygen.
c) Dissolved Oxygen Concentration, DOC:
In water, increasein the dissolved oxygen concentration leads to an increase
in the speed of cathodic reaction by bringing more oxygen in proximity of the
copper surface.
d) Water Acidity:
The pH can indicate the acidic/alkaline state of a solution, with pH values
less than 7 indicating acidity, while a pH greater than 7 indicating alkalinity
A pH of 7 means the solution is neutral. Both acidic and alkalinewater are
corrosive to copper alloys (Akinpelumi, 2012).
In this research,the corrosion of copper alloy in flowing water environment, is
studied in order to show the effect of water’s hydrodynamic state on corrosion rate.
5
1.2 PROBLEM STATEMENT AND ITS SIGNIFICANCE
This research studies the industrial problem associated with the prevention of copper
corrosion and the avoidance of undesired contamination with copper metal. The
corrosion products are formed by the anodic corrosion reaction and transferred by feed
water. It contaminates the boiler feed water system, such as boilers, condensers, and
also other critical parts of the steam cycle like turbines.
Contaminations by corrosion products of copper can cause serious problems in
the industry. It can significantly change the aerodynamic design of the high-pressure
steam turbines by copper deposited on the turbine blades. This leads to losses in
power production, it can cause as much as 5% decrease in power generation worth
millions of dollars each year. Boiler tubes are also affected by copper corrosion
product, which are transferred via the feed water from the condenser. Copper deposits
on the boiler tubes interior surfaces can depress the melting point of the boiler tube
material, causing early failure. which is called liquid metal embrittlement.
The usual practice in the industry has been to use expensive corrosion resistant
materials to avoid these types of problems. However, the findings of this research will
help understand and implement the desired operating conditions and avoid critical
flow conditions in order to prevent problems related to copper corrosion. This will
cancel the need to use expensive materials, thereby considerably reducing the costs
related to installation, replacement, maintenance, unscheduled breakdown,
catastrophic failures, and decreased power production.
6
1.3 RESEARCH OBJECTIVES
The main purpose of this research is to study copper alloy corrosion in flowing water
environment at a temperature range of 20 to 45 °C. In order to accomplish this aim the
following specific objectives must be fulfilled:
a. To setup a hydrodynamic corrosion test system in order to study copper
alloy corrosion in water flowing environment.
b. To carry out set of experiments for investigating the effect of water
flowing velocity, temperature, and dissolved oxygen concentration on
copper alloy corrosion.
c. To characterise the corroded copper alloy samples using FESM, SEM, and
EDX.
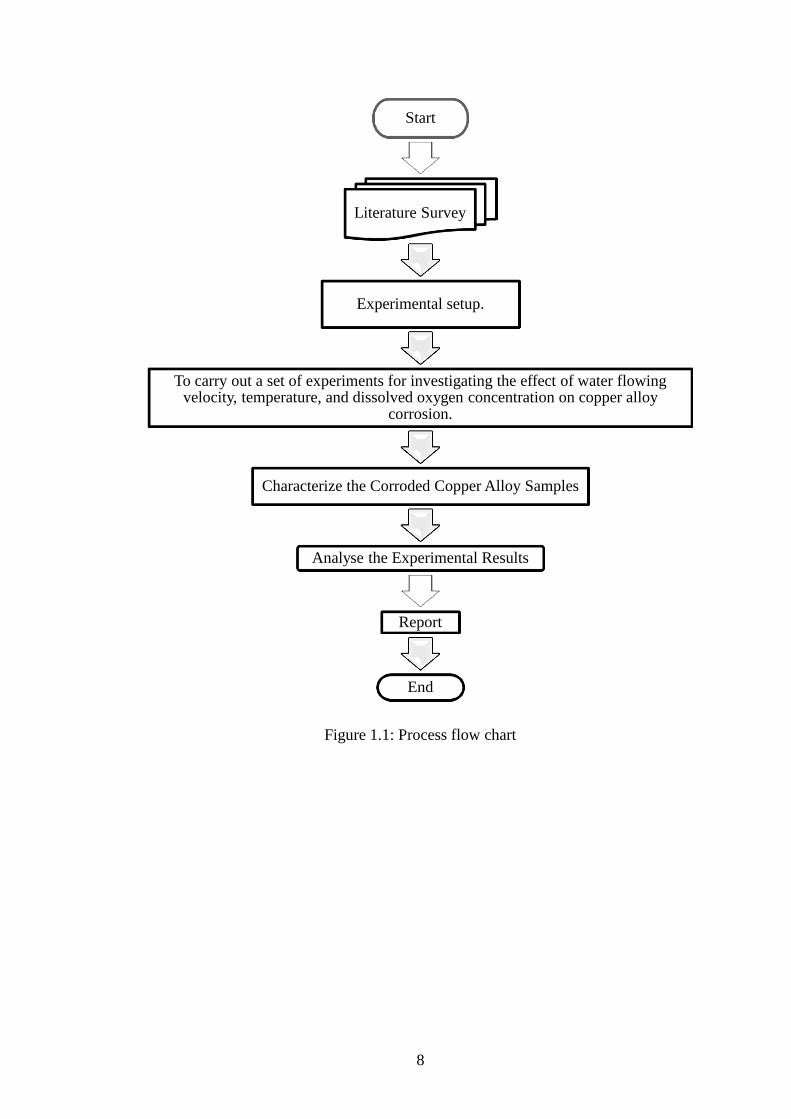
1.4 RESEARCH METHODOLOGY
The principles of the research methods are as follows:
a. Prepare a hydrodynamic corrosion test system to study the effect of water
flowing environment on copper alloy corrosion.
b. Carry out set of experiments to investigate the effect of water flowing
velocity, temperature, and dissolved oxygen concentration on copper alloy
corrosion.
c. Characterise corroded copper alloy samples using FESM, SEM, and EDX.
d. Analysis of the experimental results.
e. Report writing and submission.
The flow sequence of the research methods is detailed in the process flow chart
in figure 1.1.
7
1.5 RESEARCH SCOPE
This study will investigate the effect of water flow rate on the corrosion of copper
alloy tubes used in the water circulation system in industry. To accomplish this, the
effects of several operating condition variables on corrosion rate were considered
according to the actual operating conditions in condensers of boiler feed water
systems. The experiments were carried out at water flowing velocity range from 0.05
to 3.5 m/s, water temperature from 20 to 45 °C, and dissolved oxygen concentration in
water from 6.1 to 9.17 mg/ L.
8
Figure 1.1: Process flow chart
Start
Literature Survey
Experimental setup.
To carry out a set of experiments for investigating the effect of water flowing velocity, temperature, and dissolved oxygen concentration on copper alloy
corrosion.
Characterize the Corroded Copper Alloy Samples
Analyse the Experimental Results
Report
End
9
CHAPTER 2
LITERATURE REVIEW
2.1 INTRODUCTION
This chapter presents a review of issues in relation to the copper corrosion problem
subject in flowing water environment. It starts with an introduction to the basic metal
corrosion mechanism, followed by brief descriptions of some major types of metal
corrosion. After that, it emphasizes on the previous reviews on the relation between
mass transfer and polarization process, and then discusses issues in copper corrosion
mechanism. This is followed by an in-depth discussion on the different factors which
have effects on copper corrosion. Finally, the advantages and disadvantages of copper
corrosion from the context of industry are reviewed.
In power plants, the condenser tubes of boiler feed water system are usually
manufactured from copper alloys. It operates under a water circulating system. the
industrial plants utilities found that the monitored copper content during starting up
for the boiler feed water are 1,000 times greater than its normal levels at normal
operation condition (Daniels, 2013).
In this copper alloy water system, a reddish brown cuprous oxide Cu2O and/or
black cupric oxide CuO are formed depending on the dissolved oxygen concentration.
It is then discharged as contamination into the flowing water, causing blockage in the
system components. Therefore, the subject of copper alloy oxidation was one of the
most important issues in improving the operating vacuum performance (Dortwegt,
2003).