Embed Size (px)
Citation preview
Study of Different Particle Size Analyzers for Waste Water Treatment
By:
Wan Nur Syuhada Bt Wan Ata
Dissertation submitted in partial fulfillment of
the requirement for the
Bachelor of Engineering (Hons)
(Chemical Engineering)
MAY 2014
Universiti Teknologi PETRONAS
Bandar Seri Iskandar
31750 Tronoh
Perak Darul Ridzuan
i
CERTIFICATION OF APPROVAL
Study of Different Particle Size Analyzers for Waste Water Treatment
by
Wan Nur Syuhada bt Wan Ata
A project dissertation submitted to the
Chemical Engineering Programme
Universiti Teknologi PETRONAS
in partial fulfilment of the requirement for the
BACHELOR OF ENGINEERING (Hons)
(CHEMICAL ENGINEERING)
Approved by,
_____________________
(Dr Taslima Khanam)
UNIVERSITI TEKNOLOGI PETRONAS
TRONOH, PERAK
MAY 2014

ii
CERTIFICATION OF ORIGINALITY
This is to certify that I am responsible for the work submitted in this project, that the
original work is my own except as specified in the references and acknowledgements,
and that the original work contained herein have not been undertaken or done by
unspecified sources or persons.
___________________________________________
WAN NUR SYUHADA BT WAN ATA
iii
ABSTRACT
Wastewater treatment is a process of removing the contaminants in the wastewater before
discharging it into the water body. The efficiency of the wastewater treatment plant is
very crucial and need to be strictly monitored in order to treat the waste water until it
complies with the standard discharge value that has been set by the government. One of
the important parameters that can be used to measure the efficiency of the wastewater
treatment plant is particle size. Particle size represents the level of contamination of the
wastewater. The studies and researches about the particle size have been done widely
especially in environmental area, but there is still a lack of comprehensive study being
done in covering the limitations and advantages of using specific equipment to determine
the particle size. Hence, this project will cover the study on the limitations and
advantages of using specific equipment which is Particle Size Analyzer (PSA) and
microscope to determine the particle size in various waste water samples. The usage of
microscope along with the ImageJ software to determine the size of particles in the waste
water sample is believed to give a high contribution to the environmental field especially
for structural analysis. This is due to the ability of this software to measure the size of
irregular particles.
iv
ACKNOWLEDGEMENT
First and foremost, highest thanks to The Almighty, the source of life, wisdom and hope
for giving the author the strength and patience to pursue and complete this Final
Year Project within the time frame allocated.
The author’s utmost gratitude goes to the author’s supervisor, Dr Taslima Khanam for the
informative supervision and valuable knowledge throughout the project. Without her
guidance and patience, the author would not be succeeded to complete this project. Thank
you to the Final Year Research Project Coordinator, Dr Abrar Inayat for providing all
important information throughout the project.
The author’s sincere thanks to Chemical Engineering Department of Universiti Teknologi
PETRONAS (UTP) for providing this chance to undertake this remarkable final year
project. Special thanks also to all contributors for the kind cooperation and assistance in
tutoring the author in conducting this project.
Last but not least, special credit goes to the author’s parents, family members and friends,
who had dedicatedly provided the author with additional support and encouragement
throughout this project either directly or indirectly. Thanks again to all, your kindness
and helps will always be remembered and may Allah reward you with His blessings.
v
CONTENT PAGE
CHAPTER 1 INTRODUCTION 1
1.1 Background of Study 1
1.2 Problem Statement 2
1.3 Objective 3
1.4 Scope of study 3
CHAPTER 2 LITERATURE REVIEW 4
CHAPTER 3 METHODOLOGY/PROJECT WORK 8
3.1 Research Methodology 8
3.2 Experiment Methodology 10
3.2.1 Wastewater Sample Preparation 10
3.2.2 Tools and Equipment 10
3.2.3 Proposed Experiment Procedure 11
CHAPTER 4 RESULT AND DISCUSSION 12
4.1 Experimental Work Using Particle Size Analyzer 12
4.2 Experimental Work Using Microscope 16
4.3 ImageJ Software Analysis 21
4.4 Result Analyis 33
CHAPTER 5 CONCLUSION AND RECOMMENDATIONS 39
REFERENCES 40
vi
LIST OF FIGURES
Figure Page
Figure 1: Illustration of the Concept of Equivalent Spheres. 4
Figure 2: Key Milestone of the Project 8
Figure 3: Gantt Chart of FYPII 9
Figure 4: The Influent Sample 12
Figure 5: The Effluent Sample 12
Figure 6: The Palm Oil Mill Effluent (POME) Sample 12
Figure 7: Graph of Volume (%) vs. Particle Size ( m) For Influent 13
Figure 8: Graph of Volume (%) vs. Particle Size ( m) For Effluent 15
Figure 9: Graph of Volume (%) vs. Particle Size ( m) For POME 16
Figure 10: Area Distribution for the Sample on Glass Slide 18
Figure 11: Analysis on the influent sample for sample 2 at side 1 with 25
x10 magnification.
Figure 12: Analysis on the influent sample for sample 2 at side 2 with 26
x10 magnification.
Figure 13: Analysis on the influent sample for sample 3 at side 4 with 26
x10 magnification.
Figure 14: Analysis on the influent sample for sample 3 at side 1 with 26
x10 magnification
Figure 15: Analysis on the influent sample for sample 3 at side 2 with 27
x10 magnification
Figure 16: Analysis on the influent sample for sample 3 at side 2 with 27
x10 magnification
Figure 17: Analysis on the influent sample for sample 3 at side 3 with 27
x10 magnification
Figure 18: Analysis on the influent sample for sample 3 at side 3 with 28
x10 magnification
Figure 19: Analysis on the influent sample for sample 4 at side 1 with 28
x10 magnification
vii
Figure 20: Analysis on the influent sample for sample 4 at side 3 with 28
x10 magnification.
Figure 21: Analysis on the effluent sample for sample 1 at side 2 with 29
x10 magnification
Figure 22: Analysis on the effluent sample for sample 1 at side 3 with 29
x10 magnification.
Figure 23: Analysis on the effluent sample for sample 2 at side 2 with 30
x10 magnification
Figure 24: Analysis on the effluent sample for sample 3 at side 1 with 30
x10 magnification
Figure 25: Analysis on the effluent sample for sample 4 at side 3 with 30
x10 magnification
Figure 26: Analysis on the effluent sample for sample 4 at side 1 with 31
x10 magnification
Figure 27: Analysis on the effluent sample for sample 4 at side 3 with 31
x10 magnification
Figure 28: Analysis on the effluent sample for sample 4 at side 3 with 31
x10 magnification
Figure 29: Analysis on the effluent sample for sample 4 at side 3 with 32
x10 magnification.
Figure 30: Analysis on the effluent sample for sample 4 at side 4 with 32
x10 magnification
Figure 31: Analysis on the effluent sample for sample 1 at side 1 with 33
x10 magnification
Figure 32: Analysis on the effluent sample for sample 1 at side 2 with 33
x10 magnification
Figure 33: Analysis on the effluent sample for sample 1 at side 3 with 34
x10 magnification
Figure 34: Analysis on the effluent sample for sample 1 at side 4 with 34
x10 magnification
viii
Figure 35: Analysis on the effluent sample for sample 2 at side 3 with 34
x10 magnification
Figure 36: Analysis on the effluent sample for sample 3 at side 3 with 35
x10 magnification
Figure 37: Analysis on the effluent sample for sample 3 at side 1 with 35
x10 magnification
Figure 38: Analysis on the effluent sample for sample 3 at side 3 with 35
x10 magnification.
Figure 39: Analysis on the effluent sample for sample 3 at side 3 with 36
x10 magnification
Figure 40: Analysis on the effluent sample for sample 3 at side 3 with 36
x10 magnification
Figure 41: Graph of normalized particle number vs. particle size for influent 37
Figure 42: Graph of normalized particle number vs. particle size for effluent 38
Figure 43: Graph of normalized particle number vs. particle size for POME 39
Figure 44: Graph of normalized particle number vs. particle size for influent 40
Figure 45: Graph of normalized particle number vs. particle size for effluent 41
Figure 46: Graph of normalized particle number vs. particle size for POME 41

1
CHAPTER 1
INTRODUCTION
1.1 BACKGROUND
Particle size analysis or simply particle sizing is the collective name of the
technical procedures or laboratory techniques which determines the size range, the
average or mean size of the particles in a powder or liquid sample. This analysis has been
applied in the various fields including chemical, mining, agricultural, pharmaceutical and
aggregate industries which emphasized on the control of particle size for their operations.
One of the most important fields that focused on the particle size analysis is the waste
water treatment (T. Vítěz, 2010).
Waste water is liquid discharged by domestic residences, commercial properties,
industry or agriculture which often contains some contaminants. The waste water need to
be treated before being discharged to the water source or being reuse again. The
treatment may involve physical, chemical or biological processes or combination of these
processes depending on the required standard value of discharge. Most treatment plants
have primary treatment which involve physical removal of floatable and settable solids
and also secondary treatment for biological removal of the dissolved solids. After the
primary and secondary treatment, the waste water is usually disinfected using chlorine
(Agency, 2004). The types of treatments are different according to the requirement of
treating the waste water up to the standard value allowable to be discharged.
The treatment is essential in order to comply with the standard value of discharge
that has been set by the Malaysia’s Environmental Law, ENVIRONMENTAL
QUALITY ACT 1974(Act, 1974). Hence, the efficiency of the waste water treatment
2
needed to be monitored to achieve this target. One of the important parameters to
measure the efficiency of the waste water treatment is particle size which can determine
the degree of contaminant removal in waste water (A.Tiehm, 1999). The size of the
suspended solids in the waste water has considerable impact on the separation process
such as sedimentation and filtration (A.Tiehm, 1999). Hence, this project will focus
mainly on the particle size analysis in the waste water treatment using different
equipment to determine the feasibility of the equipment for measuring different type of
waste water.
1.2 PROBLEM STATEMENT
Wastewater regulation and treatment is still a major concern in planetary pollution
management. The fundamental purpose of the waste water treatment is concerns with the
protection of public health. Environmental protection is the second major purpose. It is
the responsibility of the engineers, scientists and public officials involved to ensure that
waste treatment systems achieve this goal. This goal means to achieve the standard
discharge value stated by Malaysia’s Environmental Law, ENVIRONMENTAL
QUALITY ACT 1974(Act, 1974).Hence, the waste water treatment plant needed to be
monitored frequently for its efficiency in treating the waste water. One of the parameters
being monitored is particle size in the waste water. Particle size is important parameters
being measure to determine the level of contaminants removal in the waste water, hence
provide the efficiency of the waste water treatment plant (A.Tiehm, 1999). Particle size
is one of the most important physical properties of solids, which is used in many fields of
human activity, such as construction, waste management, metallurgy, fuel fabrication,
etc. Nowadays, many tools and equipment have been developed for measuring the
particle size. Some of them are Particle Size Analyzer (PSA), sieving, sedimentation,
microscope counting, Coulter Counter, Dynamic Light Scattering and Imaging Particle
Analysis (Gregorová, 2007). All of these tools are very well-known and common in
particle size analysis. Despite availability of large number of tools, each tool associated
with some short comings limiting robust applicability of one tool for handling large
3
variety of sample. To date, there is still a lack of comprehensive study covering
limitations and advantages of using the specific equipment to measure the particle size in
different waste water. Hence, this project will provide the data for determination of the
limitations and advantages of different equipment being used for measuring particle size.
1.3 OBJECTIVE
(1) To compare the feasibility of using two equipment which are Particle Size
Analyzer and microscope for measuring particle size in terms of their limitations
and advantages for the study of waste water.
1.4 SCOPE OF STUDY
(1) Waste water are collected from two different sources:
Domestic waste water of UTP
Palm Oil Mill Effluent (POME)
(2) Experimental work on particle size by using two equipments; Particle Size
Analyzer (PSA) and microscope. The usage of only two equipments is due to
some limitations of the time frame and the availability of the equipment in UTP.
(3) Repetition of experimental works for each equipment in two different waste water
samples.
(4) Analysis on the results obtained to determine the limitations and advantages for
each tool being used for particle size analysis.
4
CHAPTER 2
LITERATURE REVIEW
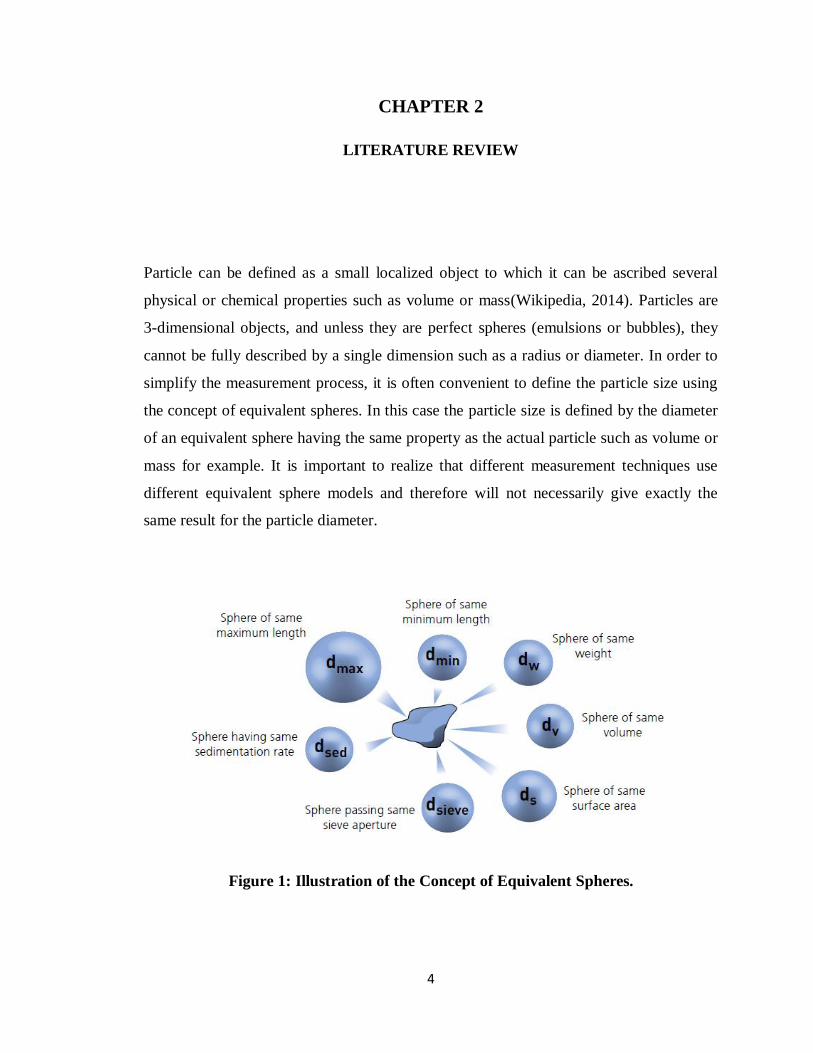
Particle can be defined as a small localized object to which it can be ascribed several
physical or chemical properties such as volume or mass(Wikipedia, 2014). Particles are
3-dimensional objects, and unless they are perfect spheres (emulsions or bubbles), they
cannot be fully described by a single dimension such as a radius or diameter. In order to
simplify the measurement process, it is often convenient to define the particle size using
the concept of equivalent spheres. In this case the particle size is defined by the diameter
of an equivalent sphere having the same property as the actual particle such as volume or
mass for example. It is important to realize that different measurement techniques use
different equivalent sphere models and therefore will not necessarily give exactly the
same result for the particle diameter.
Figure 1: Illustration of the Concept of Equivalent Spheres.
5
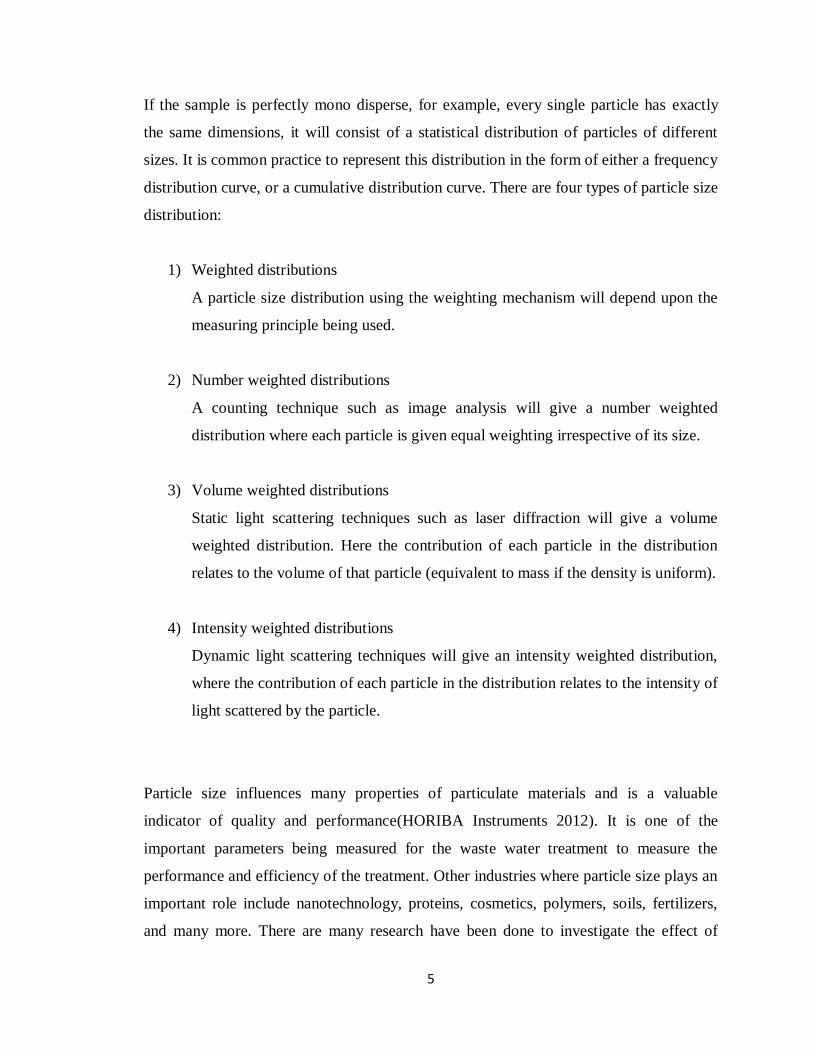
If the sample is perfectly mono disperse, for example, every single particle has exactly
the same dimensions, it will consist of a statistical distribution of particles of different
sizes. It is common practice to represent this distribution in the form of either a frequency
distribution curve, or a cumulative distribution curve. There are four types of particle size
distribution:
1) Weighted distributions
A particle size distribution using the weighting mechanism will depend upon the
measuring principle being used.
2) Number weighted distributions
A counting technique such as image analysis will give a number weighted
distribution where each particle is given equal weighting irrespective of its size.
3) Volume weighted distributions
Static light scattering techniques such as laser diffraction will give a volume
weighted distribution. Here the contribution of each particle in the distribution
relates to the volume of that particle (equivalent to mass if the density is uniform).
4) Intensity weighted distributions
Dynamic light scattering techniques will give an intensity weighted distribution,
where the contribution of each particle in the distribution relates to the intensity of
light scattered by the particle.
Particle size influences many properties of particulate materials and is a valuable
indicator of quality and performance(HORIBA Instruments 2012). It is one of the
important parameters being measured for the waste water treatment to measure the
performance and efficiency of the treatment. Other industries where particle size plays an
important role include nanotechnology, proteins, cosmetics, polymers, soils, fertilizers,
and many more. There are many research have been done to investigate the effect of
6
particle size analysis on the performance of waste water treatment. Separation steps such
as screening, filtering, cyclones, etc. may be monitored by measuring particle size before
and after the process. According to (A.Tiehm, 1999), particle size analysis can provide
the assessment of the functionality of clarifiers and deep bed filtration in the waste water
treatment as the size of suspended solids has considerable impact on separation processes
such as sedimentation, flocculation and filtration. The result of the assessment can be
done to design the treatment with optimum working conditions which surely can improve
the efficiency of the waste water treatment. Optimum working parameters for each
treatment is crucial as it can guarantee relatively low cost and enough removal efficiency
with respect to the time(Zielina, 2007). Particle size control is crucial in the waste water
treatment and the need for highly reproducible particle size assessment techniques has
grown significantly in the past decade.
Sieving is particularly useful since particles are sorted into categories solely on the basis
of size, independently of other properties. Sieving consists of placing a sample on a sieve
containing openings of a fixed size and agitating the sieve in such a way that the particles
that can pass through the openings do so. To speed up the analysis, several sieves are
stacked on top of each other, with the sieve containing the largest openings on top. These
sieves are vibrated until the residue on each sieve contains particles which can pass
through the upper sieve and cannot pass through the lower sieve. A variety of sieve
apertures are currently available, ranging in size from around 20 µm to mm sizes for
woven wire sieves, down to 5 µm or less for electroformed sieves, and above 1 mm for
punched plate sieves. Sieving is probably the most used and abused method of particle
size analysis because the equipment, analytical procedure and basic concepts are so
simple.
Particle size analysis by image analysis is carried out by using the microscope. Due to the
wide availability of computers and software for images capturing such digital pictures
can be utilized for a rapid and convenient analysis of particle size and shape. Microscopy
is often used as an absolute method of particle size analysis since it is the only method in
which the individual particles are observed and measured(Allen, 1997). Sample
7
preparation in the case of microscopy is very simple, requiring only the sandwiching of
~100 microliters of sample between a slide and a cover slip with gentle pressure to
achieve a sample thickness of ~25 micrometers(Philo Morse, 2009).
Other than that, the second method is by using the Particle Size Analyzer (PSA).This
method is using the laser diffraction technique. Over the past years, laser diffraction has
become an important tool in environmental field to measure the particle size (S.A.Ha,
2003). This method has been used by many environmental agencies and researches to
determine the particle size in particular area as being applied by Department of
Environmental Sciences, University of California(Eran Segal, 2009). By laser diffraction
analysis it is possible to measure particles sizes between 0.02 and 2000 µm. The sample
is dispersed in either air or a suitable liquid media. The laser passes through the
dispersion media and is diffracted by the particles. The blue laser is used for measuring
the small particles, while the red detects the larger particles. The diffraction pattern is
measured by detectors, and the signal is then transformed to a particle size distribution
based on an optical mode. Laser diffraction (LD) is well established across the particulate
processing industries as an effective technique for measuring particle size and particle
size distribution. It exploits the Mie theory of light, which relates the scattering pattern
produced as light passes through a sample to the size of any particles present. Large
particles scatter light strongly at small angles to the incident ray while smaller particles
scatter more weakly at wider angles. Through the analysis of detected angular scattering
intensity data it is, therefore, possible to determine particle size and
distribution(Levoguer, 2013).
If particle size is to be a quality control for specific project or analysis, the method of
particle size distribution determination will have to be validated. This can be achieved by
comparing the feasibility of the equipment being used to measure the particle size in
terms of their limitations and advantages. Up to this time being, there is still a lack of
comprehensive study for this analysis. Hence this project is expected to provide
quantitative review on particle size analysis equipment from the experiments of
wastewater analysis.
8
CHAPTER 3
METHODOLOGY/ PROJECT WORK
3.1 RESEARCH METHODOLOGY
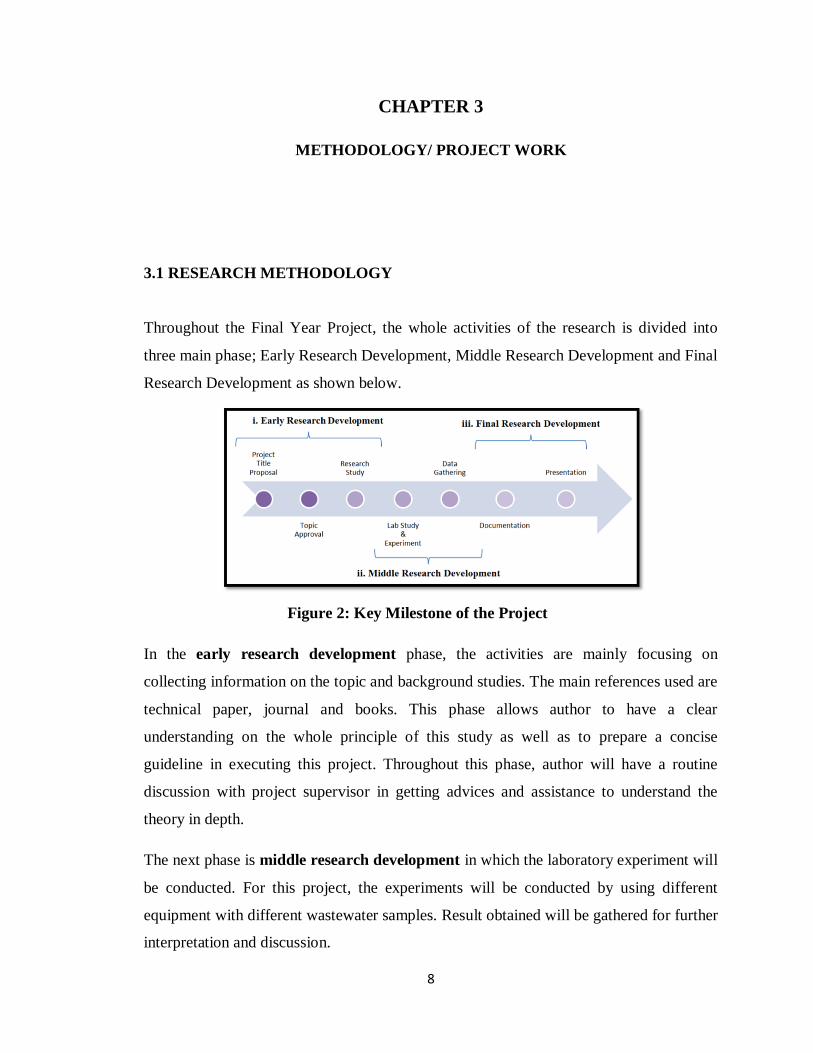
Throughout the Final Year Project, the whole activities of the research is divided into
three main phase; Early Research Development, Middle Research Development and Final
Research Development as shown below.
Figure 2: Key Milestone of the Project
In the early research development phase, the activities are mainly focusing on
collecting information on the topic and background studies. The main references used are
technical paper, journal and books. This phase allows author to have a clear
understanding on the whole principle of this study as well as to prepare a concise
guideline in executing this project. Throughout this phase, author will have a routine
discussion with project supervisor in getting advices and assistance to understand the
theory in depth.
The next phase is middle research development in which the laboratory experiment will
be conducted. For this project, the experiments will be conducted by using different
equipment with different wastewater samples. Result obtained will be gathered for further
interpretation and discussion.
9
In the final research development, all the data obtained will be documented and
discussed. A proper report will be completed and the research will be open for further
improvement. The author will then make a presentation to present the outcome or finding
from this project.
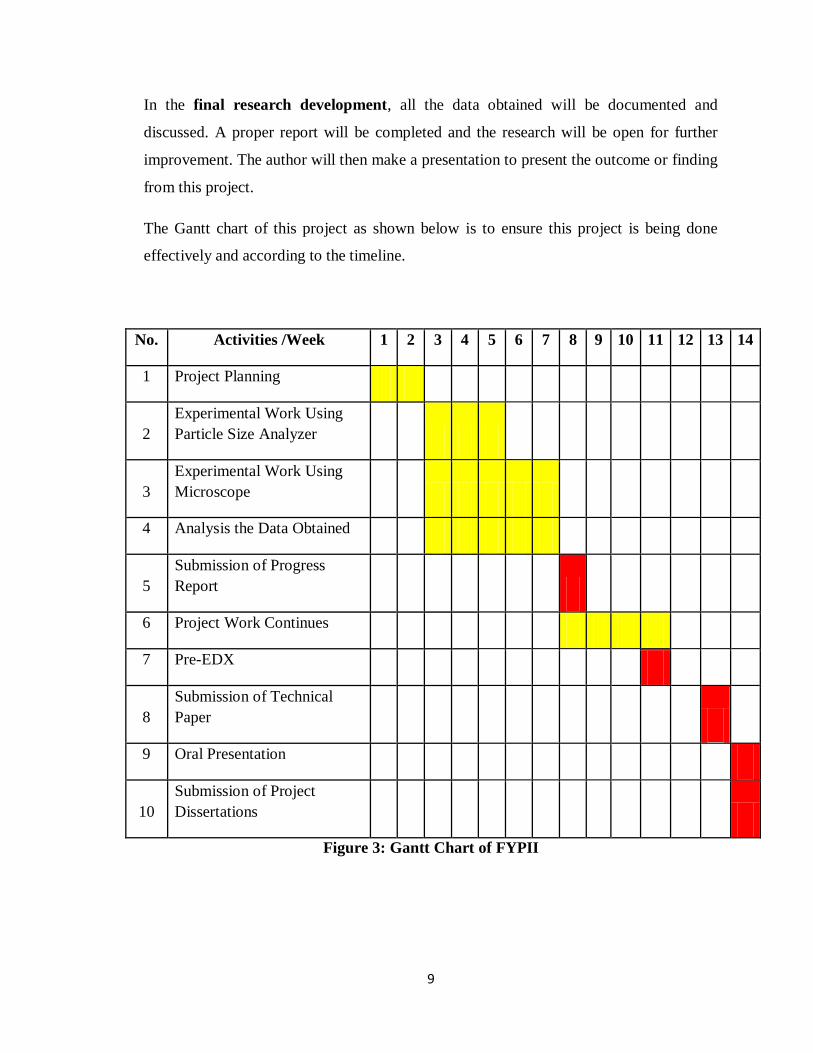
The Gantt chart of this project as shown below is to ensure this project is being done
effectively and according to the timeline.
No. Activities /Week 1 2 3 4 5 6 7 8 9 10 11 12 13 14
1 Project Planning
2
Experimental Work Using
Particle Size Analyzer
3
Experimental Work Using
Microscope
4 Analysis the Data Obtained
5
Submission of Progress
Report
6 Project Work Continues
7 Pre-EDX
8
Submission of Technical
Paper
9 Oral Presentation
10
Submission of Project
Dissertations
Figure 3: Gantt Chart of FYPII
10
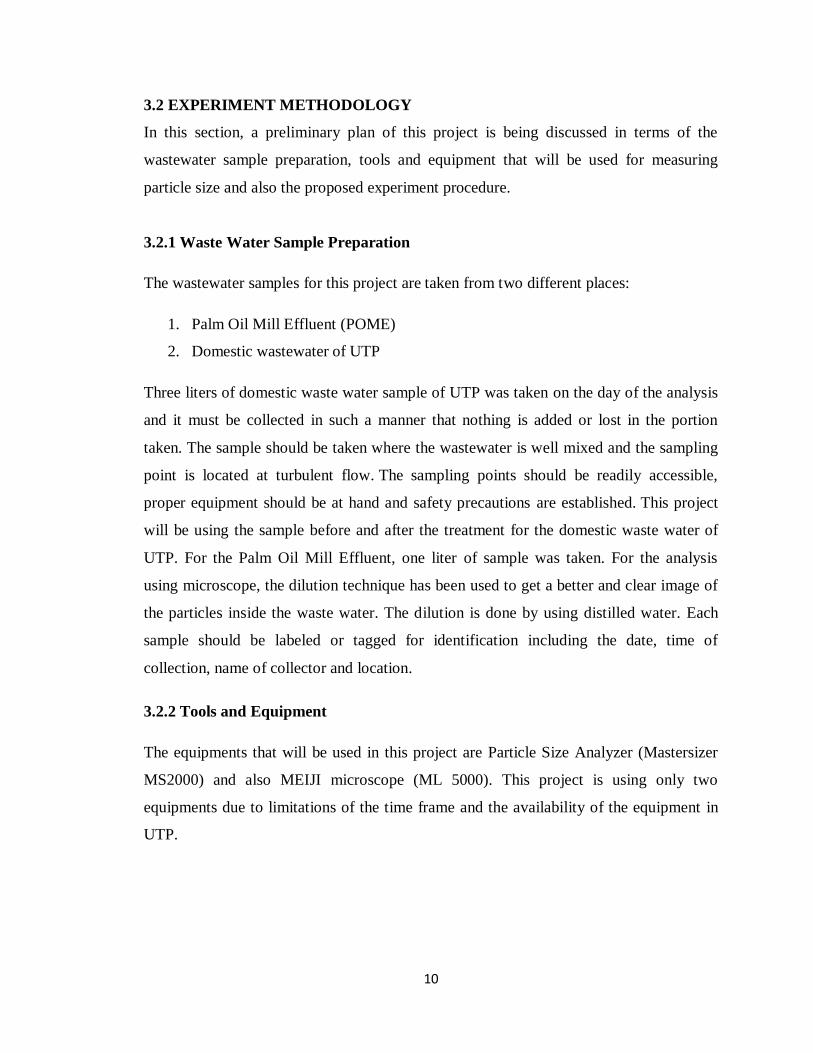
3.2 EXPERIMENT METHODOLOGY
In this section, a preliminary plan of this project is being discussed in terms of the
wastewater sample preparation, tools and equipment that will be used for measuring
particle size and also the proposed experiment procedure.
3.2.1 Waste Water Sample Preparation
The wastewater samples for this project are taken from two different places:
1. Palm Oil Mill Effluent (POME)
2. Domestic wastewater of UTP
Three liters of domestic waste water sample of UTP was taken on the day of the analysis
and it must be collected in such a manner that nothing is added or lost in the portion
taken. The sample should be taken where the wastewater is well mixed and the sampling
point is located at turbulent flow. The sampling points should be readily accessible,
proper equipment should be at hand and safety precautions are established. This project
will be using the sample before and after the treatment for the domestic waste water of
UTP. For the Palm Oil Mill Effluent, one liter of sample was taken. For the analysis
using microscope, the dilution technique has been used to get a better and clear image of
the particles inside the waste water. The dilution is done by using distilled water. Each
sample should be labeled or tagged for identification including the date, time of
collection, name of collector and location.
3.2.2 Tools and Equipment
The equipments that will be used in this project are Particle Size Analyzer (Mastersizer
MS2000) and also MEIJI microscope (ML 5000). This project is using only two
equipments due to limitations of the time frame and the availability of the equipment in
UTP.
11
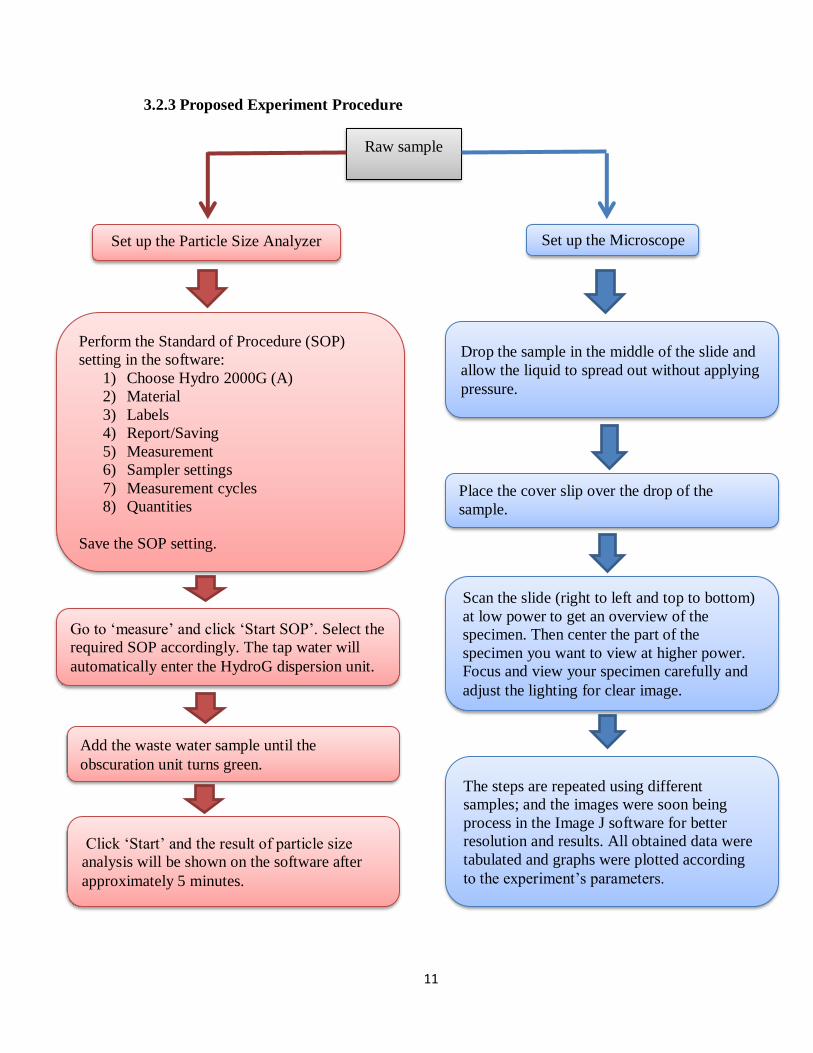
3.2.3 Proposed Experiment Procedure
Raw sample
Set up the Particle Size Analyzer Set up the Microscope
Drop the sample in the middle of the slide and
allow the liquid to spread out without applying
pressure.
Place the cover slip over the drop of the
sample.
Scan the slide (right to left and top to bottom)
at low power to get an overview of the
specimen. Then center the part of the
specimen you want to view at higher power.
Focus and view your specimen carefully and
adjust the lighting for clear image.
The steps are repeated using different
samples; and the images were soon being
process in the Image J software for better
resolution and results. All obtained data were
tabulated and graphs were plotted according
to the experiment’s parameters.
Perform the Standard of Procedure (SOP)
setting in the software:
1) Choose Hydro 2000G (A)
2) Material
3) Labels
4) Report/Saving
5) Measurement
6) Sampler settings
7) Measurement cycles
8) Quantities
Save the SOP setting.
Go to ‘measure’ and click ‘Start SOP’. Select the
required SOP accordingly. The tap water will
automatically enter the HydroG dispersion unit.
Add the waste water sample until the
obscuration unit turns green.
Click ‘Start’ and the result of particle size
analysis will be shown on the software after
approximately 5 minutes.
12
CHAPTER 4
RESULTS AND DISCUSSION
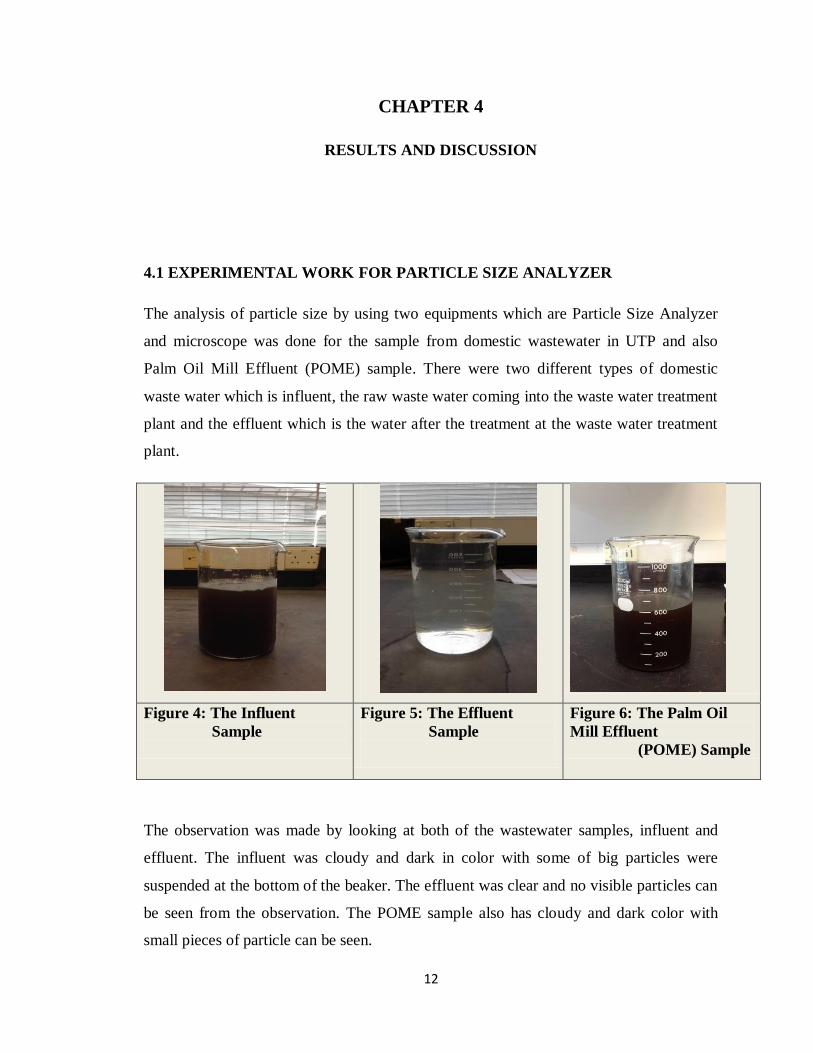
4.1 EXPERIMENTAL WORK FOR PARTICLE SIZE ANALYZER
The analysis of particle size by using two equipments which are Particle Size Analyzer
and microscope was done for the sample from domestic wastewater in UTP and also
Palm Oil Mill Effluent (POME) sample. There were two different types of domestic
waste water which is influent, the raw waste water coming into the waste water treatment
plant and the effluent which is the water after the treatment at the waste water treatment
plant.
Figure 4: The Influent
Sample
Figure 5: The Effluent
Sample
Figure 6: The Palm Oil
Mill Effluent
(POME) Sample
The observation was made by looking at both of the wastewater samples, influent and
effluent. The influent was cloudy and dark in color with some of big particles were
suspended at the bottom of the beaker. The effluent was clear and no visible particles can
be seen from the observation. The POME sample also has cloudy and dark color with
small pieces of particle can be seen.
13
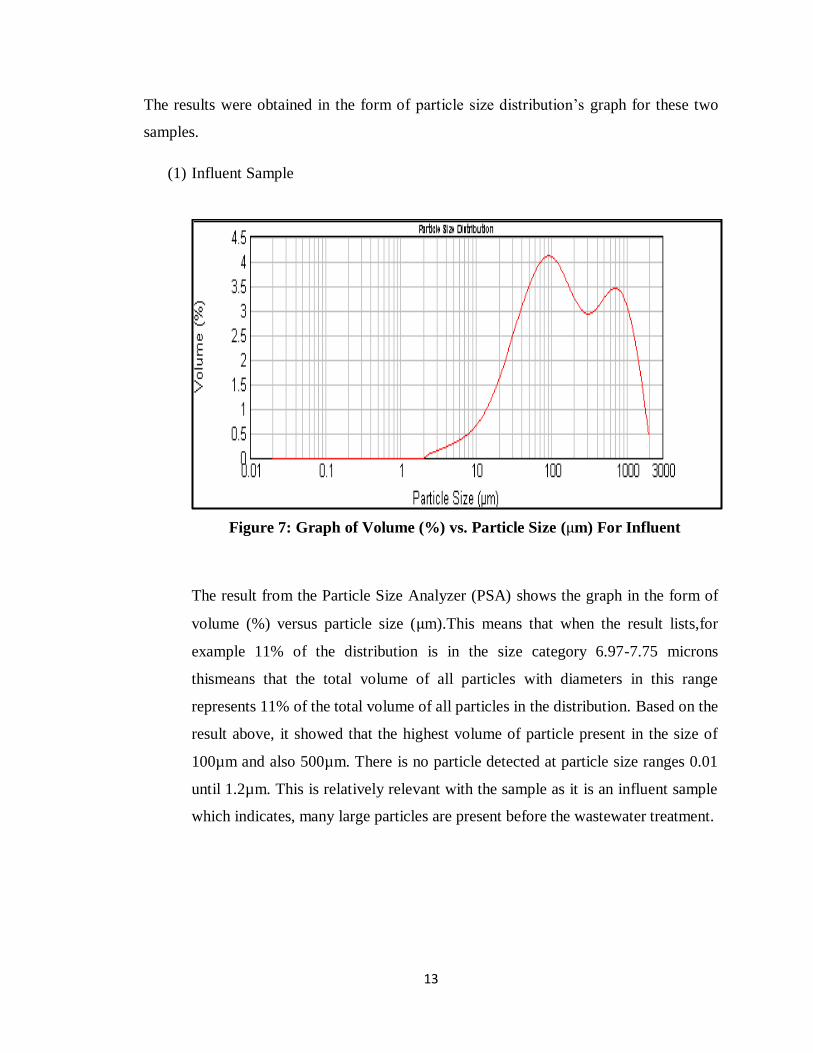
The results were obtained in the form of particle size distribution’s graph for these two
samples.
(1) Influent Sample
Figure 7: Graph of Volume (%) vs. Particle Size ( m) For Influent
The result from the Particle Size Analyzer (PSA) shows the graph in the form of
volume (%) versus particle size ( m).This means that when the result lists,for
example 11% of the distribution is in the size category 6.97-7.75 microns
thismeans that the total volume of all particles with diameters in this range
represents 11% of the total volume of all particles in the distribution. Based on the
result above, it showed that the highest volume of particle present in the size of
100µm and also 500µm. There is no particle detected at particle size ranges 0.01
until 1.2µm. This is relatively relevant with the sample as it is an influent sample
which indicates, many large particles are present before the wastewater treatment.

14
(2) Effluent sample
Figure 8: Graph of Volume (%) vs. Particle Size ( m) For Effluent
The result for effluent sample also showed no particle size ranges from 0.01µm to
1.2µm is being detected. The particle size in the effluent is smaller compared to
the influent. This is by right, is reliable result as effluent has undergone some
treatments in the wastewater treatment plant to remove all the contaminants and
big particles in order to comply with the standard discharge value to the
environment. The highest volume of particle was detected at particle size of 60µm
and also 300µm. This showed the reduction of particle size in effluent compared
to the particle size in influent from the previous analysis. The analysis on particle
size will be continued by doing the study on the treatments in the wastewater
treatment plant in order to determine what compound are being removed from the
wastewater after the treatment.
15
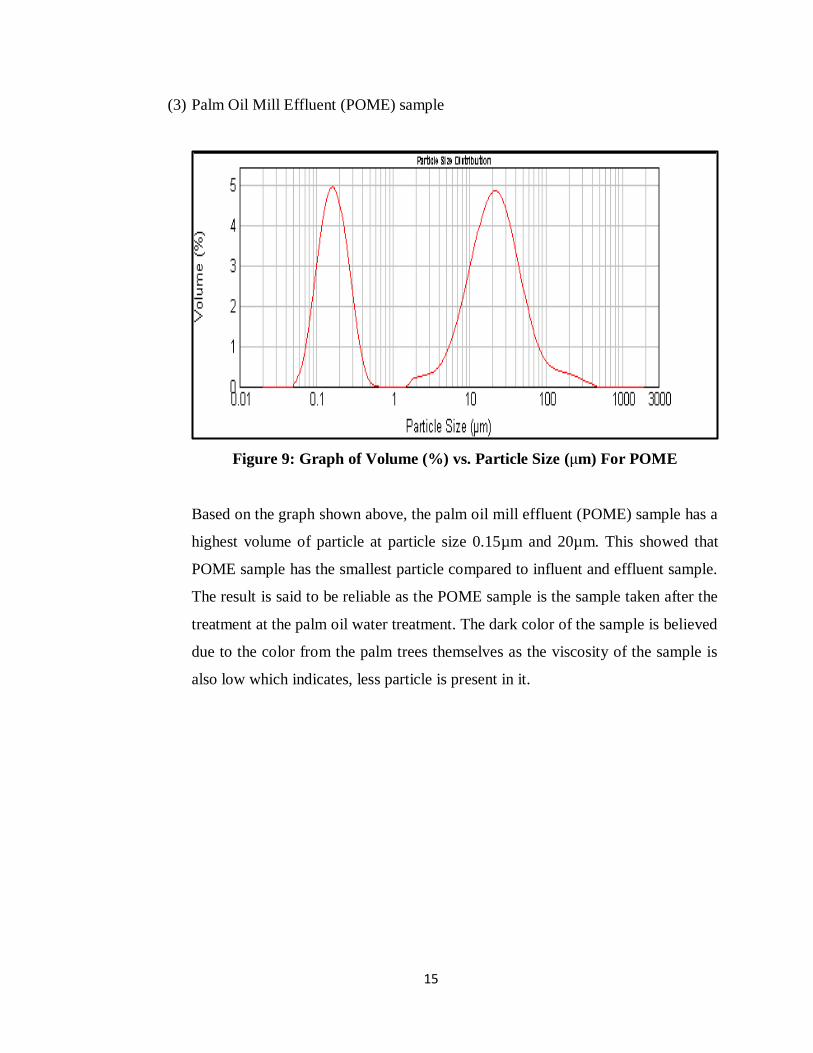
(3) Palm Oil Mill Effluent (POME) sample
Figure 9: Graph of Volume (%) vs. Particle Size ( m) For POME
Based on the graph shown above, the palm oil mill effluent (POME) sample has a
highest volume of particle at particle size 0.15µm and 20µm. This showed that
POME sample has the smallest particle compared to influent and effluent sample.
The result is said to be reliable as the POME sample is the sample taken after the
treatment at the palm oil water treatment. The dark color of the sample is believed
due to the color from the palm trees themselves as the viscosity of the sample is
also low which indicates, less particle is present in it.
16
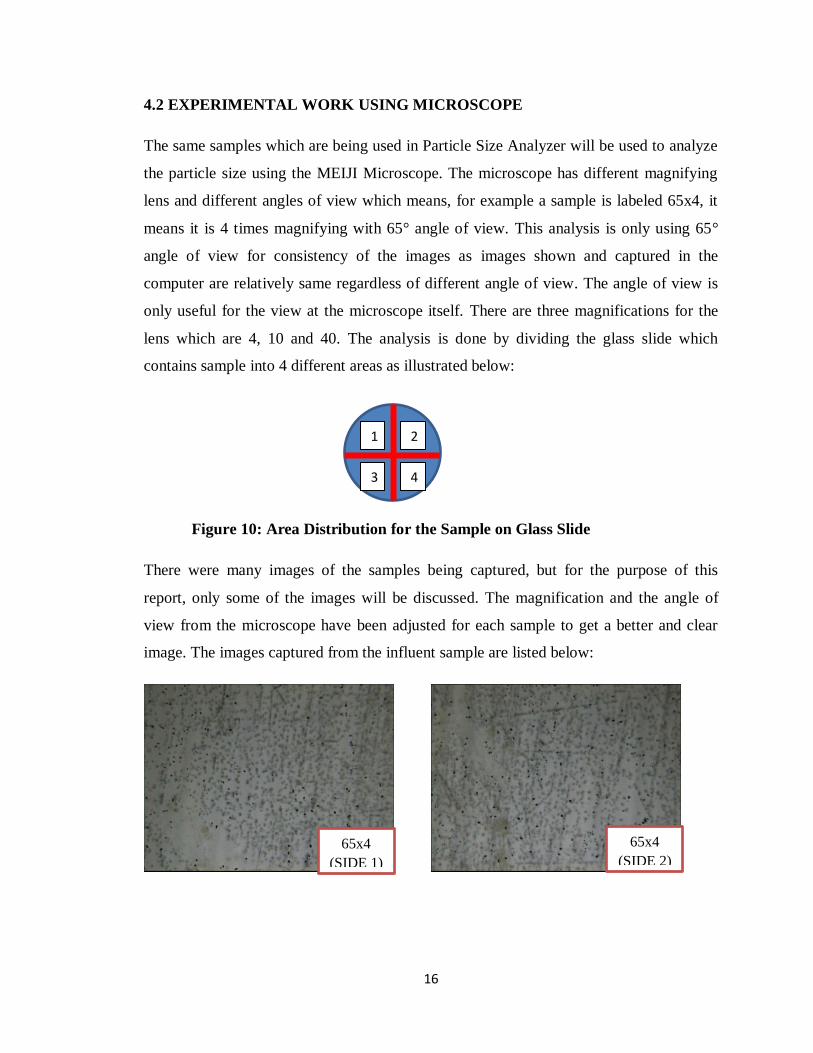
4.2 EXPERIMENTAL WORK USING MICROSCOPE
The same samples which are being used in Particle Size Analyzer will be used to analyze
the particle size using the MEIJI Microscope. The microscope has different magnifying
lens and different angles of view which means, for example a sample is labeled 65x4, it
means it is 4 times magnifying with 65° angle of view. This analysis is only using 65°
angle of view for consistency of the images as images shown and captured in the
computer are relatively same regardless of different angle of view. The angle of view is
only useful for the view at the microscope itself. There are three magnifications for the
lens which are 4, 10 and 40. The analysis is done by dividing the glass slide which
contains sample into 4 different areas as illustrated below:
Figure 10: Area Distribution for the Sample on Glass Slide
There were many images of the samples being captured, but for the purpose of this
report, only some of the images will be discussed. The magnification and the angle of
view from the microscope have been adjusted for each sample to get a better and clear
image. The images captured from the influent sample are listed below:
1 2
3 4
65x4
(SIDE 1)
65x4
(SIDE 2)
17
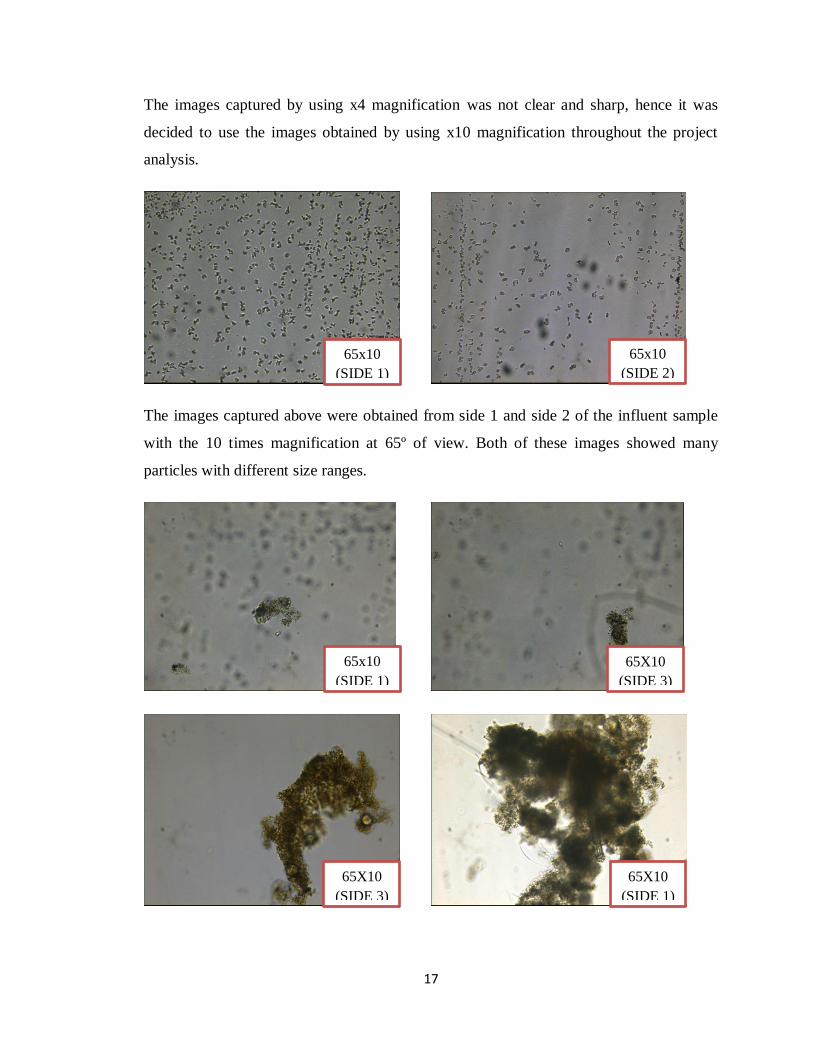
The images captured by using x4 magnification was not clear and sharp, hence it was
decided to use the images obtained by using x10 magnification throughout the project
analysis.
The images captured above were obtained from side 1 and side 2 of the influent sample
with the 10 times magnification at 65º of view. Both of these images showed many
particles with different size ranges.
65x10
(SIDE 1)
65x10
(SIDE 2)
65X10
(SIDE 3)
65X10
(SIDE 3)
65x10
(SIDE 1)
65X10
(SIDE 1)
18
There were also some big particles can be seen from these images as shown above. It was
predicted earlier in the influent sample, that it should contain a bigger size of particle as it
has been contaminated with many contaminants. All of these images supported the
physical appearance of the influent sample which is cloudy and dark color.
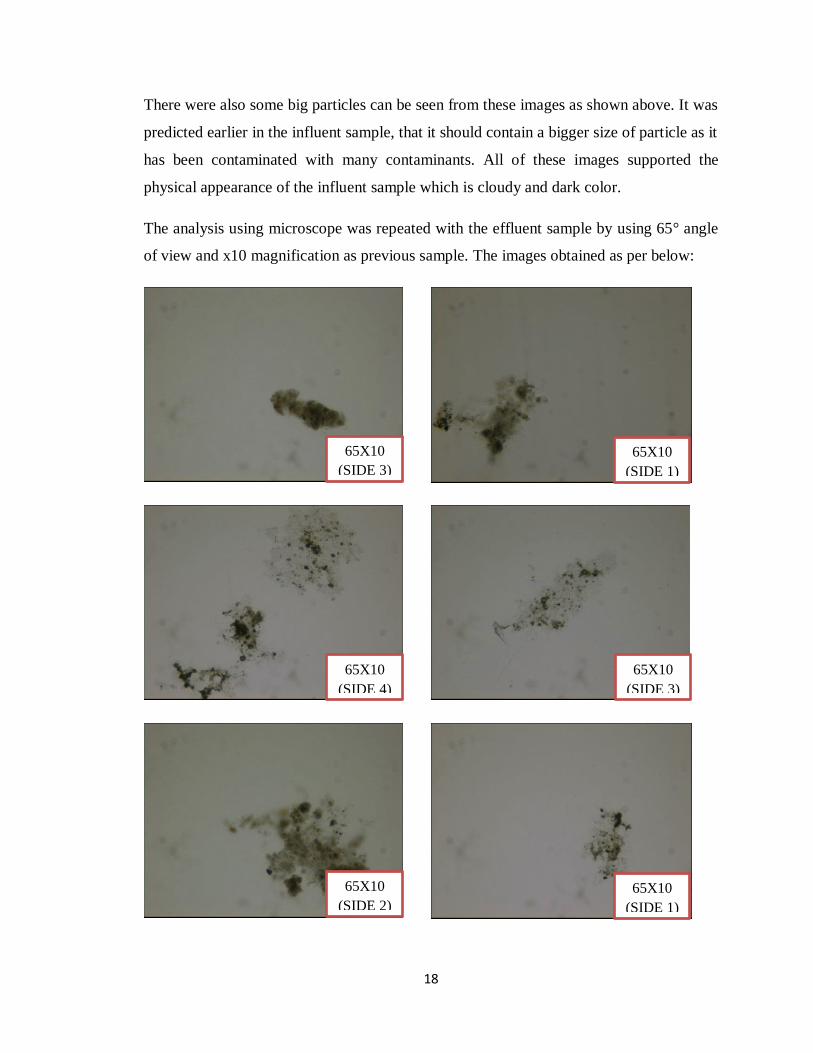
The analysis using microscope was repeated with the effluent sample by using 65° angle
of view and x10 magnification as previous sample. The images obtained as per below:
65X10
(SIDE 4)
65X10
(SIDE 3)
65X10
(SIDE 1)
65X10
(SIDE 2)
65X10
(SIDE 1)
65X10
(SIDE 3)
19
There were many images obtained from the effluent sample, but for the purpose of this
report, only some images will be discussed. The images above showed some smaller
particles compared to those in the influent sample previously. In fact, it was true as this
effluent sample has undergone several types of treatments which reduce the contaminants
inside it. Based on these images, it will surely support the result of the particle size which
will report a smaller size of particle in effluent sample.
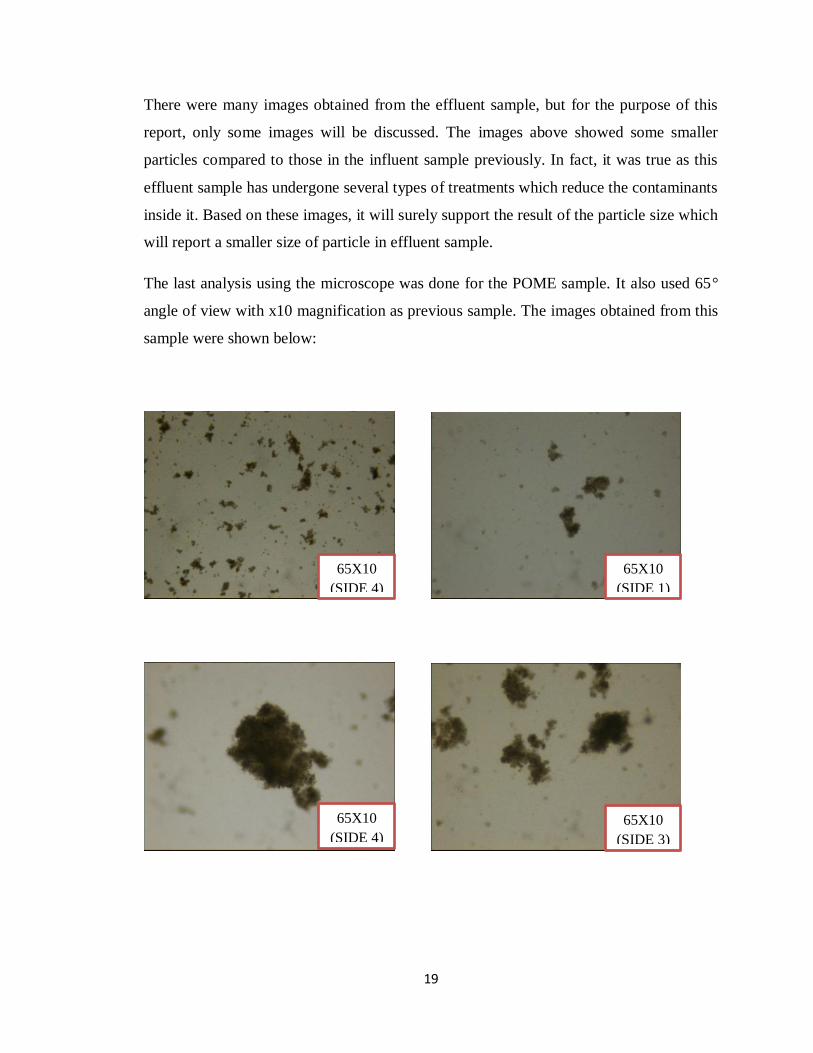
The last analysis using the microscope was done for the POME sample. It also used 65°
angle of view with x10 magnification as previous sample. The images obtained from this
sample were shown below:
65X10
(SIDE 4)
65X10
(SIDE 1)
65X10
(SIDE 4)
65X10
(SIDE 3)
20
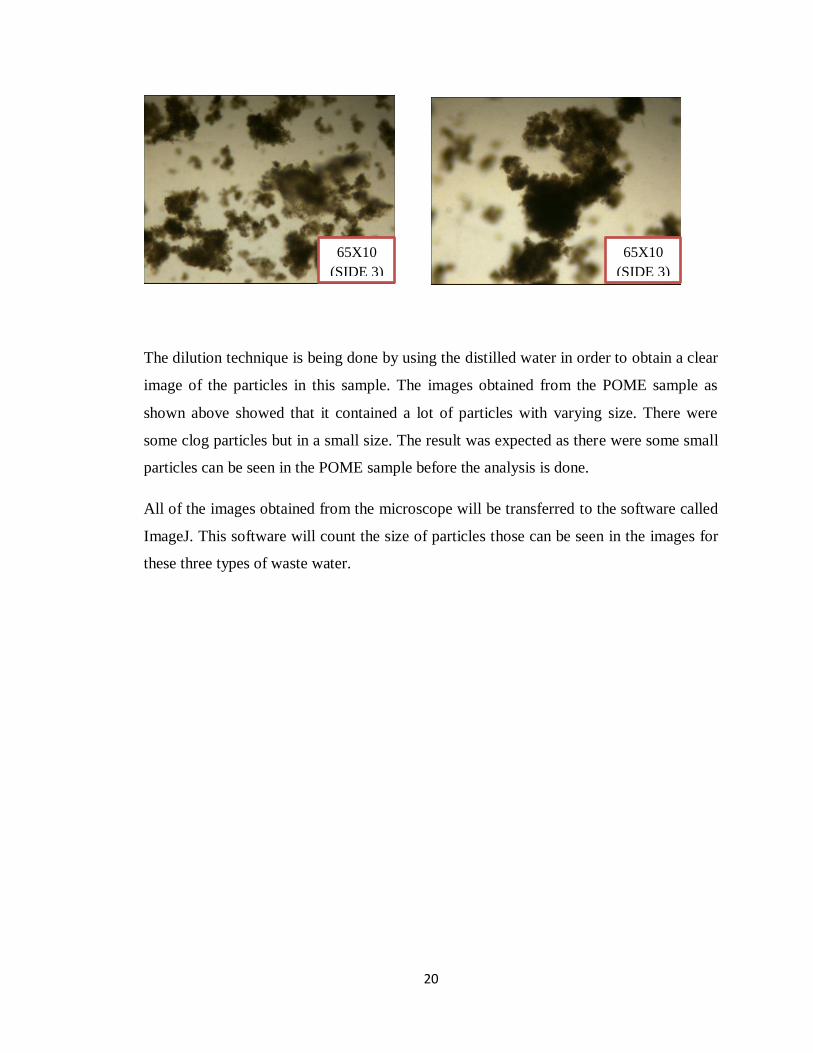
The dilution technique is being done by using the distilled water in order to obtain a clear
image of the particles in this sample. The images obtained from the POME sample as
shown above showed that it contained a lot of particles with varying size. There were
some clog particles but in a small size. The result was expected as there were some small
particles can be seen in the POME sample before the analysis is done.
All of the images obtained from the microscope will be transferred to the software called
ImageJ. This software will count the size of particles those can be seen in the images for
these three types of waste water.
65X10
(SIDE 3)
65X10
(SIDE 3)
21
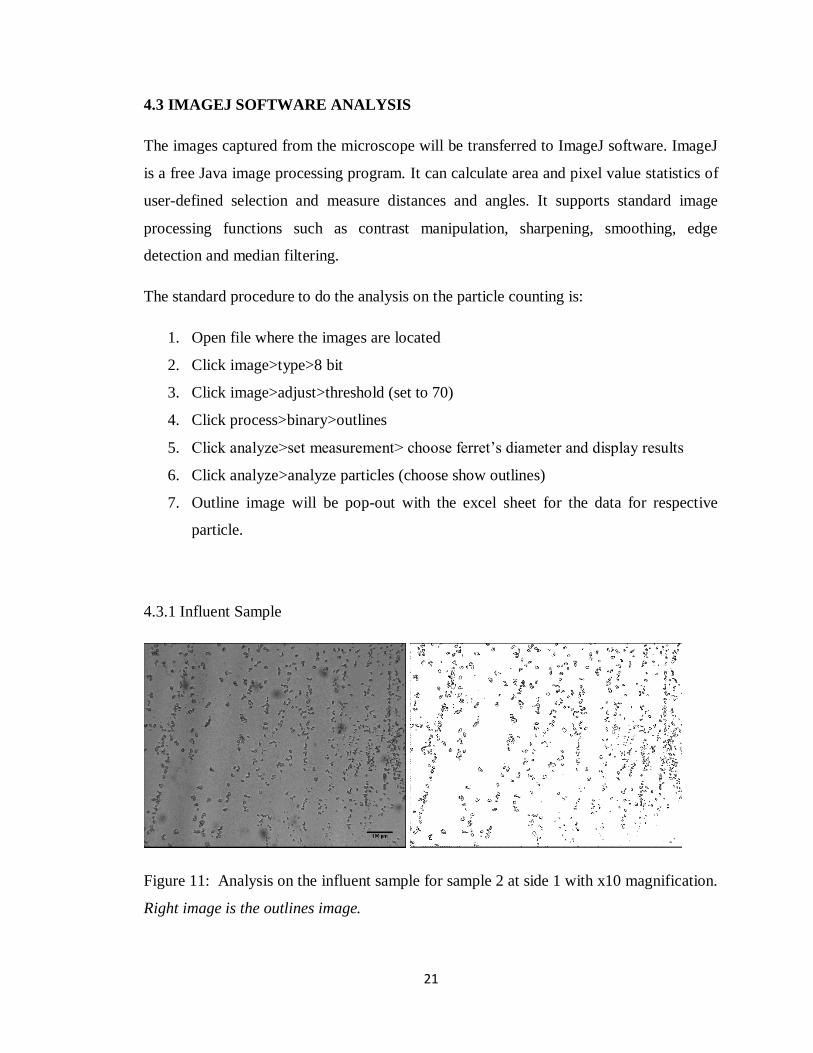
4.3 IMAGEJ SOFTWARE ANALYSIS
The images captured from the microscope will be transferred to ImageJ software. ImageJ
is a free Java image processing program. It can calculate area and pixel value statistics of
user-defined selection and measure distances and angles. It supports standard image
processing functions such as contrast manipulation, sharpening, smoothing, edge
detection and median filtering.
The standard procedure to do the analysis on the particle counting is:
1. Open file where the images are located
2. Click image>type>8 bit
3. Click image>adjust>threshold (set to 70)
4. Click process>binary>outlines
5. Click analyze>set measurement> choose ferret’s diameter and display results
6. Click analyze>analyze particles (choose show outlines)
7. Outline image will be pop-out with the excel sheet for the data for respective
particle.
4.3.1 Influent Sample
Figure 11: Analysis on the influent sample for sample 2 at side 1 with x10 magnification.
Right image is the outlines image.
22
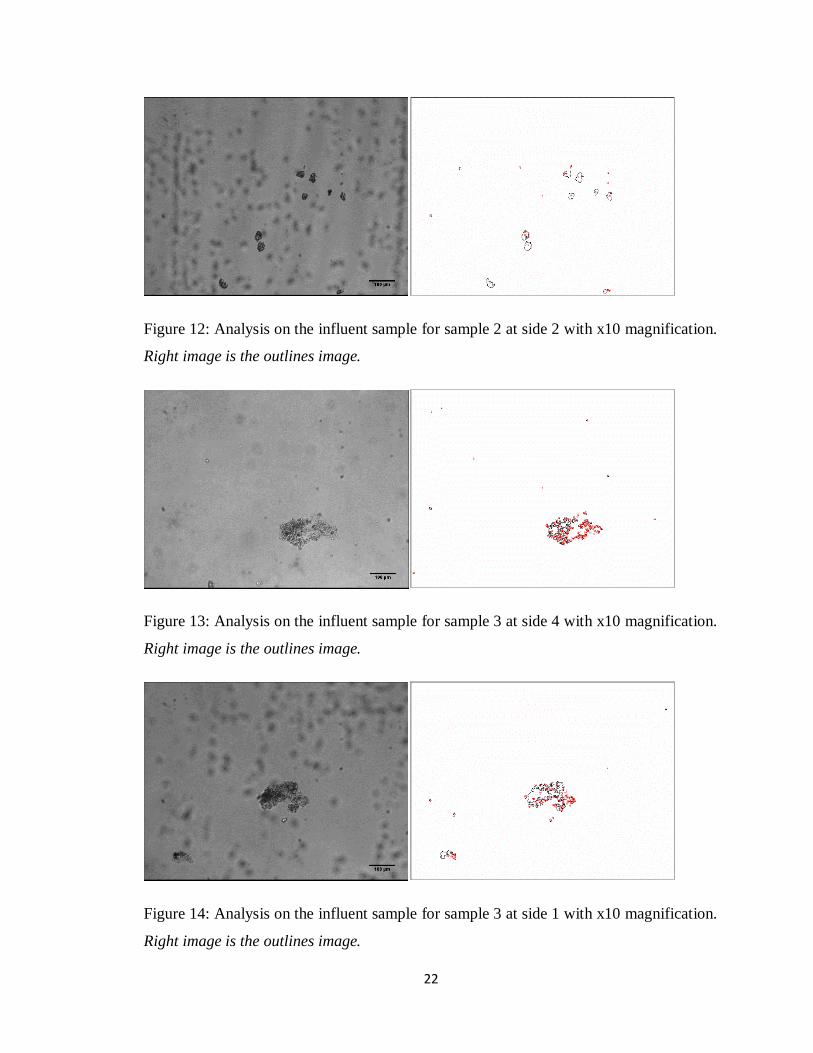
Figure 12: Analysis on the influent sample for sample 2 at side 2 with x10 magnification.
Right image is the outlines image.
Figure 13: Analysis on the influent sample for sample 3 at side 4 with x10 magnification.
Right image is the outlines image.
Figure 14: Analysis on the influent sample for sample 3 at side 1 with x10 magnification.
Right image is the outlines image.
23
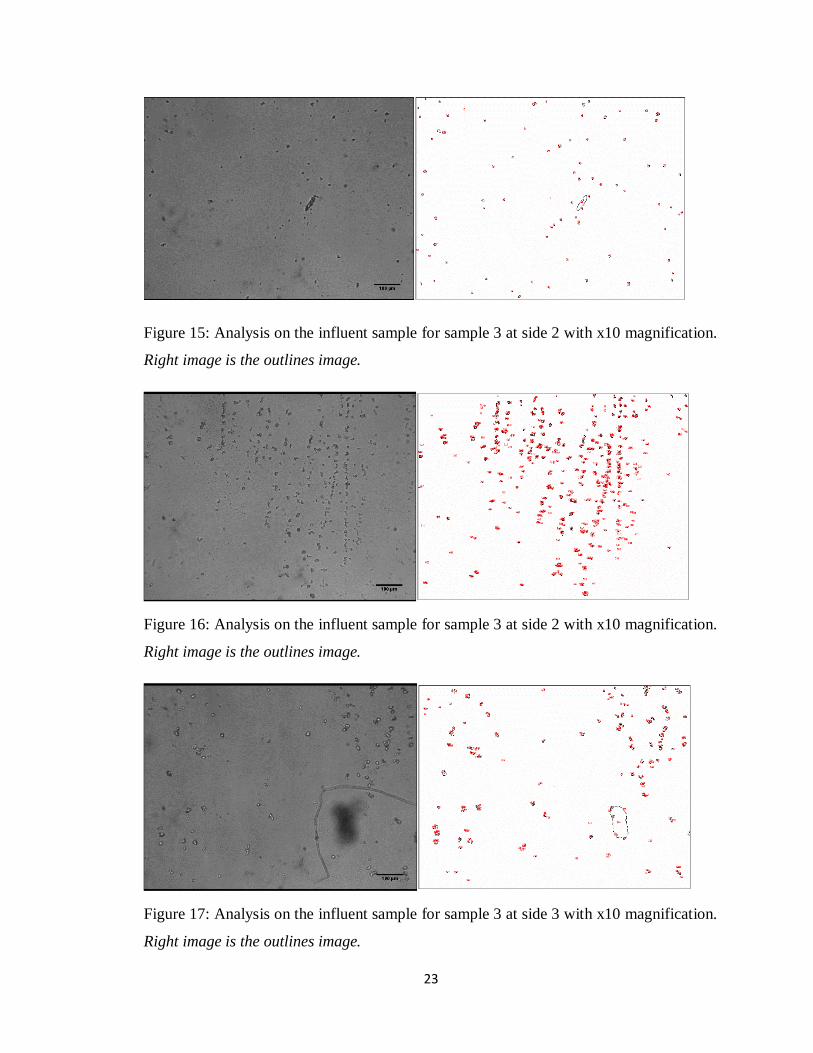
Figure 15: Analysis on the influent sample for sample 3 at side 2 with x10 magnification.
Right image is the outlines image.
Figure 16: Analysis on the influent sample for sample 3 at side 2 with x10 magnification.
Right image is the outlines image.
Figure 17: Analysis on the influent sample for sample 3 at side 3 with x10 magnification.
Right image is the outlines image.
24
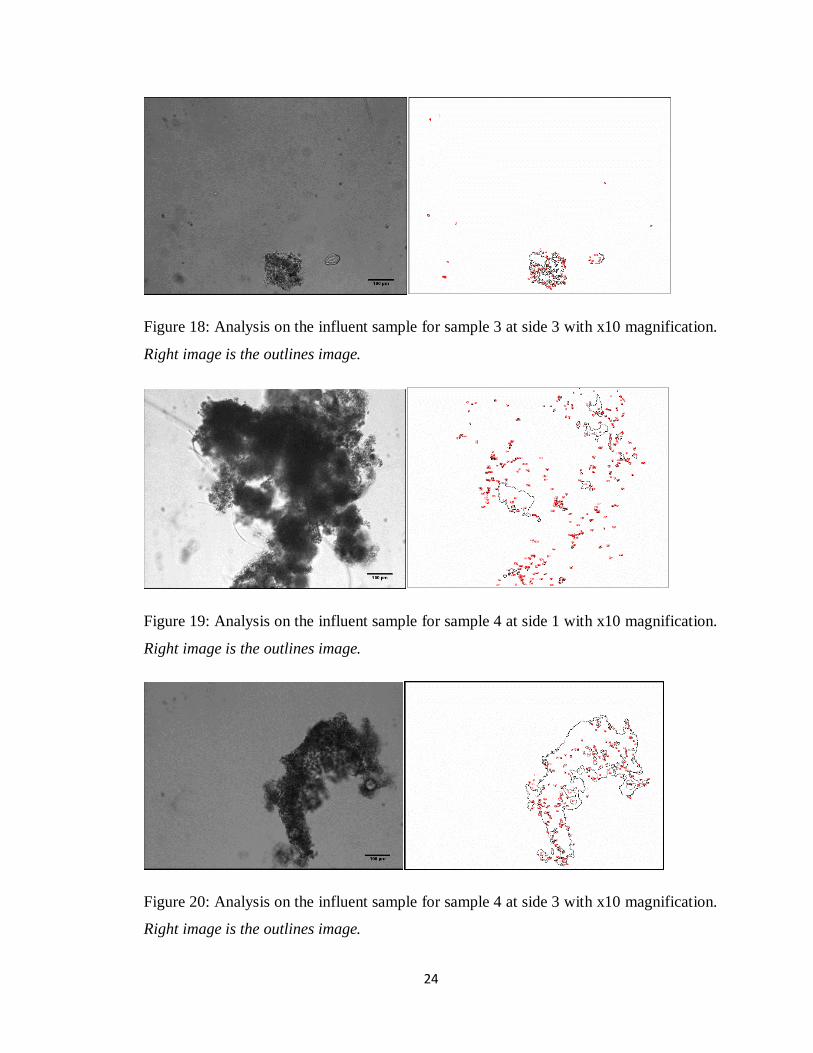
Figure 18: Analysis on the influent sample for sample 3 at side 3 with x10 magnification.
Right image is the outlines image.
Figure 19: Analysis on the influent sample for sample 4 at side 1 with x10 magnification.
Right image is the outlines image.
Figure 20: Analysis on the influent sample for sample 4 at side 3 with x10 magnification.
Right image is the outlines image.
25
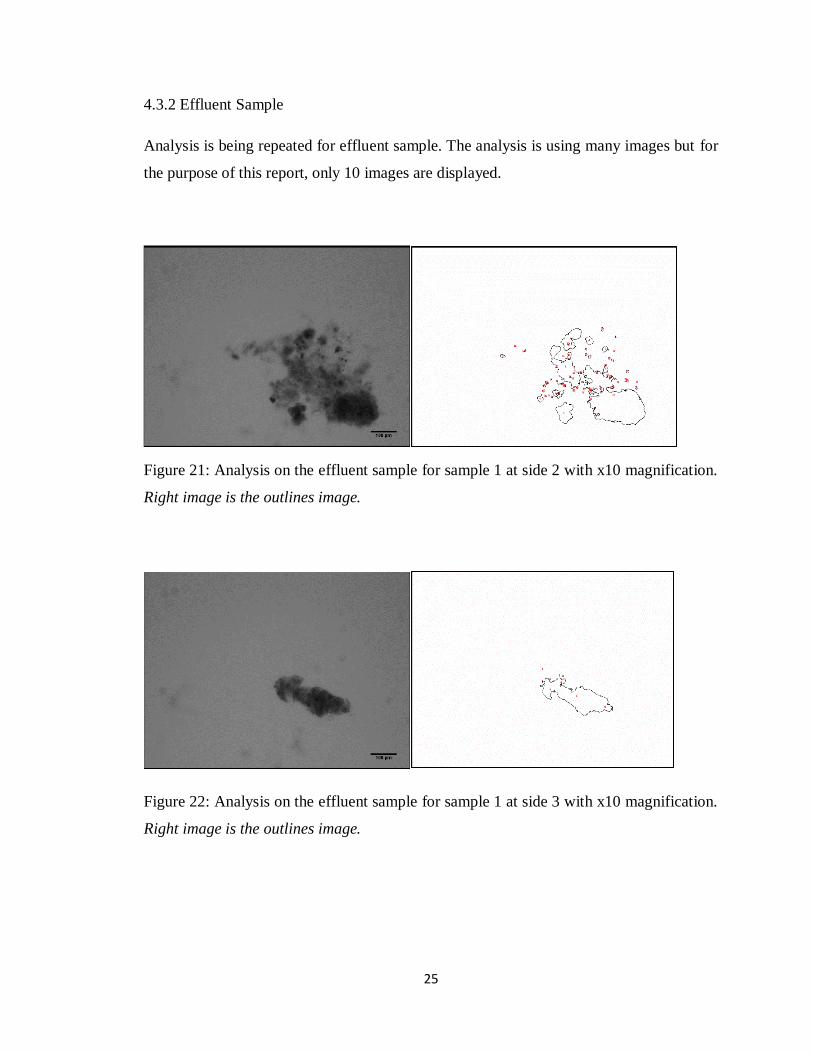
4.3.2 Effluent Sample
Analysis is being repeated for effluent sample. The analysis is using many images but for
the purpose of this report, only 10 images are displayed.
Figure 21: Analysis on the effluent sample for sample 1 at side 2 with x10 magnification.
Right image is the outlines image.
Figure 22: Analysis on the effluent sample for sample 1 at side 3 with x10 magnification.
Right image is the outlines image.
26
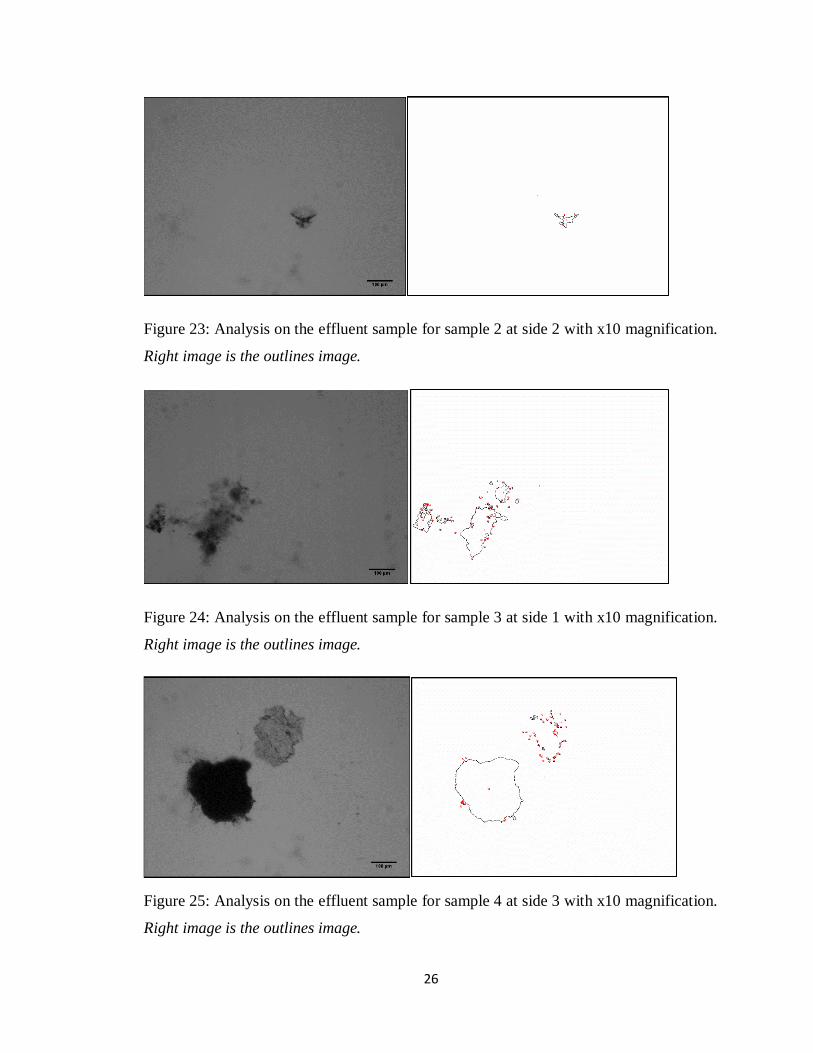
Figure 23: Analysis on the effluent sample for sample 2 at side 2 with x10 magnification.
Right image is the outlines image.
Figure 24: Analysis on the effluent sample for sample 3 at side 1 with x10 magnification.
Right image is the outlines image.
Figure 25: Analysis on the effluent sample for sample 4 at side 3 with x10 magnification.
Right image is the outlines image.
27
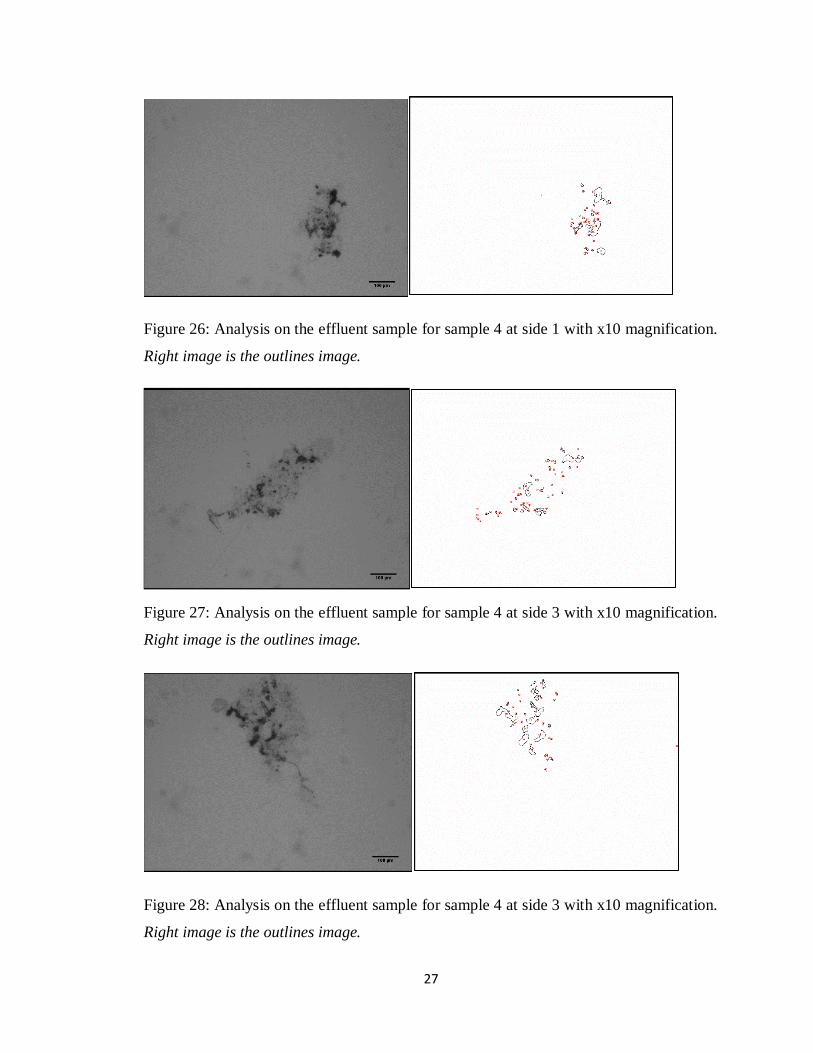
Figure 26: Analysis on the effluent sample for sample 4 at side 1 with x10 magnification.
Right image is the outlines image.
Figure 27: Analysis on the effluent sample for sample 4 at side 3 with x10 magnification.
Right image is the outlines image.
Figure 28: Analysis on the effluent sample for sample 4 at side 3 with x10 magnification.
Right image is the outlines image.
28
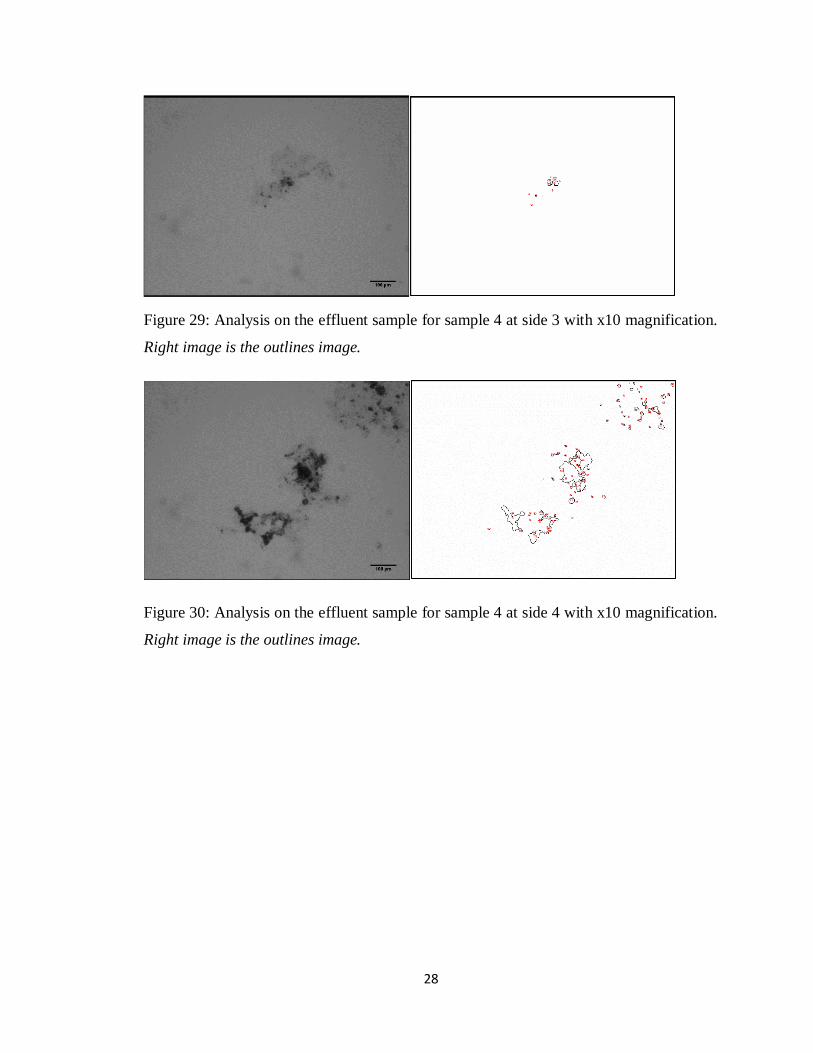
Figure 29: Analysis on the effluent sample for sample 4 at side 3 with x10 magnification.
Right image is the outlines image.
Figure 30: Analysis on the effluent sample for sample 4 at side 4 with x10 magnification.
Right image is the outlines image.

29
4.3.3 POME Sample
Analysis is being repeated for POME sample. The analysis is using many images but for
the purpose of this report, only 10 images are displayed.
Figure 31: Analysis on the effluent sample for sample 1 at side 1 with x10 magnification.
Right image is the outlines image.
Figure 32: Analysis on the effluent sample for sample 1 at side 2 with x10 magnification.
Right image is the outlines image.
30
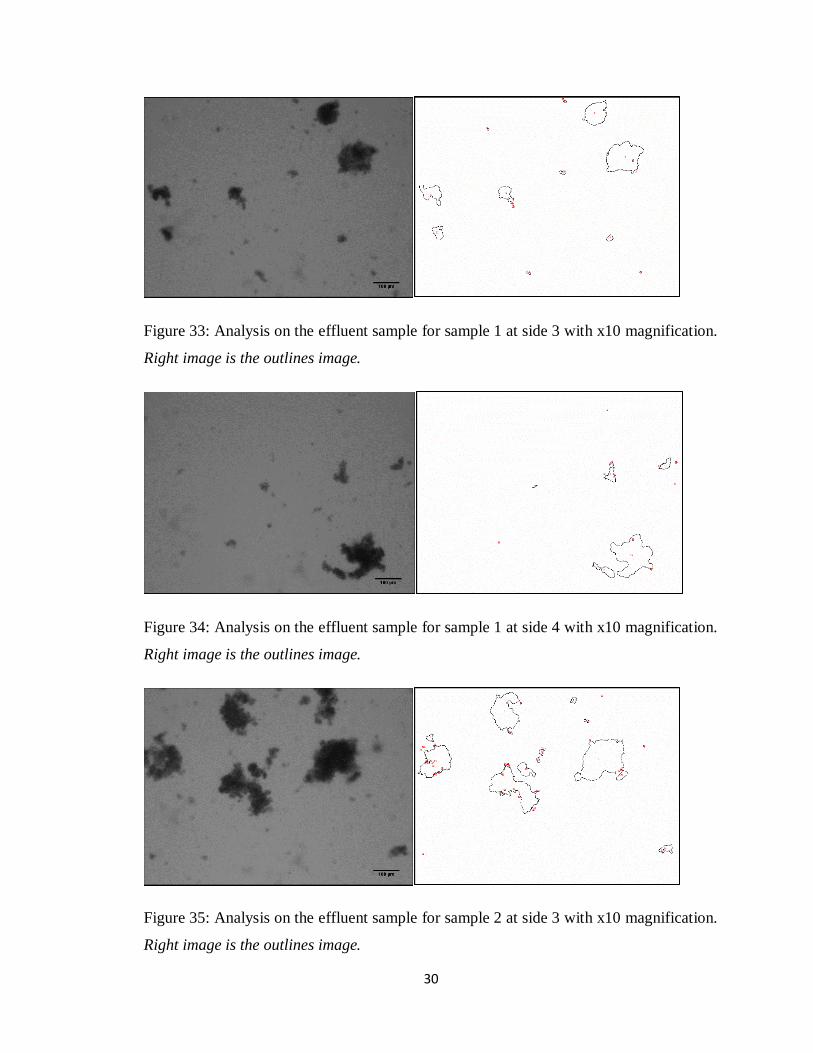
Figure 33: Analysis on the effluent sample for sample 1 at side 3 with x10 magnification.
Right image is the outlines image.
Figure 34: Analysis on the effluent sample for sample 1 at side 4 with x10 magnification.
Right image is the outlines image.
Figure 35: Analysis on the effluent sample for sample 2 at side 3 with x10 magnification.
Right image is the outlines image.
31
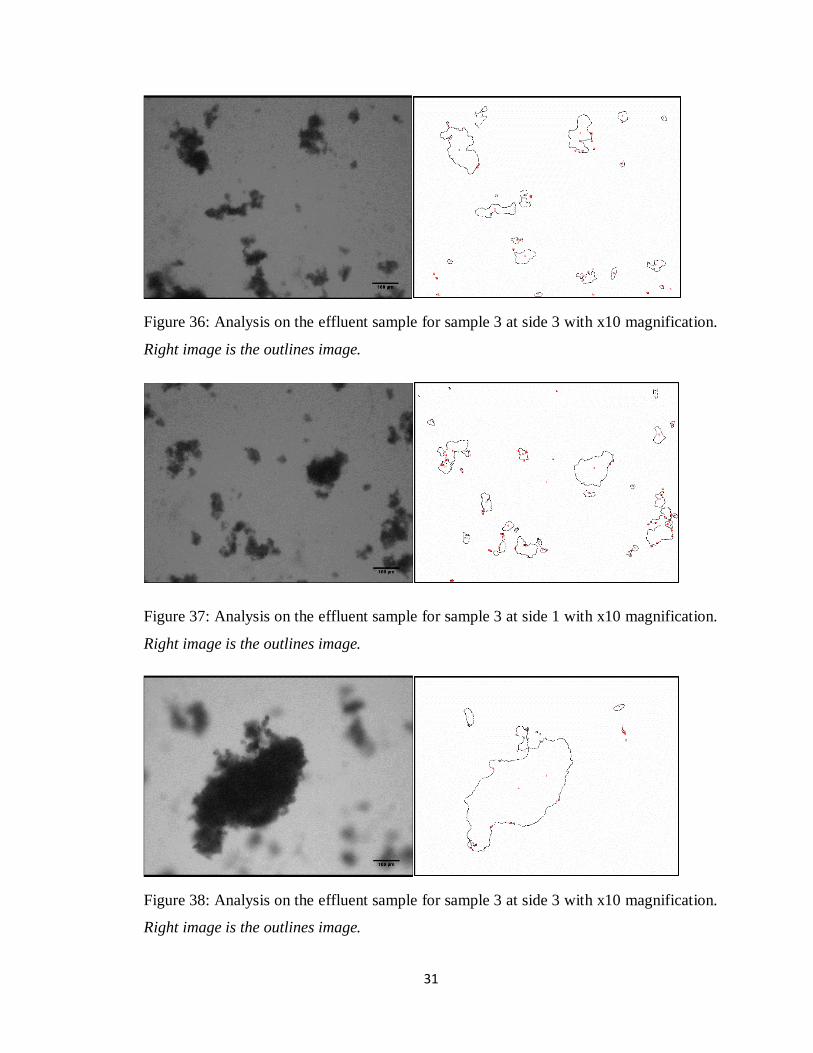
Figure 36: Analysis on the effluent sample for sample 3 at side 3 with x10 magnification.
Right image is the outlines image.
Figure 37: Analysis on the effluent sample for sample 3 at side 1 with x10 magnification.
Right image is the outlines image.
Figure 38: Analysis on the effluent sample for sample 3 at side 3 with x10 magnification.
Right image is the outlines image.
32
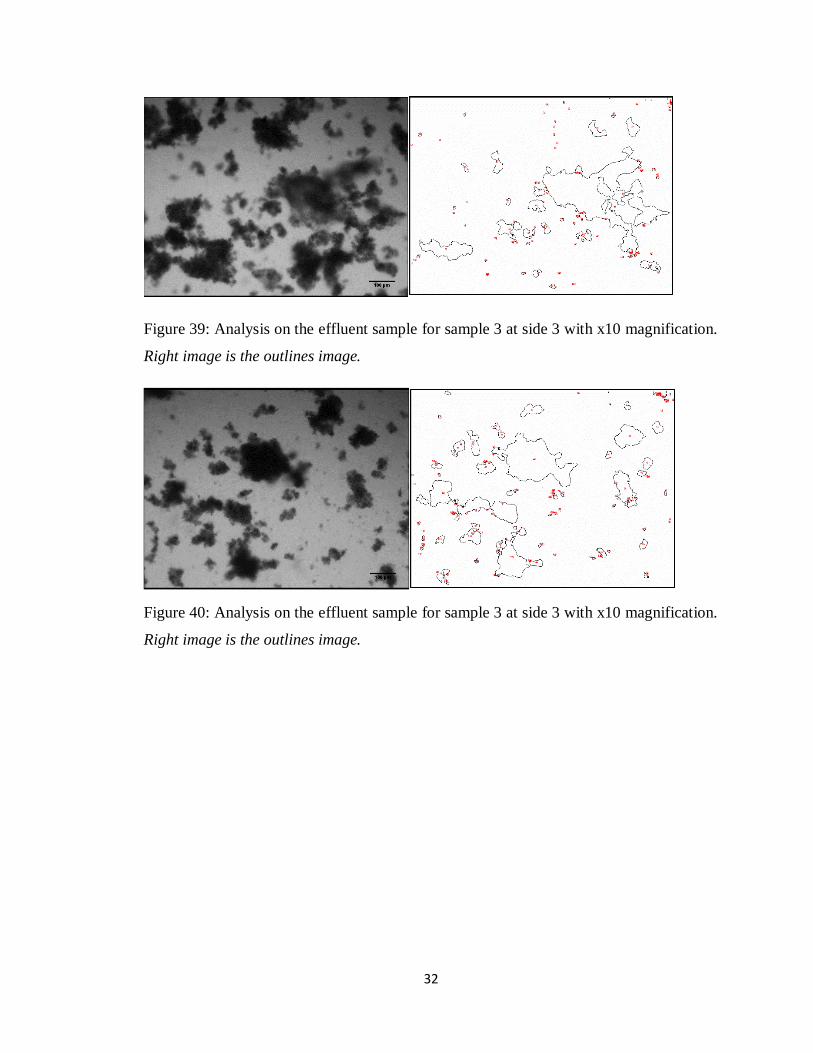
Figure 39: Analysis on the effluent sample for sample 3 at side 3 with x10 magnification.
Right image is the outlines image.
Figure 40: Analysis on the effluent sample for sample 3 at side 3 with x10 magnification.
Right image is the outlines image.
33
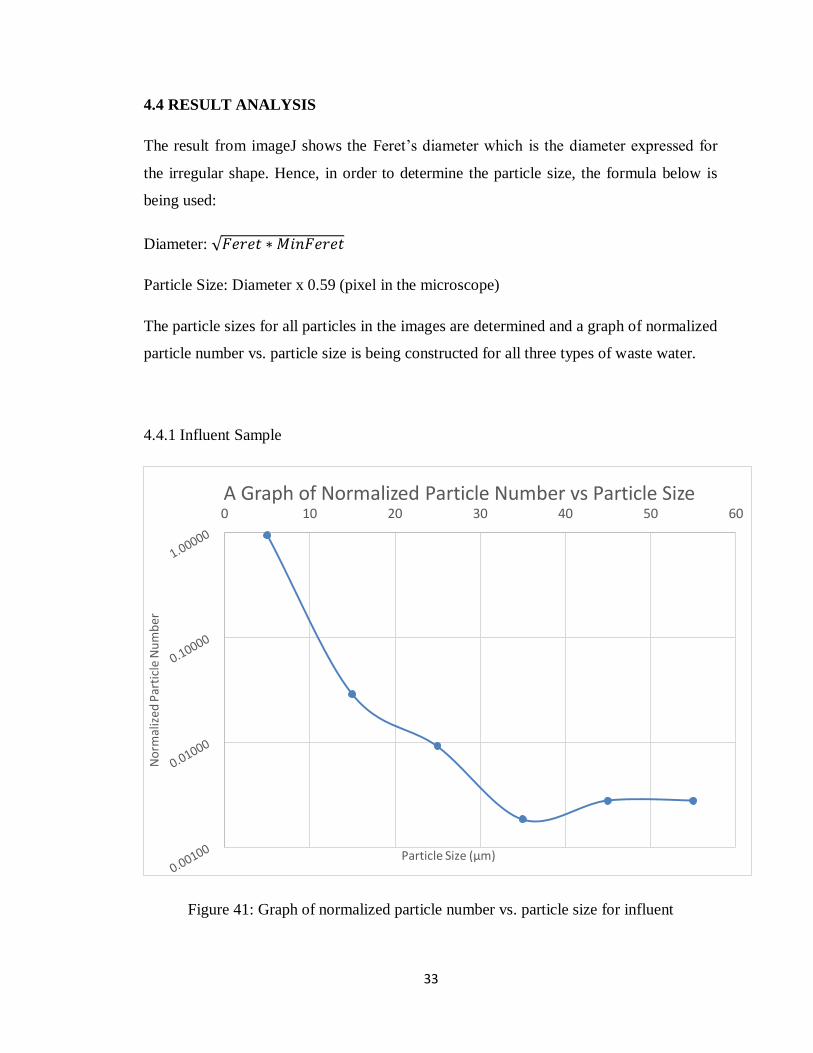
4.4 RESULT ANALYSIS
The result from imageJ shows the Feret’s diameter which is the diameter expressed for
the irregular shape. Hence, in order to determine the particle size, the formula below is
being used:
Diameter: √
Particle Size: Diameter x 0.59 (pixel in the microscope)
The particle sizes for all particles in the images are determined and a graph of normalized
particle number vs. particle size is being constructed for all three types of waste water.
4.4.1 Influent Sample
Figure 41: Graph of normalized particle number vs. particle size for influent
0 10 20 30 40 50 60
No
rmal
ized
Par
ticl
e N
um
ber
Particle Size (µm)
A Graph of Normalized Particle Number vs Particle Size

34
4.4.2 Effluent Sample
Figure 42: Graph of normalized particle number vs. particle size for effluent
0.0010
0.0100
0.1000
1.0000
0 10 20 30 40 50 60 70
No
rmal
ized
Par
ticl
e N
um
ber
Particle Size (µm)
Graph of Normalized Particle Number vs Particle Size
35
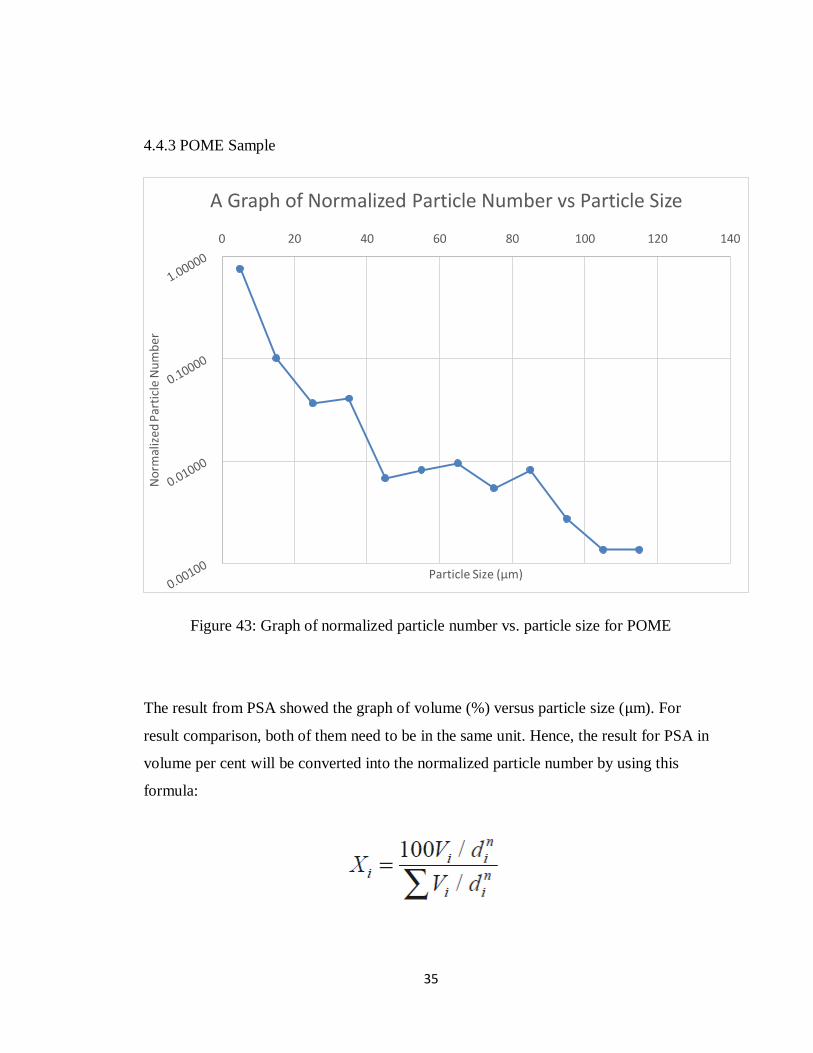
4.4.3 POME Sample
Figure 43: Graph of normalized particle number vs. particle size for POME
The result from PSA showed the graph of volume (%) versus particle size ( m). For
result comparison, both of them need to be in the same unit. Hence, the result for PSA in
volume per cent will be converted into the normalized particle number by using this
formula:
0 20 40 60 80 100 120 140
No
rmal
ized
Par
ticl
e N
um
ber
Particle Size (µm)
A Graph of Normalized Particle Number vs Particle Size
36
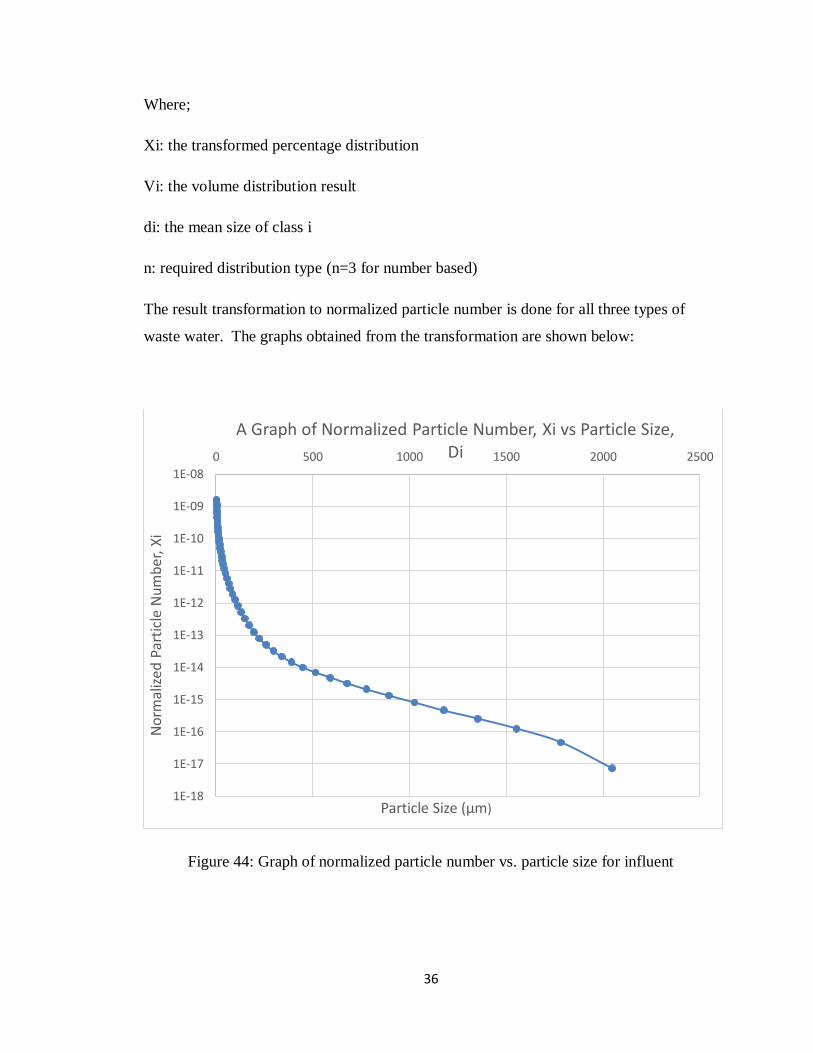
Where;
Xi: the transformed percentage distribution
Vi: the volume distribution result
di: the mean size of class i
n: required distribution type (n=3 for number based)
The result transformation to normalized particle number is done for all three types of
waste water. The graphs obtained from the transformation are shown below:
Figure 44: Graph of normalized particle number vs. particle size for influent
1E-18
1E-17
1E-16
1E-15
1E-14
1E-13
1E-12
1E-11
1E-10
1E-09
1E-08
0 500 1000 1500 2000 2500
No
rmal
ized
Par
ticl
e N
um
ber
, Xi
Particle Size (µm)
A Graph of Normalized Particle Number, Xi vs Particle Size, Di
37
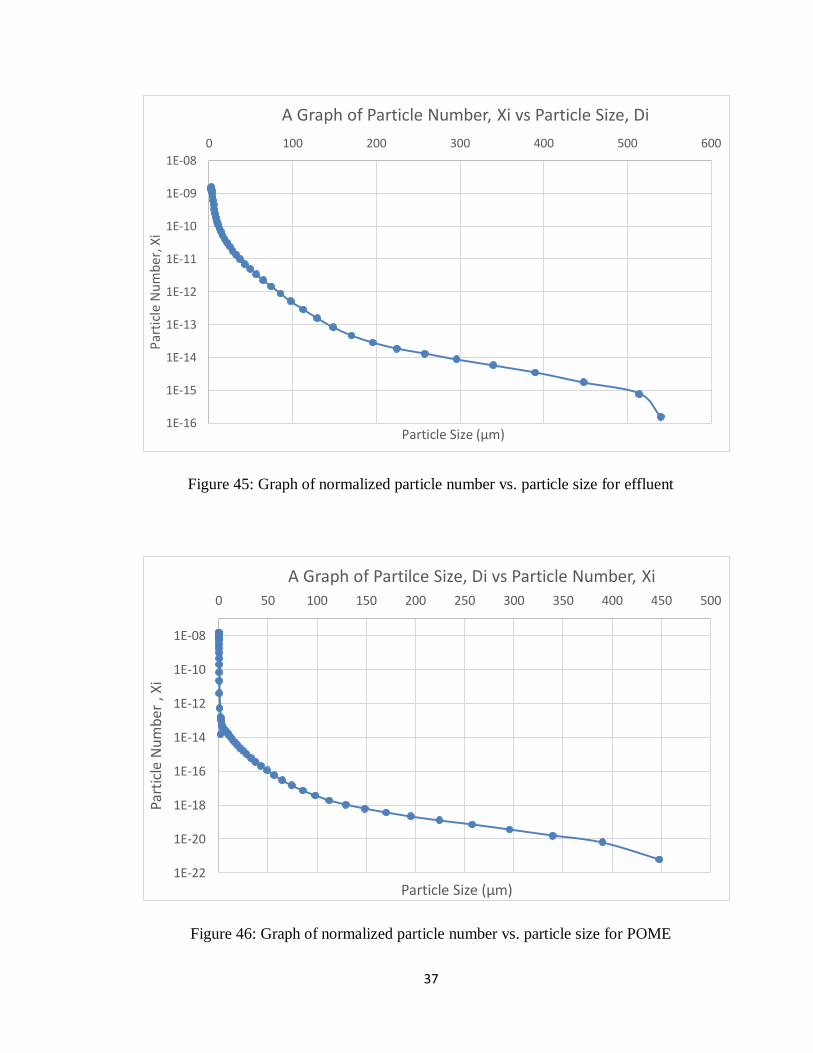
Figure 45: Graph of normalized particle number vs. particle size for effluent
Figure 46: Graph of normalized particle number vs. particle size for POME
1E-16
1E-15
1E-14
1E-13
1E-12
1E-11
1E-10
1E-09
1E-08
0 100 200 300 400 500 600P
arti
cle
Nu
mb
er, X
i
Particle Size (µm)
A Graph of Particle Number, Xi vs Particle Size, Di
1E-22
1E-20
1E-18
1E-16
1E-14
1E-12
1E-10
1E-08
0 50 100 150 200 250 300 350 400 450 500
Part
icle
Nu
mb
er ,
Xi
Particle Size (µm)
A Graph of Partilce Size, Di vs Particle Number, Xi
38
Based on the graphs obtained from PSA and also ImageJ analysis, the trends of the graph
are decreasing. The results for PSA need to be converted into particle number distribution
in order to make the result comparison with the ImageJ analysis. Taking for example, the
result obtained from the ImageJ for influent, the most size of particle present in the
sample is 5µm, while from the PSA, the particle size at 2µm is the most present in the
sample. The result shows a bit deviation but acceptable. This is due to the working
principle of the equipment itself. As for PSA, it uses the laser diffraction technique which
measures particle size distributions by measuring the angular variation in intensity of
light scattered as a laser beam passes through a dispersed particulate sample. Large
particles scatter light at small angles relative to the laser beam and small particles scatter
light at large angles. The angular scattering intensity data is then analyzed to calculate the
size of the particles responsible for creating the scattering pattern, using the Mie theory of
light scattering assuming the particle is equivalent to sphere model. Hence, all the
particles present in the waste water will be assumed as sphere. Differently by using
microscope, the images of all particles can be seen. Based on the experimental work
being done throughout this project, it can be concluded that not all particles are in sphere
model. Most of the particles are present in the irregular shape. Hence, by using
microscope, the images of irregular particles can be captured and the particle size can be
obtained by using ImageJ software. The usage of microscope in this project is believed to
give a high contribution to the environmental field as for example, to measure the
bacteria and microorganisms in the waste water, specific measurements are required as
they are in irregular shapes. Hence, by knowing the size of bacteria and microorganisms,
the feasible waste water treatment can be designed. Unfortunately, the analysis using the
microscope tends to be repeated. The images of the same particles are sometimes being
captured twice as many particles are present in one waste water sample.
39
CHAPTER 5
CONCLUSION AND RECOMMENDATION
5.1 CONCLUSION
Based on the study, background research and literature review that have been carried out,
the project seems to be relevant and feasible to be executed within the time frame and the
scope of study. Although there are many tools being developed for particle size analysis,
there is still a lack of comprehensive study covering limitations and advantages of using
the specific equipment to measure the particle size in different wastewater. Hence, this
project will provide the data for determination of the limitations and advantages in
different equipment being used for measuring particle size. There are only two equipment
will be used in this project which is Particle Size Analyzer (PSA) and microscope due to
some limitations of time frame and the availability of the equipment in UTP. The usage
of microscope along with the ImageJ software to determine the size of particles in the
waste water sample is believed to give a high contribution to the environmental field
especially for structural analysis. This is due to the ability of this software to measure the
size of irregular particles. In conclusion, the image analysis method is beneficial and
should be further developed in the future.
5.2 RECOMMENDATIONS
Suggested further works for expansion and continuation:
Purchase more equipment for measuring particle size to wider the coverage area
of the research in terms of equipment being used.
Increase the waste water samples to compare the feasibility of the equipment
being used with more different samples.
40
REFERENCES
1. A.Tiehm, V. H. U. N. (1999). Particle Size Analysis For Improved Sedimentation
And Filtration In Waste Water Treatment.
2. Environmental Quality (Sewage And Industrial Effluents) Regulations 1979
(1974).
3. Agency, U. S. E. P. (2004). Primer For Municipal Wastewater Treatment
Systems.
4. Allen, T. (1997). Particle Size Measurement (5 ed. Vol. 1). USA: Chapman &
Hall.
5. Eran Segal, P. J. S., Scott A.Bradford. (2009). Measuring Particle Size
Distribution Using Laser Diffraction: Implications for Predicting Soil Hydraulic
Properties. 174(12).
6. Gregorová, W. P. E. (2007). Characterization Of Particles And Particle Systems
7. HORIBA Instruments , I. (2012). A Guidebook To Particle Size Analysis.
8. Levoguer, C. (2013). Using Laser Diffraction To Measure Particle Size And
Distribution. Metal Powder Report, 68(3), 15-18. doi:
http://dx.doi.org/10.1016/S0026-0657(13)70090-0
9. Philo Morse, M., and Andrew Loxley,. (2009). Light Microscopic Determination
Of Particle Size Distribution In An Aqueous Gel. Particle Size Distribution, 9(5).
10. S.A.Ha. (2003). A Study on the Reproducibility of Particle Size Analysis Using
Laser Diffraction. 8(4), 212-221.
11. T. Vítěz, P. T. (2010). Particle Size Distribution Of A Waste Sand From A Waste
Water Treatment Plant With Use Of Rosin–Rammler And Gates–Gaudin–
Schumann Mathematical Model. 3, 197–202.
12. Wikipedia. (2014). Particle.
13. Zielina, M. (2007). Monitoring Of The Processes In Water Treatment Plant.