Embed Size (px)
Citation preview
Study of Early Education and Development (SEED): Impact Study on Early Education Use and Child Outcomes up to age five years Research brief
February 2020 Edward Melhuish – University of Oxford, and Nord University, Norway
Julian Gardiner – University of Oxford
2
Acknowledgments The authors wish to thank the families and children in the longitudinal study who gave their valuable time to contribute to the collection of the data for this report.
We would like to thank the SEED research teams at the National Centre for Social Research (NatCen), Action for Children and Frontier Economics for their contribution to the project. We are also grateful to colleagues at the Department for Education and to the SEED Advisory Board for comments and advice throughout the work.
3
Contents List of Tables 4
Summary 5
Introduction 7
Background 7
Aims 7
Historical context 8
Sample 8
Early childhood education and care (ECEC) 9
Measures 10
Results 13
Are variations in ECEC use associated with child development? 13
Do the effects of ECEC use vary according to disadvantage group and home learning environment? 16
Are there differences between the effects of different formal group ECEC settings? 16
Is higher formal group ECEC use associated with socio-emotional problems? 17
Is the start age for formal ECEC use associated with child development? 18
Is the combination of types of ECEC used associated with child development? 19
Are variations in the quality of ECEC attended associated with child development? 20
Are variations in the home environment associated with child development? 20
Conclusions 23
References 25
4
List of Tables Table 1: Summary of associations between children’s time (hours per week) in ECEC between age two and start of school and children’s outcomes during reception year / school year one. .............................................................................................................. 14
Table 2: Breakdown by factor combining the age at which ten or more hours per week formal ECEC was first used and the mean formal ECEC usage between age two and the start of school. ................................................................................................................. 18
Table 3: Summary of the associations between home environment variables and children’s outcomes during reception year / school year one. ......................................... 21
5
Summary Aims and Methods This report presents findings for families who took part in the Study of Early Education and Development (SEED) longitudinal study. Data on children’s use of early childhood education and care (ECEC) and on families’ demographic and home environment backgrounds were collected via parental interviews when children were aged two, three and four years old. Child development during school reception year / school year one was assessed in three ways:
1. Using the Early Years Foundation Stage Profile (EYFSP), a teacher assessment of cognitive and socio-emotional outcomes undertaken at the end of school reception year.
2. Children’s cognitive development was assessed during school year one using the British Ability Scales (BAS) verbal and non-verbal ability measures.
3. Children’s socio-emotional development was assessed using the Children’s Self-regulation and Behaviour Questionnaire (CSBQ), completed by children’s teachers during school year one.
ECEC quality was measured through observations carried out in 1,000 settings attended by a subsample of children in the study.
This report explores whether child development during school reception year / school year one is associated with:
• The amount of differing types of ECEC that children receive between age two and the start of school.
• The combination of types of ECEC which children use between age two and the start of school.
• The age at which children first use at least ten hours per week of formal ECEC.
• The early years home environment and the quality of the parent/child relationship at age two to four.
• The quality of the ECEC settings that children have attended at age two to four.
Key Findings • A larger amount of informal individual ECEC (with friends and relatives) used
between age two and the start of school was associated with higher child verbal ability measured during school year one.
• A larger amount of formal group ECEC (in playgroups, nursery classes etc) was associated with poorer outcomes on a number of child socio-emotional scales measured during school year one.
6
• There is evidence that the use of some individual ECEC (childminders, friends, relatives) mitigates the negative socio-emotional effects of high formal group ECEC use.
• For the 40% most disadvantaged children, starting to use a minimum of ten hours per week formal ECEC no later than age two, combined with a mean use of over twenty hours per week of formal ECEC between age two and the start of school, increases the chances of achieving expected EYFSP levels in school reception year and improves children’s verbal ability in school year one.
• The characteristics of the home environment, including the home learning environment and the parent / child relationship, have considerable influence on children’s cognitive and socio-emotional outcomes measured during school reception year / school year one.
• There was no clear evidence of associations between the quality of ECEC which children had attended between ages two and four and their developmental outcomes during reception year / school year one: though these findings may relate to the relatively small sample of settings for the SEED quality study and the similarities in ECEC quality across the sample.
7
Introduction
Background Several decades of research indicated that early childhood education and care (ECEC) can have a positive effect on children’s educational, cognitive, behavioural and social outcomes, in both the short and long term, particularly if it is of good quality (Sylva et al., 2010; Melhuish et al., 2015; Melhuish & Barnes, 2018). From September 2004, all three- and four-year-olds in England have been entitled to funded early education. Since September 2010 this entitlement was for 570 hours per year (commonly taken as 15 hours per week for 38 weeks of the year). From September 2017 the entitlement doubled to 1140 hours per year (equivalent to 30 hours per week for 38 weeks of the year) for families where parents are each earning at least the equivalent of the National Minimum Wage or Living Wage for 16 hours per week.1
Research also indicated that the benefits of high quality early education exist from as young as two years of age (Sammons et al., 2002). In 2013, the UK Government expanded the funded early education entitlement to two-year-old children living in certain disadvantaged households in England. Specifically, from September 2013 the entitlement of 570 hours per year was introduced for two-year-olds looked after by the local authority and those from families receiving specified benefits, who might be regarded as the most disadvantaged. It was further extended in September 2014 to two-year-olds from low income families, two-year-olds with special needs and two-year-olds who have left care.
The Study of Early Education and Development (SEED)2 includes a major longitudinal study designed to provide evidence on the effectiveness of early years education and to identify any short- and longer-term benefits from this investment in early education The study is being conducted by a consortium including the National Centre for Social Research, the University of Oxford, Action for Children and Frontier Economics. SEED aims to study children at age two, three, four, five and seven years to seek information on how variation in early childhood education and care experience may be associated with cognitive and socio-emotional development.
Aims This report focuses on how ECEC may be related to children’s development during school reception year / school year one, with these objectives:
1. To study the associations between the amounts of different types of ECEC that children received between the age of two and the start of school and child development at school reception year / school year one.
1 30 hours childcare are available if parents and partners with whom the child lives are in work (including on parental leave, sick leave or annual leave) and each earning at least the national minimum wage for 16 hours a week and less than £100,000 per year. 2 Further information about the SEED study and reports published to date are available at http://www.seed.natcen.ac.uk/.
8
2. To study the associations between the quality of the ECEC group settings that children have attended aged two to four and child development at school reception year / school year one.
3. To consider how age of starting ECEC may be associated with child development at school reception year / school year one.
4. To study the associations between combinations of types of ECEC between age two and the start of school and development at reception year / school year one.
5. To investigate the impact of the home environment, parenting and the quality of the parent/child relationship on development at reception year / school year one.
Historical context The last comparable study of ECEC in England was the Effective Pre-school, Primary & Secondary Education (EPPSE) study which studied the impact of use and the quality of ECEC on child development in the period 1997-2000.3 Since that time, there have been considerable changes in the use of ECEC and in the provision available. Most notably:
1. The proportion of children using some group ECEC (in playgroups, nursery classes, nursery schools etc.) has increased so that now the use of such provision is almost universal; 98.8% of children in the SEED study attended some group ECEC between age two and the start of school.
2. The quality of the group ECEC available has increased. For example, the average score on the Early Childhood Environment Rating scale (ECERS-R), a measure of overall quality for ECEC settings, increased from 4.29 for settings in the EPPSE study (an “adequate” rating) to 5.18 for settings in the SEED study (a “good” rating).4
These historical shifts in ECEC use and the quality of ECEC provision are important for the interpretation of the findings of the SEED study.
Sample The study participants consisted of 3,186 children and their families on whom data were collected at Waves 1, 2, 3 and 4 of the SEED study, when children were aged two, three, four and five years old, respectively. Additionally, data from the Early Years Foundation Stage Profile (EYFSP), which is assessed when children are in school reception year, was available for 4,942 children who were included in SEED Wave 1.
The aim was to have approximately equal numbers from three levels of disadvantage, as defined by family income and benefits received:
1. The 20% most disadvantaged families (“most disadvantaged” group)
3 See Sylva, 2004. 4 See Melhuish & Gardiner, 2017.
9
2. The 20%-40% disadvantaged families (“moderately disadvantaged” group) 3. The 60% least disadvantaged families (“least disadvantaged” group)
Early childhood education and care (ECEC) In this study, ECEC settings eligible for government funding were labelled as ‘formal’; those not eligible for government funding were labelled as ‘informal’. Settings in a non-domestic setting were labelled as ‘group’, whilst those in a domestic setting were labelled as ‘individual’. All group ECEC was formal, whereas some individual ECEC was formal and some informal. The following three-way grouping of ECEC is used:
1. Formal group ECEC – ECEC in a non-domestic setting and eligible for government funding (e.g. day nurseries, nursery classes or schools and playgroups).
2. Formal individual ECEC – ECEC in a domestic setting and eligible for government funding (i.e. childminders).
3. Informal individual ECEC – ECEC in a domestic setting and not eligible for government funding (e.g. childcare with relatives, friends, neighbours and nannies).
Children in SEED may attend any form of ECEC, and some children attended more than one type. Of the 3,186 children in Wave 4 of the SEED study, 3,149 had some formal group ECEC between age two and the start of school, 419 had some formal individual (childminder) ECEC during this period and 1,686 had some informal individual ECEC. A further breakdown of the formal group ECEC category was used in some analyses to compare private, voluntary and independent (PVI) settings with maintained settings defined as follows:
a. Private, voluntary and independent (PVI) formal group ECEC administered privately or by voluntary / charitable organisations.
b. Maintained formal group ECEC, which is local government administered (i.e. nursery classes, nursery schools, Local Authority nurseries, children’s centres).
10
Measures Child development
This report brings together data on child development from different sources. The National Pupil Database (NPD) provided Early Years Foundation Stage Profile (EYFSP) information, which is a teacher assessment of cognitive and socio-emotional outcomes at the end of the reception year. Children were assessed directly during school year one by research staff using subscales of the British Ability Scales (BAS) and by teacher ratings using the Children’s Self-regulation and Behaviour Questionnaire (CSBQ).
Educational achievement and development The Early Years Foundation Stage Profile (EYFSP) is a teacher rated assessment of children at the end (May to June) of reception year.5 Child outcomes from five areas were considered:
A. Communication and Language B. Physical Development C. Personal, Social and Emotional Development (PSED) D. Literacy E. Numeracy
In addition, an Overall Good Level of Development was derived from these five outcomes and the EYFSP total score was derived from the complete EYFSP assessment. Cognitive development Children’s cognitive development was assessed at the start (September to December) of school year one using two British Ability Scales (BAS) measures:6
1. Verbal ability (“naming vocabulary”). 2. Non-verbal ability (“picture similarities”).
Socio-emotional development Children’s socio-emotional development was assessed using the Children’s Self-regulation and Behaviour Questionnaire (CSBQ), completed by children’s teachers in the later part (March to May) of school year one.7 This was scored to produce two socio-emotional problems scales:
1. Externalising behaviour (e.g. child loses temper, argues with other children) 2. Internalising behaviour (e.g. child is easily upset, is anxious)
and five socio-emotional strengths scales:
1. Sociability (e.g. child has friends, plays with other children) 2. Prosocial behaviour (e.g. child is co-operative, is helpful, shares things)
5 See Early Years Foundation Profile, 2018. 6 See Elliot, Smith & McCullough, 2011. 7 See Howard & Melhuish, 2017.
11
3. Behavioural self-regulation(e.g. child follows instructions, waits their turn) 4. Cognitive self-regulation (e.g. child choses their own tasks, persists with tasks) 5. Emotional self-regulation (e.g. child is calm, keeps temper)
Home environment
Nine home environment measures were included in the analyses. These were derived from the SEED Wave 1, Wave 2 and Wave 3 interviews:
1. Home Learning Environment (HLE) index (learning activities in home: e.g. parents read with child, child draws/paints at home)
2. Household Disorder (CHAOS scale: e.g. house is noisy, house is disorganised). 3. Parent’s Psychological Distress (e.g. symptoms of depression or anxiety). 4. Limit Setting (i.e. how often parents set limits on their child’s behaviour). 5. Warmth (MORS scale, closeness in the parent/child relationship: e.g. relationship
is affectionate, parent and child do things together).8 6. Invasiveness (MORS scale, conflict in the parent/child relationship: e.g. parent
finds child annoying).8 7. Authoritative parenting, characterized by high demands / high responsiveness.9 8. Authoritarian parenting, characterized by high demands / low responsiveness.9 9. Permissive parenting, characterized by low demands / low or high
responsiveness.9 Where measures were available from multiple waves, the mean value was taken.
Demographic measures
These measures were assessed at the Wave 1, Wave 2 and Wave 3 interviews carried out with parents when the children were aged two, three and four, respectively.
1. Child’s month of birth / age in school year 2. Child’s gender 3. Child’s ethnic group 4. Child’s birth weight 5. Maternal age at birth of child 6. Number of siblings living in the same household as child 7. Whether child was living in a couple or lone parent household 8. Whether child was living in a workless or working household 9. Household income 10. Area Deprivation (Index of Multiple Deprivation, IMD)10 11. SEED disadvantage group (most disadvantaged, moderately disadvantaged, least
disadvantaged) according to household income and benefits at baseline
8 See Simkiss et al., 2013. 9 See Robinson, 1995. 10 A measure which ranks every small area (average 1,500 residents) in England from most to least deprived (based on income deprivation, employment deprivation, education, skills and training deprivation, health deprivation and disability, crime, barriers to housing and services, living environment deprivation).
12
12. Type of accommodation tenure (renting / owner occupier) 13. Mother’s highest academic qualification 14. Highest parental socio-economic status
Where demographic measures varied over time, the Wave 2 values were used.
Quality measures
The quality of 1000 ECEC settings was assessed though half day observations by trained observers. These observations took place in 402 settings that children had attended at age two (Wave 1), and 598 settings that children had attended at age three (Wave 2).
At Wave 1, settings were assessed using:
1. The Sustained Shared Thinking and Emotional Well-being scale (SSTEW), which focuses on the quality of interactions between staff and children.11
2. The Infant and Toddler Environment Rating Scale – Revised (ITERS-R), an overall measure of quality for the under-threes.12
At Wave 2, settings were assessed using:
1. SSTEW 2. The Early Childhood Environment Rating Scale - Revised (ECERS-R), an overall
measure of quality for the over-threes.13 3. The Extension to the Early Childhood Environment Rating Scale (ECERS-E),
which focuses on the educational aspects of experience for the over-threes.14
11 For more information on this scale see: Siraj, Kingston & Melhuish, 2015. 12 Harms, Cryer & Clifford, 2006. 13 Harms, Cryer & Clifford, 2005. 14 Sylva, Siraj-Blatchford & Taggart, 2011.
13
Results
Are variations in ECEC use associated with child development? All children were compared according to their ECEC use, which was treated as a continuous variable. The statistical models were organised so that the reported effect is the change in the standardized outcome corresponding to a ten hour per week change in ECEC use. Formal group, formal individual (childminder) and informal individual ECEC were treated separately. A summary of results is given in Table 1. Where significant effects of ECEC use were found in initial analyses, further analyses were conducted comparing the effects of specific ECEC usage bands.
14
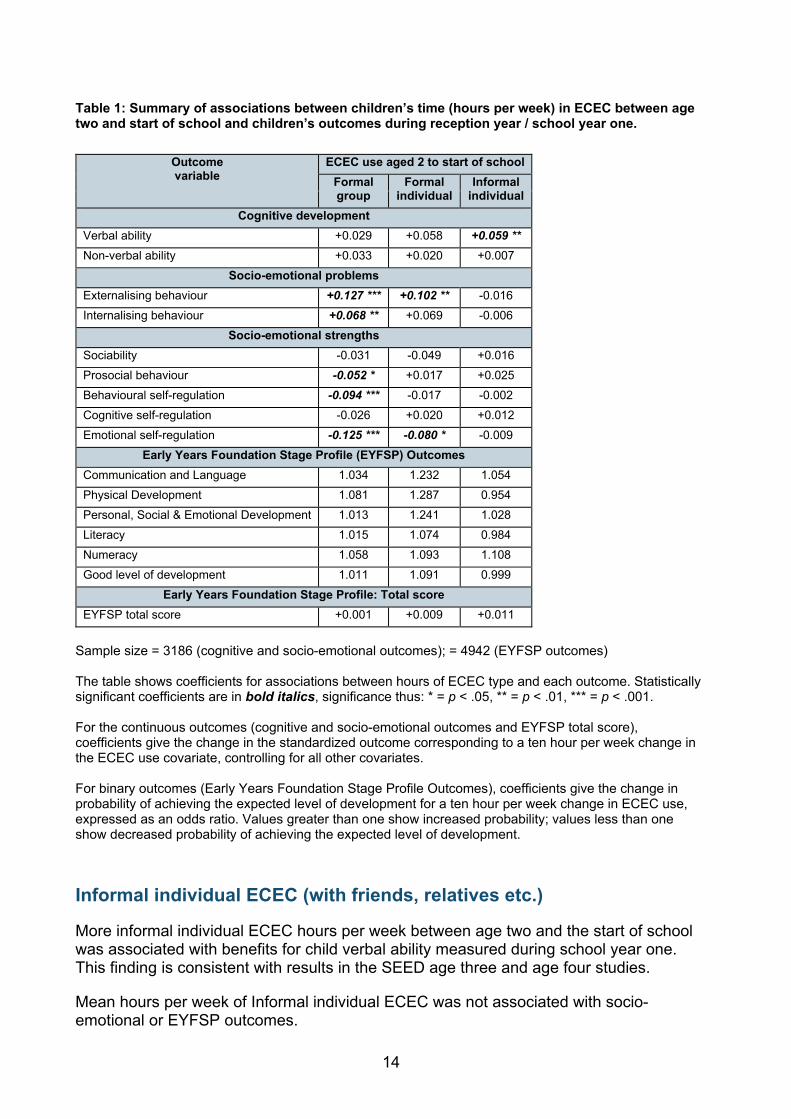
Table 1: Summary of associations between children’s time (hours per week) in ECEC between age two and start of school and children’s outcomes during reception year / school year one.
Outcome variable
ECEC use aged 2 to start of school Formal group
Formal individual
Informal individual
Cognitive development Verbal ability +0.029 +0.058 +0.059 **Non-verbal ability +0.033 +0.020 +0.007
Socio-emotional problems Externalising behaviour +0.127 *** +0.102 ** -0.016Internalising behaviour +0.068 ** +0.069 -0.006
Socio-emotional strengths Sociability -0.031 -0.049 +0.016Prosocial behaviour -0.052 * +0.017 +0.025Behavioural self-regulation -0.094 *** -0.017 -0.002Cognitive self-regulation -0.026 +0.020 +0.012Emotional self-regulation -0.125 *** -0.080 * -0.009
Early Years Foundation Stage Profile (EYFSP) Outcomes Communication and Language 1.034 1.232 1.054 Physical Development 1.081 1.287 0.954 Personal, Social & Emotional Development 1.013 1.241 1.028 Literacy 1.015 1.074 0.984 Numeracy 1.058 1.093 1.108 Good level of development 1.011 1.091 0.999
Early Years Foundation Stage Profile: Total score EYFSP total score +0.001 +0.009 +0.011
Sample size = 3186 (cognitive and socio-emotional outcomes); = 4942 (EYFSP outcomes)
The table shows coefficients for associations between hours of ECEC type and each outcome. Statistically significant coefficients are in bold italics, significance thus: * = p < .05, ** = p < .01, *** = p < .001.
For the continuous outcomes (cognitive and socio-emotional outcomes and EYFSP total score), coefficients give the change in the standardized outcome corresponding to a ten hour per week change in the ECEC use covariate, controlling for all other covariates.
For binary outcomes (Early Years Foundation Stage Profile Outcomes), coefficients give the change in probability of achieving the expected level of development for a ten hour per week change in ECEC use, expressed as an odds ratio. Values greater than one show increased probability; values less than one show decreased probability of achieving the expected level of development.
Informal individual ECEC (with friends, relatives etc.)
More informal individual ECEC hours per week between age two and the start of school was associated with benefits for child verbal ability measured during school year one. This finding is consistent with results in the SEED age three and age four studies.
Mean hours per week of Informal individual ECEC was not associated with socio-emotional or EYFSP outcomes.
15
Formal individual (childminder) ECEC More hours per week of formal individual (childminder) ECEC between age two and the start of school was associated with two poorer child outcomes, more externalising behaviour and less emotional self-regulation, assessed during school year one.
There were no significant associations between childminder hours per week and cognitive outcomes. There were also no significant associations between childminder ECEC use and the EYFSP outcomes overall, but some significant associations emerged in separate analyses for the different disadvantage groups (see below).
Formal group ECEC (e.g. in playgroups, nursery classes, nursery schools)
Using more formal group ECEC between age two and start of school was associated with several poorer outcomes: more externalising behaviour, more internalising behaviour, less prosocial behaviour, less behavioural self-regulation and less emotional self-regulation, during school year one, at age five to six.
Further analysis showed that for internalising behaviour, poorer outcomes were associated particularly with high formal group ECEC use, greater than thirty-five hours per week. For other outcomes (externalising behaviour and emotional self-regulation) poorer outcomes were found for children using a mean of more than fifteen hours per week between age two and the start of school.
These unfavourable associations between formal ECEC use and children’s socio-emotional outcomes contrast with the largely positive associations between formal ECEC use and children’s socio-emotional outcomes found in the SEED study when children were age three and age four, except that more than 35 hours per week formal group ECEC was associated with higher levels of conduct problems at ages three and four. For children’s socio-emotional outcomes during school year one, the negative associations with higher levels of formal ECEC use between age two and the start of school were more wide ranging.
Part of the reason for these unexpected differences may be differences in the source of the socio-emotional measures. The age four socio-emotional measures were derived from parent report, whereas the later outcomes were derived from teacher report. Whilst the parent and teacher assessed socio-emotional measures are positively associated as would be expected, these associations are relatively weak. It is likely that differences in the relationships that a parent and a teacher have with a child affects the child’s behaviour and how it is perceived, leading to significant differences between socio-emotional measures. Also, it is possible that coping with the new environment of school was influencing children’s socio-emotional behaviour.
Outcomes not significantly associated with ECEC use There were no overall effects associated with ECEC use between age two and the start of school on non-verbal ability, sociability, cognitive self-regulation and the EYFSP measures.
16
Do the effects of ECEC use vary according to disadvantage group and home learning environment? The effect of ECEC on children may vary according to differences in disadvantage and the home learning environment. The initial analyses looked for interactions between ECEC use and disadvantage group as well as interactions with the home learning environment score. Only statistically significant interactions are discussed.
Variation by disadvantage group
The association between formal individual (childminder) ECEC use and EYFSP total score varied according to SEED disadvantage group.
For children from the 20% most disadvantaged families, a larger number of hours per week spent in childminder ECEC between age two and the start of school was associated with poorer EYFSP total score during school reception year. For children from the 20%-40% moderately disadvantaged families, more hours per week spent in childminder ECEC between age two and the start of school was associated with better EYFSP total score during school reception year. The interpretation of these finding is not clear, but it may be that the most disadvantaged families are more likely to have access to poorer quality childminder care.15
For children in the 60% least disadvantaged families there was no association between childminder ECEC use and EYFSP total score. This lack of association may reflect a saturation effect, i.e. the relatively advantaged already have “enough” learning opportunities.
Variations by home learning environment When children were aged four years more use of formal group ECEC was associated with better cognitive outcomes overall, specifically for non-verbal ability. In the current report for school year one, there was an association between formal group ECEC use and better verbal ability during school year one, but only for children from families in the lowest quartile of home learning environment score (i.e. the least enhancing home learning environments). This again may reflect a “saturation effect” where the benefit children experience from out of home learning opportunities is less for those children who already experience many learning opportunities at home.
Are there differences between the effects of different formal group ECEC settings? The effects of ECEC appeared to be equivalent for maintained and PVI settings, with no significant differences.
15 In a recent Ofsted report, the proportion of childminders judged good or outstanding was higher in less deprived areas, although even in deprived areas the majority of provision was of good or outstanding quality. See Ofsted, 2018.
17
Is higher formal group ECEC use associated with socio-emotional problems? Do the associations between formal ECEC use and poorer child socio-emotional outcomes take children’s socio-emotional measures outside the typical range, indicating socio-emotional problems? To address this question, a working definition of child socio-emotional problems was adopted; children were considered to have socio-emotional problems if their socio-emotional measures were more than one standard deviation from the mean in the direction of poorer outcomes on a majority of the socio-emotional scales (i.e. four or more). According to this definition, 12.5% of the children had socio-emotional problems.
Having socio-emotional problems, thus defined, was associated with poorer outcomes on the cognitive measures and with poorer outcomes on all EYFSP measures, indicating the inter-relatedness of socio-emotional development and educational attainment. Models controlled for home environment and demographic variables.
There was an association between the amount of time children spent in formal group ECEC between age two and the start of school and the probability of socio-emotional problems in school year one, controlling for home environment and demographic variables.
18
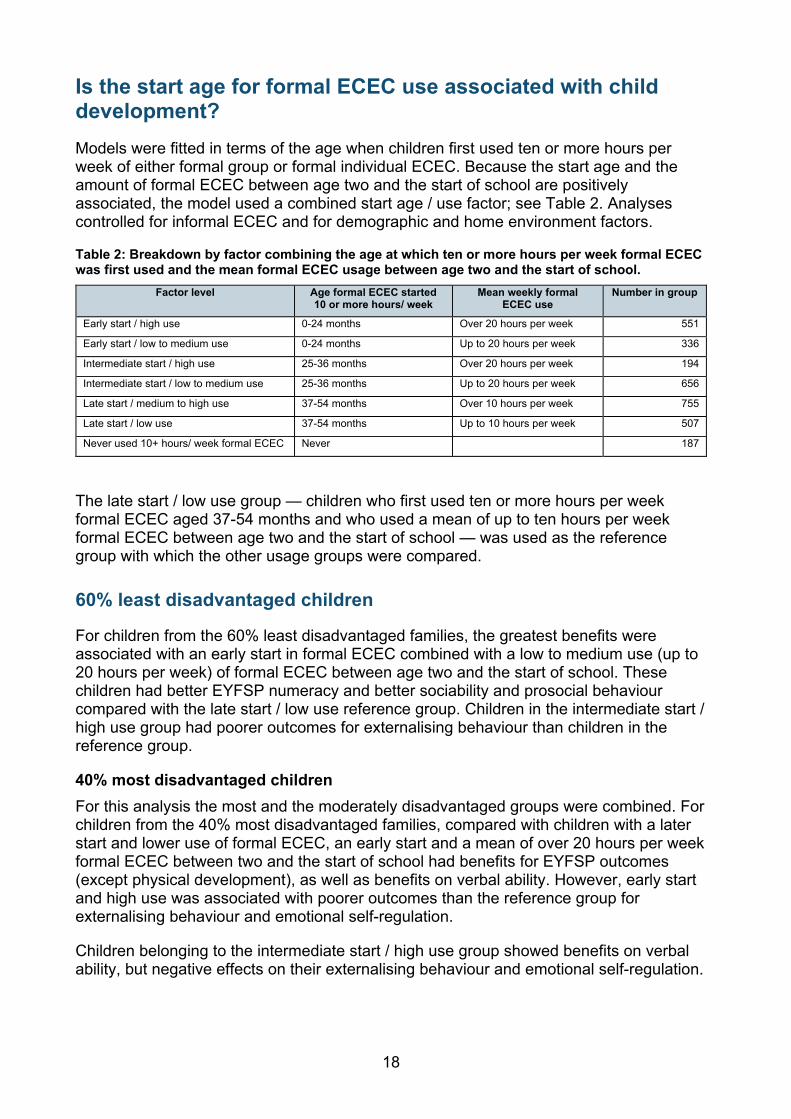
Is the start age for formal ECEC use associated with child development? Models were fitted in terms of the age when children first used ten or more hours per week of either formal group or formal individual ECEC. Because the start age and the amount of formal ECEC between age two and the start of school are positively associated, the model used a combined start age / use factor; see Table 2. Analyses controlled for informal ECEC and for demographic and home environment factors.
Table 2: Breakdown by factor combining the age at which ten or more hours per week formal ECEC was first used and the mean formal ECEC usage between age two and the start of school.
Factor level Age formal ECEC started 10 or more hours/ week
Mean weekly formal ECEC use
Number in group
Early start / high use 0-24 months Over 20 hours per week 551
Early start / low to medium use 0-24 months Up to 20 hours per week 336
Intermediate start / high use 25-36 months Over 20 hours per week 194
Intermediate start / low to medium use 25-36 months Up to 20 hours per week 656
Late start / medium to high use 37-54 months Over 10 hours per week 755
Late start / low use 37-54 months Up to 10 hours per week 507
Never used 10+ hours/ week formal ECEC Never 187
The late start / low use group — children who first used ten or more hours per week formal ECEC aged 37-54 months and who used a mean of up to ten hours per week formal ECEC between age two and the start of school — was used as the reference group with which the other usage groups were compared.
60% least disadvantaged children
For children from the 60% least disadvantaged families, the greatest benefits were associated with an early start in formal ECEC combined with a low to medium use (up to 20 hours per week) of formal ECEC between age two and the start of school. These children had better EYFSP numeracy and better sociability and prosocial behaviour compared with the late start / low use reference group. Children in the intermediate start / high use group had poorer outcomes for externalising behaviour than children in the reference group.
40% most disadvantaged children For this analysis the most and the moderately disadvantaged groups were combined. For children from the 40% most disadvantaged families, compared with children with a later start and lower use of formal ECEC, an early start and a mean of over 20 hours per week formal ECEC between two and the start of school had benefits for EYFSP outcomes (except physical development), as well as benefits on verbal ability. However, early start and high use was associated with poorer outcomes than the reference group for externalising behaviour and emotional self-regulation.
Children belonging to the intermediate start / high use group showed benefits on verbal ability, but negative effects on their externalising behaviour and emotional self-regulation.
19
These results concerning age of starting formal ECEC indicate the possible benefits of an early start in formal ECEC, especially for more disadvantaged children, as well as the potential disadvantages of high use of formal ECEC.
Is the combination of types of ECEC used associated with child development? Analyses compared four combinations, defined according to formal group ECEC use and formal or informal individual ECEC use:
1. Low formal group use (mean of up to fifteen hours per week) and no individual use (N = 892).
2. Low formal group use (mean of up to fifteen hours per week) and some individual use (N = 1222).
3. High formal group use (mean of greater than fifteen hours per week) and no individual use (N = 447).
4. High formal group use (mean of greater than fifteen hours per week) and some individual use (N = 625).
Analyses controlled for demographic and home environment covariates. The “low formal group / no individual ECEC” children (1) were used as the reference group with which other children were compared.
1. The low formal group / some individual children (2) had better verbal ability in school year one than the reference group.
2. The high formal group / no individual children (3) differed from the reference group as follows:
a. Higher non-verbal ability during school year one. b. Poorer socio-emotional outcomes in school year one: externalising
behaviour, sociability, prosocial behaviour, behavioural self-regulation and emotional self-regulation.
c. Poorer outcomes for EYFSP personal, social and emotional development and for EYFSP total score.
3. Children using high formal group / some individual (4) differed from the reference group as follows:
a. Higher verbal ability during school year one. b. Poorer outcomes in school year one for socio-emotional outcomes
externalising behaviour and emotional self-regulation. Note that these effects were smaller than the corresponding effects for the high formal group / no individual (3) children. There were no effects for EYFSP scores.
These results will require further exploration within the SEED study and in other research studies before a full interpretation can be made. However, a tentative conclusion might be that the addition of some individual ECEC (childminders, friends / relatives) is able to mitigate some of the negative socio-emotional outcomes that children may otherwise experience from high use of formal group ECEC. It may be that a greater level of one-to-one interaction in individual ECEC is helpful in building children’s emotional resilience. If this finding is confirmed by further research, it may be of considerable policy significance.
20
Are variations in the quality of ECEC attended associated with child development? A positive association occurred between children attending better quality ECEC at age two and poorer non-verbal ability during school year one. In the absence of supporting evidence from other studies (including earlier SEED ages 3 and 4 analysis), it is cautiously concluded that this unexpected finding is an instance of a Type I error: that is, a chance finding rather than a causal association.
Accepting this interpretation, there is a lack of association between the ECEC quality aged two to four and child outcomes during reception / school year one. This is probably due to two main reasons:
1. The sample size for the quality analyses is smaller than for other analyses, so the minimum size of effect that can be detected needs to be larger. It may be that there are associations between ECEC quality and child outcomes, but the small sample size means analyses are not sensitive enough to detect them.
2. The quality of ECEC has increased substantially over the last twenty years.16 The resulting comparative homogeneity in ECEC quality, particularly the relative lack of poor quality provision, may lead to a lack of statistical associations between ECEC quality and child outcomes.
Are variations in the home environment associated with child development? Analyses were conducted to look at the relevance of the home environment, controlling for the amount and type of ECEC use between age two and the start of school and demographic variables. The associations amongst the home environment variables have the potential to produce misleading results. For this reason, effects of home environment variables are considered only if there was additionally a significant association between an outcome and a given home environment covariate in a separate regression of the outcome on the relevant home environment variable alone, controlling only for demographic covariates, i.e. the home variable had to produce a significant result in two separate regressions.17 Results are given in Table 3. Of nine home factors, the most influential on EYFSP outcomes were the Home Learning Environment (HLE), household chaos and warmth of the parent / child relationship; better scores for all these variables were associated with better outcomes on all EYFSP measures.
16 See Melhuish & Gardiner, 2017. 17 Further details are given on p. 114.
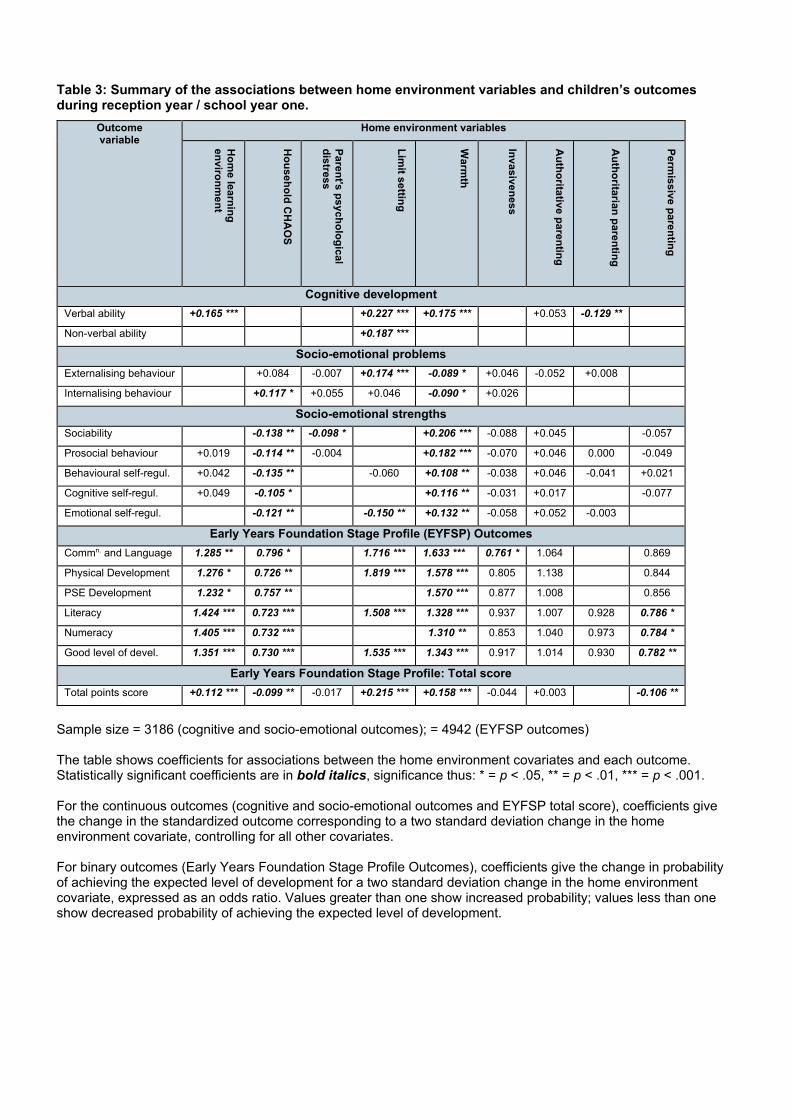
Table 3: Summary of the associations between home environment variables and children’s outcomes during reception year / school year one.
Outcome variable
Home environment variables
Hom
e learning environm
ent
Household C
HA
OS
Parent's psychological distress
Limit setting
Warm
th
Invasiveness
Authoritative parenting
Authoritarian parenting
Permissive parenting
Cognitive development Verbal ability +0.165 *** +0.227 *** +0.175 *** +0.053 -0.129 **
Non-verbal ability +0.187 ***
Socio-emotional problems
Externalising behaviour +0.084 -0.007 +0.174 *** -0.089 * +0.046 -0.052 +0.008
Internalising behaviour +0.117 * +0.055 +0.046 -0.090 * +0.026
Socio-emotional strengths
Sociability -0.138 ** -0.098 * +0.206 *** -0.088 +0.045 -0.057
Prosocial behaviour +0.019 -0.114 ** -0.004 +0.182 *** -0.070 +0.046 0.000 -0.049
Behavioural self-regul. +0.042 -0.135 ** -0.060 +0.108 ** -0.038 +0.046 -0.041 +0.021
Cognitive self-regul. +0.049 -0.105 * +0.116 ** -0.031 +0.017 -0.077
Emotional self-regul. -0.121 ** -0.150 ** +0.132 ** -0.058 +0.052 -0.003
Early Years Foundation Stage Profile (EYFSP) Outcomes
Commn. and Language 1.285 ** 0.796 * 1.716 *** 1.633 *** 0.761 * 1.064 0.869
Physical Development 1.276 * 0.726 ** 1.819 *** 1.578 *** 0.805 1.138 0.844
PSE Development 1.232 * 0.757 ** 1.570 *** 0.877 1.008 0.856
Literacy 1.424 *** 0.723 *** 1.508 *** 1.328 *** 0.937 1.007 0.928 0.786 *
Numeracy 1.405 *** 0.732 *** 1.310 ** 0.853 1.040 0.973 0.784 *
Good level of devel. 1.351 *** 0.730 *** 1.535 *** 1.343 *** 0.917 1.014 0.930 0.782 **
Early Years Foundation Stage Profile: Total score
Total points score +0.112 *** -0.099 ** -0.017 +0.215 *** +0.158 *** -0.044 +0.003 -0.106 **
Sample size = 3186 (cognitive and socio-emotional outcomes); = 4942 (EYFSP outcomes) The table shows coefficients for associations between the home environment covariates and each outcome. Statistically significant coefficients are in bold italics, significance thus: * = p < .05, ** = p < .01, *** = p < .001. For the continuous outcomes (cognitive and socio-emotional outcomes and EYFSP total score), coefficients give the change in the standardized outcome corresponding to a two standard deviation change in the home environment covariate, controlling for all other covariates. For binary outcomes (Early Years Foundation Stage Profile Outcomes), coefficients give the change in probability of achieving the expected level of development for a two standard deviation change in the home environment covariate, expressed as an odds ratio. Values greater than one show increased probability; values less than one show decreased probability of achieving the expected level of development.
CONFIDENTIAL – NOT FOR CIRCULATION
In summary:
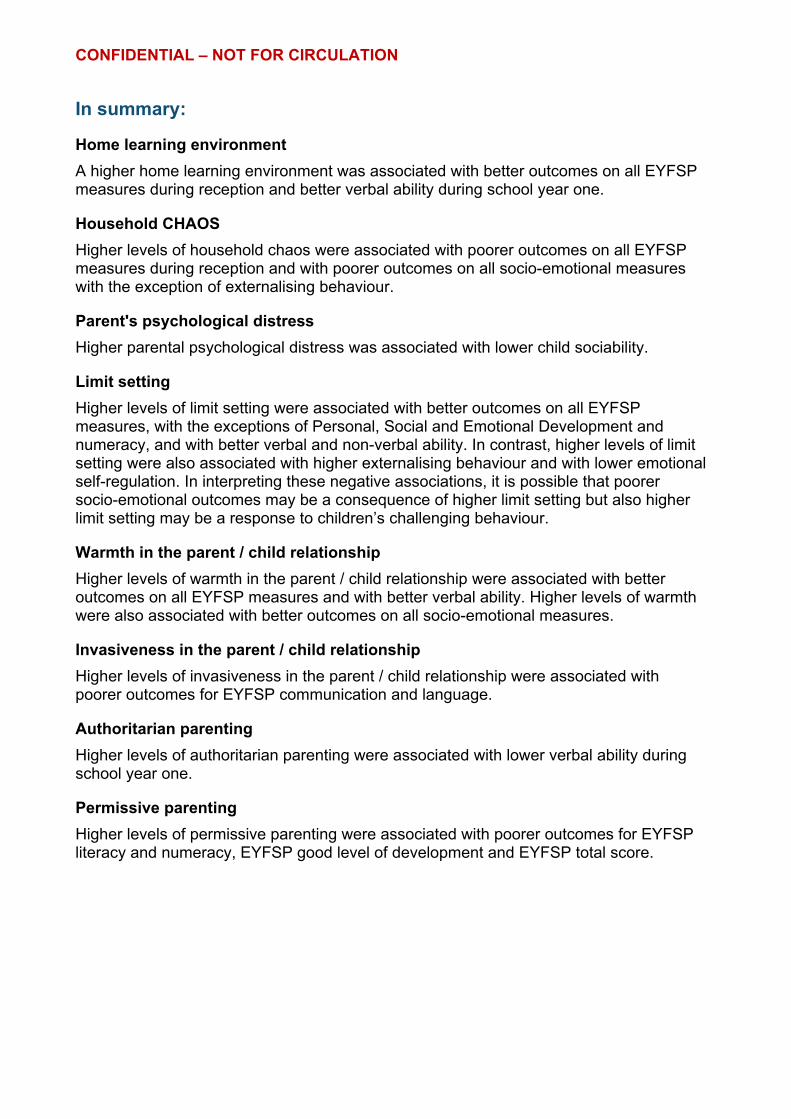
Home learning environment A higher home learning environment was associated with better outcomes on all EYFSP measures during reception and better verbal ability during school year one.
Household CHAOS Higher levels of household chaos were associated with poorer outcomes on all EYFSP measures during reception and with poorer outcomes on all socio-emotional measures with the exception of externalising behaviour.
Parent's psychological distress Higher parental psychological distress was associated with lower child sociability.
Limit setting Higher levels of limit setting were associated with better outcomes on all EYFSP measures, with the exceptions of Personal, Social and Emotional Development and numeracy, and with better verbal and non-verbal ability. In contrast, higher levels of limit setting were also associated with higher externalising behaviour and with lower emotional self-regulation. In interpreting these negative associations, it is possible that poorer socio-emotional outcomes may be a consequence of higher limit setting but also higher limit setting may be a response to children’s challenging behaviour.
Warmth in the parent / child relationship Higher levels of warmth in the parent / child relationship were associated with better outcomes on all EYFSP measures and with better verbal ability. Higher levels of warmth were also associated with better outcomes on all socio-emotional measures.
Invasiveness in the parent / child relationship Higher levels of invasiveness in the parent / child relationship were associated with poorer outcomes for EYFSP communication and language.
Authoritarian parenting Higher levels of authoritarian parenting were associated with lower verbal ability during school year one.
Permissive parenting Higher levels of permissive parenting were associated with poorer outcomes for EYFSP literacy and numeracy, EYFSP good level of development and EYFSP total score.
23
Conclusions The findings show some continuity with the earlier SEED reports looking at children’s outcomes at ages three and four, as well as some divergence from earlier findings, particularly for socio-emotional outcomes. Consistency in the pattern of results is important, which can derive from supporting results from other stages of SEED or other studies. Hence, where results are new or unexpected, the conclusions from those results in the report must be tentative until confirmed by supporting evidence from SEED or other studies.
The effects of ECEC associated with children’s cognitive outcomes at the start of school were more limited than those found in the EPPSE study, the last comparable study in England.18 Why is this? Consider the situation where all environmental variation between individuals is removed. In this scenario any differences would be only due to genetic variation. Similarly where we reduce variation in ECEC experience, the effects attributable to ECEC experience reduce. In England we see that variation in both the amount and quality of ECEC have reduced between the time of ECEC experience (1997-2000) in EPPSE and the time of ECEC experience (2014-2017) in SEED. Hence the differences between EPPSE and SEED results may partly reflect the increase in ECEC use since the EPPSE study (1997-2000), as it is no longer possible to use a no ECEC group in comparisons; this study utilises a low ECEC use comparison group instead. Also the percentage of children experiencing low quality ECEC has substantially reduced. Another difference is that the EPPSE measures were taken when children had finished their preschool period but before experiencing reception class, whereas the SEED start of school measures were assessed at the end of reception and during school year one. This may have allowed children with less pre-school ECEC use to catch up with those who used more pre-school ECEC, resulting in less impact of ECEC use in SEED as compared to the EPPSE study.
The results also reveal rather more limited effects associated with ECEC use than in previous SEED reports. In contrast, the effects associated with the home environment are wide-ranging, indicating the substantial influence on development of a range of aspects of the home and parenting.
The key conclusions to this SEED report are :
1. Higher use of informal individual ECEC (with friends, relatives etc.) between age two and the start of school was associated with better verbal ability measured during school year one.
2. Greater use of formal group ECEC (mean hours per week) between age two and the start of school is associated with negative effects on socio-emotional well-being in school year one.
3. There is evidence that the use of some individual ECEC (childminders, friends, relatives) mitigates the negative socio-emotional effects of high formal group ECEC use.
18 See Sylva, 2004.
24
4. For the 40% most disadvantaged children, starting to use a minimum of ten hours per week formal ECEC no later than age two, combined with a mean use of over twenty hours per week of formal ECEC between age two and the start of school, increases the chances of achieving expected EYFSP levels in school reception year and improves children’s verbal ability in school year one.
5. There was a positive association between formal group ECEC use (in nursery classes, nursery schools etc.) and better verbal ability during school year one, but only for children from families in the lowest quartile of home learning environment score (i.e. children with the least enhancing home learning environments).
6. There was no clear evidence of associations between the quality of ECEC which children had attended between ages two and four and their developmental outcomes during reception year / school year one: though these findings may relate to the relatively small sample of settings for the SEED quality study and the similarities in ECEC quality across the sample.
It remains to be seen how persistent these new findings are. This will be assessed in later follow-ups of the SEED study.
25
References Early years foundation stage profile (2018 handbook). https://assets.publishing.service.gov.uk/government/uploads/system/uploads/attachment_data/file/669079/Early_years_foundation_stage_profile_2018_handbook.pdf Elliot, C., Smith, P. & McCulloch, K. (2011). British Ability Scales Third Edition (BAS III). Windsor: GL-Assessment.
Harms, T. Cryer, D. & Clifford, R.M. (2005). Early Childhood Environment Rating Scale: Revised Edition. New York, Teachers College Press.
Harms, T. Cryer., D. and Clifford, R.M. (2006). Infant Toddler Environment Rating Scale: Revised Edition. New York, Teachers College Press.
Howard S. J. and Melhuish, E. (2017). An Early Years Toolbox for Assessing Early Executive Function, Language, Self-Regulation, and Social Development: Validity, Reliability, and Preliminary Norms. Journal of Psychoeducational Assessment, 35(3): 255–275. Melhuish, E., Ereky-Stevens, K., Petrogiannis, K., Ariescu, A., Penderi, E., Rentzou, K., Tawell, A., Slot, P., Broekhuizen, M., & Leseman, P. (2015). A review of research on the effects of early childhood Education and Care (ECEC) upon child development. CARE project; Curriculum Quality Analysis and Impact Review of European Early Childhood Education and Care (ECEC). http://ecec-care.org/resources/publications/
Melhuish, E. & Gardiner, J. (2017). Study of Early Education and Development (SEED): Study of Quality of Early Years Provision in England. DFE-RR706. London: DfE. https://www.gov.uk/government/uploads/system/uploads/attachment_data/file/665077/SEED_Quality_Report_December_2017.pdf
Melhuish, E. & Barnes, J. (2018). Compensatory education. In S. Hupp & J. Jewell (Eds.) The Encyclopedia of Child and Adolescent Development. London: Wiley/Blackwell. Ofsted (2018). The Annual Report of Her Majesty’s Chief Inspector of Education, Children’s Services and Skills 2017/18. https://www.gov.uk/government/publications/ofsted-annual-report-201718-education-childrens-services-and-skills Robinson, C. C., Mandleco, B., Olsen, S. F., Hart, C. H. (1995). Authoritative, Authoritarian, and Permissive Parenting Practices: Development of a New Measure, Psychological Reports 77(3), 819-830. Sammons, P., Sylva, K., Melhuish, E., Taggart, B., Elliot, K., & Siraj-Blatchford, I. (2002). The Effective Provision of Pre-School Education (EPPE) Project: Measuring the impact of pre-school on children's cognitive progress over the pre-school period. London: Institute of Education, University of London/ Department for Education and Skills.
Simkiss, D. E., et. al. (2013). Validation of the mothers’ object relations scales in 2–4-year-old children and comparison with the child–parent relationship scale. Health and Quality of Life Outcomes 11: 49. doi: 10.1186/1477-7525-11-49.
26
Siraj, I. Kingston, D. & Melhuish, E. (2015). Assessing Quality in Early Childhood Education and Care. Sustained shared thinking and emotional well-being (SSTEW) scale for 2–5-year-olds provision. London, Trentham Books.
Sylva, K., Melhuish, E., Sammons, P., Siraj-Blatchford, I., and Taggart, B. (2004). Effective Pre-school Provision. London: Institute of Education.
Sylva, K., Melhuish, E., Sammons, P., Siraj-Blatchford, I., & Taggart, B. (2010). Early childhood matters: Evidence from the effective pre-school and primary education project. Oxon: Routledge. Sylva, K. Siraj-Blatchford, I. & Taggart, B. (2011). ECERS-E The Four Curricular Subscales Extension to the Early Childhood Environment Rating Scale: 4th Edition with Planning Notes. New York, Teachers College Press.
27
© 2020 NatCen Social Research, University of Oxford, and Action for Children
Reference: DFE-RB953
ISBN: 978-1-83870-066-9
The views expressed in this report were the authors’ and do not necessarily reflect those of the Department for Education.
Any enquiries regarding this publication should be sent to us at: [email protected] or www.education.gov.uk/contactus
This document was available for download at www.gov.uk/government/publications