Embed Size (px)
Citation preview
STUDY OF GROUND WATER QUALITY WITH
GIS APPLICATION FOR ARIYALUR DISTRICT
TAMIL NADU
R. ARULNANGAI
PG and Research Department of Chemistry Jamal Mohamed College (Autonomous),
(Affiliated to Bharathidasan University)
Tiruchirappalli – 20
Abstract
Water is one of the most important commodities which man has exploited than any other
resource for his life. Due to rapid increase in density of population, fast urbanization,
Industrialization and agree cultural use the demand of water is increasing day by day. Ground
water quality has direct implications for domestic, industrial and drinking water purposes. The
paper presents a case study on the water quality analysis carried out at the Ariyalur District,
Tamil Nadu. Six physico - chemical parameters were considered in the analysis. The analysis
was carried for pre monsoon, monsoon and post monsoon seasons.
Accurate estimation of the temporal and spatial distribution characteristics of water
resources are required to manage the optimum use of water resources in a sustainable manner.
Recently with advances in computer technology and computational capabilities geographical
information system (GIS) and remote sensing (RS) technologies have been widely used in
hydrologic water quality modeling areas and thus in related decision – making contexts.
KEYWORDS: Groundwater Quality, GIS Application, Ariyalur district.
1. INTRODUCTION
Water is the basic requirements of all life on Earth. The increase in population and
urbanization and urbanization necessitates growth in the agricultural and industrial sectors
which demand for more fresh water. When surface water is the non-available mode the
alternative is to depend on ground water. When the polluted water seeps into the ground and
INFOKARA RESEARCH
Volume 8 Issue 12 2019 87
ISSN NO: 1021-9056
http://infokara.com/
enters an aquifer it results into ground water pollution. The most of our villages and many
townships, ground water is the only source of drinking water. Therefore, pollution of
groundwater is a matter of serious concern [1]. Groundwater gets polluted in a number of
ways. The dumping of raw sewage on soil, seepage pits and septic tanks cause pollution of
groundwater. Water is very important to life without water our life cannot move. Water
shortage has become an increasingly serious problem in India, especially in arid and semi-
arid regions of the country due to scarcity of surface water and vagaries of monsoon.
Ground water quality depends on the quality of recharged water, atmospheric
precipitation, inland surface water and sub-surface geochemical processes. Temporal
changes in the origin and constitution of the recharged water, hydrological and human factors
may cause periodic factors may cause periodic changes in ground water quality [2].
Water pollution not only affects water quality but also threats human health, economic
development and social prosperity. The water pollution is not only devastating to people but
also to animals aquatic life and birds. The impact of tannery waste water disposal leads to
environmental problem, even though this problem persists for a long time, it has attracted
serious attention only in recent time [3]. In developing countries like India around 80% of all
disease are directly related to poor drinking water quality and polluted conditions. The
principals governing the chemical characteristics of groundwater were well documental in
many parts of the world [4].
GIS is a power tool for collecting, storing, transforming the spatial information and
arriving decision from the real world for particular set of purpose in real time, where the
stored information are geo-references (or) geo-coded [5]. In this project the water quality is
analyzed using GIS and mapped. In recent years remote sensing systems have advanced in
leaps and bounds. Several efforts have been put in worldwide by researchers employing
remote sensing (RS) and geographical information systems (GIS) techniques for acquiring
water quality data [6]. In the present work attempts to identify the extent of groundwater
pollution in and around Ariyalur district.
Study Area
Ariyalur is a rich limestone and surrounded with five cement factories. All the people
used the ground water for domestic purposes. The Agricultural communities utilized the ground
water for forming in their lands. It is situated between 10o 50’ 0” to 11o .30’ 0” of the Northern
latitude and 790. 0’ 0” and 790 .30’0” of the study area have been shown in fig (1). Ariyalur
district consists of 2 Revenue Divisions and contains 3 taluks and 6 Blocks.
INFOKARA RESEARCH
Volume 8 Issue 12 2019 88
ISSN NO: 1021-9056
http://infokara.com/
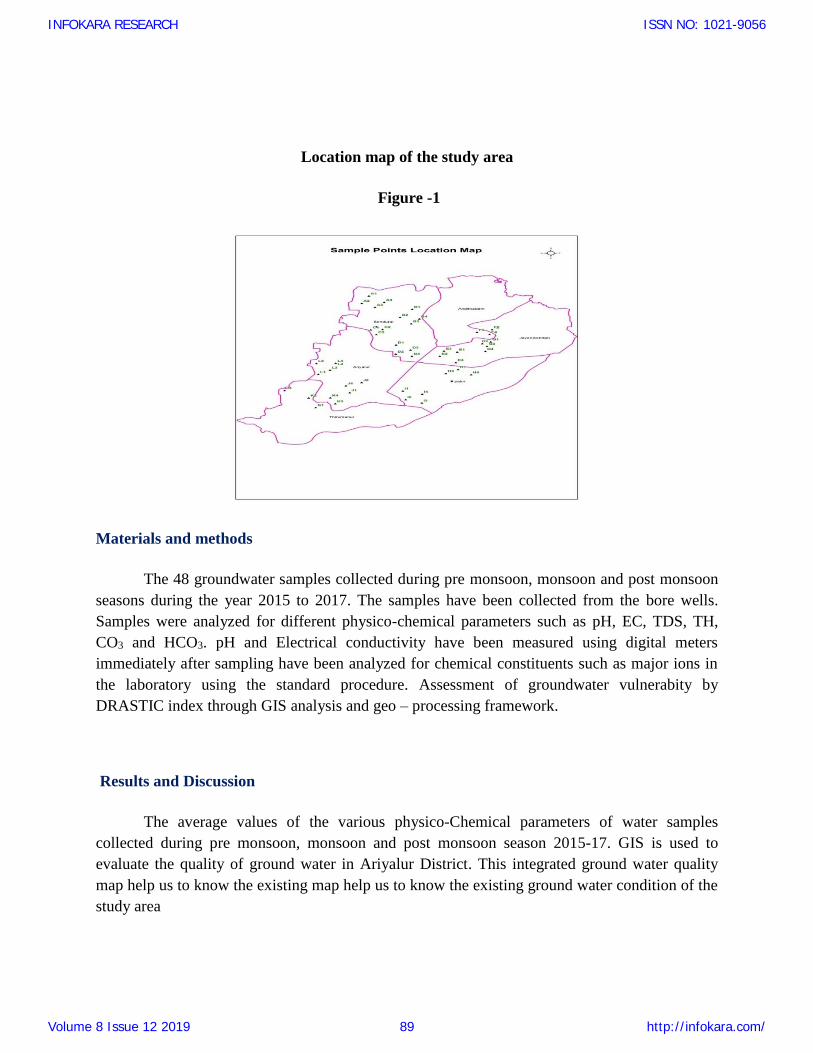
Location map of the study area
Figure -1
Materials and methods
The 48 groundwater samples collected during pre monsoon, monsoon and post monsoon
seasons during the year 2015 to 2017. The samples have been collected from the bore wells.
Samples were analyzed for different physico-chemical parameters such as pH, EC, TDS, TH,
CO3 and HCO3. pH and Electrical conductivity have been measured using digital meters
immediately after sampling have been analyzed for chemical constituents such as major ions in
the laboratory using the standard procedure. Assessment of groundwater vulnerabity by
DRASTIC index through GIS analysis and geo – processing framework.
Results and Discussion
The average values of the various physico-Chemical parameters of water samples
collected during pre monsoon, monsoon and post monsoon season 2015-17. GIS is used to
evaluate the quality of ground water in Ariyalur District. This integrated ground water quality
map help us to know the existing map help us to know the existing ground water condition of the
study area
INFOKARA RESEARCH
Volume 8 Issue 12 2019 89
ISSN NO: 1021-9056
http://infokara.com/
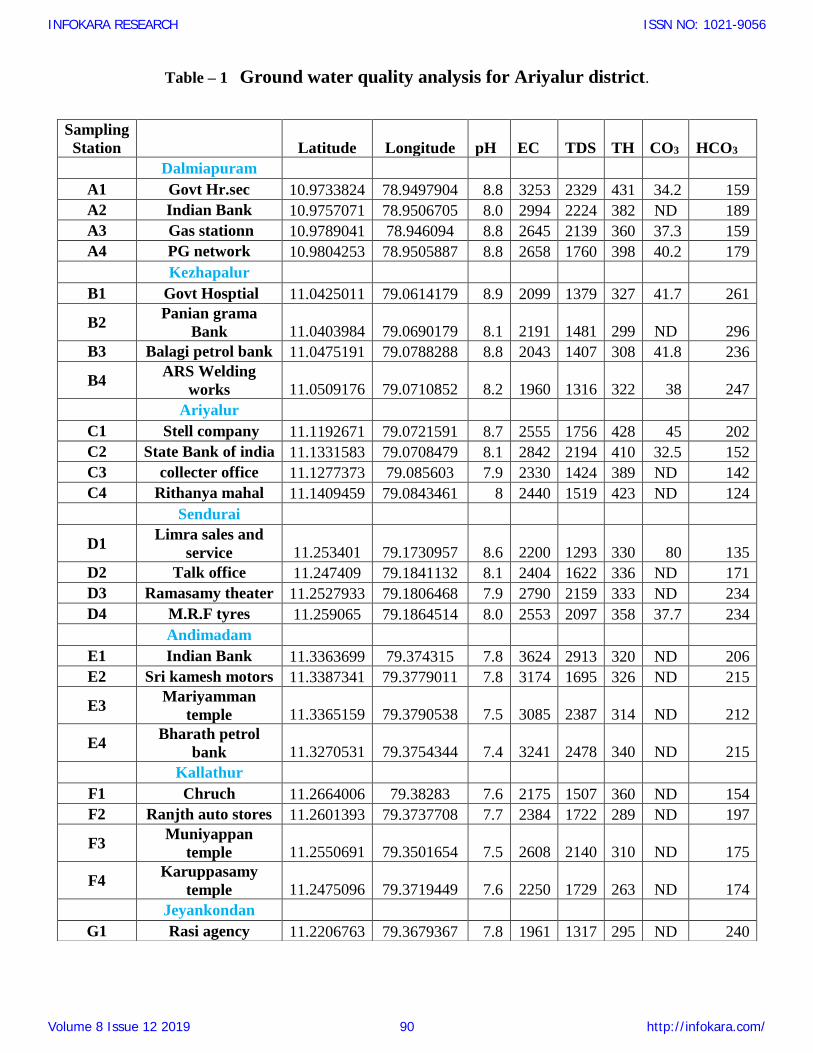
Table – 1 Ground water quality analysis for Ariyalur district.
Sampling
Station
Latitude Longitude pH EC TDS TH CO3 HCO3
Dalmiapuram
A1 Govt Hr.sec 10.9733824 78.9497904 8.8 3253 2329 431 34.2 159
A2 Indian Bank 10.9757071 78.9506705 8.0 2994 2224 382 ND 189
A3 Gas stationn 10.9789041 78.946094 8.8 2645 2139 360 37.3 159
A4 PG network 10.9804253 78.9505887 8.8 2658 1760 398 40.2 179
Kezhapalur
B1 Govt Hosptial 11.0425011 79.0614179 8.9 2099 1379 327 41.7 261
B2 Panian grama
Bank 11.0403984 79.0690179 8.1 2191 1481 299 ND 296
B3 Balagi petrol bank 11.0475191 79.0788288 8.8 2043 1407 308 41.8 236
B4 ARS Welding
works 11.0509176 79.0710852 8.2 1960 1316 322 38 247
Ariyalur
C1 Stell company 11.1192671 79.0721591 8.7 2555 1756 428 45 202
C2 State Bank of india 11.1331583 79.0708479 8.1 2842 2194 410 32.5 152
C3 collecter office 11.1277373 79.085603 7.9 2330 1424 389 ND 142
C4 Rithanya mahal 11.1409459 79.0843461 8 2440 1519 423 ND 124
Sendurai
D1 Limra sales and
service 11.253401 79.1730957 8.6 2200 1293 330 80 135
D2 Talk office 11.247409 79.1841132 8.1 2404 1622 336 ND 171
D3 Ramasamy theater 11.2527933 79.1806468 7.9 2790 2159 333 ND 234
D4 M.R.F tyres 11.259065 79.1864514 8.0 2553 2097 358 37.7 234
Andimadam
E1 Indian Bank 11.3363699 79.374315 7.8 3624 2913 320 ND 206
E2 Sri kamesh motors 11.3387341 79.3779011 7.8 3174 1695 326 ND 215
E3 Mariyamman
temple 11.3365159 79.3790538 7.5 3085 2387 314 ND 212
E4 Bharath petrol
bank 11.3270531 79.3754344 7.4 3241 2478 340 ND 215
Kallathur
F1 Chruch 11.2664006 79.38283 7.6 2175 1507 360 ND 154
F2 Ranjth auto stores 11.2601393 79.3737708 7.7 2384 1722 289 ND 197
F3 Muniyappan
temple 11.2550691 79.3501654 7.5 2608 2140 310 ND 175
F4 Karuppasamy
temple 11.2475096 79.3719449 7.6 2250 1729 263 ND 174
Jeyankondan
G1 Rasi agency 11.2206763 79.3679367 7.8 1961 1317 295 ND 240
INFOKARA RESEARCH
Volume 8 Issue 12 2019 90
ISSN NO: 1021-9056
http://infokara.com/
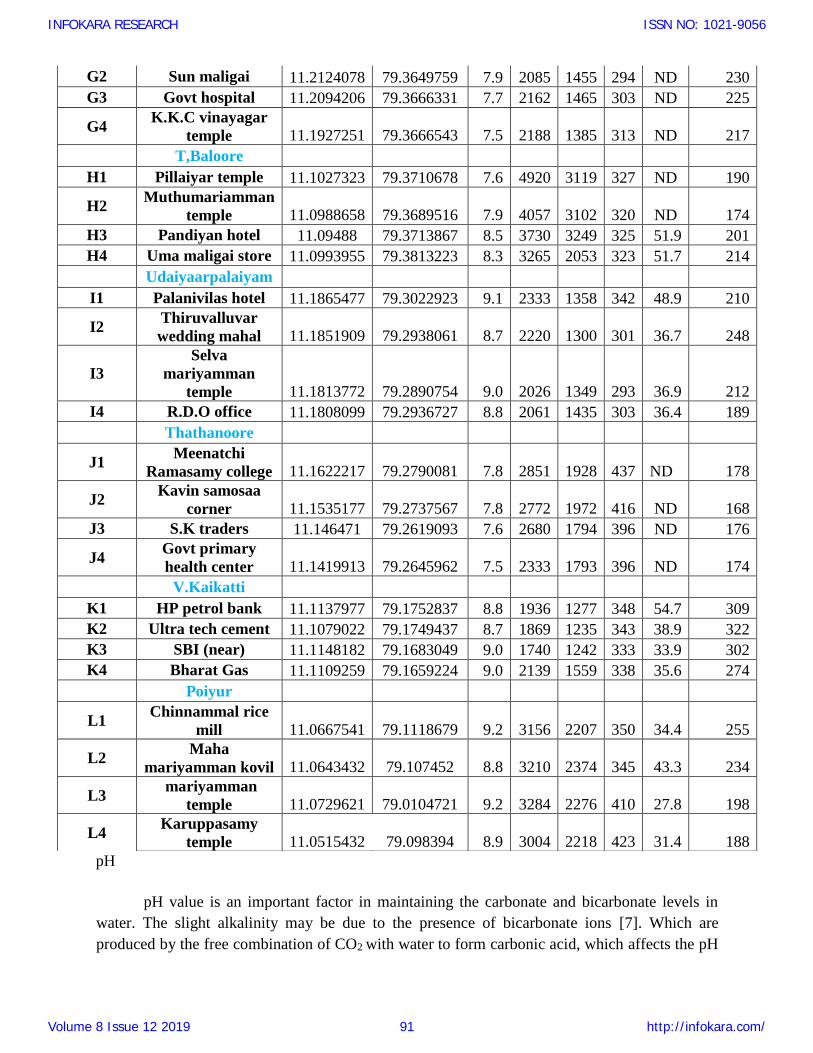
pH
pH value is an important factor in maintaining the carbonate and bicarbonate levels in
water. The slight alkalinity may be due to the presence of bicarbonate ions [7]. Which are
produced by the free combination of CO2 with water to form carbonic acid, which affects the pH
G2 Sun maligai 11.2124078 79.3649759 7.9 2085 1455 294 ND 230
G3 Govt hospital 11.2094206 79.3666331 7.7 2162 1465 303 ND 225
G4 K.K.C vinayagar
temple 11.1927251 79.3666543 7.5 2188 1385 313 ND 217
T,Baloore
H1 Pillaiyar temple 11.1027323 79.3710678 7.6 4920 3119 327 ND 190
H2 Muthumariamman
temple 11.0988658 79.3689516 7.9 4057 3102 320 ND 174
H3 Pandiyan hotel 11.09488 79.3713867 8.5 3730 3249 325 51.9 201
H4 Uma maligai store 11.0993955 79.3813223 8.3 3265 2053 323 51.7 214
Udaiyaarpalaiyam
I1 Palanivilas hotel 11.1865477 79.3022923 9.1 2333 1358 342 48.9 210
I2 Thiruvalluvar
wedding mahal 11.1851909 79.2938061 8.7 2220 1300 301 36.7 248
I3
Selva
mariyamman
temple 11.1813772 79.2890754 9.0 2026 1349 293 36.9 212
I4 R.D.O office 11.1808099 79.2936727 8.8 2061 1435 303 36.4 189
Thathanoore
J1 Meenatchi
Ramasamy college 11.1622217 79.2790081 7.8 2851 1928 437 ND 178
J2 Kavin samosaa
corner 11.1535177 79.2737567 7.8 2772 1972 416 ND 168
J3 S.K traders 11.146471 79.2619093 7.6 2680 1794 396 ND 176
J4 Govt primary
health center 11.1419913 79.2645962 7.5 2333 1793 396 ND 174
V.Kaikatti
K1 HP petrol bank 11.1137977 79.1752837 8.8 1936 1277 348 54.7 309
K2 Ultra tech cement 11.1079022 79.1749437 8.7 1869 1235 343 38.9 322
K3 SBI (near) 11.1148182 79.1683049 9.0 1740 1242 333 33.9 302
K4 Bharat Gas 11.1109259 79.1659224 9.0 2139 1559 338 35.6 274
Poiyur
L1 Chinnammal rice
mill 11.0667541 79.1118679 9.2 3156 2207 350 34.4 255
L2 Maha
mariyamman kovil 11.0643432 79.107452 8.8 3210 2374 345 43.3 234
L3 mariyamman
temple 11.0729621 79.0104721 9.2 3284 2276 410 27.8 198
L4 Karuppasamy
temple 11.0515432 79.098394 8.9 3004 2218 423 31.4 188
INFOKARA RESEARCH
Volume 8 Issue 12 2019 91
ISSN NO: 1021-9056
http://infokara.com/
of the water. The pH values of the analysed samples ranges from 7.4 to 9.2. The ranges are
classified in the spatial variation map shown in figure in (2).
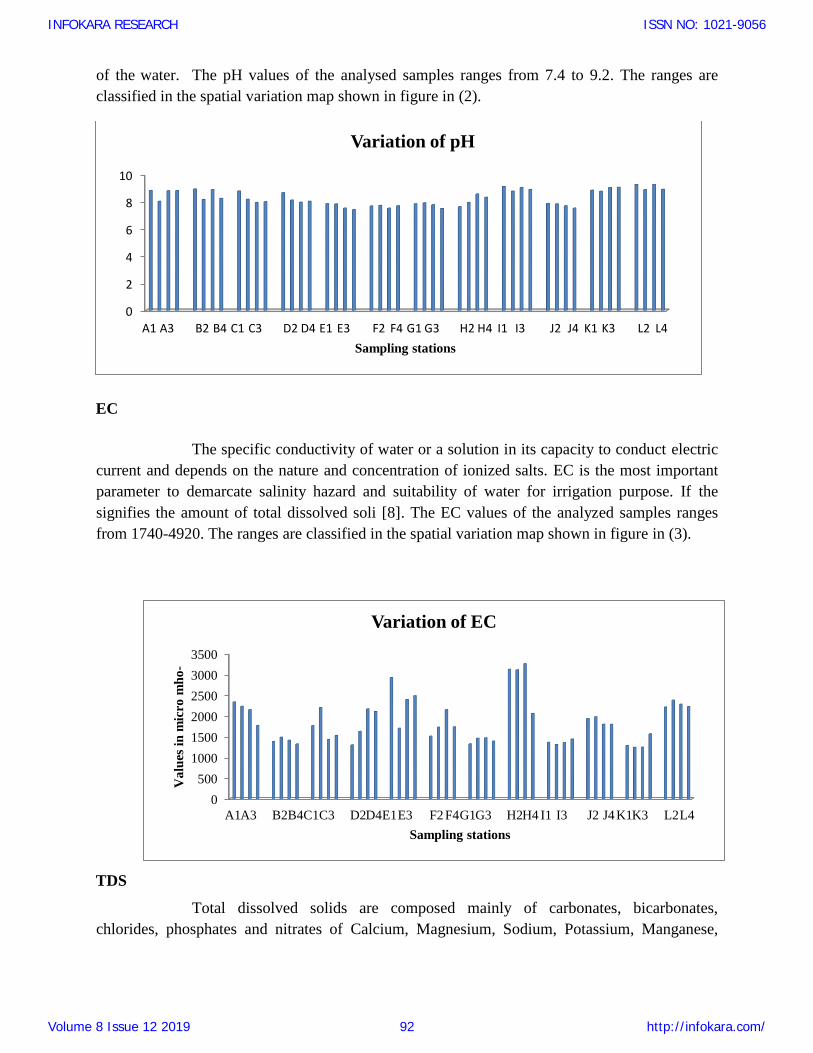
EC
The specific conductivity of water or a solution in its capacity to conduct electric
current and depends on the nature and concentration of ionized salts. EC is the most important
parameter to demarcate salinity hazard and suitability of water for irrigation purpose. If the
signifies the amount of total dissolved soli [8]. The EC values of the analyzed samples ranges
from 1740-4920. The ranges are classified in the spatial variation map shown in figure in (3).
TDS
Total dissolved solids are composed mainly of carbonates, bicarbonates,
chlorides, phosphates and nitrates of Calcium, Magnesium, Sodium, Potassium, Manganese,
0
2
4
6
8
10
A1 A3 B2 B4 C1 C3 D2 D4 E1 E3 F2 F4 G1 G3 H2 H4 I1 I3 J2 J4 K1 K3 L2 L4
Sampling stations
Variation of pH
0
500
1000
1500
2000
2500
3000
3500
A1A3 B2B4C1C3 D2D4E1E3 F2 F4G1G3 H2H4 I1 I3 J2 J4 K1K3 L2L4
Va
lues
in
mic
ro m
ho
-
Sampling stations
Variation of EC
INFOKARA RESEARCH
Volume 8 Issue 12 2019 92
ISSN NO: 1021-9056
http://infokara.com/
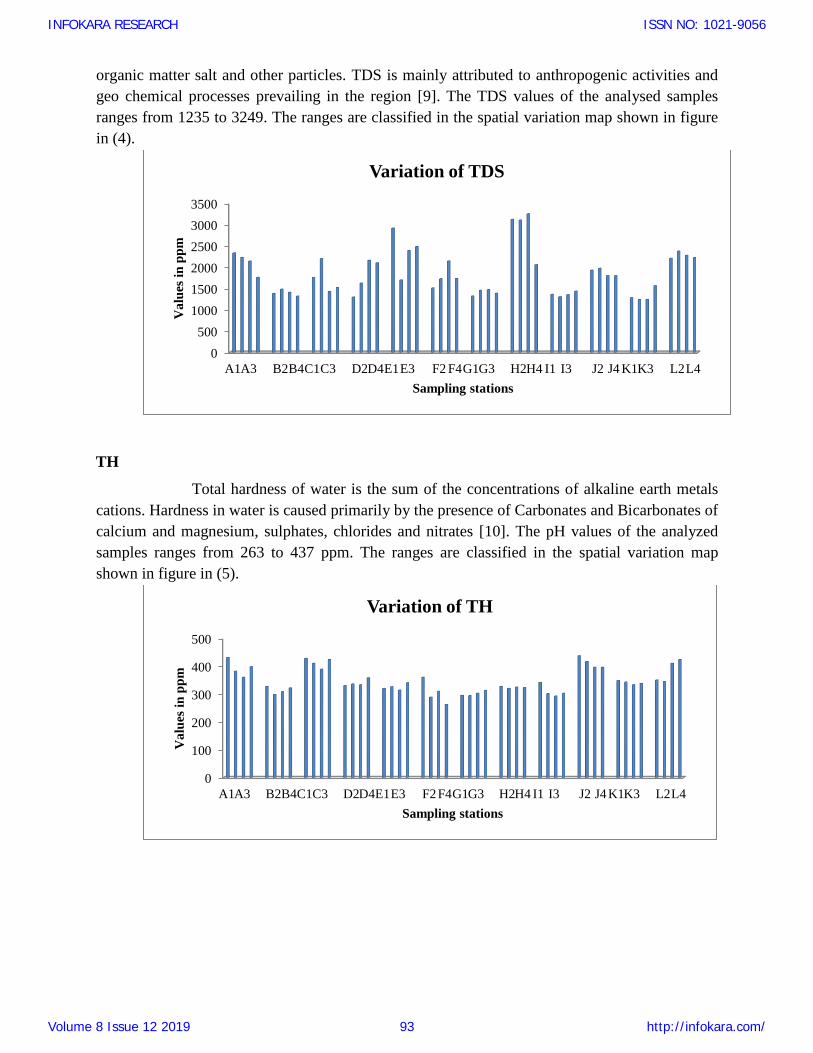
organic matter salt and other particles. TDS is mainly attributed to anthropogenic activities and
geo chemical processes prevailing in the region [9]. The TDS values of the analysed samples
ranges from 1235 to 3249. The ranges are classified in the spatial variation map shown in figure
in (4).
TH
Total hardness of water is the sum of the concentrations of alkaline earth metals
cations. Hardness in water is caused primarily by the presence of Carbonates and Bicarbonates of
calcium and magnesium, sulphates, chlorides and nitrates [10]. The pH values of the analyzed
samples ranges from 263 to 437 ppm. The ranges are classified in the spatial variation map
shown in figure in (5).
0
500
1000
1500
2000
2500
3000
3500
A1A3 B2B4C1C3 D2D4E1E3 F2 F4G1G3 H2H4 I1 I3 J2 J4 K1K3 L2L4
Va
lues
in
pp
m
Sampling stations
Variation of TDS
0
100
200
300
400
500
A1A3 B2B4C1C3 D2D4E1E3 F2F4G1G3 H2H4 I1 I3 J2 J4K1K3 L2L4
Va
lues
in
pp
m
Sampling stations
Variation of TH
INFOKARA RESEARCH
Volume 8 Issue 12 2019 93
ISSN NO: 1021-9056
http://infokara.com/
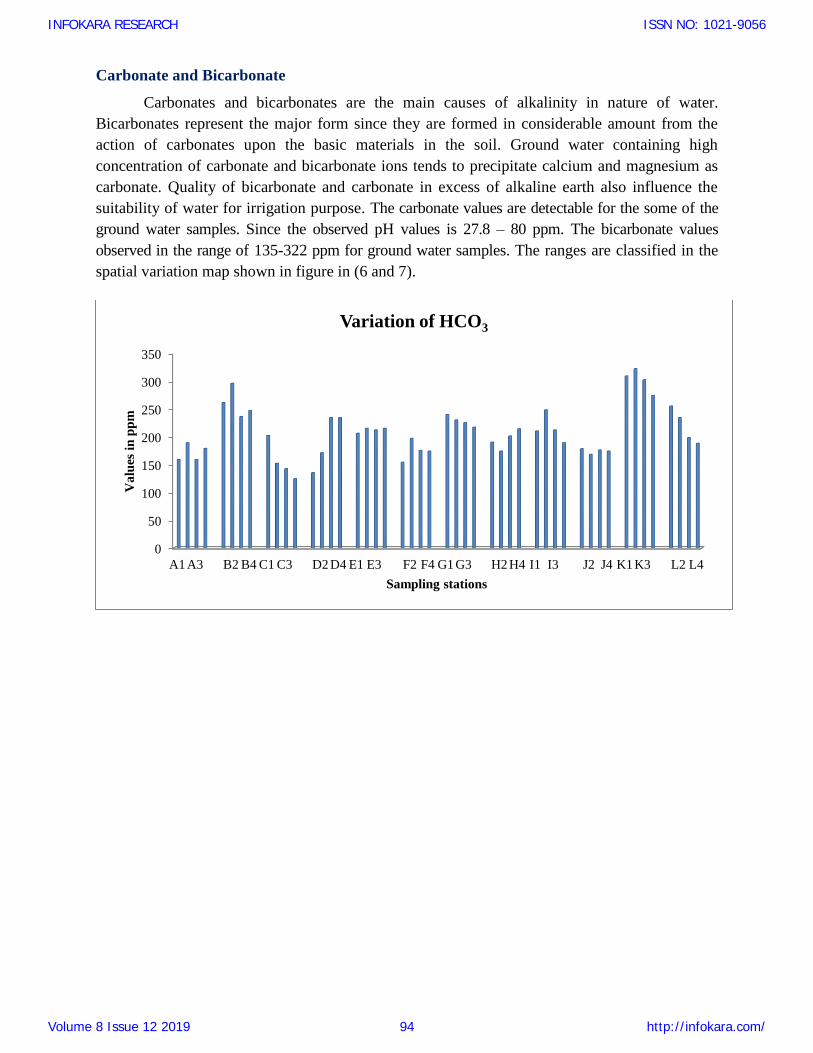
Carbonate and Bicarbonate
Carbonates and bicarbonates are the main causes of alkalinity in nature of water.
Bicarbonates represent the major form since they are formed in considerable amount from the
action of carbonates upon the basic materials in the soil. Ground water containing high
concentration of carbonate and bicarbonate ions tends to precipitate calcium and magnesium as
carbonate. Quality of bicarbonate and carbonate in excess of alkaline earth also influence the
suitability of water for irrigation purpose. The carbonate values are detectable for the some of the
ground water samples. Since the observed pH values is 27.8 – 80 ppm. The bicarbonate values
observed in the range of 135-322 ppm for ground water samples. The ranges are classified in the
spatial variation map shown in figure in (6 and 7).
0
50
100
150
200
250
300
350
A1 A3 B2 B4 C1 C3 D2 D4 E1 E3 F2 F4 G1 G3 H2 H4 I1 I3 J2 J4 K1 K3 L2 L4
Va
lues
in
pp
m
Sampling stations
Variation of HCO3
INFOKARA RESEARCH
Volume 8 Issue 12 2019 94
ISSN NO: 1021-9056
http://infokara.com/
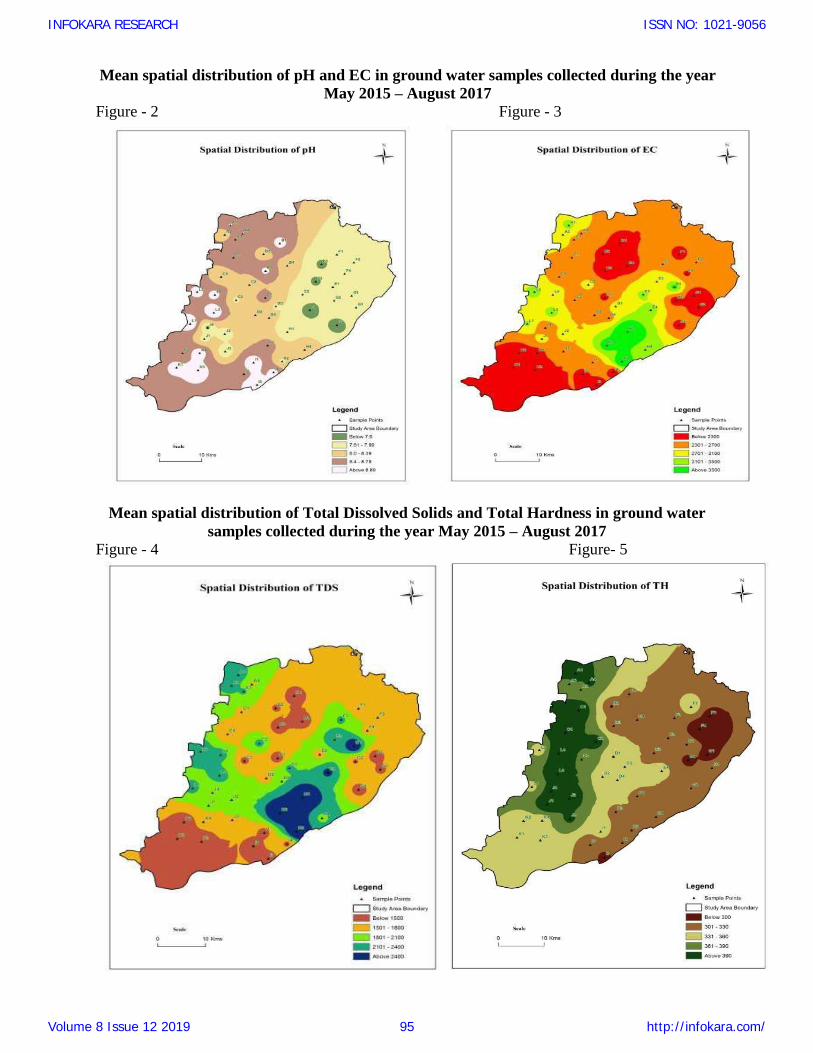
Mean spatial distribution of pH and EC in ground water samples collected during the year
May 2015 – August 2017
Figure - 2 Figure - 3
Mean spatial distribution of Total Dissolved Solids and Total Hardness in ground water
samples collected during the year May 2015 – August 2017
Figure - 4 Figure- 5
INFOKARA RESEARCH
Volume 8 Issue 12 2019 95
ISSN NO: 1021-9056
http://infokara.com/
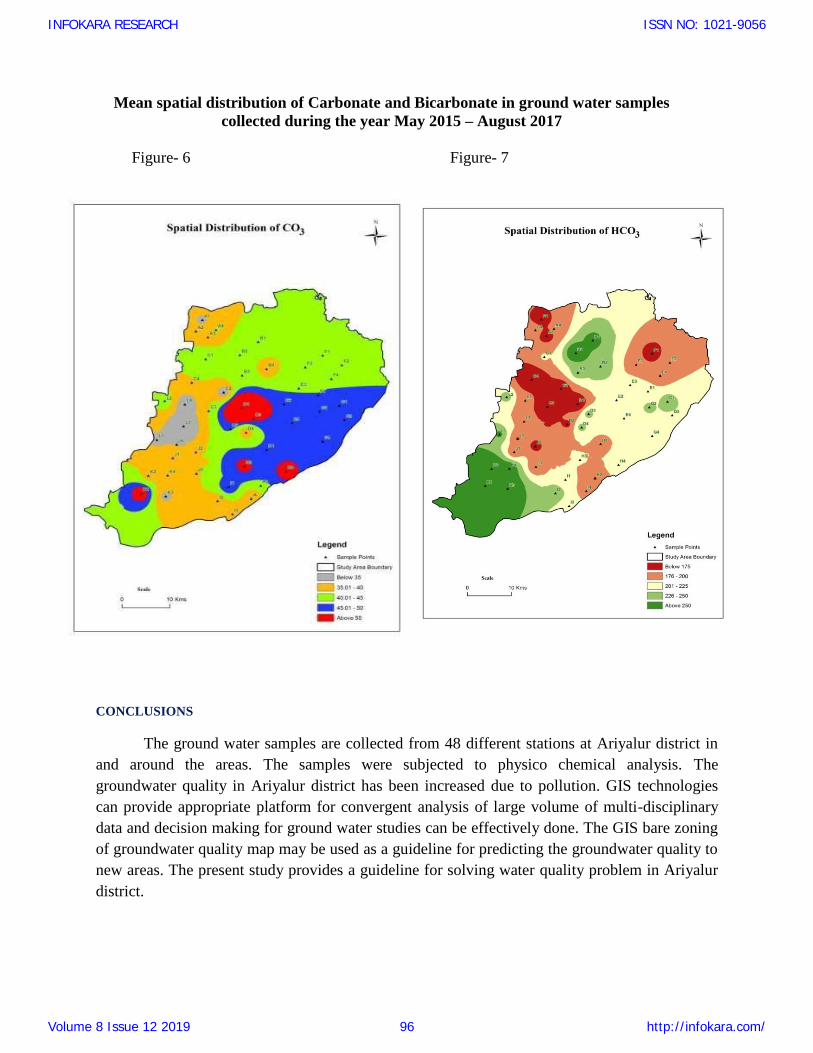
Mean spatial distribution of Carbonate and Bicarbonate in ground water samples
collected during the year May 2015 – August 2017
Figure- 6 Figure- 7
CONCLUSIONS
The ground water samples are collected from 48 different stations at Ariyalur district in
and around the areas. The samples were subjected to physico chemical analysis. The
groundwater quality in Ariyalur district has been increased due to pollution. GIS technologies
can provide appropriate platform for convergent analysis of large volume of multi-disciplinary
data and decision making for ground water studies can be effectively done. The GIS bare zoning
of groundwater quality map may be used as a guideline for predicting the groundwater quality to
new areas. The present study provides a guideline for solving water quality problem in Ariyalur
district.
INFOKARA RESEARCH
Volume 8 Issue 12 2019 96
ISSN NO: 1021-9056
http://infokara.com/
REFERENCES:
1. K.Ramesh and K.Srinithi ( 2014) Hydrochemical characteristics of ground water in
Mailaduthurai block of Nagapattinam District, Tamilnadu. International journal of
chemtech research .vol .6, No. 14, pp 5698-5708 Nov- Dec-2014.
2. 2.Jafar Ahamed .A,Loganathan.k and Ananthakrishnan A comparative evaluation of
ground water suitability for drinking ana irrigation purposes in pugalur area , karur
district, Tamilnadu,India. Archives of applied science research. 2013, 5 (1) : 213-
223.
3. K. Ramesh, V. Thirumangai International journal of engineering research and
applications. Vol.4, issue 1,(version 3 ) , January 2014 pp.63-70. Impacts of tanneries
on quality of ground water in pallavaram, Chennai metropolitan city.
4. Rajkumar V. Raikar and sneha MK International Research journal of Environmental
Research 2(4): 2443-2453 May 2012. Water quality analysis of Badravathi taluk using
GIS – a case study.
5. T.Subramani, S.Krishnan, P.K.Kumaresan International Journal of modern Engineering
research Vol.2 Issue 3. MayJune – 2012 PP 582-592 Study of ground water quality with
GIS Application for Ariyalur district- Tamil Nadu.
6. Trivedy A.K and Pandey S.N. (1990). Water Pollution. Ashinsh Publishing House New
Delhi. 2467 – 2543
7. Ramesh K and Bhuvana Jagadeeswari P (2012). Hydrochemical characteristics of ground
water for Domestic and Irrigation purposes in periyakulam taluk of Theni District,
Tamilnadu. Research Journal of Environment Sciences. 1(1): 19 - 27.
8. Selvakumar S, Ramkumar K, Chandrasekar N, Magesh N.S and Kaliraj S (2014).
Groundwater quality and its suitability for drinking and irrigational use in the southern
Tiruchirappalli district, Tamilnadu, India. Application of Water Sciences. 7(1) : 441 -
420.
9. Kumar G, Prabakaran K and Selvam G (2015). Assessment of groundwater Quality for
venppanthattai taluk, Perambalur district, Tamilnadu. Using Remote sensing and Gis
Techniques. International Journal of Recent Scientific Research. 6(3) : 3142-3146.
10. Patil P.N, Sawant D.V and Deshmukh (2012). International Journal of Environmental
Sciences. 3(3) : 1194 - 1207.
INFOKARA RESEARCH
Volume 8 Issue 12 2019 97
ISSN NO: 1021-9056
http://infokara.com/