Embed Size (px)
Citation preview

International Journal of Academic Research [ISSN: 2075-4124]
Vol. 5. Issue 6. & pp.364-383, 2017, www.ijarsite.com
________________________________________________________________________________________
364
Study of Oil Linked LNG Pricing Model in Japan
A. Seetharaman
Dean Academic Affairs, S P Jain School of Global Management
Veena Jadhav, Assistant Dean, S P Jain School of Global Management
Nitin Patwa, Director, Simulations, S P Jain School of Global Management
Shekhrenddu Bharadwaj, Post Graduate Scholar, S P Jain School of Global Management
ABSTRACT
A need for change in traditional crude oil linked LNG (Liquefied Natural Gas) pricing mechanism is strongly
felt by Japanese buyers, as they have been adversely affected due to wild fluctuations in global oil prices in
past 10 years. This study aims to establish the imperfectness in present LNG pricing mechanism by analyzing
it against carefully selected economic & energy variables. Around 10 years’ monthly data was analyzed for
correlation using linear regression models. The same variables were compared with a diametrically opposite
Henry Hub Index of US, which is an open market pricing mechanism. We observed the current LNG pricing
mechanism’s strong correlation with unrelated parameters and on other hand with no or very little correlation
with some of the very important parameters. Crude oil prices were very strongly correlated as expected but
there was little or no correlation with alternative energy sources such as coal prices, renewable energy etc.
Other market fundamentals such as demand/supply gap, JPY/USD exchange rate, Henry Hub Index have also
not shown any correlation with oil linked LNG prices. However, Japan is not likely to switch over to market
based pricing system entirely and major part contract is still expected be pegged with some reference point.
The study suggests that the reference point should be changed from oil alone to a basket of competitive &
alternative energy indices such as coal, oil products, renewable energy etc. The balance LNG should be
sourced through Hub pricing based on market fundamentals. This study is expected to provide a direction to
negotiate better terms with inclusion of the recommended parameters in the new contracts.
INTRODUCTION
Japan is by far the largest importer of LNG in the world and accounted for 32.3% of worldwide Import LNG
cargo volume in 2016. Until recently, majority of LNG import prices in Japan were closely linked with crude
oil index JCC (Japanese Crude Cocktail: A basket of crude oil prices). As there was no specific LNG pricing
model available in the past, crude oil being a well-established market worldwide was used as a benchmark to
LNG pricing in Japan. Oil linked LNG pricing provided a stable supply of gas at a relatively stable price range
which is especially suitable for big investment projects.
The linkage between oil and LNG pricing is based on some formula. The exact details of formula and terms of
the contract are not very transparent and limited between buyers & sellers. Various studies have demonstrated
that relationship was characterized by a time lag of about 5 months between world crude prices and LNG
prices with an addition of S-curve to dampen the effect of extreme high & low oil prices on LNG prices.
However due to various changes in last few years such as dramatic rise and collapse of crude oil prices,
worldwide changes in demand and supply dynamics etc., the pure oil linked pricing mechanism was under
pressure and a requirement for an alternative price Mechanism is felt.
First signs of trouble were felt when Crude oil prices soared above $100/bbl and as a result linked LNG prices
skyrocketed too. This was followed up by Fukushima Nuclear Power Plant disaster & shutdown in 2011. As a
result LNG demand went up by 20 bcm. The additional requirement was compensated by purchase through
Spot and other Index based LNG resources which were relatively cheaper. Since majority of LNG supplies in
Japan is done through oil linked long term contracts, the LNG import prices in Japan were much higher than

International Journal of Academic Research [ISSN: 2075-4124]
Vol. 5. Issue 6. & pp.364-383, 2017, www.ijarsite.com
________________________________________________________________________________________
365
most parts of the world. Below price data from year 2011 to 2013 gives a glimpse of wide price spread,
arbitrage opportunities and inability of Japanese buyers to buy freely from cheaper options due to long term
oil linked contracts.
Henry Hub $2 to $5/mmbtu,
European Hubs $8 to $11/mmbtu,
Asian LNG oil linked contract prices $15 to $18/mmbtu;
Asian LNG spot prices $13 to $19/mmbtu.
Gas Market Types:
Most Asian gas prices are pegged with crude oil, whereas US gas prices are based on Henry Hub pricing
index which is an open market based system. On other hand Europe has started moving from traditionally oil
linked pricing system and over 60% of gas sold in Europe is now based on hub prices.
There are 3 broad categories of LNG markets based on different pricing mechanisms:
1. Oil Linked LNG Pricing (Mainly Asia-Pacific)
2. Gas on Gas Hub Pricing: Based on Supply/Demand Balance (Mainly US, UK & Canada Markets: Henry
Hub, NBP etc.)
3. Mixed Pricing: Brent/Oil Product(s) link and part Hub pricing (Continental Europe market)
1. Oil Linked LNG Pricing: In absence of a well-established reference point, the LNG prices were tagged with crude oil in North
Asian countries like Japan, Korea & Taiwan. In 80s, LNG prices were calculated basis government
selling crude oil prices. Later in 90s LNG prices was linked to JCC (Japan Crude Cocktail) prices. The
exact details of formula to link crude oil and LNG prices and terms of the contract are not very
transparent and limited between buyers & sellers. Various studies have demonstrated that relationship
was characterized by a time lag of about 5 months between world crude prices and LNG prices. In order
to absorb wild fluctuations of crude oil in world market an S type curve was introduced with lower
0.00
2.00
4.00
6.00
8.00
10.00
12.00
14.00
16.00
18.00
2006 2007 2008 2009 2010 2011 2012 2013 2014 2015 2016
Comparative LNG Prices & Spread in 2011-2013
LNG - Japan Henry Hub - US
LNG Index - German NBP Index - UK
Alberta LNG Index - Canada

International Journal of Academic Research [ISSN: 2075-4124]
Vol. 5. Issue 6. & pp.364-383, 2017, www.ijarsite.com
________________________________________________________________________________________
366
slopes at both ends. The slop of S curve at middle and at both ends is decided between contracted parties.
Broadly speaking the LNG oil linked price formula is linked with oil, expressed as follows:
LNG = A x OIL + B
Where: LNG = LNG Prices, OIL = Crude oil Prices (JCC), A = Slope, B = Constant)
Source: Japanese S-Curve Contract prices Adapted from Global Natural Gas Markets Overview: A Report
Prepared by Leidos, Inc., Under Contract to EIA (www.eia.gov/workingpapers/pdf/global_gas.pdf);
http://reneweconomy.com.au
2. Gas on Gas Hub Pricing:
This is the case of an established gas market with many buyers and sellers at the same place and the price
is determined based on local or regional gas supply and demand, depending on the area covered &
popularity of such as hub. The gas fundaments form the basis of gas pricing and trading is done in and
open and transparent manner. US, Canada & most of Europe have such kind of hub pricing, named as
Henry Hub (US), National Balancing Point (NBP, UK) etc. Adoption of such Hub pricing protected these
countries from much higher oil linked gas pricing.
Depending on the prevailing market conditions, the short term gas pricing can be volatile but the long
term price security for high investment projects, which has been a key attracting point for oil linked
pricing can be achieved through Gas future contracts which are traded freely in a hub system.
With much liquidity all new supplies and demand even large in size can be accommodated in Hub trading
system without individual buyers and sellers entering into a new contract and negotiations.
Henry Hub & it’s relevance in this study:
Although Henry Hub is a US Gas price index, it has been extensively discussed and analysed in this
study. US gas market is the most dynamic of all the world gas markets and its gas index Henry Hub is
considered to be a pure free market based index. Japan’s oil linked pricing & open market Henry Hub
are two extremes of LNG pricing system and a comparative analysis between the two is expected to
provide the necessary direction and scale of change for the oil linked pricing system of Japan.

International Journal of Academic Research [ISSN: 2075-4124]
Vol. 5. Issue 6. & pp.364-383, 2017, www.ijarsite.com
________________________________________________________________________________________
367
Sabine Pipeline LLC owns and operates Henry Gas Processing Plant in Louisiana, which is the largest gas
collection and interconnection facility in Southern Louisiana US. Gas wholesale prices are referenced to
Henry Hub, the interconnection point for thirteen 13 major US inter and intrastate pipelines. The
movement of Henry Hub Index is purely based on actual demand & supply conditions of gas at the Hub.
Since 1990, the New York Mercantile Exchange (NYMEX) has adopted Henry Hub as the benchmark
point for gas trading.
The US is the most developed and deregulated market LNG market with a transparent pricing at work. As
the US is fast becoming a net exporter of LNG having Henry Hub as the base price, it is expected that
America's hub pricing mechanism will increasingly be used and set an international benchmark price for
natural gas.
3. Mixed Pricing:
As name suggests, a mix of both Hub pricing and Crude Oil/Oil Product linked pricing mechanism is
prevalent in most of the Central and Southern Europe.
Most long term gas contracts are linked with Brent crude oil or other oil products/energy reference, such
as diesel, kerosene or even coal. Although the hub pricing system is also making good progress in these
regions.
Review of Literature and Research Structure 1. Jonathan Stern and Howard Rogers (2013) in the paper ‘The Pricing of Internationally Traded Gas: the
search for new fundamentals (IEEJ, March 2013) indicated that Oil linked LNG pricing has no
fundamentals and an Alternative pricing mechanism for the LNG outside US is necessary. They further
said that LNG prices outside America have been traditionally linked to oil prices as oil index is well
established and LNG is an alternate fuel to oil and to support long term investment of projects. The oil
linked prices were not based on fundamentals and begin to strain when fundaments such as supply &
demand changed. Need for an alternative Price mechanism was felt.
2. Ken Koyama (2012 in the paper ‘An Analysis on Asian Premium for LNG Price, (IEEJ: March 2012)
stated that oil linked LNG Prices are higher than Import LNG from US to Japan including the shipping
cost. He further stated that Japan’s oil linked LNG import prices were much higher than LNG prices in
other parts of the world including British NBP Index and Henry Hub Index of US. This is to the extent
that LNG imported to Asia from US based on HH pricing + shipping cost is cheaper than Japan’s oil
linked prices. This price gap is known as Asian Premium should be reduced or eliminated.
3. Kenneth B. Medlock Iii (2014), In the paper ‘Natural Gas Price In Asia: What To Expect And What It
Means’ (James A. Baker III Institute for Public Policy, Rice University) discusses about changes In
Supply Dynamics with new avenues opening up & Shale Gas boom in US. Competition in LNG supply
side is increasing up due to change in supply dynamics with US Shale gas boom and new supply avenues
opening up all over world. This will eventually need to change gas pricing model in Asia.
4. Mark Agerton (2014), In paper, Global LNG Pricing Terms and Revisions: An Empirical Analysis (James
A. Baker III Institute for Public Policy Rice University) Points Out at Lack of Transparency in LNG
contracts and the exact relationship with Oil. Most LNG is sold under confidential, bilateral long-term
contracts, particularly in Asia. Thus, though prices are indexed to crude oil, actual prices, contract terms
and price revision clauses are not known. There is lack of transparency in price determination in Asia. The
paper tries to establish an empirical relationship between LNG import prices and crude oil prices.

International Journal of Academic Research [ISSN: 2075-4124]
Vol. 5. Issue 6. & pp.364-383, 2017, www.ijarsite.com
________________________________________________________________________________________
368
5. John Simpson (2009), in the paper, ‘Spot Natural Gas Prices: A Theoretical Party to Party Bargaining
Framework’ (Asian Social Science (Vol.5, No. 10, www.ccsenet.org/journal.html) establishes that hub
based gas prices are influenced by oil prices, which in turn is influenced by Stock global market and coal
index. He further emphasized that Gas prices and gas price changes are influenced by oil price and oil
price changes which in turn are influenced by global stock price index value and index value changes and
the coal price index values and index value changes. The global gas market could in future, when markets
become larger and more efficient, use these variables to assist in partially forecasting future spot gas
prices, but also to assist in spot price bargaining in an expansion of the party to party bargaining model.
6. Jonathan Stern (2013), in the paper ‘A crisis of fundamentals International gas pricing in Europe and Asia
(Energy Policy, Volume 64, January 2014, Pages 43-48) describes that Oil based LNG pricing is losing its
relevance. International gas prices in Europe and LNG importing Asia no longer reflect market
fundamentals. This became highly problematic in Europe post-2008 and in Japan post-Fukushima. The
result has been a significant switch to hub pricing in Europe. In Asia, no substantial action has been taken
beyond some new contracts based on Henry Hub prices. In Asia the ‘crisis of fundamentals’ was only just
starting to be addressed with a transition to market pricing an urgent imperative, but still a distant
prospect.
7. Seksun Moryadee , Steven A. Gabriel , Hakob G. Avetisyan (2014) in paper ‘Investigating the potential
effects of U.S. LNG exports on global natural gas markets’ (Energy Strategy Reviews, Volume 2, Issues
3–4, February 2014) investigates that that Cheaper US prices could replace expensive Asian & European
Gas suppliers. This paper investigates the potential effects of U.S. LNG exports on the domestic and
global markets. Less expensive U.S. LNG is competitive in European and Asian gas markets and could
displace more expensive suppliers in European and Asian gas markets.
8. Don Maxwell , Zhen Zhu (2011) in the paper ‘Natural gas prices, LNG transport costs, and the dynamics
of LNG imports’ (Energy Economics, Volume 33, Issue 2, March 2011, Pages 217-226,
https://doi.org/10.1016/j.eneco.2010.06.012) establishes an Imperial relations between Henry Hub with
UK & Asian prices. This paper examines the empirical relationship between U.S. LNG imports, the Henry
Hub price of natural gas relative to U.K. and Asia gas prices, and a proxy for LNG transportation costs
using monthly data from 1997 to 2007.
9. PEARSON Andrew & ROS Thierry (2011) in the paper ‘High oil price triggers LNG bargain hunt’
(Petroleum Economist. Mar 2011, Vol. 78 Issue 2, p26-26) argues that despite very high LNG price due
High oil price, it was not east for Asian buyers to switch on cheaper Spot LNG. Andrew Pearson, head of
LNG research at consultancy Wood Mackenzie, says most contracts are sensitive to big increases in oil
prices since around 85-90% of LNG purchased in the Asia- Pacific region is on long-term, oil-linked
agreements. LNG analyst Thierry Bros claims it is difficult for many Asia buyers to rely on spot LNG.
10. Péter Erdős (2012) in paper ‘Have oil and gas prices got separated?’ (Energy Policy, Volume 49, Oct
2012, Pages 707-18,https: //doi.org/10.1016/j.enpol.2012.07.022) describes that US Gas prices is no
longer linked with Oil since 2009, while as Asian & part Europe gas is still linked with Oil. VEC models
are applied to investigate the relationship between oil and natural gas prices. While natural gas prices in
Europe and Asia react to oil price, US gas price decoupled from oil in 2009. Since 2009, the US gas price
has decoupled from the European and Asian gas prices.
11. Kenneth Barry Medlock III (2012) in paper, ‘Modeling the implications of expanded US shale gas
production’ (Energy Strategy Reviews, Volume 1, Issue 1, March 2012, Pages 33-41,
https://doi.org/10.1016/j.esr.2011.12.002) says that Shale gas boom will influence the Supply dynamics
and traditional oil linked LNG pricing mechanism. North American shale gas development has major
implications for global natural gas trade. Shale makes global supply more elastic, enhances liquidity, and

International Journal of Academic Research [ISSN: 2075-4124]
Vol. 5. Issue 6. & pp.364-383, 2017, www.ijarsite.com
________________________________________________________________________________________
369
lowers long term price. Shale has implications for traditional pricing paradigms, such as oil indexation.
Shale has shifted perceived LNG opportunities away from North America and toward Asia. The potential
for future shale development in Asia could also be paradigm shifting. Globally, longer term supply focus
moves away from Russia, Iran, Qatar and Venezuela.
12. Jonathan Stern (2016), in paper ‘The new Japanese LNG strategy: a major step towards hub-based gas
pricing in Asia, (Oxford Institute for Energy Studies, OXFORD ENERGY COMMENT, June 2016),
discussed about initiative toward hub based pricing mechanism in Japan to diversify the portfolio. New
strategy of hub based pricing which favours a move to market prices, will diversify its purchase portfolio
away from long term contracts.
13. Article ‘Shale-gas LNG offers price evolution, not revolution (Petroleum Economist. Jun 2013, Vol. 80
Issue 5, p28-28. 1p) suggests that Asian players may not switch completely from oil linked pricing to hub
based pricing. The article further says that liquefied natural gas (LNG) supplies from the U.S. and East
Africa will have less impact on Asian import costs than expected. It considers the emergence of
competitively priced supplies tied to natural gas spot prices, which some industry players believe could
end oil-indexed contracts and control the expansion of traditional producers. However, analysts do not
support the argument that Asian buyers will switch away from long-term deals tied to oil spot prices.
14. Nhu Che, Tom Kompas (2014) in paper ‘The Structure and Dynamics of Liquefied Natural Gas Pricing in
Asia and the Pacific and implications for Australia’ (Crawford School of Public Policy, The Australian
National University, Crawford School Research Paper No. 14-09, November 2014) says that the role of
the base price and non-oil linked factors in LNG price formation are instead becoming more important for
Asian LNG pricing. The Asia-Pacific gas market’s JCC linked mechanism remains important, but its
contribution to LNG pricing is becoming less significant. This paper provides a modelling approach for
analysing the structure and dynamics of LNG pricing in the Asia and the Pacific region over the past
decades. The role of the base price and non-oil linked factors in LNG price formation are instead
becoming more important
15. Ken Koyama (2015) in paper, ‘Time Lag between Crude Oil and LNG Price Movements, IEEJ October
2015’ establishes that Correlation between JCC & LNG has a time lags of about five months. Based on
crude oil price data future LNG import prices can be estimated. LNG prices under long-term contracts for
Asian market are linked to average CIF crude oil import price called the Japan Crude Cocktail (JCC)
price, with some specific coefficients and factors taken into account. However the correlation is
accompanied by a time lags of about five months to be reflected in the LNG import price for Japan. The
result has interesting implications in a sense. Based on daily crude oil price changes, we can anticipate the
movements and direction of Japanese LNG import prices for up to almost half a year ahead.
16. Bachmeier, L J. (2006) in paper, ‘Testing for Market Integration Crude Oil, Coal and Natural Gas’ (The
Energy Journal, Vol. 27, No. 2, 55-72), analysed that there is a weak integration between crude oil, coal &
Natual Gas, in US market. This paper evaluates the degree of market integration both within and between
crude oil, coal, and natural gas markets. Using daily price data for five very different crude oils, we conclude
that the world oil market is a single, highly integrated economic market. On the other hand, coal prices at five
trading locations across the United States are cointegrated, but the degree of market integration is much
weaker, particularly between Western and Eastern coals. Finally, we show that crude oil, coal, and natural gas
markets are only very weakly integrated. Our results indicate that there is not a primary energy market.
Despite current price peaks, it is not useful to think of a primary energy market, except in a very long run
context.
Research Methodology

International Journal of Academic Research [ISSN: 2075-4124]
Vol. 5. Issue 6. & pp.364-383, 2017, www.ijarsite.com
________________________________________________________________________________________
370
1. Research Questions:
1.1 What are the underlying factors shaking the traditional oil linked LNG pricing mechanism in
Japan and other parts of the World?
1.2 To explore an alternative pricing mechanism suitable for Asia and Japan, in particular.
2. Research Design:
A number of economic indicators (variables) and competitive fuels were identified through Literature
Review of various research papers and journals, which may directly or indirectly affect the LNG prices.
Correlation of these variables with Japan LNG prices and Henry Hub LNG prices were carried out. This
helped us to establish the imperfectness of Oil based pricing model and provided a direction for a better
model in future contracts. A better model, which takes care of price stability for long term projects and at
the same time covers the short term price volatilities, in order to be mutually beneficial for both sellers and
buyers.
The difference in inherent characteristics of the two extreme pricing models will be analysed, i.e. Oil
pegged Japan LNG and market based US Henry Hub. Regression Analysis showed us varying degree of
correlations between various indicators with Japan LNG & Henry Hub pricing when compared with a set
of economic indicators and competitive fuels. This information could be used to decide the most suitable
pricing mechanism for Asian especially Japan market.
To test the hypotheses, the ‘R Square’, ‘Pearson Correlation’ and Sig. (2 tailed) for each variable against
dependant variable (i.e. LNG Japan Price & Henry Hub Prices) were calculated using Linear Regression
on SPSS software. These correlations are listed in a tabular form to clearly present pairs of variables that
had either strong, weak or insignificant correlations (positive or negative).
The graphs of Linear Regressions were also extracted to clearly see the correlation and spread of the
dependent variables Japan LNG and Henry Hub with the rest of the independent variables. The lines of
regression and the corresponding R-Square values for each graph fully supported the trends that were
observed using the Pearson-correlations of the variables.
In general, pairs of variables with a stronger correlation also possessed a higher R-Square value. However
the R-Square value must be checked along with Pearson Correlation for checking the positive or negative
correlation and Sig. (2 tailed) to check if the model is significant or not.
R-Square value close to 1 indicates a strong correlation and near Zero values shows no correlation.
However without checking Sig. (2 tailed) value, R-Square should not be interpreted.
Pearson Correlation value close to +1 indicates a strong positive & -1 indicates and strong negative
correlation. However without checking Sig. (2 tailed), Pearson Correlation should not be interpreted.
Sig. (2 tailed): value > 0.05 indicates that model is insignificant and could not fit the data. Sig. (2
tailed) value < 0.05 indicates a better fit. E.g. If Sig < 0.01, then the model is significant at 99%, if Sig
< 0.05 then the model is significant at 95%.
3. Data Collection
Historical data of the identified indicators from 2007 to May 2017, were collected from various secondary
sources. This is a very important time period in view for the Oil & Gas industry due to below mentioned
reasons:
3.1 Oil Price wild fluctuations from 2008
3.2 Supply Demand Dynamic change, Shale gas boom from 2007 onwards

International Journal of Academic Research [ISSN: 2075-4124]
Vol. 5. Issue 6. & pp.364-383, 2017, www.ijarsite.com
________________________________________________________________________________________
371
3.3 Financial crisis of 2007-2008 & recovery
3.4 Fukushima disaster & Nuclear Power Plant Shut down in 2011 raised the demand for LNG in
Japan.
4. Definition of Variables
Brief description of the variables as follows:
4.1 Dependent Variables
LNG Prices (Japan Oil Linked LNG Prices & US Henry Hub Prices) were checked for correlation
with other variables, which could have affected the LNG Prices apart from oil prices & demand &
supply.
4.2 Independent Variables
4.2.1 Crude Oil Prices
4.2.2 LNG Demand:
4.2.3 LNG supply
4.2.4 Availability of New Markets & Purchase Options
4.2.5 Changes in Geo Political conditions
4.2.1 Crude Oil Prices
a. World Economy: It has been observed that World economy influence the oil demand
and prices.
b. Increased Supply due to Shall Oil Boom & New Oil Resources
c. Global stock price index values: Stock prices in a global index are representation of
global supply and demand conditions and eventually effects global energy prices
d. Japan Economy: Japan being the biggest LNG importer influences the Demand &
Supply situation around the world and hence the prices.
e. JPY/USD Exchange Rates: JPY/USD have been fluctuating rapidly over the years. A
devalued JPY asks for more USD to be spent for the same LNG prices.
f. COAL Prices Index & Index Value Changes: Oil price and oil price changes are
influenced significantly by global stock price index values and index value changes
and the coal price index values and index value changes
g. Japan stock price index values:
Indicators Used: JCC prices, Brent prices, coal prices, JPY/USD exchange rate, Japan
Nikkei Stock Index, Japan GDP, US GDP, US Stocks S&P 500 Index
4.2.2 LNG Demand

International Journal of Academic Research [ISSN: 2075-4124]
Vol. 5. Issue 6. & pp.364-383, 2017, www.ijarsite.com
________________________________________________________________________________________
372
a. Demand Decrease: World Economy Slowing Down and may put a limited downward
pressure towards Demand.
i. Asia represents the main source of uncertainty on the demand side of the global
gas market. In summary across the large and growing Asian gas consumers.
ii. Japan: Lack of clarity on the pace and scale of nuclear restarts
iii. South Korea: Uncertainty around gas vs coal usage in the power sector
iv. India: Questions over infrastructure, domestic pricing and affordability of gas vs
coal.
v. China: Economy slowing down and uncertainty on domestic production.
b. Demand Increase: LNG demand increased due to Fukushima Nuclear disaster in
March 2011 and delay in recommissioning of the reactor and Government
restrictions. A restart may put pressure on LNG demand though.
c. Demand to increase: More emphasis on Cleaner Energy (LNG being cleaner than Oil
& Coal) with Government Support and increase of LNG in Industrial area.
d. Increase of Renewable Energy Usage will reduce the LNG demand. Prices and usage
of Renewable energy is increasing.
e. Crude Oil Prices: An increase or decrease in crude oil prices affects the LNG demand
in 2 ways.
i. As an alternative Fuel, LNG demand goes up with an increase of crude oil prices
and vice-versa, in open markets where oil and LNG prices are not linked by
contract formulas.
ii. In oil linked LNG markets, an increase in Oil price increase the LNG prices as
well and may have decrease the LNG demand and vice versa.
f. Average Temperature during the winters going high: Will slowly decrease the
demand in long term. However overall effect will be insignificant to be considered in
this study.
Indicators Used: LNG Consumption US, Japan and World, Renewables Consumption in
TWH
4.2.3 LNG supply
a. Increased Supply: With Shale Oil Boom, US became the net exporter of LNG from a
major LNG Importer. Overall the Global LNG trade was the highest ever in history
(258.0 MT) and the growth is expected to continue at least for next few years.
b. More Pipelines Supply Available: Availability of a better pipeline network will
provide more flexibility on supply side.
c. Supply Options through New LNG Resources: Through new projects and expansion
of existing facilities in US, Australia, East Africa & Asia Pacific.
d. More Functioning FSRUs in Market: More no. of FSRUs in service felicitating more
flexibility in term of supplies at new and remote places with lesser investment.
e. Falling Shipping Cost: shipping costs have been falling since 2008 due to excess
tonnage (i.e. more no. of ships in the market than required). Low shipping cost
encourage arbitrage opportunity to buy form US & European markers and eases the
supply side.
Indicators Used: LNG Production US, LNG Production World, Shipping Cost (Spot
rates for Qatar and Japan were used as reference, being the world’s largest exporter and
importers of LNG.
4.2.4 Availability of New Markets & Purchase Options
International Journal of Academic Research [ISSN: 2075-4124]
Vol. 5. Issue 6. & pp.364-383, 2017, www.ijarsite.com
________________________________________________________________________________________
373
a. Spot LNG Prices: An oversupply LNG is expected for next 3 years along with more
number of Ships available, which will is favorable for an increased activity of LNG
Spot cargo. Will further boost supply side and expected to keep the LNG prices on
lower side. Supply Options through New LNG Resources: Through new projects and
expansion of existing facilities in US, Australia, East Africa & Asia Pacific.
b. Availability through Henry Hub, British & European Hubs:
The sudden spike of oil prices from 2008 onwards resulted in oil linked LNG contract
prices significantly higher in Asia than US & European index prices. This coupled
with low shipping cost environment provided, provided alternative options and
excellent arbitrage opportunity to the Asian buyers. Possibility of new LNG Hubs in
Tokyo, shanghai & Singapore to capture to local market fundamentals.
Indicators Used: Henry Hub, UK NBP Index, Canada (Alberta) Index, German, LNG
Index, Japan Spot prices and a relatively new Spot Index JKM (Japan Korea Marker).
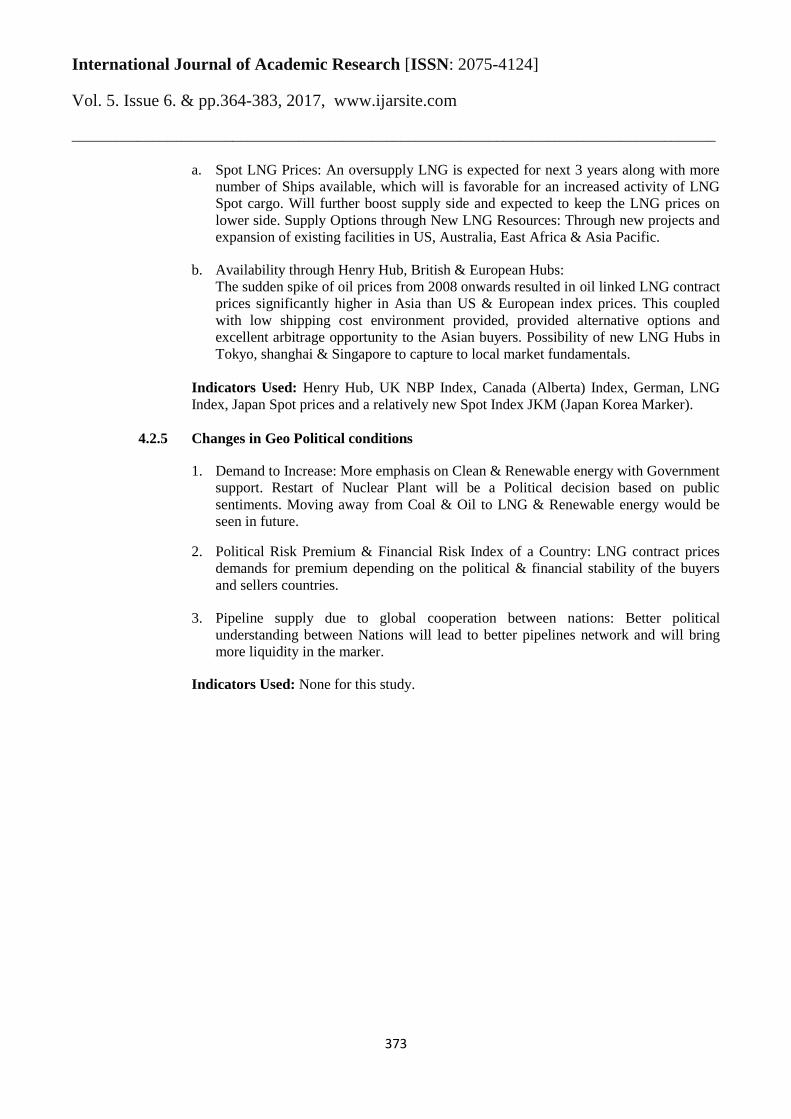
4.2.5 Changes in Geo Political conditions
1. Demand to Increase: More emphasis on Clean & Renewable energy with Government
support. Restart of Nuclear Plant will be a Political decision based on public
sentiments. Moving away from Coal & Oil to LNG & Renewable energy would be
seen in future.
2. Political Risk Premium & Financial Risk Index of a Country: LNG contract prices
demands for premium depending on the political & financial stability of the buyers
and sellers countries.
3. Pipeline supply due to global cooperation between nations: Better political
understanding between Nations will lead to better pipelines network and will bring
more liquidity in the marker.
Indicators Used: None for this study.
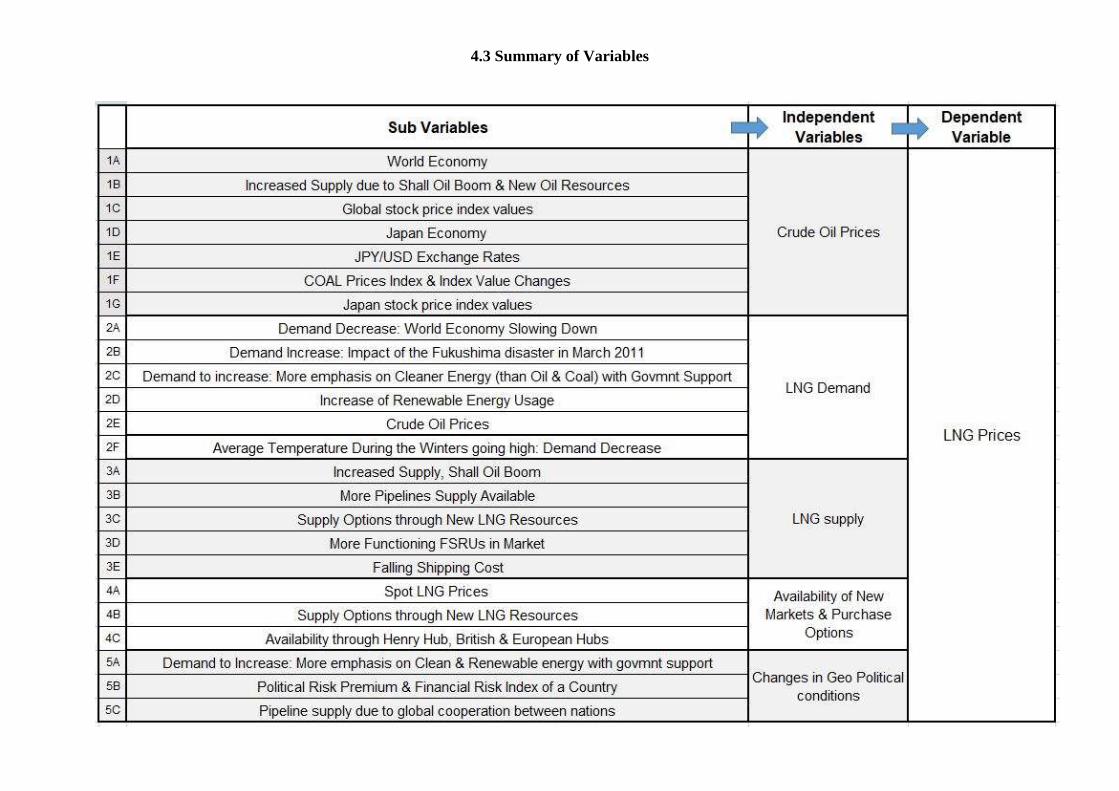
4.3 Summary of Variables

International Journal of Academic Research [ISSN: 2075-4124]
Vol. 5. Issue 6. & pp.364-383, 2017, www.ijarsite.com
________________________________________________________________________________________
375
5. Data Analysis : Results & Their Interpretation
5.1 Co-relation of Japan LNG* Prices with Oil and other Parameters:
* In this study Japan LNG Price is referred to Japan’s Oil Linked LNG Prices.
5.1.1 Japan LNG Vs JCC Crude Oil Prices:
The R Square Value is 0.725 & Pearson Correlation: 0.851 with a Sig. value as 0.000.
This shows a very strong correlation between JCC Crude Oil prices & Japan LNG Prices
and the model is good fit with a confidence level of close to 100%.
This confirms our base concept that Japan LNG prices are closely linked with crude oil
prices.
5.1.2 Japan LNG Vs Brent Crude Oil Prices:
The R Square Value is 0.601 & Pearson Correlation: 0.775 with a Sig. value as 0.000.
This shows a very strong correlation between Brent Crude Oil prices & Japan LNG Prices
and the model is good fit with a confidence level of close to 100%.
This confirms our base concept that Japan LNG prices are closely linked with crude oil
prices
NB: JCC Crude Oil prices are closely related with Brent prices with addition of shipping
cost and JPY/USD exchange rates
5.1.3 Japan LNG Vs US Henry Hub Index Prices:
The R Square Value is 0.013 & Pearson Correlation: -0.116 with a Sig. value as
0.197. There is no statistically significant correlation between Japan LNG & US
Henry Hub prices
Since one is oil linked and other is market based, there is no relation between the two.
5.1.4 Japan LNG Vs Japan Spot Prices:
The R Square Value is 0.781 & Pearson Correlation: 0.884 with a Sig. value as 0.00. This
shows a very strong correlation between Japan LNG & Japan Spot LNG Prices and the
model is good fit with a confidence level of close to 100%.
Japan spot LNG price is based on additional demand, when Japan oil linked LNG price
rises. This provide an arbitrage opportunity for US or European LNG, which could be
cheaper than Japan LNG including shipping cost.
5.1.5 Japan LNG Vs Japan Shipping Rates (from Qatar to Japan)
The R Square Value is 0.694 & Pearson Correlation: 0.833 with a Sig. value as 0.00. This
shows a correlation between Japan LNG & Japan shipping LNG Prices and the model is
good fit with a confidence level of close to 100%.
Shipping rates depends on Cargo to be moved and shipping tonnage availability. Higher
shipping rates will push up the Japan LNG prices.
5.1.6 Japan LNG Vs Platt’s JKM Spot Prices:
The R Square Value is 0.739 & Pearson Correlation: 0.859 with a Sig. value as 0.00. This
shows a very strong correlation between Japan LNG & JKM Prices and the model is good
fit with a confidence level of close to 100%.
This is a new spot Index being introduced by Platts, having the similar characteristics as
Japan Spot price.

International Journal of Academic Research [ISSN: 2075-4124]
Vol. 5. Issue 6. & pp.364-383, 2017, www.ijarsite.com
________________________________________________________________________________________
376
5.1.7 Japan LNG Vs Coal Prices:
The R Square Value is 0.077 & Pearson Correlation: 0.278 with a Sig. value as 0.002.
This shows both values (Japan LNG & Coal prices) are having a weak correlation.
When oil prices go up it adds some pressure on alternative fuels such as coal etc.
5.1.8 Japan LNG Vs JPY/USD:
The R Square Value is 0.168 & Pearson Correlation: -0.409 with a Sig. value as 0.00.
This shows both values (Japan LNG Vs JPY/USD) are having a weak negative
correlation.
5.1.9 Japan LNG Vs Japan (Nikkei) Stock Exchange:
The R Square Value is 0.081 & Pearson Correlation: -0.285 with a Sig. value as 0.001.
This shows both values (Japan LNG Vs Japan (Nikkei) Stock Exchange) are having a
weak negative correlation.
5.1.10 Japan LNG Vs Japan GDP:
The R Square Value is 0.168 & Pearson Correlation: -0.409 with a Sig. value as 0.00.
This shows both values (Japan LNG Vs Japan GDP) are having a weak negative
correlation.
5.1.11 Japan LNG Vs US GDP:
The R Square Value is 0.001 & Pearson Correlation: 0.027 with a Sig. value as 0.765.
This shows both values (Japan LNG Vs US GDP) are Not correlated and the model is not
significant as Sig. value is higher than 0.05.
5.1.12 Japan LNG Vs US Stocks:
The R Square Value is 0.000 & Pearson Correlation: -0.020 with a Sig. value as 0.824.
This shows both values (Japan LNG Vs US Stocks) are Not correlated and the model is
not significant as Sig. value is higher than 0.05.
5.1.13 Japan LNG Vs German LNG Index Prices:
The R Square Value is 0.574 & Pearson Correlation: 0.758 with a Sig. value as 0.007.
This shows a strong correlation between Japan LNG & German LNG and the model is
good fit
Correlation as European LNG indices are still not fully delinked with oil.
5.1.14 Japan LNG Vs UK NBP Index Prices:
The R Square Value is 0.565 & Pearson Correlation: 0.751 with a Sig. value as 0.008.
This shows a strong correlation between Japan LNG & German LNG and the model is
good fit
Correlation as European LNG indices are still not fully delinked with oil.
5.1.15 Japan LNG Vs Canada LNG Index Prices:
The R Square Value is 0.030 & Pearson Correlation: -0.173 with a Sig. value as 0.611.
There is no statistically significant correlation between Japan LNG & Canada LNG Prices
as Sig. value > 0.05
5.1.16 Japan LNG Vs World Supply/Demand Gap:
The R Square Value is 0.223 & Pearson Correlation: 0.473 with a Sig. value as 0.142.
There is no statistically significant correlation between Japan LNG & World
Supply/Demand Gap, as Sig. value > 0.05

International Journal of Academic Research [ISSN: 2075-4124]
Vol. 5. Issue 6. & pp.364-383, 2017, www.ijarsite.com
________________________________________________________________________________________
377
5.1.17 Japan LNG Vs US Supply/Demand Gap:
The R Square Value is 0.137 & Pearson Correlation: 0.370 with a Sig. value as 0.263.
There is no statistically significant correlation between Japan LNG & US Supply/Demand
Gap as Sig. value > 0.05
5.1.18 Japan LNG Vs Renewable Consumption:
The R Square Value is 0.108 & Pearson Correlation: 0.328 with a Sig. value as 0.324.
There is no statistically significant correlation between Japan LNG & Renewable
Consumption, as Sig. value > 0.05
5.2 Correlation of US Henry Hub Index Prices with Oil and other Parameters:
5.2.1 Henry Hub Index Vs JCC Crude Oil Prices:
The R Square Value is 0.054 & Pearson Correlation: 0.233 with a Sig. value as 0.009.
This shows both values (Henry Hub Index & JCC crude oil) are not correlated but the
model is statistically significant.
As per our base concept Henry Hub is not linked to crude oil prices.
5.2.2 Henry Hub Index Vs Brent Crude Oil Prices:
The R Square Value is 0.084 & Pearson Correlation: 0.289 with a Sig. value as 0.001.
This shows both values (Henry Hub Index & JCC crude oil) are not correlated but the
model is statistically significant.
As per our base concept Henry Hub is not linked to crude oil prices.
5.2.3 Henry Hub Index Vs Japan Spot LNG Prices:
The R Square Value is 0.657 & Pearson Correlation: 0.810 with a Sig. value as 0.00. This
shows a very strong correlation between Henry Hub Index & Japan Spot LNG Prices and the
model is good fit with a confidence level of close to 100%
The spot cargo is sourced at market price and hence showing strong correlation with Henry
Hub prices.
5.2.4 Henry Hub Index Vs Japan Shipping Spot Rates (from Qatar to Japan):
The R Square Value is 0.067 & Pearson Correlation: 0.260 with a Sig. value as 0.010.
There is no statistically significant correlation between Henry Hub Index Vs Japan Shipping
Rates, as Sig. value > 0.05
5.2.5 Henry Hub Index Vs Platts’ JKM Spot Prices:
The R Square Value is 0.648 & Pearson Correlation: 0.805 with a Sig. value as 0.00. This
shows a very strong correlation between Henry Hub Index & JKM Prices and the model is
good fit with a confidence level of close to 100%
This is a new spot Index being introduced by Platts, having the similar characteristics as
Japan Spot price.
5.2.6 Henry Hub Index Vs Coal Prices:
The R Square Value is 0.208 & Pearson Correlation: 0.456 with a Sig. value as 0.00.
This shows both values (Henry Hub Index & Coal prices are having a weak positive
correlation.
5.2.7 Henry Hub Index Vs JPY/USD:

International Journal of Academic Research [ISSN: 2075-4124]
Vol. 5. Issue 6. & pp.364-383, 2017, www.ijarsite.com
________________________________________________________________________________________
378
The R Square Value is 0.026 & Pearson Correlation: 0.162 with a Sig. value as 0.070. There
is no statistically significant correlation between Henry Hub Index Vs JPY/USD index, as
Sig. value > 0.05
5.2.8 Henry Hub Index Vs Japan (Nikkei) Stock Exchange:
The R Square Value is 0.002 & Pearson Correlation: -0.040 with a Sig. value as 0.658. There
is no statistically significant correlation between Henry Hub Index Vs Nikkei index, as Sig.
value > 0.05.
5.2.9 Henry Hub Index Vs Japan GDP:
The R Square Value is 0.006 & Pearson Correlation: 0.079 with a Sig. value as 0.379. There
is no statistically significant correlation between Henry Hub Index Vs Japan GDP index, as
Sig. value > 0.05.
5.2.10 Henry Hub Index Vs US GDP:
The R Square Value is 0.266 & Pearson Correlation: -0.515 with a Sig. value as 0.000. This
shows both values (Henry Hub Index Vs US GDP) are mildly negative correlated.
Associated with more investment towards Shale technology and increased availability of Gas
at lower price.
5.2.11 Henry Hub Index Vs US Stocks:
The R Square Value is 0.112 & Pearson Correlation: -0.334 with a Sig. value as 0.000. This
shows both values (Henry Hub Index Vs US Stocks) are mildly negative correlated.
GDP generally have a positive correlation with stock exchange.
5.2.12 Henry Hub Index Vs German LNG Index Prices:
The R Square Value is 0.119 & Pearson Correlation: 0.345 with Sig. value as: 0.299 There is
no statistically significant correlation between Henry Hub Index Vs German LNG prices, as
Sig. value > 0.05.
5.2.13 Henry Hub Index Vs UK NBP LNG Index Prices:
The R Square Value is 0.098 & Pearson Correlation: 0.313 with a Sig. value as 0.348. There
is no statistically significant correlation between Henry Hub Index Vs NBP Index, as Sig.
value > 0.05.
5.2.14 Henry Hub Index Vs LNG Canada Index Prices:
The R Square Value is 0.994 & Pearson Correlation: 0.997 with a Sig. value as 0.000. This
shows a correlation between Henry Hub Index & Canada Index price and the model is good
fit with a confidence level of close to 100%
US & Canada LNG markets are very closely linked.
5.2.15 Henry Hub Index Vs World Supply/Demand Gap:
The R Square Value is 0.116 & Pearson Correlation: -0.340 with a Sig. value as 0.306. There
is no statistically significant correlation between Henry Hub Index Vs World Supply/Demand
Gap, as Sig. value > 0.05
Despite the great potential, Henry Hub’s usage in world market is still limited.
5.2.16 Henry Hub Index Vs US Supply/Demand Gap:
The R Square Value is 0.627 & Pearson Correlation: -0.792 with a Sig. value as 0.004. This
shows a very strong correlation between Henry Hub Index & US Supply/Demand Gap and
the model is good fit with a confidence level of close to 100%

International Journal of Academic Research [ISSN: 2075-4124]
Vol. 5. Issue 6. & pp.364-383, 2017, www.ijarsite.com
________________________________________________________________________________________
379
With increased gap between supply and demand, more Henry Hub prices will come down.
This confirms our base concept of Henry Hub is a pure demand/supply based model.
5.2.17 Henry Hub Index Vs Renewable Consumption:
The R Square Value is 0.663 & Pearson Correlation: -0.814 with a Sig. value as 0.002. This
shows a strong negative correlation between Henry Hub Index & renewable energy
consumption and the model is good fit with a confidence level of close to 100%.
Increase renewable energy consumption eases demand of LNG further and will bring down
the LNG prices.
5.3 Summary of Data Analysis
No. Variables Statistical Coefficients JapanLNG HenryHub
1 JapanLNG
Pearson Correlation 1.000 -0.116
R Square 0.013
Sig. (2-tailed) NA 0.197
2 JCC Crude
Pearson Correlation 0.851 0.233
R Square 0.725 0.054
Sig. (2-tailed) 0.000 0.009
3 Brent
Pearson Correlation 0.775 0.289
R Square 0.601 0.084
Sig. (2-tailed) 0.000 0.001
4 Henry Hub
Pearson Correlation -0.116 1.000
R Square 0.013
Sig. (2-tailed) 0.197 NA
5 JPN Spot LNG
Pearson Correlation 0.884 0.810
R Square 0.781 0.657
Sig. (2-tailed) 0.000 0.000
6 LNG Shipping Spot Rate
Pearson Correlation 0.833 0.260
R Square 0.694 0.067
Sig. (2-tailed) 0.000 0.010
7 Japan Korea Marker (LNG
Spot)
Pearson Correlation 0.859 0.805
R Square 0.739 0.648
Sig. (2-tailed) 0.000 0.000
8 Coal
Pearson Correlation 0.278 0.456
R Square 0.077 0.208
Sig. (2-tailed) 0.002 0.000
9 JPY / USD Exchange Rates
Pearson Correlation -0.409 0.162
R Square 0.168 0.026
Sig. (2-tailed) 0.000 0.070
10 Nikkei Pearson Correlation -0.285 -0.040

International Journal of Academic Research [ISSN: 2075-4124]
Vol. 5. Issue 6. & pp.364-383, 2017, www.ijarsite.com
________________________________________________________________________________________
380
R Square 0.081 0.002
Sig. (2-tailed) 0.001 0.658
11 Japan GDP
Pearson Correlation -0.409 0.079
R Square 0.168 0.006
Sig. (2-tailed) 0.000 0.379
12 US GDP
Pearson Correlation 0.027 -0.515
R Square 0.001 0.266
Sig. (2-tailed) 0.765 0.000
13 US Stocks
Pearson Correlation -0.020 -0.334
R Square 0.000 0.112
Sig. (2-tailed) 0.824 0.000
14 German LNG
Pearson Correlation 0.758 0.345
R Square 0.574 0.119
Sig. (2-tailed) 0.007 0.299
15 UK NBP
Pearson Correlation 0.751 0.313
R Square 0.565 0.098
Sig. (2-tailed) 0.008 0.348
16 Canada LNG
Pearson Correlation -0.173 0.997
R Square 0.030 0.994
Sig. (2-tailed) 0.611 0.000
17 World Supply/Demand Gap
Pearson Correlation 0.473 -0.340
R Square 0.223 0.116
Sig. (2-tailed) 0.142 0.306
18 US Supply/Demand Gap
Pearson Correlation 0.370 -0.792
R Square 0.137 0.627
Sig. (2-tailed) 0.263 0.004
19 Renewable Consumptions
Pearson Correlation 0.328 -0.814
R Square 0.108 0.663
Sig. (2-tailed) 0.324 0.002
6. Research Findings
As expected, present oil linked LNG pricing is strongly correlated with crude oil price and oil prices
are the sole deciding factor for LNG prices.
On other hand open market’s Henry Hub has shown little correlation with Crude oil.
LNG prices’ heavy dependency on Crude oil is unreal, which has shown little correlation with open
market LNG. This will certainly lead to undesirable extremes.
Current Japan LNG Pricing has no relation with market fundamentals such as Demand/Supply,
JPY/USD Exchange Rate, market based Index Henry Hub etc.
Current Japan LNG Pricing has no relation with alternative energy sources such as Coal prices,
Renewable energy.

International Journal of Academic Research [ISSN: 2075-4124]
Vol. 5. Issue 6. & pp.364-383, 2017, www.ijarsite.com
________________________________________________________________________________________
381
Henry Hub, a pure demand and supply based pricing model has shown good correlation with
important Indicators such as Demand/Supply, Canada LNG prices, GDP, Renewables and other
alternative energy sources such as Coal.
Japan LNG prices show strong correlation with European LNG indices, which are still about 60% oil
linked.
Conclusion & Recommendations
The statistical analysis of Japan LNG prices and its relations with other variables have brought out the
inherent characteristics of oil Linked LNG pricing. Japan LNG prices by virtue of oil linking, have shown
little or no correlation with important indicators such as demand/supply of LNG, coal prices, expansion of
renewable energy and other important economic indicators such as JPY/USD Exchange Rates. The
contract buyers were obligated to buy LNG at very high prices which was completely out of sync from
LNG market fundamentals and prevailing open market prices. ‘Destination Clause’ and ‘Take or Pay
Clause’ also put the contract buyers at great disadvantage and a change in LNG pricing system is the way
out.
Based on this study, below important points are recommended to be included for a better pricing
mechanism when negotiating new contracts.
The pricing should incorporate market fundaments such as demand & supply status. A regional Hub
should be made with a mutual participation of all major players in the regions, to create a large trading
Hub to provide enough liquidity.
A balanced reference point comprises of a basket of energy products & economic factors such as
prices of coal, oil, oil products, renewable energy, shipping cost, currency exchange rate would give a
more stable pricing structure and prevent LNG prices being running away due to linked with a single
commodity such as oil.
Henry Hub Index has all the flexibility and openness to become a world index. Another possibility
could be to form a global index by converging various prevailing LNG indexing in the world.
However we do not foresee Japan to completely abandon the oil linked contracts & go entirely for
Henry Hub or other global index. This is to avoid shocks due to inherent volatility of a demand and
supply based open index. However as mentioned above part of the cargo should be sourced from open
market.
Long term contracts could still be continued as they provide better long term stability against
volatility of market based LNG prices. However new long term contract should be made to provide
flexibility that about +/- 20-30% of the contracted quantity could be cancelled or sourced from a
nearby hub or delivered to another destination.
A mixed or hybrid type of contracts with some portion of oil/oil basket mix and rest from hub
pricing will provide necessary stability and market advantage at the same time.
We can expect shifting towards more spot cargo in a free market, shipping rates should also be
incorporated in the pricing mechanism or new contracts. As shipping rates are known to fluctuate
violently and may diminish the benefits of better priced LNG.
New contracts to be made with Destination Free clause and provide flexibility in Pay or Take
Clause, so that all or part cargo can be discharged at other places as per prevailing demand/supply
situation.

International Journal of Academic Research [ISSN: 2075-4124]
Vol. 5. Issue 6. & pp.364-383, 2017, www.ijarsite.com
________________________________________________________________________________________
382
References
Bachmeier, L. J. (2006). Testing for Market Integration Crude Oil, Coal and Natural Gas. The Energy Journal,
Vol. 27, No. 2, 55-72.
British Petroleum (2016). Statistical Review of World Energy, June 2016
British Petroleum (2017). Statistical Review of World Energy, June 2017
Don Maxwell, Zhen Zhu (2011). Natural gas prices, LNG transport costs, and the dynamics of LNG imports,
Energy Economics, Volume 33, Issue 2, March 2011, Pages 217-226,
https://doi.org/10.1016/j.eneco.2010.06.012
Energy Information Administration (EIA) (2016), International Energy Outlook, 2017.
Honore (2014). The Outlook for Natural Gas Demand in Europe, Anouk Honore, NG87, OIES, June 2014,
http://www.oxfordenergy.org/2014/06/the-outlook-for-natural-gas-demand-in-europe-2/
http://www.bp.com/en/global/corporate/energy-economics/statistical-review-of-world-energy/downloads.html
https://data.oecd.org/energy/renewable-energy.htm
http://blogs.platts.com/2014/03/07/lng-pricing/
http://stats.oecd.org/
http://www.poten.com/what-we-do/lng-natural-gas
International Energy Agency (IEA) (2016). World Energy Outlook, Energy Information Administration.
International Energy Agency (IEA) (2016). Key world energy statistics
J.Henderson, S. Pirani (2008). The-russian-gas-matrix-how-markets-are-driving-change, OIES,
http://www.oxfordenergy.org/shop/
John Simpson (2009). Spot Natural Gas Prices: A Theoretical Party to Party Bargaining Framework; Asian
Social Science (Vol.5, No. 10, www.ccsenet.org/journal.html
Jonathan Stern and Howard Rogers (2013). The Pricing of Internationally Traded Gas: the search for new
fundamentals. IEEJ, March 2013
Jonathan Stern (2013). International gas pricing in Europe and Asia: A crisis of fundamentals ☆ Energy
Policy, Volume 64, January 2014, Pages 43-48
Jonathan Stern (2016). The new Japanese LNG strategy: a major step towards hub-based gas pricing in Asia,
Oxford Institute for Energy Studies, OXFORD ENERGY COMMENT, June 2016
Ken Koyama (2012). An Analysis on Asian Premium for LNG Price, IEEJ: March 2012
Kenneth Barry Medlock III (2012). Modelling the implications of expanded US shale gas production, Energy
Strategy Reviews, Volume 1, Issue 1, March 2012, Pages 33-41 (https://doi.org/10.1016/j.esr.2011.12.002)
Ken Koyama (2015). Time Lag between Crude Oil and LNG Price Movements, IEEJ October 2015
Kenneth B. Medlock III (2014). Natural Gas Price in Asia: What to Expect and What It Means: James A.
Baker III Institute for public Policy, Rice University
Mark Agerton (2014). Global LNG Pricing Terms and Revisions: An Empirical Analysis; James A. Baker III
Institute for public Policy, Rice University
Nhu Che, Tom Kompas (2014). The Structure and Dynamics of Liquefied Natural Gas Pricing in Asia and the
Pacific and implications for Australia; Crawford School of Public Policy, The Australian National University,
Crawford School Research Paper No. 14-09, November 2014
PEARSON Andrew & ROS Thierry (2011). High oil price triggers LNG bargain hunt. Petroleum Economist.
Mar 2011, Vol. 78 Issue 2, p26-26.
Péter Erdős (2012). Have oil and gas prices got separated?, Energy Policy, Volume 49, October 2012, Pages
707-718 (https://doi.org/10.1016/j.enpol.2012.07.022)

International Journal of Academic Research [ISSN: 2075-4124]
Vol. 5. Issue 6. & pp.364-383, 2017, www.ijarsite.com
________________________________________________________________________________________
383
Seksun Moryadee, Steven A. Gabriel, Hakob G. Avetisyan (2014). Investigating the potential effects of U.S.
LNG exports on global natural gas markets, Energy Strategy Reviews, Volume 2, Issues 3–4, February 2014
Shale-gas LNG offers price evolution, not revolution, Petroleum Economist. Jun 2013, Vol. 80 Issue 5, p28-
28. 1p.
Takeo Kumagai, Eriko Amaha, Jonty Rushforth, Shelley Kerr (2016). Japan’s Oil and LNG Price Evolution,
On the Path to Transparency, S&P Global Platts, SEPTEMBER 2016
UNCTAD/Rmt/2016, United Nations Publication, Review Of Maritime Transport 2016
www.bloomberg.com
www.cedigaz.com
www.PLATTS.com
Data in the this Dissertation work is sourced from a variety of public and private domains, including the BP
Statistical Review of World Energy, Cedigaz, the International Energy Agency (IEA), the Oxford Institute
for Energy Studies (OIES), the US Energy Information Agency (EIA), the US Department of Energy
(DOE), company reports and announcements.