Embed Size (px)
Citation preview
Advanced Steel Construction – Vol. 15 No. 4 (2019) 386-397
DOI: 10.18057/IJASC.2019.15.4.9
386
STUDY OF SEISMIC RESISTANCE OF KIEWIT-8 DOME CONSIDERING
KEY STRUCTURAL DESIGN PARAMETERS
Ming Zhang1, *, Yao-Peng Liu2, Zhi-Xiang Yu1 and Gerry Parke3
1 School of Civil Engineering, Southwest Jiaotong University, Chengdu 610031, China (corresponding author)
2 Department of Civil and Environmental Engineering, The Kong Kong Polytechnic University, Hong Kong, China
3 Department of Civil and Environmental Engineering, University of Surrey, Guildford, Surrey GU2 7XH, UK
* (Corresponding author: E-mail: [email protected])
A B S T R A C T A R T I C L E H I S T O R Y
A new seismic failure criterion is proposed for the Kiewit-8 (K8) dome subjected to earthquakes based on key structural
parameters. Firstly, the K8 dome models were built in the finite-element package ANSYS after considering the key struc-
tural design parameters. Secondly, the incremental dynamic analysis was undertaken resulting in a typical structural dam-
age index Ds. These were introduced to undertake the nonlinear dynamic response history analyses at each increased level
of seismic records intensity and permitted the calculation of collapse loads of domes. Three hundred three -dimensional
seismic records based on the main influential factors of ground motion were selected as input seismic waves. Thirdly, the
lognormal distribution was selected to appraise collapse loads to gain the dynamic collapse fragility curves for domes
after comparing three maximum likelihoods. Then, the lower bound collapse loads with 95% probability of non-exceed-
ance changing with structural parameters were determined. Finally, relationships between lower bound collapse loads and
five key structural parameters were separated out by using numerical matching methods, followed by a new seismic failure
criterion for all the relationships including the five key structural parameters and a safety factor of 1.5. The new seismic
failure criterion will contribute to the safe design and construction of these excellent space structures worldwide, particu-
larly in the countries which are prone to earthquakes.
Received: 22 April 2019
Revised: 12 August 2019
Accepted: 15 August 2019
K E Y W O R D S
Domes;
New seismic failure criterion;
Collapse loads;
Key structural parameters;
95% probability of non-exceed-
ance
Copyright © 2019 by The Hong Kong Institute of Steel Construction. All rights reserved.
1. Introduction
Single-layer domes are adopted worldwidely as long-span roofs in recent dec-
ades [1-3] because of their advantages, such as their good aesthetic appearance,
large space coverage capability and sound structural performance. Current re-
search work is mainly focused on the structural response [4-10], collapse [11-
13] of the steel structure under different loads through experiment and numeri-
cal simulation analysis [14-18], considering stability and buckling [19-22].
Only few reports have investigated the structural dynamic failure modes [17, 19,
23, 24] and the seismic failure loads when the single-layer reticulated shells are
subject to earthquakes. Especially in countries prone to earthquakes (or tremor),
design methods considering not only static but also dynamic behavior are re-
quired. In the technical manual for designing and analyzing the space structures
[25], the maximum displacement is restricted to 1/400 of the shortest span of
the single-layer domes under the action of static loads and frequent tremors. But
there are no design guidelines at present to deal with the design of single-layer
domes subjected to severe tremors. Currently, the design process for single-
layer domes under strong earthquakes are mainly referring to general steel struc-
ture guidelines and the engineer’s experience [26-28]. In these circumstances,
Zhi [23] empirically proposed two different criteria for predicting the failure
loads of Kiewit-8 (K8) domes and cylindrical reticulated shells by determining
the maximum nodal displacement and structural plastic deformation. However,
the existing dynamic criteria need to be determined by undertaking a series of
numerical analyses using finite element software, which is complicated and time
consuming for the structural engineer. Therefore, there is a need to develop a
systematic, practical and fast method to estimate the limit load of these shell
structures.
In this paper, typical single-layer dome models of the K8 domes [23] were
built in the finite-element package ANSYS [29]. This was undertaken after con-
sidering key structural factors, which have a great effect on the dynamic
failure loads of these kind of structures. Secondly, an incremental dynamic anal-
ysis (IDA) [30] with a typical structural damage index Ds [23] were used to
conduct nonlinear dynamic response history analyses (RHAs) at each
increased level of seismic records intensity. This was used to determine
the collapse loads of the domes whose failure modes were dynamic strength
failure. For considering the action of the properties of earthquake waves on the
failure loads, three hundred three-dimensional seismic records from the data-
base of the COSMOS [31] on the basis of the main influential factors of
ground motion, such as earthquake magnitude, distance, focal mechanism
and site class, were selected as input seismic waves to obtain collapse fragility
curves for the domes. Thirdly, the lognormal distribution [32] was selected to
fit the collapse loads to obtain the collapse fragility curves for the domes under
the action of seismic waves after comparing the results from lognormal, Weibull
[33], and Gamma distributions [34, 35]. The lower bound collapse loads with
95% probability of non-exceedance [28, 36-38] changing with structural roof
weights, spans, rise to span ratios and tube sections were determined based on
the collapse fragility curves. Finally, relationships between the lower bound col-
lapse loads and five key structural design parameters were separately selected
out by numerical matching methods, followed by a new seismic failure criterion,
a general equation, for all the relationships including the five key structural pa-
rameters and a safety factor of 1.5 [39]. The reason for the relatively higher
safety factor is that the value of the statistical life [40-42] is significantly higher
comparing with the cost of dome construction, which could increase the safety
of the dome structures and reduce the risk of death.
2. Factors to be considered in the ultimate load evaluation and the dome
models
2.1 Factors
The domes should be safely and properly designed not to buckle or collapse
under design loads. The calculation of the critical load corresponding to the
collapse stage under the action of earthquakes should consider several factors,
such as membrane action, structural configuration, boundary conditions,
materials, members, nodes, connections between members and nodes,
geometric imperfections, load distribution, peak ground motion and the duration
as well as the frequency of the ground motions. The following gives a short
explanation of the key factors considered in the ultimate load evaluation.
The membrane action is the membrane stresses prevailing in the shell-like
structures. The domes generally resist external loads through membrane action
with relatively low bending moments, in a similar way to continuous shells.
Accordingly, the K8 domes used in this paper were designed and modeled as
thin shell-like forms. To comply with this assumption, the shape and boundary
conditions should be compatible with the membrane action, leading to a state of
small bending moments. In these types of thin structures, appropriate measures
are required for avoiding shell-like collapse.
The support types greatly influence the behaviour of the domes. In general,
the buckling failure load or collapse load is higher in the case of pin-support
where the supports are fixed against translation but free for rotation, than in the
case of simple-support where the supports are fixed against only vertical
translation. The failure load is higher in the case of simple-support conditions
than that in the case of free edges if the form and members are the same for each
particular dome.
The members used in the reticulated shell were considered to be fabricated
from high strength, ductile steel. The ultimate load should be evaluated taking
into consideration the effects of Young’s modulus, yield stress, and residual
Ming Zhang et al. 387
stress in the fabricated members.
The members and nodes are the fundamental elements of domes. The
member slenderness ratio, subtended half angle and the arrangement of
members are regarded as the key factors for the ultimate load of the dome.
The connection between members mainly refers to the rigidity and strength
provided at the connections. It is well known that when the bending stiffness at
a connection is high enough, the ultimate loads can be increased on account of
the full rigidity at the connection, while the ultimate load will be reduced if the
joint rigidity is low.
Geometric imperfections are classified roughly into global geometrical
imperfections associated with nodal deviations and member crookedness. In the
case of the domes, the geometric imperfections should be considered when
evaluating ultimate loads, and the magnitude of real imperfections should be as
small as possible.
The load distribution includes uniform loads, asymmetric snow
accumulation, and combined loads of uniform and concentrated areas over a
local region.
The peak ground motion and the duration, as well as the frequency, are the
three fundamental parameters of ground motions. All of them can change the
ultimate load of the domes subjected to earthquakes.
2.2. Single-layer dome models
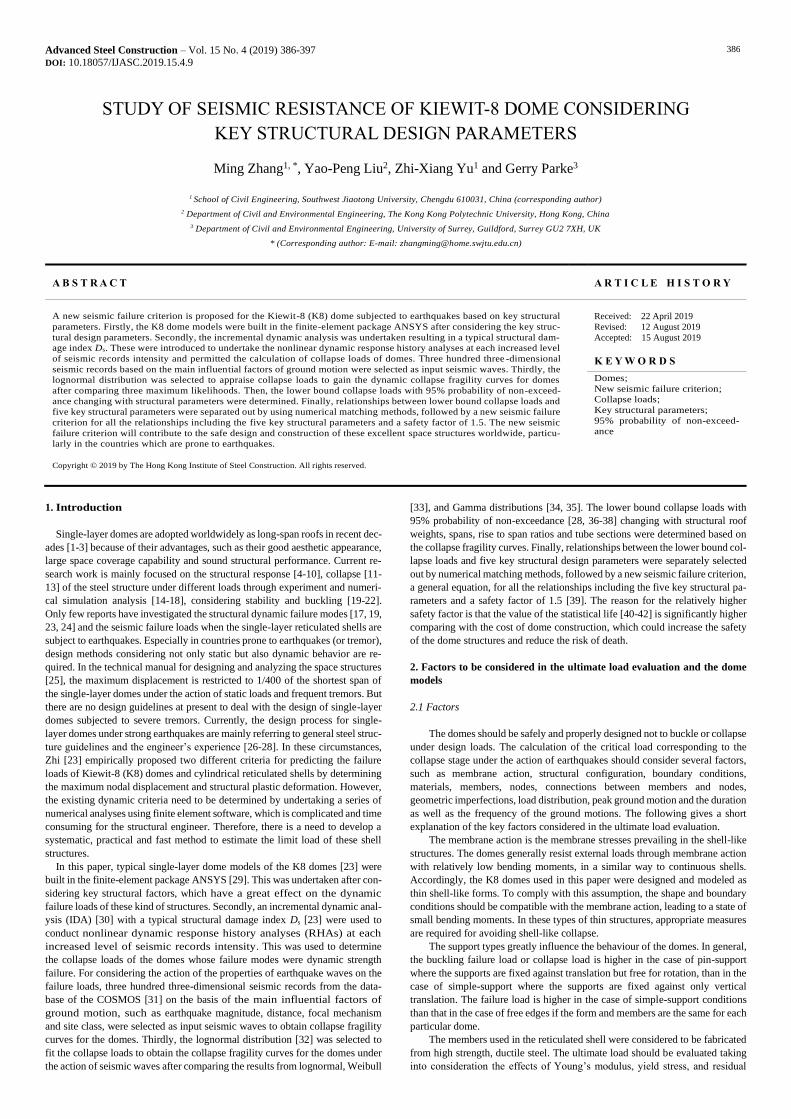
In view of the above factors, the K8 dome [23] and its classification, the
members and the material of the members are presented in Figs 1a, b, c and d,
respectively. The RHAs was carried out for the dome models with all the sup-
ports fixed against translation but free for rotation. The joints between the mem-
bers were taken as rigid, which is in accordance with most of the constructed
structures. The span L and rise f could control the shape of the dome. The
PIPE20 [29] element was chosen to simulate the structural members which yield
stress and Young’s modulus are 235 MPa and 2.06×10⁵ MPa, respectively. The
bilinear isotropic hardening model for all of the elements was adopted. The roof
weight including cladding is equivalent to the surface area supported and the
lumped masses applied to the nodes are described by the point elements
MASS21 [29]. The dead load distributions are all uniform loads for all domes
selected in this paper. Rayleigh damping was assumed here, whose damping
ratio was empirically set to be 0.02. The consistent mode imperfection method
was adopted to consider the geometric imperfections referring to the technical
manual [25], and the maximum value of the consistent mode was 1/300 of the
span L. Other parameters of the selected domes were designed to meet the tech-
nical manual [25], such as tube slenderness ratio, subtended half angle and the
arrangement of members. The basic configurations of the domes are listed in
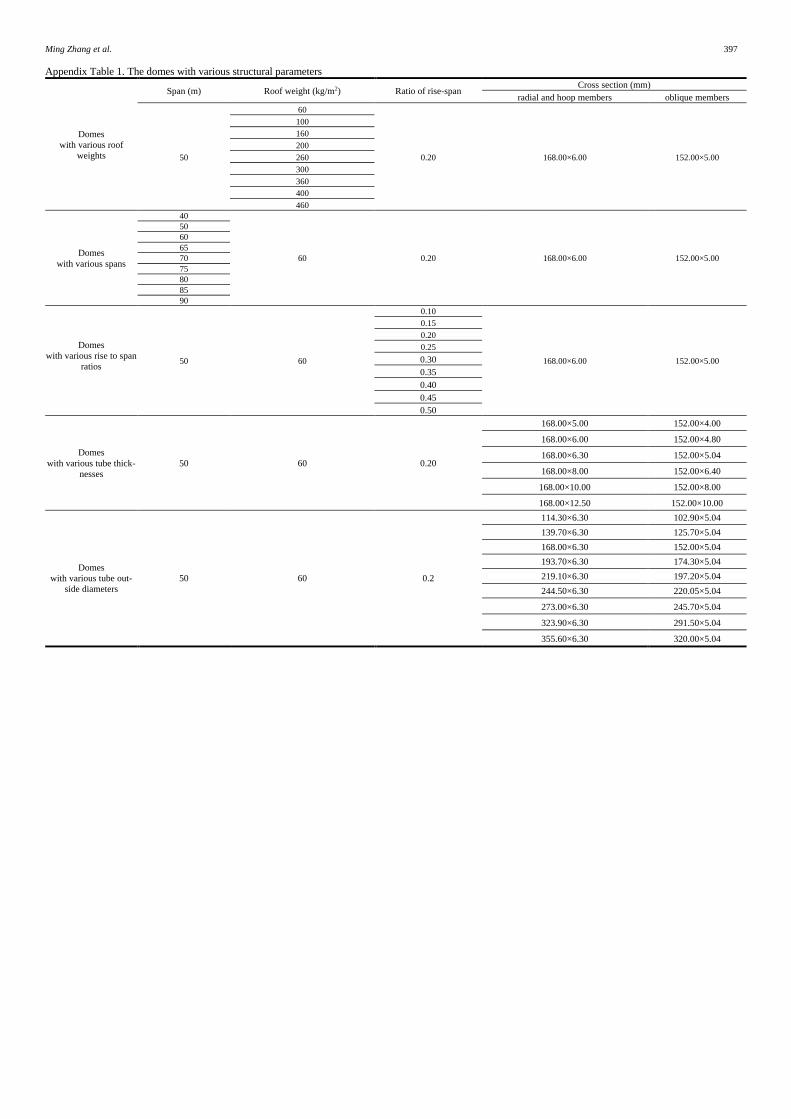
Table 1, other cases with changed parameters complying with the basic config-
urations, such as different uniform roof weight, spans, rise to span ratios and
cross sections, are shown in Appendix Table 1.
D 40 20 3
Dome
Span (m)
Roof weight (×10kg/m2)
Reciprocal of
rise-span ratio
(a) The dome (b) Classification of the domes
(c) The PIPE20 geometry [29] (d) The material of the members
Fig. 1. The K8 dome system
The pipe20 [29] element can resist axial force, bending moment, shear, torque,
etc. Meanwhile, the element has plastic, creep and swelling capabilities, and by
using it, it is possible to output nodal displacements (including the nodal dis-
placements in three directions at a node), member forces for nodes, shear strains,
strain energy, and so on. In addition, there were eight integration points distrib-
uted uniformly around the cross-section of the pipe20 element presented in
Fig.1c, which can output all the data information mentioned above.
Table 1
Labels and parameters of the K8 system
Dome label Span (m) Roof weight
including cladding (kg/m2) Rise to span ratio
Cross section (mm)
radial and hoop members oblique members
D40203 40 200 1/3 146×5 140×6
D40205 40 200 1/5 146×5 140×6
D40207 40 200 1/7 146×5 140×6
D50063 50 60 1/3 168×6 152×5
D50065 50 60 1/5 168×6 152×5
D50067 50 60 1/7 168×6 152×5
D60063 60 60 1/3 194×6 168×6
D60065 60 60 1/5 194×6 168×6
D60067 60 60 1/7 194×6 168×6
Ming Zhang et al. 388
3. The failure load (PGA), seismic records, and the lower bound failure load
as well as its safety factor
3.1. The failure loads (PGA) of the domes
To obtain the collapse load of these structures, Ibarra and Krawinkler [43, 44]
proposed using IDA method [30] to estimate the collapse load of the selected
dome for each seismic record. Obtaining the dynamic collapse loads is a time-
consuming job. In this study, the collapse states of the dome include dynamic
instability and dynamic strength failure according to the definition of Zhi [23].
It is easy to judge the failure modes and failure loads for the dynamic instability
as described in the literature [23]. However, it is difficult to discriminate its
failure mode accurately for the dynamic strength failure because of the terrible
plastic deformation and overall displacements before structures topple down.
Here a failure criterion proposed in literature [23] is used to calculate failure
loads of the domes whose failure modes are dynamic strength failure. The equa-
tion of the index Ds can be defined as:
2 2 2 2e as 1p 8p
u
3.2 ( ) 100 ( ) ( ) D DHD R R
L L
−= + + +
(1)
where Ds is the structural damage index; H and L are the height and span of the
dome, respectively; D refers to the nodal displacement, whose value is the larg-
est comparing with other nodes in the selected dome; De accounts for the largest
elastic displacement before entering plastic state; εa means the average strain for
the global dome; εu equals the strain of steel when the failure occurred; R1p and
R8p are the plastic ratios of the members.
3.2. The seismic records
It is known to all that all the information contained in the seismic records,
such as PGAs, durations and frequencies, can affect the structural dynamic re-
sponse. In order to consider these factors as far as possible, three hundred seis-
mic records from the database of the COSMOS [31] were selected as input seis-
mic waves. In this paper, three hundred three-dimensional seismic records were
selected from seven earthquakes on the basis of the main influential factors
of ground motion mentioned above. The ratio of the PGAs along the three
directions, X, Y and Z, was modulated into 1: 0.85 : 0.65 for all the seismic
waves according to the technical manual [25], and the 90% energy duration Td
(Td = T2 - T1, △E = E(T2) - E(T1) = 90% Ea, where Ea is the total energy) was
adopted to calculate the durations of the input seismic waves.
3.3. Three probability distributions and the lower bound collapse load of the
dome
Here, three hundred seismic records were selected to obtain the failure fragil-
ity curve based on three probability distributions, namely lognormal, Weibull
and Gamma distributions, whose PDF and CDF are given by [32 - 35], presented
in Eq. (2) – Eq. (8):
( )2
2
ln1( ) exp
22X
xf x
x
−= −
(2)
ln( )X
xF x
− =
(3)
1
exp 0( ; , )
0 <0
k kk x x
xf x k
x
− − =
(4)
1 exp 0( ; , )
0 <0
kx
xF x k
x
− − =
(5)
( )
1
( ; , ) for >0 and , >0
x
k
k
x ef x k x k
k
−−
=
(7)
( )( )0
,
( ; , ) ; ,x
xk
F x k f u k duk
= =
(8)
where fX(x) and FX(x) denote the PDF and CDF of the Lognormal distribution,
X is the log-normally distributed random variable, x is the failure load PGA, μ
and σ account for the mean value and standard deviation, Ф is the CDF of the
standard normal distribution; f(x; λ, k) and F(x; λ, k) are the PDF and CDF of
the Weibull distribution, k > 0 and λ > 0 refer to the shape parameter and the
scale parameter; f(x; k, θ) and F(x; k, θ) equal the PDF and CDF of the Gamma
distribution.
In addition, in this paper the Kolmogorov-Smirnov test [34, 35] was used to
calculate the confidence level for the three probability distributions. It quantifi-
cationally analyzes the deviations between the hypothesized CDF FX(x) and the
measured cumulative histogram, which can be given by
( )( ) ( )( ) ( )( )*
1 1D max max
n ni i i
X Xi i
iF X F X F X
n= =
= − = −
(9)
where X(i) is the ith largest observed value in the random sample of size n.
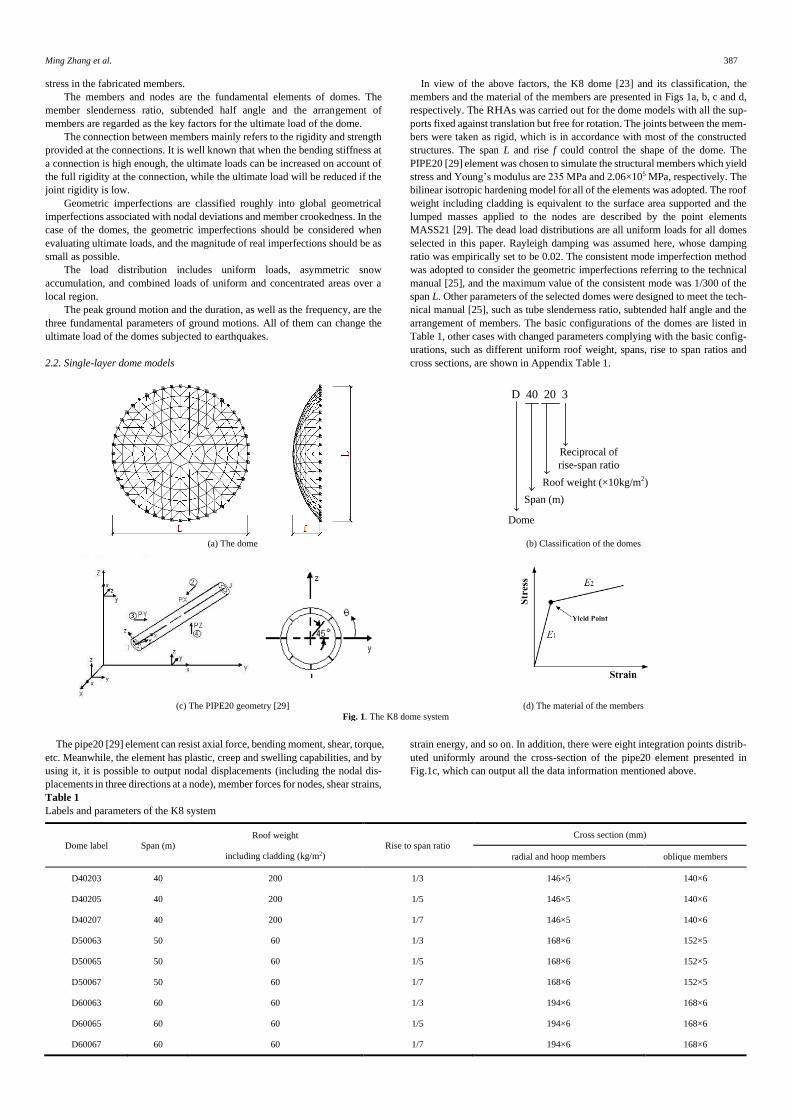
After this, the PDF and CDF for the collapse loads of D40205 under the ac-
tion of the three hundred ground motions are presented in Fig. 2 that have been
fitted to the simulation results by lognormal, Weibull, and Gamma method. It
can be seen from Fig. 2 that the lognormal distribution is the best fit to the dy-
namic failure loads and approximately satisfies the above test method with 95%
confidence interval in agreement with these figures in Zhong’s doctoral disser-
tation [45]. Hence, the lognormal distribution will be adopted to analyzing the
dynamic failure fragility curves in this paper. The dome D40205 has a median
dynamic failure load of 22.10m/s2, whose logarithmic standard deviation is
0.2084. This dispersion only considered the uncertainty of ground motion, not
included modeling uncertainty.
In practical engineering, a 95% probability of non-exceedance [28, 52, 36,
37] was the most commonly used to obtain a design value with credible and
confidence intervals. In this paper the 95% confidence limit was also adopted
to discriminate the lower bound collapse loads for domes subjected to the se-
lected seismic records. In other words, the structural collapse loads for all the
selected seismic waves would be larger than the lower bound collapse loads
with 95% probability.
Fig. 2 The distributions for D40205 subjected to different seismic records
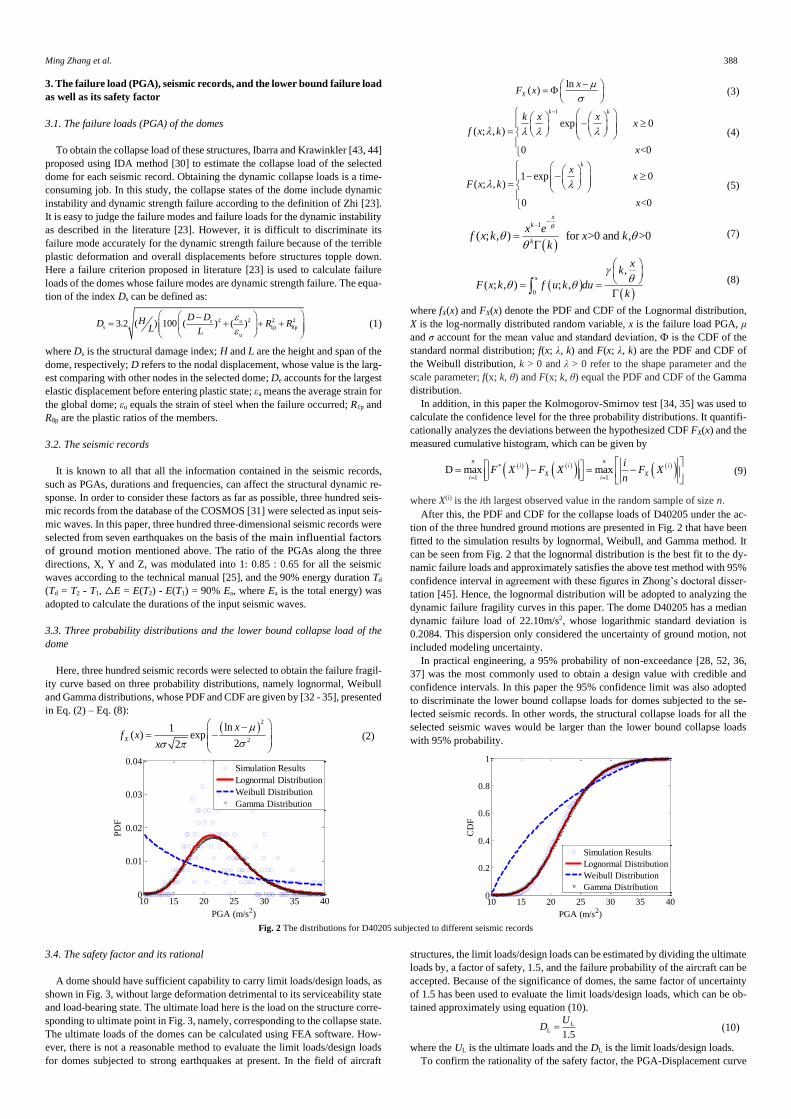
3.4. The safety factor and its rational
A dome should have sufficient capability to carry limit loads/design loads, as
shown in Fig. 3, without large deformation detrimental to its serviceability state
and load-bearing state. The ultimate load here is the load on the structure corre-
sponding to ultimate point in Fig. 3, namely, corresponding to the collapse state.
The ultimate loads of the domes can be calculated using FEA software. How-
ever, there is not a reasonable method to evaluate the limit loads/design loads
for domes subjected to strong earthquakes at present. In the field of aircraft
structures, the limit loads/design loads can be estimated by dividing the ultimate
loads by, a factor of safety, 1.5, and the failure probability of the aircraft can be
accepted. Because of the significance of domes, the same factor of uncertainty
of 1.5 has been used to evaluate the limit loads/design loads, which can be ob-
tained approximately using equation (10).
LL
1.5
UD =
(10)
where the UL is the ultimate loads and the DL is the limit loads/design loads.
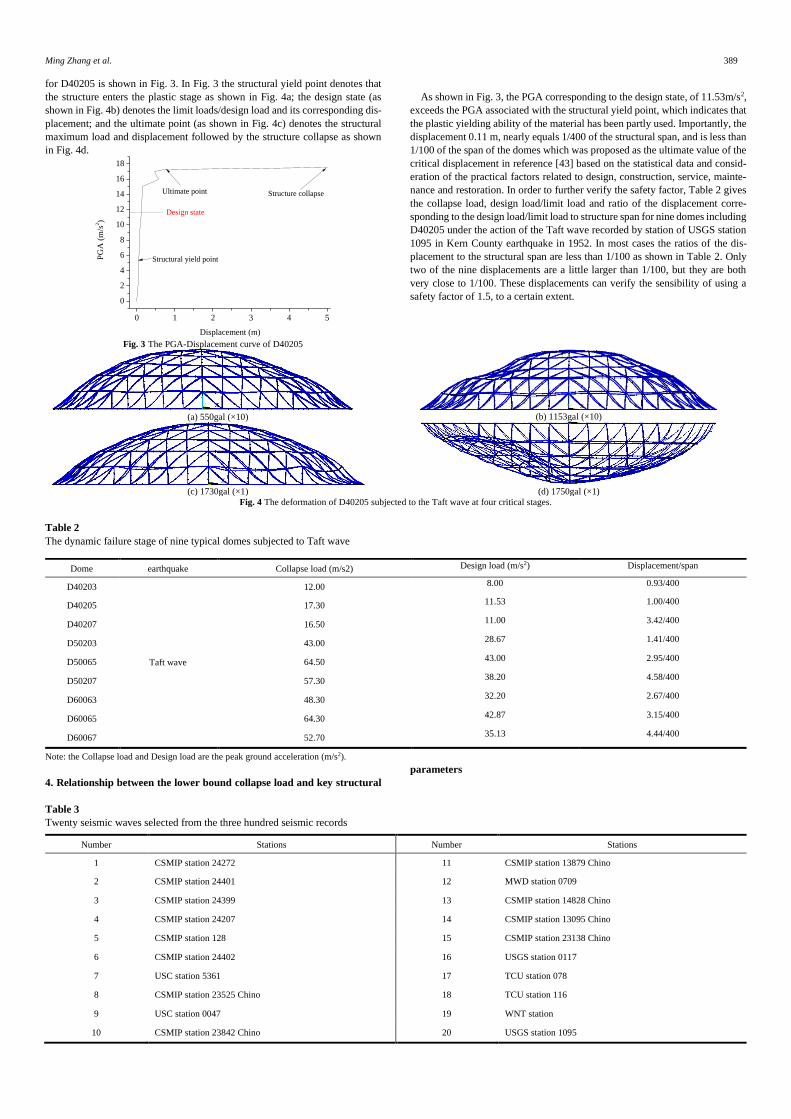
To confirm the rationality of the safety factor, the PGA-Displacement curve
10 15 20 25 30 35 400
0.01
0.02
0.03
0.04
PGA (m/s2)
PD
F
Simulation Results
Lognormal Distribution
Weibull Distribution
Gamma Distribution
10 15 20 25 30 35 400
0.2
0.4
0.6
0.8
1
PGA (m/s2)
CD
F
Simulation Results
Lognormal Distribution
Weibull Distribution
Gamma Distribution
Ming Zhang et al. 389
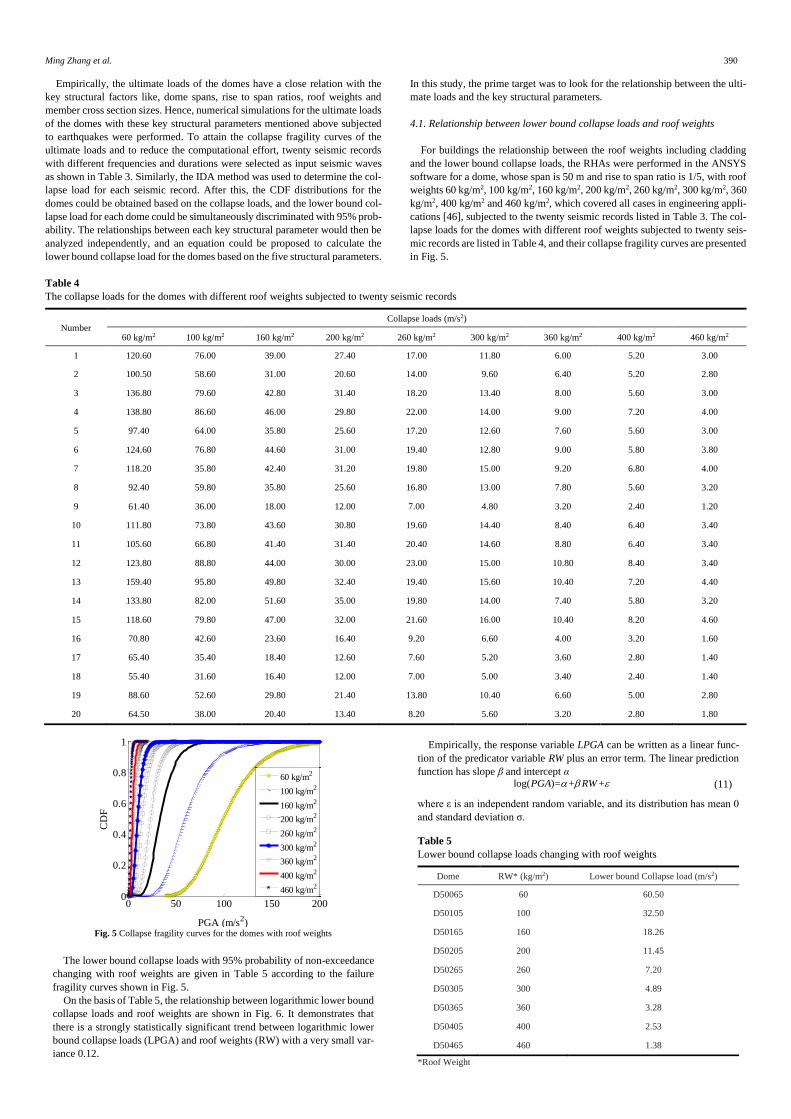
for D40205 is shown in Fig. 3. In Fig. 3 the structural yield point denotes that
the structure enters the plastic stage as shown in Fig. 4a; the design state (as
shown in Fig. 4b) denotes the limit loads/design load and its corresponding dis-
placement; and the ultimate point (as shown in Fig. 4c) denotes the structural
maximum load and displacement followed by the structure collapse as shown
in Fig. 4d.
0 1 2 3 4 5
0
2
4
6
8
10
12
14
16
18
PG
A (
m/s
2)
Displacement (m)
Structural yield point
Ultimate point Structure collapse
Design state
Fig. 3 The PGA-Displacement curve of D40205
As shown in Fig. 3, the PGA corresponding to the design state, of 11.53m/s2,
exceeds the PGA associated with the structural yield point, which indicates that
the plastic yielding ability of the material has been partly used. Importantly, the
displacement 0.11 m, nearly equals 1/400 of the structural span, and is less than
1/100 of the span of the domes which was proposed as the ultimate value of the
critical displacement in reference [43] based on the statistical data and consid-
eration of the practical factors related to design, construction, service, mainte-
nance and restoration. In order to further verify the safety factor, Table 2 gives
the collapse load, design load/limit load and ratio of the displacement corre-
sponding to the design load/limit load to structure span for nine domes including
D40205 under the action of the Taft wave recorded by station of USGS station
1095 in Kern County earthquake in 1952. In most cases the ratios of the dis-
placement to the structural span are less than 1/100 as shown in Table 2. Only
two of the nine displacements are a little larger than 1/100, but they are both
very close to 1/100. These displacements can verify the sensibility of using a
safety factor of 1.5, to a certain extent.
(a) 550gal (×10)
(b) 1153gal (×10)
(c) 1730gal (×1)
(d) 1750gal (×1)
Fig. 4 The deformation of D40205 subjected to the Taft wave at four critical stages.
Table 2
The dynamic failure stage of nine typical domes subjected to Taft wave
Note: the Collapse load and Design load are the peak ground acceleration (m/s2).
4. Relationship between the lower bound collapse load and key structural
parameters
Table 3
Twenty seismic waves selected from the three hundred seismic records
Number Stations Number Stations
1 CSMIP station 24272 11 CSMIP station 13879 Chino
2 CSMIP station 24401 12 MWD station 0709
3 CSMIP station 24399 13 CSMIP station 14828 Chino
4 CSMIP station 24207 14 CSMIP station 13095 Chino
5 CSMIP station 128 15 CSMIP station 23138 Chino
6 CSMIP station 24402 16 USGS station 0117
7 USC station 5361 17 TCU station 078
8 CSMIP station 23525 Chino 18 TCU station 116
9 USC station 0047 19 WNT station
10 CSMIP station 23842 Chino 20 USGS station 1095
Dome earthquake Collapse load (m/s2) Design load (m/s2) Displacement/span
D40203
Taft wave
12.00 8.00 0.93/400
D40205 17.30 11.53 1.00/400
D40207 16.50 11.00 3.42/400
D50203 43.00 28.67 1.41/400
D50065 64.50 43.00 2.95/400
D50207 57.30 38.20 4.58/400
D60063 48.30 32.20 2.67/400
D60065 64.30 42.87 3.15/400
D60067 52.70 35.13 4.44/400
Ming Zhang et al. 390
Empirically, the ultimate loads of the domes have a close relation with the
key structural factors like, dome spans, rise to span ratios, roof weights and
member cross section sizes. Hence, numerical simulations for the ultimate loads
of the domes with these key structural parameters mentioned above subjected
to earthquakes were performed. To attain the collapse fragility curves of the
ultimate loads and to reduce the computational effort, twenty seismic records
with different frequencies and durations were selected as input seismic waves
as shown in Table 3. Similarly, the IDA method was used to determine the col-
lapse load for each seismic record. After this, the CDF distributions for the
domes could be obtained based on the collapse loads, and the lower bound col-
lapse load for each dome could be simultaneously discriminated with 95% prob-
ability. The relationships between each key structural parameter would then be
analyzed independently, and an equation could be proposed to calculate the
lower bound collapse load for the domes based on the five structural parameters.
In this study, the prime target was to look for the relationship between the ulti-
mate loads and the key structural parameters.
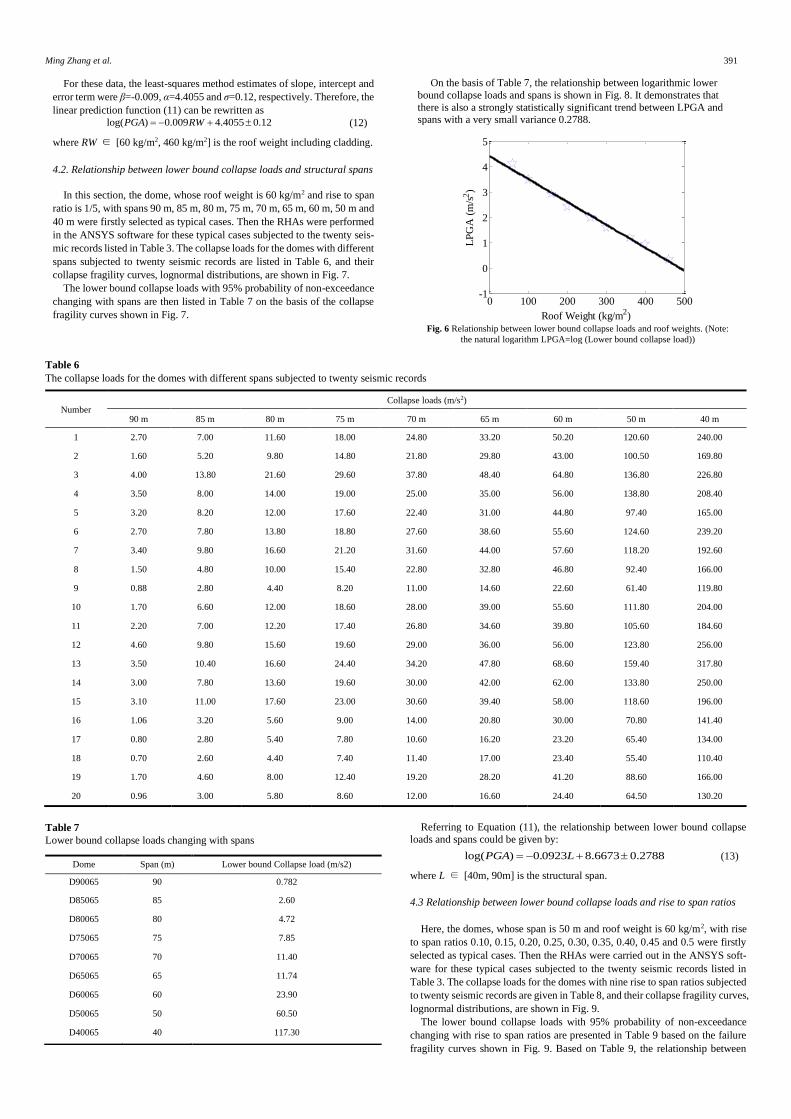
4.1. Relationship between lower bound collapse loads and roof weights
For buildings the relationship between the roof weights including cladding
and the lower bound collapse loads, the RHAs were performed in the ANSYS
software for a dome, whose span is 50 m and rise to span ratio is 1/5, with roof
weights 60 kg/m2, 100 kg/m2, 160 kg/m2, 200 kg/m2, 260 kg/m2, 300 kg/m2, 360
kg/m2, 400 kg/m2 and 460 kg/m2, which covered all cases in engineering appli-
cations [46], subjected to the twenty seismic records listed in Table 3. The col-
lapse loads for the domes with different roof weights subjected to twenty seis-
mic records are listed in Table 4, and their collapse fragility curves are presented
in Fig. 5.
Table 4
The collapse loads for the domes with different roof weights subjected to twenty seismic records
Number Collapse loads (m/s2)
60 kg/m2 100 kg/m2 160 kg/m2 200 kg/m2 260 kg/m2 300 kg/m2 360 kg/m2 400 kg/m2 460 kg/m2
1 120.60 76.00 39.00 27.40 17.00 11.80 6.00 5.20 3.00
2 100.50 58.60 31.00 20.60 14.00 9.60 6.40 5.20 2.80
3 136.80 79.60 42.80 31.40 18.20 13.40 8.00 5.60 3.00
4 138.80 86.60 46.00 29.80 22.00 14.00 9.00 7.20 4.00
5 97.40 64.00 35.80 25.60 17.20 12.60 7.60 5.60 3.00
6 124.60 76.80 44.60 31.00 19.40 12.80 9.00 5.80 3.80
7 118.20 35.80 42.40 31.20 19.80 15.00 9.20 6.80 4.00
8 92.40 59.80 35.80 25.60 16.80 13.00 7.80 5.60 3.20
9 61.40 36.00 18.00 12.00 7.00 4.80 3.20 2.40 1.20
10 111.80 73.80 43.60 30.80 19.60 14.40 8.40 6.40 3.40
11 105.60 66.80 41.40 31.40 20.40 14.60 8.80 6.40 3.40
12 123.80 88.80 44.00 30.00 23.00 15.00 10.80 8.40 3.40
13 159.40 95.80 49.80 32.40 19.40 15.60 10.40 7.20 4.40
14 133.80 82.00 51.60 35.00 19.80 14.00 7.40 5.80 3.20
15 118.60 79.80 47.00 32.00 21.60 16.00 10.40 8.20 4.60
16 70.80 42.60 23.60 16.40 9.20 6.60 4.00 3.20 1.60
17 65.40 35.40 18.40 12.60 7.60 5.20 3.60 2.80 1.40
18 55.40 31.60 16.40 12.00 7.00 5.00 3.40 2.40 1.40
19 88.60 52.60 29.80 21.40 13.80 10.40 6.60 5.00 2.80
20 64.50 38.00 20.40 13.40 8.20 5.60 3.20 2.80 1.80
0 50 100 150 2000
0.2
0.4
0.6
0.8
1
PGA (m/s2)
CD
F
60 kg/m2
100 kg/m2
160 kg/m2
200 kg/m2
260 kg/m2
300 kg/m2
360 kg/m2
400 kg/m2
460 kg/m2
Fig. 5 Collapse fragility curves for the domes with roof weights
The lower bound collapse loads with 95% probability of non-exceedance
changing with roof weights are given in Table 5 according to the failure
fragility curves shown in Fig. 5.
On the basis of Table 5, the relationship between logarithmic lower bound
collapse loads and roof weights are shown in Fig. 6. It demonstrates that
there is a strongly statistically significant trend between logarithmic lower
bound collapse loads (LPGA) and roof weights (RW) with a very small var-
iance 0.12.
Empirically, the response variable LPGA can be written as a linear func-
tion of the predicator variable RW plus an error term. The linear prediction
function has slope β and intercept α log( )= + +PGA RW (11)
where ε is an independent random variable, and its distribution has mean 0
and standard deviation σ.
Table 5
Lower bound collapse loads changing with roof weights
Dome RW* (kg/m2) Lower bound Collapse load (m/s2)
D50065 60 60.50
D50105 100 32.50
D50165 160 18.26
D50205 200 11.45
D50265 260 7.20
D50305 300 4.89
D50365 360 3.28
D50405 400 2.53
D50465 460 1.38
*Roof Weight
Ming Zhang et al. 391
For these data, the least-squares method estimates of slope, intercept and
error term were β=-0.009, α=4.4055 and σ=0.12, respectively. Therefore, the
linear prediction function (11) can be rewritten as log( ) 0.009 4.4055 0.12PGA RW= − + (12)
where RW ∈ [60 kg/m2, 460 kg/m2] is the roof weight including cladding.
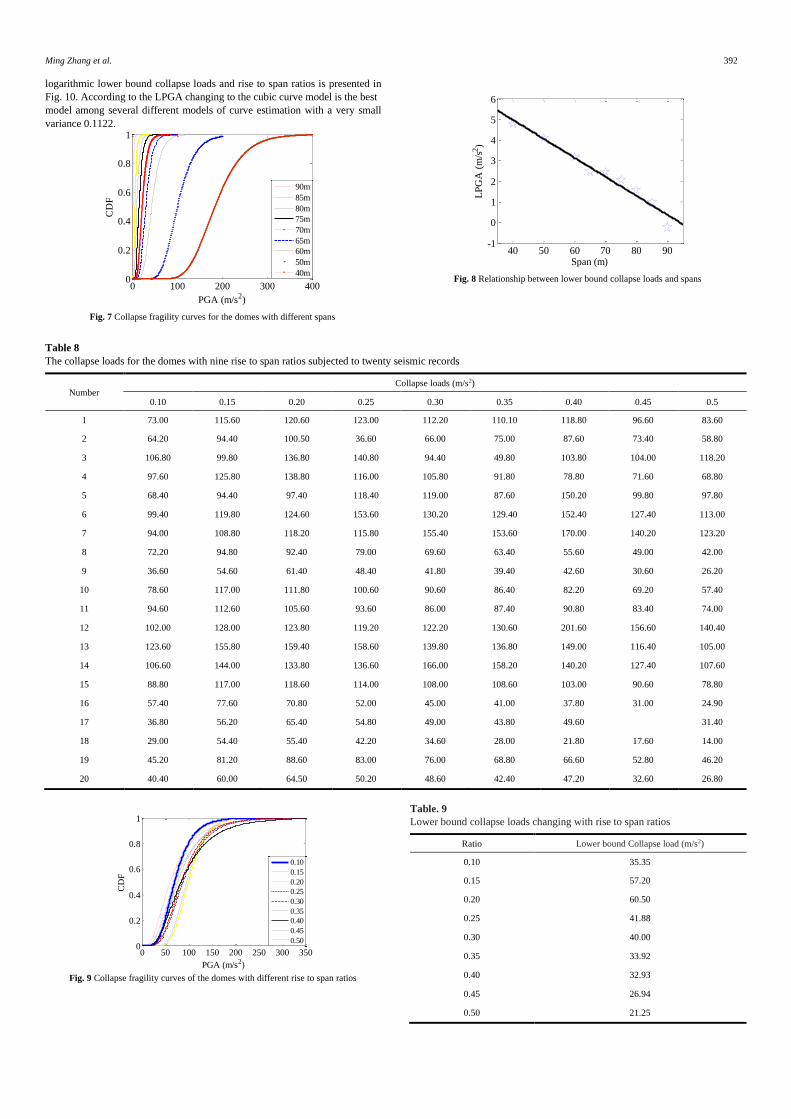
4.2. Relationship between lower bound collapse loads and structural spans
In this section, the dome, whose roof weight is 60 kg/m2 and rise to span
ratio is 1/5, with spans 90 m, 85 m, 80 m, 75 m, 70 m, 65 m, 60 m, 50 m and
40 m were firstly selected as typical cases. Then the RHAs were performed
in the ANSYS software for these typical cases subjected to the twenty seis-
mic records listed in Table 3. The collapse loads for the domes with different
spans subjected to twenty seismic records are listed in Table 6, and their
collapse fragility curves, lognormal distributions, are shown in Fig. 7.
The lower bound collapse loads with 95% probability of non-exceedance
changing with spans are then listed in Table 7 on the basis of the collapse
fragility curves shown in Fig. 7.
On the basis of Table 7, the relationship between logarithmic lower
bound collapse loads and spans is shown in Fig. 8. It demonstrates that
there is also a strongly statistically significant trend between LPGA and spans with a very small variance 0.2788.
0 100 200 300 400 500-1
0
1
2
3
4
5
Roof Weight (kg/m2)
LP
GA
(m
/s2)
Fig. 6 Relationship between lower bound collapse loads and roof weights. (Note:
the natural logarithm LPGA=log (Lower bound collapse load))
Table 6
The collapse loads for the domes with different spans subjected to twenty seismic records
Number Collapse loads (m/s2)
90 m 85 m 80 m 75 m 70 m 65 m 60 m 50 m 40 m
1 2.70 7.00 11.60 18.00 24.80 33.20 50.20 120.60 240.00
2 1.60 5.20 9.80 14.80 21.80 29.80 43.00 100.50 169.80
3 4.00 13.80 21.60 29.60 37.80 48.40 64.80 136.80 226.80
4 3.50 8.00 14.00 19.00 25.00 35.00 56.00 138.80 208.40
5 3.20 8.20 12.00 17.60 22.40 31.00 44.80 97.40 165.00
6 2.70 7.80 13.80 18.80 27.60 38.60 55.60 124.60 239.20
7 3.40 9.80 16.60 21.20 31.60 44.00 57.60 118.20 192.60
8 1.50 4.80 10.00 15.40 22.80 32.80 46.80 92.40 166.00
9 0.88 2.80 4.40 8.20 11.00 14.60 22.60 61.40 119.80
10 1.70 6.60 12.00 18.60 28.00 39.00 55.60 111.80 204.00
11 2.20 7.00 12.20 17.40 26.80 34.60 39.80 105.60 184.60
12 4.60 9.80 15.60 19.60 29.00 36.00 56.00 123.80 256.00
13 3.50 10.40 16.60 24.40 34.20 47.80 68.60 159.40 317.80
14 3.00 7.80 13.60 19.60 30.00 42.00 62.00 133.80 250.00
15 3.10 11.00 17.60 23.00 30.60 39.40 58.00 118.60 196.00
16 1.06 3.20 5.60 9.00 14.00 20.80 30.00 70.80 141.40
17 0.80 2.80 5.40 7.80 10.60 16.20 23.20 65.40 134.00
18 0.70 2.60 4.40 7.40 11.40 17.00 23.40 55.40 110.40
19 1.70 4.60 8.00 12.40 19.20 28.20 41.20 88.60 166.00
20 0.96 3.00 5.80 8.60 12.00 16.60 24.40 64.50 130.20
Table 7
Lower bound collapse loads changing with spans
Referring to Equation (11), the relationship between lower bound collapse
loads and spans could be given by:
where L ∈ [40m, 90m] is the structural span.
4.3 Relationship between lower bound collapse loads and rise to span ratios
Here, the domes, whose span is 50 m and roof weight is 60 kg/m2, with rise
to span ratios 0.10, 0.15, 0.20, 0.25, 0.30, 0.35, 0.40, 0.45 and 0.5 were firstly
selected as typical cases. Then the RHAs were carried out in the ANSYS soft-
ware for these typical cases subjected to the twenty seismic records listed in
Table 3. The collapse loads for the domes with nine rise to span ratios subjected
to twenty seismic records are given in Table 8, and their collapse fragility curves,
lognormal distributions, are shown in Fig. 9.
The lower bound collapse loads with 95% probability of non-exceedance
changing with rise to span ratios are presented in Table 9 based on the failure
fragility curves shown in Fig. 9. Based on Table 9, the relationship between
Dome Span (m) Lower bound Collapse load (m/s2)
D90065 90 0.782
D85065 85 2.60
D80065 80 4.72
D75065 75 7.85
D70065 70 11.40
D65065 65 11.74
D60065 60 23.90
D50065 50 60.50
D40065 40 117.30
log( ) 0.0923 8.6673 0.2788PGA L= − + (13)
Ming Zhang et al. 392
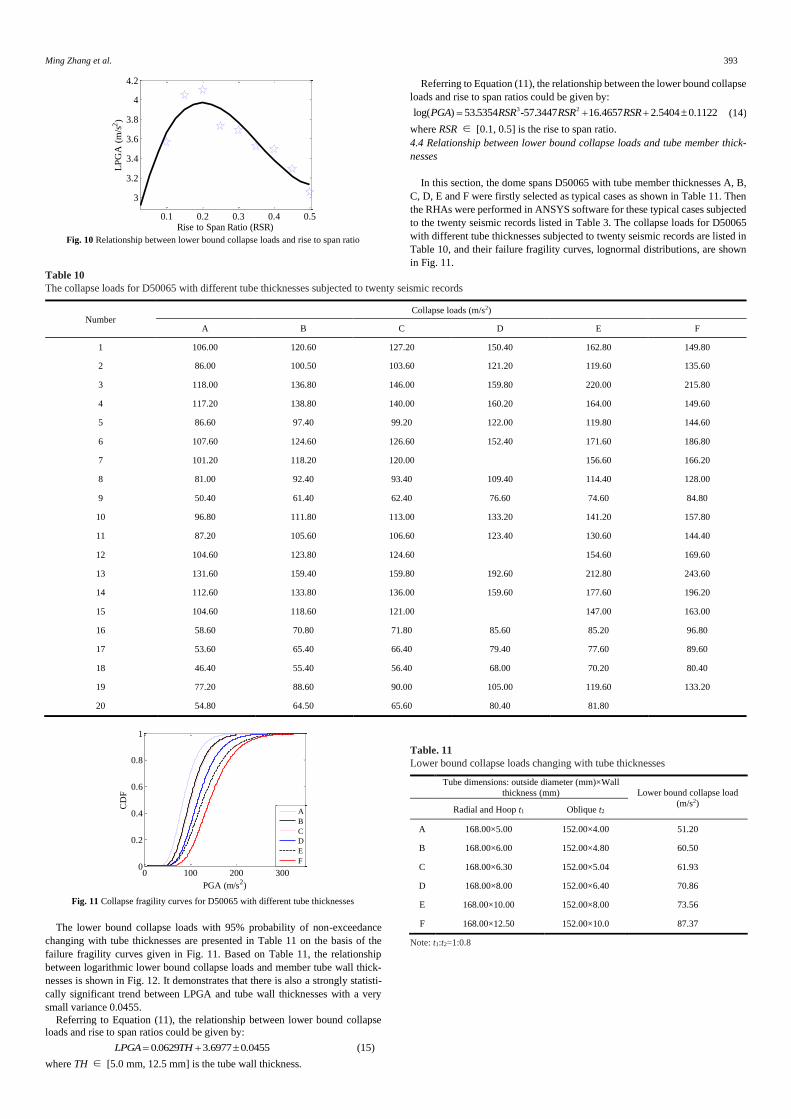
logarithmic lower bound collapse loads and rise to span ratios is presented in
Fig. 10. According to the LPGA changing to the cubic curve model is the best
model among several different models of curve estimation with a very small
variance 0.1122.
0 100 200 300 4000
0.2
0.4
0.6
0.8
1
PGA (m/s2)
CD
F
90m
85m
80m
75m
70m
65m
60m
50m
40m
Fig. 7 Collapse fragility curves for the domes with different spans
40 50 60 70 80 90-1
0
1
2
3
4
5
6
Span (m)
LP
GA
(m
/s2)
Fig. 8 Relationship between lower bound collapse loads and spans
Table 8
The collapse loads for the domes with nine rise to span ratios subjected to twenty seismic records
Number Collapse loads (m/s2)
0.10 0.15 0.20 0.25 0.30 0.35 0.40 0.45 0.5
1 73.00 115.60 120.60 123.00 112.20 110.10 118.80 96.60 83.60
2 64.20 94.40 100.50 36.60 66.00 75.00 87.60 73.40 58.80
3 106.80 99.80 136.80 140.80 94.40 49.80 103.80 104.00 118.20
4 97.60 125.80 138.80 116.00 105.80 91.80 78.80 71.60 68.80
5 68.40 94.40 97.40 118.40 119.00 87.60 150.20 99.80 97.80
6 99.40 119.80 124.60 153.60 130.20 129.40 152.40 127.40 113.00
7 94.00 108.80 118.20 115.80 155.40 153.60 170.00 140.20 123.20
8 72.20 94.80 92.40 79.00 69.60 63.40 55.60 49.00 42.00
9 36.60 54.60 61.40 48.40 41.80 39.40 42.60 30.60 26.20
10 78.60 117.00 111.80 100.60 90.60 86.40 82.20 69.20 57.40
11 94.60 112.60 105.60 93.60 86.00 87.40 90.80 83.40 74.00
12 102.00 128.00 123.80 119.20 122.20 130.60 201.60 156.60 140.40
13 123.60 155.80 159.40 158.60 139.80 136.80 149.00 116.40 105.00
14 106.60 144.00 133.80 136.60 166.00 158.20 140.20 127.40 107.60
15 88.80 117.00 118.60 114.00 108.00 108.60 103.00 90.60 78.80
16 57.40 77.60 70.80 52.00 45.00 41.00 37.80 31.00 24.90
17 36.80 56.20 65.40 54.80 49.00 43.80 49.60 31.40
18 29.00 54.40 55.40 42.20 34.60 28.00 21.80 17.60 14.00
19 45.20 81.20 88.60 83.00 76.00 68.80 66.60 52.80 46.20
20 40.40 60.00 64.50 50.20 48.60 42.40 47.20 32.60 26.80
0 50 100 150 200 250 300 3500
0.2
0.4
0.6
0.8
1
PGA (m/s2)
CD
F
0.10
0.15
0.20
0.25
0.30
0.35
0.40
0.45
0.50
Fig. 9 Collapse fragility curves of the domes with different rise to span ratios
Table. 9
Lower bound collapse loads changing with rise to span ratios
Ratio Lower bound Collapse load (m/s2)
0.10 35.35
0.15 57.20
0.20 60.50
0.25 41.88
0.30 40.00
0.35 33.92
0.40 32.93
0.45 26.94
0.50 21.25
Ming Zhang et al. 393
0.1 0.2 0.3 0.4 0.5
3
3.2
3.4
3.6
3.8
4
4.2
Rise to Span Ratio (RSR)
LP
GA
(m
/s2)
Fig. 10 Relationship between lower bound collapse loads and rise to span ratio
Referring to Equation (11), the relationship between the lower bound collapse
loads and rise to span ratios could be given by: 3 2log( ) 53.5354 -57.3447 16.4657 2.5404 0.1122PGA RSR RSR RSR= + + (14)
where RSR ∈ [0.1, 0.5] is the rise to span ratio.
4.4 Relationship between lower bound collapse loads and tube member thick-
nesses
In this section, the dome spans D50065 with tube member thicknesses A, B,
C, D, E and F were firstly selected as typical cases as shown in Table 11. Then
the RHAs were performed in ANSYS software for these typical cases subjected
to the twenty seismic records listed in Table 3. The collapse loads for D50065
with different tube thicknesses subjected to twenty seismic records are listed in
Table 10, and their failure fragility curves, lognormal distributions, are shown
in Fig. 11.
Table 10
The collapse loads for D50065 with different tube thicknesses subjected to twenty seismic records
Number Collapse loads (m/s2)
A B C D E F
1 106.00 120.60 127.20 150.40 162.80 149.80
2 86.00 100.50 103.60 121.20 119.60 135.60
3 118.00 136.80 146.00 159.80 220.00 215.80
4 117.20 138.80 140.00 160.20 164.00 149.60
5 86.60 97.40 99.20 122.00 119.80 144.60
6 107.60 124.60 126.60 152.40 171.60 186.80
7 101.20 118.20 120.00 156.60 166.20
8 81.00 92.40 93.40 109.40 114.40 128.00
9 50.40 61.40 62.40 76.60 74.60 84.80
10 96.80 111.80 113.00 133.20 141.20 157.80
11 87.20 105.60 106.60 123.40 130.60 144.40
12 104.60 123.80 124.60 154.60 169.60
13 131.60 159.40 159.80 192.60 212.80 243.60
14 112.60 133.80 136.00 159.60 177.60 196.20
15 104.60 118.60 121.00 147.00 163.00
16 58.60 70.80 71.80 85.60 85.20 96.80
17 53.60 65.40 66.40 79.40 77.60 89.60
18 46.40 55.40 56.40 68.00 70.20 80.40
19 77.20 88.60 90.00 105.00 119.60 133.20
20 54.80 64.50 65.60 80.40 81.80
0 100 200 3000
0.2
0.4
0.6
0.8
1
PGA (m/s2)
CD
F
A
B
C
D
E
F
Fig. 11 Collapse fragility curves for D50065 with different tube thicknesses
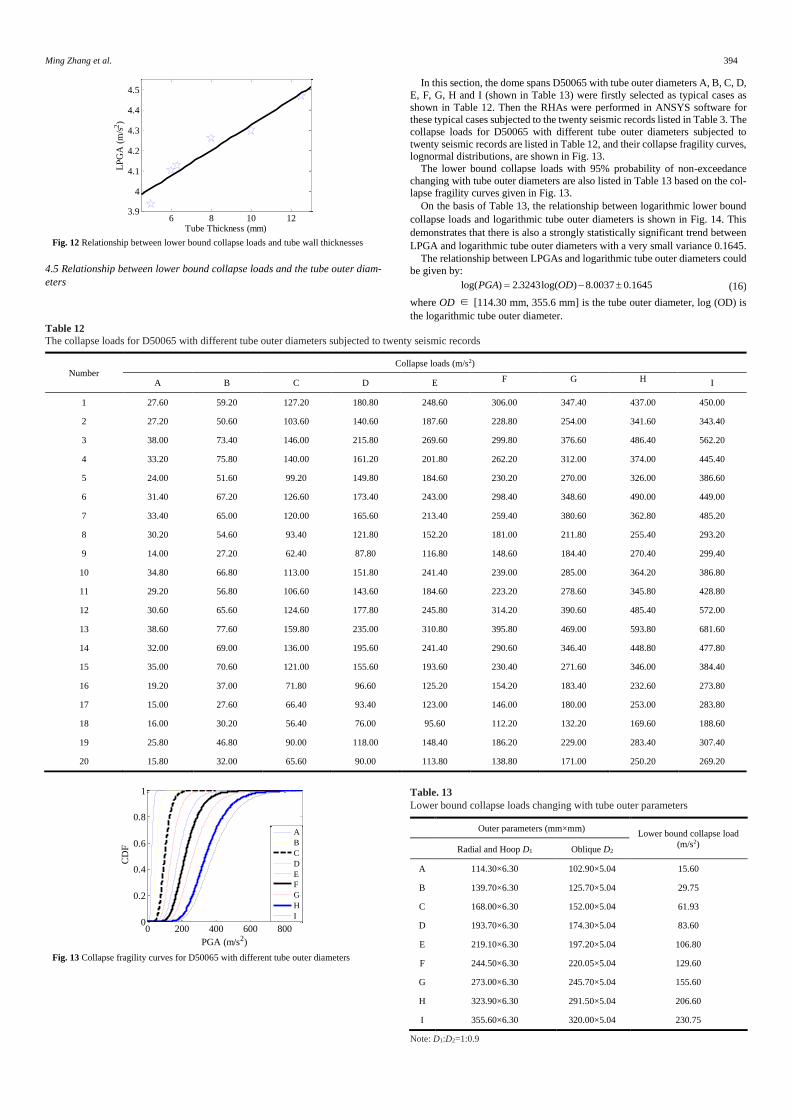
The lower bound collapse loads with 95% probability of non-exceedance
changing with tube thicknesses are presented in Table 11 on the basis of the
failure fragility curves given in Fig. 11. Based on Table 11, the relationship
between logarithmic lower bound collapse loads and member tube wall thick-
nesses is shown in Fig. 12. It demonstrates that there is also a strongly statisti-
cally significant trend between LPGA and tube wall thicknesses with a very
small variance 0.0455.
Referring to Equation (11), the relationship between lower bound collapse
loads and rise to span ratios could be given by:
0.0629 3.6977 0.0455LPGA TH= + (15)
where TH ∈ [5.0 mm, 12.5 mm] is the tube wall thickness.
Table. 11
Lower bound collapse loads changing with tube thicknesses
Tube dimensions: outside diameter (mm)×Wall
thickness (mm) Lower bound collapse load
(m/s2) Radial and Hoop t1 Oblique t2
A 168.00×5.00 152.00×4.00 51.20
B 168.00×6.00 152.00×4.80 60.50
C 168.00×6.30 152.00×5.04 61.93
D 168.00×8.00 152.00×6.40 70.86
E 168.00×10.00 152.00×8.00 73.56
F 168.00×12.50 152.00×10.0 87.37
Note: t1:t2=1:0.8
Ming Zhang et al. 394
6 8 10 123.9
4
4.1
4.2
4.3
4.4
4.5
Tube Thickness (mm)
LP
GA
(m
/s2)
Fig. 12 Relationship between lower bound collapse loads and tube wall thicknesses
4.5 Relationship between lower bound collapse loads and the tube outer diam-
eters
In this section, the dome spans D50065 with tube outer diameters A, B, C, D,
E, F, G, H and I (shown in Table 13) were firstly selected as typical cases as
shown in Table 12. Then the RHAs were performed in ANSYS software for these typical cases subjected to the twenty seismic records listed in Table 3. The
collapse loads for D50065 with different tube outer diameters subjected to
twenty seismic records are listed in Table 12, and their collapse fragility curves, lognormal distributions, are shown in Fig. 13.
The lower bound collapse loads with 95% probability of non-exceedance
changing with tube outer diameters are also listed in Table 13 based on the col-lapse fragility curves given in Fig. 13.
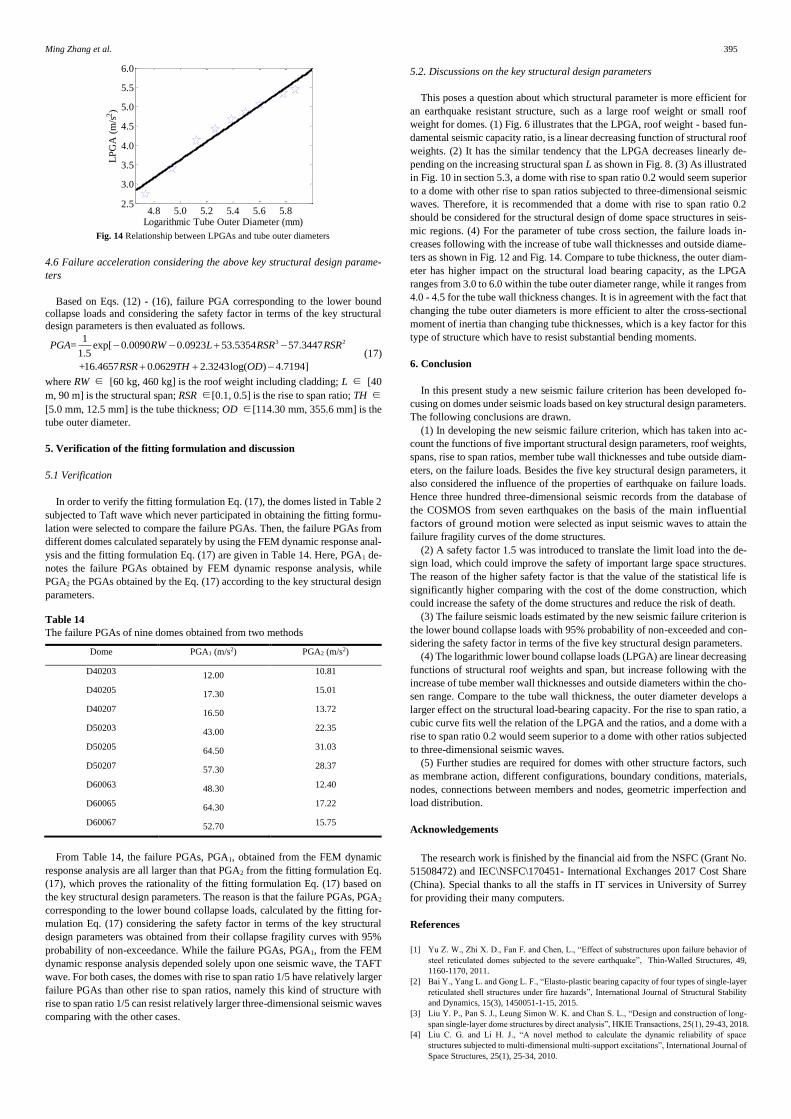
On the basis of Table 13, the relationship between logarithmic lower bound
collapse loads and logarithmic tube outer diameters is shown in Fig. 14. This
demonstrates that there is also a strongly statistically significant trend between
LPGA and logarithmic tube outer diameters with a very small variance 0.1645.
The relationship between LPGAs and logarithmic tube outer diameters could
be given by:
log( ) 2.3243log( ) 8.0037 0.1645PGA OD= − (16)
where OD ∈ [114.30 mm, 355.6 mm] is the tube outer diameter, log (OD) is
the logarithmic tube outer diameter.
Table 12
The collapse loads for D50065 with different tube outer diameters subjected to twenty seismic records
Number Collapse loads (m/s2)
A B C D E F G H I
1 27.60 59.20 127.20 180.80 248.60 306.00 347.40 437.00 450.00
2 27.20 50.60 103.60 140.60 187.60 228.80 254.00 341.60 343.40
3 38.00 73.40 146.00 215.80 269.60 299.80 376.60 486.40 562.20
4 33.20 75.80 140.00 161.20 201.80 262.20 312.00 374.00 445.40
5 24.00 51.60 99.20 149.80 184.60 230.20 270.00 326.00 386.60
6 31.40 67.20 126.60 173.40 243.00 298.40 348.60 490.00 449.00
7 33.40 65.00 120.00 165.60 213.40 259.40 380.60 362.80 485.20
8 30.20 54.60 93.40 121.80 152.20 181.00 211.80 255.40 293.20
9 14.00 27.20 62.40 87.80 116.80 148.60 184.40 270.40 299.40
10 34.80 66.80 113.00 151.80 241.40 239.00 285.00 364.20 386.80
11 29.20 56.80 106.60 143.60 184.60 223.20 278.60 345.80 428.80
12 30.60 65.60 124.60 177.80 245.80 314.20 390.60 485.40 572.00
13 38.60 77.60 159.80 235.00 310.80 395.80 469.00 593.80 681.60
14 32.00 69.00 136.00 195.60 241.40 290.60 346.40 448.80 477.80
15 35.00 70.60 121.00 155.60 193.60 230.40 271.60 346.00 384.40
16 19.20 37.00 71.80 96.60 125.20 154.20 183.40 232.60 273.80
17 15.00 27.60 66.40 93.40 123.00 146.00 180.00 253.00 283.80
18 16.00 30.20 56.40 76.00 95.60 112.20 132.20 169.60 188.60
19 25.80 46.80 90.00 118.00 148.40 186.20 229.00 283.40 307.40
20 15.80 32.00 65.60 90.00 113.80 138.80 171.00 250.20 269.20
0 200 400 600 8000
0.2
0.4
0.6
0.8
1
PGA (m/s2)
CD
F
A
B
C
D
E
F
G
H
I
Fig. 13 Collapse fragility curves for D50065 with different tube outer diameters
Table. 13
Lower bound collapse loads changing with tube outer parameters
Outer parameters (mm×mm) Lower bound collapse load
(m/s2) Radial and Hoop D1 Oblique D2
A 114.30×6.30 102.90×5.04 15.60
B 139.70×6.30 125.70×5.04 29.75
C 168.00×6.30 152.00×5.04 61.93
D 193.70×6.30 174.30×5.04 83.60
E 219.10×6.30 197.20×5.04 106.80
F 244.50×6.30 220.05×5.04 129.60
G 273.00×6.30 245.70×5.04 155.60
H 323.90×6.30 291.50×5.04 206.60
I 355.60×6.30 320.00×5.04 230.75
Note: D1:D2=1:0.9
Ming Zhang et al. 395
4.8 5.0 5.2 5.4 5.6 5.82.5
3.0
3.5
4.0
4.5
5.0
5.5
6.0
Logarithmic Tube Outer Diameter (mm)
LP
GA
(m
/s2)
Fig. 14 Relationship between LPGAs and tube outer diameters
4.6 Failure acceleration considering the above key structural design parame-
ters
Based on Eqs. (12) - (16), failure PGA corresponding to the lower bound collapse loads and considering the safety factor in terms of the key structural
design parameters is then evaluated as follows.
3 21= exp[ 0.0090 0.0923 53.5354 57.3447
1.5
+16.4657 0.0629 2.3243log( ) 4.7194]
PGA RW L RSR RSR
RSR TH OD
− − + −
+ + −
(17)
where RW ∈ [60 kg, 460 kg] is the roof weight including cladding; L ∈ [40
m, 90 m] is the structural span; RSR ∈[0.1, 0.5] is the rise to span ratio; TH ∈
[5.0 mm, 12.5 mm] is the tube thickness; OD ∈[114.30 mm, 355.6 mm] is the
tube outer diameter.
5. Verification of the fitting formulation and discussion
5.1 Verification
In order to verify the fitting formulation Eq. (17), the domes listed in Table 2
subjected to Taft wave which never participated in obtaining the fitting formu-
lation were selected to compare the failure PGAs. Then, the failure PGAs from
different domes calculated separately by using the FEM dynamic response anal-
ysis and the fitting formulation Eq. (17) are given in Table 14. Here, PGA1 de-
notes the failure PGAs obtained by FEM dynamic response analysis, while
PGA2 the PGAs obtained by the Eq. (17) according to the key structural design
parameters.
Table 14
The failure PGAs of nine domes obtained from two methods
Dome PGA1 (m/s2) PGA2 (m/s2)
D40203 12.00 10.81
D40205 17.30 15.01
D40207 16.50 13.72
D50203 43.00 22.35
D50205 64.50 31.03
D50207 57.30 28.37
D60063 48.30 12.40
D60065 64.30 17.22
D60067 52.70 15.75
From Table 14, the failure PGAs, PGA1, obtained from the FEM dynamic
response analysis are all larger than that PGA2 from the fitting formulation Eq.
(17), which proves the rationality of the fitting formulation Eq. (17) based on
the key structural design parameters. The reason is that the failure PGAs, PGA2
corresponding to the lower bound collapse loads, calculated by the fitting for-
mulation Eq. (17) considering the safety factor in terms of the key structural
design parameters was obtained from their collapse fragility curves with 95%
probability of non-exceedance. While the failure PGAs, PGA1, from the FEM
dynamic response analysis depended solely upon one seismic wave, the TAFT
wave. For both cases, the domes with rise to span ratio 1/5 have relatively larger
failure PGAs than other rise to span ratios, namely this kind of structure with
rise to span ratio 1/5 can resist relatively larger three-dimensional seismic waves
comparing with the other cases.
5.2. Discussions on the key structural design parameters
This poses a question about which structural parameter is more efficient for
an earthquake resistant structure, such as a large roof weight or small roof
weight for domes. (1) Fig. 6 illustrates that the LPGA, roof weight - based fun-
damental seismic capacity ratio, is a linear decreasing function of structural roof
weights. (2) It has the similar tendency that the LPGA decreases linearly de-
pending on the increasing structural span L as shown in Fig. 8. (3) As illustrated
in Fig. 10 in section 5.3, a dome with rise to span ratio 0.2 would seem superior
to a dome with other rise to span ratios subjected to three-dimensional seismic
waves. Therefore, it is recommended that a dome with rise to span ratio 0.2
should be considered for the structural design of dome space structures in seis-
mic regions. (4) For the parameter of tube cross section, the failure loads in-
creases following with the increase of tube wall thicknesses and outside diame-
ters as shown in Fig. 12 and Fig. 14. Compare to tube thickness, the outer diam-
eter has higher impact on the structural load bearing capacity, as the LPGA
ranges from 3.0 to 6.0 within the tube outer diameter range, while it ranges from
4.0 - 4.5 for the tube wall thickness changes. It is in agreement with the fact that
changing the tube outer diameters is more efficient to alter the cross-sectional
moment of inertia than changing tube thicknesses, which is a key factor for this
type of structure which have to resist substantial bending moments.
6. Conclusion
In this present study a new seismic failure criterion has been developed fo-
cusing on domes under seismic loads based on key structural design parameters.
The following conclusions are drawn.
(1) In developing the new seismic failure criterion, which has taken into ac-
count the functions of five important structural design parameters, roof weights,
spans, rise to span ratios, member tube wall thicknesses and tube outside diam-
eters, on the failure loads. Besides the five key structural design parameters, it
also considered the influence of the properties of earthquake on failure loads.
Hence three hundred three-dimensional seismic records from the database of
the COSMOS from seven earthquakes on the basis of the main influential
factors of ground motion were selected as input seismic waves to attain the
failure fragility curves of the dome structures.
(2) A safety factor 1.5 was introduced to translate the limit load into the de-
sign load, which could improve the safety of important large space structures.
The reason of the higher safety factor is that the value of the statistical life is
significantly higher comparing with the cost of the dome construction, which
could increase the safety of the dome structures and reduce the risk of death.
(3) The failure seismic loads estimated by the new seismic failure criterion is
the lower bound collapse loads with 95% probability of non-exceeded and con-
sidering the safety factor in terms of the five key structural design parameters.
(4) The logarithmic lower bound collapse loads (LPGA) are linear decreasing
functions of structural roof weights and span, but increase following with the
increase of tube member wall thicknesses and outside diameters within the cho-
sen range. Compare to the tube wall thickness, the outer diameter develops a
larger effect on the structural load-bearing capacity. For the rise to span ratio, a
cubic curve fits well the relation of the LPGA and the ratios, and a dome with a
rise to span ratio 0.2 would seem superior to a dome with other ratios subjected
to three-dimensional seismic waves.
(5) Further studies are required for domes with other structure factors, such
as membrane action, different configurations, boundary conditions, materials,
nodes, connections between members and nodes, geometric imperfection and
load distribution.
Acknowledgements
The research work is finished by the financial aid from the NSFC (Grant No.
51508472) and IEC\NSFC\170451- International Exchanges 2017 Cost Share
(China). Special thanks to all the staffs in IT services in University of Surrey
for providing their many computers.
References
[1] Yu Z. W., Zhi X. D., Fan F. and Chen, L., “Effect of substructures upon failure behavior of
steel reticulated domes subjected to the severe earthquake”, Thin-Walled Structures, 49,
1160-1170, 2011.
[2] Bai Y., Yang L. and Gong L. F., “Elasto-plastic bearing capacity of four types of single-layer
reticulated shell structures under fire hazards”, International Journal of Structural Stability
and Dynamics, 15(3), 1450051-1-15, 2015.
[3] Liu Y. P., Pan S. J., Leung Simon W. K. and Chan S. L., “Design and construction of long-
span single-layer dome structures by direct analysis”, HKIE Transactions, 25(1), 29-43, 2018.
[4] Liu C. G. and Li H. J., “A novel method to calculate the dynamic reliability of space
structures subjected to multi-dimensional multi-support excitations”, International Journal of
Space Structures, 25(1), 25-34, 2010.
Ming Zhang et al. 396
[5] Zhai X. M. and Wang Y. H., “Modeling and dynamic response of steel reticulated shell under
blast loading”, Shock and Vibration, 20(1), 19-28, 2013.
[6] Nie G. B., Zhi X. D., Fan F. and Dai J.W., “Seismic performance evaluation of single-layer
reticulated dome and its fragility analysis”, Journal of Constructional Steel Research, 100,
176-182, 2014.
[7] Kong D. W., Fan F. and Zhi X. D., “Seismic performance of single-layer lattice shells with
VF-FPB”, International Journal of Steel Structures, 14(4), 901-911, 2014.
[8] Li Y. G., Fan F. and Hong H. P., “Effect of support flexibility on seismic responses of a
reticulated dome under spatially correlated and coherent excitations”, Thin-Walled
Structures, 82, 343-351, 2014.
[9] Fan F., Li Y. G., Zhi X. D. and Li L., “Comparison of seismic response of single-layer
reticulated dome under uniform and incoherence three-directional excitations”, International
Journal of Steel Structures, 14(4), 855-863, 2014.
[10] Ma J. L., Wu C. Q., Zhi X. D. and Fan F., “Prediction of confined blast loading in single-
layer lattice shells”, Advances in Structural Engineering, 17(7), 1029-1043, 2014.
[11] Ye J. H., Zhang Z. Q. and Chu Y., “Strength failure of spatial reticulated structures under
multi-support excitation”, Earthquake Engineering and Engineering Vibration, 10(1), 21-36,
2011.
[12] Ye J. H., Zhang Z. Q. and Chu Y., “Strength behavior and collapse of spatial-reticulated
structures under multi-support excitation”, Science China-Technological Sciences, 54, 1624-
1638, 2011.
[13] Liu W. Z. and Ye J. H., “Collapse optimization for domes under earthquake using a genetic
simulated annealing algorithm”, Journal of Constructional Steel Research, 97, 59-68, 2014.
[14] Zhu N. H. and Ye J. H., “Structural vulnerability of a single-layer dome based on its form”,
Journal of Engineering Mechanics, 140(1), 112-127, 2014.
[15] Yan R. Z., Chen Z. H., Wang X. D., Xiao X. and Yang Y., “Calculation theory and
experimental study of the K6 single-layer reticulated shell”, International Journal of Steel
Structures, 14(2), 195-212, 2014.
[16] Ma H. H., Fan F., Wen P., Zhang H. and Shen S. Z., “Experimental and numerical studies on
a single-layer cylindrical reticulated shell with semi-rigid joints”, Thin-Walled Structures,
86, 1-9, 2015.
[17] Yang C., Yu Z. X., Sun Y. P., Zhao L., and Zhao H., “Axial residual capacity of circular
concrete-filled steel tube stub columns considering local buckling”, Advanced Steel
Construction, 14(3), 496-513, 2018.
[18] Zhong J., Zhi X. D. and Fan F., “A dominant vibration mode-based scalar ground motion
intensity measure for single-layer reticulated domes”, Earthquakes and Structures, 11(2),
245-264, 2016.
[19] Fan F., Wang D. Z., Zhi X. D. and Shen S. Z., “Failure modes of reticulated domes subjected
to impact and the judgment”, Thin-Walled Structures, 48(2), 143-149, 2010.
[20] Ramalingam R. and Jayachandran S. A., “Postbuckling behavior of flexibly connected single
layer steel domes”, Journal of Constructional Steel Research, 114, 136-145, 2015.
[21] Bruno L., Sassone M. and Fiammetta V., “Effects of the equivalent geometric nodal
imperfections on the stability of single layer grid shells”, Engineering Structures, 112, 184-
199, 2016.
[22] Yan J. C., Qin F., Cao Z. G., Fan F. and Mo Y. L., “Mechanism of coupled instability of
single-layer reticulated domes”, Engineering Structures, 114, 158-170, 2016.
[23] Zhi X. D., Fan F. and Shen S. Z., “Failure mechanisms of single-layer reticulated domes
subjected to earthquakes”, International Association of Shell and Spatial Structures, 48(1),
29-44, 2007.
[24] Yu Z. X., Qiao Y.K., Zhao L., Xu H., Zhao S. C. and Liu Y. P., “A simple analytical method
for evaluation of flexible rockfall barrier part 1: working mechanism and analytical solution”,
Advanced Steel Construction, 14(2), 115-141.
[25] Standardization Administration of China, Technical specification for space frame structures,
JGJ 7 -2010, Beijing, China Architecture & Building Press, 2010. (in Chinese).
[26] Architectural Institute of Japan, Dynamic Behavior and Seismic Design of Spatial Structures,
Tokyo, Showa Joho Process, 2006.
[27] American Institute of Steel Construction, Seismic Provisions for Structural Steel Buildings,
ANSI/AISC 341-10, Chicago, 2010.
[28] British Standards Institution, Eurocode 8: Design of Structures for Earthquake Resistance –
Part 1: General Rules, Seismic Actions and Rules for Buildings, CEN. EN 1998-1, 2004.
[29] ANSYS 10.0. Theory reference. ANSYS Inc. 2005.
[30] Vamvatsikos D, Cornel CA, “Incremental dynamic analysis”, Earthquake Engineering and
Structural Dynamics, 31(3), 491-514, 2002.
[31] COSMOS Virtual Data Center. (http:/db.cosmos-eq.erg/scripts/default.plx).
[32] Johnson Norman L., Kotz Samuel, Balakrishnan N., "14: Lognormal
Distributions", Continuous univariate distributions, Vol. 1, Wiley Series in Probability and
Mathematical Statistics: Applied Probability and Statistics (2nd ed.), New York: John Wiley
& Sons, ISBN978-0-471-58495-7,MR1299979, 1994.
[33] Papoulis A. P., Pillai S. U., “Probability, Random Variables, and Stochastic Processes (4th
ed.)”. Boston, McGraw-Hill, ISBN 0-07-366011-6, 2002.
[34] http://ocw.mit.edu/courses/mathematics/18-443- statistics -for-applications-fall-
2006/lecture-notes/lecture6. pdf.
[35] Benjamin J. R., Cornell C. A., “Probability, Statistics, and Decision for Civil Engineers”,
McGraw-Hill: New York, NY, 1970; 684.
[36] Soutsos M. N., Breysse D., Garnier V., Goncalves A. and Monteiro A. V., “Estimation of on-
site compressive strength of concrete”, In Non-Destructive Assessment of Concrete
Structures, Reliability and Limits of Single and Combined Techniques, RILEM, Talence,
France, 2012.
[37] American Institute of Steel Construction, Specification for Structural Steel Buildings,
ANSI/AISC 360-16, Chicago, 2016.
[38] Department of Transportation, Standard Specifications, CalTrans, State of California, 2015.
[39] Department of Defense, J Joint service specification guide: Aircraft structures, SSG – 2006,
Washington, U.S, 1998 .
[40] Department of the Prime Minister and Cabinet, Best Practice Regulation Guidance Note:
Value of statistical life, Australian Government, 2014.
[41] Ministry of Transport, Social cost of road crashes and injuries 2016 update, New Zealand
Government, 2016.
[42] Department of Transportation, Guidance on Treatment of the economic value of a statistical
life (VSL) in U.S. department of transportation analyses-2016 adjustment, Office of the
Secretary of Transportation, U. S., 2016.
[43] Shen S. Z., Zhi X. D., “Failure mechanism of reticular shells subjected to dynamic actions”,
the 4th International Conference for Advances in Steel Structures, ShangHai, China, 2005.
[44] Ibarra LF, Krawinkler H, “Global collapse of frame structures under seismic excitations”,
Report No. 152, The John A. Blume Earthquake Engineering Center, Department of Civil
and Environmental Engineering, Stanford University, Stanford, CA, 2005.
[45] Zhong J., “Probabilistic Seismic Fragility Analysis of Reticulated Shells”, PhD thesis, Harbin
Institute of Technology, Harbin, China, 2016. (in Chinese).
[46] Fan F., Zhi X. D. and Shen S. Z., “Failure mechanism of reticulated shells under earthquake”,
Science Press, 2014. (in Chinese).
Ming Zhang et al. 397
Appendix Table 1. The domes with various structural parameters
Domes
with various roof
weights
Span (m) Roof weight (kg/m2) Ratio of rise-span Cross section (mm)
radial and hoop members oblique members
50
60
0.20 168.00×6.00 152.00×5.00
100
160
200
260
300
360
400
460
Domes
with various spans
40
60 0.20 168.00×6.00 152.00×5.00
50
60
65
70
75
80
85
90
Domes
with various rise to span
ratios
50 60
0.10
168.00×6.00 152.00×5.00
0.15
0.20
0.25
0.30
0.35
0.40
0.45
0.50
Domes
with various tube thick-
nesses
50 60 0.20
168.00×5.00 152.00×4.00
168.00×6.00 152.00×4.80
168.00×6.30 152.00×5.04
168.00×8.00 152.00×6.40
168.00×10.00 152.00×8.00
168.00×12.50 152.00×10.00
Domes
with various tube out-
side diameters 50 60 0.2
114.30×6.30 102.90×5.04
139.70×6.30 125.70×5.04
168.00×6.30 152.00×5.04
193.70×6.30 174.30×5.04
219.10×6.30 197.20×5.04
244.50×6.30 220.05×5.04
273.00×6.30 245.70×5.04
323.90×6.30 291.50×5.04
355.60×6.30 320.00×5.04