Embed Size (px)
Citation preview
STUDY OF SMALLHOLDER FARMS LIVESTOCK FEED SOURCING
AND FEEDING STRATEGIES AND THEIR IMPLICATION ON
LIVESTOCK WATER PRODUCTIVITY IN MIXED CROP-LIVESTOCK
SYSTEMS IN THE HIGHLANDS OF THE BLUE NILE BASIN,
ETHIOPIA
M.Sc. Thesis
BEDASA EBA TEBEJE
October 2012
Haramaya University
i
STUDY OF SMALLHOLDER FARMS LIVESTOCK FEED SOURCING
AND FEEDING STRATEGIES AND THEIR IMPLICATION ON
LIVESTOCK WATER PRODUCTIVITY IN MIXED CROP-LIVESTOCK
SYSTEMS IN THE HIGHLANDS OF THE BLUE NILE BASIN, ETHIOPIA
A Thesis Submitted to the School of Animal and Range Sciences, School of
Graduate Studies
HARAMAYA UNIVERSITY
In Partial Fulfillment of the Requirements for the Degree of
MASTER OF SCIENCE IN AGRICULTURE (RANGE ECOLOGY AND
MANAGEMENT)
By
Bedasa Eba Tebeje
October 2012
Haramaya University
ii
SCHOOL OF GRADUATE STUDIES
HARAMAYA UNIVERSITY
As Thesis research advisors, we hereby certify that we have read and evaluated this Thesis,
prepared under our guidance, by Bedasa Eba, entitled ‘‘Study of Smallholder Farms Livestock
Feed Sourcing and Feeding Strategies and Their Implication on Livestock water
productivity in Mixed-crop Livestock Systems in the Highlands of the Blue Nile Basin,
Ethiopia’’ and recommend that it be submitted as fulfilling the Thesis requirement.
Amare Haileslassie (PhD) ___________ __________
Name of Major advisor Signature Date
Getachew Animut (PhD) ___________ __________
Name of Co-advisor Signature Date
As members of the Examining Board of the Final MSc. thesis Open Defense, we certify that we
have read and evaluated the thesis prepared by Bedasa Eba and recommend that it be accepted
as fulfilling the thesis requirement for the degree of Master of Science in Agriculture (Range
Ecology and Management).
______________________ ___________ ________
Name of Chairman Signature Date
______________________ ___________ __________
Name of Internal examiner Signature Date
______________________ ___________ _________
Name of External examiner Signature Date

iii
DEDICATION
I dedicate this thesis manuscript to my father EBA TEBEJE, and my mother TARIKE AYANA,
for nursing me with affection and love and for their committed partnership in the success of my
life.
iv
STATEMENT OF THE AUTHOR
First, I declare that this thesis is my genuine work and that all sources of materials used for this
thesis have been duly acknowledged. This thesis has been submitted in partial fulfillment of the
requirements for MSc. degree at Haramaya University and is deposited at the University Library
to be made available to borrowers under rules of the Library. I solemnly declare that this thesis is
not submitted to any other institution anywhere for the award of any academic degree, diploma,
or certificate.
Brief quotations from this thesis are allowable without special permissions provided that accurate
acknowledgement of source is made. Requests for permission for extended quotation from or
reproduction of this manuscript in whole or in part may be granted by the head of the major
department or the Dean of the School of Graduate Studies when in his or her judgment the
proposed use of the material is in the interest of scholarship. In all other instances, however,
permission must be obtained from the author.
Name: Bedasa Eba Signature: _____________________
Place: Haramaya University
Date of Submission: _____________________________
LIST OF ABBERVIATIONS
ARDO Agriculture and Rural Development Offices
v
BNB Blue Nile Basin
BPS Barley-Potato System
DM Dry Matter
ET Evapotranspiration
FAO Food and Agriculture Organization of the United Nation
FWP Feed Water Productivity
GLM General Linear Model
ha Hectare
Kc Crop Coefficient
ILRI International Livestock Research Institute
IVDMD In vitro Dry Matter Digestibility
IWMI International Water Management Institute
LGP Length of Growing Period
LSD Least Significant Difference
LWP Livestock Water Productivity
ME Metabolisable Energy
MSS Maize-Sorghum System
RPS Rice-Pulses System
SAS Statistical Analysis System
TLU Tropical Livestock Unit
TMMS Teff-Millet/Maize System
TMS Teff-Millet System
TSS Teff-Sorghum System
TWS Teff-Wheat System
vi
BIOGRAPHICAL SKETCH
The author was born in 1983 at Guduru Woreda, Horro-Guduru Wollega zone, Oromia regional
state, Ethiopia. He attended elementary, junior secondary and high school education in
Loyakidame, Fincha, and Shambu Schools, respectively.
The author joined Mekelle University in September 2002 and graduated with BSc degree in
Animal, Range and Wild life Sciences on 16 July 2006. He worked in Agriculture and Rural
Developments Office of the Abay Choman Woreda, Horro-Guduru Wollega zone as a feed
resource expert from August 2006 up to April 2007. He also worked as instructor in Kombolcha
Agriculture Technical and Vocational Education Training (ATVET) College, East Hararge from
May 2007 up to April 2008. He has served as junior researcher in Oromia Agriculture Research
Institute at Yabello Pastoral and Dry Land Agriculture Research Center, since September 2010.
Then in October 2010 he joined the School of Graduate Studies at Haramaya University to
pursue his MSc study in Range Ecology and Management.
vii
ACKNOWLEDGEMENTS
God, the Almighty, helped me to pass through tough times that cannot be forgotten in every
corner of my life. Had it not been the will of God, nothing would have been possible. So, I would
like to praise GOD!
On the onset of this study and after wards when carrying out the actual work, Dr. Amare
Haileslassie, my major advisor, has been with me in guiding, encouraging and to the extent of
allow to use his personal resources. I would like to extend my thanks to him. I want to express
my indebtedness to Dr. Getachewu Animut, my co-advisor, whom I found to be helpful in
encouraging, guiding and critically commenting on the draft manuscript. Despite their tight
schedule, Dr. Alan Duncan and Dr. Don Peden made a substantial contribution in shaping this
research proposal, field survey questionnaire and the draft manuscript. I am very grateful to
them. I am also thanks Dr. Charlotte MacAlister for advice, guidance and sharing of
extraordinary experience in the course the work of this research.
I wish to express my sincere word of thanks to the Oromia Agricultural Research Institute
(OARI) for giving me the chance to pursue MSc. study. A special word of thanks goes to ILRI
(International Livestock research Institute) for sponsoring this work.
My sincere acknowledgement is extended to Mr. Kebebe Ergano, Mr. Gerba Leta and Mr. Abera
Adie for commenting on the field survey questionnaire, excellent coordination of enumerator and
invaluable support in biomass sampling and species identification. Timely and safe filed data
collection would have been very difficult, had it not been for a good driving skills and kind
cooperation I had from Mr. Yosef Gebre and Kebede. My thanks go to them. Mrs Tiruwerk
Melaku and Mrs Tigist Begashew of ILRI were very helpful in facilitating logistics and
administrative issues. I express my sincere thanks to both of them.
viii
My thanks also go to Mr. Shibiru Gurmessa, Mr. Gedafa Adugna and Mr. Getachewu Molla for
their kind cooperation in sharing data available at Woreda Agricultural and Rural Development
Offices and also in collecting data during survey in Diga, Jeldu and Fogera Woredas,
respectively. My thanks also go to Mr. Andale, Mr. Fayisa, Mr. Ragassa and Mr. Diriba for their
support in collecting data during household survey.
My thanks also go to my friends for their lovely affection and encouragement during this study;
especially Wakkene Tigre, Bikila Negasa, Samuel Tuffa and Bantayehu Muluneh. I like to
extend to my heartfelt and deepest love to my brother Diriba Eba who always nursing me his
lovely affection and encouraging me for my success. Miss. Ajabush Dafar supported me in
encoding the household survey data. I would like to thanks her. It is difficult to make a whole list
of individuals who helped me to complete this work and it is grateful to express my sincere
thanks to all of them. May Almighty God bless all!

ix
TABLE OF CONTENT
Pages
STATEMENT OF THE AUTHOR iv
LIST OF ABBERVIATIONS iv
BIOGRAPHICAL SKETCH vi
ACKNOWLEDGEMENTS vii
LIST OF TABLES xii
LIST OF FIGURES xiv
ABSTRACT xvi
1. INTRODUCTION 1
2. LITERATURE REVIEW 4
2.1. Feed Resources in the Ethiopian Highlands 4
2.1.1. Natural pasture 4
2.1.2. Crop residues and other agro-industrial by-products 6
2.2. Feeding Calendar and Farmers Coping Strategies 7
2.3. Livestock Water Productivity: The Concept and its Linkage to Feed Sourcing and
Feeding Strategies 7
2.4. Drinking Water Supply and Grazing Land: Synchronizing their Spatial and Temporal
Distribution 8
x
2.5. The Livestock Water Productivity Framework 9
3. MATERIALS AND METHODS 11
TABLE OF CONTENT (CONTINUED)
3.1. Description of the Study Sites 11
3.2. Stratification and Household Survey 14
3.3. Feed Resource Assessment 16
3.3.1. Estimation dry matter productivity and production of grazing lands 16
3.3.2. Assessment of feed dry matter production and productivity on arable and communal
property resources 17
3.4. Estimation of Water Depleted in Producing Livestock Feed 18
3.5. Estimation of Livestock Beneficial Outputs and Service 21
3.6. Livestock Water Productivity Estimation 23
3.7. Feed Demand-Supply Balance Estimation 24
3.8. Statistical Analysis 26
4. RESULTS AND DISCUSSIONS 27
4.1. Characteristics of the Sample Farms 27
4.1.1. General characteristics 27
4.1.2. Landholding and land use pattern 29
4.1.3. Livestock herd size and structure 31
4.2. Variability of Feed Resources Availability and Ingredients Across the Study Systems 33
4.2.1. Dry matter productivity and grass-legume composition on private grazing lands 34
xi
4.2.2. Variability of mean dry matter availability per sample farms in the study systems 37
4.2.3. Improved forages production practice and major constraints 38
4.2.4. Sources of supplemental feeds 42
4.3. Feed Resources Management and Feeding Strategies 44
4.3.1. Feed resources management 44
4.3.2. Feeding strategies and calendar 50
4.3.3. Efficiencies of utilization of crop residues and implication on LWP 53
TABLE OF CONTENT (CONTINUED)
4.4. Variation in Temporal Feed and Water Resources Availability 55
4.5. Major Constraints on Feed Sourcing and Feeding 60
4.6. Feed Demand-Supply Balance Estimation and Implication for LWP 62
4.7. Water Depleted for Livestock Feed Production and Values of Livestock Beneficial
Outputs and Services 66
4.8. Feed Water Productivity 68
4.9. Livestock Water Productivity 70
4.10. Opportunities to improve LWP 73
5. SUMMARY AND CONCLUSION 74
6. REFERENCES 78
7. APPENDICES 93
xii
LIST OF TABLES
Table Pages
1. Distribution of sample households across farming systems in selected watersheds and wealth
classes ................................................................................................................................. 16
2. Household characteristics of the respondents in the study areas (Mean±SE) ...................... 28
3. Mean value of landholding (ha) across the study systems (Mean±SE) ................................ 30
4. Mean livestock holdings (in TLU) by species of sample farms in the study system (Mean±SE)
.............................................................................................................................................. 32
5. Biomass productivity of grasses and legumes from private grazing land (ton ha-1
) in study
systems (Mean±SE) .............................................................................................................. 35
6. Dry matter production (ton) from feed sources in study sites per sampled household
(Mean±SE) ........................................................................................................................... 38
7. Percentages of respondents’ practicing and reasons for not practicing improved forages
production in study sites ....................................................................................................... 41
8. Percentage of respondents on types of feed supplemented, season of feed supplemented and
for which livestock type feed is supplemented in the study sites ......................................... 43
9. Grazing lands management practices in study site as per respondents interviewed ............. 45
10. Percentages of respondents conserving/storing feed in the study systems ......................... 48
11. Percentages sample farmers who practice physical and /or chemical treatments of crop
residues .............................................................................................................................. 49
xiii
12. Percentages of respondents for feeding strategies of different feed sources in the study sites
............................................................................................................................................. 51
13. Percentages of small cereal residues usage for various purposes as per interviewed in the
study sites (Mean±SE) ........................................................................................................ 53
14. Percentages of large cereals residues usage for various purposes as per interviewed in the
study sites (Mean±SE) ........................................................................................................ 54
LIST OF TABLES (CONTINUED)
15. Percentages of respondents on feed availability across season of the year in the study
sites....... .............................................................................................................................. 56
16. Percentages of respondent on source of water for livestock drinking in the study sites .... 57
17. Percentages of respondents on frequency of drinking of livestock and estimated distance to
sources of water in the study sites....................................................................................... 59
18. Major constraints of feed sourcing and feeding strategies in study sites ............................ 61
19. Average estimated annual DM (kg) and ME (MJ) supply, demand and balance per
households farm in the study sites ...................................................................................... 64
20. Percentages of respondents on coping mechanisms during feed shortages ........................ 65
21. Water depleted for livestock feed and productivity of livestock in study sites (Mean±SE)
....................................................................................................................................……. 67
22. Water productivity for feed sources (kg m-3
) in the study sites (Mean±SE) .......................69
23. Livestock water productivity (US$ m-3
) in the study sites (Mean±SE) ...............................71
xiv
LIST OF FIGURES
Figure Pages
1. Simplified framework for assessing livestock water productivity .........................................10
2. Map of study sites ..................................................................................................................15
3. Frequency distribution of the level of education in the study systems ..................................29
4. Variability of feed resources availability and ingredients across the study systems based on
sample farms perception and researchers’ estimate of dry matter production……………...34
5. Proportion of grass-legumes composition on dry matter bases in study sites .......................36
6. Farmers selective feeding of livestock across system............................................................52
7. Average livestock water productivity among wealth group of smallholders in the study site s.
………………………………………………………………………………………………72
xv
LIST OF TABLES IN APPENDIX
Appendix Table Pages
1. Landholding size and cattle number based wealth clusters ...................................................93
2. Grain to residues dry matter conversion factor ......................................................................93
3. Climatic factors (Temperature, humidity, Wind, Sun, Radiation and ET) in each farming
system of Woredas ................................................................................................................94
4. Conversion factors of livestock number to Tropical Livestock Unit (TLU) and Daily Dry
matter Requirements (DDMR) for livestock species ............................................................97
5. Metabolisable Energy (MJ/kg DM), gross energy (GE) (MJ/kg DM) and IVDMD (%) of
different feed sources ............................................................................................................98
6. Major crop domination of area (%) per household in the study sites ....................................99
7. Dominant herbaceous names and frequency (%) in the study sites .......................................99
8. Feeding calendar for all Woredas ........................................................................................101
9. Rank given to preference for crop residues by livestock .....................................................103
10. ANOVA output (Degree freedom and mean square of variables, coefficient of variation,) in
study sites ............................................................................................................................104
11. Questionnaires for the survey ............................................................................................105
xvi
ABSTRACT
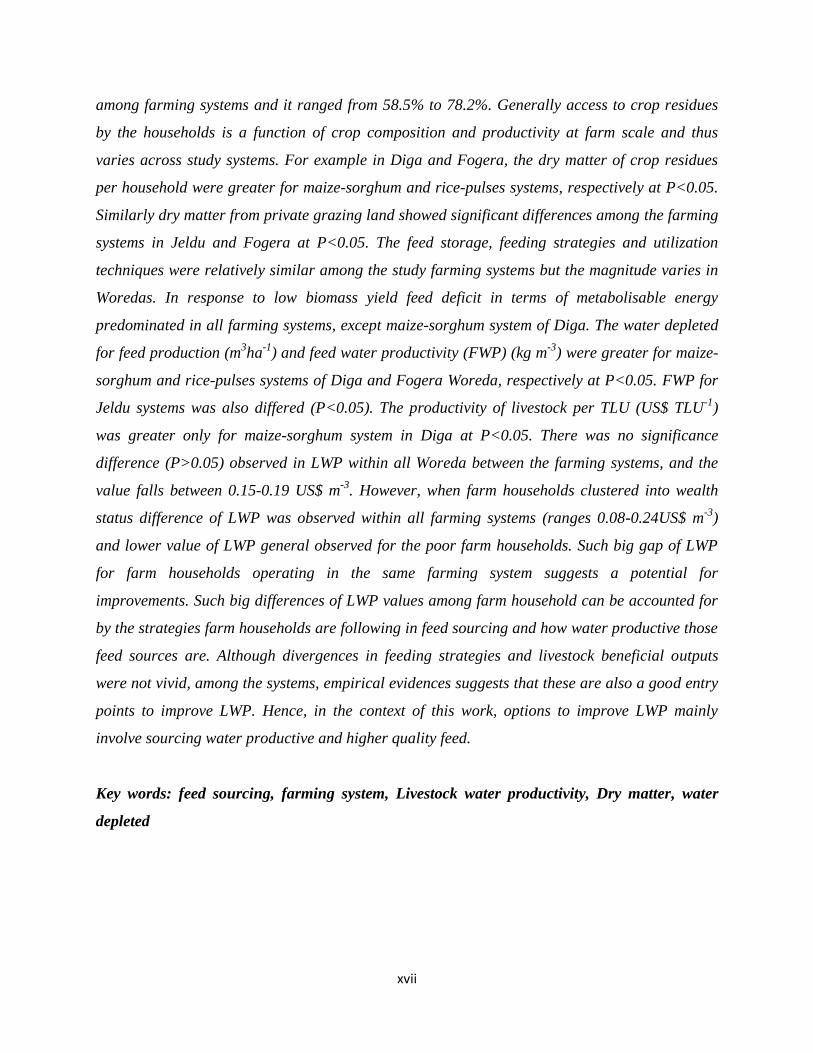
This study was conducted to assess livestock feed sourcing and feeding strategies and their
implications on livestock water productivity (LWP) in mixed crop-livestock production systems
of the Blue Nile Basin (BNB) in Ethiopian Highlands. Three Woredas (Diga, Jeldu and Fogera)
representing diverse agricultural farming systems were considered. One watershed in each
Woreda, which is Dapo from Diga, Meja from Jeldu and Mizuwa from Fogera were selected.
Each watershed further stratified to different farming systems depending on cropping pattern
and landscape positions. Accordingly seven farming system has been identified. Diga has teff-
millet and maize-sorghum farming systems; Jeldu has barley-potato, teff-wheat and teff-sorghum
farming systems; and Fogera has teff-millet/maize and rice-pulses farming systems. A multi-
stage stratified random sampling technique was employed to select farm households. A total of
220 household were selected: where 67 household from Diga, 91 household from Jeldu and 62
household from Fogera Woreda. A structured questionnaire, group discussions, plant biomass
sampling, literature and survey were done to generate data on farmers feed sourcing and feeding
strategies. To estimate livestock water productivity, water depleted (evapotranspired) for
livestock feed was estimated using reference evapotranspiration and crop coefficient and then
LWP was estimated as a ratio of livestock’s beneficial outputs and services to depleted water.
The results indicated that the major feed sources in the BNB were mainly from natural pasture
and crop residues. Improved feed sources including those with denser metabolisable energy
were not reported. The share of crop residues on dry matter basis was highest in all study sites.
In the study farming system the contribution of crop residues to livestock feed sourcing varied
xvii
among farming systems and it ranged from 58.5% to 78.2%. Generally access to crop residues
by the households is a function of crop composition and productivity at farm scale and thus
varies across study systems. For example in Diga and Fogera, the dry matter of crop residues
per household were greater for maize-sorghum and rice-pulses systems, respectively at P<0.05.
Similarly dry matter from private grazing land showed significant differences among the farming
systems in Jeldu and Fogera at P<0.05. The feed storage, feeding strategies and utilization
techniques were relatively similar among the study farming systems but the magnitude varies in
Woredas. In response to low biomass yield feed deficit in terms of metabolisable energy
predominated in all farming systems, except maize-sorghum system of Diga. The water depleted
for feed production (m3ha
-1) and feed water productivity (FWP) (kg m
-3) were greater for maize-
sorghum and rice-pulses systems of Diga and Fogera Woreda, respectively at P<0.05. FWP for
Jeldu systems was also differed (P<0.05). The productivity of livestock per TLU (US$ TLU-1
)
was greater only for maize-sorghum system in Diga at P<0.05. There was no significance
difference (P>0.05) observed in LWP within all Woreda between the farming systems, and the
value falls between 0.15-0.19 US$ m-3
. However, when farm households clustered into wealth
status difference of LWP was observed within all farming systems (ranges 0.08-0.24US$ m-3
)
and lower value of LWP general observed for the poor farm households. Such big gap of LWP
for farm households operating in the same farming system suggests a potential for
improvements. Such big differences of LWP values among farm household can be accounted for
by the strategies farm households are following in feed sourcing and how water productive those
feed sources are. Although divergences in feeding strategies and livestock beneficial outputs
were not vivid, among the systems, empirical evidences suggests that these are also a good entry
points to improve LWP. Hence, in the context of this work, options to improve LWP mainly
involve sourcing water productive and higher quality feed.
Key words: feed sourcing, farming system, Livestock water productivity, Dry matter, water
depleted
1
1. INTRODUCTION
The Ethiopian Highlands, which cover major parts of the Blue Nile Basin (BNB), are highly
populated by people and livestock (CSA, 2008). The density ranges from 37-120 person/km2
and 27-130 TLU/km2. This is one of the major reasons for severe degradation of the natural
resources base in this part of the country. Approximately 88% of the human, 75% of the cattle,
75% of the sheep and 34% of the goat population in Ethiopia are found in the Highlands
(CSA, 2008).
Livestock keeping is an intensive use of the earth’s increasingly scarce water resources. Water
productivity in agriculture highlights livestock as a key area for water productivity
improvement (Molden, 2007). There are many ways in which livestock affect water
productivity across a landscape, but the most important one is through the feed that they
consume (Tilahun et al., 2009) and therefore understanding the interactions between livestock
and water is an important avenue in improving water productivity of livestock. Steinfeld et al.
(2006) also indicated that significant volumes of water are withdrawn globally for the
production of feed. The presence of heavy grazing also disturbs water cycles, reducing
replenishment of below ground water resources, ultimately impacting sustainable livestock
and crop production. In general, there is a growing concern that increased water scarcity and
water competition among different uses and users can hinder meeting increasing food-feed
demands (Benin et al., 2006).
The BNB shares similar problems of unproductive and inefficient uses of water by the
agricultural sector. Recent studies indicated that much rain water is lost as unproductive run
off and evaporation and high volume of water is required to produce a liter of milk
(Descheemaeker et al., 2010a). Although livestock benefits in mixed crop livestock systems
are more than just milk production, the current situation affects sustainable use of the scarce
water resource and the livelihoods of smallholder farmers. Amare et al. (2009) suggests that
adequate feed supply largely determines livestock production while the ways feed is produced
and supplied to the animal affect the water productivity of livestock and ecosystem services.
Furthermore, the findings of Solomon et al. (2009) advocate some strategies and technological
2
options such as improved feeds, better herd management (e.g., appropriate herd structure such
as age and weight) that should be taken into account to enhance Livestock Water Productivity
(LWP).
It is necessary to understand scientific links among LWP, feeding and feed sourcing strategies
and selecting best practices that fit different farming systems and landscapes in the mixed crop
livestock systems. In this respect Amare et al. (2009) suggested that in addition to feed
sourcing, dry matter (DM) productivity and feed quality are important factors influencing the
volume of water needed to support animal production. For example, the lower the DM
productivity the more land is required to produce sufficient quantity of feed to satisfy the
metabolisable energy (ME) and protein requirements of livestock. In terms of quality of feed,
a recent study in Indo-Ganga Basin (Amare et al., 2011a) suggested that the total DM
requirement of livestock to meet certain production targets can be reduced by improving feed
quality. For example, by changing feed quality from 7 MJ kg-1
to 8.5 MJ kg-1
as much as 120
m3 of water can be saved per cow per year. The saved water can be used for ecosystem
services or alternative livelihood activities (e.g., supplemental irrigation for crops or additional
milk production). The same study further elaborated that not only the feed quality, quantity
and productivity that matters but also contact between livestock and the environment. For
example, feeding strategies such as cut and carry systems, and tethering can mitigate
livestock’s impact on nutrient fluxes between and within systems (e.g., erosion), and through
such practices considerable amount of energy can be saved which otherwise will be spent in
walking in search of feed (Descheemaeker et al., 2010a). This has strong implication for LWP.
Feeding strategy also includes how we synchronize temporal and spatial availability of feed
and water resources to enhance efficient use of feed resources and also mitigate over grazing
of areas around limited watering points.
Peden et al. (2006) and Amare et al. (2009) pointed out that the management of different
species and breeds of domestic animals and their interaction with water vary in different
farming systems due to farmers’ diverse livelihood strategies (i.e., livestock or crop focused
livelihood) and the resources base. Understanding spatial and temporal variability of these
interactions and circumstances that result in unproductive water use is important to enhance
3
LWP (Peden et al., 2007; Peden et al., 2009). Therefore, it is important to understand the
farming systems and landscape feed sourcing and feeding strategies in the Highlands of BNB.
Thus, generating baseline information in this area will serve as a reference point to explore
different water efficient feed sourcing and feeding practices. Furthermore, most of the research
works related to livestock feed resources in different parts of the country, focused on feed
demand and supply analysis and the feed rationing exercises. Most often they also consider
parameters such as feed cost and feed quality. This thesis argues that an insight of the water
productivity of feeds and efficient uses of water productive feeds is equally important.
Therefore the objectives of this study were:
To identify the different livestock feed sourcing and feeding strategies and their
dynamics across different landscapes and farm typologies in mixed crop livestock
systems of the BNB
To assess the dry matter productivity and implications for feed demand-supply and
farmers coping mechanisms in time of feed shortage in mixed crop livestock systems
of the BNB
To assess the effects of current feeding strategies on livestock water productivity
To propose alternative livestock feed management practices that make water more
productive, enhance ecosystem services and improve livelihoods of the smallholders
4
2. LITERATURE REVIEW
2.1. Feed Resources in the Ethiopian Highlands
In the Highlands of Ethiopia (including major parts of the Blue Nile Basin), livestock feed
resources are mainly from natural pasture, crops residues and stubble grazing. The
contributions of these ingredients to the total feed resource base vary across systems, seasons
of the year and farm typology (Seyoum et al., 2001). Temporal and spatial variation of the
feed resources in terms of access and availability and quality is a major concern. In general
feed resources availability depends on the intensity of crop production and amount and
distribution of the rain fall (Mohammed and Abate, 1995). Seyoum et al. (2001) noted that
pasture growth is a reflection of the annual rainfall distribution pattern. Despite the good rain
fall in major parts of the BNB, decline in the size and productivity of grazing land is a growing
concern. Numbers of scholars ascribe this to overgrazing and the expansion of arable
cropping. As coping mechanism, farmers in different mixed-crop livestock production systems
are increasingly feeding agricultural by-products to their livestock (Alemu et al., 1991; Abate
et al., 1993; Getinet, 1999; Alemayehu, 2004). The potential use of crop residues as livestock
feed is greatest in mixed crop-livestock farming systems (Kossila, 1988; Getachew, 2002;
Lemma, 2002). Crop residues are required by animals to supply feeds during the dry season
and yet trade off with soil fertility management and crop residue’s poor feed quality are some
of the major challenges.
2.1.1. Natural pasture
Natural grassland consists of the main Highlands pastures of Ethiopia and the grassland of
Ethiopia accounts for about 30.5% of the area of the country (Alemayehu, 2004). The change
of species composition in the grassland vegetation naturally depends upon a number of factors.
From ecological point of view, grassland develops as a direct expression of the climate and
other sets of factors which are unfavorable for the growth of trees (Zerihun, 1985) including
altitude, soil and farming system (Alemayehu, 2004). In the Highlands of Ethiopia, seasonal
fluctuation in the availability and quality of natural pasture is a common phenomenon which
5
results in serious feed shortage thereby affecting livestock production and productivity (Zinash
et al., 1995; Alemayehu, 1998; Solomon, 2004). Grazing of pasture and rangelands is an
integral component of livestock production systems in many countries (Johanston et al., 1996).
Livestock grazing stimulates nutrient mobilization and uptake through consumption of
vegetation; in that mobilization of nutrients to the growing points is enhanced by frequent
defoliation (Mohamed, 1998).
The degradation of the BNB grazing land relates to a combination of human exploitation
exceeding the natural carrying capacity of the land resources systems, and inherent ecological
fragility of the systems (Mohamed and Abyie, 1998). Grazing lands biomass yield is very low
(e.g., 1.6 ton ha-1
in Fogera) (Descheemaeker et al., 2010b). This has a negative implication
for LWP value. But the magnitude of biomass varies by intensity of grazing. For example,
biomass yield on non-grazed area varied from 2.84–4.13 ton ha-1
whereas on grazed area
varied from 0.84–2.25 ton ha-1
(Grima and Peden, 2003). According to Alemayehu (1987), in
the Highlands of Ethiopia, the annual DM yield of the natural pasture on seasonally
waterlogged fertile areas was estimated to be 4-6 ton ha-1
. But the concern here is that only
water loving species may grow and thus the overall nutritional value of pastureland will be
affected. Biomass yield decreased as the altitude increases. Farming systems and altitude are
important variables affecting vegetation distribution (Ayana, 1999; Amsalu, 2000). Botanical
composition of plant species and productivity of the pasture land are highly influenced by
animal species, intensity of grazing and edaphic factors. Biomass production over time varies
and therefore, causes seasonal variation in forage availability (Holechek et al., 1998).
In addition to biomass yield, pasture management practices appear to affect floristic
composition. For example, continuous over stocking decreases the proportion of desirable
species and favors infestation by less nutritious and unpalatable species (Ahmed, 2006).
6
2.1.2. Crop residues and other agro-industrial by-products
Crop residues represent a large part of feed resources, most of which are underutilized (Alemu
et al., 1991). Cereal crop residues are the most important feed resources for ruminants in
developing countries (Reed, 1985). Crop Residues described as roughages that become
available for livestock feed after crops have been harvested (World Bank, 1989; Nordblom and
Shomo, 1995). Crop residues are distinct from agricultural by-products: such as bran, oil seed
cakes, which are generated when crops are processed in different industries for food main
products. Crop residues can usually be grouped by crop type including cereals, grain legumes,
roots and tubers. The role of crop residues as feed sources depends mainly on degree of
intensification of crop-livestock systems and shortage of feed from natural pasture. In major
parts of the BNB crop residues are important ingredient and the type of residues depends on
the major cropping systems, (i.e., maize, teff, wheat, barley, rice based). As the ME values and
digestibility of these crop varies associated LWP values can be influenced. In many parts of
the BNB, farmers collect and store residues after harvest. Most farmers selectively feed milk
cows and work animals during critical feed shortage time. Depending on cropping systems
some farmers may mix cereals residues with legumes to enhance the nutritive value and
consequently the LWP.
In most parts of the BNB, stubble is also important feed resources. For example, Bekele
(1991) reported an average DM yield of 2 ton ha-1
year-1
with 0.3 feed use factors (30%
utilization rate of crop stubbles). According to FAO (1987), utilizable average Dry Matter
Yield (DMY) of stubble grazing is estimated to be 0.5 ton ha-1
year-1
. This shows strong
variability across systems. Zinash and Seyoum (1991) reported that in the central Highland
zone (Shewa administrative region which include some parts of BNB) the available feed
resources (grazing and agricultural by-products) could only meet the maintenance
requirements of animals and half of the total cow herd the existing production requirements at
level of 5 liter day-1
. Getachew et al. (1993) also indicated that on average, the available feed
per farm meets only maintenance requirements of animals and very little is left over for
growth and production. Small holder farmers’ use of feed concentrates such as bran and oils
seed cake occurs mostly in peri-urban areas due to less availability and affording capacity.
7
Many livestock production systems rely on crop residues as the main feed resource. Thus,
enhancing water productivity on the plant side would also enhance productivity of the
livestock. In general the interdependency between the crop production and livestock shows the
role of livestock in improving resources uses efficiencies and obviously LWP will increase
from efforts to improve crop water productivity (Sonder et al., 2004).
2.2. Feeding Calendar and Farmers Coping Strategies
Study on feeding calendar of livestock in BNB is scarce. Mohamed and Abate (1995)
identified three feeding periods and associated feeding strategies in the Central Highlands of
Ethiopia, which also covers a significant part of the BNB. The first one is the main rainy
season (June-September) when feed is adequate and livestock are under controlled grazing and
crop residues supplement the green fodder from grazing and weeds. The second is the dry
season (October-February) when feed from stubble grazing and crop residues gradually
become available and depending on system farmers may practices open grazing on crop lands,
communal grazing lands and in community forest areas and fallow lands. The last is the period
starting from March to May, when feed supplies decline, although new re-growth may occur
depending on the timeliness and amount of the short rains. In the last calendar period farmers
may selectively feed productive animals (e.g., milk cows and calf) on hay and conserved crop
residues and normally open grazing on: communal grazing areas, crop and fallow lands are
major sources of feed (Getnet, 1999; Yoseph, 1999; Getachew, 2002; Solomon, 2004).
2.3. Livestock Water Productivity: The Concept and its Linkage to Feed Sourcing and
Feeding Strategies
Livestock water productivity (LWP) is defined as the amount of water depleted to produce
livestock products and services including energy (Peden et al., 2007; Sonder et al., 2004). In
this respect, depleted water for feed production is mainly given due attention as drinking water
for livestock is reported to be about 2%. Although, water accounting models have helped
understand crop water productivity, no systematic consideration has been given to understand
livestock’s uses of water and impact on water resources (Sonder et al., 2004). Thus, the
concept of LWP framework was introduced by Peden et al. (2007) to investigate these
8
interactions and find ways to increase livestock production without depleting more water or
causing further environmental degradation. In broader terms, water productivity measures the
ability of agricultural systems to convert water into food and feed and is defined as the ratio of
agricultural outputs to the volume of water depleted for production (Molden et al., 2010).
Globally, current animal production depletes more than 1 x 10¹²
m3 of water per year only for
feed and this is about one seventh of the global water depletion for agriculture (Peden et al.,
2007). However, by 2020, livestock will likely produce more than half of the total global
agricultural output in monetary value. This will place a significant extra demand on
agricultural water resources, especially for livestock feed production. The question is how this
concept relates to feeding and feed sourcing strategies.
The LWP of animals is influenced by the type of feed they consume. In cases where livestock
are fed crop residues and graze rangelands, which are unsuitable for crop production anyway,
livestock make a very effective use of the invested water (Peden et al., 2007). Adequate feed
supply largely determines livestock productivity while the way feed is produced affects the
sustainability of water use (Blümmel et al., 2009). The feed sources and the efficiencies with
which feed is utilized within the animal determine the amount of water required to produce
livestock products and services. Solomon et al. (2009) showed that about 11.5 m3 of water was
depleted to produce 1 kg of meat. According to Singh et al. (2004) and Amare et al. (2011a),
the quantity of water used to produce feed can vary based on the livestock feed sourcing
strategies, such as feed from food-feed crops (e.g., residues, and concentrates; i.e. multiple
uses of water) or from fully irrigated fodders and pasture from grazing lands. Availability of
surface or ground water, distance to and quantity and quality of feed resources and the way in
which these are fed to the animals determine the level of output and water input and ultimately
this impacts the value of LWP.
2.4. Drinking Water Supply and Grazing Land: Synchronizing their Spatial and
Temporal Distribution
Spatial variability in water resources may have a significant effect on the landscape and
efficient uses of grazing land resources (Ryel et al., 2004). It is not always ecologically
9
desirable or economically viable to bring all potential grazing land within reach of permanent
watering points. Water supply has importance in determining grazing distribution on
homogenous landscapes but forage palatability, terrain and tree density are also important in
heterogeneous landscapes. The integrated response to these factors determines resources use
efficiencies and livestock productivity in general. In most parts of the BNB livestock watering
points are not synchronized with feed availability. Particularly in the dry seasons livestock
must trek long distance in search of drinking water. In parts where there are watering points
over grazing is not uncommon. In areas where drinking water is not accessible feed may not
be efficiently used. This means also by distributing drinking water availability, in time and
space, efficient uses of the existing feed can be enhanced and at the same time energy spent on
walking in search of water can be reduced (Peden et al,. 2007).
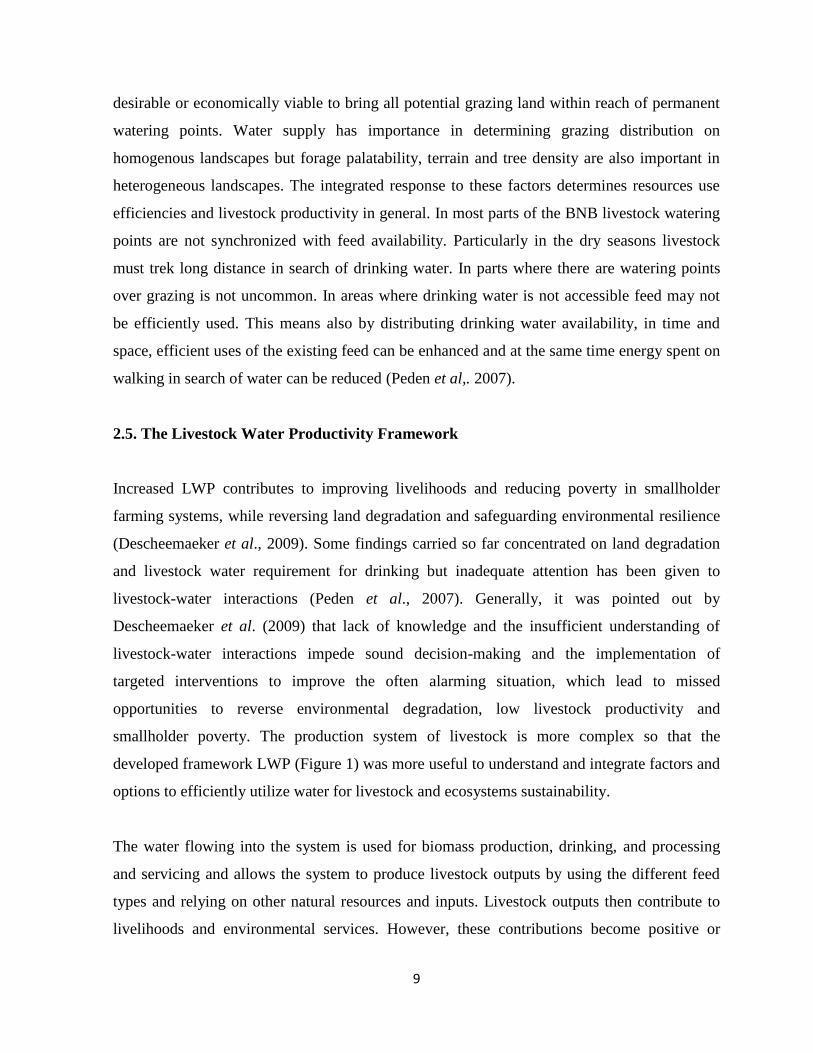
2.5. The Livestock Water Productivity Framework
Increased LWP contributes to improving livelihoods and reducing poverty in smallholder
farming systems, while reversing land degradation and safeguarding environmental resilience
(Descheemaeker et al., 2009). Some findings carried so far concentrated on land degradation
and livestock water requirement for drinking but inadequate attention has been given to
livestock-water interactions (Peden et al., 2007). Generally, it was pointed out by
Descheemaeker et al. (2009) that lack of knowledge and the insufficient understanding of
livestock-water interactions impede sound decision-making and the implementation of
targeted interventions to improve the often alarming situation, which lead to missed
opportunities to reverse environmental degradation, low livestock productivity and
smallholder poverty. The production system of livestock is more complex so that the
developed framework LWP (Figure 1) was more useful to understand and integrate factors and
options to efficiently utilize water for livestock and ecosystems sustainability.
The water flowing into the system is used for biomass production, drinking, and processing
and servicing and allows the system to produce livestock outputs by using the different feed
types and relying on other natural resources and inputs. Livestock outputs then contribute to
livelihoods and environmental services. However, these contributions become positive or
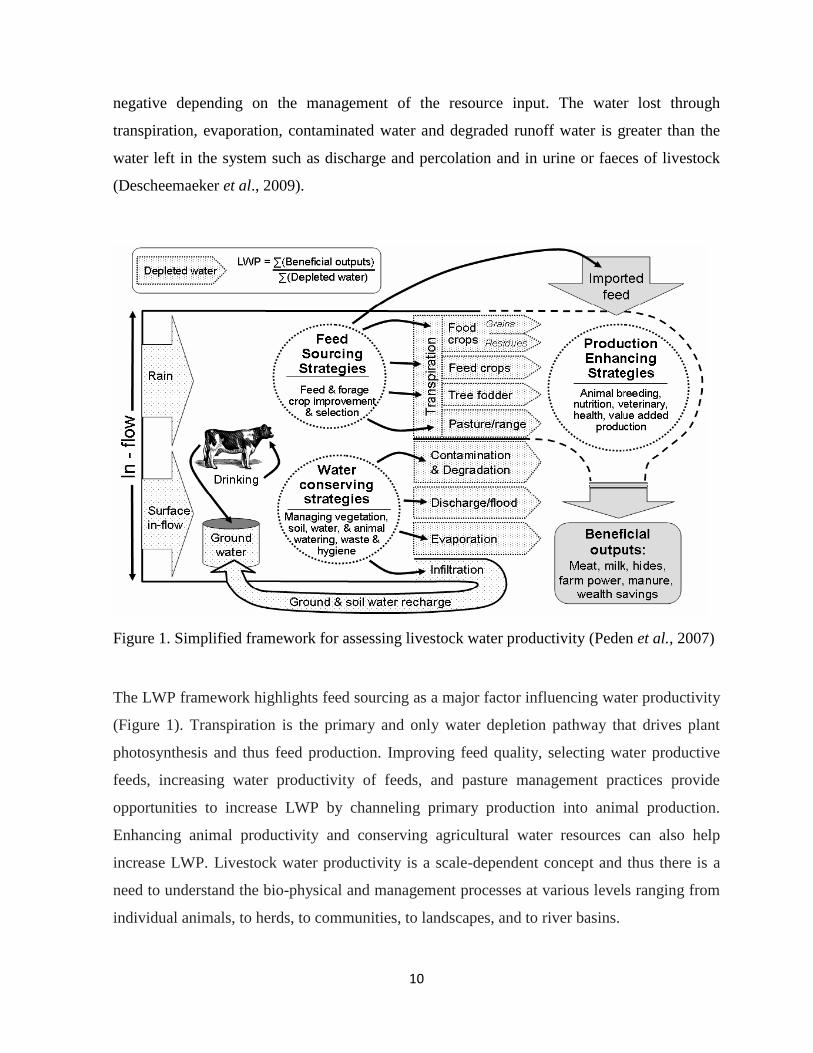
10
negative depending on the management of the resource input. The water lost through
transpiration, evaporation, contaminated water and degraded runoff water is greater than the
water left in the system such as discharge and percolation and in urine or faeces of livestock
(Descheemaeker et al., 2009).
Figure 1. Simplified framework for assessing livestock water productivity (Peden et al., 2007)
The LWP framework highlights feed sourcing as a major factor influencing water productivity
(Figure 1). Transpiration is the primary and only water depletion pathway that drives plant
photosynthesis and thus feed production. Improving feed quality, selecting water productive
feeds, increasing water productivity of feeds, and pasture management practices provide
opportunities to increase LWP by channeling primary production into animal production.
Enhancing animal productivity and conserving agricultural water resources can also help
increase LWP. Livestock water productivity is a scale-dependent concept and thus there is a
need to understand the bio-physical and management processes at various levels ranging from
individual animals, to herds, to communities, to landscapes, and to river basins.
11
3. MATERIALS AND METHODS
3.1. Description of the Study Sites
This research was undertaken in Diga, Jeldu and Fogera Woredas, as part of the Nile Basin
Development Challenge (NBDC) project: a project which is financed by the Challenge
Program on Water and Food (CPWF) and implemented by the International Livestock
Research Institute (ILRI) and International Water Management Institute (IWMI). These three
sites were already selected by the project team for their good access and representativeness of
the mixed crop livestock systems of the BNB. Three study watersheds one from each Woreda
were selected. The watersheds identified were; Dapo from Diga, Meja from Jeldu and Mizewa
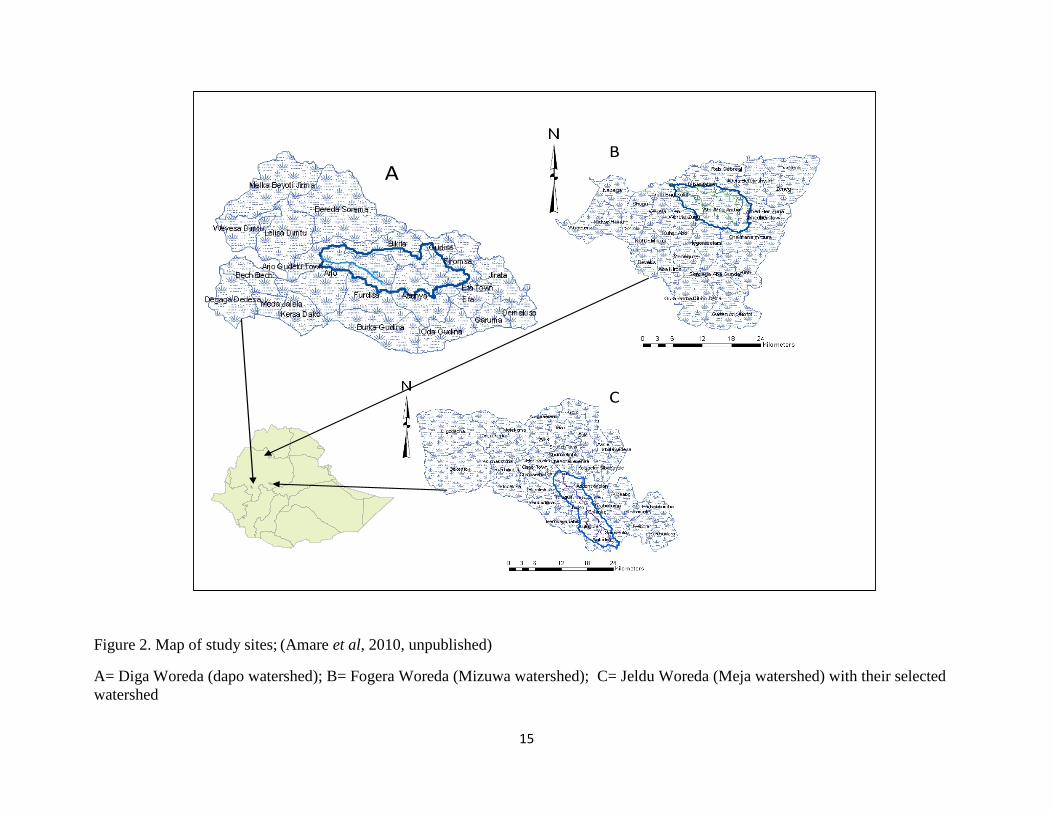
watershed from Fogera (Figure 2).
Diga Woreda
Diga Woreda is located in Oromia Regional Sate (Ethiopia) and in the Southwest of the BNB.
The Woreda is bordered in the Northeast by Guto Gida Woreda and in the West by the
Didessa River (Figure 2). The altitude of the Woreda varies from 1,200 to 2,342 meters above
sea level (masl). The area is one of the highest rainfall regions of the Ethiopian Highlands. It
has a range of mean annual rainfall of 1,376 –2,037 mm and mean minimum and maximum
temperature 15 0
C and 27 0
C, respectively (Birhanu et al., 2011). According to information
from the Woreda’s Agriculture and Rural Development Office, the livestock population
includes about 60,592 cattle, 11,893 sheep, 6,426 goats, 147 horses, 48 mules, 3066 donkey
and 32648 poultry (DARDO, 2011). Human population in 2011 was about 80,105 of which
39,249 and 40, 856 were males and females, respectively.
The land use pattern in lower landscape position area is dominant by maize, sorghum, millet
and sesame and perennial crops coffee and mango. In the medium landscape position, teff,
millet and maize are important in that order of magnitude. Information from the Woreda
Agriculture and Rural Development Office estimates area under the different land use land
cover at 15,966 ha cereals, 1,118 ha pulse, 4,485 ha oil crops, 4,305 ha root and tuber, 156 ha
12
vegetables and 2,872 ha fallow lands. The area of grazing estimated was 361 ha private
grazing land and 5,700 ha forest and shrub land (DARDO, 2011).
Discussion with Woreda officials suggests that vegetation cover in Woreda has been
decreasing from time to time through expansion of cultivation. Large areas of forest have been
cleared in the last 10 years. Dominant tree species in the area are; Ficus vasta, Vernonia
amygdalina, Ficus gnaphalocarpa, Vepris dainelli, Piliostigma thonningii, Tephrosia spp.,
Stereosprmum kunthianum, Kalanchoe deficiens, Apodytes dimidiate, Stereosprmum
kunthianum, Celtis africana and Acacia nilotica. Some of the common herbaceous plants
found in study site are; Eleusine coracana, Cynodon dactylon, Andropogon gayanus,
Digitaria abyssinica, Aeschynomene elaphroxylon, Phalaris paradox, Cenchrus
pennistiformis, Enteropogon samalensis, Ageratum conyzoides, Bothriochloa radicans,
Cyperus rigidifolius, Hyperania spp, Echinochloa crus-galli and Trifolium spp.
Jeldu Woreda
Jeldu Woreda is located in Oromia Regional State and at about 130 km West of Addis Ababa
and in South of the BNB. It lies at altitude of 1800-3200 masl and has a rainfall ranging
between 900-1350 mm. The mean minimum and maximum temperature is 9 0
C and 27 0
C
respectively. According to Jeldu Woreda Agriculture and Rural Development Office, livestock
population in 2011 was about 195,681 cattle, 76,272 sheep, 36,897 goat, 17,771 horse, 755
mule, 7,377 donkey and 66,300 poultry. For the same physical year the total human population
of the Woreda is estimated at about 202,655 of which 99,886 were males’ population, while
the differences were females (JARDO, 2011).
In Jeldu Woreda there are three farming system as defined by biophysical settings and farming
practices. Barley, potato and wheat dominate the Highlands at altitude ranging between 2700
and 3200 masl. Teff, wheat and sorghum dominate mid altitude ranging between 2300-2700
masl. Teff, sorghum and maize dominate lower altitude ranging between 1800-2300 masl. In
the Woreda, generally, cereals, pulses, oil crops and vegetables cover 45317 ha, 2152 ha and
787 ha, respectively. There are 1807 ha of grazing land and 3500 ha of forest (JARDO, 2011).
13
Like in Diga, here also vegetation cover has been decreasing due to heavy deforestation in the
last 10-20 years. All farming systems exhibit decreasing species composition. Currently
eucalyptuses occupy most of the watershed especially in the Highland and mid altitude areas
and mainly planted to generate cash income. Some of the common tree species in the study
farming systems area are: Ficus vasta, Grewia ferruginea, Dracaena stedneri, Cordia
Africana, Erythrina brucei, Vernonia amygdalina, Hagenia abyssinica, Maytenus ovatus,
Apodytes dimidiate and Dracaena stedneri. The common herbaceous plant species in study
sites are Andropogon gayanus, Cyperus rigidifolius, Andropogon dumereri, Erogrostis spp.,
Pennisetum schimperi, Snowdenia polystachya, Sporobolus indicus, Phalaris paradox and
Trifolium rueppellianum.
Fogera Woreda
Fogera Woreda is located in the Amhara Regional State and in the Northeast of the BNB
specifically to the East of Lake Tana. Fogera Woreda comprises of a large flat floodplain in
the vicinity of the lake and contributing hilly catchments to the East. The altitude varies from
1774-2410 masl (IPMS, 2005). Rainfall varies from approximately 1,000 mm on the plains to
about 1,500 mm at higher altitudes and has a mean annual rainfall of 1200 mm and mean
minimum and maximum temperature 110C and 27
0C, respectively. According to the Woreda
Agriculture and Rural Development Office, for year 2011 the livestock population was
estimated at 194,135 cattle, 19,027 sheep, 26,920 goats, 36 horses, 1,119 mules, 14,433
donkey and 133, 278 poultry (FARDO, 2011). For same physical year the total human
population of the Woreda was about 216,211: of which 112,665 and 103,546 were males and
females, respectively.
The land use pattern of Fogera Woreda includes: 46.4 % cultivated land, 8.2 % grazing land,
20.1 % water bodies (Belete, 2006). When the cultivated land is disaggregated annual crops
such as cereals 33126 ha, pulse 1230.5 ha, oil crops 2988.5 ha, roots 470 ha and vegetables
251 ha constitute the major share. The area allocated to grazing and forest land was 13,490.6
ha and 2101.54 ha, respectively (FARDO, 2011). Accordingly, teff-millet/maize and rice-
pulse are the two farming systems in Fogera Woreda. Vegetation cover in the area is low
14
because of a long agricultural practice and enormous erosion hazard in hilly areas. Discussion
with local communities suggests that both farming systems exhibit decreasing species
composition and areas of woody vegetation. In rice-pulse farming system the dominance of
eucalyptus trees are thoroughly noticed. Some of the common tree species in teff-millet/maize
based system are Cordial Africana, Phytolacca dodecandra, Dodonacea viscose, Syzygium
guineense and Vernonia natalensis. The common herbaceous plant species in study sites:
Andropogon gayanus, Echinochloa crus-galli, Cyndon dactylon, Andropogon dumereri,
Erogrostis spp., Commelina benghalensis, Cyperus rotundus, Trifolium rueppellianum and
Trifolium spp.
3.2. Stratification and Household Survey
A multi stage stratified random sampling technique was employed to select farm households
for this study. First, three Woredas were selected from the BNB and then watershed was
selected from each Woreda. In each watershed, farming systems were stratified based on
dominant cropping pattern and farming practices. From each farming system, two
representative peasant associations (PA) were selected. Households in each PA were grouped
into better off, medium and poor smallholders based on key livelihood assets [e.g., Livestock
and landholding (Appendix Table 1)]. From each peasant associations 4-6 of households were
randomly selected for each group of wealth status. A total of 220 households were randomly
selected and interviewed (Table 1). A questionnaire was designed for collecting data on farm
household characteristics, access to agricultural assets, farming, feed sourcing and feeding
practices. The questionnaire was pretested before the actual survey in Diga and Fogera
Woredas and refined for the formal survey. After designing the questionnaire, two
enumerators drawn from each Woreda experts, in livestock production, were given orientation
and training on household survey. A senior ILRI staff was supervising the formal survey. To
triangulate information collected through household survey, transect walk was made and
group discussions were held with elder farmers, Development Agents, Woreda experts.
15
Figure 2. Map of study sites; (Amare et al, 2010, unpublished)
A= Diga Woreda (dapo watershed); B= Fogera Woreda (Mizuwa watershed); C= Jeldu Woreda (Meja watershed) with their selected
watershed
C
B
A
16
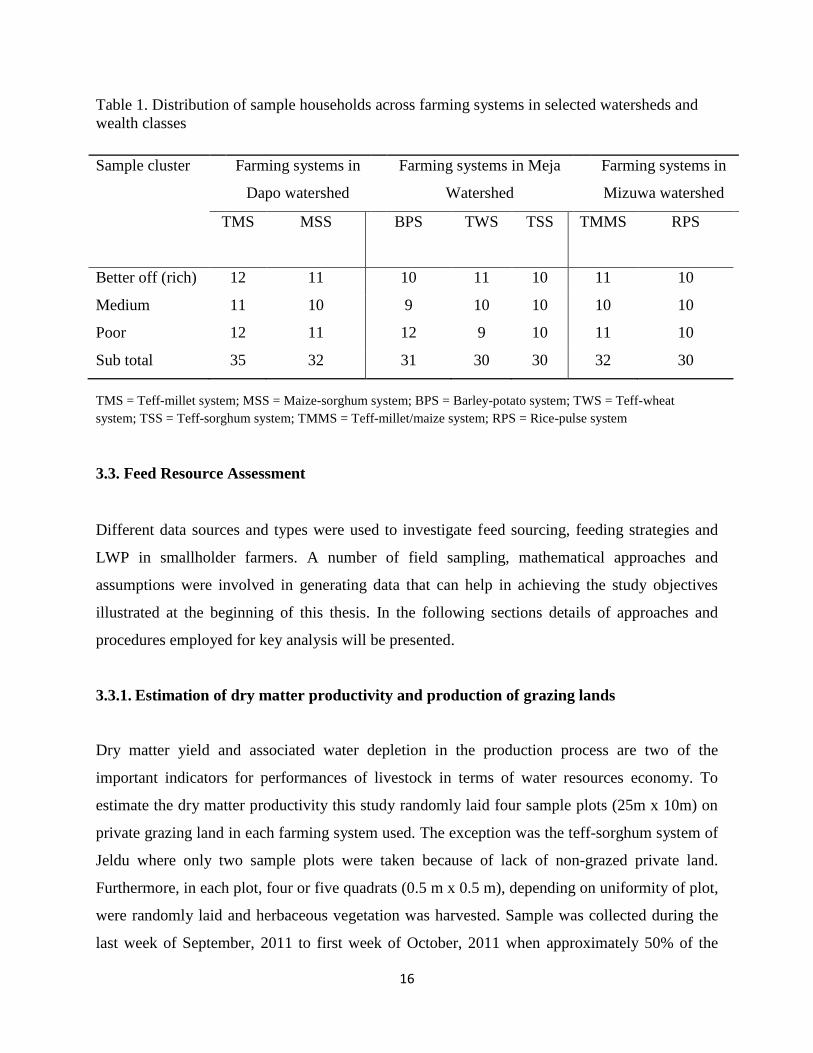
Table 1. Distribution of sample households across farming systems in selected watersheds and
wealth classes
Sample cluster Farming systems in
Dapo watershed
Farming systems in Meja
Watershed
Farming systems in
Mizuwa watershed
TMS MSS BPS TWS TSS
TMMS RPS
Better off (rich) 12 11 10 11 10 11 10
Medium 11 10 9 10 10 10 10
Poor 12 11 12 9 10 11 10
Sub total 35 32 31 30 30 32 30
TMS = Teff-millet system; MSS = Maize-sorghum system; BPS = Barley-potato system; TWS = Teff-wheat
system; TSS = Teff-sorghum system; TMMS = Teff-millet/maize system; RPS = Rice-pulse system
3.3. Feed Resource Assessment
Different data sources and types were used to investigate feed sourcing, feeding strategies and
LWP in smallholder farmers. A number of field sampling, mathematical approaches and
assumptions were involved in generating data that can help in achieving the study objectives
illustrated at the beginning of this thesis. In the following sections details of approaches and
procedures employed for key analysis will be presented.
3.3.1. Estimation of dry matter productivity and production of grazing lands
Dry matter yield and associated water depletion in the production process are two of the
important indicators for performances of livestock in terms of water resources economy. To
estimate the dry matter productivity this study randomly laid four sample plots (25m x 10m) on
private grazing land in each farming system used. The exception was the teff-sorghum system of
Jeldu where only two sample plots were taken because of lack of non-grazed private land.
Furthermore, in each plot, four or five quadrats (0.5 m x 0.5 m), depending on uniformity of plot,
were randomly laid and herbaceous vegetation was harvested. Sample was collected during the
last week of September, 2011 to first week of October, 2011 when approximately 50% of the
17
herbaceous vegetation was in flowering. Immediately after harvest, sample was separated into
grasses and legumes species and weighted by scale grid of 20gm and placed in plastic bags.
Dominant herbaceous species in each quadrat were identified on the field and those species that
were difficult for identification were recorded in local language and translated into scientific
name with Glossary of Ethiopian Plant Names (Wolde, 1987). Dry matter of grasses and legumes
were determined after oven drying at 105 °C for 24 hours at ILRI laboratory in Addis Ababa.
Based on the DM weights obtained, percentages of grasses and legumes from each sample sites
were calculated and summarized to get the value for each farming systems.
3.3.2. Assessment of feed dry matter production and productivity on arable and communal
property resources
Dry matter production from arable land became increasingly an important sources of livestock
feed in mixed crop livestock systems. To estimate the dry matter production and productivity
from crop land a harvest index approaches were used. Data on land holding, cropping pattern and
productivity were collected through household survey. These data sets were cross-checked with
Woreda annual report of crop productivity and production. The quantity of crop residues
produced from each crop type was estimated by harvest index as suggested in FAO (1987).
Accordingly, a multiplier of 1.5 for small cereals such as wheat, barley, oat and teff straw; a
multiplier of 1.2 for pluses such as faba bean, field pea, chick pea and haricot bean straw, a
multiplier of 2.0 for maize and 2.5 for sorghum was used (Appendix Table 2). The annual
stubble grazing was estimated with a conversion factor of 0.5 ton ha-1
(FAO, 1987). Harvested
crop residue does not necessary implies that it is used for feed. There are competitive uses and
also limitation by accessibility and nature of the residues itself. Given strong feed deficits and
priority given to livestock in the highland mixed crop livestock systems we assumed that about
90% of crop residues are used as a feed to determine the potential supply (Adugna and Said,
1994). Access to feed resources on common property resources is important in the mixed crop
livestock systems. The fact that this land unit is openly grazed and communally owned makes its dry
matter productivity estimation and understanding the share of individual household often very
difficult. In this thesis dry matter productivity (2 ton ha-1
yr-1
) was estimated as suggested by FAO
(1987). Then this was factored into total communal grazing areas in a farming system, total
18
households and associated TLU eligible to graze on this the land unit. Trees used for browsing
were rarely encountered in all study systems. This is mainly associated with dominance of
eucalyptus trees which are not normally preferred by livestock. The exception is for Diga where
fodder tree species were available and farmers were claiming feeding of livestock on tree leaves
if drought prolonged. Accordingly, estimation of dry matter from browsing trees and shrubs of
leaf biomass was estimated at 1.2 ton ha-1
(FAO, 1987). In quantifying tree feed resources from
common property resources (e.g., open forest areas) at individual household level similar
approaches, as communal grazing area mentioned earlier, was used. Empirical evidence, from
WBISPP (2002), suggests that only about 75% of all available DM is accessible by livestock for
use and therefore this study used the same accessibility factor to quantify total DM utilized by
livestock from grazing and browsing areas.
3.4. Estimation of Water Depleted in Producing Livestock Feed
Livestock provide benefits and services using metabolisable energy embodied in the different
feed resources. In the process of converting solar energy to Metabolisable energy huge amount
of water is depleted through evapotranspiration [ET (Amare et al., 2011a)]. LWP is an indicator
of how water productive on these livestock productive and services are and therefore it is a factor
of information on: livestock beneficial outputs, services and evapotranspired water to produce
livestock feed.
To generate the evapotranspiration (ET) information, climatic parameters such as radiation,
temperature, humidity, precipitation and wind speed needed. This study used a tool called New
LocClim (FAO, 2005) which can generate these metrological data for sites with known
geographical positions. Then, to calculate ET of a known crop the reference evapotranspiration
(ETo) in mm day-1
and crop coefficient (Kc) approaches (FAO, 1998) were used. ET for each
crop types for growing length was computed from weather data using CROPWAT 8.0 software
(FAO, 2003). FAO (1992) recommended Penman-Monteith method as a standard method for the
definition and computation of the reference evapotranspiration (ETo). Reference
evapotranspiration calculated for Diga Woreda was from Nekemte and Didesa metrology
stations where as for Jeldu Woreda Ambo and Guder metrology stations were used. For Fogera
19
Woreda Bahir Dar, Debra-Tabor, Addis Zemen and Gorogora metrology stations were used
(Appendix Table 3). The Length Growing Period (LGP) used for each crop was collected from
group discussion held in each study farming system. Kc values from some pulse crop are not
established. In calculating ET of these pulse crops, average Kc of a family was used (for
example, chickpea, and grass pea and haricot bean). Proportion of grass to legume was
considered during the calculation of ET for natural pasture in each farming system. On crop
field, this depleted water serves both for the grain and residues. Therefore separation between
grain and residues was important (Amare et al., 2011a). In this thesis harvest index approaches
as suggested by Amare et al., (2011a) employed and linked to area under each crop types and
utilization factors indicated in previous section and Table 13 and 14. The following equations
shows mathematical relation of the different data sets used in calculation of water depleted for
livestock feed.
ETci= ETo*Kci*LGPij……………………………………………………………………Eq. (1)
Where;
ETci = The total water depleted for ith
crop types biomass (grain and crop
residues) or grazing land in mm per during growing season in ith
farming system
EToi = The average reference evapotranspiration in mm per day of the ith
farming system
Kci = Crop coefficient of the ith
crop type/grazing land
LGPij = Length of growing period in days of the ith
farming system for jth
crop types/grazing land
1. Water depleted for crop residues
WDCRi =(ETci*(1-HIi)*GA*CRui)/1000 ............................................. ...............................Eq. (2)
Where;
WDCRi = Water depleted for crop residues in m3 per household farm of
the ith
crop type and utilized by livestock.
20
ETci = Total water depleted in mm per growing period of the ith
crop type
in ith
farming system
HIi = Harvest index used to portioned grain to crop residues of ith
crop
type (grain yield of ith
crop types to total biomass above ground of
ith
crop types)
GA = Growing area of ith
crop types in meter square per household
CRui = Utilization factor (%) of the crop residue of the ith
crop type per
household.
2. Water depleted for grazing lands (private, communal and fallow lands)
WDGLxi = (ETcxi*GLAxi*GLul)/1000…………………………………………………..Eq. (3)
Where;
WDGLxi = Total water depleted for production of feed dry matter on
grazing land in m3 for household x in the i
th farming system
ETci = Total water depleted in mm per growing period for grazing land
in ith
farming system
GLAxi = Grazing land area of farm x (in m2) per household of the i
th
farming system
GLui = Feed use factor of grazing land of the ith
farming system
3. Depleted water for livestock feed
DWLFxi =
n
i
iWDCRx1
+
n
l
WDGLxi1
.................................................... …………………...Eq. (4)
Where;
DWLFi = Total depleted water in m3 per x household per year for
livestock feed in the ith
farming system
WDCRxi = Water depleted for crop residues in m3 per x household farm
of the ith
crop type and utilized by livestock
21
WDGLxi = Total water depleted for dry matter from grazing land in m3
per x household farm of the ith
farming system
3.5. Estimation of Livestock Beneficial Outputs and Service
Livestock beneficial outputs and services involve milk, meat, traction, threshing, transportation,
manure estimated in monetary value of particular sites. The estimation of livestock products and
services requires information on the livestock herd structure (Amare et al., 2009). Livestock
products and services data established based on information on livestock herd structure and age
composition, activities and productivity levels collected through the household survey. The
output and services of livestock value was estimated in US$ per household as fallows;
1. Milk yield value
MYVji = (AMYji*NLCji*ALGji*MVi)……………………………………………………Eq. (6)
Where,
MYVji = Milk yield value (US$) of jth
household in the ith
farming system
AMYji = Average milk yield (liter) per day per cow of the jth
household in
ith
farming system
NLCji = Number of lactating cow in jth
household in the ith
farming system
ALGji = Average lactation length (days) cows in jth
household in the ith
farming system
MVi = market price of milk (US$ per liter) in ith
farming system in
reference to 2010-11
2. Off-take value (sold, slaughtered and gifted)
In this study off-take rate at household level was use as indicator of beneficial outputs obtained
from livestock. It was estimated by considering current market price (in ETB converted to US$)
of livestock according to age of the different livestock species that a farm has sold, slaughtered
and gifted out.
OTVji ∑ …………………………………………………………Eq. (7)
22
Where,
OTVji = Total value of off take from all types of livestock per jth
household per year in the ith
farming system
NLOTi = Number of livestock off take (slaughtered, sold and gifted) of
the ith
livestock types per household
MVij = Market value (US$) of respective slaughtered, sold and gifted of
the ith
livestock types per jth
household in the farming system
3. Services from livestock
The services from livestock considered in this study were ploughing, threshing and
transportation. These were estimated using equation 8 as follows;
∑ ( ) ……………………………………………………...Eq. (8)
Where,
VOSji = The total value of services from all livestock types delivered per
year per jth
households in the ith
farming system
NLji = Number of the jth
type of livestock performed ith
type of service
per household
TDji = Average total days of the jth
type of livestock performed ith
type of
service per year
MVji = Market value (US$) of the jth
types of livestock performed ith
type
of services per day in reference to 2010-11
4. Estimation of produced manure value
Most often estimation of livestock manure production is mentioned as difficult as it varies by
livestock age, feed type and activities (Amare et al., 2006). The method adopted for this study
similar to Amare et al. (2006) in which each species of livestock converted to TLU with specific
conversion factor (Appendix Table 4). Dry matter level manure production was estimated for
cattle as 3.3 kg day-1
TLU-1
and for equines, and sheep and goats were 2.4 kg day-1
TLU-1
.
Nutrient composition of the manure was estimated as 18.3gN kg-1
, 21.3gK kg-1
and 4.5gP kg-1
of
manure. The value (US$) of nutrients (K, N and P) was estimated from Urea and DAP prices in
23
reference to 2010-11. Accordingly the cost of N, P and K were 0.29, 0.41 and 0.41US$ kg-1
,
respectively.
∑(
) ( )
Where;
TMVji = Total manure value (US$) from all TLU of livestock species per
jth
household per year in ith
types of farming system
MTLUi = Total manure produced from ith
livestock species on dry weight
basis (kg) per household per year
0.0183N = Nitrogen content (kg) from 1kg of manure on dry weight of ith
livestock species
0.0213K = Potassium content (kg) from 1kg of manure on dry weight of ith
livestock species
0.0045P = Phosphorus content (kg) from 1kg of manure on dry weight of
ith
livestock species
MPin = market value (US$) of N per kg in ith
of Woreda in reference to
the year 2010-11 price.
MPik = market value (US$) of K per kg in ith
of Woreda in reference to
the year 2010-11 price.
MPip = market value (US$) of P per kg in ith
of Woreda in reference to
the year 2010-11 price.
3.6. Livestock Water Productivity Estimation
To estimate LWP; spreadsheet model developed for LWP by Amare et al. (2009); and livestock
feed demand-supply and linkage to land and water requirement (King, 1983) are required. LWP
as defined earlier, is based on the ratio of livestock beneficial outputs to depleted water (Amare
et al, 2009). For this study LWP was estimated as:
24
LWPji = (MYVji+OTVji+TVOSji+TMVji)/DWLFji…………………………………Eq. (10)
Where;
LWPji = livestock water productivity per jth
household in ith
farming
system
MYVji = Milk yield value (US$) per household jth
per year in ith
farming
system
OTVji = Total value of off-take from all types of livestock per jth
household per year in ith
farming system
TVOSji = Total service value from all livestock types delivered per jth
household per year in ith
farming system
TMVji = Total manure value (US$) from all TLU of livestock species per
jth
household per year in ith
farming system
DWLFji = Total depleted water (in m3 per j
th household per year) for
livestock feed in the ith
farming system
3.7. Feed Demand-Supply Balance Estimation
The feed demand supply balance estimation uses two major data sets: i) the supply side which
was estimated from household survey, biomass harvesting and literature values as presented
earlier. These feeds biomass (dry matter basis) was converted to ME in MJ kg-1
using literature
value on energy content (Appendix Table 5) of different feed resources to estimate feed
Metabolisable Energy at household level (Abdinasir, 2000; Tsigeyohannes, 2000). ii) On the
other hand the total energy requirements of livestock types was calculated as the sum of the
maintenance energy requirements and additional energy to account for the effect of standing and
walking, milk production, body weight gain and traction service. In the demand side estimation a
standard method developed by King (1983) for tropical regions was used. Maintenance energy
requirement was calculated according to equation 11:
MEx = 0.343×LW 0.73
…………………………………………………………………….Eq. (11)
Km
25
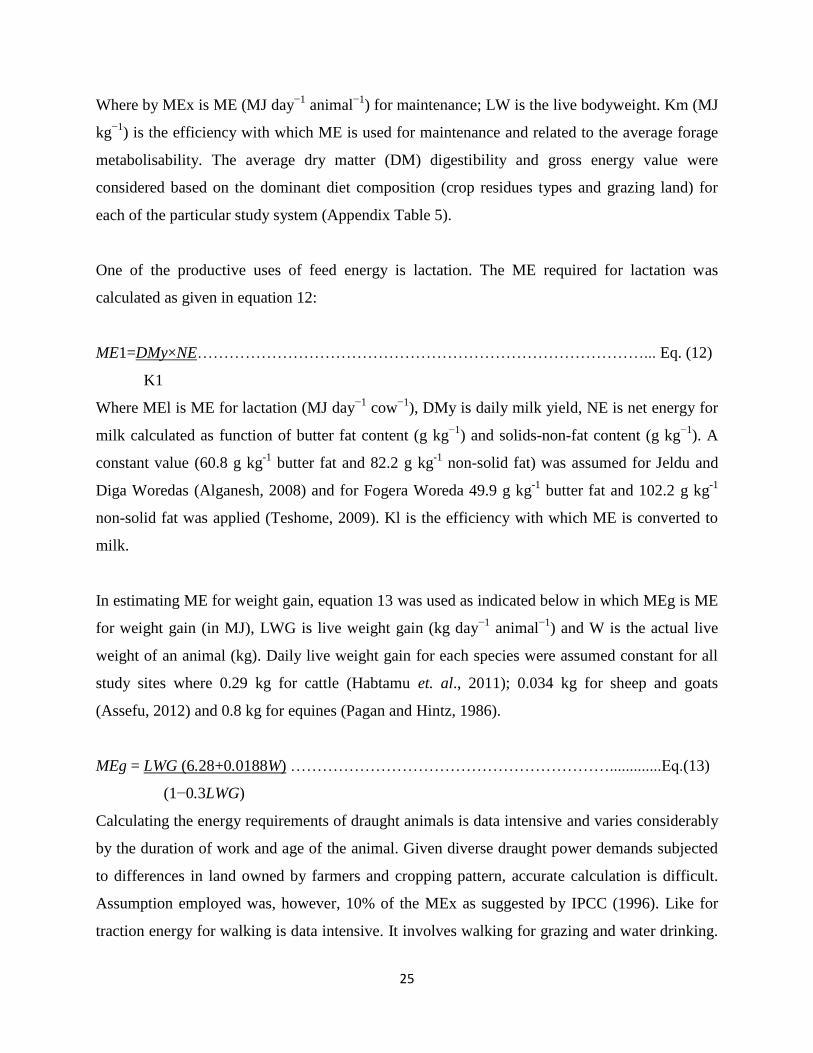
Where by MEx is ME (MJ day−1
animal−1
) for maintenance; LW is the live bodyweight. Km (MJ
kg−1
) is the efficiency with which ME is used for maintenance and related to the average forage
metabolisability. The average dry matter (DM) digestibility and gross energy value were
considered based on the dominant diet composition (crop residues types and grazing land) for
each of the particular study system (Appendix Table 5).
One of the productive uses of feed energy is lactation. The ME required for lactation was
calculated as given in equation 12:
ME1=DMy×NE…………………………………………………………………………... Eq. (12)
K1
Where MEl is ME for lactation (MJ day−1
cow−1
), DMy is daily milk yield, NE is net energy for
milk calculated as function of butter fat content (g kg−1
) and solids-non-fat content (g kg−1
). A
constant value (60.8 g kg-1
butter fat and 82.2 g kg-1
non-solid fat) was assumed for Jeldu and
Diga Woredas (Alganesh, 2008) and for Fogera Woreda 49.9 g kg-1
butter fat and 102.2 g kg-1
non-solid fat was applied (Teshome, 2009). Kl is the efficiency with which ME is converted to
milk.
In estimating ME for weight gain, equation 13 was used as indicated below in which MEg is ME
for weight gain (in MJ), LWG is live weight gain (kg day−1
animal−1
) and W is the actual live
weight of an animal (kg). Daily live weight gain for each species were assumed constant for all
study sites where 0.29 kg for cattle (Habtamu et. al., 2011); 0.034 kg for sheep and goats
(Assefu, 2012) and 0.8 kg for equines (Pagan and Hintz, 1986).
MEg = LWG (6.28+0.0188W) …………………………………………………….............Eq.(13)
(1−0.3LWG)
Calculating the energy requirements of draught animals is data intensive and varies considerably
by the duration of work and age of the animal. Given diverse draught power demands subjected
to differences in land owned by farmers and cropping pattern, accurate calculation is difficult.
Assumption employed was, however, 10% of the MEx as suggested by IPCC (1996). Like for
traction energy for walking is data intensive. It involves walking for grazing and water drinking.
26
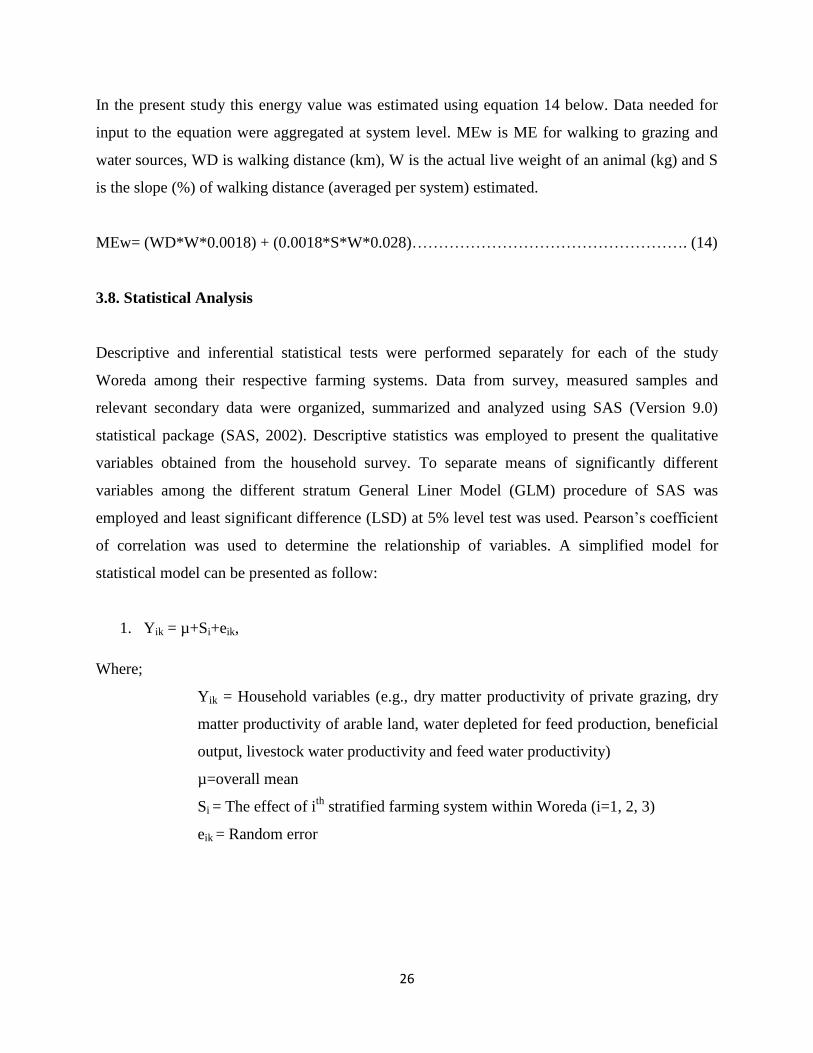
In the present study this energy value was estimated using equation 14 below. Data needed for
input to the equation were aggregated at system level. MEw is ME for walking to grazing and
water sources, WD is walking distance (km), W is the actual live weight of an animal (kg) and S
is the slope (%) of walking distance (averaged per system) estimated.
MEw= (WD*W*0.0018) + (0.0018*S*W*0.028)……………………………………………. (14)
3.8. Statistical Analysis
Descriptive and inferential statistical tests were performed separately for each of the study
Woreda among their respective farming systems. Data from survey, measured samples and
relevant secondary data were organized, summarized and analyzed using SAS (Version 9.0)
statistical package (SAS, 2002). Descriptive statistics was employed to present the qualitative
variables obtained from the household survey. To separate means of significantly different
variables among the different stratum General Liner Model (GLM) procedure of SAS was
employed and least significant difference (LSD) at 5% level test was used. Pearson’s coefficient
of correlation was used to determine the relationship of variables. A simplified model for
statistical model can be presented as follow:
1. Yik = µ+Si+eik,
Where;
Yik = Household variables (e.g., dry matter productivity of private grazing, dry
matter productivity of arable land, water depleted for feed production, beneficial
output, livestock water productivity and feed water productivity)
µ=overall mean
Si = The effect of ith
stratified farming system within Woreda (i=1, 2, 3)
eik = Random error
27
4. RESULTS AND DISCUSSION
4.1. Characteristics of the Sample Farms
4.1.1. General characteristics
Table 2 depicts mean values of household size, productive and unproductive household size in
the study systems. The average ages of the respondents were 40.3, 45.1 and 42.9 years for Diga,
Jeldu and Fogera Woreda, respectively (Table 2) and the values were comparable across the
Woredas and among farming systems. The average family size of households in Diga and
Fogera, and also between their respective farming systems was similar. But the family size in
Jeldu appeared to be higher than the other two Woredas implying stronger competition for land
resources. For Jeldu among systems family size differences was statically significant. For
example the family size of respondents between barley-potato and teff-wheat systems differed
(P<0.05). The family size in Fogera Woreda is comparable to the value reported by Teshome
(2009). The proportion of males and females were almost equal in the study systems except in
the Jeldu Woreda where the average number of females was relatively greater than males. The
number of productive people (15-60 years of age) per household among the farming systems of
the Diga and Fogera Woreda was similar. However, there was a difference in the number of
productive people between barley-potato and teff-wheat systems of the Jeldu Woreda. Arguably
such high proportion of unproductive household member can be accounted for by migration of
youngsters to the nearby town which is generally triggered by land shortage and degradation.
The trend may impact the size of labor available for agricultural activities and therefore the
productivity of the agriculture in general.
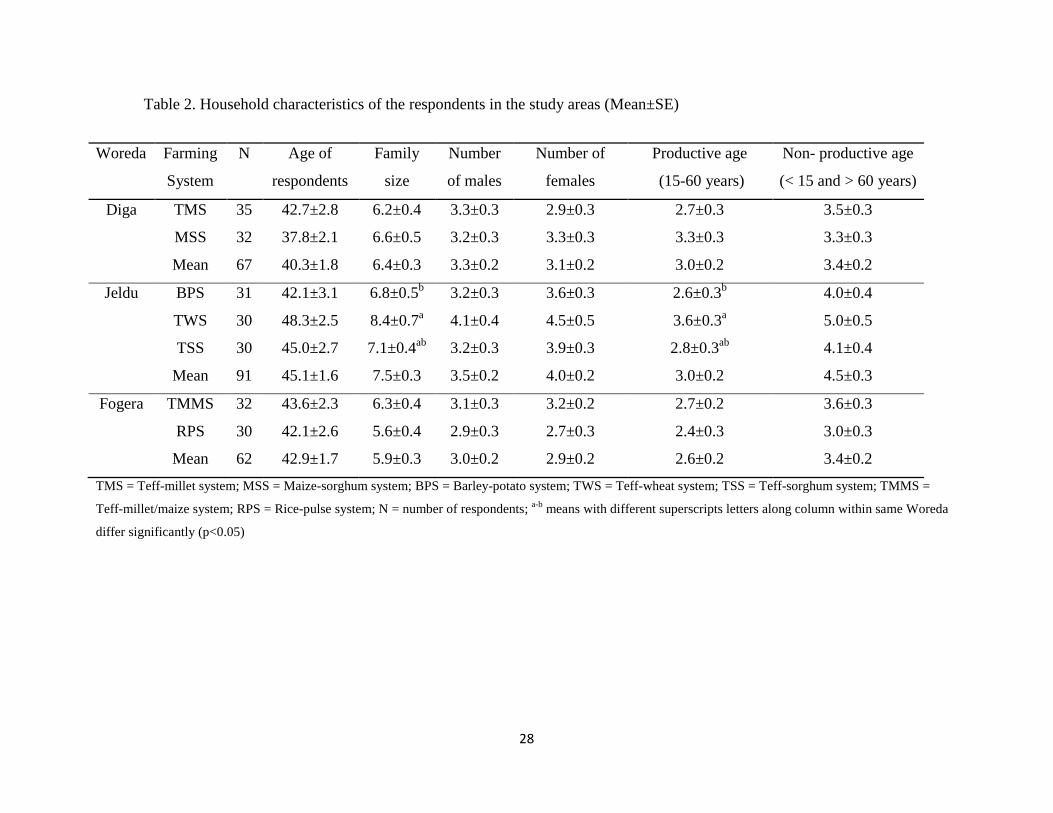
28
Table 2. Household characteristics of the respondents in the study areas (Mean±SE)
Woreda Farming
System
N Age of
respondents
Family
size
Number
of males
Number of
females
Productive age
(15-60 years)
Non- productive age
(< 15 and > 60 years)
Diga TMS 35 42.7±2.8 6.2±0.4 3.3±0.3 2.9±0.3 2.7±0.3 3.5±0.3
MSS 32 37.8±2.1 6.6±0.5 3.2±0.3 3.3±0.3 3.3±0.3 3.3±0.3
Mean 67 40.3±1.8 6.4±0.3 3.3±0.2 3.1±0.2 3.0±0.2 3.4±0.2
Jeldu BPS 31 42.1±3.1 6.8±0.5b 3.2±0.3 3.6±0.3 2.6±0.3
b 4.0±0.4
TWS 30 48.3±2.5 8.4±0.7a 4.1±0.4 4.5±0.5 3.6±0.3
a 5.0±0.5
TSS 30 45.0±2.7 7.1±0.4ab
3.2±0.3 3.9±0.3 2.8±0.3ab
4.1±0.4
Mean 91 45.1±1.6 7.5±0.3 3.5±0.2 4.0±0.2 3.0±0.2 4.5±0.3
Fogera TMMS 32 43.6±2.3 6.3±0.4 3.1±0.3 3.2±0.2 2.7±0.2 3.6±0.3
RPS 30 42.1±2.6 5.6±0.4 2.9±0.3 2.7±0.3 2.4±0.3 3.0±0.3
Mean 62 42.9±1.7 5.9±0.3 3.0±0.2 2.9±0.2 2.6±0.2 3.4±0.2
TMS = Teff-millet system; MSS = Maize-sorghum system; BPS = Barley-potato system; TWS = Teff-wheat system; TSS = Teff-sorghum system; TMMS =
Teff-millet/maize system; RPS = Rice-pulse system; N = number of respondents; a-b
means with different superscripts letters along column within same Woreda
differ significantly (p<0.05)
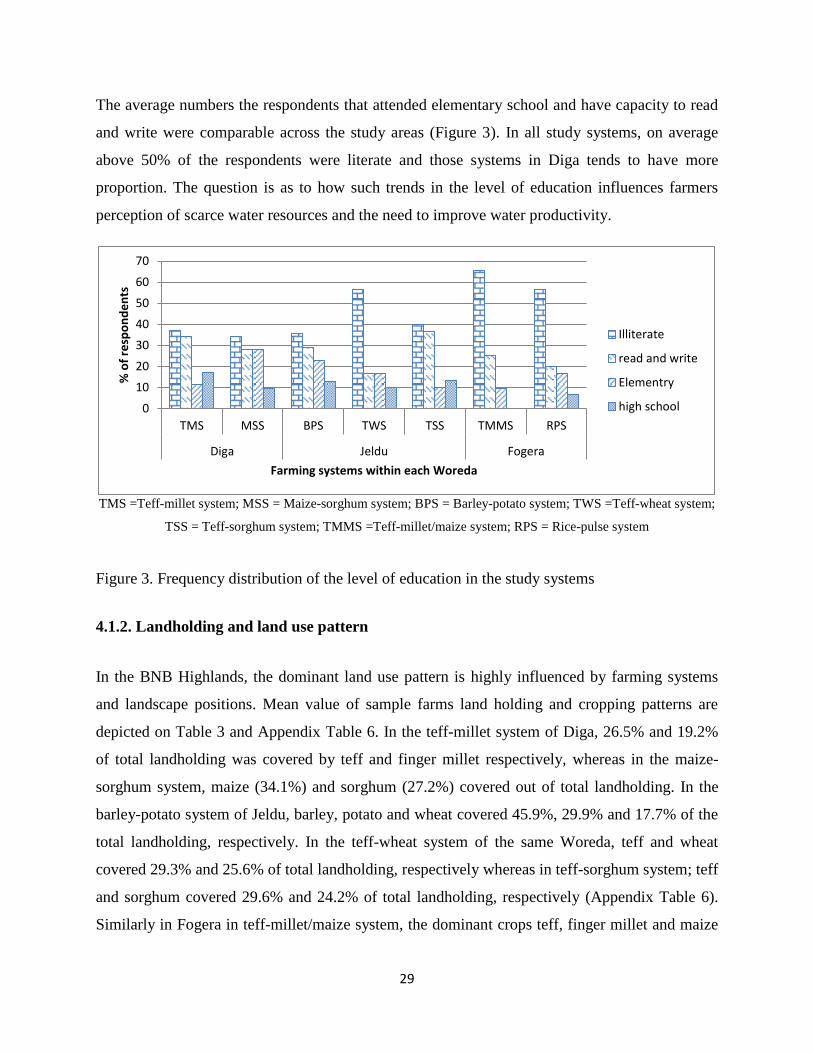
29
The average numbers the respondents that attended elementary school and have capacity to read
and write were comparable across the study areas (Figure 3). In all study systems, on average
above 50% of the respondents were literate and those systems in Diga tends to have more
proportion. The question is as to how such trends in the level of education influences farmers
perception of scarce water resources and the need to improve water productivity.
TMS =Teff-millet system; MSS = Maize-sorghum system; BPS = Barley-potato system; TWS =Teff-wheat system;
TSS = Teff-sorghum system; TMMS =Teff-millet/maize system; RPS = Rice-pulse system
Figure 3. Frequency distribution of the level of education in the study systems
4.1.2. Landholding and land use pattern
In the BNB Highlands, the dominant land use pattern is highly influenced by farming systems
and landscape positions. Mean value of sample farms land holding and cropping patterns are
depicted on Table 3 and Appendix Table 6. In the teff-millet system of Diga, 26.5% and 19.2%
of total landholding was covered by teff and finger millet respectively, whereas in the maize-
sorghum system, maize (34.1%) and sorghum (27.2%) covered out of total landholding. In the
barley-potato system of Jeldu, barley, potato and wheat covered 45.9%, 29.9% and 17.7% of the
total landholding, respectively. In the teff-wheat system of the same Woreda, teff and wheat
covered 29.3% and 25.6% of total landholding, respectively whereas in teff-sorghum system; teff
and sorghum covered 29.6% and 24.2% of total landholding, respectively (Appendix Table 6).
Similarly in Fogera in teff-millet/maize system, the dominant crops teff, finger millet and maize
0
10
20
30
40
50
60
70
TMS MSS BPS TWS TSS TMMS RPS
Diga Jeldu Fogera
% o
f re
spo
nd
en
ts
Farming systems within each Woreda
Illiterate
read and write
Elementry
high school
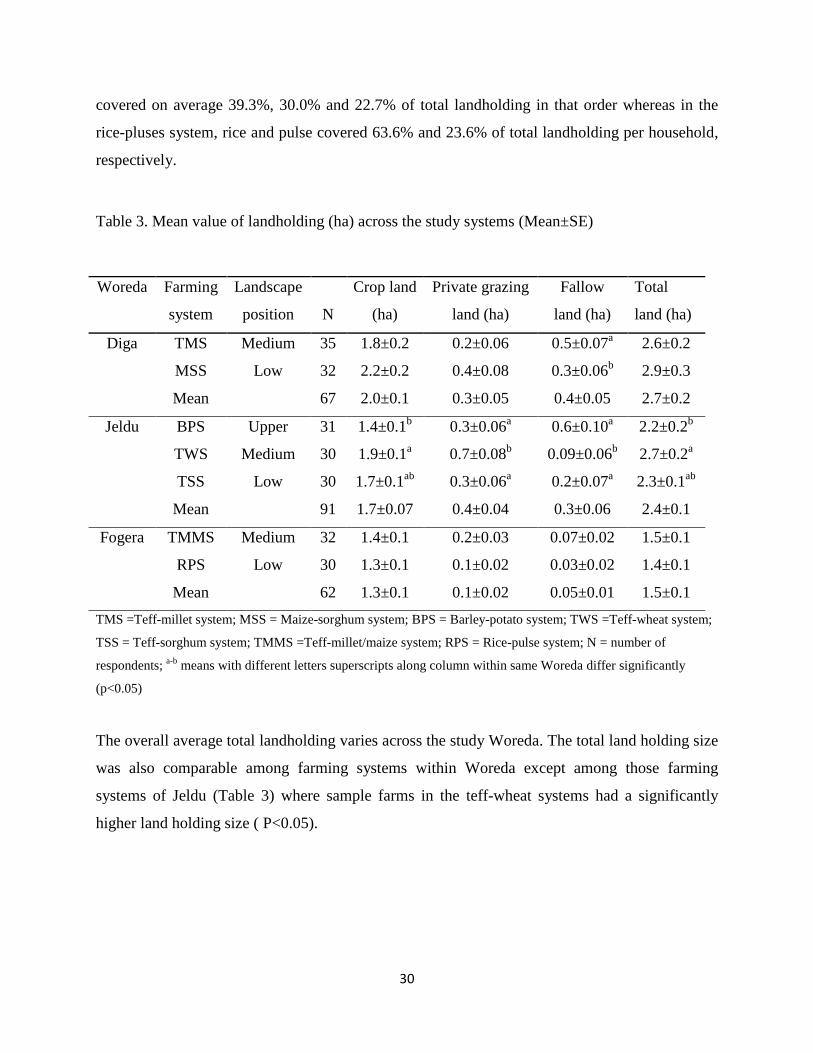
30
covered on average 39.3%, 30.0% and 22.7% of total landholding in that order whereas in the
rice-pluses system, rice and pulse covered 63.6% and 23.6% of total landholding per household,
respectively.
Table 3. Mean value of landholding (ha) across the study systems (Mean±SE)
TMS =Teff-millet system; MSS = Maize-sorghum system; BPS = Barley-potato system; TWS =Teff-wheat system;
TSS = Teff-sorghum system; TMMS =Teff-millet/maize system; RPS = Rice-pulse system; N = number of
respondents; a-b
means with different letters superscripts along column within same Woreda differ significantly
(p<0.05)
The overall average total landholding varies across the study Woreda. The total land holding size
was also comparable among farming systems within Woreda except among those farming
systems of Jeldu (Table 3) where sample farms in the teff-wheat systems had a significantly
higher land holding size ( P<0.05).
Woreda Farming
system
Landscape
position
N
Crop land
(ha)
Private grazing
land (ha)
Fallow
land (ha)
Total
land (ha)
Diga TMS Medium 35 1.8±0.2 0.2±0.06 0.5±0.07a 2.6±0.2
MSS Low 32 2.2±0.2 0.4±0.08 0.3±0.06b 2.9±0.3
Mean 67 2.0±0.1 0.3±0.05 0.4±0.05 2.7±0.2
Jeldu BPS Upper 31 1.4±0.1b 0.3±0.06
a 0.6±0.10
a 2.2±0.2
b
TWS Medium 30 1.9±0.1a 0.7±0.08
b 0.09±0.06
b 2.7±0.2
a
TSS Low 30 1.7±0.1ab
0.3±0.06a 0.2±0.07
a 2.3±0.1
ab
Mean 91 1.7±0.07 0.4±0.04 0.3±0.06 2.4±0.1
Fogera
TMMS Medium 32 1.4±0.1 0.2±0.03 0.07±0.02 1.5±0.1
RPS Low 30 1.3±0.1 0.1±0.02 0.03±0.02 1.4±0.1
Mean 62 1.3±0.1 0.1±0.02 0.05±0.01 1.5±0.1
31
4.1.3. Livestock herd size and structure
As elsewhere in the mixed crop livestock system, in all study areas livestock are important
system components. Table 4 depicts mean livestock holding in TLU by species and by system
for the study areas. Although the mean TLU of all species were comparable across systems and
between study Woreda, apparent variation exists in terms of species composition. Jeldu study
systems were exceptional in that a statically significant difference exists between the wheat-teff
and the other two systems under investigation in terms of the mean TLU of all species and also
herd composition. This can be accounted for by a contrasting differences between the different
farming system investigated in Jeldu [e.g., compare altitude ranges) (Table 4)]. The many of the
values of mean TLU reported here are in good agreement with the values reported by Amare et
al. (2009) and Belete (2006) (e.g., for Fogera study systems). Mean value of sheep TLU showed
greater divergences across systems. For example there was contrasting differences of mean sheep
TLU across farming systems in Diga and Jeldu. Many previous works account this for by to
sheep adaptability to agro ecological zone (Amare et al., 2009). Even though the importance of
cattle was similar across the study sites, in barley-potato system of Jeldu the mean value of cattle
TLU were by one unit lower than the other systems and this can be accounted for by farmers
alternative uses of horses both for transport and threshing purpose so replacing the role of oxen.
The question is as to how these differences in species composition and herd size within and
among systems influences LWP value.
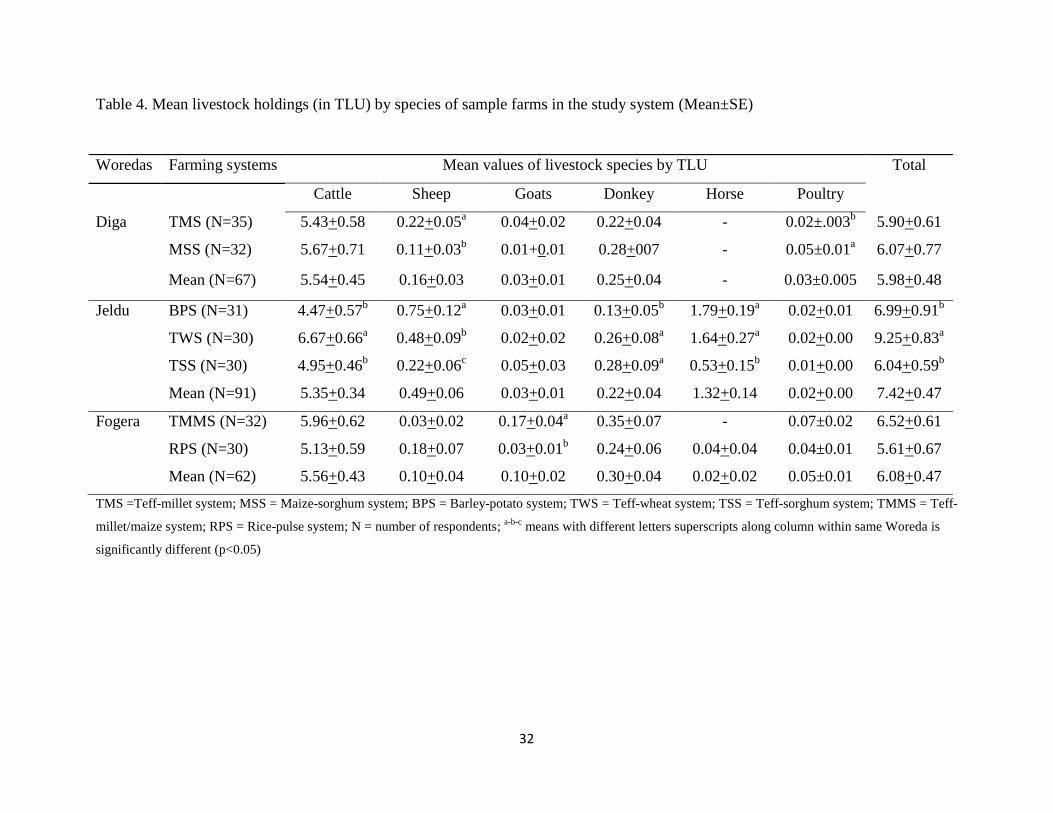
32
Table 4. Mean livestock holdings (in TLU) by species of sample farms in the study system (Mean±SE)
TMS =Teff-millet system; MSS = Maize-sorghum system; BPS = Barley-potato system; TWS = Teff-wheat system; TSS = Teff-sorghum system; TMMS = Teff-
millet/maize system; RPS = Rice-pulse system; N = number of respondents; a-b-c
means with different letters superscripts along column within same Woreda is
significantly different (p<0.05)
Woredas Farming systems Mean values of livestock species by TLU Total
Cattle Sheep Goats Donkey Horse Poultry
Diga TMS (N=35) 5.43+0.58 0.22+0.05a 0.04+0.02
0.22+0.04 - 0.02±.003
b 5.90+0.61
MSS (N=32) 5.67+0.71 0.11+0.03b 0.01+0.01 0.28+007 - 0.05±0.01
a 6.07+0.77
Mean (N=67) 5.54+0.45 0.16+0.03 0.03+0.01 0.25+0.04 - 0.03±0.005 5.98+0.48
Jeldu BPS (N=31) 4.47+0.57b 0.75+0.12
a 0.03+0.01 0.13+0.05
b 1.79+0.19
a 0.02+0.01 6.99+0.91
b
TWS (N=30) 6.67+0.66a 0.48+0.09
b 0.02+0.02 0.26+0.08
a 1.64+0.27
a 0.02+0.00 9.25+0.83
a
TSS (N=30) 4.95+0.46b 0.22+0.06
c 0.05+0.03 0.28+0.09
a 0.53+0.15
b 0.01+0.00 6.04+0.59
b
Mean (N=91) 5.35+0.34 0.49+0.06 0.03+0.01 0.22+0.04 1.32+0.14 0.02+0.00 7.42+0.47
Fogera TMMS (N=32) 5.96+0.62 0.03+0.02 0.17+0.04a 0.35+0.07 - 0.07±0.02 6.52+0.61
RPS (N=30) 5.13+0.59 0.18+0.07 0.03+0.01b 0.24+0.06 0.04+0.04 0.04±0.01 5.61+0.67
Mean (N=62) 5.56+0.43 0.10+0.04 0.10+0.02 0.30+0.04 0.02+0.02 0.05±0.01 6.08+0.47
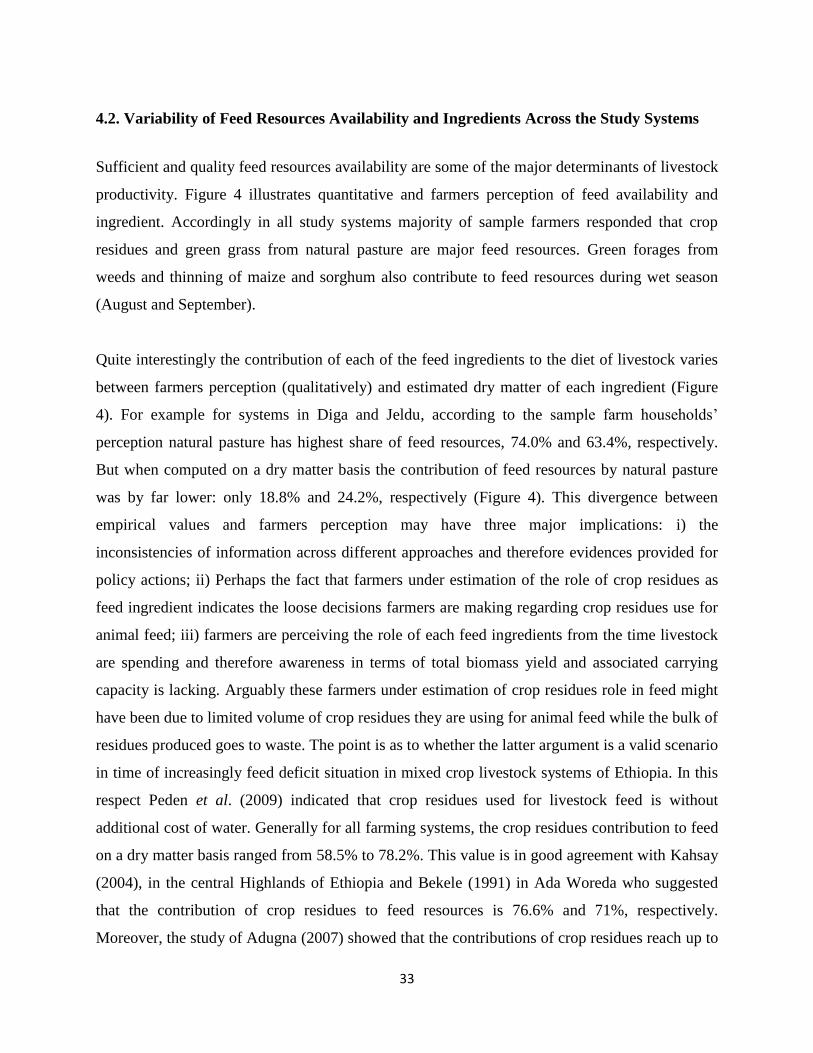
33
4.2. Variability of Feed Resources Availability and Ingredients Across the Study Systems
Sufficient and quality feed resources availability are some of the major determinants of livestock
productivity. Figure 4 illustrates quantitative and farmers perception of feed availability and
ingredient. Accordingly in all study systems majority of sample farmers responded that crop
residues and green grass from natural pasture are major feed resources. Green forages from
weeds and thinning of maize and sorghum also contribute to feed resources during wet season
(August and September).
Quite interestingly the contribution of each of the feed ingredients to the diet of livestock varies
between farmers perception (qualitatively) and estimated dry matter of each ingredient (Figure
4). For example for systems in Diga and Jeldu, according to the sample farm households’
perception natural pasture has highest share of feed resources, 74.0% and 63.4%, respectively.
But when computed on a dry matter basis the contribution of feed resources by natural pasture
was by far lower: only 18.8% and 24.2%, respectively (Figure 4). This divergence between
empirical values and farmers perception may have three major implications: i) the
inconsistencies of information across different approaches and therefore evidences provided for
policy actions; ii) Perhaps the fact that farmers under estimation of the role of crop residues as
feed ingredient indicates the loose decisions farmers are making regarding crop residues use for
animal feed; iii) farmers are perceiving the role of each feed ingredients from the time livestock
are spending and therefore awareness in terms of total biomass yield and associated carrying
capacity is lacking. Arguably these farmers under estimation of crop residues role in feed might
have been due to limited volume of crop residues they are using for animal feed while the bulk of
residues produced goes to waste. The point is as to whether the latter argument is a valid scenario
in time of increasingly feed deficit situation in mixed crop livestock systems of Ethiopia. In this
respect Peden et al. (2009) indicated that crop residues used for livestock feed is without
additional cost of water. Generally for all farming systems, the crop residues contribution to feed
on a dry matter basis ranged from 58.5% to 78.2%. This value is in good agreement with Kahsay
(2004), in the central Highlands of Ethiopia and Bekele (1991) in Ada Woreda who suggested
that the contribution of crop residues to feed resources is 76.6% and 71%, respectively.
Moreover, the study of Adugna (2007) showed that the contributions of crop residues reach up to
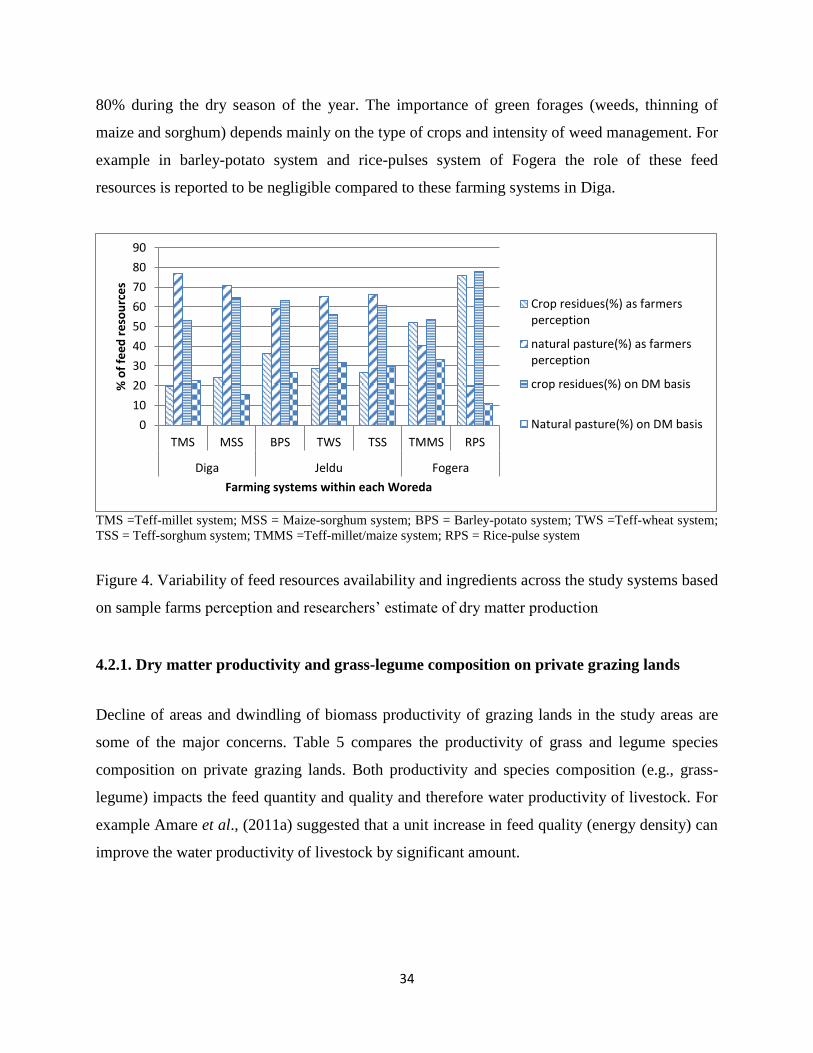
34
80% during the dry season of the year. The importance of green forages (weeds, thinning of
maize and sorghum) depends mainly on the type of crops and intensity of weed management. For
example in barley-potato system and rice-pulses system of Fogera the role of these feed
resources is reported to be negligible compared to these farming systems in Diga.
TMS =Teff-millet system; MSS = Maize-sorghum system; BPS = Barley-potato system; TWS =Teff-wheat system;
TSS = Teff-sorghum system; TMMS =Teff-millet/maize system; RPS = Rice-pulse system
Figure 4. Variability of feed resources availability and ingredients across the study systems based
on sample farms perception and researchers’ estimate of dry matter production
4.2.1. Dry matter productivity and grass-legume composition on private grazing lands
Decline of areas and dwindling of biomass productivity of grazing lands in the study areas are
some of the major concerns. Table 5 compares the productivity of grass and legume species
composition on private grazing lands. Both productivity and species composition (e.g., grass-
legume) impacts the feed quantity and quality and therefore water productivity of livestock. For
example Amare et al., (2011a) suggested that a unit increase in feed quality (energy density) can
improve the water productivity of livestock by significant amount.
0
10
20
30
40
50
60
70
80
90
TMS MSS BPS TWS TSS TMMS RPS
Diga Jeldu Fogera
% o
f fe
ed
re
sou
rce
s
Farming systems within each Woreda
Crop residues(%) as farmersperception
natural pasture(%) as farmersperception
crop residues(%) on DM basis
Natural pasture(%) on DM basis
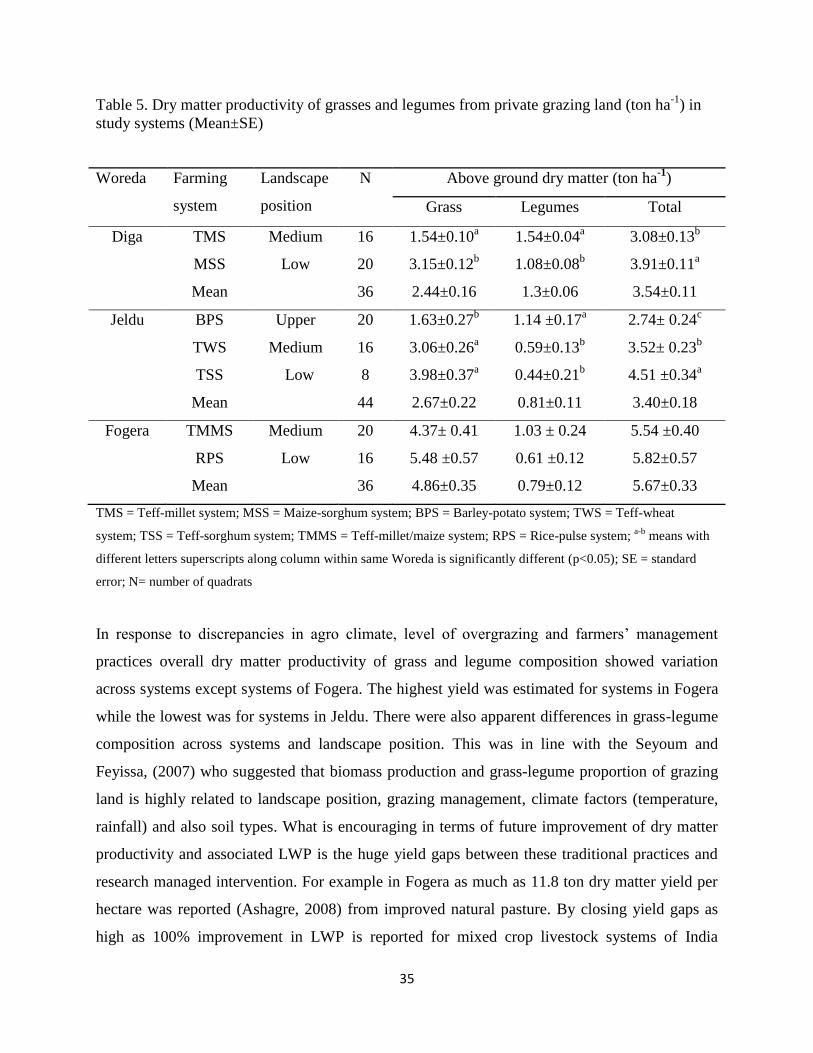
35
Table 5. Dry matter productivity of grasses and legumes from private grazing land (ton ha-1
) in
study systems (Mean±SE)
TMS = Teff-millet system; MSS = Maize-sorghum system; BPS = Barley-potato system; TWS = Teff-wheat
system; TSS = Teff-sorghum system; TMMS = Teff-millet/maize system; RPS = Rice-pulse system; a-b
means with
different letters superscripts along column within same Woreda is significantly different (p<0.05); SE = standard
error; N= number of quadrats
In response to discrepancies in agro climate, level of overgrazing and farmers’ management
practices overall dry matter productivity of grass and legume composition showed variation
across systems except systems of Fogera. The highest yield was estimated for systems in Fogera
while the lowest was for systems in Jeldu. There were also apparent differences in grass-legume
composition across systems and landscape position. This was in line with the Seyoum and
Feyissa, (2007) who suggested that biomass production and grass-legume proportion of grazing
land is highly related to landscape position, grazing management, climate factors (temperature,
rainfall) and also soil types. What is encouraging in terms of future improvement of dry matter
productivity and associated LWP is the huge yield gaps between these traditional practices and
research managed intervention. For example in Fogera as much as 11.8 ton dry matter yield per
hectare was reported (Ashagre, 2008) from improved natural pasture. By closing yield gaps as
high as 100% improvement in LWP is reported for mixed crop livestock systems of India
Woreda Farming
system
Landscape
position
N
Above ground dry matter (ton ha-1
)
Grass Legumes Total
Diga TMS Medium 16 1.54±0.10a 1.54±0.04
a 3.08±0.13
b
MSS Low 20 3.15±0.12b 1.08±0.08
b 3.91±0.11
a
Mean 36 2.44±0.16 1.3±0.06 3.54±0.11
Jeldu BPS Upper 20 1.63±0.27b 1.14 ±0.17
a 2.74± 0.24
c
TWS Medium 16 3.06±0.26a 0.59±0.13
b 3.52± 0.23
b
TSS Low 8 3.98±0.37a 0.44±0.21
b 4.51 ±0.34
a
Mean 44 2.67±0.22 0.81±0.11 3.40±0.18
Fogera
TMMS Medium 20 4.37± 0.41 1.03 ± 0.24 5.54 ±0.40
RPS Low 16 5.48 ±0.57 0.61 ±0.12 5.82±0.57
Mean 36 4.86±0.35 0.79±0.12 5.67±0.33
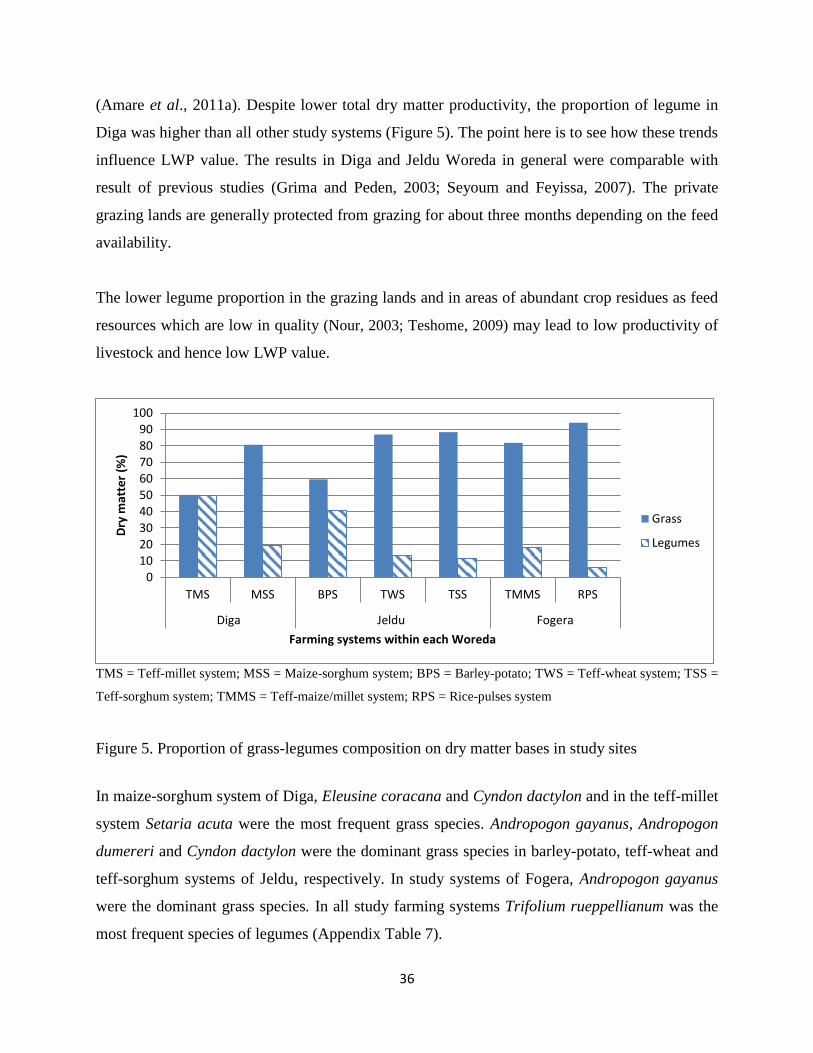
36
(Amare et al., 2011a). Despite lower total dry matter productivity, the proportion of legume in
Diga was higher than all other study systems (Figure 5). The point here is to see how these trends
influence LWP value. The results in Diga and Jeldu Woreda in general were comparable with
result of previous studies (Grima and Peden, 2003; Seyoum and Feyissa, 2007). The private
grazing lands are generally protected from grazing for about three months depending on the feed
availability.
The lower legume proportion in the grazing lands and in areas of abundant crop residues as feed
resources which are low in quality (Nour, 2003; Teshome, 2009) may lead to low productivity of
livestock and hence low LWP value.
TMS = Teff-millet system; MSS = Maize-sorghum system; BPS = Barley-potato; TWS = Teff-wheat system; TSS =
Teff-sorghum system; TMMS = Teff-maize/millet system; RPS = Rice-pulses system
Figure 5. Proportion of grass-legumes composition on dry matter bases in study sites
In maize-sorghum system of Diga, Eleusine coracana and Cyndon dactylon and in the teff-millet
system Setaria acuta were the most frequent grass species. Andropogon gayanus, Andropogon
dumereri and Cyndon dactylon were the dominant grass species in barley-potato, teff-wheat and
teff-sorghum systems of Jeldu, respectively. In study systems of Fogera, Andropogon gayanus
were the dominant grass species. In all study farming systems Trifolium rueppellianum was the
most frequent species of legumes (Appendix Table 7).
0102030405060708090
100
TMS MSS BPS TWS TSS TMMS RPS
Diga Jeldu Fogera
Dry
mat
ter
(%)
Farming systems within each Woreda
Grass
Legumes
37
4.2.2. Variability of mean dry matter availability per sample farms in the study systems
Feed dry matter access considered here includes from private grazing land, fallow land and
communal grazing land and crop residues. Table 6 depicts mean value of feed dry matter
availability by farm households in study systems. Fallow lands in all farming systems were very
rarely found except barley-potato system of Jeldu and teff-millet system of Diga Woreda (Table
3). Similarly, communal grazing land was also rarely found in all farming system of the study
sites except in teff-millet/maize system of Fogera Woreda where on average 0.7 ha per
household was found. The area of private grazing land per household ranged from 7.0-13.5% of
total landholding in all farming systems.
In Diga and Fogera Woredas, mean dry matter production per household from grazing lands was
similar (Table 6). However, the dry matter from grazing lands per household between the
farming systems of Fogera was significantly different (P<0.05) but not between the farming
systems of Diga. Similarly, in Jeldu, dry matter yield of grazing land per household of teff-wheat
system was greater (P<0.05) than the barley-potato system. The DM yield from grazing land in
the teff-millet/maize system of Fogera and teff-wheat system of Jeldu appeared to be higher than
other systems. This may be due to the location of private grazing lands, which are located in
seasonally water logged areas that produce high dry matter than in drained areas. The DM
production from crop residues in the study sites varies depending on the cropped land size, crop
types and productivity. The farming systems within Woreda vary (P<0.05) in the amount of DM
produced from crop residues per household. Values were greater for maize-sorghum in Diga, for
teff-wheat system in Jeldu and for rice-pulse system in Fogera. The dry matter of crop residues
per household in farming systems was comparable with the study of Tesfaye, et al. (2006) for
eastern Shewa region. The lower crop residues production in barley-potato system of Jeldu might
be due to the damage of wheat by rust in 2010-11 year production. Currently potato production
shares more land but not accounted for residues because no respondents used them for feed.
Similarly, in Diga the lower dry matter crop residues in the teff-millet system might be due to the
termite effects on the total biomass production. The study of Alemayehu (2009) indicated that
straw yield of major cereals (teff, finger millet, maize, sorghum) were reduced by more than 60%
within ten years interval due to termite infestation in West Wollega. It also indicated that almost
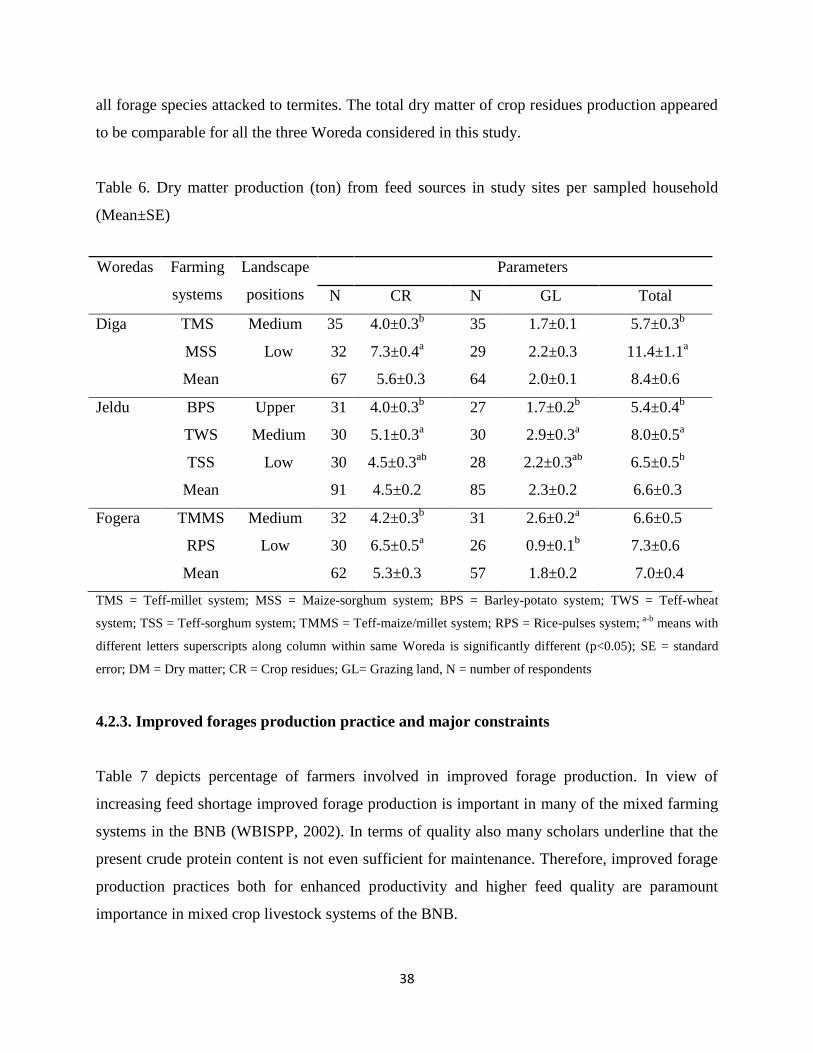
38
all forage species attacked to termites. The total dry matter of crop residues production appeared
to be comparable for all the three Woreda considered in this study.
Table 6. Dry matter production (ton) from feed sources in study sites per sampled household
(Mean±SE)
TMS = Teff-millet system; MSS = Maize-sorghum system; BPS = Barley-potato system; TWS = Teff-wheat
system; TSS = Teff-sorghum system; TMMS = Teff-maize/millet system; RPS = Rice-pulses system; a-b
means with
different letters superscripts along column within same Woreda is significantly different (p<0.05); SE = standard
error; DM = Dry matter; CR = Crop residues; GL= Grazing land, N = number of respondents
4.2.3. Improved forages production practice and major constraints
Table 7 depicts percentage of farmers involved in improved forage production. In view of
increasing feed shortage improved forage production is important in many of the mixed farming
systems in the BNB (WBISPP, 2002). In terms of quality also many scholars underline that the
present crude protein content is not even sufficient for maintenance. Therefore, improved forage
production practices both for enhanced productivity and higher feed quality are paramount
importance in mixed crop livestock systems of the BNB.
Woredas Farming
systems
Landscape
positions
Parameters
N CR N GL Total
Diga TMS Medium 35 4.0±0.3b 35 1.7±0.1 5.7±0.3
b
MSS Low 32 7.3±0.4a 29 2.2±0.3 11.4±1.1
a
Mean 67 5.6±0.3 64 2.0±0.1 8.4±0.6
Jeldu BPS Upper 31 4.0±0.3b 27 1.7±0.2
b 5.4±0.4
b
TWS Medium 30 5.1±0.3a 30 2.9±0.3
a 8.0±0.5
a
TSS Low 30 4.5±0.3ab
28 2.2±0.3ab
6.5±0.5b
Mean 91 4.5±0.2 85 2.3±0.2 6.6±0.3
Fogera TMMS Medium 32 4.2±0.3b 31 2.6±0.2
a 6.6±0.5
RPS Low 30 6.5±0.5a 26 0.9±0.1
b 7.3±0.6
Mean 62 5.3±0.3 57 1.8±0.2 7.0±0.4
39
Contrastingly the results of this study demonstrated that improved forages production was rarely
practiced in all study sites. More than 85% of respondents in all study systems mentioned that
they do not practice improved forages production (Table 7). The study of Zewdie (2010) in
central Highlands of Ethiopia also indicated that the proportion of farmers practicing improved
forage production is only 13%. Farmers reason for not practicing improved forage production
varies across the study Woredas while among farming systems within the Woredas they tends to
be similar. For example for farming systems in Diga the main reasons for not practicing
improved forage production were lack of awareness followed by lack of seeds (Table7). For
systems in Jeldu, the main reason for not practicing improved forage production was lack of
seed. Although lack of awareness is a common denominator for many of the study systems, but
in Fogera shortage of land emerges as an important constraint. Problem identified in this study
agrees with report of Zewdie (2010). According to Alemayehu (2005), for last two decades
forage adaptability and production trials were made across the different agro ecosystems in the
country and some promising forages were selected.
In addition to the feed quality traits these forage species could be multi-cut and the growing
period is longer and this creates opportunities for better water uptake and thus converts the
evaporative green water losses to productive transpiration. Among the selected grass species,
Rhodes grass (Chloris gayana), Guinea grass (Panicum maximum) and Napier grass (Pennisetum
purpureum) are highly productive, their annual DM yields ranging between 10 and 15 tons ha-1
.
Moreover, in suitable areas, yields of oat-vetch mixtures are commonly more than 8 ton ha-1
and
that of fodder beet ranged from 15-20 ton ha-1
(Lulseged, 1987). Although we do not have actual
figure on DM yields of oat, in the teff system of Jeldu, we observed a poor crop performance.
Focusing on those high yielding variety can reduce competition for space with the food crops.
One of the limitations of soil and water conservation structures built (e.g., millet systems of
Fogera) is unproductive uses of spaces under physical structures. Species like Napier grasses can
be planted with legumes as a mixed stand on farm boundary or as soil conservation measures.
This is vital for high soil erosion prone areas like Jeldu (barley and teff systems) and also in
millet systems of Fogera. Among the selected forage legumes, spurred butterfly pea (Centrosema
virginianum) and cowpeas (Vigna unguiculata) have been identified as potential species for cut
and carry system of feeding. These are good to plant on farm boundary and also on physical
40
conservation structure. Species recommended for under sowing in perennial cash crops like
coffee or cereals like maize and sorghum are Desmondium (Desmodium intortum, and
Desmodium uncinatum) and Rhodes grass (Lazier, 1987). This will be a good intervention for the
maize system in Diga. Some species are suggested for intercropping with cereal food crops such
as barley and wheat. These include annual clovers, (Tylosanthes guianensis, Macrotyloma
axillare, and Lablab purpureum (Lazier, 1987)). This will be important for barely based system
of Jeldu and also wheat plots in teff system in Jeldu. Such intervention can increase the DM and
crud protein (CP) in the wheat straw and thus positively impacts LWP through productive and
high quality (e.g., improved digestibility) feed. In addition to the grasses and legumes, useful
browse species pigeon pea (Cajanus cajan), glricidia (Glricidia sepium) and sesbania (Sesbainia
susba) leucena (Leucena leucocephala) have also been selected for the purpose of hedge planting
(Lazier, 1987; Lulseged, 1987). In one of this study areas Descheemaker et al. (2011) illustrated
an improvement in LWP as a result of on farm integration of shrubs like pigeon pea.
But to date adoptions of technologies are generally limited to pre-urban and urban area. Relevant
question here is probably as to why policy measures that enhances improved forage production
could not be implemented and as to whether policy recommendations, if it exists, are system
specific or generalized.
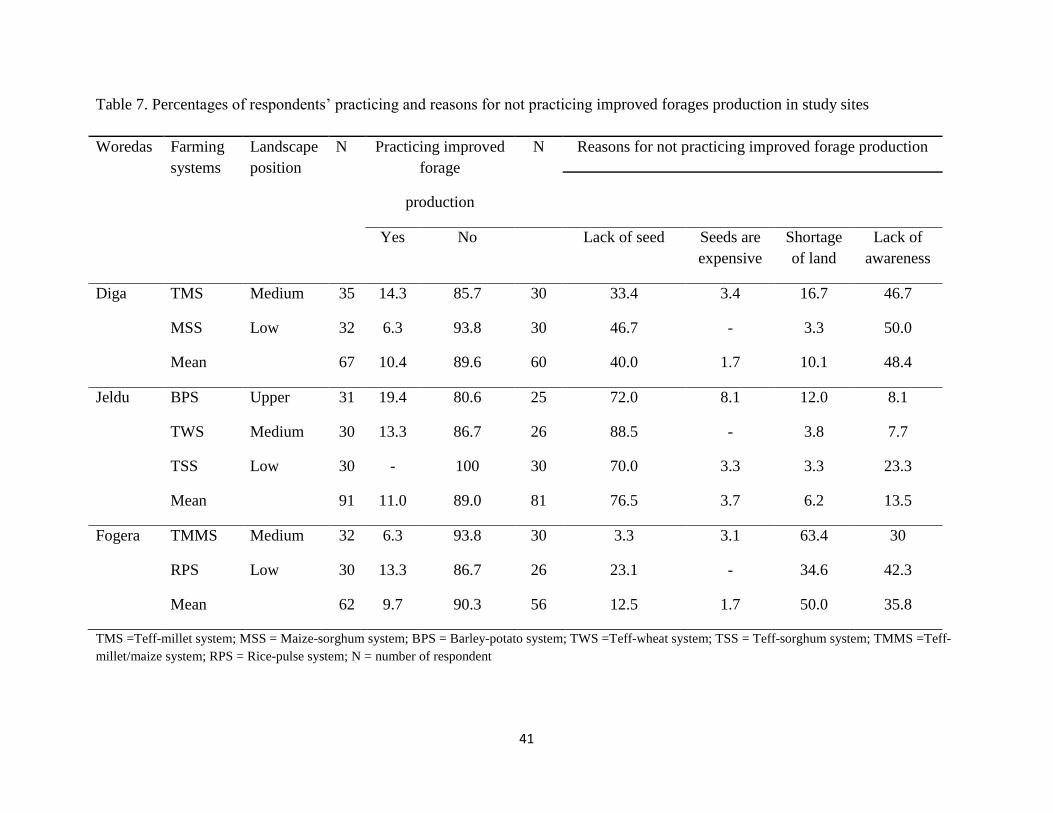
41
Table 7. Percentages of respondents’ practicing and reasons for not practicing improved forages production in study sites
TMS =Teff-millet system; MSS = Maize-sorghum system; BPS = Barley-potato system; TWS =Teff-wheat system; TSS = Teff-sorghum system; TMMS =Teff-
millet/maize system; RPS = Rice-pulse system; N = number of respondent
Woredas Farming
systems
Landscape
position
N Practicing improved
forage
production
N Reasons for not practicing improved forage production
Yes No Lack of seed Seeds are
expensive
Shortage
of land
Lack of
awareness
Diga TMS Medium 35 14.3 85.7 30 33.4 3.4 16.7 46.7
MSS Low 32 6.3 93.8 30 46.7 - 3.3 50.0
Mean 67 10.4 89.6 60 40.0 1.7 10.1 48.4
Jeldu BPS Upper 31 19.4 80.6 25 72.0 8.1 12.0 8.1
TWS Medium 30 13.3 86.7 26 88.5 - 3.8 7.7
TSS Low 30 - 100 30 70.0 3.3 3.3 23.3
Mean 91 11.0 89.0 81 76.5 3.7 6.2 13.5
Fogera TMMS Medium 32 6.3 93.8 30 3.3 3.1 63.4 30
RPS Low 30 13.3 86.7 26 23.1 - 34.6 42.3
Mean 62 9.7 90.3 56 12.5 1.7 50.0 35.8
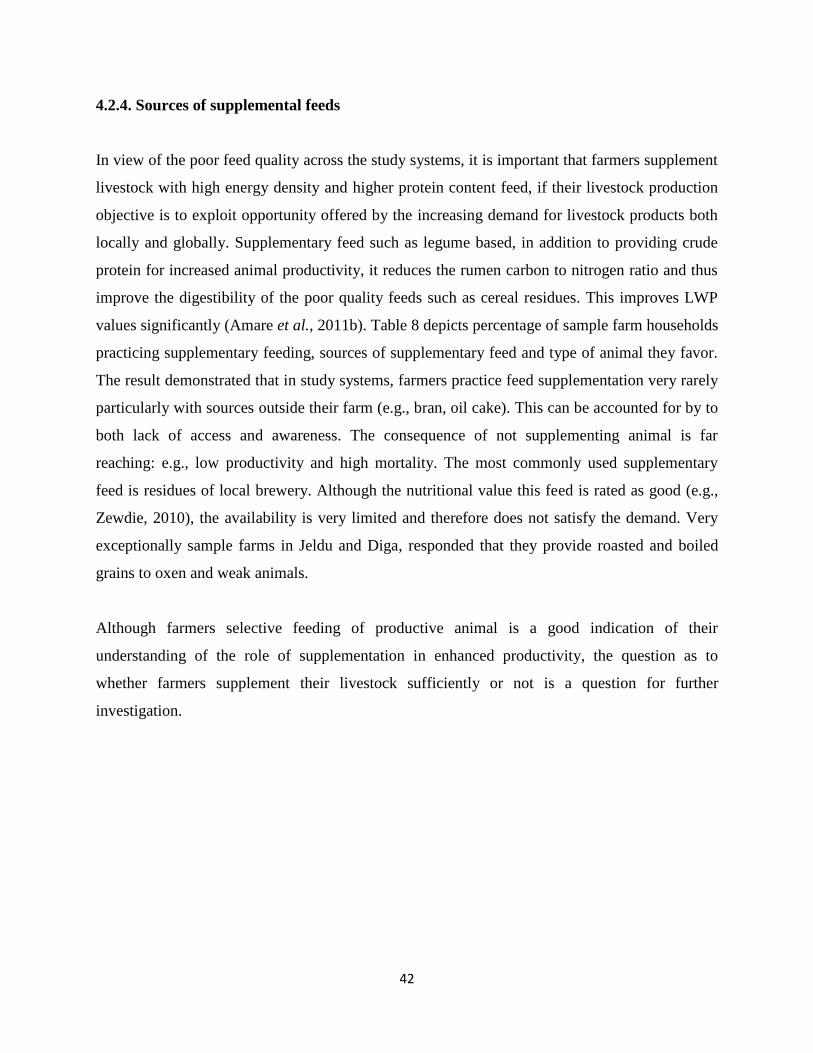
42
4.2.4. Sources of supplemental feeds
In view of the poor feed quality across the study systems, it is important that farmers supplement
livestock with high energy density and higher protein content feed, if their livestock production
objective is to exploit opportunity offered by the increasing demand for livestock products both
locally and globally. Supplementary feed such as legume based, in addition to providing crude
protein for increased animal productivity, it reduces the rumen carbon to nitrogen ratio and thus
improve the digestibility of the poor quality feeds such as cereal residues. This improves LWP
values significantly (Amare et al., 2011b). Table 8 depicts percentage of sample farm households
practicing supplementary feeding, sources of supplementary feed and type of animal they favor.
The result demonstrated that in study systems, farmers practice feed supplementation very rarely
particularly with sources outside their farm (e.g., bran, oil cake). This can be accounted for by to
both lack of access and awareness. The consequence of not supplementing animal is far
reaching: e.g., low productivity and high mortality. The most commonly used supplementary
feed is residues of local brewery. Although the nutritional value this feed is rated as good (e.g.,
Zewdie, 2010), the availability is very limited and therefore does not satisfy the demand. Very
exceptionally sample farms in Jeldu and Diga, responded that they provide roasted and boiled
grains to oxen and weak animals.
Although farmers selective feeding of productive animal is a good indication of their
understanding of the role of supplementation in enhanced productivity, the question as to
whether farmers supplement their livestock sufficiently or not is a question for further
investigation.
43
Table 8. Percentage of respondents on types of feed supplemented, season of feed supplemented and for which livestock type feed is
supplemented in the study sites
TMS =Teff-millet system; MSS = Maize-sorghum system; BPS = Barley-potato system; TWS = Teff-wheat system; TSS = Teff-sorghum system; TMMS = Teff-
millet-maize system; RPS = Rice-pulse system; N = number of respondents; D = Dry; W = Wet; AA = As available; BMH = by-product of mill house;
BRG = Boiled/roasted grains; LBR = Local brewery residue; O = Ox; WA = weak animal; C = Cow; TAL= To all livestock; CO = Cow and ox
Woredas Farming
systems
Landscape
position
N Seasons of
supplementary
feeding
Type and sources of
supplemented feed
For which livestock type
Supplemented
D W AA Salt BMH BRG LBR TAL WA C O CO
Diga TMS Medium 35 5.7 42.9 51.4 37.1 2.9 28.6 31.4 14.3 - 5.7 20.0 60.0
MSS Low 32 18.8 43.8 37.5 37.5 9.4 34.4 18.8 15.6 3.1 9.4 21.9 50.0
Mean 67 11.9 43.3 44.8 37.3 6.0 31.3 25.4 14.9 1.5 7.5 20.9 55.2
Jeldu BPS Upper 31 3.2 6.5 90.3 22.6 16.1 22.6 38.7 19.4 3.2 3.2 61.3 12.9
TWS Medium 30 3.3 10.0 86.7 10.0 10.0 13.3 66.6 20.0 - - 80.0 -
TSS Low 30 16.7 16.7 66.7 26.7 10.0 10.0 53.3 6.7 10 3.3 66.6 13.3
Mean 91 7.7 11.0 81.3 19.8 12.1 15.4 52.7 15.4 4.4 2.2 69.2 8.8
Fogera TMMS Medium 32 3.1 18.8 78.1 25.0 - 6.3 65.6 3.1 3.1 6.3 84.4 3.1
RPS Low 30 - 6.7 83.3 20 - - 80 10 - 10 70 10
Mean 62 1.6 12.9 80.6 17.7 - 3.1 75.8 6.2 1.6 6.5 80.7 4.8
44
4.3. Feed Resources Management and Feeding Strategies
4.3.1. Feed resources management
In the study systems about 95.5%, of sample farmers in Diga, 92.3% in Jeldu and 88.7% in
Fogera responded that the grazing lands are deteriorating. Given the low biomass yield and poor
feed quality the current stocking density across the study areas seems high (1.7 TLU ha-1
in Diga,
2.2 TLU ha-1
in Jeldu and 2.9 TLU ha-1
in Fogera). Generally, the management of feed resources
has impact on feed supply and quality and thus on LWP (Amare et al., 2011a and
Descheemaeker et al., 2010a). Unless properly managed over stocking decreases the proportion
of desirable species and favors infestation by less nutritious and unpalatable species (Ahmed
2006). Farmers across the study systems manage grazing land differently. But commonly private
natural pasture is protected from grazing during June to September (Table 9). It is grazed late
August to December privately then open to livestock of other farmers during dry season. Some
studies suggested that protection from grazing is an important management practices to reduce
compaction and to increase the biomass of the grazing land. For example Tefera et al. (2005)
indicated a 50% above ground woody species composition increase as a result of enclosure.
Moreover the study of Descheemaeker et al. (2010c) indicated that by protecting 40% of the
grazing lands, the water productivity of the feed increased by about 20% and hence enclosure
establishment could lead to similar improvements in livestock water productivity (LWP).
The second most important but most often neglected grazing land management is clearing of
invasive species. In all study system invasive species are mentioned as major problem. For
example in Diga, weed known as Sida schimperiana (karaba) is highly invasive species in lower
landscape position. The species is widely spread on grazing land, fallow land and road sides.
Sida schimperiana may compete with grass and legume species for nutrients and suppress the
productivity of natural pasture. Such weeds contribute to non-productive of evapotranspiration
(ET) which is one of the major areas on intervention to improve LWP. Moreover, in medium
landscape position (teff-millet system) of Diga, respondents’ complain about termite damage to
their livestock’s grazing lands. This affect LWP is several ways: it competes for the biomass and
thus biomass will not be converted to beneficial output that can support the livelihood of the
community. Secondly termite feed also on seed of pasture thus reduce generally biomass
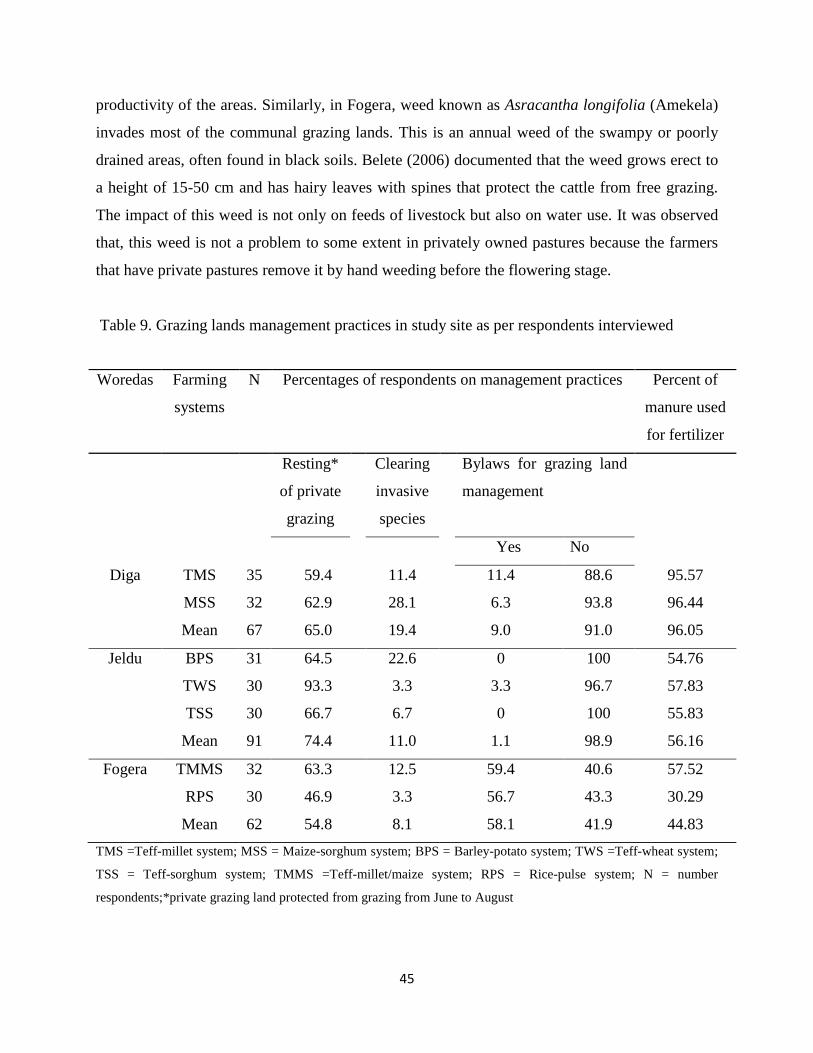
45
productivity of the areas. Similarly, in Fogera, weed known as Asracantha longifolia (Amekela)
invades most of the communal grazing lands. This is an annual weed of the swampy or poorly
drained areas, often found in black soils. Belete (2006) documented that the weed grows erect to
a height of 15-50 cm and has hairy leaves with spines that protect the cattle from free grazing.
The impact of this weed is not only on feeds of livestock but also on water use. It was observed
that, this weed is not a problem to some extent in privately owned pastures because the farmers
that have private pastures remove it by hand weeding before the flowering stage.
Table 9. Grazing lands management practices in study site as per respondents interviewed
TMS =Teff-millet system; MSS = Maize-sorghum system; BPS = Barley-potato system; TWS =Teff-wheat system;
TSS = Teff-sorghum system; TMMS =Teff-millet/maize system; RPS = Rice-pulse system; N = number
respondents;*private grazing land protected from grazing from June to August
Woredas Farming
systems
N Percentages of respondents on management practices Percent of
manure used
for fertilizer
Resting*
of private
grazing
Clearing
invasive
species
Bylaws for grazing land
management
Yes No
Diga TMS 35 59.4 11.4 11.4 88.6 95.57
MSS 32 62.9 28.1 6.3 93.8 96.44
Mean 67 65.0 19.4 9.0 91.0 96.05
Jeldu BPS 31 64.5 22.6 0 100 54.76
TWS 30 93.3 3.3 3.3 96.7 57.83
TSS 30 66.7 6.7 0 100 55.83
Mean 91 74.4 11.0 1.1 98.9 56.16
Fogera TMMS 32 63.3 12.5 59.4 40.6 57.52
RPS 30 46.9 3.3 56.7 43.3 30.29
Mean 62 54.8 8.1 58.1 41.9 44.83
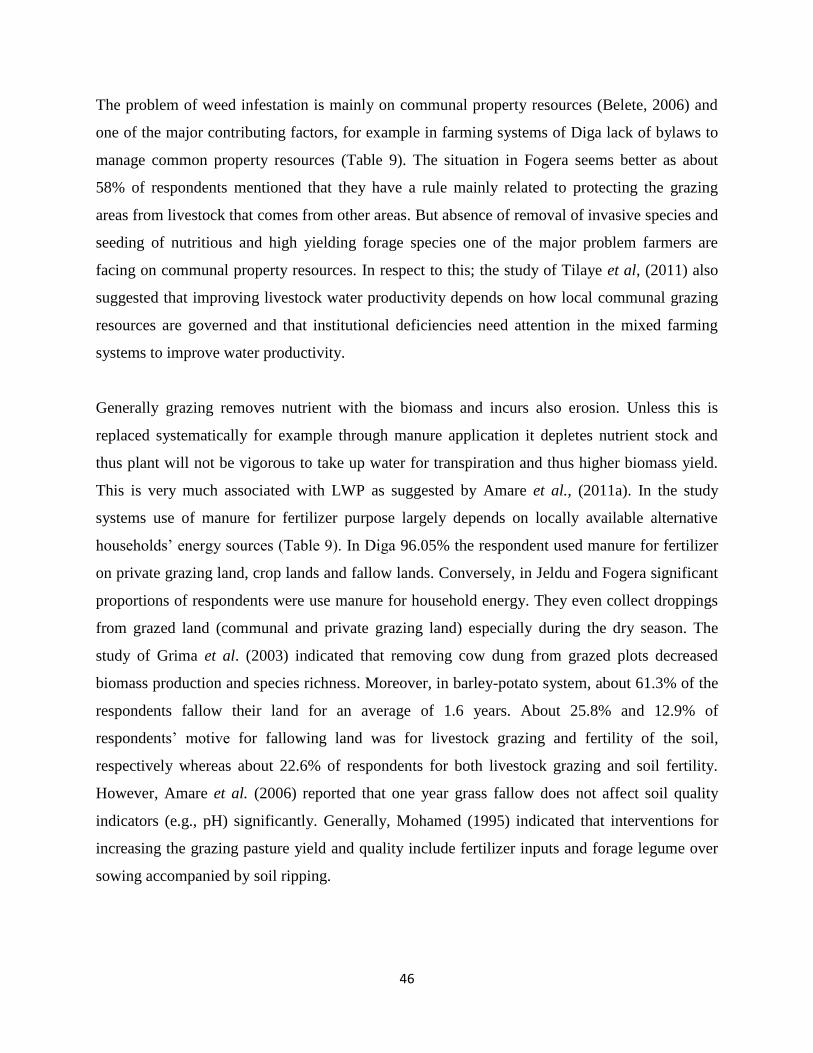
46
The problem of weed infestation is mainly on communal property resources (Belete, 2006) and
one of the major contributing factors, for example in farming systems of Diga lack of bylaws to
manage common property resources (Table 9). The situation in Fogera seems better as about
58% of respondents mentioned that they have a rule mainly related to protecting the grazing
areas from livestock that comes from other areas. But absence of removal of invasive species and
seeding of nutritious and high yielding forage species one of the major problem farmers are
facing on communal property resources. In respect to this; the study of Tilaye et al, (2011) also
suggested that improving livestock water productivity depends on how local communal grazing
resources are governed and that institutional deficiencies need attention in the mixed farming
systems to improve water productivity.
Generally grazing removes nutrient with the biomass and incurs also erosion. Unless this is
replaced systematically for example through manure application it depletes nutrient stock and
thus plant will not be vigorous to take up water for transpiration and thus higher biomass yield.
This is very much associated with LWP as suggested by Amare et al., (2011a). In the study
systems use of manure for fertilizer purpose largely depends on locally available alternative
households’ energy sources (Table 9). In Diga 96.05% the respondent used manure for fertilizer
on private grazing land, crop lands and fallow lands. Conversely, in Jeldu and Fogera significant
proportions of respondents were use manure for household energy. They even collect droppings
from grazed land (communal and private grazing land) especially during the dry season. The
study of Grima et al. (2003) indicated that removing cow dung from grazed plots decreased
biomass production and species richness. Moreover, in barley-potato system, about 61.3% of the
respondents fallow their land for an average of 1.6 years. About 25.8% and 12.9% of
respondents’ motive for fallowing land was for livestock grazing and fertility of the soil,
respectively whereas about 22.6% of respondents for both livestock grazing and soil fertility.
However, Amare et al. (2006) reported that one year grass fallow does not affect soil quality
indicators (e.g., pH) significantly. Generally, Mohamed (1995) indicated that interventions for
increasing the grazing pasture yield and quality include fertilizer inputs and forage legume over
sowing accompanied by soil ripping.
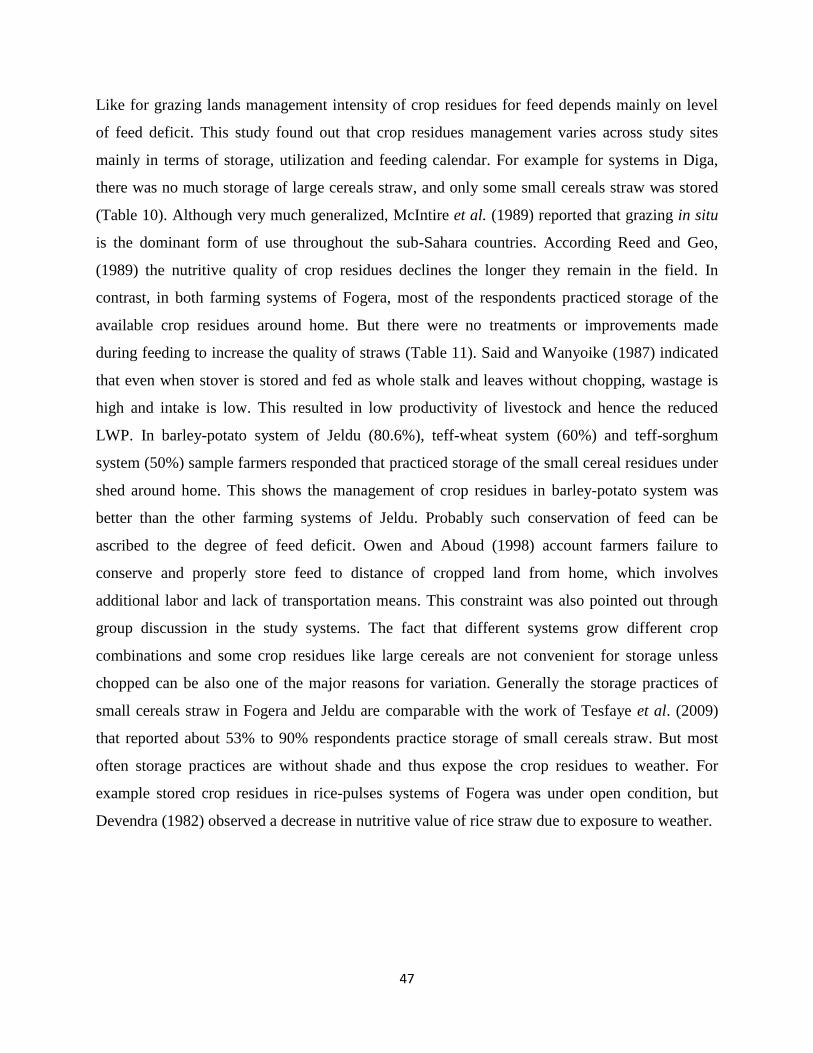
47
Like for grazing lands management intensity of crop residues for feed depends mainly on level
of feed deficit. This study found out that crop residues management varies across study sites
mainly in terms of storage, utilization and feeding calendar. For example for systems in Diga,
there was no much storage of large cereals straw, and only some small cereals straw was stored
(Table 10). Although very much generalized, McIntire et al. (1989) reported that grazing in situ
is the dominant form of use throughout the sub-Sahara countries. According Reed and Geo,
(1989) the nutritive quality of crop residues declines the longer they remain in the field. In
contrast, in both farming systems of Fogera, most of the respondents practiced storage of the
available crop residues around home. But there were no treatments or improvements made
during feeding to increase the quality of straws (Table 11). Said and Wanyoike (1987) indicated
that even when stover is stored and fed as whole stalk and leaves without chopping, wastage is
high and intake is low. This resulted in low productivity of livestock and hence the reduced
LWP. In barley-potato system of Jeldu (80.6%), teff-wheat system (60%) and teff-sorghum
system (50%) sample farmers responded that practiced storage of the small cereal residues under
shed around home. This shows the management of crop residues in barley-potato system was
better than the other farming systems of Jeldu. Probably such conservation of feed can be
ascribed to the degree of feed deficit. Owen and Aboud (1998) account farmers failure to
conserve and properly store feed to distance of cropped land from home, which involves
additional labor and lack of transportation means. This constraint was also pointed out through
group discussion in the study systems. The fact that different systems grow different crop
combinations and some crop residues like large cereals are not convenient for storage unless
chopped can be also one of the major reasons for variation. Generally the storage practices of
small cereals straw in Fogera and Jeldu are comparable with the work of Tesfaye et al. (2009)
that reported about 53% to 90% respondents practice storage of small cereals straw. But most
often storage practices are without shade and thus expose the crop residues to weather. For
example stored crop residues in rice-pulses systems of Fogera was under open condition, but
Devendra (1982) observed a decrease in nutritive value of rice straw due to exposure to weather.
48
Table 10. Percentages of respondents conserving/storing feed in the study systems
TMS =Teff-millet system; MSS = Maize-sorghum system; BPS = Barley-potato system; TWS =Teff-wheat system;
TSS = Teff-sorghum system; TMMS =Teff-millet/maize system; RPS = Rice-pulse system; N = number
respondents; PHWS = pile at home with shed; PHWOS = pile at home without shed; PFWOS = pile at farm without
shed; LF = left over the field
As indicated on Table 10, in all study systems, crop residues are most often stored without shed
except in systems of Jeldu. Works of Mulugeta, (2005) in Yarer area reported that about 91% of
the farmers stored crop residues outdoor. The question here is to understand the potential gain in
LWP using proper storage as an entry point.
Another potentially important area of feed management to improve quality is crop residues
management. Regardless of whether farmers are practicing proper storage or not overall the
practices of crop residues treatment were insignificant (Table 11). This ultimately results in less
efficient use of crop residues (Scarr, 1987) and hence low productivity of livestock. Only few
sample farmers responded that they soak small cereals residues crop residues with salt water
(Table 11) to feed oxen during ploughing. Number of practices are suggested and to some extent
experimented in Ethiopia to treat crop residues to improve its palatability and digestibility.
Amare et al., (2011b) and Descheemaeker et al., (2011) already demonstrated that crop residues
Woredas Farming
systems
N Large cereals Small cereals
PHWS PHWOS PFWOS LF PHWS PHWOS PFWOS LF
Diga TMS 35 - - - 100 2.9 22.9 42.9 31.4
MSS 32 9.4 - 3.1 87.5 9.4 25.0 18.8 31.3
Mean 67 4.5 - 1.5 94.0 6.0 23.9 31.3 31.3
Jeldu BPS 31 3.2 3.2 - - 80.6 12.9 - -
TWS 30 3.3 13.3 10.0 33.3 60.0 30.0 3.3 6.7
TSS 30 6.7 23.3 13.3 50.0 50.0 40.0 6.7 -
Mean 91 4.4 13.2 7.7 27.5 63.7 27.5 3.3 2.2
Fogera TMMS 32 6.3 - 78.1 - 15.6 75.0 - -
RPS 30 - 3.3 36.7 - 6.7 90.0 - -
Mean 62 3.2 1.6 58.1 - 11.3 82.3 - -
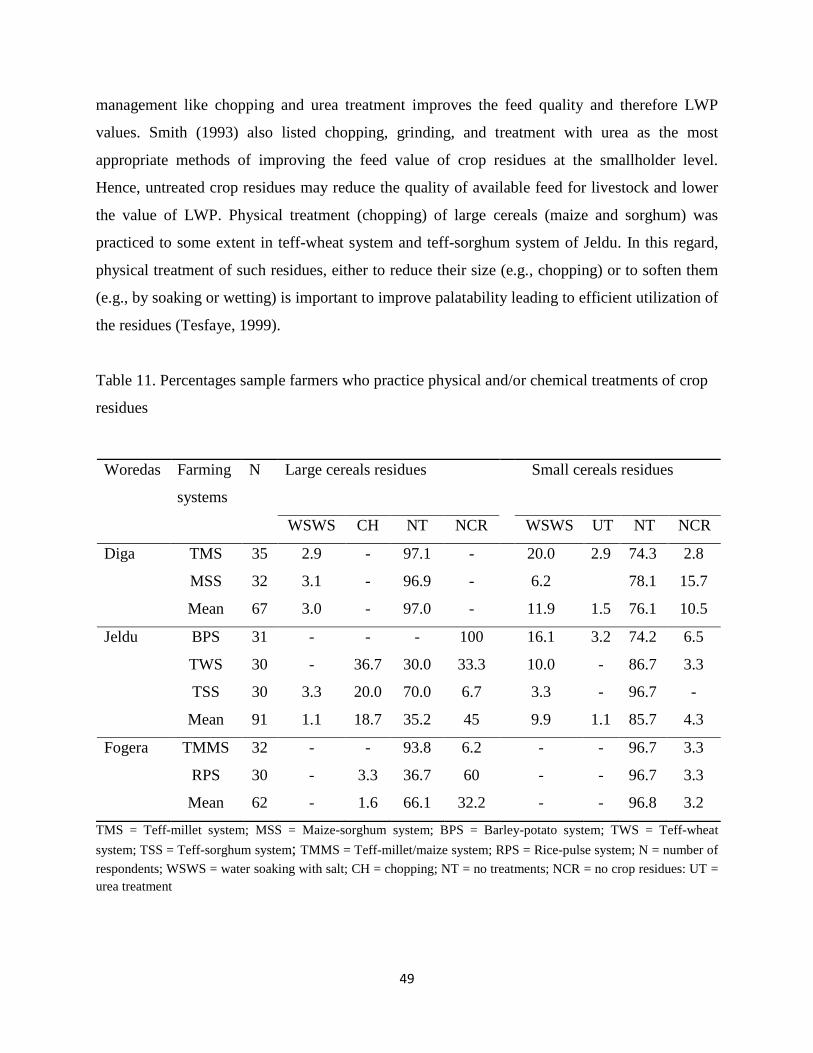
49
management like chopping and urea treatment improves the feed quality and therefore LWP
values. Smith (1993) also listed chopping, grinding, and treatment with urea as the most
appropriate methods of improving the feed value of crop residues at the smallholder level.
Hence, untreated crop residues may reduce the quality of available feed for livestock and lower
the value of LWP. Physical treatment (chopping) of large cereals (maize and sorghum) was
practiced to some extent in teff-wheat system and teff-sorghum system of Jeldu. In this regard,
physical treatment of such residues, either to reduce their size (e.g., chopping) or to soften them
(e.g., by soaking or wetting) is important to improve palatability leading to efficient utilization of
the residues (Tesfaye, 1999).
Table 11. Percentages sample farmers who practice physical and/or chemical treatments of crop
residues
TMS = Teff-millet system; MSS = Maize-sorghum system; BPS = Barley-potato system; TWS = Teff-wheat
system; TSS = Teff-sorghum system; TMMS = Teff-millet/maize system; RPS = Rice-pulse system; N = number of
respondents; WSWS = water soaking with salt; CH = chopping; NT = no treatments; NCR = no crop residues: UT =
urea treatment
Woredas Farming
systems
N Large cereals residues Small cereals residues
WSWS CH NT NCR WSWS UT NT NCR
Diga TMS 35 2.9 - 97.1 - 20.0 2.9 74.3 2.8
MSS 32 3.1 - 96.9 - 6.2 78.1 15.7
Mean 67 3.0 - 97.0 - 11.9 1.5 76.1 10.5
Jeldu BPS 31 - - - 100 16.1 3.2 74.2 6.5
TWS 30 - 36.7 30.0 33.3 10.0 - 86.7 3.3
TSS 30 3.3 20.0 70.0 6.7 3.3 - 96.7 -
Mean 91 1.1 18.7 35.2 45 9.9 1.1 85.7 4.3
Fogera TMMS 32 - - 93.8 6.2 - - 96.7 3.3
RPS 30 - 3.3 36.7 60 - - 96.7 3.3
Mean 62 - 1.6 66.1 32.2 - - 96.8 3.2
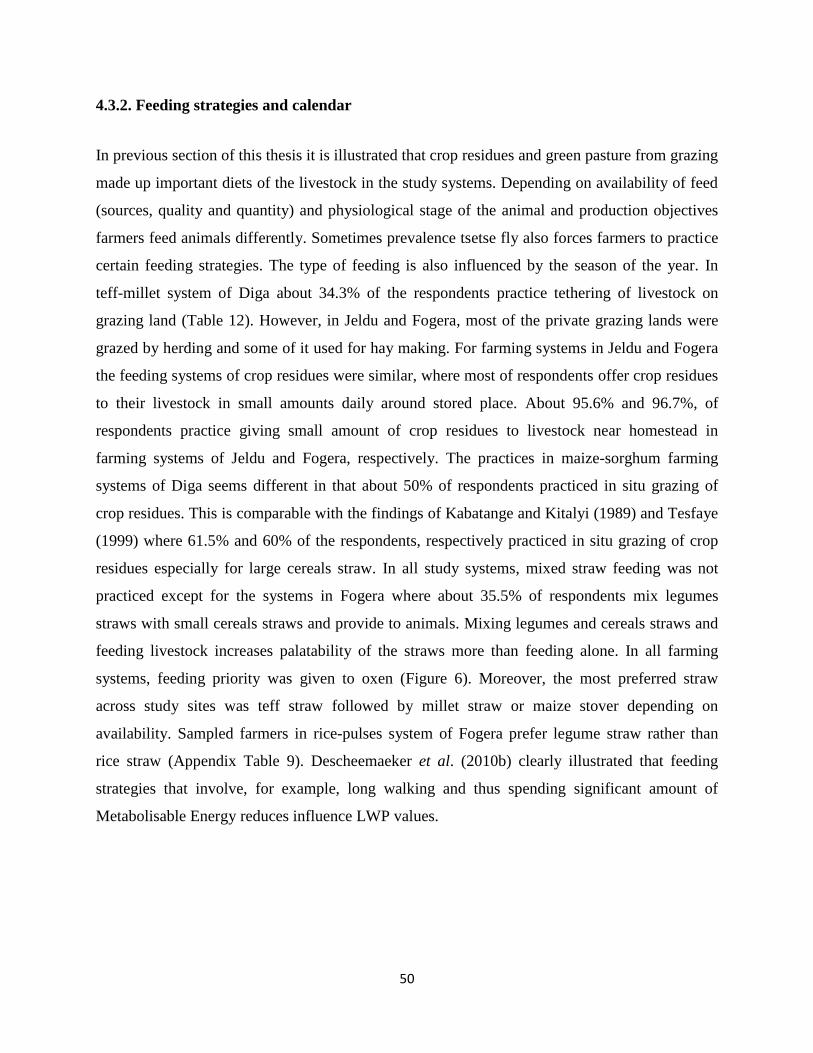
50
4.3.2. Feeding strategies and calendar
In previous section of this thesis it is illustrated that crop residues and green pasture from grazing
made up important diets of the livestock in the study systems. Depending on availability of feed
(sources, quality and quantity) and physiological stage of the animal and production objectives
farmers feed animals differently. Sometimes prevalence tsetse fly also forces farmers to practice
certain feeding strategies. The type of feeding is also influenced by the season of the year. In
teff-millet system of Diga about 34.3% of the respondents practice tethering of livestock on
grazing land (Table 12). However, in Jeldu and Fogera, most of the private grazing lands were
grazed by herding and some of it used for hay making. For farming systems in Jeldu and Fogera
the feeding systems of crop residues were similar, where most of respondents offer crop residues
to their livestock in small amounts daily around stored place. About 95.6% and 96.7%, of
respondents practice giving small amount of crop residues to livestock near homestead in
farming systems of Jeldu and Fogera, respectively. The practices in maize-sorghum farming
systems of Diga seems different in that about 50% of respondents practiced in situ grazing of
crop residues. This is comparable with the findings of Kabatange and Kitalyi (1989) and Tesfaye
(1999) where 61.5% and 60% of the respondents, respectively practiced in situ grazing of crop
residues especially for large cereals straw. In all study systems, mixed straw feeding was not
practiced except for the systems in Fogera where about 35.5% of respondents mix legumes
straws with small cereals straws and provide to animals. Mixing legumes and cereals straws and
feeding livestock increases palatability of the straws more than feeding alone. In all farming
systems, feeding priority was given to oxen (Figure 6). Moreover, the most preferred straw
across study sites was teff straw followed by millet straw or maize stover depending on
availability. Sampled farmers in rice-pulses system of Fogera prefer legume straw rather than
rice straw (Appendix Table 9). Descheemaeker et al. (2010b) clearly illustrated that feeding
strategies that involve, for example, long walking and thus spending significant amount of
Metabolisable Energy reduces influence LWP values.
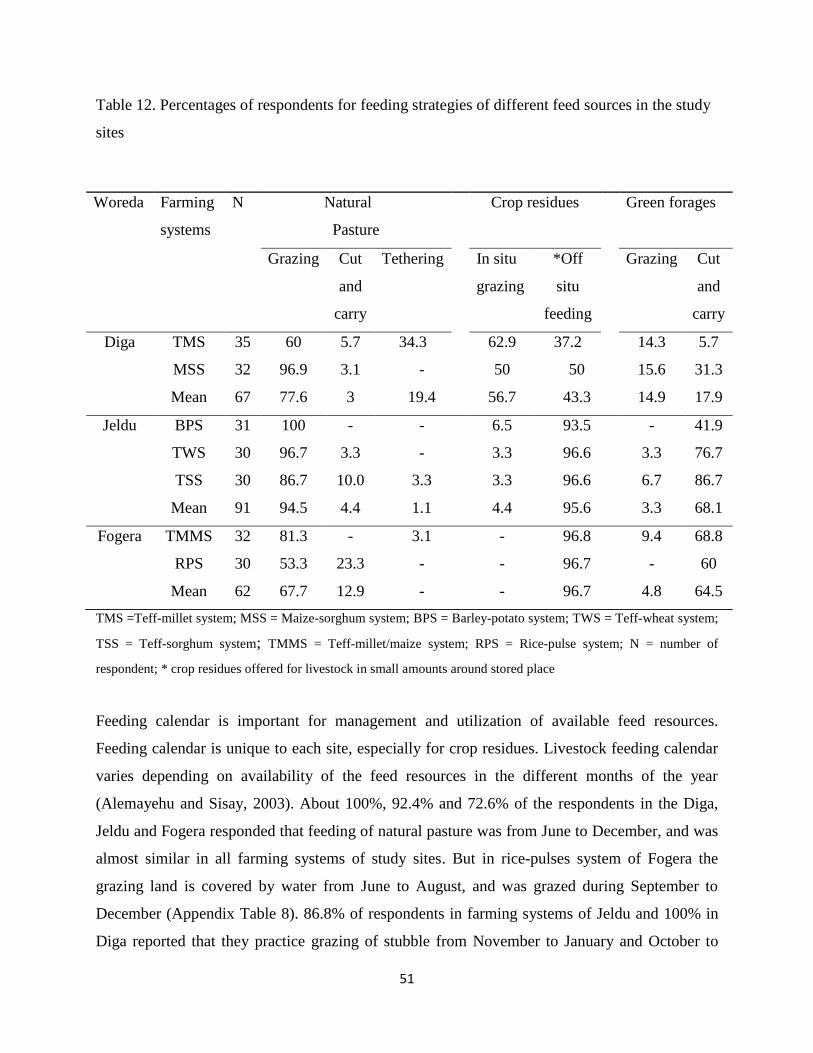
51
Table 12. Percentages of respondents for feeding strategies of different feed sources in the study
sites
TMS =Teff-millet system; MSS = Maize-sorghum system; BPS = Barley-potato system; TWS = Teff-wheat system;
TSS = Teff-sorghum system; TMMS = Teff-millet/maize system; RPS = Rice-pulse system; N = number of
respondent; * crop residues offered for livestock in small amounts around stored place
Feeding calendar is important for management and utilization of available feed resources.
Feeding calendar is unique to each site, especially for crop residues. Livestock feeding calendar
varies depending on availability of the feed resources in the different months of the year
(Alemayehu and Sisay, 2003). About 100%, 92.4% and 72.6% of the respondents in the Diga,
Jeldu and Fogera responded that feeding of natural pasture was from June to December, and was
almost similar in all farming systems of study sites. But in rice-pulses system of Fogera the
grazing land is covered by water from June to August, and was grazed during September to
December (Appendix Table 8). 86.8% of respondents in farming systems of Jeldu and 100% in
Diga reported that they practice grazing of stubble from November to January and October to
Woreda Farming
systems
N
Natural
Pasture
Crop residues
Green forages
Grazing Cut
and
carry
Tethering In situ
grazing
*Off
situ
feeding
Grazing Cut
and
carry
Diga TMS 35 60 5.7 34.3 62.9 37.2 14.3 5.7
MSS 32 96.9 3.1 - 50 50 15.6 31.3
Mean 67 77.6 3 19.4 56.7 43.3 14.9 17.9
Jeldu BPS 31 100 - - 6.5 93.5 - 41.9
TWS 30 96.7 3.3 - 3.3 96.6 3.3 76.7
TSS 30 86.7 10.0 3.3 3.3 96.6 6.7 86.7
Mean 91 94.5 4.4 1.1 4.4 95.6 3.3 68.1
Fogera TMMS 32 81.3 - 3.1 - 96.8 9.4 68.8
RPS 30 53.3 23.3 - - 96.7 - 60
Mean 62 67.7 12.9 - - 96.7 4.8 64.5
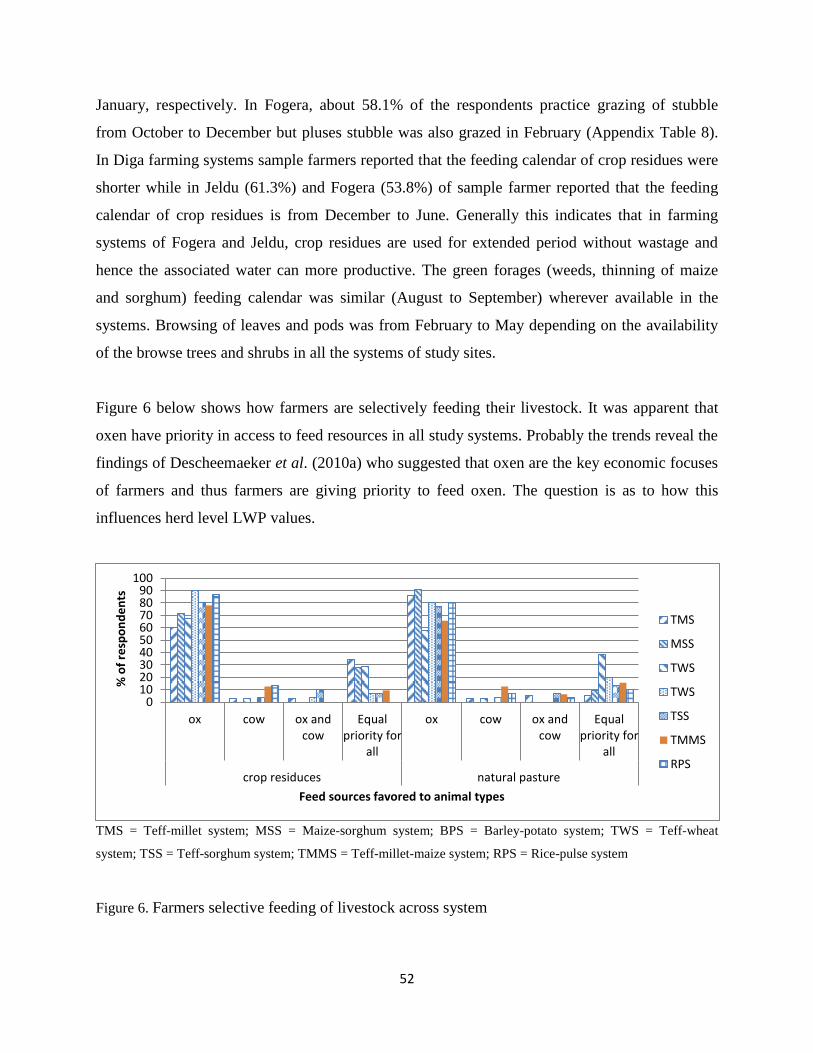
52
January, respectively. In Fogera, about 58.1% of the respondents practice grazing of stubble
from October to December but pluses stubble was also grazed in February (Appendix Table 8).
In Diga farming systems sample farmers reported that the feeding calendar of crop residues were
shorter while in Jeldu (61.3%) and Fogera (53.8%) of sample farmer reported that the feeding
calendar of crop residues is from December to June. Generally this indicates that in farming
systems of Fogera and Jeldu, crop residues are used for extended period without wastage and
hence the associated water can more productive. The green forages (weeds, thinning of maize
and sorghum) feeding calendar was similar (August to September) wherever available in the
systems. Browsing of leaves and pods was from February to May depending on the availability
of the browse trees and shrubs in all the systems of study sites.
Figure 6 below shows how farmers are selectively feeding their livestock. It was apparent that
oxen have priority in access to feed resources in all study systems. Probably the trends reveal the
findings of Descheemaeker et al. (2010a) who suggested that oxen are the key economic focuses
of farmers and thus farmers are giving priority to feed oxen. The question is as to how this
influences herd level LWP values.
TMS = Teff-millet system; MSS = Maize-sorghum system; BPS = Barley-potato system; TWS = Teff-wheat
system; TSS = Teff-sorghum system; TMMS = Teff-millet-maize system; RPS = Rice-pulse system
Figure 6. Farmers selective feeding of livestock across system
0102030405060708090
100
ox cow ox andcow
Equalpriority for
all
ox cow ox andcow
Equalpriority for
all
crop residuces natural pasture
% o
f re
spo
nd
en
ts
Feed sources favored to animal types
TMS
MSS
TWS
TWS
TSS
TMMS
RPS
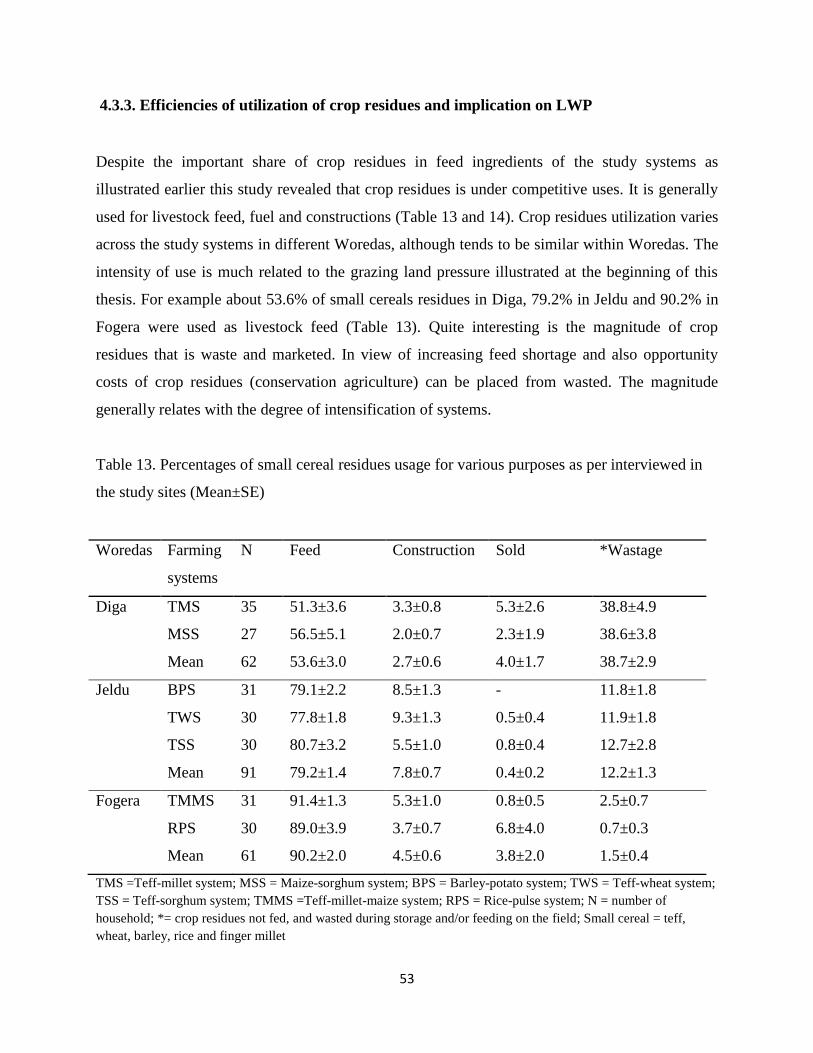
53
4.3.3. Efficiencies of utilization of crop residues and implication on LWP
Despite the important share of crop residues in feed ingredients of the study systems as
illustrated earlier this study revealed that crop residues is under competitive uses. It is generally
used for livestock feed, fuel and constructions (Table 13 and 14). Crop residues utilization varies
across the study systems in different Woredas, although tends to be similar within Woredas. The
intensity of use is much related to the grazing land pressure illustrated at the beginning of this
thesis. For example about 53.6% of small cereals residues in Diga, 79.2% in Jeldu and 90.2% in
Fogera were used as livestock feed (Table 13). Quite interesting is the magnitude of crop
residues that is waste and marketed. In view of increasing feed shortage and also opportunity
costs of crop residues (conservation agriculture) can be placed from wasted. The magnitude
generally relates with the degree of intensification of systems.
Table 13. Percentages of small cereal residues usage for various purposes as per interviewed in
the study sites (Mean±SE)
Woredas Farming
systems
N Feed Construction Sold *Wastage
Diga TMS 35 51.3±3.6 3.3±0.8 5.3±2.6 38.8±4.9
MSS 27 56.5±5.1 2.0±0.7 2.3±1.9 38.6±3.8
Mean 62 53.6±3.0 2.7±0.6 4.0±1.7 38.7±2.9
Jeldu BPS 31 79.1±2.2 8.5±1.3 - 11.8±1.8
TWS 30 77.8±1.8 9.3±1.3 0.5±0.4 11.9±1.8
TSS 30 80.7±3.2 5.5±1.0 0.8±0.4 12.7±2.8
Mean 91 79.2±1.4 7.8±0.7 0.4±0.2 12.2±1.3
Fogera TMMS 31 91.4±1.3 5.3±1.0 0.8±0.5 2.5±0.7
RPS 30 89.0±3.9 3.7±0.7 6.8±4.0 0.7±0.3
Mean 61 90.2±2.0 4.5±0.6 3.8±2.0 1.5±0.4
TMS =Teff-millet system; MSS = Maize-sorghum system; BPS = Barley-potato system; TWS = Teff-wheat system;
TSS = Teff-sorghum system; TMMS =Teff-millet-maize system; RPS = Rice-pulse system; N = number of
household; *= crop residues not fed, and wasted during storage and/or feeding on the field; Small cereal = teff,
wheat, barley, rice and finger millet
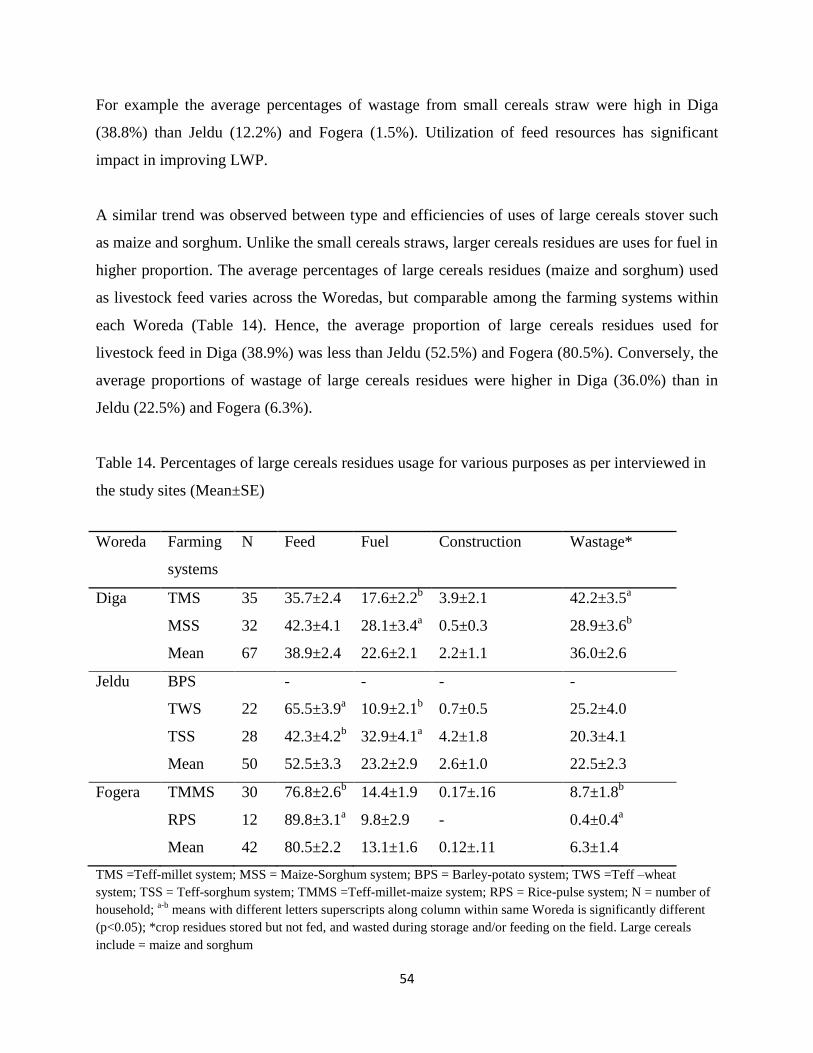
54
For example the average percentages of wastage from small cereals straw were high in Diga
(38.8%) than Jeldu (12.2%) and Fogera (1.5%). Utilization of feed resources has significant
impact in improving LWP.
A similar trend was observed between type and efficiencies of uses of large cereals stover such
as maize and sorghum. Unlike the small cereals straws, larger cereals residues are uses for fuel in
higher proportion. The average percentages of large cereals residues (maize and sorghum) used
as livestock feed varies across the Woredas, but comparable among the farming systems within
each Woreda (Table 14). Hence, the average proportion of large cereals residues used for
livestock feed in Diga (38.9%) was less than Jeldu (52.5%) and Fogera (80.5%). Conversely, the
average proportions of wastage of large cereals residues were higher in Diga (36.0%) than in
Jeldu (22.5%) and Fogera (6.3%).
Table 14. Percentages of large cereals residues usage for various purposes as per interviewed in
the study sites (Mean±SE)
Woreda Farming
systems
N Feed Fuel Construction Wastage*
Diga TMS 35 35.7±2.4 17.6±2.2b 3.9±2.1 42.2±3.5
a
MSS 32 42.3±4.1 28.1±3.4a 0.5±0.3 28.9±3.6
b
Mean 67 38.9±2.4 22.6±2.1 2.2±1.1 36.0±2.6
Jeldu BPS - - - -
TWS 22 65.5±3.9a 10.9±2.1
b 0.7±0.5 25.2±4.0
TSS 28 42.3±4.2b 32.9±4.1
a 4.2±1.8 20.3±4.1
Mean 50 52.5±3.3 23.2±2.9 2.6±1.0 22.5±2.3
Fogera TMMS 30 76.8±2.6b 14.4±1.9 0.17±.16 8.7±1.8
b
RPS 12 89.8±3.1a 9.8±2.9 - 0.4±0.4
a
Mean 42 80.5±2.2 13.1±1.6 0.12±.11 6.3±1.4
TMS =Teff-millet system; MSS = Maize-Sorghum system; BPS = Barley-potato system; TWS =Teff –wheat
system; TSS = Teff-sorghum system; TMMS =Teff-millet-maize system; RPS = Rice-pulse system; N = number of
household; a-b
means with different letters superscripts along column within same Woreda is significantly different
(p<0.05); *crop residues stored but not fed, and wasted during storage and/or feeding on the field. Large cereals
include = maize and sorghum
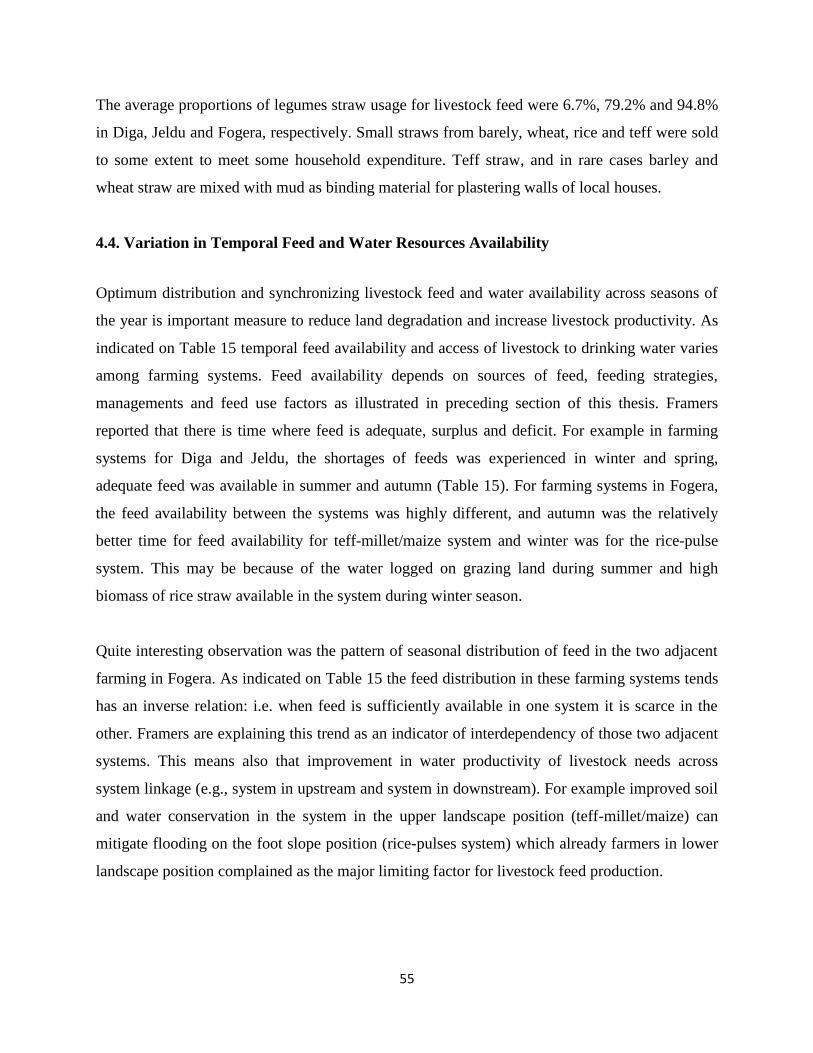
55
The average proportions of legumes straw usage for livestock feed were 6.7%, 79.2% and 94.8%
in Diga, Jeldu and Fogera, respectively. Small straws from barely, wheat, rice and teff were sold
to some extent to meet some household expenditure. Teff straw, and in rare cases barley and
wheat straw are mixed with mud as binding material for plastering walls of local houses.
4.4. Variation in Temporal Feed and Water Resources Availability
Optimum distribution and synchronizing livestock feed and water availability across seasons of
the year is important measure to reduce land degradation and increase livestock productivity. As
indicated on Table 15 temporal feed availability and access of livestock to drinking water varies
among farming systems. Feed availability depends on sources of feed, feeding strategies,
managements and feed use factors as illustrated in preceding section of this thesis. Framers
reported that there is time where feed is adequate, surplus and deficit. For example in farming
systems for Diga and Jeldu, the shortages of feeds was experienced in winter and spring,
adequate feed was available in summer and autumn (Table 15). For farming systems in Fogera,
the feed availability between the systems was highly different, and autumn was the relatively
better time for feed availability for teff-millet/maize system and winter was for the rice-pulse
system. This may be because of the water logged on grazing land during summer and high
biomass of rice straw available in the system during winter season.
Quite interesting observation was the pattern of seasonal distribution of feed in the two adjacent
farming in Fogera. As indicated on Table 15 the feed distribution in these farming systems tends
has an inverse relation: i.e. when feed is sufficiently available in one system it is scarce in the
other. Framers are explaining this trend as an indicator of interdependency of those two adjacent
systems. This means also that improvement in water productivity of livestock needs across
system linkage (e.g., system in upstream and system in downstream). For example improved soil
and water conservation in the system in the upper landscape position (teff-millet/maize) can
mitigate flooding on the foot slope position (rice-pulses system) which already farmers in lower
landscape position complained as the major limiting factor for livestock feed production.
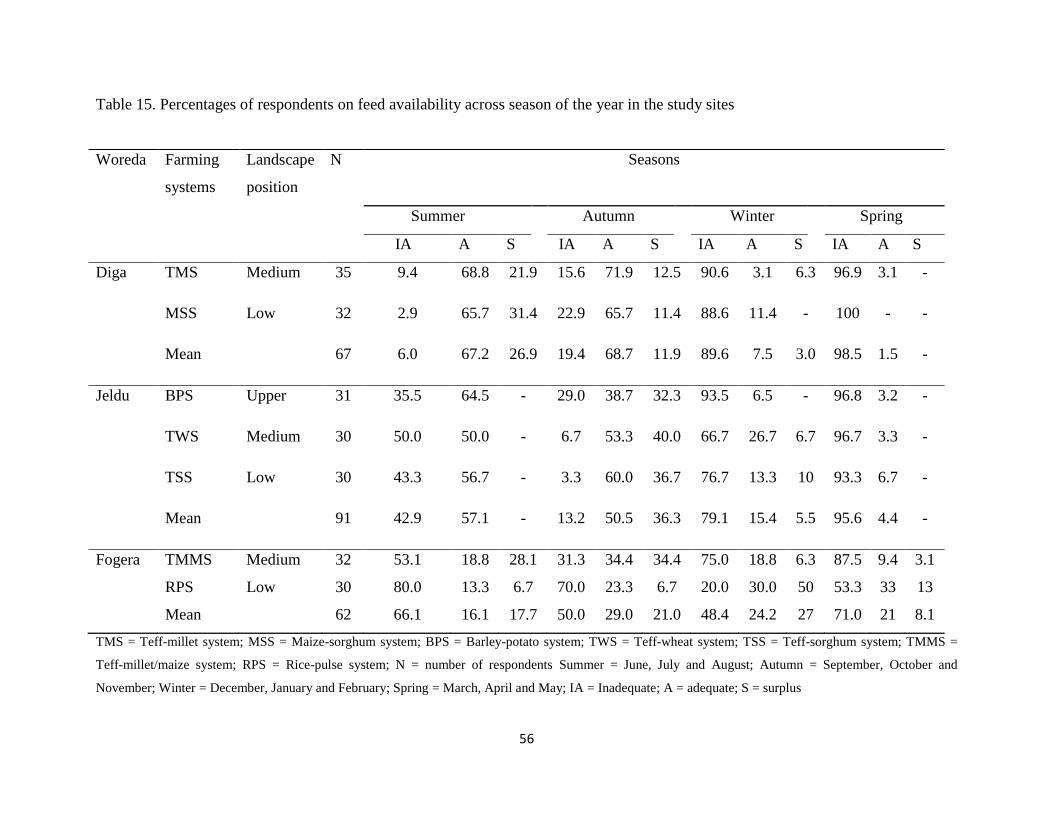
56
Table 15. Percentages of respondents on feed availability across season of the year in the study sites
TMS = Teff-millet system; MSS = Maize-sorghum system; BPS = Barley-potato system; TWS = Teff-wheat system; TSS = Teff-sorghum system; TMMS =
Teff-millet/maize system; RPS = Rice-pulse system; N = number of respondents Summer = June, July and August; Autumn = September, October and
November; Winter = December, January and February; Spring = March, April and May; IA = Inadequate; A = adequate; S = surplus
Woreda Farming
systems
Landscape
position
N Seasons
Summer Autumn Winter Spring
IA A S IA A S IA A S IA A S
Diga TMS Medium 35 9.4 68.8 21.9 15.6 71.9 12.5 90.6 3.1 6.3 96.9 3.1 -
MSS Low 32 2.9 65.7 31.4 22.9 65.7 11.4 88.6 11.4 - 100 - -
Mean 67 6.0 67.2 26.9 19.4 68.7 11.9 89.6 7.5 3.0 98.5 1.5 -
Jeldu BPS Upper 31 35.5 64.5 - 29.0 38.7 32.3 93.5 6.5 - 96.8 3.2 -
TWS Medium 30 50.0 50.0 - 6.7 53.3 40.0 66.7 26.7 6.7 96.7 3.3 -
TSS Low 30 43.3 56.7 - 3.3 60.0 36.7 76.7 13.3 10 93.3 6.7 -
Mean 91 42.9 57.1 - 13.2 50.5 36.3 79.1 15.4 5.5 95.6 4.4 -
Fogera TMMS Medium 32 53.1 18.8 28.1 31.3 34.4 34.4 75.0 18.8 6.3 87.5 9.4 3.1
RPS Low 30 80.0 13.3 6.7 70.0 23.3 6.7 20.0 30.0 50 53.3 33 13
Mean 62 66.1 16.1 17.7 50.0 29.0 21.0 48.4 24.2 27 71.0 21 8.1
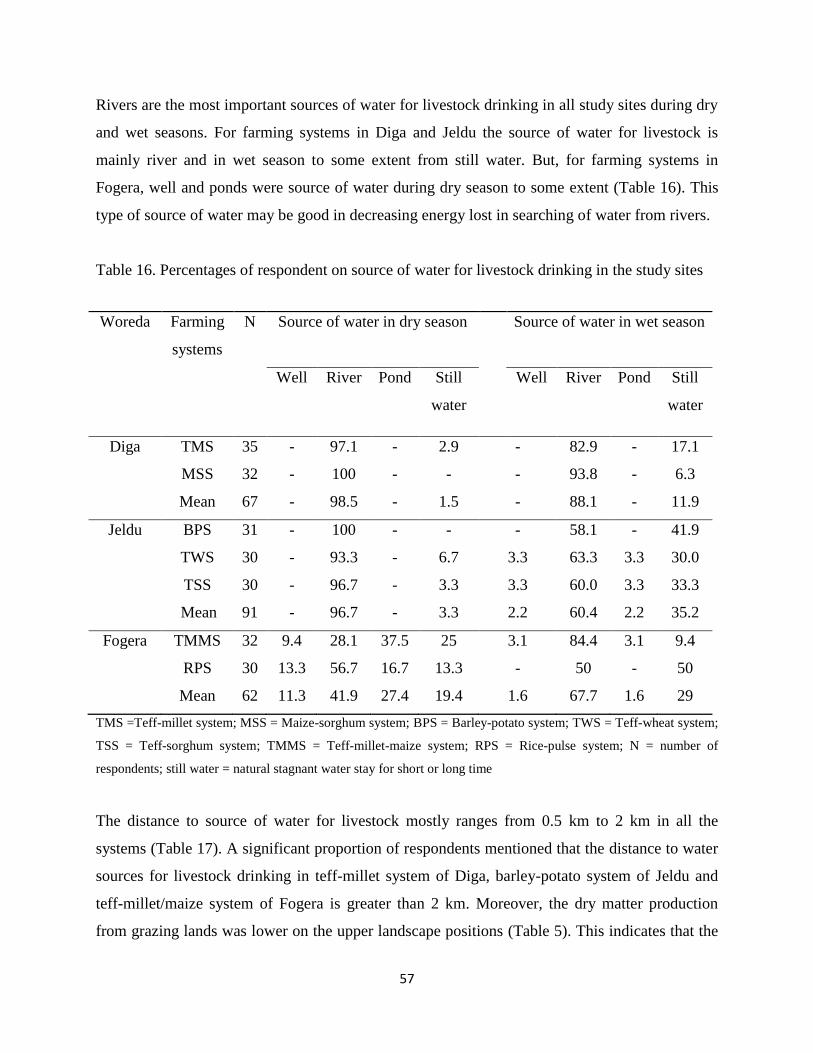
57
Rivers are the most important sources of water for livestock drinking in all study sites during dry
and wet seasons. For farming systems in Diga and Jeldu the source of water for livestock is
mainly river and in wet season to some extent from still water. But, for farming systems in
Fogera, well and ponds were source of water during dry season to some extent (Table 16). This
type of source of water may be good in decreasing energy lost in searching of water from rivers.
Table 16. Percentages of respondent on source of water for livestock drinking in the study sites
TMS =Teff-millet system; MSS = Maize-sorghum system; BPS = Barley-potato system; TWS = Teff-wheat system;
TSS = Teff-sorghum system; TMMS = Teff-millet-maize system; RPS = Rice-pulse system; N = number of
respondents; still water = natural stagnant water stay for short or long time
The distance to source of water for livestock mostly ranges from 0.5 km to 2 km in all the
systems (Table 17). A significant proportion of respondents mentioned that the distance to water
sources for livestock drinking in teff-millet system of Diga, barley-potato system of Jeldu and
teff-millet/maize system of Fogera is greater than 2 km. Moreover, the dry matter production
from grazing lands was lower on the upper landscape positions (Table 5). This indicates that the
Woreda Farming
systems
N Source of water in dry season
Source of water in wet season
Well River Pond Still
water
Well River Pond Still
water
Diga TMS 35 - 97.1 - 2.9 - 82.9 - 17.1
MSS 32 - 100 - - - 93.8 - 6.3
Mean 67 - 98.5 - 1.5 - 88.1 - 11.9
Jeldu BPS 31 - 100 - - - 58.1 - 41.9
TWS 30 - 93.3 - 6.7 3.3 63.3 3.3 30.0
TSS 30 - 96.7 - 3.3 3.3 60.0 3.3 33.3
Mean 91 - 96.7 - 3.3 2.2 60.4 2.2 35.2
Fogera TMMS 32 9.4 28.1 37.5 25 3.1 84.4 3.1 9.4
RPS 30 13.3 56.7 16.7 13.3 - 50 - 50
Mean 62 11.3 41.9 27.4 19.4 1.6 67.7 1.6 29
58
shortage of feed coupled with more energy wastages in search of water will reduce the
productivity of livestock. The study of Peden (2009) pointed out that minimizing stress on the
animal associated with factors such as excessive trekking to watering sites is important to reduce
the water cost of animal production. In dry season, the distance to water sources would be longer
and the frequency of water drinking is mainly two times per day in all farming systems (Table
17). This aggravates the energy loss mostly in upper or medium position compared to the lower
landscape position of farming systems. Staal et al. (2001) showed that providing on-site drinking
water to livestock reduces stress and energy costs associated with drinking enabling substantive
increases in animal production, which can improve LWP.
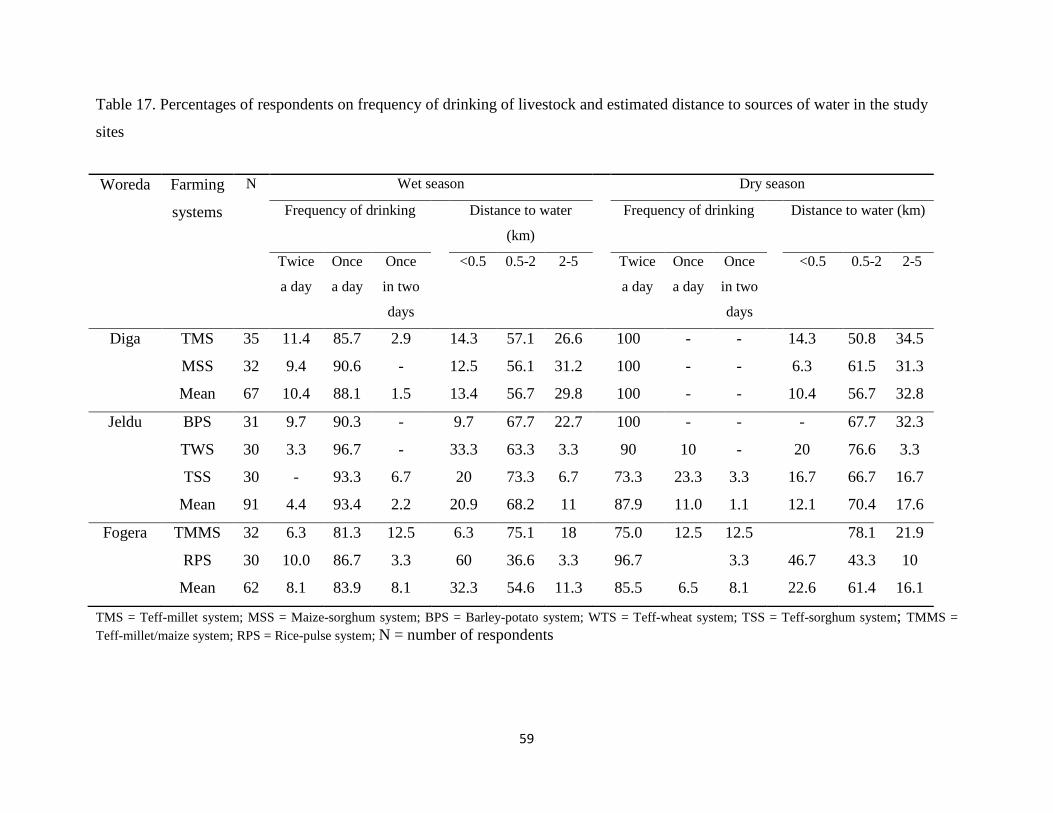
59
Table 17. Percentages of respondents on frequency of drinking of livestock and estimated distance to sources of water in the study
sites
TMS = Teff-millet system; MSS = Maize-sorghum system; BPS = Barley-potato system; WTS = Teff-wheat system; TSS = Teff-sorghum system; TMMS =
Teff-millet/maize system; RPS = Rice-pulse system; N = number of respondents
Woreda Farming
systems
N Wet season
Dry season
Frequency of drinking Distance to water
(km)
Frequency of drinking
Distance to water (km)
Twice
a day
Once
a day
Once
in two
days
<0.5 0.5-2 2-5 Twice
a day
Once
a day
Once
in two
days
<0.5 0.5-2 2-5
Diga TMS 35 11.4 85.7 2.9 14.3 57.1 26.6 100 - - 14.3 50.8 34.5
MSS 32 9.4 90.6 - 12.5 56.1 31.2 100 - - 6.3 61.5 31.3
Mean 67 10.4 88.1 1.5 13.4 56.7 29.8 100 - - 10.4 56.7 32.8
Jeldu BPS 31 9.7 90.3 - 9.7 67.7 22.7 100 - - - 67.7 32.3
TWS 30 3.3 96.7 - 33.3 63.3 3.3 90 10 - 20 76.6 3.3
TSS 30 - 93.3 6.7 20 73.3 6.7 73.3 23.3 3.3 16.7 66.7 16.7
Mean 91 4.4 93.4 2.2 20.9 68.2 11 87.9 11.0 1.1 12.1 70.4 17.6
Fogera TMMS 32 6.3 81.3 12.5 6.3 75.1 18 75.0 12.5 12.5 78.1 21.9
RPS 30 10.0 86.7 3.3 60 36.6 3.3 96.7 3.3 46.7 43.3 10
Mean 62 8.1 83.9 8.1 32.3 54.6 11.3 85.5 6.5 8.1 22.6 61.4 16.1
60
4.5. Major Constraints on Feed Sourcing and Feeding
Table 18 below depicts major problem related with feed sourcing and feeding in the study
systems of the Blue Nile Basin. Shortage of grazing land ranked first in all study sites. The
findings of this study agrees with the work of Zewdie (2010) which illustrated shortage of
grazing land as the major contributes to critical feed shortages in the Highland areas. This part of
this study also commensurate well with farmers opinion regarding determinates of weak
adoption of improved forage production reported in the preceding section of this work. Land
degradation and low biomass yield were ranked as second in Diga and third in Jeldu. Issues of
land degradation in the study systems are also reported by Birhanu et al. (2011). In Fogera,
livestock population pressure ranked as second constraint of feed sourcing and feeding strategies.
Probably what is peculiar in those relatively high rain fall areas is the fact that poor rain fall
distribution stood the second important problem for systems in Jeldu. Water logging on grazing
land was a constraint in farming systems of Fogera mainly in rice-pulses system.
In their study of scenario based comparison of the impacts of livestock and feed based
intervention on LWP values, Amare et al., (2011a) illustrated that feed based intervention has a
significant magnitude of impacts on LWP compared to the livestock based. The fact that some of
the livestock based intervention takes longer year to generate impacts also limits the short term
targeting of this intervention.
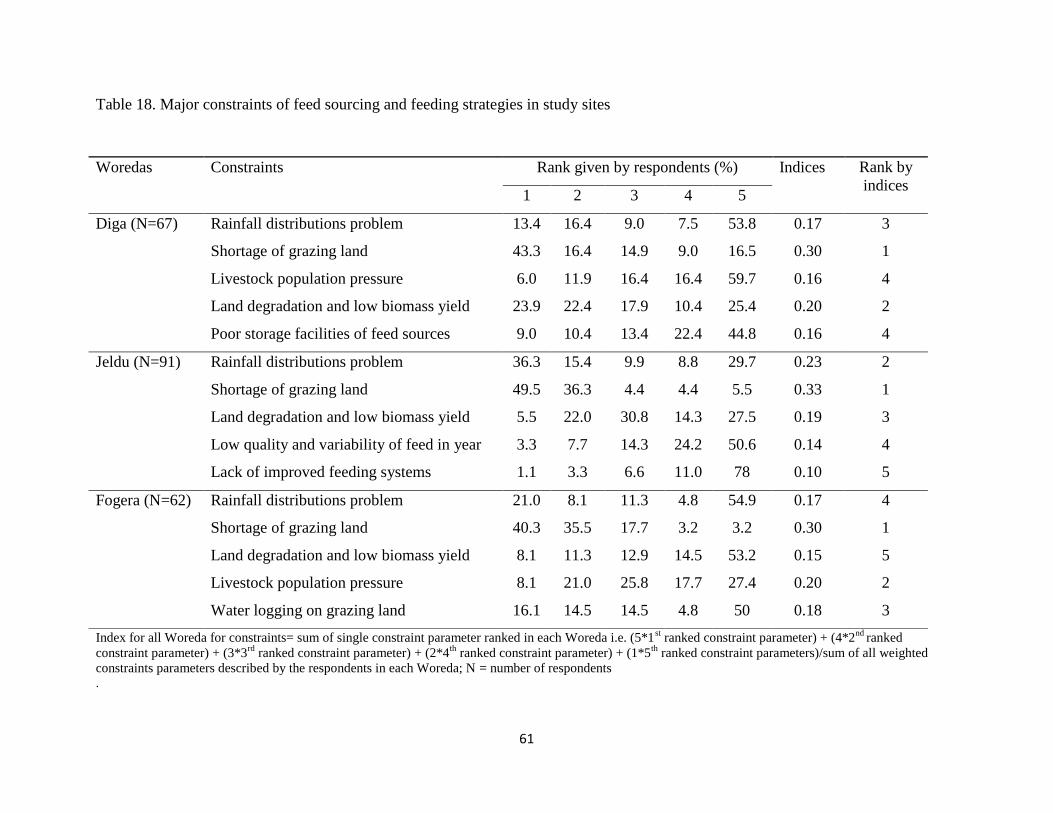
61
Table 18. Major constraints of feed sourcing and feeding strategies in study sites
Index for all Woreda for constraints= sum of single constraint parameter ranked in each Woreda i.e. (5*1st ranked constraint parameter) + (4*2
nd ranked
constraint parameter) + (3*3rd
ranked constraint parameter) + (2*4th
ranked constraint parameter) + (1*5th
ranked constraint parameters)/sum of all weighted
constraints parameters described by the respondents in each Woreda; N = number of respondents .
Woredas Constraints Rank given by respondents (%) Indices Rank by
indices 1 2 3 4 5
Diga (N=67) Rainfall distributions problem 13.4 16.4 9.0 7.5 53.8 0.17 3
Shortage of grazing land 43.3 16.4 14.9 9.0 16.5 0.30 1
Livestock population pressure 6.0 11.9 16.4 16.4 59.7 0.16 4
Land degradation and low biomass yield 23.9 22.4 17.9 10.4 25.4 0.20 2
Poor storage facilities of feed sources 9.0 10.4 13.4 22.4 44.8 0.16 4
Jeldu (N=91) Rainfall distributions problem 36.3 15.4 9.9 8.8 29.7 0.23 2
Shortage of grazing land 49.5 36.3 4.4 4.4 5.5 0.33 1
Land degradation and low biomass yield 5.5 22.0 30.8 14.3 27.5 0.19 3
Low quality and variability of feed in year 3.3 7.7 14.3 24.2 50.6 0.14 4
Lack of improved feeding systems 1.1 3.3 6.6 11.0 78 0.10 5
Fogera (N=62) Rainfall distributions problem 21.0 8.1 11.3 4.8 54.9 0.17 4
Shortage of grazing land 40.3 35.5 17.7 3.2 3.2 0.30 1
Land degradation and low biomass yield 8.1 11.3 12.9 14.5 53.2 0.15 5
Livestock population pressure 8.1 21.0 25.8 17.7 27.4 0.20 2
Water logging on grazing land 16.1 14.5 14.5 4.8 50 0.18 3
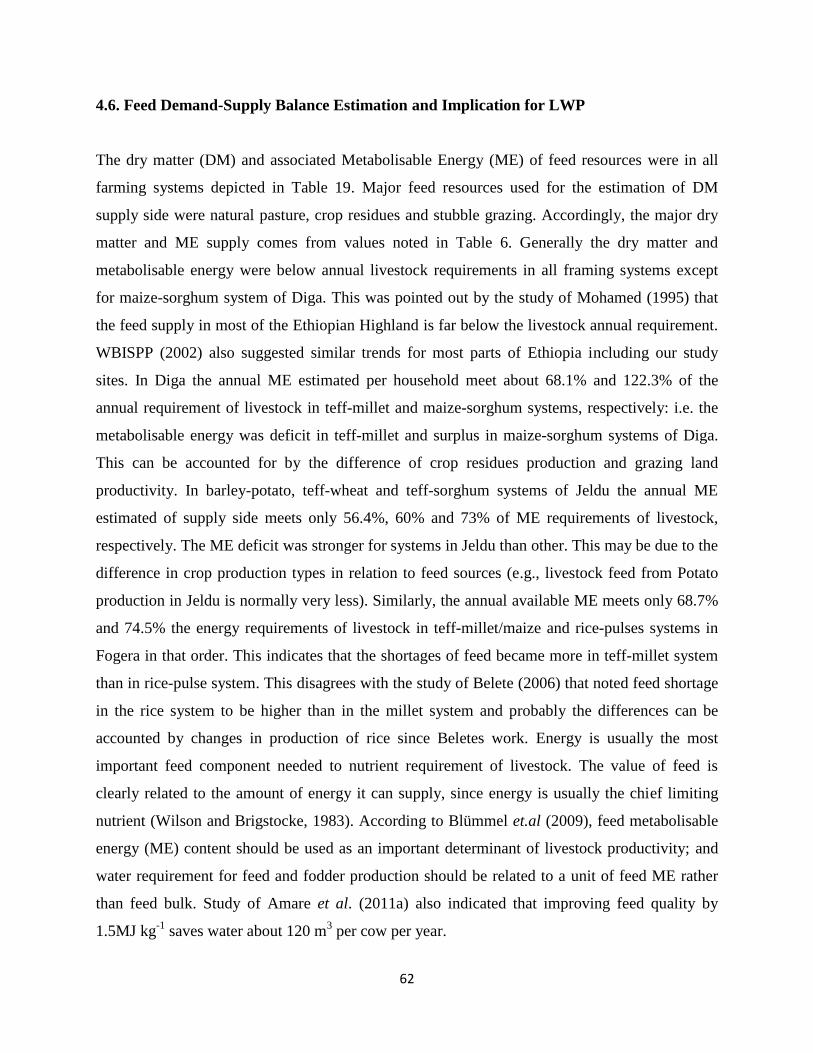
62
4.6. Feed Demand-Supply Balance Estimation and Implication for LWP
The dry matter (DM) and associated Metabolisable Energy (ME) of feed resources were in all
farming systems depicted in Table 19. Major feed resources used for the estimation of DM
supply side were natural pasture, crop residues and stubble grazing. Accordingly, the major dry
matter and ME supply comes from values noted in Table 6. Generally the dry matter and
metabolisable energy were below annual livestock requirements in all framing systems except
for maize-sorghum system of Diga. This was pointed out by the study of Mohamed (1995) that
the feed supply in most of the Ethiopian Highland is far below the livestock annual requirement.
WBISPP (2002) also suggested similar trends for most parts of Ethiopia including our study
sites. In Diga the annual ME estimated per household meet about 68.1% and 122.3% of the
annual requirement of livestock in teff-millet and maize-sorghum systems, respectively: i.e. the
metabolisable energy was deficit in teff-millet and surplus in maize-sorghum systems of Diga.
This can be accounted for by the difference of crop residues production and grazing land
productivity. In barley-potato, teff-wheat and teff-sorghum systems of Jeldu the annual ME
estimated of supply side meets only 56.4%, 60% and 73% of ME requirements of livestock,
respectively. The ME deficit was stronger for systems in Jeldu than other. This may be due to the
difference in crop production types in relation to feed sources (e.g., livestock feed from Potato
production in Jeldu is normally very less). Similarly, the annual available ME meets only 68.7%
and 74.5% the energy requirements of livestock in teff-millet/maize and rice-pulses systems in
Fogera in that order. This indicates that the shortages of feed became more in teff-millet system
than in rice-pulse system. This disagrees with the study of Belete (2006) that noted feed shortage
in the rice system to be higher than in the millet system and probably the differences can be
accounted by changes in production of rice since Beletes work. Energy is usually the most
important feed component needed to nutrient requirement of livestock. The value of feed is
clearly related to the amount of energy it can supply, since energy is usually the chief limiting
nutrient (Wilson and Brigstocke, 1983). According to Blümmel et.al (2009), feed metabolisable
energy (ME) content should be used as an important determinant of livestock productivity; and
water requirement for feed and fodder production should be related to a unit of feed ME rather
than feed bulk. Study of Amare et al. (2011a) also indicated that improving feed quality by
1.5MJ kg-1
saves water about 120 m3 per cow per year.

63
Scholars are increasingly concerned as to how livestock can survive and produce in states of
negative feed ME balances (Amare et al., 2011a). This thesis argues that demands might be
overestimated and supplies underestimated due to inconsistencies in analytical methods. Systems
are also not self-contained. Farmers in mixed crop livestock systems are diverse (e.g. in terms of
farmers’ access to resources).
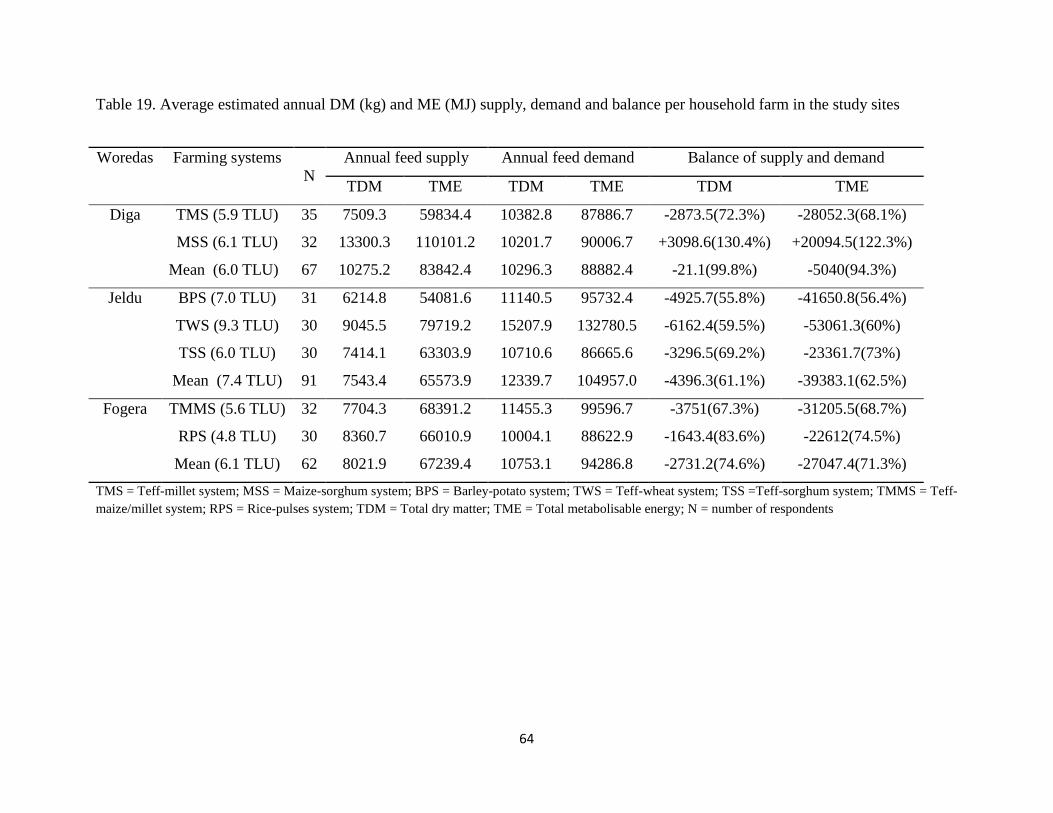
64
Table 19. Average estimated annual DM (kg) and ME (MJ) supply, demand and balance per household farm in the study sites
TMS = Teff-millet system; MSS = Maize-sorghum system; BPS = Barley-potato system; TWS = Teff-wheat system; TSS =Teff-sorghum system; TMMS = Teff-
maize/millet system; RPS = Rice-pulses system; TDM = Total dry matter; TME = Total metabolisable energy; N = number of respondents
Woredas Farming systems
N
Annual feed supply Annual feed demand Balance of supply and demand
TDM TME TDM TME TDM TME
Diga TMS (5.9 TLU) 35 7509.3 59834.4 10382.8 87886.7 -2873.5(72.3%) -28052.3(68.1%)
MSS (6.1 TLU) 32 13300.3 110101.2 10201.7 90006.7 +3098.6(130.4%) +20094.5(122.3%)
Mean (6.0 TLU) 67 10275.2 83842.4 10296.3 88882.4 -21.1(99.8%) -5040(94.3%)
Jeldu BPS (7.0 TLU) 31 6214.8 54081.6 11140.5 95732.4 -4925.7(55.8%) -41650.8(56.4%)
TWS (9.3 TLU) 30 9045.5 79719.2 15207.9 132780.5 -6162.4(59.5%) -53061.3(60%)
TSS (6.0 TLU) 30 7414.1 63303.9 10710.6 86665.6 -3296.5(69.2%) -23361.7(73%)
Mean (7.4 TLU) 91 7543.4 65573.9 12339.7 104957.0 -4396.3(61.1%) -39383.1(62.5%)
Fogera TMMS (5.6 TLU) 32 7704.3 68391.2 11455.3 99596.7 -3751(67.3%) -31205.5(68.7%)
RPS (4.8 TLU) 30 8360.7 66010.9 10004.1 88622.9 -1643.4(83.6%) -22612(74.5%)
Mean (6.1 TLU) 62 8021.9 67239.4 10753.1 94286.8 -2731.2(74.6%) -27047.4(71.3%)
65
The overall feed deficit coping mechanisms are depicted in Table 20. In Diga crop residues
usage and movement of livestock across the systems were the coping mechanisms during feed
shortages. The coping mechanism of feed shortages in Jeldu and Fogera includes preservation of
crop residues, hay making and purchasing of grazing land. However, it was observed during
survey time that the harvesting time of natural pastures were during seed shedding. This may
deteriorate the quality of the hay and thus LWP values. In Jeldu, movement of livestock in search
of feed sources called ‘Daraba’, to a less livestock populated areas is practiced. About 33% of
respondents move their all cattle except oxen and lactating cows from June end to September.
According to the respondents, it needs approximately 12 hours for livestock trekking to cover
around 42 km to the source of feed.
Table 20. Percentages of respondents on coping mechanisms during feed shortages
TMS = Teff-millet system; MSS = Maize-sorghum system; BPS = Barley-potato system; TWS =Teff-wheat system;
TSS = Teff-sorghum system; TMMS = Teff-maize/millet system; RPS = Rice-pulses system; N = number of
respondents
Woredas Farming
systems
N Move livestock
to search feed
Hay
making
Purchase
of grazing
land
Usage of
crop
residues
No
measure
taken
Yes No
Diga TMS 35 20 80 - 5.7 71.5 22.9
MSS 32 12.5 87.5 - 9.4 62.5 28.1
Mean 67 16.4 83.6 - 7.5 67.2 25.4
Jeldu BPS 31 9.7 90.3 35.5 3.2 74.2 22.6
TWS 30 40 60 43.3 13.3 83.3 3.3
TSS 30 50 50 10 30 50 20
Mean 91 33 67 29.7 15.4 69.2 15.4
Fogera TMMS 32 30 70 40.6 9.4 53.1 9.4
RPS 30 3.1 96.8 13.3 16.7 50 10
Mean 62 16.1 83.9 27.4 12.9 51.6 9.7
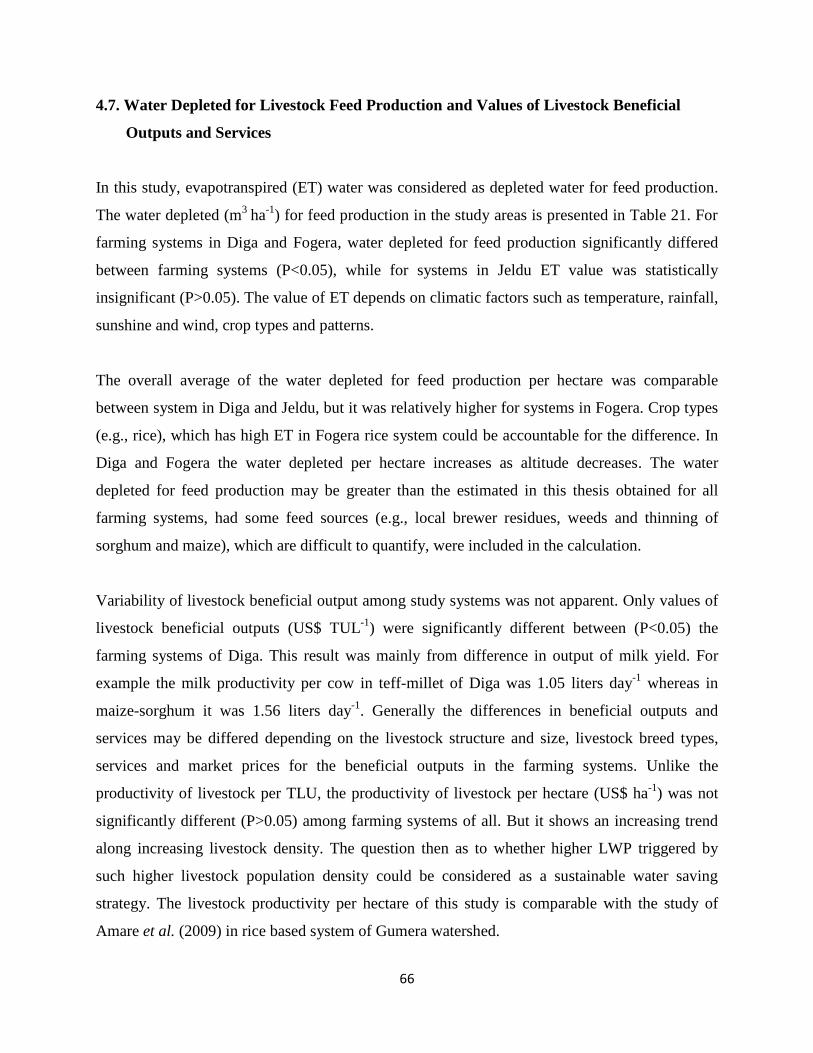
66
4.7. Water Depleted for Livestock Feed Production and Values of Livestock Beneficial
Outputs and Services
In this study, evapotranspired (ET) water was considered as depleted water for feed production.
The water depleted (m3
ha-1
) for feed production in the study areas is presented in Table 21. For
farming systems in Diga and Fogera, water depleted for feed production significantly differed
between farming systems (P<0.05), while for systems in Jeldu ET value was statistically
insignificant (P>0.05). The value of ET depends on climatic factors such as temperature, rainfall,
sunshine and wind, crop types and patterns.
The overall average of the water depleted for feed production per hectare was comparable
between system in Diga and Jeldu, but it was relatively higher for systems in Fogera. Crop types
(e.g., rice), which has high ET in Fogera rice system could be accountable for the difference. In
Diga and Fogera the water depleted per hectare increases as altitude decreases. The water
depleted for feed production may be greater than the estimated in this thesis obtained for all
farming systems, had some feed sources (e.g., local brewer residues, weeds and thinning of
sorghum and maize), which are difficult to quantify, were included in the calculation.
Variability of livestock beneficial output among study systems was not apparent. Only values of
livestock beneficial outputs (US$ TUL-1
) were significantly different between (P<0.05) the
farming systems of Diga. This result was mainly from difference in output of milk yield. For
example the milk productivity per cow in teff-millet of Diga was 1.05 liters day-1
whereas in
maize-sorghum it was 1.56 liters day-1
. Generally the differences in beneficial outputs and
services may be differed depending on the livestock structure and size, livestock breed types,
services and market prices for the beneficial outputs in the farming systems. Unlike the
productivity of livestock per TLU, the productivity of livestock per hectare (US$ ha-1
) was not
significantly different (P>0.05) among farming systems of all. But it shows an increasing trend
along increasing livestock density. The question then as to whether higher LWP triggered by
such higher livestock population density could be considered as a sustainable water saving
strategy. The livestock productivity per hectare of this study is comparable with the study of
Amare et al. (2009) in rice based system of Gumera watershed.
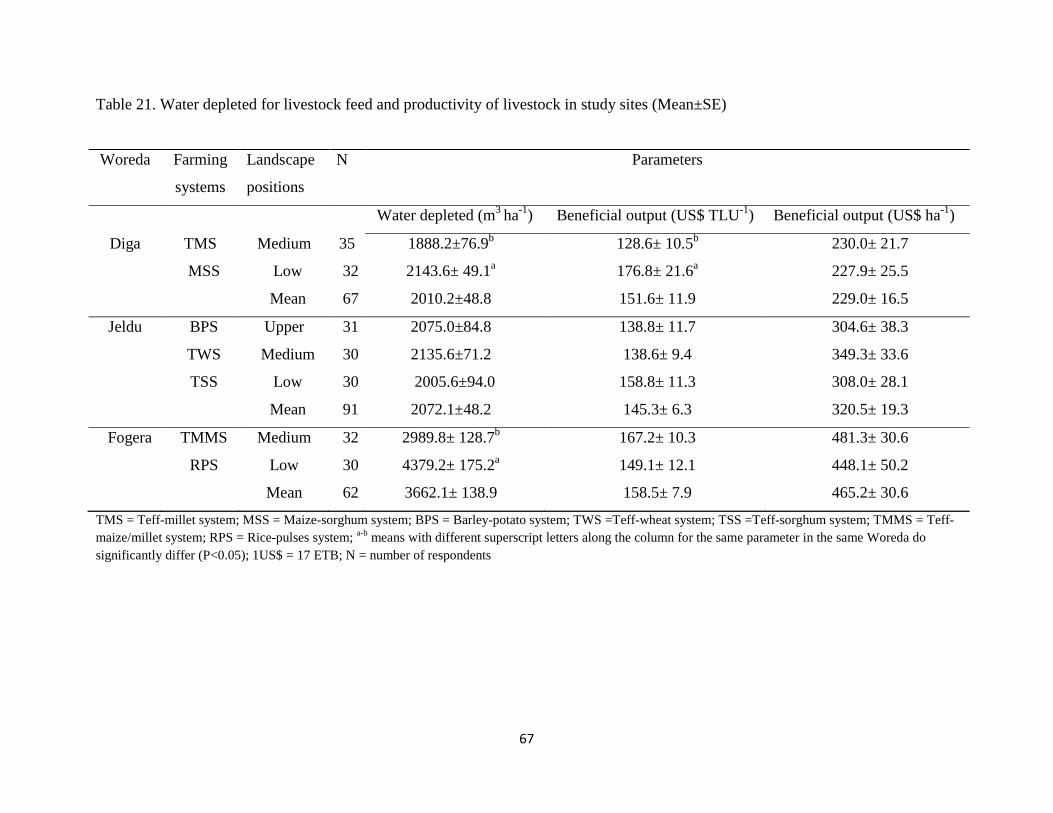
67
Table 21. Water depleted for livestock feed and productivity of livestock in study sites (Mean±SE)
TMS = Teff-millet system; MSS = Maize-sorghum system; BPS = Barley-potato system; TWS =Teff-wheat system; TSS =Teff-sorghum system; TMMS = Teff-
maize/millet system; RPS = Rice-pulses system; a-b
means with different superscript letters along the column for the same parameter in the same Woreda do
significantly differ (P<0.05); 1US$ = 17 ETB; N = number of respondents
Woreda Farming
systems
Landscape
positions
N Parameters
Water depleted (m3
ha-1
) Beneficial output (US$ TLU-1
) Beneficial output (US$ ha-1
)
Diga TMS Medium 35 1888.2±76.9b 128.6± 10.5
b 230.0± 21.7
MSS Low 32 2143.6± 49.1a 176.8± 21.6
a 227.9± 25.5
Mean 67 2010.2±48.8 151.6± 11.9 229.0± 16.5
Jeldu BPS Upper 31 2075.0±84.8 138.8± 11.7 304.6± 38.3
TWS Medium 30 2135.6±71.2 138.6± 9.4 349.3± 33.6
TSS Low 30 2005.6±94.0 158.8± 11.3 308.0± 28.1
Mean 91 2072.1±48.2 145.3± 6.3 320.5± 19.3
Fogera TMMS Medium 32 2989.8± 128.7b 167.2± 10.3 481.3± 30.6
RPS Low 30 4379.2± 175.2a 149.1± 12.1 448.1± 50.2
Mean 62 3662.1± 138.9 158.5± 7.9 465.2± 30.6
68
4.8. Feed Water Productivity
Water productivity for feed resources in the study systems is shown in Table 22. The total feed
water productivity was computed from major feed resources (crop residues, grazing lands and
stubble grazing). For systems in Diga, maize-sorghum system showed a significantly higher feed
water productivity values at (P<0.05). In Jeldu, the grazing land water productivity increased
with decreased in altitude and was significantly different at P<0.05. For farming systems in
Fogera, total feed and crop residues water productivity showed statistically significant difference
at P<0.05. The magnitudes of water productivity for feed sources (e.g., crop residues and grazing
land) were generally higher in lower landscape position and the degree of water depletion
showed similar trend. The point here is how these trends, elaborated so far, feed productivity,
depleted water, feed water productivity and livestock beneficial out puts, influences the LWP
values and what these imply in terms of entry points to improve LWP. Number of empirical
evidence suggests that feed water productivity is one of the key determinants of LWP (Amare et
al., 2011a and Descheemaeker et al., 2010b). The value for crop residues water productivity
ranges from 1.2 kg m-3
to 1.9 kg m-3
in the study farming systems. This is comparable with study
of Mekete (2008) that noted 1.19 and 1.38 kg m-3
in rainfed Golina and Awehula watersheds,
respectively. However, the water productivity for grazing land reported here was higher than
study of Mekete (2008) which was conducted in Golina (0.26 kg m-3
) and Awehula (0.32 kg m-
3). The differences can be accounted for by the differences in the level moisture in the two study
areas.
69
Table 22. Water productivity for feed sources (kg m-3
) in the study sites (Mean±SE)
TMS = Teff-millet system; MSS = Maize-sorghum system; BPS = Barley-potato system; TWS = Teff-wheat
system; TSS = Teff-sorghum system; TMMS = Teff-maize/millet system; RPS = Rice-pulses system; a-b-c
means
with different superscript letters along column for the same parameter in the same Woreda do significantly differ
(P<0.05); SE = standard error; CRWP = Crop residues water productivity; GLWP = Grazing land water
productivity; TFWP= Total feed water productivity
The overall average total feed water productivity was comparable across the study Woredas.
However, Peden et al. (2007) concluded from available literature that evapotranspired water used
to produce 1 kg of dry animal feed is highly variable, ranging from about 0.5 kg m-3
of water to
about 8 kg m-3
of water. This implies the potential for improvement. The low value of grazing
land feed water productivity is likely partially related to the fact that grazing land often has
shallow or degraded soil (Table 18) that is not or no longer suitable for crops. This guides for
more attention on grazing land management to increase the productivity of water. The study of
Gibon (2005) indicated that appropriate grazing management is primarily intended to maintain a
sufficient vegetative ground cover, contribute to healthy and productive pastures that not only
provide biomass for fodder but also to environmental services such as biodiversity conservation
and protection of downstream water uses.
Woreda Farming
systems
Landscape
positions
N Parameters
CRWP GLWP TFWP
Diga TMS Medium 35 1.2±0.06b 0.56±0.03
b 1.3±0.05
b
MSS Low 32 1.9±0.07a 0.74±0.03
a 1.9±0.15
a
Mean 67 1.5±0.06 0.64±0.02 1.6±0.09
Jeldu BPS Upper 31 1.26±0.06 0.46±0.03c 1.30±0.08
b
TWS Medium 30 1.27±0.04 0.75±0.02b 1.41±0.04
ab
TSS Low 30 1.34±0.05 0.89±0.06a 1.59±0.06
a
Mean 91 1.30±0.03 0.70±0.03 1.43±0.03
Fogera TMMS Medium 32 1.3±0.04b 0.73±0.04 1.4±0.04
b
RPS Low 30 1.5±0.05a 0.82±0.04 1.8±0.05
a
Mean 62 1.4±0.03 0.77±0.03 1.6±0.04
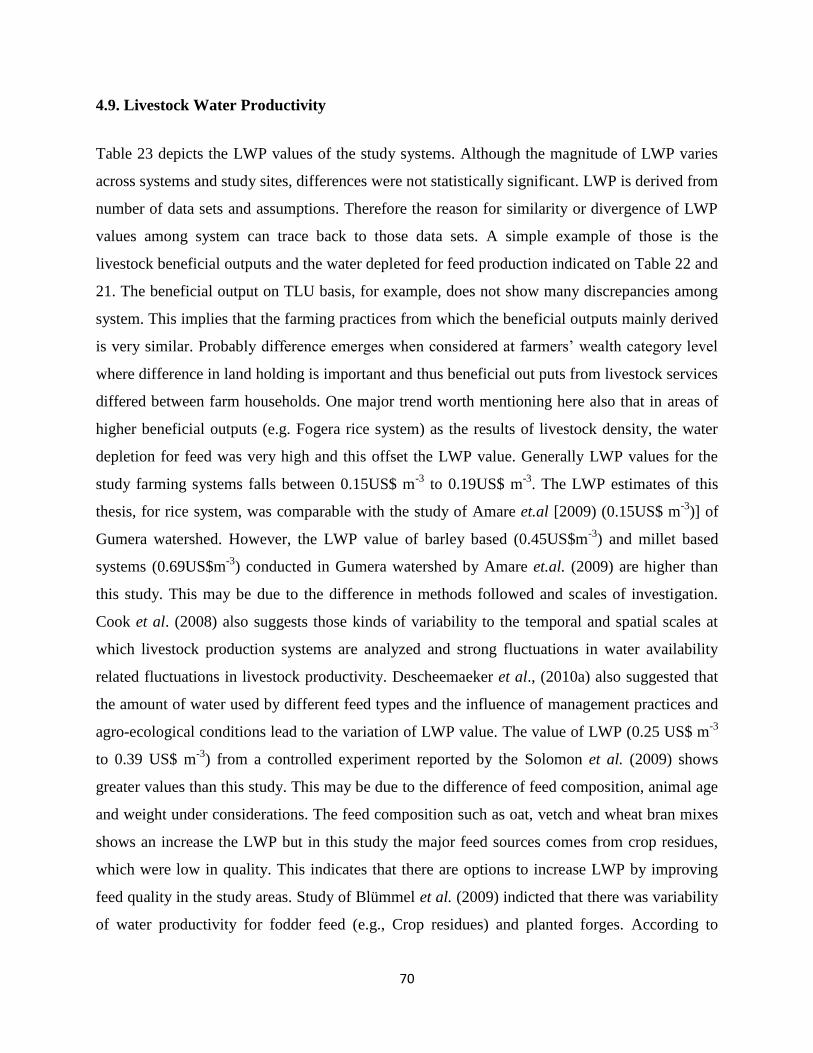
70
4.9. Livestock Water Productivity
Table 23 depicts the LWP values of the study systems. Although the magnitude of LWP varies
across systems and study sites, differences were not statistically significant. LWP is derived from
number of data sets and assumptions. Therefore the reason for similarity or divergence of LWP
values among system can trace back to those data sets. A simple example of those is the
livestock beneficial outputs and the water depleted for feed production indicated on Table 22 and
21. The beneficial output on TLU basis, for example, does not show many discrepancies among
system. This implies that the farming practices from which the beneficial outputs mainly derived
is very similar. Probably difference emerges when considered at farmers’ wealth category level
where difference in land holding is important and thus beneficial out puts from livestock services
differed between farm households. One major trend worth mentioning here also that in areas of
higher beneficial outputs (e.g. Fogera rice system) as the results of livestock density, the water
depletion for feed was very high and this offset the LWP value. Generally LWP values for the
study farming systems falls between 0.15US$ m-3
to 0.19US$ m-3
. The LWP estimates of this
thesis, for rice system, was comparable with the study of Amare et.al [2009) (0.15US$ m-3
)] of
Gumera watershed. However, the LWP value of barley based (0.45US$m-3
) and millet based
systems (0.69US$m-3
) conducted in Gumera watershed by Amare et.al. (2009) are higher than
this study. This may be due to the difference in methods followed and scales of investigation.
Cook et al. (2008) also suggests those kinds of variability to the temporal and spatial scales at
which livestock production systems are analyzed and strong fluctuations in water availability
related fluctuations in livestock productivity. Descheemaeker et al., (2010a) also suggested that
the amount of water used by different feed types and the influence of management practices and
agro-ecological conditions lead to the variation of LWP value. The value of LWP (0.25 US$ m-3
to 0.39 US$ m-3
) from a controlled experiment reported by the Solomon et al. (2009) shows
greater values than this study. This may be due to the difference of feed composition, animal age
and weight under considerations. The feed composition such as oat, vetch and wheat bran mixes
shows an increase the LWP but in this study the major feed sources comes from crop residues,
which were low in quality. This indicates that there are options to increase LWP by improving
feed quality in the study areas. Study of Blümmel et al. (2009) indicted that there was variability
of water productivity for fodder feed (e.g., Crop residues) and planted forges. According to
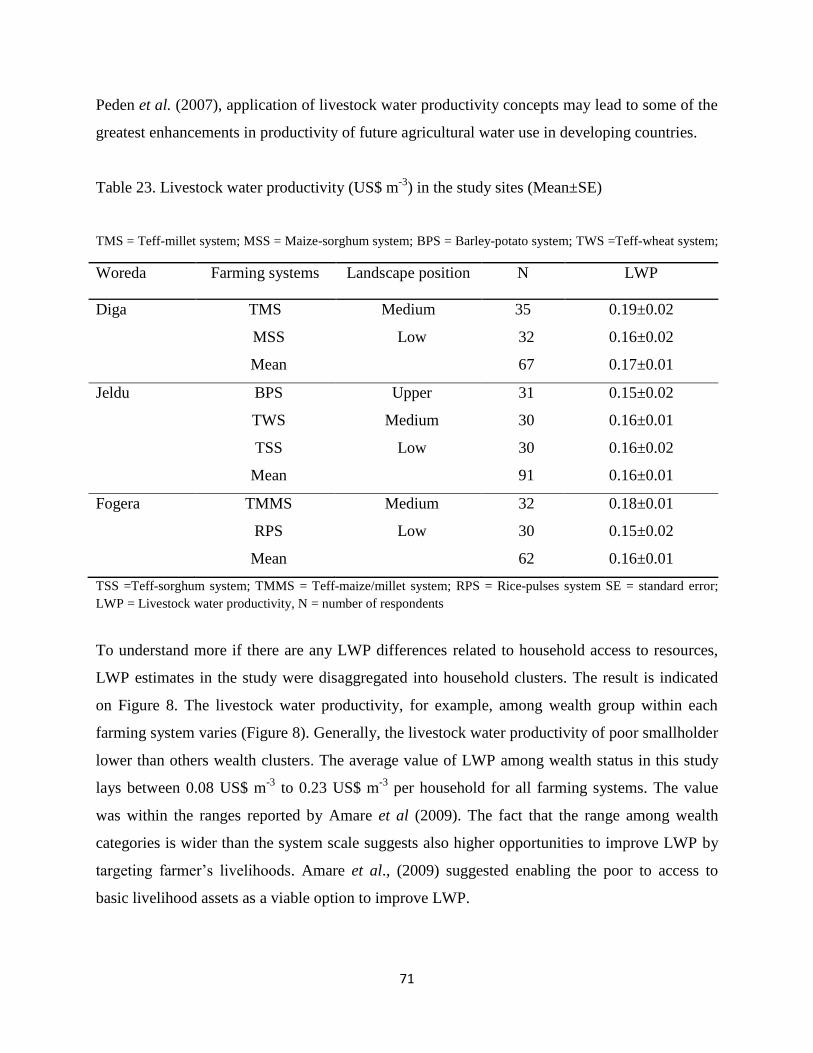
71
Peden et al. (2007), application of livestock water productivity concepts may lead to some of the
greatest enhancements in productivity of future agricultural water use in developing countries.
Table 23. Livestock water productivity (US$ m-3
) in the study sites (Mean±SE)
TMS = Teff-millet system; MSS = Maize-sorghum system; BPS = Barley-potato system; TWS =Teff-wheat system;
TSS =Teff-sorghum system; TMMS = Teff-maize/millet system; RPS = Rice-pulses system SE = standard error;
LWP = Livestock water productivity, N = number of respondents
To understand more if there are any LWP differences related to household access to resources,
LWP estimates in the study were disaggregated into household clusters. The result is indicated
on Figure 8. The livestock water productivity, for example, among wealth group within each
farming system varies (Figure 8). Generally, the livestock water productivity of poor smallholder
lower than others wealth clusters. The average value of LWP among wealth status in this study
lays between 0.08 US$ m-3
to 0.23 US$ m-3
per household for all farming systems. The value
was within the ranges reported by Amare et al (2009). The fact that the range among wealth
categories is wider than the system scale suggests also higher opportunities to improve LWP by
targeting farmer’s livelihoods. Amare et al., (2009) suggested enabling the poor to access to
basic livelihood assets as a viable option to improve LWP.
Woreda Farming systems Landscape position N LWP
Diga TMS Medium 35 0.19±0.02
MSS Low 32 0.16±0.02
Mean 67 0.17±0.01
Jeldu BPS Upper 31 0.15±0.02
TWS Medium 30 0.16±0.01
TSS Low 30 0.16±0.02
Mean 91 0.16±0.01
Fogera TMMS Medium 32 0.18±0.01
RPS Low 30 0.15±0.02
Mean 62 0.16±0.01
72
TMMS = Teff-maize-millet system; RPS = Rice-pulses system; TMS = Teff-millet system; MSS = Maize-sorghum
system; BPS = Barley-potato system; TWS =Teff-wheat system; TSS =Teff-sorghum system
Figure 7. Average livestock water productivity among wealth group of smallholders in the study
sites
Correlation of LWP with some farm characteristics and land management seems strong and
suggested important points of interventions. Livestock water productivity shows significant
(P<0.01) and positive correlated with family size in Diga (r2=0.63) and Fogera (r
2=0.58) and also
significant in Jeldu (r2=0.26) (P<0.05). The family size is highly related with labor force, more
family size may contribute to more labor force for feeding and herding and also for crop
production activities that increases crop yield and therewith the feed water productivity.
Livestock water productivity shows significant (P<0.05) and positively correlation with total
feed production (r2=0.25) and dry matter from crop residues (r
2=0.24) for systems in Jeldu.
Hence, the more feed produce is the water productivity of feed and thus this positively influences
LWP. But for system in Fogera like rice system LWP was not significantly (P>0.05) related with
total feed production and dry matter from crop residues. In rice system of Fogera lack of strong
relation between feed productivity and LWP can be generally explained by the fact that the feed
production there costs more water than for similar volume of dry matter elsewhere.
0
0.05
0.1
0.15
0.2
0.25
0.3
TMS MSS BPS TWS TSS TMMS RPS
Diga Jeldu Fogera
LW
P (
US
$ m
-3)
Farming systems within each Woreda
Better off
Medium
Poor
73
4.10. Opportunities to improve LWP
Improving grazing land management (private and communal) is an option to increase water
productivity. This would be through institutions responsible for communal grazing management
and private grazing land improvement. Clearing of invasive species (e.g., the case of Fogera
Asracantha longifolia and Diga, Sida schimperiana) increases the yield of natural pasture and
nutrition and decreases water depleted by non-productive invasive plants. Proper grazing
management and leaving of the livestock’s dung on the grazed lands improves species
composition and diversity. This increases the productivity of natural pasture and water
infiltration. For example in Fogera simple improved management of grazing land improves feed
productivity by 100%.
Synchronizing feed and water sources were also an option to save water. In Diga and Jeldu,
livestock move long distance in search of water for drinking during dry season other than the
usual sources of water. This leads much energy lost and hence LWP value decreases. Most of the
respondents not practicing improved forage production. This is also an option to increase the
water productivity of feed and hence the LWP values.
Appropriate management of available feed sources also increases quality of feed and the
productivity of livestock and hence the LWP. In all study areas, storage and utilization of crop
residues were highly variable. Good storage of crop residues increases the quality. Utilization of
available crop residues for feed was low in Diga, particularly in maize-sorghum system. So,
compromising the use of crop residues for both feed and nutrient cycling would increases the
water productivity and hence LWP. In all study areas, improving the quality of crop residues is
not practiced. Hence, improving the quality of crop residues through different treatments (e.g.,
urea treatment) is an option to increase the productivity of livestock. Under sowing legumes
fodder in cereals could also increase the feed quality and increase water productivity. Improved
feeding of available sources in which almost the respondents have no experience also increases
the water productivity (e.g., cut and carry system, supplementary of feed).
74
5. SUMMARY AND CONCLUSION
This study was conducted to assess livestock feed sourcing and feeding strategies and their
implications on livestock water productivity (LWP) in mixed crop-livestock systems of Blue
Nile Basin (BNB) highlands. Three Woredas (Diga, Jeldu and Fogera) that are assumed to
represent the highlands of BNB were considered. From each Woreda, one watershed was
selected. Each watershed was further stratified into different farming systems depending on crop
dominations and landscape positions. Diga has teff-millet and maize-sorghum farming systems;
Jeldu has barley-potato, teff-wheat and teff-sorghum farming systems; and Fogera has teff-
millet/maize and rice-pulses farming systems. Multi-stage stratified random sampling was
employed to select farm households.
The sources of feed identified in the study area were natural pasture, crop residues, stubble
grazing and green forages such as weeds and thinning of maize and sorghum. Generally for all
farming systems, the crop residues contribution to feed on a dry matter basis ranged from 58.5%
to 78.2%. Overall dry matter productivity of grasses and legumes from private grazing land
showed variation across systems except systems of Fogera. The highest yield was estimated for
systems in Fogera (5.54 and 5.82 ton ha-1
) while the lowest was for systems in Jeldu (2.74 to
4.52 ton ha-1
). The dry matter production from grazing land per household was comparable
across Woredas but varies among farming systems within each Woreda. The dry matter
production of crop residues per household among the farming systems within each Woreda
differed significantly. More than 85% of respondents in all study farming systems mentioned that
they do not practice improved forages production. The result also demonstrated that farmers
practice feed supplementation very rarely particularly with sources from outside their farm (e.g.,
bran, oil seed cake).
Management of feed resources also varies across the Woredas. In the study systems about 95.5%
of sample farmers in Diga, 92.3% in Jeldu and 88.7% in Fogera responded that the grazing lands
are deteriorating. Lacks of clearing of invasive species, bylaws to manage common property
resources and manure usage for fertilizer purpose are the major problem of grazing land
management.
75
This study found out that crop residues management varies across study sites mainly in terms of
storage, utilization and feeding calendar. The storage of straws in study systems of Jeldu and
Fogera was better than Diga. The feeding strategies of crop residues differed across the Woredas
but were similar among farming systems within Woredas. Generally, there were no
improvements made so far to increase the quality of crop residues. Crop residues are under
competitive uses. They are generally used for livestock feed, fuel and constructions. Crop
residues utilization varies across the study systems in different Woredas, although tends to be
similar within Woredas.
Feed deficits were found in all the study Woredas. In Jeldu Woreda, ME meets about 62.5% of
livestock feed requirement. In maize-sorghum system of Diga, about 22.3% ME was surplus than
annual livestock feed requirements. But in teff-millet system of Diga Woreda ME meets about
68.1% of livestock feed requirements. In Fogera Woreda ME only satisfies 68.7% and 74.5% of
livestock feed requirements in teff-millet/maize and rice-pluses systems, respectively.
The overall water depleted for feed production was comparable between Diga (2010.2 m3
ha-1
)
and Jeldu Woredas (2080.2 m3
ha-1
) but it was higher for Fogera Woreda (3662.1 m3
ha-1
).
Variability of livestock beneficial output among study systems was not apparent. Only values of
livestock beneficial outputs (US$ TUL-1
) were significantly different between (P<0.05) the
farming systems of Diga. The total feed water productivity was similar across the Woredas, and
about 87.5% to 93.5% of it was contributed by crop residues water productivity. The grazing
land water productivity was comparable across the Woredas, but differed among farming
systems of Diga and Jeldu Woredas. The livestock water productivity was not different among
the farming systems in each Woreda. But, generally the average livestock water productivity
among the grouped wealth status varies in each study systems. In view of the results, the
followings key messages can be drawn:
Currently, in all of the study farming systems, crop residues constitute the major ingredient
of livestock diet. Supplementary feeding with high value feed is not commonly practiced.
Livestock feed scarcity is considerable. These can be attributed, firstly, to the ongoing land
use changes from grazing to arable lands and this resulted in shortage of land for grazing as
widely reported by sample farmers. Secondly, failure of the crop production sector and also
76
the grazing land to achieve the biological yield potential through integrated land and water
management and thereby to offset the growing feed demand; and thirdly, in response to land
use changes and as a result of dwindling feed supply, farmers’ actions to improve feed
sourcing (e.g., improved forages), feeding strategies are not being seen. Hence, strategic way
of feed source diversification, improvement of quality, improved feeding strategies and
efficient utilization of feeds are important entry for feed productivity improvement and hence
LWP values.
In view of this thesis generally improving water productivity of feed is major entry points to
improve LWP. Very high yield gap between the result of this study and the results from on
farm experiments (e.g., in Fogera) probably gives very good insights as to how much water
we can save by improving the biomass yield from grazing areas.
System scale LWP did not show apparent divergences between farming systems as the farm
scale did. The farm scale showed a very wide range between the resources poor and better off
farmers. Such big gap of LWP for farm households operating in the same farming system
suggests a potential for improvements. Hence, to exploit this potential, policy measures that
build farmers capacity to access key livelihood assets (e.g., land and livestock) is important.
There are useful examples of good LWP enhancement strategies (e.g., virtual water transfer,
‘Daraba’) in some of the systems. These can be out-scaled to other systems. But such an
exercise must be contextualized and supported by research findings.
RECOMMENDATIONS AND FUTURE SCOPE OF STUDY
Crop residues are most important in contributing to livestock feed but they tend to be
of low quality. Hence, encouraging farmers to practice improved forage production
with integration of crop production (e.g., food-feed crops, integration of legume
forages in cereals crops).
Construction of proper storage and treatment of crop residues, clearing invasive
species from grazing land, improved feeding, more effective extension services and
farmer training are required to increase feed productivity and hence human
development.
77
Farmers lack seeds and awareness of improved forages. Hence joint extension and
training service and provision of seeds are required
High feed energy deficits occurred in upper landscape positions of the farming
systems. Enhancing feed supply needs attention in all farming systems.
In this study, the LWP showed generally variation implying opportunities for
improvement. Future development efforts and policy option must nurture these
opportunities.
The results presented in this thesis are based on a one-year survey. However, feed
production, feed utilization, feed management, climatic factors, productivity of
livestock (e.g., off take) and market prices related output and services of livestock in
any given landscape vary over time. Thus, it is necessary to conduct multiyear and
controlled experiments to reach to a conclusive LWP estimates.
78
6. REFERENCES
Abate Tedla and Abiye Astake, 1993. Some Methods of Introducing Forage Legumes into the
Smallholder Mixed Farms in the Ethiopian Highlands. 11p. Proceedings of Symposium on
environmental degradation. Mekele, Ethiopia, 15-20 April 1992, Mekelle University.
Abdinasir Ibrahim, 2000. Smallholder Dairy Production and Dairy Technology Adoption in the
Mixed Farming System in Arsi Highland, Ethiopia. PhD. Thesis, Humboldt University, Berlin,
Germany. 146p.
Adugna Tolera and A. N. Said, 1994. Assessment of feed resources in Wolaita Sodo, Ethiopian.
Jounal of Agrricultural Sciences. Vol. 14. pp. 69-87
Adugna Tolera., 2007. Feed resources for producing export quality meat and livestock in
Ethiopia (Examples from selected Weredas in Oromia and SNNP regional states), Addis Abab,
Ethiopia.
Ahamed Hassen Mohammed, 2006. Assessment and utilization practices of feed resources in
Basona Worana woreda of North Showa, An M.Sc. Thesis Presented to the School of Graduate
Studies of Haramay University, Haramaya, Ethiopia.
Alemayehu Dessalegn, 2009. Effect of land management on vegetation dynamics of grazing
lands of Mana-Sibu Woreda, West Wollega, Oromia, MSc. Thesis Presented to the School of
Graduate Studies of Haramaya University, Haramaya University, pp 83
Alemayehu Mengistu and Sissay Amare, 2003. Integrated Livestock Development Project
(ILDP). Livestock Feed Resources Survey. North Gondar, Ethiopia.pp. 75
Alemayehu Mengistu, 1987. Feed Resources in Ethiopia. 42p, Proceedings of the Second
National Livestock Improvement Conference. Addis Ababa, Ethiopia, 11-13 February 1987.
Institute of Agricultural Research.
79
Alemayehu Mengistu, 1998. Natural resource improvement study around smallholder dairy
development areas. MOA small scale dairy development area project (SDDP). Grassland
ecology study. MOA, Animal and Fishery Resource Development Department, Addis Ababa,
Ethiopia. 35p.
Alemayehu Mengistu, 2004. Pasture and Forage Resource profiles of Ethiopia. 19p.
Ethiopia/FAO. Addis Ababa, Ethiopia.
Alemayehu Mengistu., 2005. Feed Resources Base of Ethiopia: Status Limitations and
opportunities for integrated development. Proceedings of the 12th Annual Conference of the
Ethiopian Society of Animal Production (ESAP) held in Addis Ababa, Ethiopia, August 12-14,
2004. Addis Ababa, 410p.
Alemu Yami, Zinash Silesh and Seyoum Bediye, 1991. The Potential of Crop Residues and
Agro-Industrial By-Products as Animal Feed. In: ESAP Proceedings, Third National Livestock
Improvement Conference.24-26 May 1989.Addis Ababa, Ethiopia. pp. 57-63.
Alganesh Tola, L. N. Ofodile and Fekadu Beyene, 2008. Microbial Quality and Chemical
Composition of Raw Whole Milk from Horro Cattle in East Wollega, Ethiopia, Department of
Animal Science, Jimma University, Ambo College, Ethiopia
Amare Haileslassie, J. Priess, E. Veldkamp and J. P. Lesschen, 2006. Smallholders’ soil fertility
management in the Central Highlands of Ethiopia: implications for nutrient stocks, balances and
sustainability of agro ecosystems. Nutrient Cycling in Agro ecosystems 75:135-146
Amare Haileslassie, D. Peden, Solomon Geberselassie, Tilahun Amede and D. Descheemaeker,
2009. Livestock water productivity in mixed crop–livestock farming systems of the Blue Nile
Basin:Assessing variability and prospects for improvement. Agricultural system.102 (1-3):33-40.
80
Amare Haileslassie, A. Duncan and D. Peden, 2010. Integrating livestock into farming systems
rain water management strategies: a system diagnosis to improve water productivity
(unpublished), International Livestock water productivity, Ethiopia.
Amare Haileslassie, B. Blummel, F. Clement, K. Descheemacker, Tilahun Amede, A.
Samireddypalle, S. Acharya, V. Radha, S. Ihaq, M. Samad, M. V. R. Murty and M. A. Khan,
2011a. Assessment of the livestock-feed and water nexus across a mixed crop Livestock systems
intensification gradient: An example from the Indo-Ganga basin. Experimental Agriculture. 47:
113-132.
Amare, Haileslassie, M. Blummel, F. Clement S. Ishaq and M.A. Khan, 2011b. Adapting
livestock water productivity to climate change. International Journal of Climate Change
Strategies and Management Vol. 3: 156-169.
Amsalu Sisay, 2000. Herbaceous Species Composition. Dry matter Production and Condition of
the Major Grazing Areas in the Mid Rift Valley Ethiopia. An M.Sc. Thesis Presented to the
School of Graduate Studies of Alemaya University, Alemaya, Ethiopia.106p.
Ashagre Abate, 2008. Effect of Nitrogen Fertilizer and Harvesting Stage on Yield and Quality of
Natural Pasture In Fogera Woreda, North Western Ethiopia. A MSc. Thesis peresnted to
Haramaya University.
Assefu Gizachew, 2012. Comparative Feedlot Performance of Washera and Horro Sheep Fed
Different Roughage to Concentrate Ratio. A MSc. Thesis peresnted to Haramaya University.
Ayana Angassa, 1999. Range condition and traditional grazing management in Borana. An MSc
Thesis Presented to the School of Graduate Studies of Alemaya University of Agriculture,
Alemaya, Ethiopia. pp 50.

81
Bekele Shiferaw, 1991. Crop livestock interactions in the Ethiopian Highlands and effects on
sustainability of mixed farming: A case study from Ada Woreda. An M. Sc Thesis, Agricultural
University of Norway. pp. 35-65.
Belete Anteneh, 2006. Studies on Cattle Milk and Meat Production in Fogera Woreda:
Production Systems, Constraints and Opportunities for Development, MSc. Thesis, Hawassa
University, Hawassa, Ethiopia.
Benin, S., S. Ehui and J. Pender, 2006. Policies for livestock development in the Ethiopian
Highlands. In Strategies for Sustainable Land Management in the East African Highlands. pp.
141–164 (Eds, J. Pender, F. Place, S. Ehui). Washington, DC: IFPR.
Blümmel, M., M. Samad, O. P. Singh and Tilahun Amede, 2009. Opportunities and limitations
of food-feed crops for livestock feeding and implications for livestock water productivity. The
Rangeland Journal. 31: 207–213.
Birhanu Zemadim, M. Matthew, S. Bharat and W. Abeyou, 2011. Integrated Rain Water
Management Strategies in the Blue Nile Basin of the Ethiopian Highlands, International Journal
of Water Resources and Environmental Engineering Vol. 3(10), pp. 220-232
CSA, 2008. Ethiopian Statistical Abstract, Central Statistical Authority, Addis Ababa Ethiopia.
DARDO (Diga Woreda of Agriculture and Rural Development office), 2011. Annual report,
eastern Wollega, Ethiopia
Descheemaeker, K., Tilahun Amede and Amare Haileslassie, 2009. Livestock and water
interactions in mixed crop-livestock farming systems of sub-Saharan Africa: Interventions for
improved productivity. Colombo, Sri Lanka: International Water Management Institute.
44p.(IWMI Working Paper 133)
82
Descheemaeker, K., Tilahun Amede and Amare Haileslassie, 2010a. Improving water
productivity in mixed crop–livestock farming systems of sub-Saharan Africa. Agricultural Water
Management. 97: 579–586.
Descheemaeker, K., Amare Haileslassie, Tilahun Amede, D. Bossio and T. Tarawali, 2010b.
Assessment of water productivity and entry points for improvement in mixed crop-livestock
systems of the Ethiopian Highlands. Advances in Animal Biosciences, 1, pp 491-492
doi:10.1017/S204047001000110X
Descheemaeker, K., E. Mapedza, Tilahun Amede and Ayaleneh Wagnew, 2010c. Effects of
integrated watershed management on livestock water productivity in water scarce areas in
Ethiopia. Physics and Chemistry of the Earth, Parts A/B/C 35(13-14):723-729.
Descheemaeker, K., Tilahun Amede and D. Bossio, 2011. Analysis of Gaps and Possible
Interventions for Improving Water Productivity in Crop Livestock Systems of Ethiopia. Expl.
Agric. (2011), vol. 47, pp. 21–38.
Devendra, C., 1982. Perspectives in the utilization of untreated rice straw by ruminants in Asia,
pp. 7-26. In P.T. Doyle (ed.). The Utilization of Fibrous Agricultural Residues as Animal Feeds.
University of Melbourne, Parkville, Victoria, Australia.
FAO (Food and Agriculture Organization of the United Nations), 1987. Master Land Use Plan,
Ethiopia Range Land/Livestock Consultancy Report Prepared for the Government of the Peoples
Democratic of Ethiopia. Technical Report. AG/ETH/82/020/FAO, Rome. 94p.
FAO, 1992. CROPWAT-A Computer Program for Irrigation Planning and Management. FAO
Irrigation and Drainage Paper No. 46. Food and Agriculture Organization, Rome.
FAO, 1998. Crop evapotranspiration - guidelines for computing crop water requirements. FAO,
Rome.
83
FAO. 2003. Water Resources Development and Management Service.
http://www.fao.org/ag/agl/aglw/cropwat.stm
FAO, 2005. Local climate estimator (New LockClim 1.06). FAO, Rome.
FARDO (Fogera Woreda of Agriculture and Rural Development office), 2011. Annual report,
South Gonder, Ethiopia
Getachew Asamenew, Haile Beyene, Werkneh Nigatu and Gezahegn Ayele, 1993. A survey of
farming systems of vertisol areas of the Ethiopian Highlands. In: Tekalign Mamo, Abiye
Astatke, K.L. Srivastra and Asgelil Dibabe (eds.) Improved management of vertisols for
sustainable crop-livestock production in the Ethiopian Highlands. Synthesis 84 Report 1986-92.
Technical committee of the joint vertisol project, Addis Ababa, Ethiopia. pp. 29-49.
Getachew Eshete, 2002. An assessment of Feed Resources, Their Management and Impact on
Livestock productivity in the Ginchi Watershed Area. M. Sc. Thesis, Alemaya University of
Agriculture, Alemaya. 171p.
Getnet Assefa, 1999. Feed Resource Assessment and Evaluation of Forage Yield, Quantity and
Intake of Oats and Vetches Grown in Pure Stands and in Mixtures in the Highlands of Ethiopia.
An MSc thesis submitted to the Swedish University of Agricultural Sciences. 83p.
Gibon, A., 2005. Managing grassland for production, the environment and the landscape.
Challenges at the farm and the landscape scale. Livestock Production Science 96: 11-31.
Girma Tadesse and D. Peden, 2003. Livestock grazing impact on vegetation, soil and hydrology
in a tropical Highland watershed. pp. 87-97, conference paper h032452, International Water
Management Institute, Addis Ababa, Ethiopia.
Girma Tadesse, D. Peden, Astatke Abiye and Ayalenehe Wagnew, 2003. Effect of manure on
grazing lands in Ethiopia, east Africa Highlands, mountain research and development vol.23:.2
84
Gryseels, G., 1988. Role of Livestock on a Mixed Smallholder Farms in Debre Berhan, PhD
Dissertation, Agricultural University of Wageningen, the Netherlands. 249p.
Habtamu Abera, Solomon Abegaz and Yosphe Mekasha, 2011.Genetic parameter estimates of
pre-weaning weight of Horro (Zebu) and their crosses with Holstein Friesian and Jersey cattle
breeds in Ethiopia, International Journal of Livestock Production Vol. 2(6), pp. 84-91
Holechek, J. L., R.L. Pieper and C.H. Herbel, 1998. Range Management, Principles and
Practices. 3th edition. Printice Hall, USA. 587p.
ILCA (International Livestock Centre for Africa), 1990. Livestock System Research
Manual.Working paper 1,VOL.1.ILCA, Addis Ababa, Ethiopia.p287
ILRI (International livestock research institute), 2011. Nutritive values of the most commonly
used feeds in Ethiopia, CGIAR Systemwide Livestock Programme (http://www.vslp.org/ssafeed)
IPCC (Intergovernmental Panel on Climate Change), 1996. Guidelines for National Greenhouses
Gas Inventory: reference manual. IPCC Technical Support Unit, Hadley Center, UK.
IPMS (Improving Productivity and Marketing Success), 2005. Fogera Woreda Pilot Learning
Site Diagnosis and Program Design. Improving Productivity and marketing Success-
International Livestock Research Institute. Addis Ababa. 77p
JARDO (Jeldu Woreda of Agriculture and Rural Development office), 2011. Annual report, west
Showa, Ethiopia
Johanston P. W., G. M. McKeon and K. Day, 1996. Objective ‘safe’ grazing capacities for
South-West Queensland, Australia: Development of a model for individual properties. Journal of
Rangelands. 18:244–258.
85
Kabatange, M. A. and A. J. Kitalyi, 1989. Constraints to cereal crop residue utilization in central
Tanzania. In: A N Said and B H Dzowela (editors). Proceedings of the 4th
annual workshop on
overcoming constraints to the efficient utilization of agricultural by-products as animal feed.
Mankon station, Bamenda, Cameroon, 20-27 October 1987, Institute of Animal Research.
http://www.fao.org/wairdocs/ilri/x5490e/x5490e0h.htm
Kahsay Berhe Gebrehiwet., 2004. Land Use and Land Cover Changes in the Central Highlands
of Ethiopia: The Case of Yerer Mountain and its Surroundings. M.Sc. Thesis. Addis Ababa
University. Addis Ababa, Ethiopia. p147.
Kearl, L. C., 1982. Nutrient requirements of ruminants in developing countries. International
Feedstuffs Institute, Utah Agricultural Experiment Station, Utah State University, Longan Utah.
King, J., 1983. Livestock–water Needs in Pastoral Africa in Relation to Climate and Forage.
ILCA Research Report 7. International Livestock Centre for Africa (ILCA), Addis Ababa,
Ethiopia.
Kossila, V., 1988. The availability of crop residues in developing countries in relation to
livestock populations. pp. 29-39. In: J. D. Reed, B. S. Capper and P. J. H. Neate (eds.).
Proceedings of the Workshop on Plant Breeding and Nutritive Value of Crop Residues. Addis
Ababa, Ethiopia, 7-10 December 1987. ILCA.
Lazier, J. R. 1987. Legumes in forage research programmes for small-scale livestock production.
In: J. A. Kategile, A. N. Said, and B. H. Dzowela (eds). Animal Feed Resources for small-scale
livestock producers. Proceedings of the second PANESA workshop, held in Nairobi, Kenya 11-
15 November, 1985. IDRC manuscript Report - Canada. pp. 259-267.
Lemma Gizachew, 2002. Crude protein and mineral status of Forages grown on pelvic vertisoil
of Ginchi, central Highlands of Ethiopia .PhD dissertation presented to the University of the Free
State, Bloemfontein.
86
Lulseged Gebrehiwot, 1987. The status of pasture and forage Research in Ethiopia. pp. 101- 103.
Proceedings of a National Workshop on Livestock, Pasture and Forage Research in Ethiopia.
Addis Ababa, Ethiopia, 8-19 January 1985. Institute of Agricultural Research.
McDonal, P., R. A. Edward and J. F. D. Greenhalgh, 1988. Animal nutrition. 4th
eds. Longman
scientific.
McIntire, J. M., D. Bourzat and P. Pingali, 1989. Crop–livestock interactions in sub-Saharan
Africa. ILCA/World Bank Research Project No. 674–06 Report. ILCA. Addis Ababa, Ethiopia.
293 pp.
Mekete Bekele, 2008. Integrating Livestock Production in to Water Resources Development:
Assessment on Livelihood Resilience and Livestock Water Productivity at Alewuha and Golina
Rivers. MSc Thesis, Awassa University. Ethiopia: 144 pp
Mohammed Saleem, M. A. and Abate Tedla, 1995. Feed improvement to support intensification
of ruminant production systems in the Ethiopian Highlands. pp. 296-306. In: Proceedings of the
3rd Annual Conference of the Ethiopian Society of Animal Production. Addis Ababa, Ethiopia,
27-29 April 1995.
Mohamed Saleem, M. A., 1995. Fragile East African Highlands: A development vision for
smallholder farmers in the Ethiopian Highlands. Outlook on Agriculture Vol. 24, No. 2.
Mohamed Saleem, M. A. and Abyie Astatke, 1998. Livestock management as a strategy for
improving land-use and conservation of natural resources in the mixed crop–livestock production
systems of East African Highlands. Animal production systems and the environment. An
international conference on Odor waters quality, nutrient management and socio-economic
issues. 2:223.
Mohamed Saleem, M. A., 1998. Nutrient balance patterns in African livestock systems.
Agriculture, Ecosystems and Environment. 71:241–254.
87
Molden, D., 2007. ‘Water for Food, Water for Life. A Comprehensive Assessment of Water
Management in Agriculture.’ (Earthscan: London, and the International Water Management
Institute: Colombo.)
Molden, D., T. Oweis, P. Steduto, P. Bindrban, M. A. Hanjra and J. Kijne, 2010. Improving
agricultural water productivity: Between optimism and caution. Agricultural Water Management
97: 528–535.
Mulugeta Ayalew, 2005. Characterization of Dairy Production Systems of Yerer watershed in
Ada Liben Wereda, Oromia Region, Ethiopia. An MSc Thesis Presented to the School of
Graduate Studies of Alemaya University, Alemaya University. 140 p.
Nordblom, J. L. and F. Shomo, 1995. Food and Feed Prospects to 2020 in the West Asia North
Africa Region. ICARDA Social Science Paper No. 2, International Centre for Agricultural
Research in the Dry Areas, Aleppo, Syria.
Nour, A. M., 2003. Rice Straw and Rice Hulls in Feeding Ruminants in Egypt. Department of
Animal Production, Faculty of Agriculture, Alexandria University, Alexandria, Egypt.
Owen, E. and A. A. O. Aboud, 1998. Practical problems of feeding crop residues. Plant breeding
and the nutritive value of crop residues, (Reed JD, Capper BS, Neate PJH (Eds.) ILCA, Addis
Ababa, 133.156.
Pagan, J. D. and H. F. Hintz, 1986. Equine Energetics. I. Relationship Between Body Weight and
Energy Requirements in Horses, J ANIM SCI 1, 63:815-821.
Peden, D., A. Freeman, Abyie Astatke and A. Notenbaert, 2006. Investment options for
integrated water-livestock-crop production in sub-Saharan Africa. ILRI Research Paper No. 1.
ILRI, Nairobi.
88
Peden, D., Girma Tadesse, A. K. Misra, 2007. Water and livestock for human development. In
David Molden (Ed), Water for Food, Water for Life: A Comprehensive Assessment of Water
Management in Agriculture. London: Earths can and Colombo: International Water Management
Institute.
Peden, D., Girma Tadesse and Amare Hialeslassie, 2009. Livestock water productivity:
implications for sub-Saharan Africa. The Rangeland Journal, 31, 187–193
Reed, J.D., 1985. Evaluation of crop residues. Influence of species variety and environment on
nutritive value. ILCA, Addis Ababa, Ethiopia.
Reed, J. D. and M. R. Goe, 1989. Estimating the nutritive value of crop residues: Implications
for developing feeding standards for draught animals.ILCA Bulletin 34:2-9.ILCA (International
Livestock Centre for Africa), Addis Ababa, Ethiopia.
Ryel, R. J., A. J. Leffler, M. S. Peek, C. Y. Ivans and M. M. Caldwell, 2004. Water conservation
in Artemisia tridentata through redistribution of precipitation. Oecologia. 141: 335–345.
SAS., 2002. Statistical Analysis System software, Version 9.0, SAS Institute, Inc.Cary,NC,USA.
Said, A. N. and M. Wanyoike, 1987. The prospects of utilizing urea-treated maize stover by
smallholders in Kenya. In: D A Little and A N Said (eds), Utilization of agricultural by-products
as livestock feeds in Africa. Proceedings of a workshop held at Ryall's Hotel, Blantyre, Malawi,
September 1986. African Research Network for Agricultural Byproducts/International Livestock
Centre for Africa, Addis Ababa, Ethiopia. pp. 1526
Scarr, M. J., 1987. The optimal use of agro-industrial by-products and crop residues in Nigeria.
In: D. A. Little and A. N. Said (eds), Utilization of agricultural by-products as livestock feeds in
Africa. Proceedings of a workshop held at Ryan's Hotel, Blantyre, Malawi, September 1986.
89
Seyoum Bediye, Getinet Assefa, Abate Tedila and Dereje Fikadu, 2001. Present status and future
direction in feed resources and nutrition research targeted for wheat based crop livestock
production system in Ethiopia. In: P. C. Wall (eds.). Wheat and Weed: Food and Feed.
Proceedings of Two Stakeholder Workshops. CIMMYT, Mexico City. Improving the
productivity of Crop Livestock Production in Wheat-based Farming Systems in Ethiopia, Addis
Ababa, Ethiopia, 10-11 October 2000. pp. 207-226.
Seyoum Bediye and Feyissa Fekadu, 2007. The status of animal feeds and nutrition in the West
Showa Zone of Roomy, Ethiopia. Proceedings of the Workshop Indigenous Tree and Shrub
Species for Environmental Protection and Agricultural Productivity’, November 7-9, 2006
Colette Agricultural Research Centre (HARC), Ethiopia. Vienna: Commission for Development
Studies at the Austrian Academy of Sciences, VOEAW. Moa /National Livestock Development
Program, 1998, Ethiopia, Working Paper 4 - National Resources and the Environment
Singh, O. P, A. Sharma, R. Singh and T. Shah, 2004. Virtual water trade in dairy economy
irrigation water productivity in Gujarat. Economic and Political Weekly. pp. 3492–3497.
Smith, O. B., 1993. Feed resource for intensive smallholder systems in the tropics: The role of
crop residues. In: Proceedings of the XVII International Grassland Congress, 18-21 February
1993. Rock Hampton, Australia
Solomon Boggle, 2004. Assessment of Livestock Production Systems and Feed Resource base in
Siannas Dish Woreda of Bale Highlands, Southeast Oromia, M.Sc. Thesis, Alemaya University,
Dire Adwa, Ethiopia.
Solomon Geberselassie, D. Peden, Amare Haileslassie and D. Mpairwe, 2009. Factors affecting
livestock water productivity: animal scale analysis using previous cattle feeding trials in
Ethiopia. The Rangeland Journal. 31: 251–258.
90
Sonder, K., A. Astatke, Abiye. El Waked, D. Molden and D. Peden, 2004. Strategies for
increasing livestock water productivity in water stressed agricultural systems. http://cpwf
theme1.irri.org/documents3.htm.
Staal, S., M. Owango, G. Muriuki, B. Lukuyu, F. Musembi, O. Bwana, K. Muriuki, G.
Gichungu, A. Omore, B. Kenyanjui, D. Njubi, I. Baltenweck and W. Thorpe, 2001. ‘Dairy
Systems Characterization of the Greater Nairobi Milk-shed.’ SDP Research Report. (Kenya
Ministry of Agriculture and Rural Development, Kenya Agricultural Research Institute, and
International Livestock Research Institute: Nairobi.)
Steinfeld, H., P. Gerber, T. Wassenaar, V. Castel, M. Rosales and C. De Haan, 2006. Livestock's
Long Shadow-Environmental Issues and Options. Food and Agriculture Organization of the
United Nations (FAO), Rome. 390p.
Tefera Mengistu, Demel Teketay, H. Hultén and Yemshaw Y., 2005. The role of enclosures in
the recovery of woody vegetation in degraded hillsides of central and northern Ethiopia. Journal
of Arid Environments 60:259–281.
Tesfaye Alemu, 1999. The role of crop residues as livestock feed resources in semi-arid areas of
Adamitulu Woreda, Ethiopia. An MSc Thesis Presented to the University of Nairobi, Kenya.
90p.
Tesfaye Alemu, 2006. Studies on the utilization of crop residues and the potential of urea treated
maize stover for cattle performances in East Shewa Zone, Ethiopia. A PhD Thesis presented to
Kasetsart University.
Teshome Derso, 2009. On-farm Evaluation of Urea Treated Rice Straw and Rice Bran
Supplementation on Feed Intake, Milk Yield and Composition of Fogera Cows, North Western
Ethiopia. An MSc Thesis Presented to Haramaya University.
91
Tilahun Amede, K. Descheemaeker, D. Peden and A. Van Rooyen, 2009. Harnessing benefits
from improved livestock water productivity in crop-livestock systems of sub-Saharan Africa:
synthesis. The Rangeland Journal. 31: 169–178.
Tilaye Teklewold Deneke, M. Everisto and Tilahun Amede, 2011. Institutional Implications of
Governance of Local Common Pool Resources on Livestock water productivity in Ethiopia,
Experimental Agriculture 47: pp 99-111
Tsigeyohhannes Habte, 2000. Livestock feed security and association impact on sustainable
agricultural development. In: Preceding of the 7th
Annual Conference of the Ethiopia society of
animal Production (ESAP) Held in Addis Ababa, Ethiopia, 26-27 May 1999, pp. 51-56.
WBISPP (Woody Biomass Inventory and Strategic Planning Project). 2002. A Strategic Plan for
the Sustainable Development, Conservation, and Management of the Woody Biomass
Resources. Amhara Regional State. Final Draft. Addis Ababa, Ethiopia.
Wilson, P. N. and T. D. A. Brigstocke, 1983. Improved feeding of cattle and sheep. A practical
guide to modern concepts of ruminant nutrition. Grenada Publishing, Great Britain. 238p.
Wolde M. K., 1987. Glossary of Ethiopian plant names. Forth edition revised and enlarged. Addis Ababa,
Ethiopia
World Bank, 1989. Sub-Saharan Africa: From Crisis to Sustainable Growth. Washington DC,
USA
Yoseph Mekasha, 1999. Impact of Feed Resource on Productive and Reproductive Performance
of Dairy Cows in the Urban and Peri-urban Dairy Production System in the Addis Ababa Milk
Shed and Evaluation of Non-conventional Feed Resources Using Sheep. An M.Sc. Thesis
Presented to the School of Graduate Studies of Alemaya University. 197p.
92
Zinash Sileshi and Seyoum Bediye, 1991. Utilization of feed resources and feeding systems in
the central zone of Ethiopia.Proceedings of the Third National livestock improvement
Conference,Addis Ababa,Ethiopia.pp.129-132
Zinash Sileshi, Seyoum Bediye, Lulsegede Gebrehiwot and Tadesse Tekletsadik, 1995. Effect of
harvesting stage on yield and quality of natural pasture in the central Highlands of Ethiopia, pp.
316-322. In: ESAP Proceedings. 3rd
Annual Conference of the Ethiopian Society of Animal
Production (ESAP), Addis Ababa, Ethiopia, 27-29 April 1995. IAR.
Zerihun Woldu, 1985. Grassland vegetation on the central plateau of Shewa, Ethiopia, in relation
to edaphic factors and grazing conditions. Doctoral Thesis. Uppsala University. Dissertations
Botanicae, 84. J. Cramer. Vaduz. 110p.
Zewdie Wondatir, 2010. Livestock production systems in relation with feed availability in the
Highlands and central rift valley of Ethiopia, MSc Thesis presented to Haramaya University
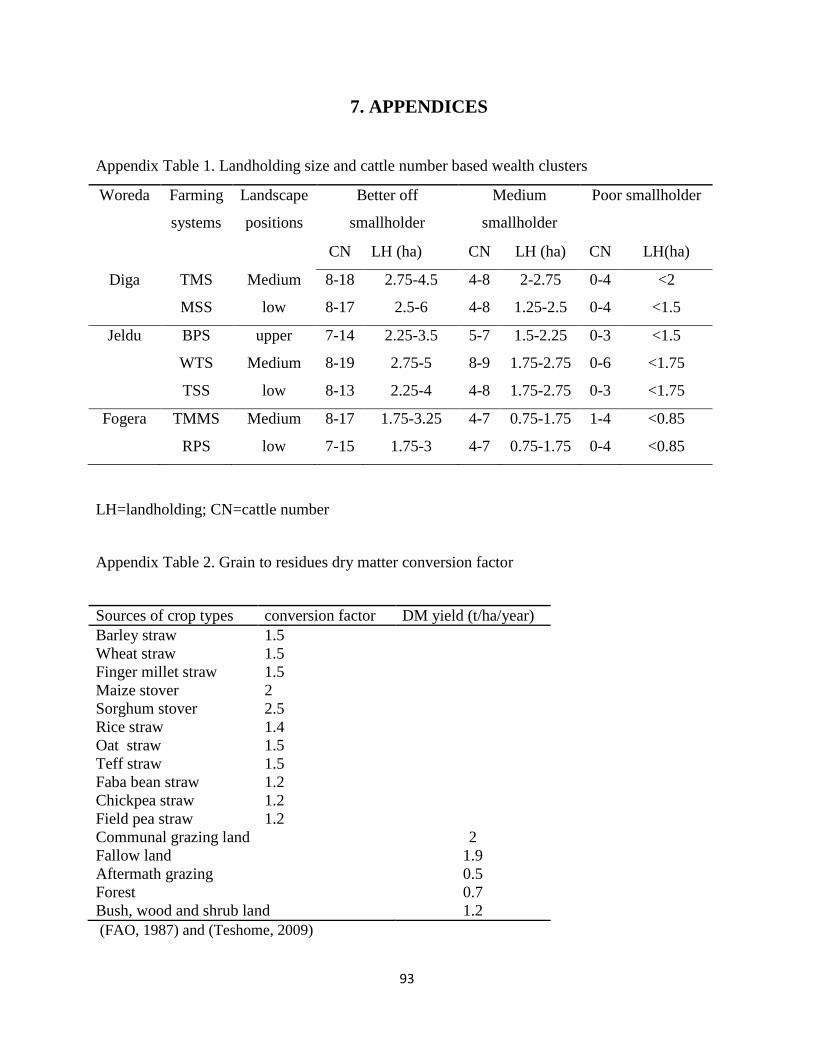
93
7. APPENDICES
Appendix Table 1. Landholding size and cattle number based wealth clusters
LH=landholding; CN=cattle number
Appendix Table 2. Grain to residues dry matter conversion factor
Sources of crop types conversion factor DM yield (t/ha/year)
Barley straw 1.5
Wheat straw 1.5
Finger millet straw 1.5
Maize stover 2
Sorghum stover 2.5
Rice straw 1.4
Oat straw 1.5
Teff straw 1.5
Faba bean straw 1.2
Chickpea straw 1.2
Field pea straw 1.2
Communal grazing land 2
Fallow land 1.9
Aftermath grazing 0.5
Forest 0.7
Bush, wood and shrub land 1.2
(FAO, 1987) and (Teshome, 2009)
Woreda Farming
systems
Landscape
positions
Better off
smallholder
Medium
smallholder
Poor smallholder
CN LH (ha) CN LH (ha) CN LH(ha)
Diga TMS Medium 8-18 2.75-4.5 4-8 2-2.75 0-4 <2
MSS low 8-17 2.5-6 4-8 1.25-2.5 0-4 <1.5
Jeldu BPS upper 7-14 2.25-3.5 5-7 1.5-2.25 0-3 <1.5
WTS Medium 8-19 2.75-5 8-9 1.75-2.75 0-6 <1.75
TSS low 8-13 2.25-4 4-8 1.75-2.75 0-3 <1.75
Fogera TMMS Medium 8-17 1.75-3.25 4-7 0.75-1.75 1-4 <0.85
RPS low 7-15 1.75-3 4-7 0.75-1.75 0-4 <0.85
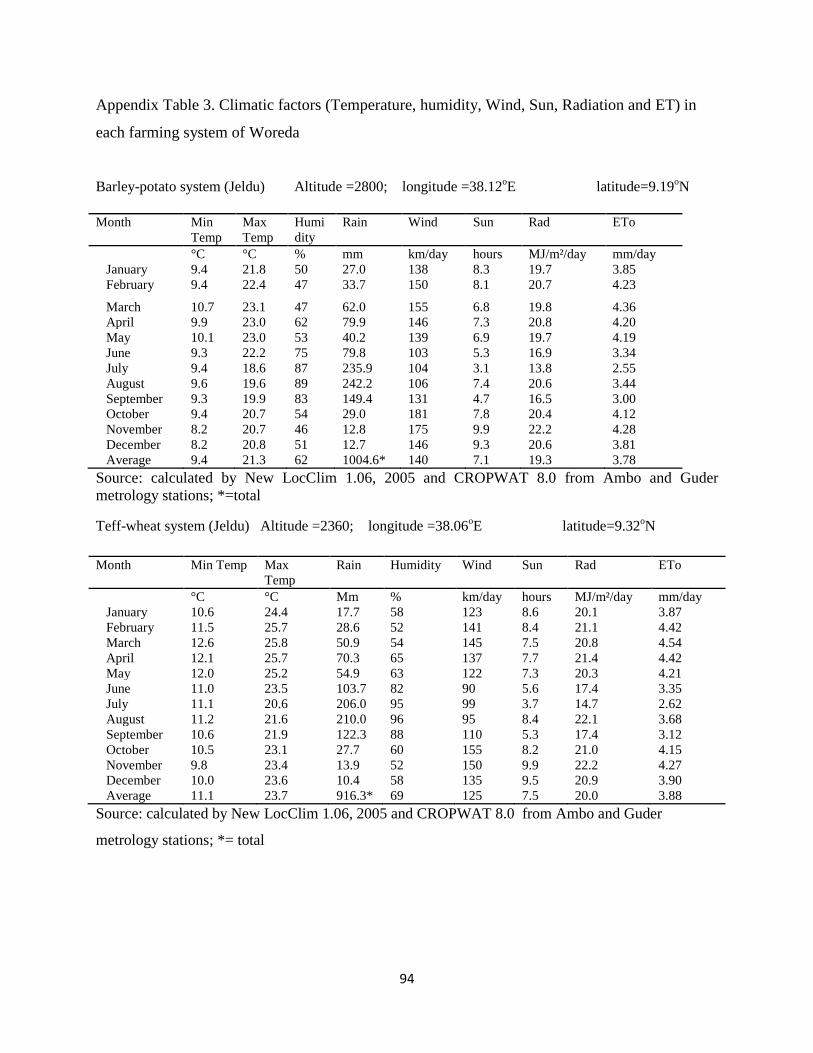
94
Appendix Table 3. Climatic factors (Temperature, humidity, Wind, Sun, Radiation and ET) in
each farming system of Woreda
Barley-potato system (Jeldu) Altitude =2800; longitude =38.12oE latitude=9.19
oN
Source: calculated by New LocClim 1.06, 2005 and CROPWAT 8.0 from Ambo and Guder
metrology stations; *=total
Teff-wheat system (Jeldu) Altitude =2360; longitude =38.06oE latitude=9.32
oN
Month Min Temp Max
Temp
Rain
Humidity Wind Sun Rad ETo
°C °C Mm % km/day hours MJ/m²/day mm/day
January 10.6 24.4 17.7 58 123 8.6 20.1 3.87
February 11.5 25.7 28.6 52 141 8.4 21.1 4.42
March 12.6 25.8 50.9 54 145 7.5 20.8 4.54
April 12.1 25.7 70.3 65 137 7.7 21.4 4.42
May 12.0 25.2 54.9 63 122 7.3 20.3 4.21
June 11.0 23.5 103.7 82 90 5.6 17.4 3.35
July 11.1 20.6 206.0 95 99 3.7 14.7 2.62
August 11.2 21.6 210.0 96 95 8.4 22.1 3.68
September 10.6 21.9 122.3 88 110 5.3 17.4 3.12
October 10.5 23.1 27.7 60 155 8.2 21.0 4.15
November 9.8 23.4 13.9 52 150 9.9 22.2 4.27
December 10.0 23.6 10.4 58 135 9.5 20.9 3.90
Average 11.1 23.7 916.3* 69 125 7.5 20.0 3.88
Source: calculated by New LocClim 1.06, 2005 and CROPWAT 8.0 from Ambo and Guder
metrology stations; *= total
Month Min
Temp
Max
Temp
Humi
dity
Rain Wind Sun Rad ETo
°C °C % mm km/day hours MJ/m²/day mm/day
January 9.4 21.8 50 27.0 138 8.3 19.7 3.85
February 9.4 22.4 47 33.7 150 8.1 20.7 4.23
March 10.7 23.1 47 62.0 155 6.8 19.8 4.36
April 9.9 23.0 62 79.9 146 7.3 20.8 4.20
May 10.1 23.0 53 40.2 139 6.9 19.7 4.19
June 9.3 22.2 75 79.8 103 5.3 16.9 3.34
July 9.4 18.6 87 235.9 104 3.1 13.8 2.55
August 9.6 19.6 89 242.2 106 7.4 20.6 3.44
September 9.3 19.9 83 149.4 131 4.7 16.5 3.00
October 9.4 20.7 54 29.0 181 7.8 20.4 4.12
November 8.2 20.7 46 12.8 175 9.9 22.2 4.28
December 8.2 20.8 51 12.7 146 9.3 20.6 3.81
Average 9.4 21.3 62 1004.6* 140 7.1 19.3 3.78
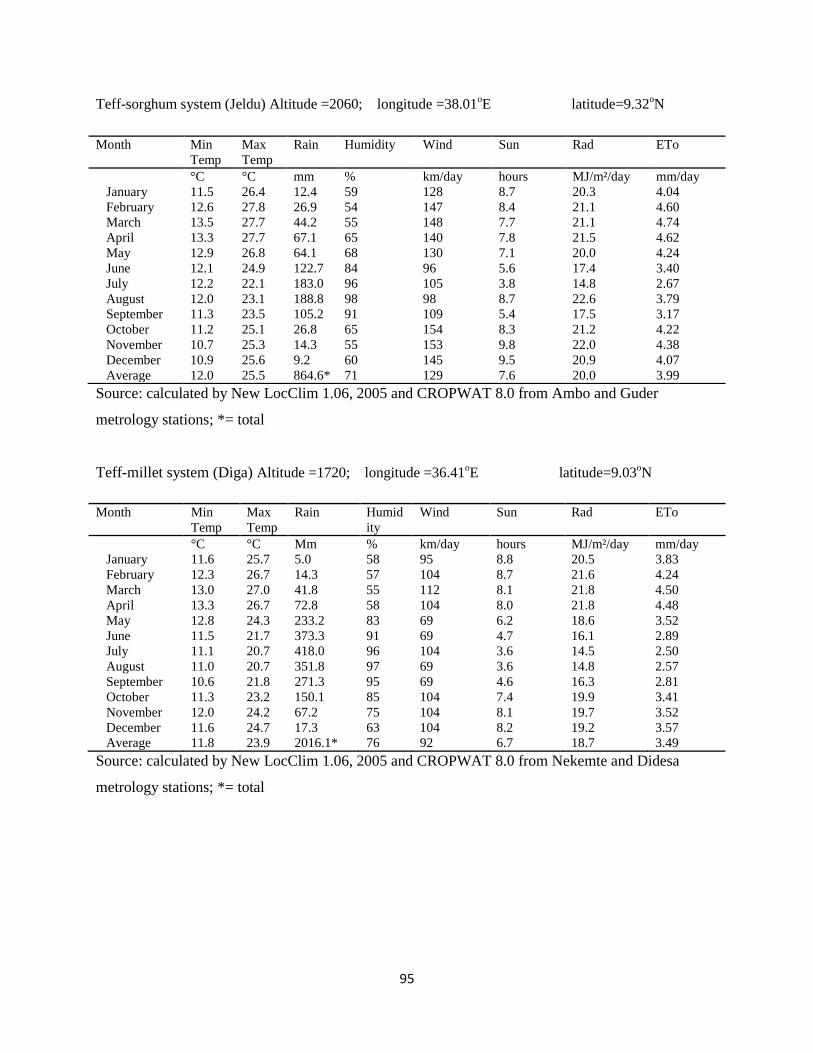
95
Teff-sorghum system (Jeldu) Altitude =2060; longitude =38.01oE latitude=9.32
oN
Source: calculated by New LocClim 1.06, 2005 and CROPWAT 8.0 from Ambo and Guder
metrology stations; *= total
Teff-millet system (Diga) Altitude =1720; longitude =36.41oE latitude=9.03
oN
Month Min
Temp
Max
Temp
Rain Humid
ity
Wind Sun Rad ETo
°C °C Mm % km/day hours MJ/m²/day mm/day
January 11.6 25.7 5.0 58 95 8.8 20.5 3.83
February 12.3 26.7 14.3 57 104 8.7 21.6 4.24
March 13.0 27.0 41.8 55 112 8.1 21.8 4.50
April 13.3 26.7 72.8 58 104 8.0 21.8 4.48
May 12.8 24.3 233.2 83 69 6.2 18.6 3.52
June 11.5 21.7 373.3 91 69 4.7 16.1 2.89
July 11.1 20.7 418.0 96 104 3.6 14.5 2.50
August 11.0 20.7 351.8 97 69 3.6 14.8 2.57
September 10.6 21.8 271.3 95 69 4.6 16.3 2.81
October 11.3 23.2 150.1 85 104 7.4 19.9 3.41
November 12.0 24.2 67.2 75 104 8.1 19.7 3.52
December 11.6 24.7 17.3 63 104 8.2 19.2 3.57
Average 11.8 23.9 2016.1* 76 92 6.7 18.7 3.49
Source: calculated by New LocClim 1.06, 2005 and CROPWAT 8.0 from Nekemte and Didesa
metrology stations; *= total
Month Min
Temp
Max
Temp
Rain Humidity Wind Sun Rad ETo
°C °C mm % km/day hours MJ/m²/day mm/day
January 11.5 26.4 12.4 59 128 8.7 20.3 4.04
February 12.6 27.8 26.9 54 147 8.4 21.1 4.60
March 13.5 27.7 44.2 55 148 7.7 21.1 4.74
April 13.3 27.7 67.1 65 140 7.8 21.5 4.62
May 12.9 26.8 64.1 68 130 7.1 20.0 4.24
June 12.1 24.9 122.7 84 96 5.6 17.4 3.40
July 12.2 22.1 183.0 96 105 3.8 14.8 2.67
August 12.0 23.1 188.8 98 98 8.7 22.6 3.79
September 11.3 23.5 105.2 91 109 5.4 17.5 3.17
October 11.2 25.1 26.8 65 154 8.3 21.2 4.22
November 10.7 25.3 14.3 55 153 9.8 22.0 4.38
December 10.9 25.6 9.2 60 145 9.5 20.9 4.07
Average 12.0 25.5 864.6* 71 129 7.6 20.0 3.99
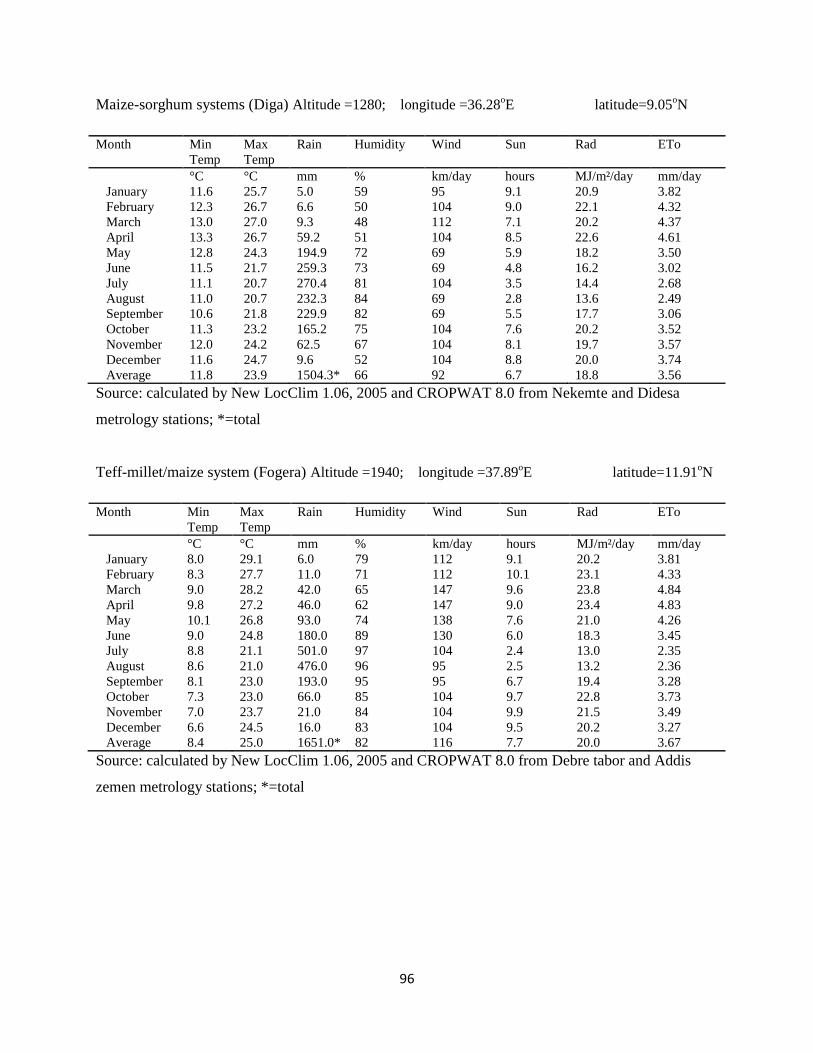
96
Maize-sorghum systems (Diga) Altitude =1280; longitude =36.28oE latitude=9.05
oN
Month Min
Temp
Max
Temp
Rain Humidity Wind Sun Rad ETo
°C °C mm % km/day hours MJ/m²/day mm/day
January 11.6 25.7 5.0 59 95 9.1 20.9 3.82
February 12.3 26.7 6.6 50 104 9.0 22.1 4.32
March 13.0 27.0 9.3 48 112 7.1 20.2 4.37
April 13.3 26.7 59.2 51 104 8.5 22.6 4.61
May 12.8 24.3 194.9 72 69 5.9 18.2 3.50
June 11.5 21.7 259.3 73 69 4.8 16.2 3.02
July 11.1 20.7 270.4 81 104 3.5 14.4 2.68
August 11.0 20.7 232.3 84 69 2.8 13.6 2.49
September 10.6 21.8 229.9 82 69 5.5 17.7 3.06
October 11.3 23.2 165.2 75 104 7.6 20.2 3.52
November 12.0 24.2 62.5 67 104 8.1 19.7 3.57
December 11.6 24.7 9.6 52 104 8.8 20.0 3.74
Average 11.8 23.9 1504.3* 66 92 6.7 18.8 3.56
Source: calculated by New LocClim 1.06, 2005 and CROPWAT 8.0 from Nekemte and Didesa
metrology stations; *=total
Teff-millet/maize system (Fogera) Altitude =1940; longitude =37.89oE latitude=11.91
oN
Month Min
Temp
Max
Temp
Rain Humidity Wind Sun Rad ETo
°C °C mm % km/day hours MJ/m²/day mm/day
January 8.0 29.1 6.0 79 112 9.1 20.2 3.81
February 8.3 27.7 11.0 71 112 10.1 23.1 4.33
March 9.0 28.2 42.0 65 147 9.6 23.8 4.84
April 9.8 27.2 46.0 62 147 9.0 23.4 4.83
May 10.1 26.8 93.0 74 138 7.6 21.0 4.26
June 9.0 24.8 180.0 89 130 6.0 18.3 3.45
July 8.8 21.1 501.0 97 104 2.4 13.0 2.35
August 8.6 21.0 476.0 96 95 2.5 13.2 2.36
September 8.1 23.0 193.0 95 95 6.7 19.4 3.28
October 7.3 23.0 66.0 85 104 9.7 22.8 3.73
November 7.0 23.7 21.0 84 104 9.9 21.5 3.49
December 6.6 24.5 16.0 83 104 9.5 20.2 3.27
Average 8.4 25.0 1651.0* 82 116 7.7 20.0 3.67
Source: calculated by New LocClim 1.06, 2005 and CROPWAT 8.0 from Debre tabor and Addis
zemen metrology stations; *=total
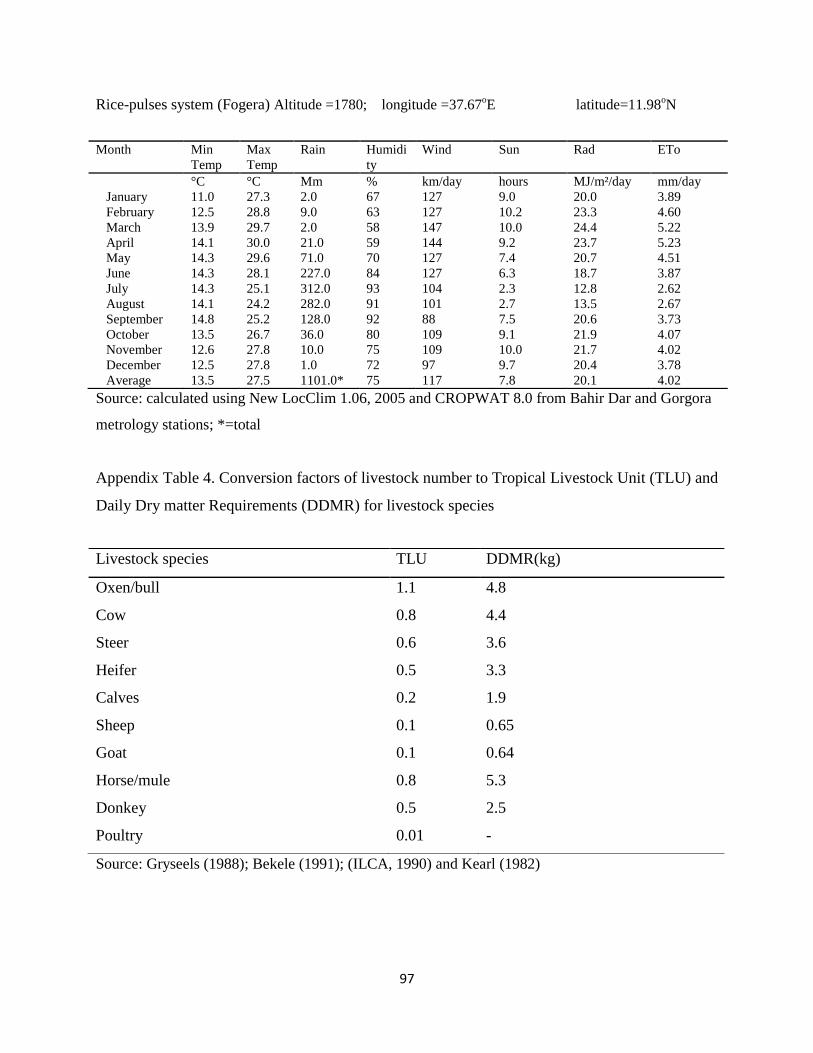
97
Rice-pulses system (Fogera) Altitude =1780; longitude =37.67oE latitude=11.98
oN
Source: calculated using New LocClim 1.06, 2005 and CROPWAT 8.0 from Bahir Dar and Gorgora
metrology stations; *=total
Appendix Table 4. Conversion factors of livestock number to Tropical Livestock Unit (TLU) and
Daily Dry matter Requirements (DDMR) for livestock species
Source: Gryseels (1988); Bekele (1991); (ILCA, 1990) and Kearl (1982)
Month Min
Temp
Max
Temp
Rain Humidi
ty
Wind Sun Rad ETo
°C °C Mm % km/day hours MJ/m²/day mm/day
January 11.0 27.3 2.0 67 127 9.0 20.0 3.89
February 12.5 28.8 9.0 63 127 10.2 23.3 4.60
March 13.9 29.7 2.0 58 147 10.0 24.4 5.22
April 14.1 30.0 21.0 59 144 9.2 23.7 5.23
May 14.3 29.6 71.0 70 127 7.4 20.7 4.51
June 14.3 28.1 227.0 84 127 6.3 18.7 3.87
July 14.3 25.1 312.0 93 104 2.3 12.8 2.62
August 14.1 24.2 282.0 91 101 2.7 13.5 2.67
September 14.8 25.2 128.0 92 88 7.5 20.6 3.73
October 13.5 26.7 36.0 80 109 9.1 21.9 4.07
November 12.6 27.8 10.0 75 109 10.0 21.7 4.02
December 12.5 27.8 1.0 72 97 9.7 20.4 3.78
Average 13.5 27.5 1101.0* 75 117 7.8 20.1 4.02
Livestock species TLU DDMR(kg)
Oxen/bull 1.1 4.8
Cow 0.8 4.4
Steer 0.6 3.6
Heifer 0.5 3.3
Calves 0.2 1.9
Sheep 0.1 0.65
Goat 0.1 0.64
Horse/mule 0.8 5.3
Donkey 0.5 2.5
Poultry 0.01 -
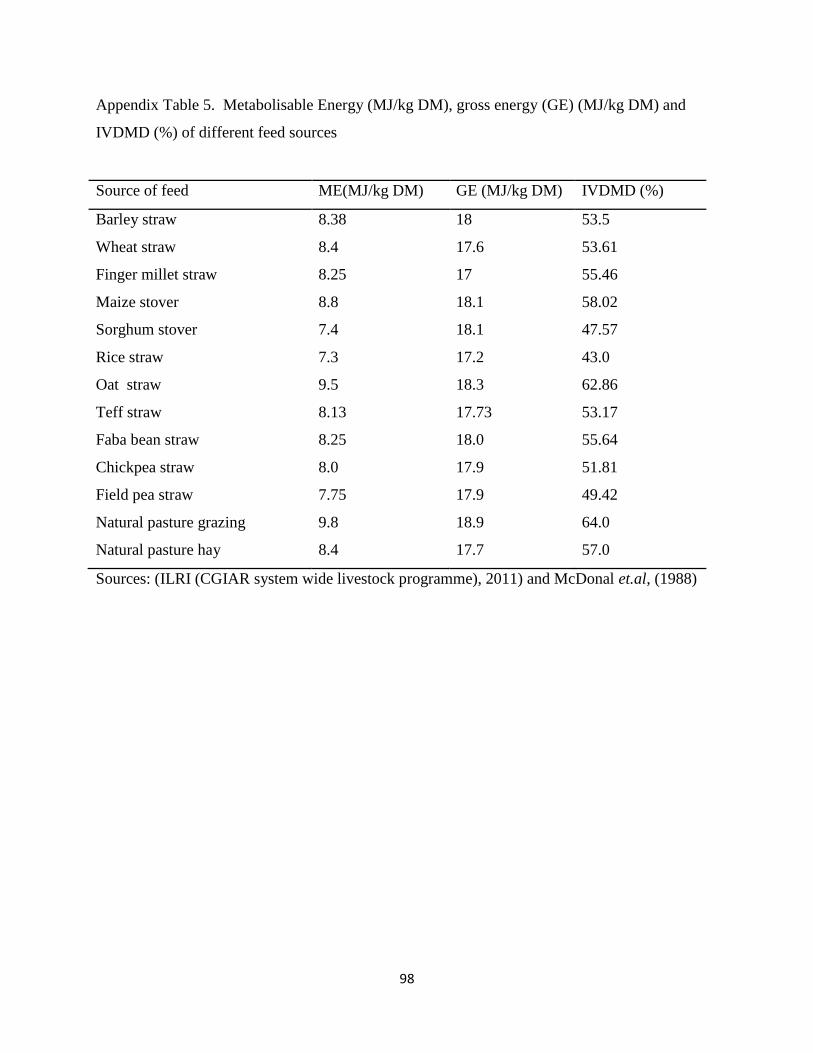
98
Appendix Table 5. Metabolisable Energy (MJ/kg DM), gross energy (GE) (MJ/kg DM) and
IVDMD (%) of different feed sources
Source of feed ME(MJ/kg DM) GE (MJ/kg DM) IVDMD (%)
Barley straw 8.38 18 53.5
Wheat straw 8.4 17.6 53.61
Finger millet straw 8.25 17 55.46
Maize stover 8.8 18.1 58.02
Sorghum stover 7.4 18.1 47.57
Rice straw 7.3 17.2 43.0
Oat straw 9.5 18.3 62.86
Teff straw 8.13 17.73 53.17
Faba bean straw 8.25 18.0 55.64
Chickpea straw 8.0 17.9 51.81
Field pea straw 7.75 17.9 49.42
Natural pasture grazing 9.8 18.9 64.0
Natural pasture hay 8.4 17.7 57.0
Sources: (ILRI (CGIAR system wide livestock programme), 2011) and McDonal et.al, (1988)
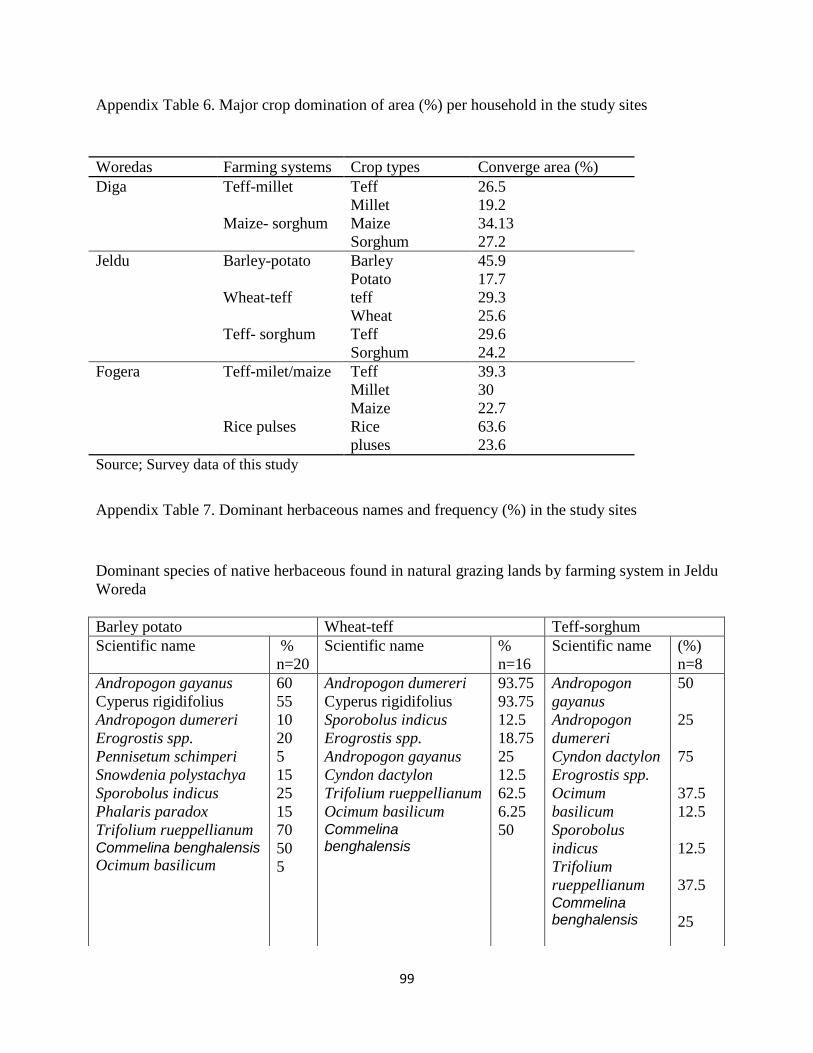
99
Appendix Table 6. Major crop domination of area (%) per household in the study sites
Woredas Farming systems Crop types Converge area (%)
Diga Teff-millet Teff
Millet
26.5
19.2
Maize- sorghum Maize
Sorghum
34.13
27.2
Jeldu Barley-potato Barley
Potato
45.9
17.7
Wheat-teff teff
Wheat
29.3
25.6
Teff- sorghum Teff
Sorghum
29.6
24.2
Fogera Teff-milet/maize Teff
Millet
Maize
39.3
30
22.7
Rice pulses Rice
pluses
63.6
23.6
Source; Survey data of this study
Appendix Table 7. Dominant herbaceous names and frequency (%) in the study sites
Dominant species of native herbaceous found in natural grazing lands by farming system in Jeldu
Woreda
Barley potato Wheat-teff Teff-sorghum
Scientific name %
n=20
Scientific name
%
n=16
Scientific name (%)
n=8
Andropogon gayanus
Cyperus rigidifolius
Andropogon dumereri
Erogrostis spp.
Pennisetum schimperi
Snowdenia polystachya
Sporobolus indicus
Phalaris paradox
Trifolium rueppellianum Commelina benghalensis
Ocimum basilicum
60
55
10
20
5
15
25
15
70
50
5
Andropogon dumereri
Cyperus rigidifolius
Sporobolus indicus
Erogrostis spp.
Andropogon gayanus
Cyndon dactylon
Trifolium rueppellianum
Ocimum basilicum Commelina benghalensis
93.75
93.75
12.5
18.75
25
12.5
62.5
6.25
50
Andropogon
gayanus
Andropogon
dumereri
Cyndon dactylon
Erogrostis spp.
Ocimum
basilicum
Sporobolus
indicus
Trifolium
rueppellianum Commelina benghalensis
50
25
75
37.5
12.5
12.5
37.5
25
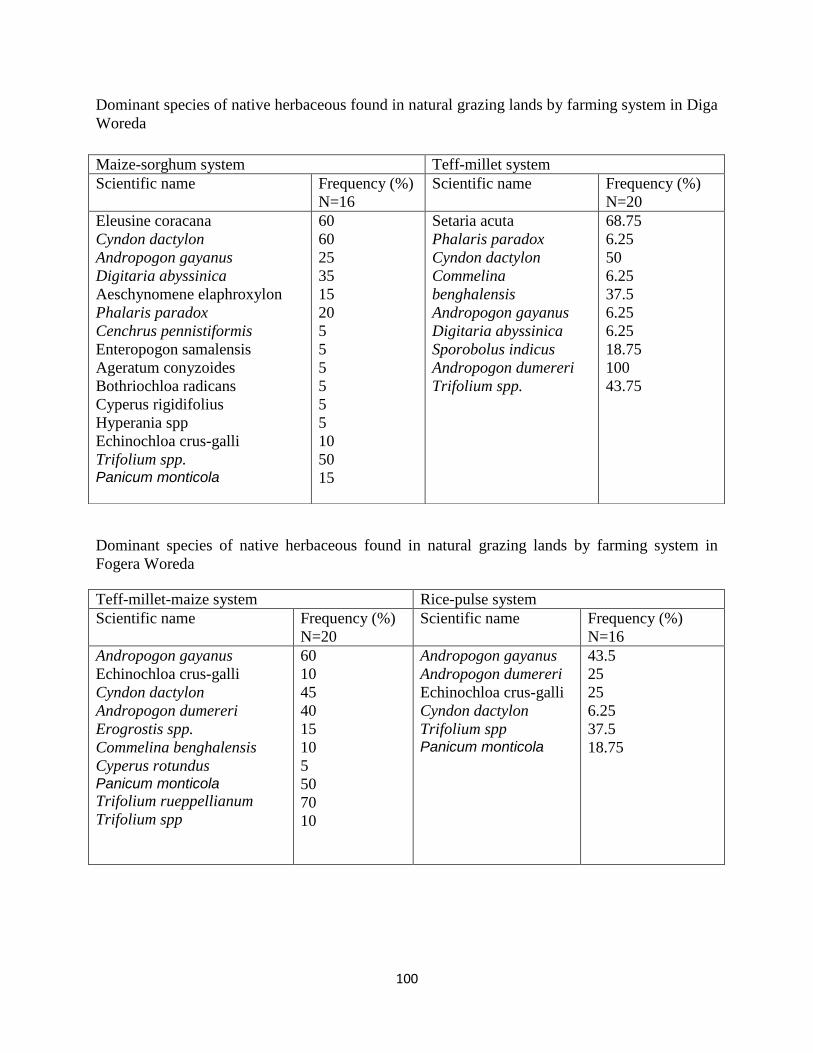
100
Dominant species of native herbaceous found in natural grazing lands by farming system in Diga
Woreda
Dominant species of native herbaceous found in natural grazing lands by farming system in
Fogera Woreda
Maize-sorghum system Teff-millet system
Scientific name Frequency (%)
N=16
Scientific name Frequency (%)
N=20
Eleusine coracana
Cyndon dactylon
Andropogon gayanus
Digitaria abyssinica
Aeschynomene elaphroxylon
Phalaris paradox
Cenchrus pennistiformis
Enteropogon samalensis
Ageratum conyzoides
Bothriochloa radicans
Cyperus rigidifolius
Hyperania spp
Echinochloa crus-galli
Trifolium spp. Panicum monticola
60
60
25
35
15
20
5
5
5
5
5
5
10
50
15
Setaria acuta
Phalaris paradox
Cyndon dactylon
Commelina
benghalensis
Andropogon gayanus
Digitaria abyssinica
Sporobolus indicus
Andropogon dumereri
Trifolium spp.
68.75
6.25
50
6.25
37.5
6.25
6.25
18.75
100
43.75
Teff-millet-maize system Rice-pulse system
Scientific name Frequency (%)
N=20
Scientific name Frequency (%)
N=16
Andropogon gayanus
Echinochloa crus-galli
Cyndon dactylon
Andropogon dumereri
Erogrostis spp.
Commelina benghalensis
Cyperus rotundus Panicum monticola
Trifolium rueppellianum
Trifolium spp
60
10
45
40
15
10
5
50
70
10
Andropogon gayanus
Andropogon dumereri
Echinochloa crus-galli
Cyndon dactylon
Trifolium spp Panicum monticola
43.5
25
25
6.25
37.5
18.75
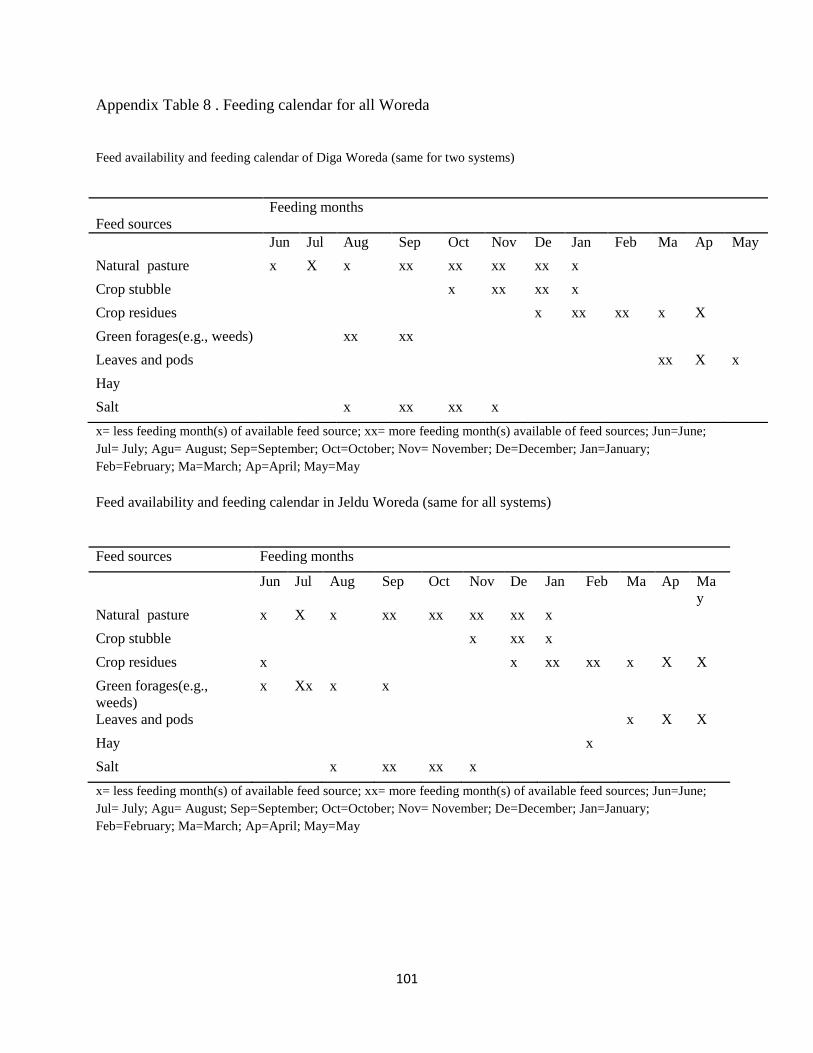
101
Appendix Table 8 . Feeding calendar for all Woreda
Feed availability and feeding calendar of Diga Woreda (same for two systems)
x= less feeding month(s) of available feed source; xx= more feeding month(s) available of feed sources; Jun=June;
Jul= July; Agu= August; Sep=September; Oct=October; Nov= November; De=December; Jan=January;
Feb=February; Ma=March; Ap=April; May=May
Feed availability and feeding calendar in Jeldu Woreda (same for all systems)
x= less feeding month(s) of available feed source; xx= more feeding month(s) of available feed sources; Jun=June;
Jul= July; Agu= August; Sep=September; Oct=October; Nov= November; De=December; Jan=January;
Feb=February; Ma=March; Ap=April; May=May
Feed sources
Feeding months
Jun Jul Aug Sep Oct Nov De Jan Feb Ma Ap May
Natural pasture x X x xx xx xx xx x
Crop stubble x xx xx x
Crop residues x xx xx x X
Green forages(e.g., weeds) xx xx
Leaves and pods xx X x
Hay
Salt x xx xx x
Feed sources Feeding months
Jun Jul Aug Sep Oct Nov De Jan Feb Ma Ap Ma
y
Natural pasture x X x xx xx xx xx x
Crop stubble x xx x
Crop residues x x xx xx x X X
Green forages(e.g.,
weeds)
x Xx x x
Leaves and pods x X X
Hay x
Salt x xx xx x
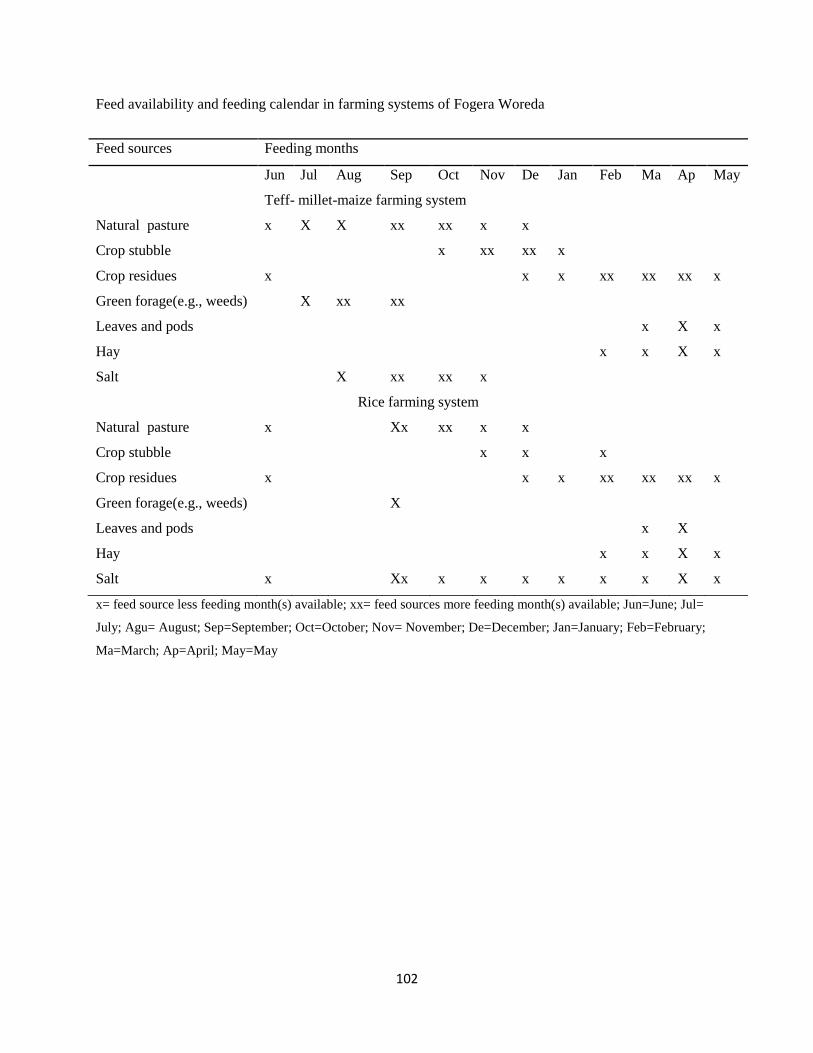
102
Feed availability and feeding calendar in farming systems of Fogera Woreda
x= feed source less feeding month(s) available; xx= feed sources more feeding month(s) available; Jun=June; Jul=
July; Agu= August; Sep=September; Oct=October; Nov= November; De=December; Jan=January; Feb=February;
Ma=March; Ap=April; May=May
Feed sources Feeding months
Jun Jul Aug Sep Oct Nov De Jan Feb Ma Ap May
Teff- millet-maize farming system
Natural pasture x X X xx xx x x
Crop stubble x xx xx x
Crop residues x x x xx xx xx x
Green forage(e.g., weeds) X xx xx
Leaves and pods x X x
Hay x x X x
Salt X xx xx x
Rice farming system
Natural pasture x Xx xx x x
Crop stubble x x x
Crop residues x x x xx xx xx x
Green forage(e.g., weeds) X
Leaves and pods x X
Hay x x X x
Salt x Xx x x x x x x X x
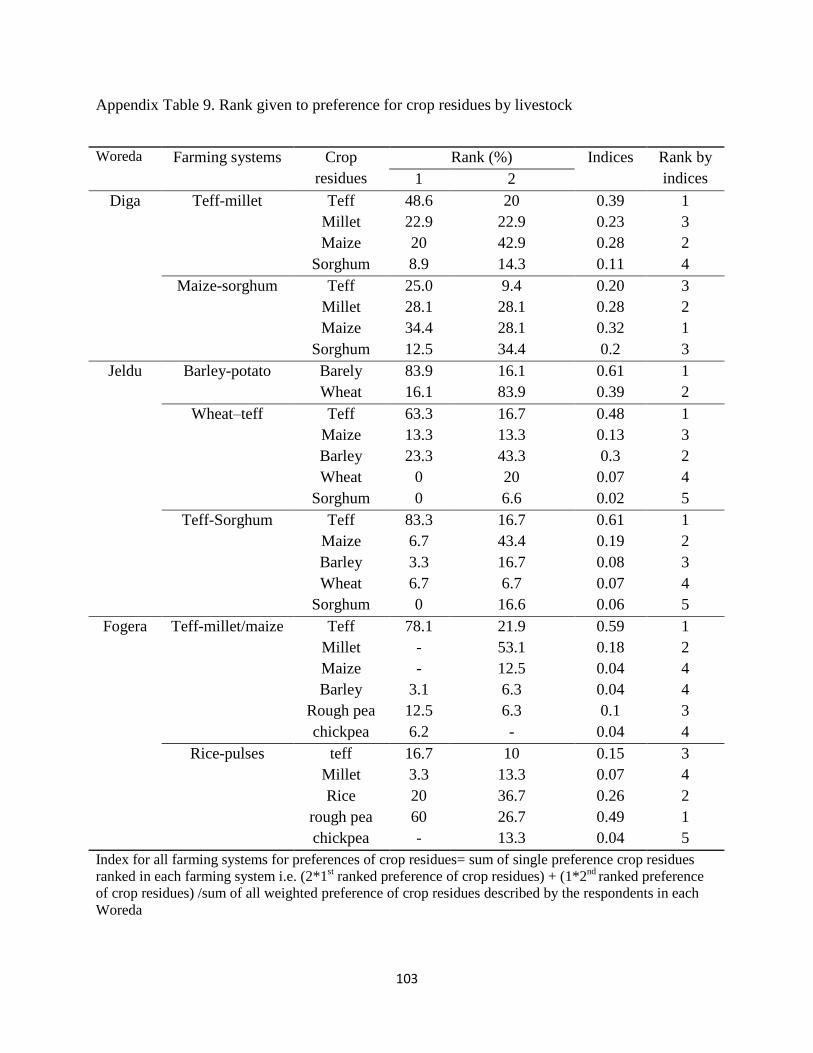
103
Appendix Table 9. Rank given to preference for crop residues by livestock
Index for all farming systems for preferences of crop residues= sum of single preference crop residues
ranked in each farming system i.e. (2*1st ranked preference of crop residues) + (1*2
nd ranked preference
of crop residues) /sum of all weighted preference of crop residues described by the respondents in each
Woreda
Woreda Farming systems Crop
residues
Rank (%) Indices Rank by
indices 1 2
Diga Teff-millet Teff 48.6 20 0.39 1
Millet 22.9 22.9 0.23 3
Maize 20 42.9 0.28 2
Sorghum 8.9 14.3 0.11 4
Maize-sorghum Teff 25.0 9.4 0.20 3
Millet 28.1 28.1 0.28 2
Maize 34.4 28.1 0.32 1
Sorghum 12.5 34.4 0.2 3
Jeldu Barley-potato Barely 83.9 16.1 0.61 1
Wheat 16.1 83.9 0.39 2
Wheat–teff Teff 63.3 16.7 0.48 1
Maize 13.3 13.3 0.13 3
Barley 23.3 43.3 0.3 2
Wheat 0 20 0.07 4
Sorghum 0 6.6 0.02 5
Teff-Sorghum Teff 83.3 16.7 0.61 1
Maize 6.7 43.4 0.19 2
Barley 3.3 16.7 0.08 3
Wheat 6.7 6.7 0.07 4
Sorghum 0 16.6 0.06 5
Fogera Teff-millet/maize Teff 78.1 21.9 0.59 1
Millet - 53.1 0.18 2
Maize - 12.5 0.04 4
Barley 3.1 6.3 0.04 4
Rough pea 12.5 6.3 0.1 3
chickpea 6.2 - 0.04 4
Rice-pulses teff 16.7 10 0.15 3
Millet 3.3 13.3 0.07 4
Rice 20 36.7 0.26 2
rough pea 60 26.7 0.49 1
chickpea - 13.3 0.04 5
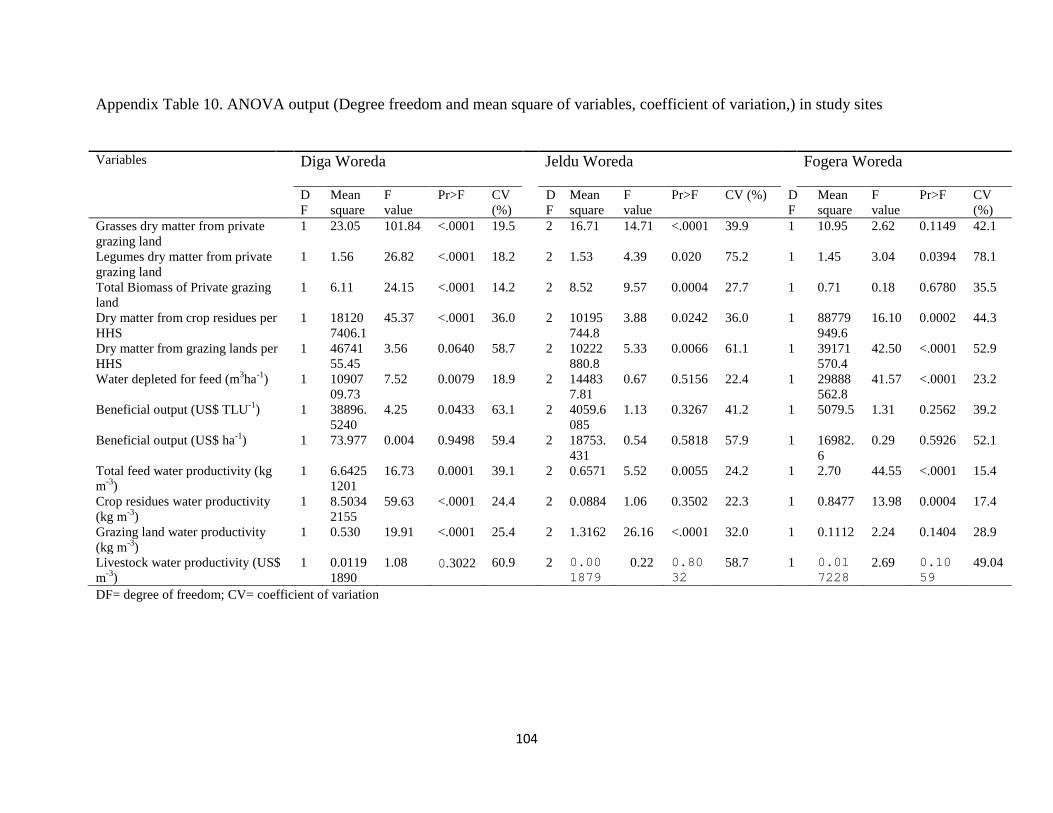
104
Appendix Table 10. ANOVA output (Degree freedom and mean square of variables, coefficient of variation,) in study sites
DF= degree of freedom; CV= coefficient of variation
Variables Diga Woreda Jeldu Woreda Fogera Woreda
D
F
Mean
square
F
value
Pr>F CV
(%)
D
F
Mean
square
F
value
Pr>F CV (%) D
F
Mean
square
F
value
Pr>F CV
(%)
Grasses dry matter from private
grazing land
1 23.05 101.84 <.0001 19.5 2 16.71 14.71 <.0001 39.9 1 10.95 2.62 0.1149 42.1
Legumes dry matter from private
grazing land
1 1.56 26.82 <.0001 18.2 2 1.53 4.39 0.020 75.2 1 1.45 3.04 0.0394 78.1
Total Biomass of Private grazing
land
1 6.11 24.15 <.0001 14.2 2 8.52 9.57 0.0004 27.7 1 0.71 0.18 0.6780 35.5
Dry matter from crop residues per
HHS
1 18120
7406.1
45.37
<.0001 36.0 2 10195
744.8
3.88 0.0242 36.0 1 88779
949.6
16.10 0.0002 44.3
Dry matter from grazing lands per
HHS
1 46741
55.45
3.56
0.0640 58.7 2 10222
880.8
5.33 0.0066 61.1 1 39171
570.4
42.50 <.0001 52.9
Water depleted for feed (m3ha
-1) 1 10907
09.73
7.52 0.0079 18.9 2 14483
7.81
0.67 0.5156 22.4 1 29888
562.8
41.57 <.0001 23.2
Beneficial output (US$ TLU-1
) 1 38896.
5240
4.25 0.0433 63.1 2 4059.6
085
1.13 0.3267 41.2 1 5079.5 1.31 0.2562 39.2
Beneficial output (US$ ha-1
) 1 73.977 0.004 0.9498 59.4 2 18753.
431
0.54 0.5818 57.9 1 16982.
6
0.29 0.5926 52.1
Total feed water productivity (kg
m-3
)
1 6.6425
1201
16.73 0.0001 39.1 2 0.6571 5.52 0.0055 24.2 1 2.70 44.55 <.0001 15.4
Crop residues water productivity
(kg m-3
)
1 8.5034
2155
59.63 <.0001 24.4 2 0.0884 1.06 0.3502 22.3 1 0.8477 13.98 0.0004 17.4
Grazing land water productivity
(kg m-3
)
1 0.530 19.91 <.0001 25.4 2 1.3162 26.16 <.0001 32.0 1 0.1112 2.24 0.1404 28.9
Livestock water productivity (US$
m-3
)
1 0.0119
1890
1.08 0.3022 60.9 2 0.00
1879 0.22 0.80
32 58.7 1 0.01
7228 2.69 0.10
59 49.04
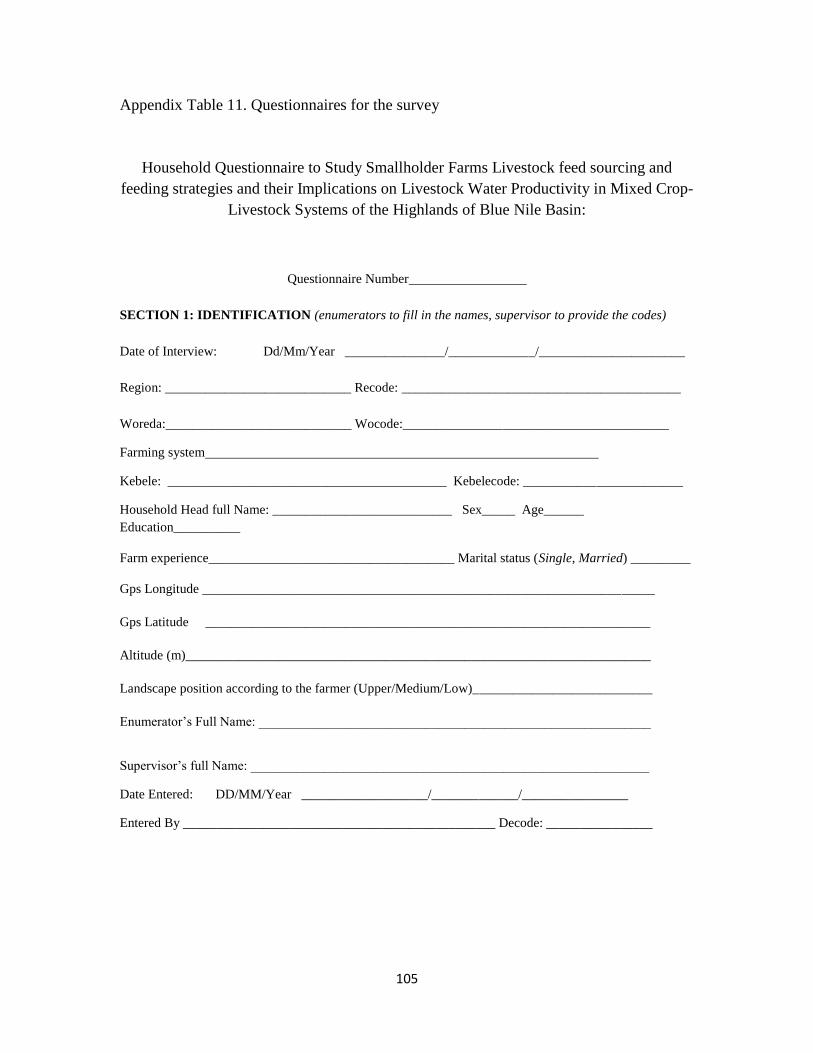
105
Appendix Table 11. Questionnaires for the survey
Household Questionnaire to Study Smallholder Farms Livestock feed sourcing and
feeding strategies and their Implications on Livestock Water Productivity in Mixed Crop-
Livestock Systems of the Highlands of Blue Nile Basin:
Questionnaire Number
SECTION 1: IDENTIFICATION (enumerators to fill in the names, supervisor to provide the codes)
Date of Interview: Dd/Mm/Year _______________/_____________/______________________
Region: ____________________________ Recode: __________________________________________
Woreda:____________________________ Wocode:________________________________________
Farming system
Kebele: __________________________________________ Kebelecode: ________________________
Household Head full Name: ___________________________ Sex_____ Age______
Education__________
Farm experience_____________________________________ Marital status (Single, Married) _________
Gps Longitude ____________________________________________________________________
Gps Latitude ___________________________________________________________________
Altitude (m)______________________________________________________________________
Landscape position according to the farmer (Upper/Medium/Low)___________________________
Enumerator’s Full Name: ___________________________________________________________
Supervisor’s full Name: ____________________________________________________________
Date Entered: DD/MM/Year ___________________/_____________/________________
Entered By _______________________________________________ Decode: ________________
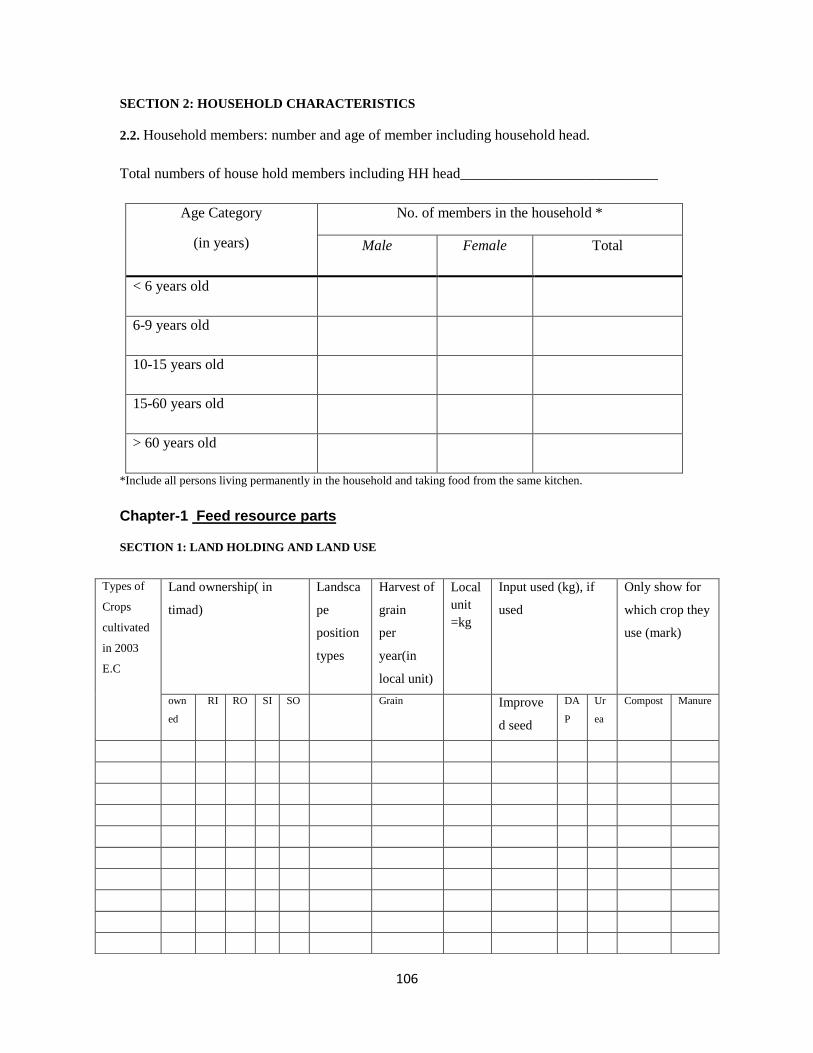
106
SECTION 2: HOUSEHOLD CHARACTERISTICS
2.2. Household members: number and age of member including household head.
Total numbers of house hold members including HH head___________________________
Age Category
(in years)
No. of members in the household *
Male Female Total
< 6 years old
6-9 years old
10-15 years old
15-60 years old
> 60 years old
*Include all persons living permanently in the household and taking food from the same kitchen.
Chapter-1 Feed resource parts
SECTION 1: LAND HOLDING AND LAND USE
Types of
Crops
cultivated
in 2003
E.C
Land ownership( in
timad)
Landsca
pe
position
types
Harvest of
grain
per
year(in
local unit)
Local
unit
=kg
Input used (kg), if
used
Only show for
which crop they
use (mark)
own
ed
RI RO SI SO Grain Improve
d seed
DA
P
Ur
ea
Compost Manure
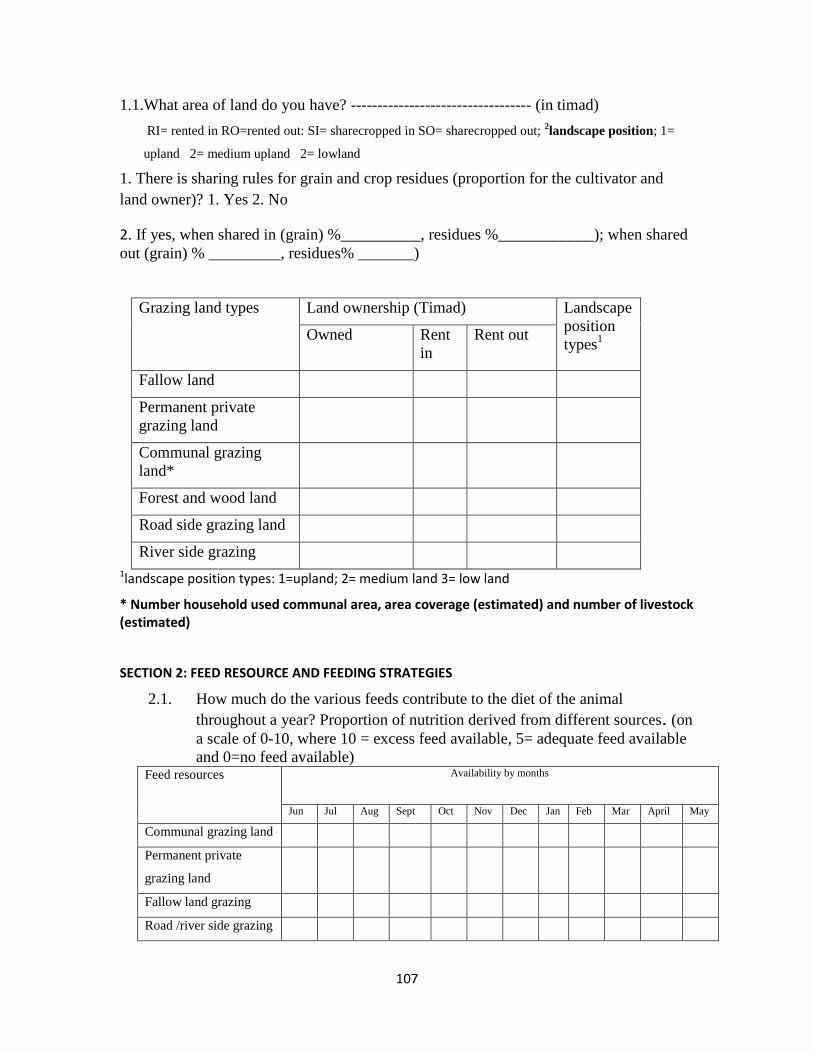
107
1.1.What area of land do you have? ---------------------------------- (in timad)
RI= rented in RO=rented out: SI= sharecropped in SO= sharecropped out; 2landscape position; 1=
upland 2= medium upland 2= lowland
1. There is sharing rules for grain and crop residues (proportion for the cultivator and
land owner)? 1. Yes 2. No
2. If yes, when shared in (grain) %__________, residues %____________); when shared
out (grain) % _________, residues% _______)
Grazing land types Land ownership (Timad) Landscape
position
types1
Owned Rent
in
Rent out
Fallow land
Permanent private
grazing land
Communal grazing
land*
Forest and wood land
Road side grazing land
River side grazing
1landscape position types: 1=upland; 2= medium land 3= low land
* Number household used communal area, area coverage (estimated) and number of livestock (estimated)
SECTION 2: FEED RESOURCE AND FEEDING STRATEGIES
2.1. How much do the various feeds contribute to the diet of the animal
throughout a year? Proportion of nutrition derived from different sources. (on
a scale of 0-10, where 10 = excess feed available, 5= adequate feed available
and 0=no feed available) Feed resources Availability by months
Jun Jul Aug Sept Oct Nov Dec Jan Feb Mar April May
Communal grazing land
Permanent private
grazing land
Fallow land grazing
Road /river side grazing
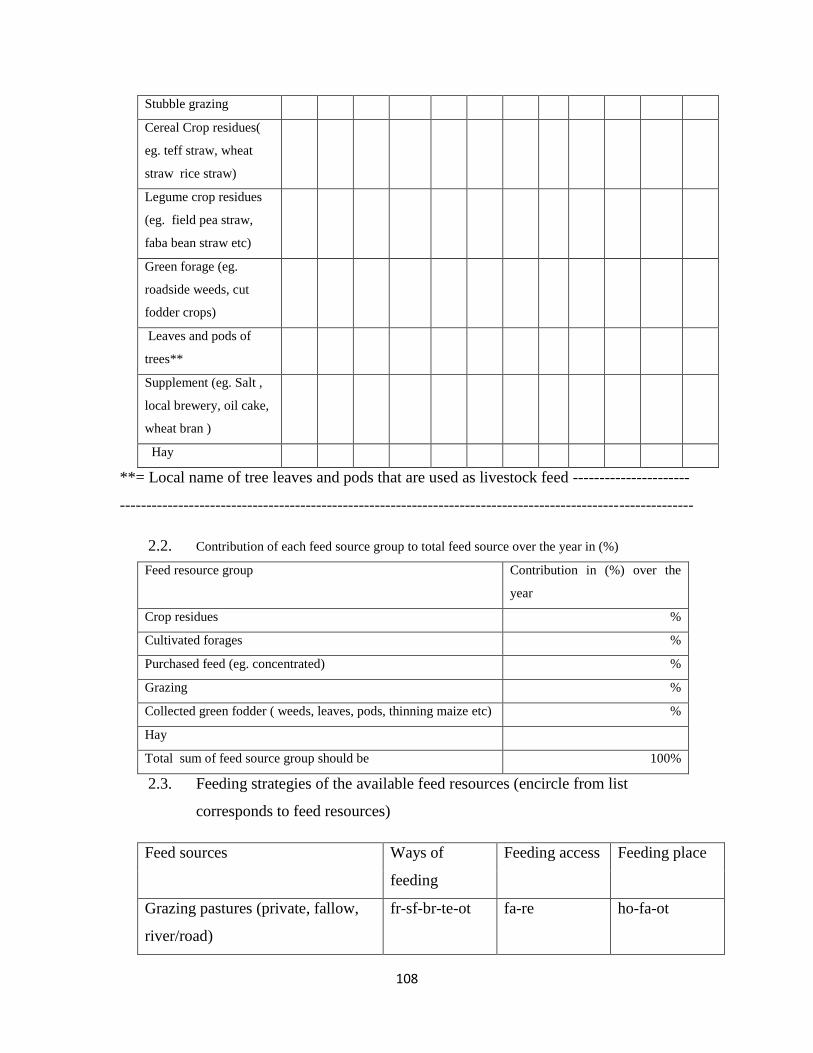
108
Stubble grazing
Cereal Crop residues(
eg. teff straw, wheat
straw rice straw)
Legume crop residues
(eg. field pea straw,
faba bean straw etc)
Green forage (eg.
roadside weeds, cut
fodder crops)
Leaves and pods of
trees**
Supplement (eg. Salt ,
local brewery, oil cake,
wheat bran )
Hay
**= Local name of tree leaves and pods that are used as livestock feed ----------------------
------------------------------------------------------------------------------------------------------------
2.2. Contribution of each feed source group to total feed source over the year in (%)
Feed resource group Contribution in (%) over the
year
Crop residues %
Cultivated forages %
Purchased feed (eg. concentrated) %
Grazing %
Collected green fodder ( weeds, leaves, pods, thinning maize etc) %
Hay
Total sum of feed source group should be 100%
2.3. Feeding strategies of the available feed resources (encircle from list
corresponds to feed resources)
Feed sources
Ways of
feeding
Feeding access Feeding place
Grazing pastures (private, fallow,
river/road)
fr-sf-br-te-ot fa-re ho-fa-ot
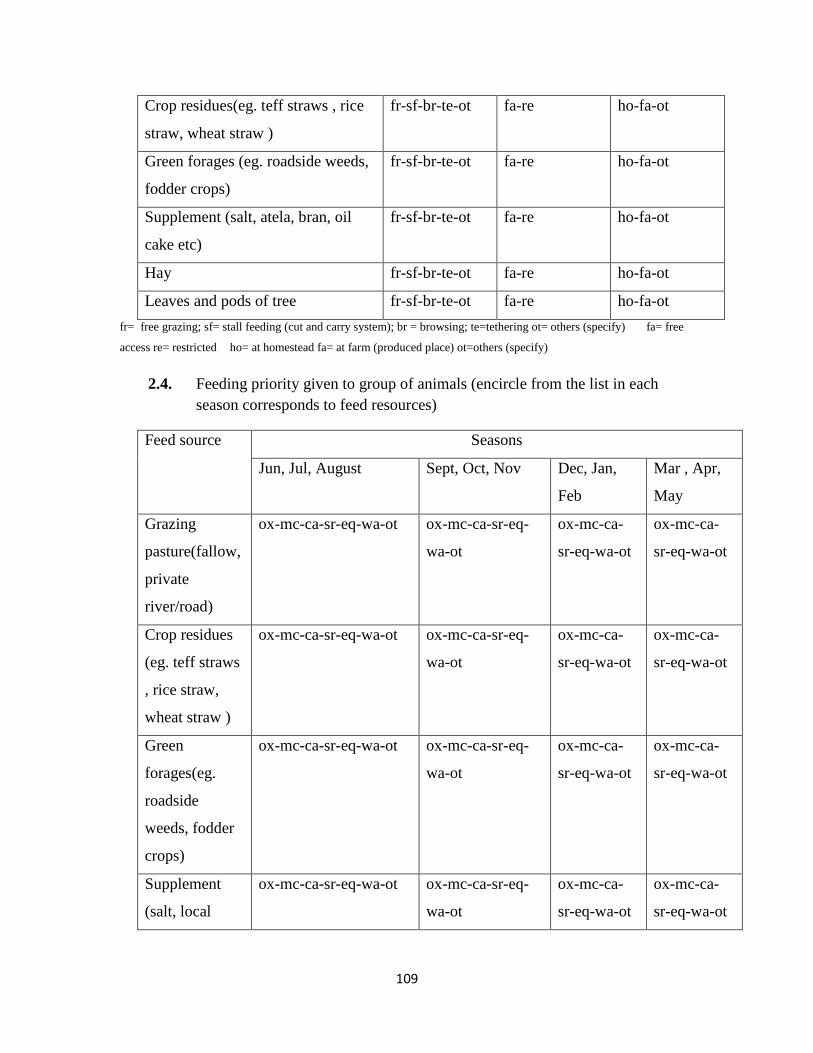
109
Crop residues(eg. teff straws , rice
straw, wheat straw )
fr-sf-br-te-ot fa-re ho-fa-ot
Green forages (eg. roadside weeds,
fodder crops)
fr-sf-br-te-ot fa-re ho-fa-ot
Supplement (salt, atela, bran, oil
cake etc)
fr-sf-br-te-ot fa-re ho-fa-ot
Hay fr-sf-br-te-ot fa-re ho-fa-ot
Leaves and pods of tree fr-sf-br-te-ot fa-re ho-fa-ot
fr= free grazing; sf= stall feeding (cut and carry system); br = browsing; te=tethering ot= others (specify) fa= free
access re= restricted ho= at homestead fa= at farm (produced place) ot=others (specify)
2.4. Feeding priority given to group of animals (encircle from the list in each
season corresponds to feed resources)
Feed source Seasons
Jun, Jul, August Sept, Oct, Nov Dec, Jan,
Feb
Mar , Apr,
May
Grazing
pasture(fallow,
private
river/road)
ox-mc-ca-sr-eq-wa-ot ox-mc-ca-sr-eq-
wa-ot
ox-mc-ca-
sr-eq-wa-ot
ox-mc-ca-
sr-eq-wa-ot
Crop residues
(eg. teff straws
, rice straw,
wheat straw )
ox-mc-ca-sr-eq-wa-ot ox-mc-ca-sr-eq-
wa-ot
ox-mc-ca-
sr-eq-wa-ot
ox-mc-ca-
sr-eq-wa-ot
Green
forages(eg.
roadside
weeds, fodder
crops)
ox-mc-ca-sr-eq-wa-ot ox-mc-ca-sr-eq-
wa-ot
ox-mc-ca-
sr-eq-wa-ot
ox-mc-ca-
sr-eq-wa-ot
Supplement
(salt, local
ox-mc-ca-sr-eq-wa-ot ox-mc-ca-sr-eq-
wa-ot
ox-mc-ca-
sr-eq-wa-ot
ox-mc-ca-
sr-eq-wa-ot
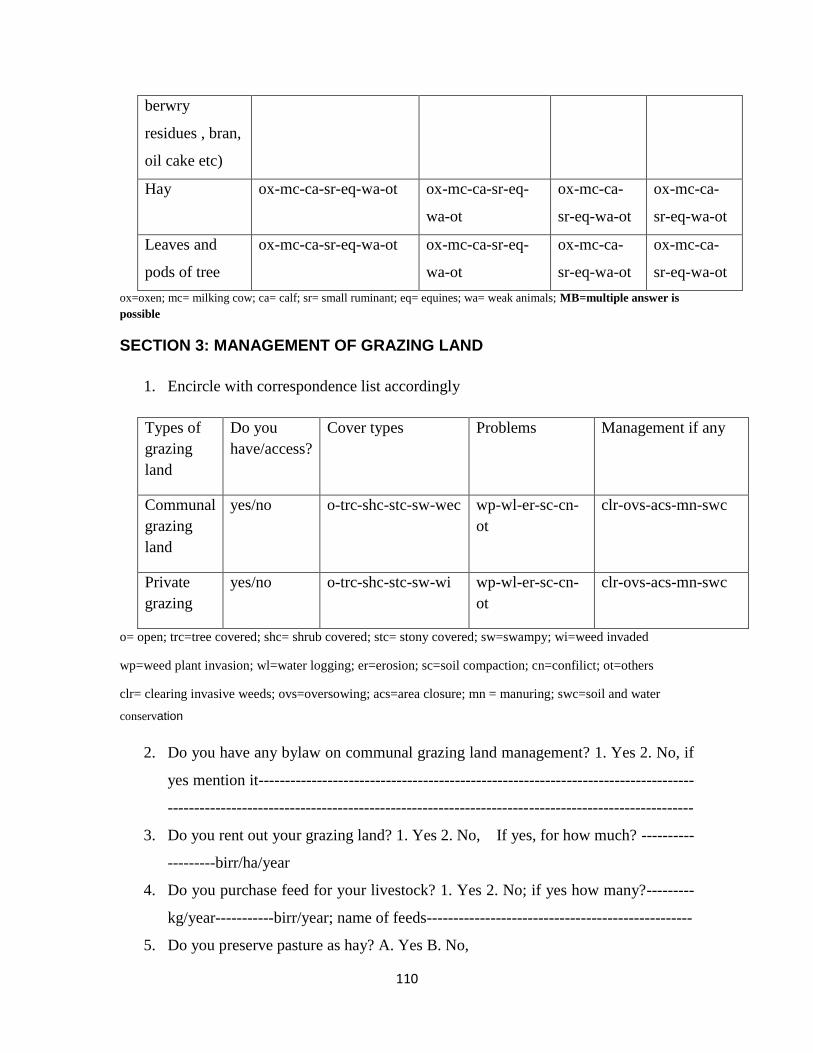
110
berwry
residues , bran,
oil cake etc)
Hay ox-mc-ca-sr-eq-wa-ot ox-mc-ca-sr-eq-
wa-ot
ox-mc-ca-
sr-eq-wa-ot
ox-mc-ca-
sr-eq-wa-ot
Leaves and
pods of tree
ox-mc-ca-sr-eq-wa-ot ox-mc-ca-sr-eq-
wa-ot
ox-mc-ca-
sr-eq-wa-ot
ox-mc-ca-
sr-eq-wa-ot
ox=oxen; mc= milking cow; ca= calf; sr= small ruminant; eq= equines; wa= weak animals; MB=multiple answer is
possible
SECTION 3: MANAGEMENT OF GRAZING LAND
1. Encircle with correspondence list accordingly
Types of
grazing
land
Do you
have/access?
Cover types Problems Management if any
Communal
grazing
land
yes/no o-trc-shc-stc-sw-wec wp-wl-er-sc-cn-
ot
clr-ovs-acs-mn-swc
Private
grazing
yes/no o-trc-shc-stc-sw-wi wp-wl-er-sc-cn-
ot
clr-ovs-acs-mn-swc
o= open; trc=tree covered; shc= shrub covered; stc= stony covered; sw=swampy; wi=weed invaded
wp=weed plant invasion; wl=water logging; er=erosion; sc=soil compaction; cn=confilict; ot=others
clr= clearing invasive weeds; ovs=oversowing; acs=area closure; mn = manuring; swc=soil and water
conservation
2. Do you have any bylaw on communal grazing land management? 1. Yes 2. No, if
yes mention it----------------------------------------------------------------------------------
---------------------------------------------------------------------------------------------------
3. Do you rent out your grazing land? 1. Yes 2. No, If yes, for how much? ----------
---------birr/ha/year
4. Do you purchase feed for your livestock? 1. Yes 2. No; if yes how many?---------
kg/year-----------birr/year; name of feeds--------------------------------------------------
5. Do you preserve pasture as hay? A. Yes B. No,
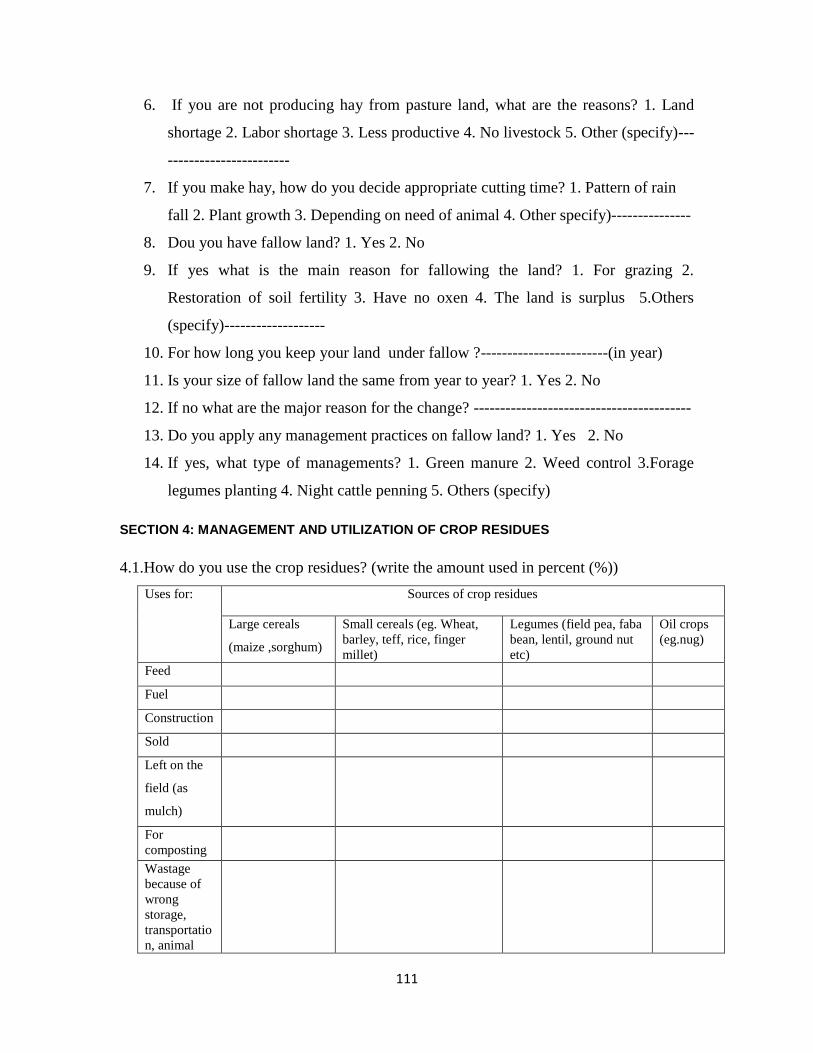
111
6. If you are not producing hay from pasture land, what are the reasons? 1. Land
shortage 2. Labor shortage 3. Less productive 4. No livestock 5. Other (specify)---
-----------------------
7. If you make hay, how do you decide appropriate cutting time? 1. Pattern of rain
fall 2. Plant growth 3. Depending on need of animal 4. Other specify)---------------
8. Dou you have fallow land? 1. Yes 2. No
9. If yes what is the main reason for fallowing the land? 1. For grazing 2.
Restoration of soil fertility 3. Have no oxen 4. The land is surplus 5.Others
(specify)-------------------
10. For how long you keep your land under fallow ?------------------------(in year)
11. Is your size of fallow land the same from year to year? 1. Yes 2. No
12. If no what are the major reason for the change? -----------------------------------------
13. Do you apply any management practices on fallow land? 1. Yes 2. No
14. If yes, what type of managements? 1. Green manure 2. Weed control 3.Forage
legumes planting 4. Night cattle penning 5. Others (specify)
SECTION 4: MANAGEMENT AND UTILIZATION OF CROP RESIDUES
4.1.How do you use the crop residues? (write the amount used in percent (%))
Uses for: Sources of crop residues
Large cereals
(maize ,sorghum)
Small cereals (eg. Wheat,
barley, teff, rice, finger
millet)
Legumes (field pea, faba
bean, lentil, ground nut
etc)
Oil crops
(eg.nug)
Feed
Fuel
Construction
Sold
Left on the
field (as
mulch)
For
composting
Wastage
because of
wrong
storage,
transportatio
n, animal
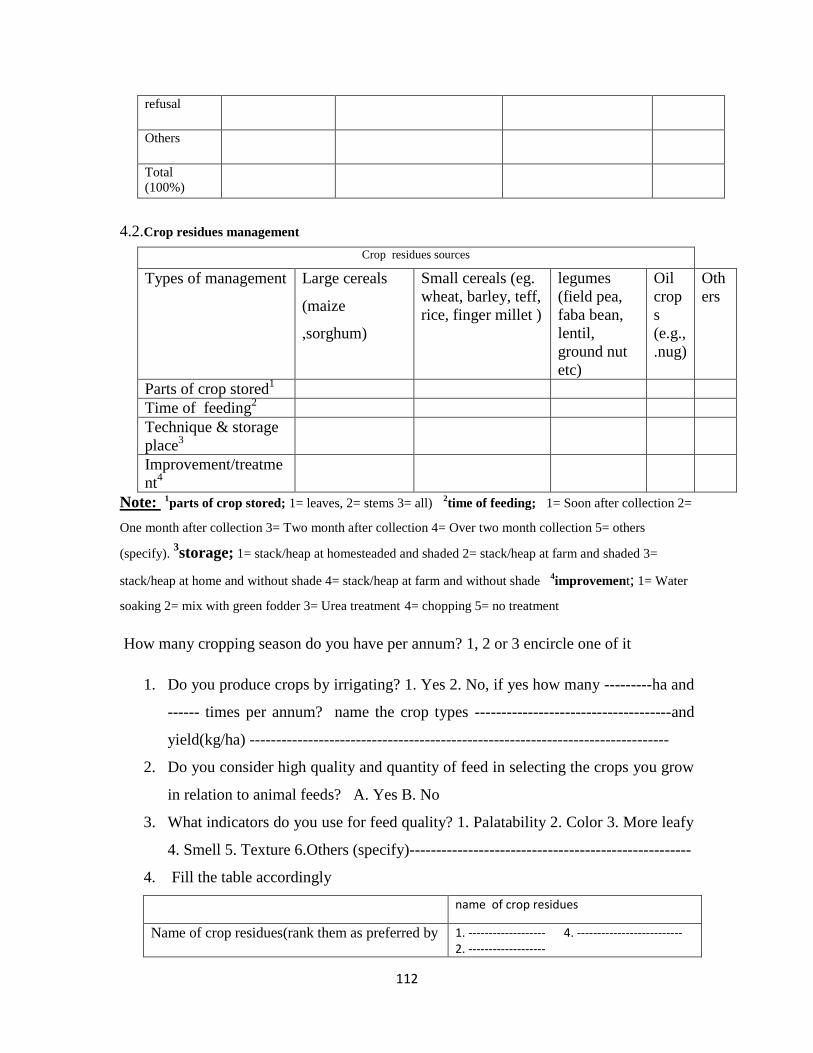
112
refusal
Others
Total
(100%)
4.2.Crop residues management
Crop residues sources
Types of management Large cereals
(maize
,sorghum)
Small cereals (eg.
wheat, barley, teff,
rice, finger millet )
legumes
(field pea,
faba bean,
lentil,
ground nut
etc)
Oil
crop
s
(e.g.,
.nug)
Oth
ers
Parts of crop stored1
Time of feeding2
Technique & storage
place3
Improvement/treatme
nt4
Note: 1parts of crop stored; 1= leaves, 2= stems 3= all) 2
time of feeding; 1= Soon after collection 2=
One month after collection 3= Two month after collection 4= Over two month collection 5= others
(specify). 3storage; 1= stack/heap at homesteaded and shaded 2= stack/heap at farm and shaded 3=
stack/heap at home and without shade 4= stack/heap at farm and without shade 4improvement; 1= Water
soaking 2= mix with green fodder 3= Urea treatment 4= chopping 5= no treatment
How many cropping season do you have per annum? 1, 2 or 3 encircle one of it
1. Do you produce crops by irrigating? 1. Yes 2. No, if yes how many ---------ha and
------ times per annum? name the crop types -------------------------------------and
yield(kg/ha) -------------------------------------------------------------------------------
2. Do you consider high quality and quantity of feed in selecting the crops you grow
in relation to animal feeds? A. Yes B. No
3. What indicators do you use for feed quality? 1. Palatability 2. Color 3. More leafy
4. Smell 5. Texture 6.Others (specify)-----------------------------------------------------
4. Fill the table accordingly
name of crop residues
Name of crop residues(rank them as preferred by 1. ------------------- 4. -------------------------- 2. -------------------
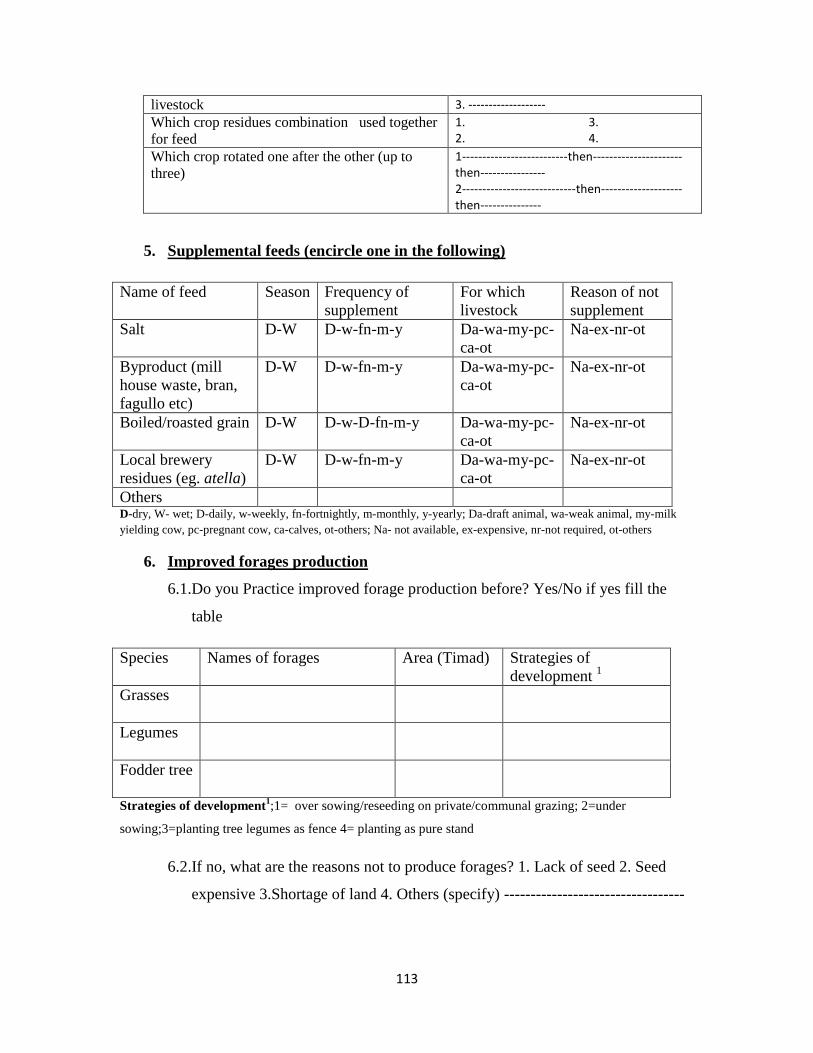
113
livestock 3. -------------------
Which crop residues combination used together
for feed 1. 3. 2. 4.
Which crop rotated one after the other (up to
three)
1--------------------------then----------------------then---------------- 2----------------------------then--------------------then---------------
5. Supplemental feeds (encircle one in the following)
Name of feed Season Frequency of
supplement
For which
livestock
Reason of not
supplement
Salt D-W D-w-fn-m-y Da-wa-my-pc-
ca-ot
Na-ex-nr-ot
Byproduct (mill
house waste, bran,
fagullo etc)
D-W D-w-fn-m-y Da-wa-my-pc-
ca-ot
Na-ex-nr-ot
Boiled/roasted grain D-W D-w-D-fn-m-y Da-wa-my-pc-
ca-ot
Na-ex-nr-ot
Local brewery
residues (eg. atella)
D-W D-w-fn-m-y Da-wa-my-pc-
ca-ot
Na-ex-nr-ot
Others D-dry, W- wet; D-daily, w-weekly, fn-fortnightly, m-monthly, y-yearly; Da-draft animal, wa-weak animal, my-milk
yielding cow, pc-pregnant cow, ca-calves, ot-others; Na- not available, ex-expensive, nr-not required, ot-others
6. Improved forages production
6.1.Do you Practice improved forage production before? Yes/No if yes fill the
table
Strategies of development1;1= over sowing/reseeding on private/communal grazing; 2=under
sowing;3=planting tree legumes as fence 4= planting as pure stand
6.2.If no, what are the reasons not to produce forages? 1. Lack of seed 2. Seed
expensive 3.Shortage of land 4. Others (specify) ----------------------------------
Species Names of forages Area (Timad) Strategies of
development 1
Grasses
Legumes
Fodder tree
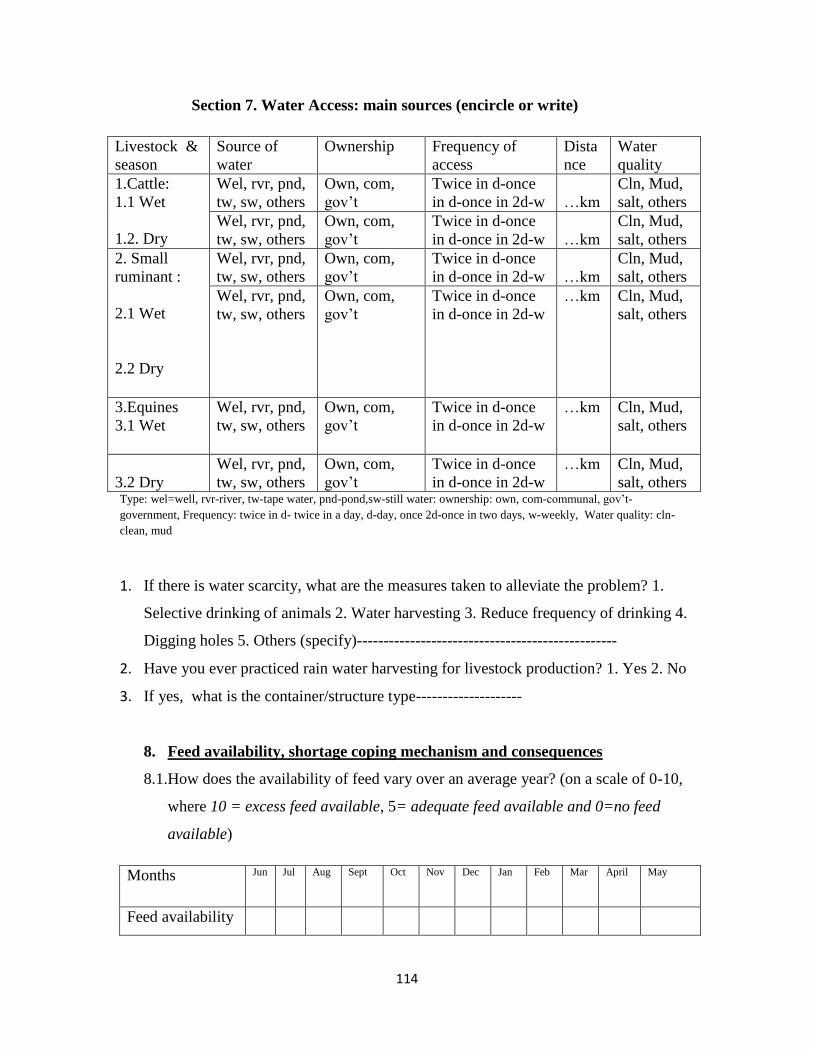
114
Section 7. Water Access: main sources (encircle or write)
Livestock &
season Source of
water Ownership Frequency of
access Dista
nce Water
quality 1.Cattle:
1.1 Wet
1.2. Dry
Wel, rvr, pnd,
tw, sw, others Own, com,
gov’t Twice in d-once
in d-once in 2d-w
…km Cln, Mud,
salt, others Wel, rvr, pnd,
tw, sw, others Own, com,
gov’t Twice in d-once
in d-once in 2d-w
…km Cln, Mud,
salt, others 2. Small
ruminant :
2.1 Wet
2.2 Dry
Wel, rvr, pnd,
tw, sw, others Own, com,
gov’t Twice in d-once
in d-once in 2d-w
…km Cln, Mud,
salt, others Wel, rvr, pnd,
tw, sw, others Own, com,
gov’t Twice in d-once
in d-once in 2d-w …km Cln, Mud,
salt, others
3.Equines
3.1 Wet
Wel, rvr, pnd,
tw, sw, others Own, com,
gov’t Twice in d-once
in d-once in 2d-w …km Cln, Mud,
salt, others
3.2 Dry Wel, rvr, pnd,
tw, sw, others Own, com,
gov’t Twice in d-once
in d-once in 2d-w …km Cln, Mud,
salt, others Type: wel=well, rvr-river, tw-tape water, pnd-pond,sw-still water: ownership: own, com-communal, gov’t-
government, Frequency: twice in d- twice in a day, d-day, once 2d-once in two days, w-weekly, Water quality: cln-
clean, mud
1. If there is water scarcity, what are the measures taken to alleviate the problem? 1.
Selective drinking of animals 2. Water harvesting 3. Reduce frequency of drinking 4.
Digging holes 5. Others (specify)-------------------------------------------------
2. Have you ever practiced rain water harvesting for livestock production? 1. Yes 2. No
3. If yes, what is the container/structure type--------------------
8. Feed availability, shortage coping mechanism and consequences
8.1.How does the availability of feed vary over an average year? (on a scale of 0-10,
where 10 = excess feed available, 5= adequate feed available and 0=no feed
available)
Months Jun Jul Aug Sept Oct Nov Dec Jan Feb Mar April May
Feed availability
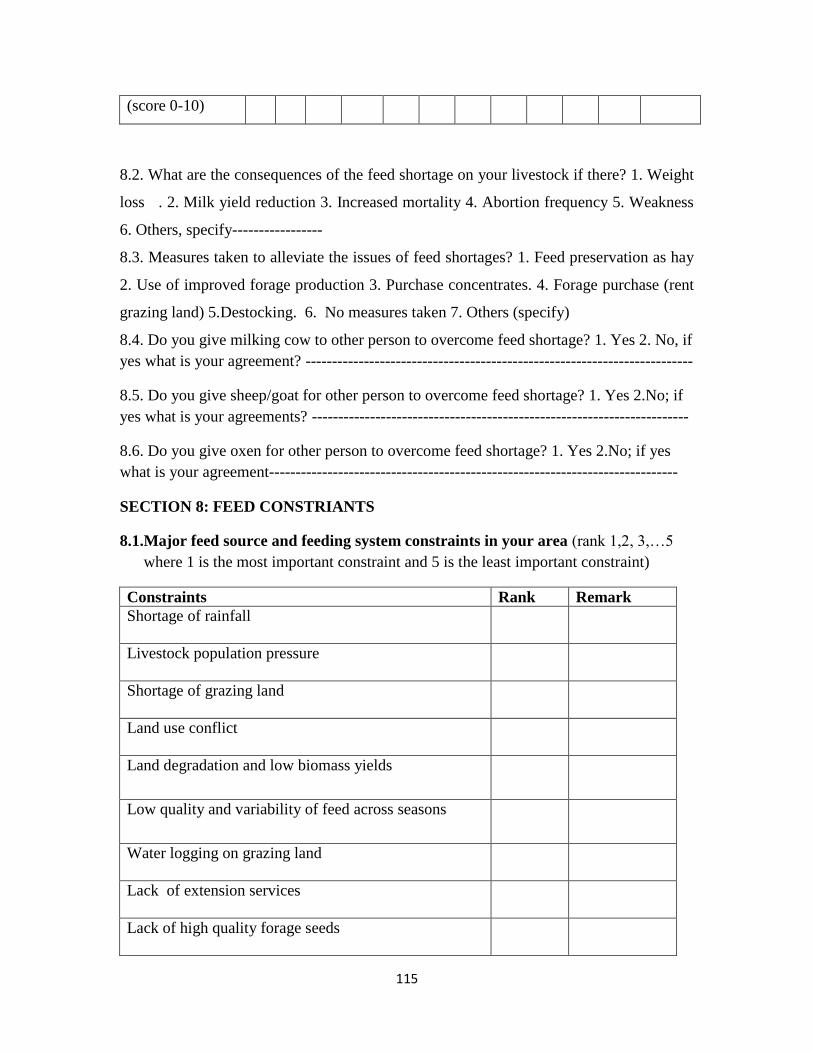
115
(score 0-10)
8.2. What are the consequences of the feed shortage on your livestock if there? 1. Weight
loss . 2. Milk yield reduction 3. Increased mortality 4. Abortion frequency 5. Weakness
6. Others, specify-----------------
8.3. Measures taken to alleviate the issues of feed shortages? 1. Feed preservation as hay
2. Use of improved forage production 3. Purchase concentrates. 4. Forage purchase (rent
grazing land) 5.Destocking. 6. No measures taken 7. Others (specify)
8.4. Do you give milking cow to other person to overcome feed shortage? 1. Yes 2. No, if
yes what is your agreement? -------------------------------------------------------------------------
8.5. Do you give sheep/goat for other person to overcome feed shortage? 1. Yes 2.No; if
yes what is your agreements? -----------------------------------------------------------------------
8.6. Do you give oxen for other person to overcome feed shortage? 1. Yes 2.No; if yes
what is your agreement-----------------------------------------------------------------------------
SECTION 8: FEED CONSTRIANTS
8.1.Major feed source and feeding system constraints in your area (rank 1,2, 3,…5
where 1 is the most important constraint and 5 is the least important constraint)
Constraints Rank Remark
Shortage of rainfall
Livestock population pressure
Shortage of grazing land
Land use conflict
Land degradation and low biomass yields
Low quality and variability of feed across seasons
Water logging on grazing land
Lack of extension services
Lack of high quality forage seeds
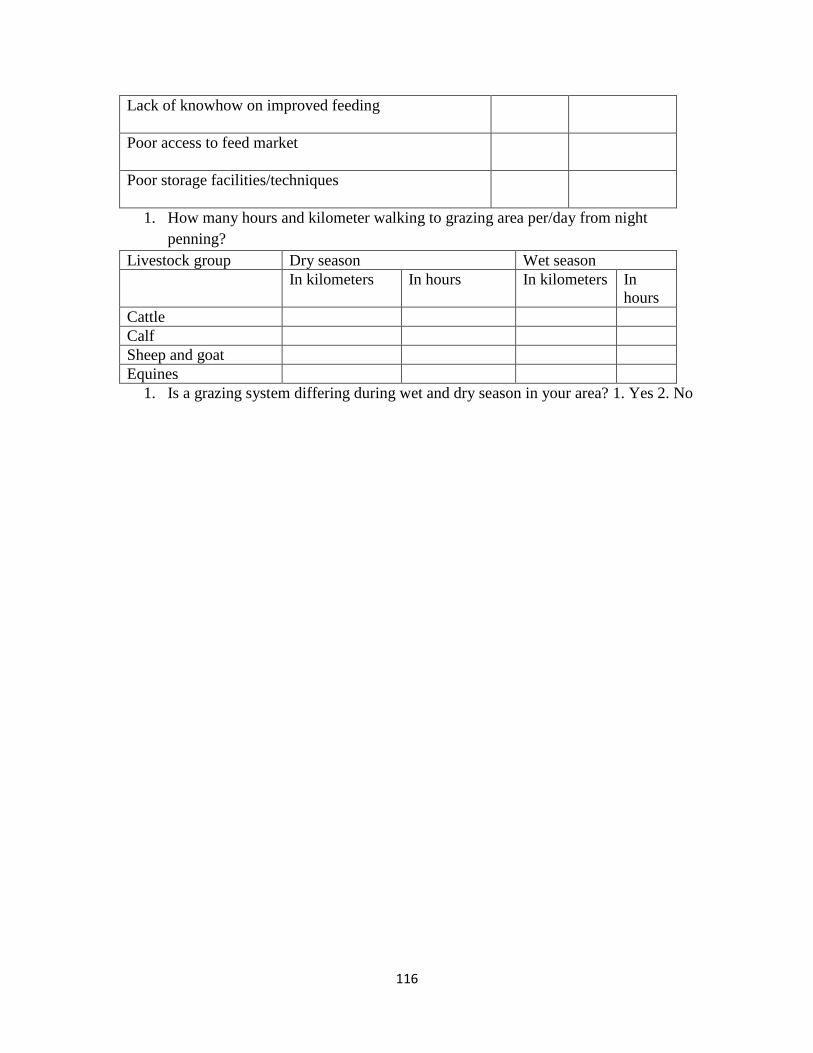
116
Lack of knowhow on improved feeding
Poor access to feed market
Poor storage facilities/techniques
1. How many hours and kilometer walking to grazing area per/day from night
penning?
Livestock group Dry season Wet season
In kilometers In hours In kilometers In
hours
Cattle
Calf
Sheep and goat
Equines
1. Is a grazing system differing during wet and dry season in your area? 1. Yes 2. No
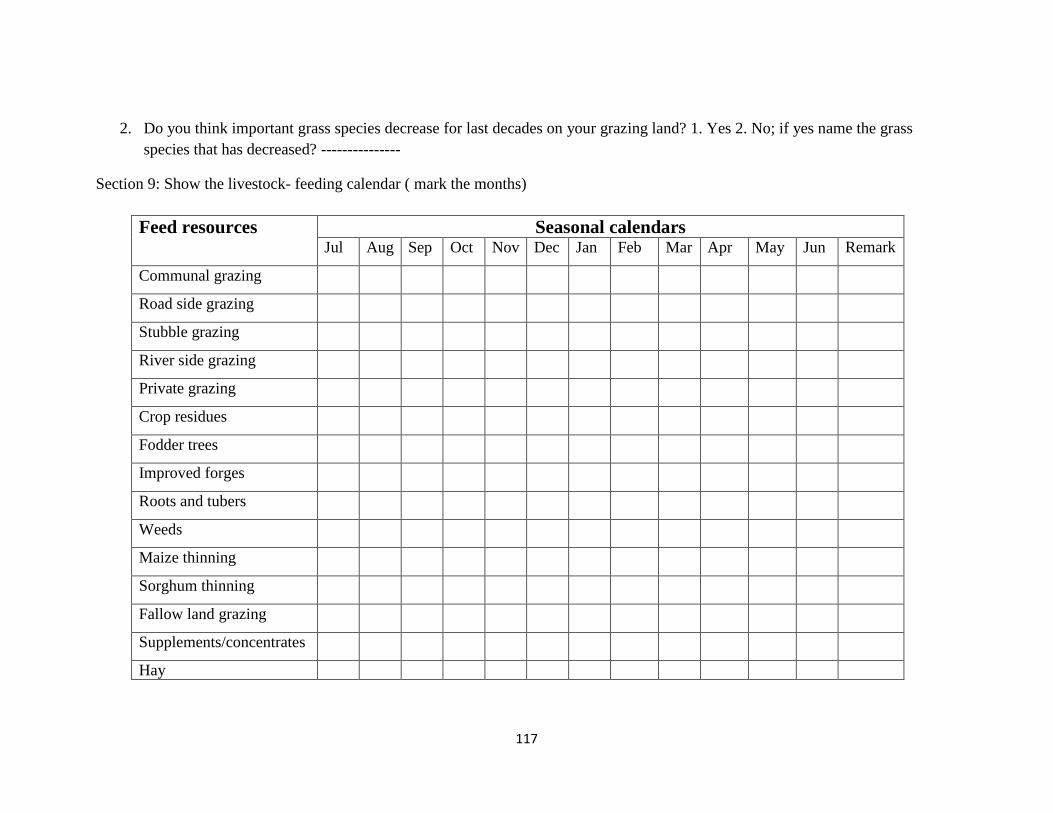
117
2. Do you think important grass species decrease for last decades on your grazing land? 1. Yes 2. No; if yes name the grass
species that has decreased? ---------------
Section 9: Show the livestock- feeding calendar ( mark the months)
Feed resources Seasonal calendars Jul Aug Sep Oct Nov Dec Jan Feb Mar Apr May Jun Remark
Communal grazing
Road side grazing
Stubble grazing
River side grazing
Private grazing
Crop residues
Fodder trees
Improved forges
Roots and tubers
Weeds
Maize thinning
Sorghum thinning
Fallow land grazing
Supplements/concentrates
Hay
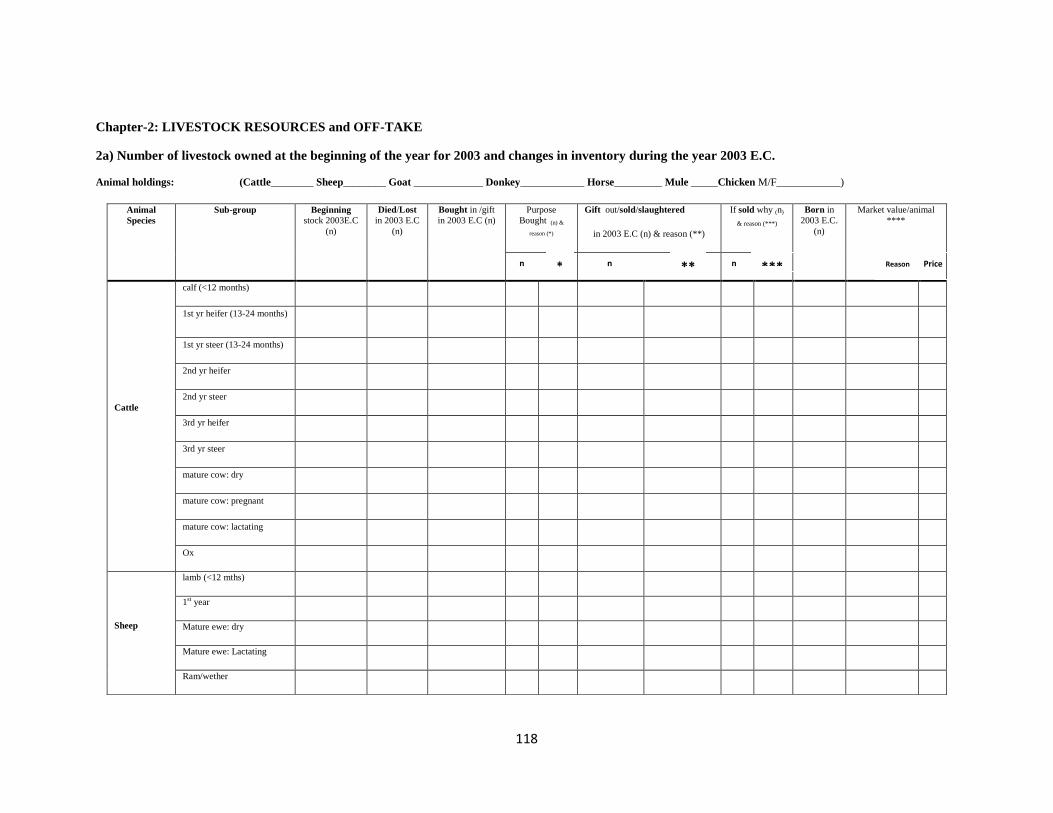
118
Chapter-2: LIVESTOCK RESOURCES and OFF-TAKE
2a) Number of livestock owned at the beginning of the year for 2003 and changes in inventory during the year 2003 E.C.
Animal holdings: (Cattle________ Sheep________ Goat _____________ Donkey____________ Horse_________ Mule _____Chicken M/F____________)
Animal
Species
Sub-group Beginning
stock 2003E.C
(n)
Died/Lost
in 2003 E.C
(n)
Bought in /gift
in 2003 E.C (n)
Purpose
Bought (n) &
reason (*)
Gift out/sold/slaughtered
in 2003 E.C (n) & reason (**)
If sold why (n)
& reason (***)
Born in
2003 E.C.
(n)
Market value/animal
****
Cattle
calf (<12 months)
1st yr heifer (13-24 months)
1st yr steer (13-24 months)
2nd yr heifer
2nd yr steer
3rd yr heifer
3rd yr steer
mature cow: dry
mature cow: pregnant
mature cow: lactating
Ox
Sheep
lamb (<12 mths)
1st year
Mature ewe: dry
Mature ewe: Lactating
Ram/wether
n * ** n *** n Reason Price
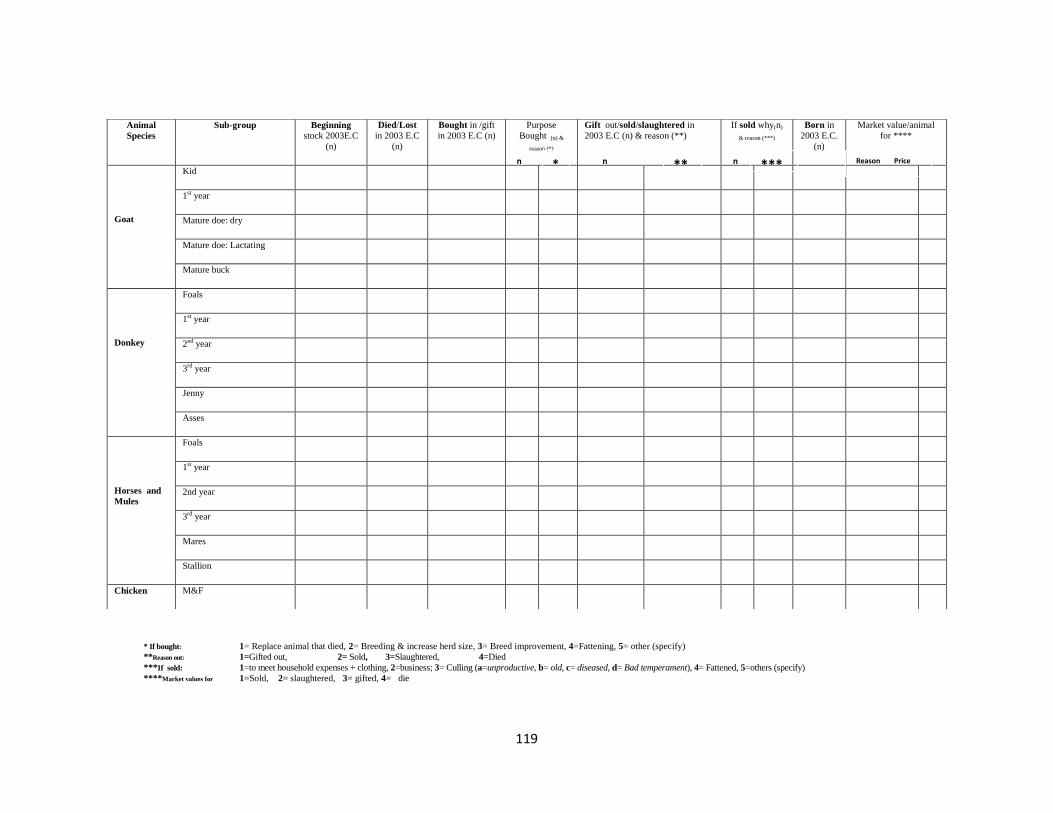
119
* If bought: 1= Replace animal that died, 2= Breeding & increase herd size, 3= Breed improvement, 4=Fattening, 5= other (specify)
**Reason out: 1=Gifted out, 2= Sold, 3=Slaughtered, 4=Died
***If sold: 1=to meet household expenses + clothing, 2=business; 3= Culling (a=unproductive, b= old, c= diseased, d= Bad temperament), 4= Fattened, 5=others (specify)
****Market values for 1=Sold, 2= slaughtered, 3= gifted, 4= die
Animal
Species
Sub-group Beginning
stock 2003E.C
(n)
Died/Lost
in 2003 E.C
(n)
Bought in /gift
in 2003 E.C (n)
Purpose
Bought (n) &
reason (*)
Gift out/sold/slaughtered in
2003 E.C (n) & reason (**)
If sold why(n)
& reason (***)
Born in
2003 E.C.
(n)
Market value/animal
for ****
Goat
Kid
1st year
Mature doe: dry
Mature doe: Lactating
Mature buck
Donkey
Foals
1st year
2nd year
3rd year
Jenny
Asses
Horses and
Mules
Foals
1st year
2nd year
3rd year
Mares
Stallion
Chicken M&F
* n ** n *** n Reason Price
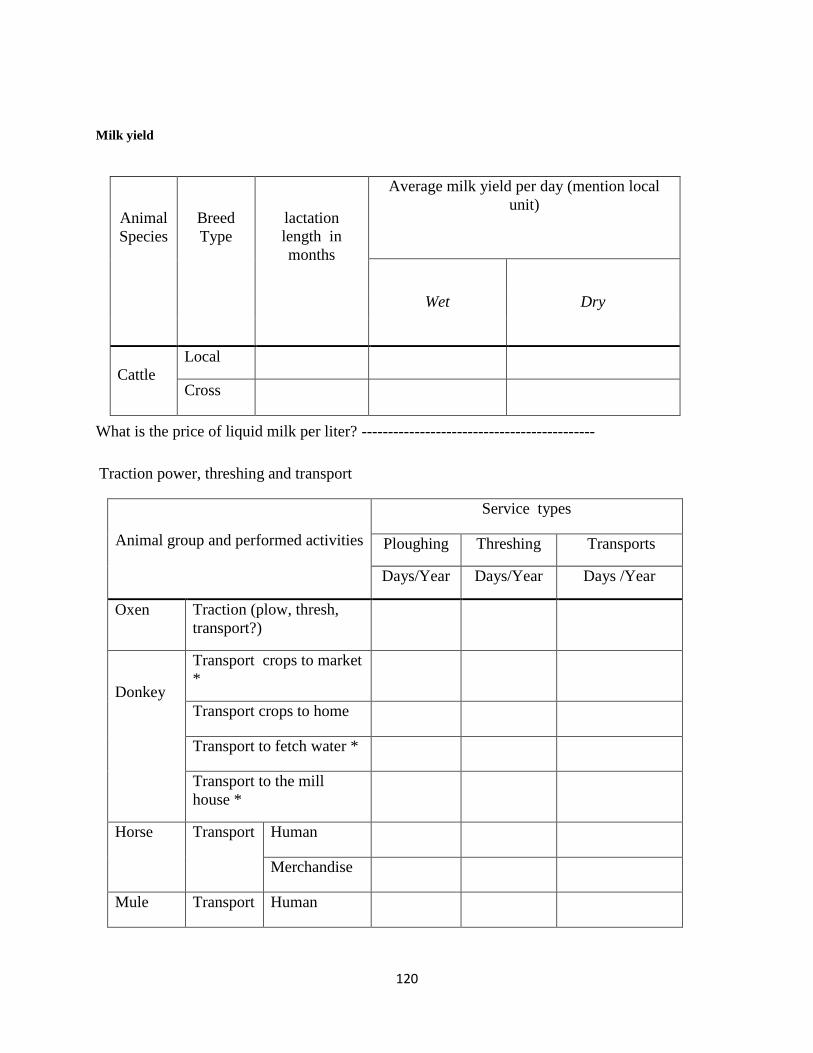
120
Milk yield
What is the price of liquid milk per liter? --------------------------------------------
Traction power, threshing and transport
Animal group and performed activities
Service types
Ploughing Threshing Transports
Days/Year Days/Year Days /Year
Oxen Traction (plow, thresh,
transport?)
Donkey
Transport crops to market
*
Transport crops to home
Transport to fetch water *
Transport to the mill
house *
Horse Transport Human
Merchandise
Mule Transport Human
Animal
Species
Breed
Type
lactation
length in
months
Average milk yield per day (mention local
unit)
Wet
Dry
Cattle
Local
Cross

121
Merchandise
* Round trip
“Jigi” : Collaborative working arrangements
Have you used “Jigi” last year? 1) Yes 2) No
o If you used, how many animals? ________________for how many
days_______________________________
Number of animals performing the activities together at once: Threshing _____
stimated hire value (birr/day) for group of animals: Threshing
Time of starting and ending of ploughing for different seasons (months):
__________________________________________________________________
________________________________________________________________________
Time of starting and ending of Threshing in a day for different crops:
(Animals used for threshing (underline the ones you used): oxen, cow, heifer, donkey, horses…)
Average wage rate (man days) in the locality (Birr/day) __________________
Average daily rate for animal traction rental in the locality (Birr/day) Oxen plow/thresh
__________/_________, Donkey ________, Horse ________, Mules ______
1) Do you move your animals to other places at certain times of the year?
a) Yes b) No
2) Reason of movement
3) Season of movement (month to go out ), Month to go back
4) Types of animals to be moved and their number
5) Way of movement and perceived benefit obtained
6) Cost per animal per month for hosting