Embed Size (px)
Citation preview

Pub
lishe
d by
Man
ey P
ublis
hing
(c)
IOM
Com
mun
icat
ions
Ltd
Study of surface cracking during extrusion ofaluminium alloy AA 2014Z Peng and T Sheppard
Surface cracking is generally recognised as one of the main defects occurring during the process of aluminiumextrusion especially in the case of the so called hard aluminium alloys Previous experiments suggest that this typeof defect is caused by the rise in temperature as the process proceeds Some experiments indicate that the surfacequality is good even though the temperature may be high during extrusion It is also well known that crack criteriahave been adopted to explain the cracking that occurs in extrusion blanking and rolling etc In this study a finiteelement method (FEM) is used in different ways to predict surface cracking during hot extrusion The crack criteriaare integrated into the FEM code FORGE120 The effectiveness of these criteria in predicting surface cracking inthe case of hot extrusion is discussed The FEM simulation also provides some other quantitative data such as thetemperature rise during extrusion from different initial temperatures In addition the principal stresses at the dieland area at different extrusion stages are also shown MST5986
Keywords Aluminium alloys Extrusion Defects Surface cracking
The authors are at DEC Bournemouth University 12 Christchurch Road Bournemouth UK BH1 3NE (tshepparbournemouthacuk) Manuscript received 22 September 2003 accepted 5 February 2004 2004 IoM Communications Ltd Published by Maney for the Institute of Materials Minerals and Mining
Introduction
Al ndash Cu ndash Mg alloy systems have been in use since theirdiscovery over half a century ago The development ofAA 2014 alloy utilised the effect of silicon to produce anAl ndash Cu ndash Mg alloy that is more susceptible to artificial agingthan 2017 and provides a high level of strength unobtain-able in naturally aged 2017 This alloy has widespreadapplications in the aircraft industry The chemical composi-tion limits for 2014 are shown in Table 1
Copper is one of the most important alloying constituentsfor aluminium because of its appreciable solubility andstrengthening effect the strength increasing with increasingcopper content up to a maximum of approximately 6Magnesium is used in combination with copper toaccelerate and increase age hardening at room temperatureThe equilibrium compounds for this system are CuAl2 (hphase) and CuMgAl2 (S phase)12 These are soluble in thematrix during solution heat treatment
During extrusion imperfections in the quality of theextrudate may arise ranging from a rough or unevensurface to complete disintegration of the extrudate Thesurface finish of the product is as important as themechanical properties and the control of defects is oftenthe deciding factor in determining the extrusion conditionsDefects that may occur vary from visible blemishes such ascracks blisters and die lines to invisible ones that show upafter anodising While in high strength aluminium alloyswhere die lines and surface scoring have only secondaryimportance to the mechanical property requirements(because the surface often has to be machined to removerecrystallised layers) the defect is tolerated provided the dielines are not so coarse that stress concentrations arise3 For4Cu alloys surface cracking (or speed cracking) is a majorproblem especially at high temperatures and strain ratesSince the product must be scrapped due to poor surfacequality and inferior mechanical properties it is of primaryimportance to study the occurrence of surface cracking inthe extrusion of hard alloys
In order to evaluate surface cracking extrusions havebeen placed into one of three categories3
(i) A ndash no evidence of cracking
(ii) B ndash cracking commences at some distance alongthe extrudate
(iii) C ndash Cracking occurs along the entire length of theextrudate increasing in severity as extrusionproceeds
Typical examples of these three categories are shown inFig 1 all taken from the same position half way along theextruded length at 05L
Historically a trial and error method has been used toform extrusion products of sufficient quality a costlyuncertain and time consuming practice The ability toidentify and predict these defects is critical to modernpractice and is challenging fundamentally Recently thedevelopment and application of numerical techniques suchas the finite element method (FEM) to continuummechanics problems has provided a powerful facility tosolve this problem
A typical simulation procedure carried out by FEM canconsider the effect of
(i) the geometry of the die and workpiece(ii) operating variables such as temperature and the
rate of deformation the bulk constitutive responseof the material and the interaction with solidboundaries
(iii) Stresses and strains are then calculated as functionsof time from which predictions regarding theoccurrence of fractures are obtained
Cracking criteria
There exist a number of criteria for assessing rupture inmetal forming process45 which are based on experimentalwork that utilises a deformation process related to actualindustrial applications The initiation of ductile fracture in
Table 1 Chemical compostion of AA 2014 (balance Al)
Si Fe Cu Mn Mg Cr Zn Ti
050 ndash 12 07 39 ndash 50 040 ndash 12 020 ndash 08 010 025 015
DOI 101179026708304225022016 Materials Science and Technology September 2004 Vol 20 1179
Pub
lishe
d by
Man
ey P
ublis
hing
(c)
IOM
Com
mun
icat
ions
Ltd
metals depends strongly on the stress and strain historiesMany ductile fracture criteria have the form thatfracture occurs when the value of a damage parameterwhich is given as an integral form of stress and strainreaches a particular value In this study several of thecriteria were combined into the FEM subroutine to see ifthere was a critical value to indicate the initiation of surfacecracking in hot extrusion The details of the selected criteriaare
(1) OyaneetheR
0
1zAsH
seq
deeqcentC1 (1)
where A and C1 are constants sH is the hydrostatic stressseq is the equivalent stress eeq is the equivalent strain Theprocess by which fractures occur in metal forming has beenwidely modelled as void initiation and growth followed bycoalescence to form a crack Based on this hypothesiscriteria for ductile fracture have been suggested byMcClintock et al6 and Oyane et al7
(2) Cockroft and Latham (C ndash L1)etheR
0
s deeqcentC2 (2)
s~Max(s1s2s3) (3)
where C2 is a constant s is the maximum principle stressCockcroft and Latham8 considered the effects of themaximum principal tensile stress over the plastic strainpath to fracture
(3) Cockroft and Latham normalised (C ndash L2)etheR
0
s
seq
deeqcentC3 (4)
where C3 is a constant This criterion has a dependence onhydrostatic stress
(4) AyadaetheR
0
sH
seq
deeqcentC4 (5)
where C4 is a constant(5) Generalised work criterion (GW) or Freudenthal
criterionetheR
0
seq deeqcentC5 (6)
or etheR
0
(s1 _ee1zs2 _ee2zs3 _ee3)centC5rsquo (7)
where C5 and C59 are constantss1 s2 and s3 are theprinciple stresses and e
1 e
2 and e
3 are the corresponding
principle strain rates
Freudenthal9 proposed that energy is the critical para-meter at fracture With this criterion fracture occurs in amaterial element when the rate of plastic energy dissipationreaches a critical value when integrated with respect to timefollowing the element as it travels through the die This isthe only criterion that accurately predicted the site offracture initiation for all three metal forming processesconsidered upsetting extrusion (brass) and strip deforma-tion in the work of Clift et al5
(6) Temperature
TcentC6 (8)
where C6 is a constant If the heat generation near the dieland area increases the local temperature such that theapplied stresses exceed the resistance to deformation thensevere cracking at the surface may be expected Thistemperature generation is a function of the alloy chemistryextrusion speed extrusion ratio aspect ratio containertemperature and initial billet temperature3 Much of theheat generated at the surface occurs through the dead metalzone and the deformation zone shear band whichterminates on the face of the die immediately ahead ofthe die land area This results in a steep rise in thetemperature as the material approaches the die land10 Heatgeneration is comparatively less in the indirect mode ofextrusion compared to the direct mode
According to the six criteria described above whenthe constants C1 ndashC6 reach a critical value the crackoccurs
By integrating the crack criteria into FEM programsresearch has been carried out to study various criteriaadopted in metal forming processes
Hambli and Reszka4 checked fracture criteria validityusing an FEM model of the blanking operation by aninverse technique approach Their study showed that validcritical values for crack initiation by shearing mechanismscould be predicted by the following fracture criteria RiceFreudenthal Cockroft and Latham Atkins Oyane Ayadaand plastic strain
Clift et al511 described the use of the finite elementtechnique to predict fracture initiation in a range of simplemetal forming operations which included simple upsettingaxisymmetric extrusion and strip compression and tensionIn the case of axisymmetric extrusion their study showedthat numerically predicted sites of fracture agreed withexperiment when the Oyane Freudenthal and C ndash L criteriawere adopted However the extrusion ratio was very smallin their study and the influence of temperature rise which isa very important factor for crack initiation duringextrusion was again ignored
In the work of Ko et al12 The C ndash L criterion wasadopted for FEM simulation and it was confirmed to bevalid for predicting crack initiation during aluminium
1 Three categories of surface cracking
1180 Peng and Sheppard Surface cracking during extrusion of aluminium alloy AA 2014
Materials Science and Technology September 2004 Vol 20
Pub
lishe
d by
Man
ey P
ublis
hing
(c)
IOM
Com
mun
icat
ions
Ltd
extrusion However the extrusion ratio used was also verysmall and the temperature rise was not studied
It is interesting to see that some studies on paste extrusionwhich can be assumed to be a real isothermal process havebeen performed by Domanti et al13 The C ndash L criterion andthe generalised work criterion are discussed in their study andthese criteria are shown to be successful in predicting theincrease in fracture with increasing die entry angle They arealso proved to be at least qualitatively correct in consideringthe effect of extrusion ratio on surface fracture Domanti etalrsquos work is an ideal example of an isothermal extrusionwhich can be contrasted with the present work in which thetemperature evolution has to be involved
Some investigations3412 have shown that it is difficult tochoose a fracture criterion that is rsquouniversalrsquo enough in thesense that it gives consistent results for operating conditionsoutside the calibration range Applications of critical valuesof fracture criteria are only successful when they are bothcharacterised and applied under similar loading conditionsA material might crack at a relatively small deformationduring forging yet might be satisfactorily deformed to avery large strain by extrusion The onset of crackingdepends both on the details of the working process to whichthe material is subjected and on its basic ductility
In addition to the criteria mentioned above there alsoexists an empirical method to predict surface crackingoccurring in hot extrusion proposed by Sheppard andTutcher14 They investigated the incidence of speed crackingin the rod form of AA 5456 alloy and showed that the Zparameter may be used to correlate results over widelyvarying temperature and speed conditions
For acceptable surface quality
lnZi
A
iexcl
635|1020
T706i
(9)
where Zi is the Zener ndash Holloman parameter using theaverage strain rate and the initial temperature
Zi~_eeee exp (Q=RTi) (10)
e6is the average strain rate defined by
_eeee~6D2
Bv(azb Ln R)(Czd Tan v)
D3BD3
E
(11)
DB is the billet diameter DE is the extrudate diameter v isthe ram speed R is the extrusion ratio v is the deformationzone cone semi-angle1 which is defined by
v~38769 Ln R (12)
a b c and d are constants (a~0171 b~186 c~387d~69)10 Ti is the initial temperature
This type of analysis has also been applied to theobserved surfaces of shaped extrusions in 2024 alloy1 andintroducing the l2 modification for shaped extrusionsacceptable surfaces were achieved when
1
nln l2 Zi
A
iexcl
2113|109
T2866i
(13)
for direct extrusion and
1
nln l2 Zi
A
cent
2113|109
T2866i
(14)
for indirect extrusion l is the shape factor
These criteria are shown in Fig 2 for a number of Alalloys
In the case of 2014 extrusion Patterson15 and Vierod1617
provided the following empirical criteria
For direct extrusion Patterson gave the followingequation
ln Ziiexcl69242
T0857i
(correlation 09986) (15)
and for indirect extrusion
Ln Zi
159095
T0982i
(Correlation 09991) (16)
where Ti is the initial billet temperature in kelvinVierod also reported that different preheat approaches
affected this criterion such that for conventional heating(CH indicating heating continuously to the extrusiontemperature)
Ln Zi
67954
T1199i
(correlation 0998) (17)
and for material that has been presolution soaked (SSheat to soak temperature and cool to extrusion
2 Extrusion limit
Peng and Sheppard Surface cracking during extrusion of aluminium alloy AA 2014 1181
Materials Science and Technology September 2004 Vol 20
Pub
lishe
d by
Man
ey P
ublis
hing
(c)
IOM
Com
mun
icat
ions
Ltd
temperature)
Ln Zi97955
T1223i
(correlation 0999) (18)
It can be seen from the above equations that in theseempirical equations only the initial temperature andthe average strain rate are considered With the FEmethod the evolution of the instantaneous Zener ndashHollomon parameter in which the real-time strain rateand the real-time temperature are used can be convenientlyobtained from the output program In this paper theinstantaneous Zener ndash Hollomon parameter is integratedinto the FEM program to observe its evolution duringextrusion and the initial LnZi and real-time Ln(Zr) valuesare compared The real-time Zener ndash Hollomon parameter isdefined by
Zr~_ee exp (Q=RT) (19)
where e
is the real-time strain rate and T is the real-timetemperature With the combination of the initial Z valueand the instantaneous Z history the surface cracking isstudied again by the use of the empirical equations
FEM simulation setting
The main simulation tooling used in this study is shown inTable 2 The billet length was 95 mm and the extrusionratio 30 Experimental results defining process conditionsinducing an unacceptable surface are taken fromRefs 16 ndash 19
The FEM program FORGE21 was used in this study Itis a process simulation tool based on the finite elementmethod The hyperbolic sine function was integrated intothe FEM to describe material behaviour The constitutiveequation can then be written as
ss~1
aLn
Z
A
1n
zZ
A
2n
z1
12
24
35 (20)
where a A n are temperature independent constantss6 is theflow stress and Z is the Zener ndash Hollomon parameter Foraluminium alloy AA 2014 DH~144408 kJ mol21a~00152 m2 MN21 n~527 ln A~244116
Three friction laws are available in FORGE21 Trescaviscoplastic and Coulomb These three friction laws havebeen studied by Flitta18 who discovered that simulationsusing the Tresca criterion gave the best result As a resultonly the Tresca law is adopted in this paper The Trescafriction law is written in the following form
t~mssffiffiffi3
p (21)
where s 6 represents the flow stress m is the frictioncoefficient which is in effect a percentage of that whichwould represent sticking conditions
Temperature evolution is represented by the followingheat equation associated with a certain number of boundary
conditions
rcdT
dt~div(k grad(T))z _WW (22)
where r is the material density c is the heat capacity and kis the conductivityW
is the heat power dissipated by plastic deformationwhich is written as
_WW~gss_eeee (23)
The term g represents here the efficiency of the defor-mation s6 is the flow stress and e6
the mean equivalent strain
rate
Discussion of simulation resultsconcerning loadndash time history andtemperature evolution
Before we consider the factors affecting surface crackingthe simulation results of load history and temperatureevolution must be discussed Because the strain the strainrate and the stress which are key parameters in thecracking criteria are closely related to the load and thetemperature it is of primary importance to check the FEMprediction concerning these variables
Experimental and FEM predicted values of extrusionload are shown in Tables 3 and 4 respectively The integralfile predicted and FEM predicted values of temperature arealso shown Sheppard19 indicated that there is reasonableagreement between these two calculations and Dashwood20
demonstrated that FEM calculations yield results thatdescribe the metallurgical features accurately Duan andSheppard21 demonstrated that the FORGE2 programaccurately predicts the temperature throughout rollingpass schedules
The predicted time ndash load curves of all the extrusionprocesses are shown in Figs 3 ndash 5
Table 2 Tooling of FEM model
Run Code Extrusion mode Initial billet temperature uC Container temperature uC Ram speed mm s21 Surface condition
1 Direct 298 275 79 A2 Direct 396 350 70 B3 Direct 470 375 73 C4 Direct 474 430 33 B5 Indirect 464 375 34 A
A Surface condition good throughout extrusionB Surface cracking occurs from the middle stage of extrusion to the endC Surface cracking occurs from the start of extrusion
3 Predicted timendash load curves
1182 Peng and Sheppard Surface cracking during extrusion of aluminium alloy AA 2014
Materials Science and Technology September 2004 Vol 20
Pub
lishe
d by
Man
ey P
ublis
hing
(c)
IOM
Com
mun
icat
ions
Ltd
In this paper the data are extracted from two points (sidepoint and centre point) and two lines (AB and CD) at thedie land area as shown in Fig 6
The temperature evolution at the side point and centrepoint of the entire direct extrusion runs are shown in Fig 7For the indirect extrusion RUN 5 the positions of the twopoints were changing throughout the extrusion because theywere moving with the die It is therefore difficult to extractthe data continuously as performed for direct extrusionsThe temperatures in this case are extracted from line AB atdifferent stages of extrusion as shown in Fig 8
It can be seen clearly that there is a difference between thetemperatures at the two points throughout all the extrusionprocesses However at the end of extrusion the tempera-ture at the centre point rises more quickly than that of the
side point and the temperature difference is very small at theend of extrusion This phenomenon has been reportedpreviously22 The difference between the temperature of theextrudate face and centre in this work was close to 30 Kwhile in Venasrsquos work the difference was found to be 60 KBecause the billet size used in this study is quite different tothat used in Venasrsquos work it is not strange that there is somediscrepancy The very sharp temperature gradient near thesurface is of great significance since it is the surfacetemperature and not the average exit temperature that iscritical for surface failure such as cracking
Table 3 shows that the predicted loads correlate well withthe experimental results The predicted temperatures asshown in Table 4 are also in good agreement with theexperimental measurements
It is necessary to point out that the lsquocutrsquo technology wasadopted in this study When the material is extruded out ofthe die to a certain distance the program deletes the elementautomatically as shown in Fig 9 Figure 9a shows anextrusion setting without the lsquocutrsquo method in which all ofthe elements remain throughout the calculation It thereforetakes an extremely long time to finish a simulation using thisapproach However when the lsquocutrsquo technology is used onlya certain length of extrudate remains and the calculationtime will be significantly saved as can be seen from Fig 9bc and d Using this method all five extrusion processes usedin this study were completed within a short time
It should be noted that in the experiments if surfacecracking occurs it would appear immediately on the surface
Table 3 Load data
Extrusion code Experimental max load tons FEM predicted max load tons Experimental min load tons FEM predicted min load tons
1 4392 4459 2858 28012 2956 2861 2086 19573 2438 2402 2046 19224 1930 1902 1793 16025 1974 2032 2097 2058
Table 4 Temperature
Extrusion code Peak temp uC FEM predicted peak temp uC Final temp uC FEM predicted final temp uC
1 3091 3152 4708 46572 4035 4089 5012 49823 4761 4792 5463 53964 4780 4821 5290 52045 4713 4783 4888 4932
Peak temp is the temperature of the extrudate when the peak load occurs Both peak temp and final temp here are obtained from the integralprofile model
5 Predicted timendash load curve of extrusion run 4
6 Positions of area analysed
4 Predicted timendash load curve of extrusion run 5
Peng and Sheppard Surface cracking during extrusion of aluminium alloy AA 2014 1183
Materials Science and Technology September 2004 Vol 20
Pub
lishe
d by
Man
ey P
ublis
hing
(c)
IOM
Com
mun
icat
ions
Ltd
of the extrudate when it is extruded out of the die It istherefore evident that more attention should be paid to thedie land area while ignoring the stress and strain field at theextrudate far from the die land When studying surfacecracking the lsquocutrsquo technology will not influence any aspectof the simulation which will appear just as a simulationperformed without this technology
The principal stress distributions at different extrusionstages along the line AB (as shown in Fig 6) are shown inFig 10 Compared with the longitudinal stress in pasteextrusion which is shown in Fig 11 the distribution of thelongitudinal stress in hot aluminium extrusion is differentAs can be seen from Fig 11 the stress is linear along thetransverse direction when the extrusion ratio is high in pasteextrusion while it is totally different in the hot aluminiumextrusion It can also be seen from Fig 10 that themaximum stress at the surface of the RUN 1 extrusion ishigher than that of RUN 3 although the surface quality ismuch better in RUN 1
Discussion of cracking criteria
If a criterion can explain the following four phenomenathen it can be regarded as effective in predicting the surfacecracking which occurs in hot extrusion of aluminium alloyAA 2014
1 Phenomenon 1 (P1) cracking occurs on the extrudatesurface and is not seen at other locations
2 Phenomenon 2 (P2) the extrusion suffers serioussurface cracking during extrusion at high initial tempera-tures such as in RUN 3 It is not a serious problem forextrusion at low initial temperatures
3 Phenomenon 3 (P3) in some cases for instance theRUN 2 extrusion used in this study surface cracking occursduring the middle period of the process and becomes moreserious as the process continues
4 Phenomenon 4 (P4) the severity of cracking is less inthe indirect mode than in the direct mode
a Run 1 b Run 2 c Run 3 d Run 4
7 Temperature evolution
8 Temperature evolution of line AndashB in extrusion run 5
1184 Peng and Sheppard Surface cracking during extrusion of aluminium alloy AA 2014
Materials Science and Technology September 2004 Vol 20
Pub
lishe
d by
Man
ey P
ublis
hing
(c)
IOM
Com
mun
icat
ions
Ltd
It should be recalled that a higher value of damageparameter ie the C1 ndash C6 mentioned above indicates agreater chance of cracking If the assumed lsquocritical valuersquodoes exist then surface cracking will occur if the predictedvalue is higher than the lsquocritical valuersquo
PHENOMENON 1As can be seen from Fig 12a ndash f all simulations operatingwith different criteria give the maximum predicted value onthe extrudate surface and the predicted value decreasessmoothly from the surface to the centre of the extrudate The
a before cut b direct extrusion c indirect extrusion d end of direct extrusion
9 Cut technology
10 Principal stress distribution along line AndashB at differ-ent stages of hot extrusion
11 Principal stress distribution in transverse direction in pasteextrusion at different levels of extrusion ratioR (Ref 14)
Peng and Sheppard Surface cracking during extrusion of aluminium alloy AA 2014 1185
Materials Science and Technology September 2004 Vol 20
Pub
lishe
d by
Man
ey P
ublis
hing
(c)
IOM
Com
mun
icat
ions
Ltd
maximum predicted values also begin to appear near the re-entrant die corner which can be seen in Fig 12f It followsthat if there is a critical value for the cracking criterion thenthis value would be reached first on the surface according toall of the criteria adopted in this study This was illustratedafter the crack function of the software was triggered as canbe seen in Fig 12g Hence we may conclude that all of thecriteria are effective in predicting the first phenomenon
PHENOMENON 2However as can be seen in Figs 13 ndash 17 these criteriaexcept the temperature criterion do not permit predictionof the second phenomenon According to the criteriamentioned above which all assume there is a critical valuefor surface cracking the critical value should be reachedfirst in the extrusion of RUN 3 which suffers the mostsurface cracking in the experiments However as can be
a Oyane b C ndash L1 c C ndash L2 d Ayada e GW f instant Z g surface cracking after crack function triggered
12 Predicted values of cracking criteria
1186 Peng and Sheppard Surface cracking during extrusion of aluminium alloy AA 2014
Materials Science and Technology September 2004 Vol 20
Pub
lishe
d by
Man
ey P
ublis
hing
(c)
IOM
Com
mun
icat
ions
Ltd
seen in Figs 13 ndash 17 in which the Oyane C ndash L Ayada andGW criteria are employed the predicted value of RUN 3 isnot the maximum among all the predicted values Thepredicted curves of the different RUNs are convoluted andcannot be used to draw the conclusion that RUN 3 suffersmost from surface cracking Meanwhile for the criteria ofAyada and GW as can be seen in Fig 13 the predictedcurve of the RUN 1 extrusion has the highest position whilethis extrusion has the best surface quality in the experi-ments In Fig 17 the curve of RUN 3 is a little lower thanthe curve of RUN 2 while in experiments the surfacecracking which happened in RUN 2 is less serious than thatin RUN 3 The data shown in Figs 13 ndash 15 were extractedfrom line CD as shown in Fig 5 after the ram travelled thesame distance The data shown in Figs 16 and 17 areextracted from the point D as shown in Fig 5
PHENOMENON 3It can be seen from Figs 18 ndash 20 that the first three criteriaie Oyane C ndash L1 and C ndash L2 criteria are valid Thepredicted peak values at the middle of extrusion are higherthan the maximum value at the beginning of extrusion Itcan also be seen from Figs 21 and 22 that the Ayada andGW criteria are obviously effective The predicted values ofthese two criteria are continuously rising through out theextrusion and this corresponds with the concept that ifsurface cracking occurs it will become more and moresevere as the process proceeds
PHENOMENON 4For the fourth phenomenon it can be seen from Figs 16and 17 that the Ayada and GW criteria are valid For the
a Oyane b C ndash L1 c C ndash L2 d Ayada e GW f instant Z g surface cracking after crack function triggered
12 Predicted values of cracking criteria (cont)
Peng and Sheppard Surface cracking during extrusion of aluminium alloy AA 2014 1187
Materials Science and Technology September 2004 Vol 20
Pub
lishe
d by
Man
ey P
ublis
hing
(c)
IOM
Com
mun
icat
ions
Ltd
simulation results of RUN 5 these two criteria givethe predicted curve occupying the lowest position inthe diagram
The temperature criterion is also valid in explaining thefourth phenomenon as can be seen from Fig 7 It has beendiscussed previously that the temperature rise duringextrusion results in incipient melting of the second phaseparticles which form an intergranular network whenrapidly quenched resulting in a brittle product havingpoor mechanical properties16
a Oyane b C ndash L1 c C ndash L2 d Ayada e GW f instant Z g sur-face cracking after crack function triggered
12 Predicted values of cracking criteria (cont)
13 Simulation results using Oyane criterion
14 Simulation results using CndashL2 criterion
15 Simulation results using CndashL1 criterion
16 Simulation results using Ayada criterion
17 Simulation results using GW (Freudenthal) criterion
18 Predicted value of Oyane criterion at different stages
1188 Peng and Sheppard Surface cracking during extrusion of aluminium alloy AA 2014
Materials Science and Technology September 2004 Vol 20
Pub
lishe
d by
Man
ey P
ublis
hing
(c)
IOM
Com
mun
icat
ions
Ltd
The other criteria are not effective in predicting the fourthphenomenon
Discussion of the empirical criterion
Because the empirical method is regressed from all of theexperiments it is evident that it is effective in predicting the
phenomena 1 2 4 and 5 mentioned above Meanwhile ifonly judged from the Ln(Zi) value it is difficult to predict ifsurface cracking will occur at the start of extrusion or part waythrough extrusion However with the FEM predicted value ofLn(Zr) this problem can be solved as discussed below
It can be seen from Figs 23 ndash 26 that the predicted Ln(Zr)value rises sharply at the beginning of extrusion and then
19 Predicted value of C ndash L1 criterion at different stages
20 Predicted value of C ndash L2 criterion at different stages
21 Predicted value of Ayada criterion at different stages
22 Predicted value of GW criterion at different stages
23 Predicted value of Ln(Zr) in Run 1
24 Predicted value of Ln(Zr) in Run 2
Table 5 Comparison of Ln(Z) values
Extrusion codePredicted peakvalue of Ln(Zr)
Predicted minimumvalue of Ln(Zr) Initial value of Ln(Zi)
Critical value accordingto equation (17)
1 3214 2719 3183 33652 2792 2474 2725 27833 2595 2468 2471 24544 2428 2302 2355 24385 1823 1752 2478
Peng and Sheppard Surface cracking during extrusion of aluminium alloy AA 2014 1189
Materials Science and Technology September 2004 Vol 20
Pub
lishe
d by
Man
ey P
ublis
hing
(c)
IOM
Com
mun
icat
ions
Ltd
decreases slowly throughout the remainder of the process Itis worth pointing out that the Ln(Zr) ndash time curve is similarto the load ndash time curve in which the peak value appears atthe start of extrusion
As shown in Table 5 for RUNS 1 and 4 the predictedinstantaneous Ln(Zr) value is lower than the criticalvalue throughout extrusion For RUN 2 as can be seenfrom Fig 25 the predicted peak value is higher than thecritical value at the start of extrusion but decreases to valueslower than the critical value at later stages of extrusionFigure 26 indicates that for RUN 3 the predicted value ishigher than the critical value throughout extrusion Theseexperiments correspond to real situations the surfacequality remained good throughout the whole process forruns 1 and 4 while surface cracking occurred part waythrough extrusion in RUN 2 and at the start of extrusion inRUN 3
It can be seen from these discussions that the combina-tion of Ln(Zi) and Ln(Zr) enables surface cracking to bepredicted If Ln(Zi) is higher than the critical value given byequation (19) then surface cracking will occur and ifLn(Zr) is higher than the critical value throughoutextrusion then the extrudate will suffer from surfacecracking throughout extrusion
Conclusions
The results are summarised in Table 61 Surface cracking is closely related to the temperature
rise during extrusion If the heat generated near the die landarea increases the local temperature above the solidus pointlocalised melting can occur which can cause severe crackingof the surface This conclusion is supported by manyprevious studies11516
2 Given a so called lsquocritical valuersquo that depends on theinitial condition but not assumed universal the empiricalcriterion can also predict all five phenomena
3 The other criteria (Oyane C ndash L Ayada etc)cannot successfully predict all four cracking mechanismsoccurring in hot aluminium extrusion Although they arecapable of predicting some phenomena all criteria excepttemperature and the empirical formula failed to predictphenomenon 2
Recommendation for further work
In this study all work was performed using axisymmetricalextrusion however the danger of cracking increases inshaped extrusion near the re-entrant corners In sectionscontaining ribs for example which is an extreme case thereis a danger of the rib disintegrating If the shape factor lwhich is used in equations (13) and (14) is considered insurface cracking phenomenon then further simulation workis required to establish the initial cracking conditions Inthis study the FEM simulation tooling is fixed and this isobviously not the case in actual processes More experi-ments and simulations with deformable dies are required iffurther conclusions are to be drawn
References
1 t sheppard lsquoExtrusion of aluminium alloysrsquo Vol 5 205 ndash 2451999 Dordrecht Kluwer Academic
2 l f mondolfo j g barlock and a p tomeo EnergiesJ Solar Energ Soc Am 1976 2 365 ndash 386
3 t sheppard Mater Sci Technol 1993 9 430 ndash 4404 r hambli andm reszka Int JMech Sci 2002 44 1349 ndash 13615 s e clift c e hartley n sturgess and g w rowe Int J
Mech Sci 1990 32 1 ndash 176 f a mcclintock s m kaplan and c a berg Int J Mech
Sci 1996 2 614 ndash 6287 m oyane t sato k okimoto and s shima J Mech Work
Technol 1980 4 65 ndash 798 m g cockcroft and d j latham J Inst Met 1968 96
2444 ndash 24779 f a mcclintock s m kaplan and c a berg Int J Mech
Sci 1966 2 614 ndash 63010 t sheppard Mater Sci Technol 1999 15 459 ndash 46311 j r rice and d m tracey J Mech Phys Solids 1969 17
201 ndash 21812 d ko b kim and j choi J Mater Process Technol 1996 62
166 ndash 17413 a t domanti d j horrobin and j bridgeater J Mech Sci
2002 44 1381 ndash 141014 m g tutcher and t sheppard Met Technol 1980 7 488 ndash
49315 s j paterson lsquoThe direct and indirect extrusion of aluminium
alloysrsquo Vol 4 262 ndash 280 1981 London London University16 t sheppard and r p vierod Mater Sci Technol 1985 1
321 ndash 324
26 Predicted value of Ln(Zr) in Run 4
Table 6 Validity of cracking criteria
Phenomenon
Criterion 1 2 3 4
Oyane d X d XC ndash L1 d X d XC ndash L2 d X d XAyada d X d dFreudenthal d X d dTemperature d d d dEmpirical d d d d
d effective X invalid
25 Predicted value of Ln(Zr) in Run 3
1190 Peng and Sheppard Surface cracking during extrusion of aluminium alloy AA 2014
Materials Science and Technology September 2004 Vol 20
Pub
lishe
d by
Man
ey P
ublis
hing
(c)
IOM
Com
mun
icat
ions
Ltd
17 t sheppard and r p vierod Mater Sci Technol 1987 3285 ndash 290
18 i flitta and t sheppard Mater Sci Technol 2003 19 23 ndash 2419 t sheppard Mater Sci Technol 1999 115 459 ndash 46320 r j dashwood h b mcshane and a jackson Proc 6th
Int Seminar on lsquoAluminium extrusion technologyrsquo Chicago
IL May 1996 Aluminium Extruders Council Vol 1331 ndash 39
21 x duan and t sheppard Int J Mech Sci 2003 44 (10)2155 ndash 2172
22 i venas j herberg and i skauvik lsquoAluminium technologyrsquo86rsquo Proc Int Conf Norway 1986 Hydro Aluminium 23 ndash 26
Materials Science and Technology September 2004 Vol 20
Peng and Sheppard Surface cracking during extrusion of aluminium alloy AA 2014 1191

Pub
lishe
d by
Man
ey P
ublis
hing
(c)
IOM
Com
mun
icat
ions
Ltd
seen in Figs 13 ndash 17 in which the Oyane C ndash L Ayada andGW criteria are employed the predicted value of RUN 3 isnot the maximum among all the predicted values Thepredicted curves of the different RUNs are convoluted andcannot be used to draw the conclusion that RUN 3 suffersmost from surface cracking Meanwhile for the criteria ofAyada and GW as can be seen in Fig 13 the predictedcurve of the RUN 1 extrusion has the highest position whilethis extrusion has the best surface quality in the experi-ments In Fig 17 the curve of RUN 3 is a little lower thanthe curve of RUN 2 while in experiments the surfacecracking which happened in RUN 2 is less serious than thatin RUN 3 The data shown in Figs 13 ndash 15 were extractedfrom line CD as shown in Fig 5 after the ram travelled thesame distance The data shown in Figs 16 and 17 areextracted from the point D as shown in Fig 5
PHENOMENON 3It can be seen from Figs 18 ndash 20 that the first three criteriaie Oyane C ndash L1 and C ndash L2 criteria are valid Thepredicted peak values at the middle of extrusion are higherthan the maximum value at the beginning of extrusion Itcan also be seen from Figs 21 and 22 that the Ayada andGW criteria are obviously effective The predicted values ofthese two criteria are continuously rising through out theextrusion and this corresponds with the concept that ifsurface cracking occurs it will become more and moresevere as the process proceeds
PHENOMENON 4For the fourth phenomenon it can be seen from Figs 16and 17 that the Ayada and GW criteria are valid For the
a Oyane b C ndash L1 c C ndash L2 d Ayada e GW f instant Z g surface cracking after crack function triggered
12 Predicted values of cracking criteria (cont)
Peng and Sheppard Surface cracking during extrusion of aluminium alloy AA 2014 1187
Materials Science and Technology September 2004 Vol 20
Pub
lishe
d by
Man
ey P
ublis
hing
(c)
IOM
Com
mun
icat
ions
Ltd
simulation results of RUN 5 these two criteria givethe predicted curve occupying the lowest position inthe diagram
The temperature criterion is also valid in explaining thefourth phenomenon as can be seen from Fig 7 It has beendiscussed previously that the temperature rise duringextrusion results in incipient melting of the second phaseparticles which form an intergranular network whenrapidly quenched resulting in a brittle product havingpoor mechanical properties16
a Oyane b C ndash L1 c C ndash L2 d Ayada e GW f instant Z g sur-face cracking after crack function triggered
12 Predicted values of cracking criteria (cont)
13 Simulation results using Oyane criterion
14 Simulation results using CndashL2 criterion
15 Simulation results using CndashL1 criterion
16 Simulation results using Ayada criterion
17 Simulation results using GW (Freudenthal) criterion
18 Predicted value of Oyane criterion at different stages
1188 Peng and Sheppard Surface cracking during extrusion of aluminium alloy AA 2014
Materials Science and Technology September 2004 Vol 20
Pub
lishe
d by
Man
ey P
ublis
hing
(c)
IOM
Com
mun
icat
ions
Ltd
The other criteria are not effective in predicting the fourthphenomenon
Discussion of the empirical criterion
Because the empirical method is regressed from all of theexperiments it is evident that it is effective in predicting the
phenomena 1 2 4 and 5 mentioned above Meanwhile ifonly judged from the Ln(Zi) value it is difficult to predict ifsurface cracking will occur at the start of extrusion or part waythrough extrusion However with the FEM predicted value ofLn(Zr) this problem can be solved as discussed below
It can be seen from Figs 23 ndash 26 that the predicted Ln(Zr)value rises sharply at the beginning of extrusion and then
19 Predicted value of C ndash L1 criterion at different stages
20 Predicted value of C ndash L2 criterion at different stages
21 Predicted value of Ayada criterion at different stages
22 Predicted value of GW criterion at different stages
23 Predicted value of Ln(Zr) in Run 1
24 Predicted value of Ln(Zr) in Run 2
Table 5 Comparison of Ln(Z) values
Extrusion codePredicted peakvalue of Ln(Zr)
Predicted minimumvalue of Ln(Zr) Initial value of Ln(Zi)
Critical value accordingto equation (17)
1 3214 2719 3183 33652 2792 2474 2725 27833 2595 2468 2471 24544 2428 2302 2355 24385 1823 1752 2478
Peng and Sheppard Surface cracking during extrusion of aluminium alloy AA 2014 1189
Materials Science and Technology September 2004 Vol 20
Pub
lishe
d by
Man
ey P
ublis
hing
(c)
IOM
Com
mun
icat
ions
Ltd
decreases slowly throughout the remainder of the process Itis worth pointing out that the Ln(Zr) ndash time curve is similarto the load ndash time curve in which the peak value appears atthe start of extrusion
As shown in Table 5 for RUNS 1 and 4 the predictedinstantaneous Ln(Zr) value is lower than the criticalvalue throughout extrusion For RUN 2 as can be seenfrom Fig 25 the predicted peak value is higher than thecritical value at the start of extrusion but decreases to valueslower than the critical value at later stages of extrusionFigure 26 indicates that for RUN 3 the predicted value ishigher than the critical value throughout extrusion Theseexperiments correspond to real situations the surfacequality remained good throughout the whole process forruns 1 and 4 while surface cracking occurred part waythrough extrusion in RUN 2 and at the start of extrusion inRUN 3
It can be seen from these discussions that the combina-tion of Ln(Zi) and Ln(Zr) enables surface cracking to bepredicted If Ln(Zi) is higher than the critical value given byequation (19) then surface cracking will occur and ifLn(Zr) is higher than the critical value throughoutextrusion then the extrudate will suffer from surfacecracking throughout extrusion
Conclusions
The results are summarised in Table 61 Surface cracking is closely related to the temperature
rise during extrusion If the heat generated near the die landarea increases the local temperature above the solidus pointlocalised melting can occur which can cause severe crackingof the surface This conclusion is supported by manyprevious studies11516
2 Given a so called lsquocritical valuersquo that depends on theinitial condition but not assumed universal the empiricalcriterion can also predict all five phenomena
3 The other criteria (Oyane C ndash L Ayada etc)cannot successfully predict all four cracking mechanismsoccurring in hot aluminium extrusion Although they arecapable of predicting some phenomena all criteria excepttemperature and the empirical formula failed to predictphenomenon 2
Recommendation for further work
In this study all work was performed using axisymmetricalextrusion however the danger of cracking increases inshaped extrusion near the re-entrant corners In sectionscontaining ribs for example which is an extreme case thereis a danger of the rib disintegrating If the shape factor lwhich is used in equations (13) and (14) is considered insurface cracking phenomenon then further simulation workis required to establish the initial cracking conditions Inthis study the FEM simulation tooling is fixed and this isobviously not the case in actual processes More experi-ments and simulations with deformable dies are required iffurther conclusions are to be drawn
References
1 t sheppard lsquoExtrusion of aluminium alloysrsquo Vol 5 205 ndash 2451999 Dordrecht Kluwer Academic
2 l f mondolfo j g barlock and a p tomeo EnergiesJ Solar Energ Soc Am 1976 2 365 ndash 386
3 t sheppard Mater Sci Technol 1993 9 430 ndash 4404 r hambli andm reszka Int JMech Sci 2002 44 1349 ndash 13615 s e clift c e hartley n sturgess and g w rowe Int J
Mech Sci 1990 32 1 ndash 176 f a mcclintock s m kaplan and c a berg Int J Mech
Sci 1996 2 614 ndash 6287 m oyane t sato k okimoto and s shima J Mech Work
Technol 1980 4 65 ndash 798 m g cockcroft and d j latham J Inst Met 1968 96
2444 ndash 24779 f a mcclintock s m kaplan and c a berg Int J Mech
Sci 1966 2 614 ndash 63010 t sheppard Mater Sci Technol 1999 15 459 ndash 46311 j r rice and d m tracey J Mech Phys Solids 1969 17
201 ndash 21812 d ko b kim and j choi J Mater Process Technol 1996 62
166 ndash 17413 a t domanti d j horrobin and j bridgeater J Mech Sci
2002 44 1381 ndash 141014 m g tutcher and t sheppard Met Technol 1980 7 488 ndash
49315 s j paterson lsquoThe direct and indirect extrusion of aluminium
alloysrsquo Vol 4 262 ndash 280 1981 London London University16 t sheppard and r p vierod Mater Sci Technol 1985 1
321 ndash 324
26 Predicted value of Ln(Zr) in Run 4
Table 6 Validity of cracking criteria
Phenomenon
Criterion 1 2 3 4
Oyane d X d XC ndash L1 d X d XC ndash L2 d X d XAyada d X d dFreudenthal d X d dTemperature d d d dEmpirical d d d d
d effective X invalid
25 Predicted value of Ln(Zr) in Run 3
1190 Peng and Sheppard Surface cracking during extrusion of aluminium alloy AA 2014
Materials Science and Technology September 2004 Vol 20
Pub
lishe
d by
Man
ey P
ublis
hing
(c)
IOM
Com
mun
icat
ions
Ltd
17 t sheppard and r p vierod Mater Sci Technol 1987 3285 ndash 290
18 i flitta and t sheppard Mater Sci Technol 2003 19 23 ndash 2419 t sheppard Mater Sci Technol 1999 115 459 ndash 46320 r j dashwood h b mcshane and a jackson Proc 6th
Int Seminar on lsquoAluminium extrusion technologyrsquo Chicago
IL May 1996 Aluminium Extruders Council Vol 1331 ndash 39
21 x duan and t sheppard Int J Mech Sci 2003 44 (10)2155 ndash 2172
22 i venas j herberg and i skauvik lsquoAluminium technologyrsquo86rsquo Proc Int Conf Norway 1986 Hydro Aluminium 23 ndash 26
Materials Science and Technology September 2004 Vol 20
Peng and Sheppard Surface cracking during extrusion of aluminium alloy AA 2014 1191
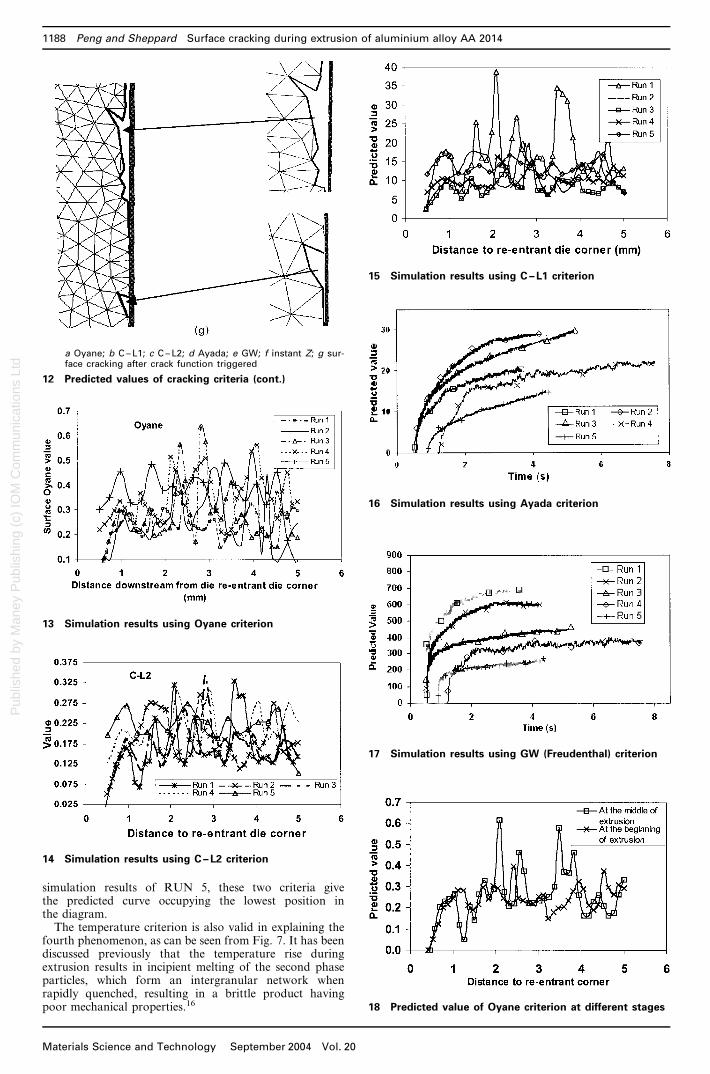
Pub
lishe
d by
Man
ey P
ublis
hing
(c)
IOM
Com
mun
icat
ions
Ltd
17 t sheppard and r p vierod Mater Sci Technol 1987 3285 ndash 290
18 i flitta and t sheppard Mater Sci Technol 2003 19 23 ndash 2419 t sheppard Mater Sci Technol 1999 115 459 ndash 46320 r j dashwood h b mcshane and a jackson Proc 6th
Int Seminar on lsquoAluminium extrusion technologyrsquo Chicago
IL May 1996 Aluminium Extruders Council Vol 1331 ndash 39
21 x duan and t sheppard Int J Mech Sci 2003 44 (10)2155 ndash 2172
22 i venas j herberg and i skauvik lsquoAluminium technologyrsquo86rsquo Proc Int Conf Norway 1986 Hydro Aluminium 23 ndash 26
Materials Science and Technology September 2004 Vol 20
Peng and Sheppard Surface cracking during extrusion of aluminium alloy AA 2014 1191