Embed Size (px)
Citation preview

Study of the ArBr-, AC, and Krl- anions and the corresponding neutral van der Waals complexes by anion zero electron kinetic energy spectroscopy
Yuexing Zhao, Ivan Yourshaw, Georg Reiser, Caroline C. Arnold, and Daniel M. Neumarka) Department of Chemistry, University of California, Berkeley, California 94720, and Chemical Sciences Division, Lawrence Berkeley Laboratory, Berkeley, California 94720
(Received 9 May 1994; accepted 29 June 1994)
Three rare gas halide (RgX-) anions, ArBr-, At-I-, and KrI-, and the corresponding open-shell van der Waals complexes, ArBr, ArI, and KrI, were studied with anion zero electron kinetic energy @EKE) spectroscopy. Photodetachment of each anion accesses the three lowest-lying electronic states (the X l/2, Z3/2, and II1 /2 states) of the neutral complex. The spectra for each system reveal well-resolved progressions in the low frequency vibrations of the anion and the three neutral electronic states, providing a detailed spectroscopic probe of the Rg.X- and Rg.X interaction potentials. The line shapes observed in the ZEKE spectra are analyzed in terms of the line strengths of the underlying rotational transitions. From our data, we construct the potential energy curve for each neutral state as well as for the anion, and these interaction potentials are compared to potentials obtained from scattering and ion mobility experiments.
I. INTRODUCTION
The determination of the potential energy function be- tween weakly interacting species has been a central goal of a wide range of scattering and spectroscopy studies over the last several years. As a result of this effort, the interactions between closed shell atomic and molecular neutral species have been characterized in considerable detail.1V2 On the other hand, potential energy functions between open and closed shell species or between neutrals and ions are gener- ally much less well understood. These latter two types of interactions are the subject of this paper. We report a zero electron kinetic energy @EKE) spectroscopy study of sev- eral rare gas halide (RgX-) anions. The resulting spectra provide a detailed probe not only of the RgX- potential en- ergy function, but also of the potential energy functions for the ground and low-lying excited electronic states of the neu- tral RgX van der Waals complex. Results are presented here for the ArBr, ArI, and KrI complexes.
The RgX- potentials are of interest as they determine the diffusion and mobility of ions in plasmas and discharges. The primary interest in the neutral RgX species derives from their importance in excimer lasers, in which the lasing tran- sition occurs between a strongly bound excited state, largely ionic in character, and the weakly bound ground state of the complex. The neutral species are also of interest as prototypi- cal open shell complexes. In contrast to the isotropic inter- action between two closed shell atoms, the interaction poten- tial between a rare gas and a halogen atom is complicated by spin-orbit and orientation effects due to the open shell nature of the halogen atom.3’4 Specifically, the interaction between an X(*P) and rare gas atom results in three low-lying elec- tronic states, all of which are weakly bound by van der Waals
%kmille and Henry Dreyfus Teacher-Scholar.
forces. The lower two states (the X1/2 and Z3/2 states) cor- relate to ground state X(*P3& +Rg products, while the higher ZZ1/2 state correlates to X*(*P,,,)+Rg products.
All three states are accessible via photodetachment of the RgX- anion and can therefore be characterized in our experiment. The resolution of our negative ion ZEKE spec- trometer (2-5 cm-’ under conditions used here) is sufficient to resolve transitions between anion and neutral vibrational levels, thereby providing a detailed probe of the anion and three neutral states. The work presented here is an extension of an earlier pape? in which the van der Waals states of the I.CO, complex were studied by ZEKE spectroscopy of the I-CO2 anion.
The properties of RgX complexes have been studied pre- viously in scattering and spectroscopy experiments. Scatter- ing experiments have been most useful in characterizing the van der Waals states of these species. In a series of differen- tial cross section measurements, Lee and co-workers6’7 ob- tained the X1/2 and Z3/2 potential energy curves of several RgX complexes. These experiments have been carried out on the whole series of Rg (Ar,Kr,Xe)-X (F,Cl,Br,I) interactions except for ArCI, KrCl, and ArI. In a complementary set of experiments, Aquilanti et &.*-” have measured Rg-F and Rg-Cl (Rg=He,Ne,Ar,Kr,Xe) elastic scattering integral cross sections using magnetically state-selected X atoms.
In addition to the scattering experiments, several spec- troscopic methods have been used to probe RgX complexes. Spontaneous emission spectra from the strongly bound ionic excited states to the van der Waals states have been recorded for several KrX and XeX species by Setser and co-workers,” Ewing and Brau,‘* and Tellinghuisen and co-workers.‘3 Golde and co-workers’4 have measured spontaneous emis- sion spectra of ArCl and ArBr. The XeF electronic absorption spectrum was obtained by Smith and Kobrinsky.” Solgadi16
6538 J. Chem. Phys. 101 (8), 15 October 1994 0021-9606/94/i 01(8)/6538/14/$6.00 Q 1994 American Institute of Physics

and Smalleyt7 have studied XeCl and XeF, respectively, with laser induced fluorescence (LIF). Photoassociation spectra of KrF and XeI have recently been obtained by Eden and co-workers.‘*
In general, these spectroscopic studies have provided considerably more information on the ionic excited states than on the van der Waals states; only the XeF and XeCl spectra show discrete structure associated with bound levels of the ground state. The ionic states have also been studied theoretically; the ab initio configuration interaction calcula- tions by Hay and Dunning” provided a particularly clear picture of these excited states, and greatly facilitated the as- signment of the features observed in the emission spectra. However, ab initio calculations have been less useful in de- scribing the weaker ground state interactions.
The RgX- anions have not been nearly as well studied as the neutrals. Potential energy functions for several of these have been derived from the ion mobility studies by Albritton,*’ McDaniel,*“** Viehlandz3 and their co-workers. Empirical, semiempirical, and ab initio potential energy functions for these species have been proposed by several research groups.24
The results presented here are the first observation of vibrational energy levels in RgX- anions and the ArBr, ArI, and KrI van der Waals states. From this data, we can extract potential energy functions for the anion and three neutral van der Waals states. These are compared to the potential energy functions obtained previously by other investigators. Among the three systems we report here, ArBr and KrI have been studied by Lee and co-workers7 while the interaction poten- tials of the ArI complex have not been reported previously. Overall, we find reasonable agreement with Lee’s X1/2 and Z3/2 potentials. The scattering experiments provide no infor- mation on the ZZ1/2 potentials because of the negligible populations of the Br and Z *PI,, states, from which the ZZ 1 I2 state derives. We find considerably more disagreement with the previously published anion potentials.
II. EXPERIMENT
The negative ion high resolution threshold photodetach- ment (ZEKE) spectrometer has been described in detail previously.*’ A cold RgX- beam is generated by expanding a l%-2% mixture of HBr or HI in rare gas (Ar or Kr) [or the mixture of Ar (or Kr) and He gas] through a pulsed molecu- lar beam valve, typically with a backing pressure of 60 psi, and then crossing the molecular beam with a 1 keV electron beam just outside the valve orifice. Negative ions are formed through dissociative attachment and clustering processes in the continuum flow region of the free-jet expansion and their internal degrees of freedom are cooled as the expansion progresses. The negative ions that pass through a 2 mm di- ameter skimmer are collinearly accelerated to 1 keV and mass selected with a 1 m long beam-modulated time-of- flight mass spectrometer.26 The mass-selected ions then enter the detection region where they are photodetached by an excimer-pumped dye laser. For photodetachment of ArBr-, DMQ and Rhodamine 640 laser dyes were used and the lat- ter was doubled with a KDP crystal; for ArI-, BBQ, DPS and Rhodamine 610 dyes were used and the last one was
Zhao et al.: Study of the ArBr-, Arl-, and Krl- 6539
V h
Y 21360 27400 21440 27480 21520 21560
31030 31070 31110 31150 31190 31230
Wavenumber (cm-‘)
FIG. 1. Threshold photodetacbment spectrum (solid lines) and simulated spectrum (dotted lines) of ArBr-. The arrows indicate where the band ori- gins are.
doubled with a &barium borate (BBO) crystal. For KrI-, DPS and Rhodamine 610 dyes were used and again the latter was doubled with a BBO crystal.
Only those electrons produced with nearly zero kinetic energy are detected using a scheme based on the design of Miller-Dethlefs et ~1.~~ for ZEKE photoionization of neutral species. First, a delay of 150-300 ns subsequent to photode- tachment allows the more energetic electrons and the thresh- old electrons to separate. Then a weak field (2-5 V/cm) is applied collinearly to extract the photoelectrons. Finally ZEKE electrons are selectively detected by using a combina- tion of spatial and temporal filtering. The ultimate resolution of the instrument is 0.3 meV. However, under the operating conditions used in these experiments the resolution was 0.4-0.6 meV. The electron signal is normalized to laser power and the ion signal.
Ill. RESULTS
The ZEKE spectra of ArBr-, AK, and RrI- are shown in Figs. 1, 2, and 3, respectively. The spectrum of each com- plex consists of two distinct groups of features separated approximately by the spin-orbit splitting of the halogen atom X(*P) (0.457 eV for Br and 0.943 eV for I). It appears that the features at lower photon energies consist of two close-lying bands, referred to, in order to increasing energy, as bands A and B. The highest energy band is labeled band C.
J. Chem. Phys., Vol. 101, No. 8, 15 October 1994

6540
24810 24850 24890 24930 i-t970 25010
32420 32460 32500 32540 32580 32620
Wavenumber (cm-‘)
FIG. 2. Threshold photodetachment spectrum (solid lines) and simulated spectrum (dotted lines) of AC. The arrows indicate where the band origins are.
Each band consists of a single intense peak with several smaller peaks on either side. Peak spacings within a band range from 6 to 26 cm-‘. These spacings are consistent with the transitions expected between the various anion and neu- tral vibrational levels. The largest peak in each band is taken to be the origin and is marked with an arrow. Typically, peaks to the blue of the origin peaks are spaced by ca. 20 cm-‘. When more than one peak is observed, such as in band B of the ArBr- and KrI- spectra, the spacing decreases to- wards the blue side. The peaks to the red of the origin peaks have smaller spacings, and the spacings appear to be more irregular. Since band A and band B are very close to each other in energy, one cannot determine at first glance the band to which the peaks between peak 1 and peak 2 belong. In bands A and C, the intensities of the peaks to the red of the origins depend on source conditions, which indicates that these peaks are “hot band” transitions from vibrationally excited anion states. The length of each progression varies depending on the species. For instance, we only observe one peak to the blue of peak 2 in the ArI- spectrum, while more extended progressions are seen in band B of the ArBr- and KC spectra.
The peak widths are between 6-9 cm-’ (FWHM). Peaks in different bands show slightly different peak shapes. Typi- cally, it appears that peaks in band A have a slight tail to- wards the blue while peaks in bands B and C are more sym- metric; this is most evident in the KrI- spectrum, Fig. 3.
Zhao et al.: Study of the ArBr-, Ad-, and Krl-
32550 32590 32630 32670 32710 32750
Wavenumber (cm-‘)
FIG. 3. Threshold photodetachment spectrum (solid lines) and simulated spectrum (dotted lines) of KC. The arrows indicate where the band origins are.
Peak widths are also dependent on the source conditions. As discussed in Sec. IV C, the peak shapes are related to the rotational subband profiles, and consequently depend on the anion rotational temperature and the rotational constants in the anion and neutral.
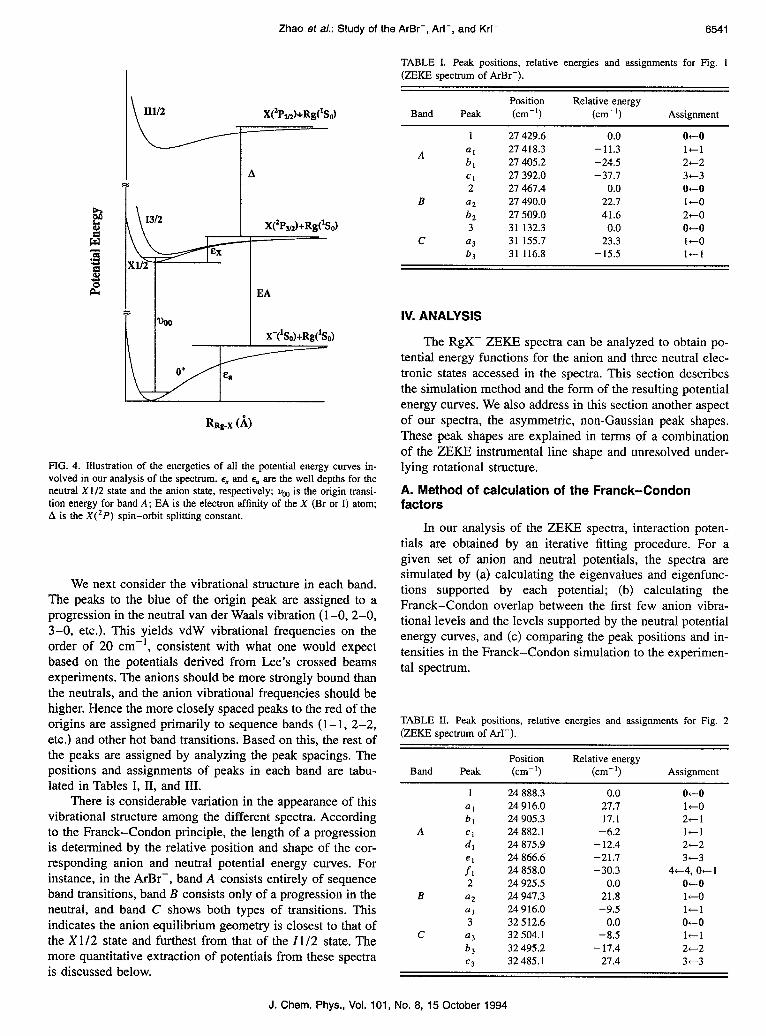
In assigning the RgX- ZEKE spectra, we first explain the band structure in terms of transitions from the anion to different neutral electronic states. Model potentials for the relevant states are shown in Fig. 4. As pointed out earlier, there are three neutral electronic states labeled by the quan- tum number Q the projection of the electronic spin and or- bital angular momentum onto the internuclear axis. At very large internuclear distance, the X1/2 and Z3/2 states corre- late to the X(2P,,2)+Rg(1S0) asymptote, while the ZI1/2 state correlates to the higher-lying X*(2P,,2) +Rg(‘S,) as- ymptote. These two asymptotes are separated in energy by the spin-orbit splitting of the corresponding halogen atom. Because the well depths of the neutral adiabatic potentials are expected to be much smaller than the spin-orbit splitting of Br(2P) or I(2P), transitions to the ZZ1/2 neutral state should be considerably higher in energy than those to the X1/2 and 1312 states. We assign the peaks observed in band C to transitions from the anion state to the ZZ1/2 neutral electronic state. Peaks in band A and B are then assigned to transitions to X1/2 and Z3/2 neutral states, respectively. Note that we are clearly in the Hund’s case (c) regime; the electrostatically induced splitting (i.e., the energy separation between band A and band B) is much less than the spin- orbit splitting of the Br or I atom.
J. Chem. Phys., Vol. 101, No. 8, 15 October 1994
Zhao et al.: Study of the ArBr-, Ad-, and Krl- 6541
A
X(*P&+Rg&)
EA
ho x-(‘So)+&dSo)
w I
RR*-x (A>
FIG. 4. Illustration of the energetics of all the potential energy curves in- volved in our analysis of the spectrum. ex and q, are the well depths for the neutral X l/2 state and the anion state, respectively; vm is the origin transi- tion energy for band A; EA is the electron affinity of the X (Br or I) atom; A is the X( ‘P) spin-orbit splitting constant.
We next consider the vibrational structure in each band. The peaks to the blue of the origin peak are assigned to a progression in the neutral van der Waals vibration (l-O, 2-0, 3-0, etc.). This yields vdW vibrational frequencies on the order of 20 cm-‘, consistent with what one would expect based on the potentials derived from Lee’s crossed beams experiments. The anions should be more strongly bound than the neutrals, and the anion vibrational frequencies should be higher. Hence the more closely spaced peaks to the red of the origins are assigned primarily to sequence bands (l-l, 2-2, etc.) and other hot band transitions. Based on this, the rest of the peaks are assigned by analyzing the peak spacings. The positions and assignments of peaks in each band are tabu- lated in Tables I, II, and III.
There is considerable variation in the appearance of this vibrational structure among the different spectra. According to the Franck-Condon principle, the length of a progression is determined by the relative position and shape of the cor- responding anion and neutral potential energy curves. For instance, in the ArBr-, band A consists entirely of sequence band transitions, band B consists only of a progression in the neutral, and band C shows both types of transitions. This indicates the anion equilibrium geometry is closest to that of the X1/2 state and furthest from that of the Z1/2 state. The more quantitative extraction of potentials from these spectra is discussed below.
TABLE I. Peak positions, relative energies and assignments for Fig. 1 (ZEKE spectrum of ArBr-).
Band
A
B
c
Peak
1 a, b, Cl 2
a2 bz 3
a3 b,
Position Relative energy (cm-‘) (cm-‘)
27 429.6 0.0 2-l 418.3 -11.3 27 405.2 -24.5 27 392.0 -37.7 27 467.4 0.0 27 490.0 22.1 27 509.0 41.6 31 132.3 0.0 31 155.7 23.3 31 116.8 - 15.5
Assignment
oto I+1 2-2 3+3 O-0 1+-O 2+0 0+-o l+O 1+-l
IV. ANALYSIS
The RgX- ZEKE spectra can be analyzed to obtain po- tential energy functions for the anion and three neutral elec- tronic states accessed in the spectra. This section describes the simulation method and the form of the resulting potential energy curves. We also address in this section another aspect of our spectra, the asymmetric, non-Gaussian peak shapes. These peak shapes are explained in terms of a combination of the ZEKE instrumental line shape and unresolved under- lying rotational structure.
A. Method of calculation of the Franck-Condon factors
In our analysis of the ZEKE spectra, interaction poten- tials are obtained by an iterative fitting procedure. For a given set of anion and neutral potentials, the spectra are simulated by (a) calculating the eigenvalues and eigenfunc- tions supported by each potential; (b) calculating the Franck-Condon overlap between the first few anion vibra- tional levels and the levels supported by the neutral potential energy curves, and (c) comparing the peak positions and in- tensities in the Franck-Condon simulation to the experimen- tal spectrum.
TABLE II. Peak positions, relative energies and assignments for Fig. 2 @EKE spectrum of AC).
Band
A
B
c
Peak
1 al b, Cl d, el fl 2
a2 al 3
a3 b, c3
Position Relative energy (cm-‘) (cm-‘)
24 888.3 0.0 24 916.0 27.7 24 905.3 17.1 24 882.1 -6.2 24 875.9 - 12.4 24 866.6 -21.7 24 858.0 -30.3 24 925.5 0.0 24 947.3 21.8 24 916.0 -9.5 32 512.6 0.0 32 504.1 -8.5 32 495.2 -17.4 32 485.1 -27.4
Assignment
0+-o l+O 2+1 1+-l 2-2 3+3
4-4, Ot 1 o-0 l+O It1 0+-o It-1 2+2 3-3
J. Chem. Phys., Vol. 101, No. 8, 15 October 1994
TABLE III. Peak positions, relative energies and assignments for Fig. 3 (ZEN2 spectrum of KC).
Position Relative energy Band Peak (cm-‘) (cm-‘) Assignment
1 25 020.6 0.0 0+-O aI 25 042.5 21.9 l+O b, 25 031.6 11.0 2+-l
A Cl 25 012.8 -1.8 1+-l d, 25 005.0 - 15.7 2+-2 =I 24 997.2 -23.4 3-3 fl 24 987.8 -32.8 4-4 2 25 073.9 0.0 0+-o
a2 25 092.8 18.9 l+O B b, 25 110.1 36.2 2-o
=z 25 125.9 52.0 3+0 4 25 042.5 -31.4 0+-l 3 32 650.7 0.0 o-0
a3 32 676.3 25.6 3+1,5+-2 4 32 672.1 21.4 1+-o c3 32 661.4 10.7 2+1 4 32 640.1 - 10.7 1+-l
C e3 32 631.5 - 19.2 2+2 f3 32 620.9 -29.9 0-l g3 32 612.3 -38.4 It2 4 32 603.8 -46.9 2~3 i3 32 595.3 -55.4 3+-4
j3 32 584.7 -66.0 4+5
The model potentials need to be varied many times to optimize the fit between the simulated and experimental spectra, so an efficient theoretical scheme to calculate the eigenvalues and eigenvectors is required. We use a discrete variable representation (DVR) to determine the eigenvalues and eigenfunctions. This method was first proposed by Har- ris et al.” and has been extended by Light et a1.29 Our implementation of the DVR to the problem at hand has been described elsewhere.30 We use a standard version in which the DVR points are determined by diagonalization of the position operator in a one-dimensional harmonic oscillator basis. Even for the one dimensional calculation, the DVR offers a great increase in speed as the potential energy part of the Hamiltonian matrix is diagonal in DVR basis and we do not have to set up and diagonalize a new Hamiltonian matrix for each model potential.
B. Nature of the potential energy curves
It is desirable to use potential energy functions that are flexible enough to fit all the vibrational features in our spec- tra. All aspects of the vibrational structure, including the peak spacings and intensities must be reproduced in the simulations. Over the years, many sophisticated potential en- ergy functions have been developed to account for the exten- sive experimental results on rare gas-rare gas interactions,“2 and these can be used for the rare gas-halogen systems as well. Moreover, these functions can be adapted to the rare gas halide anions by appropriate modification of the long range attraction.
Lee and co-workers697 have published potential functions for the X l/2 and Z3/2 states of ArBr and KrI based on their differential cross section measurements. Since these are a
convenient starting point for our analysis, we decided to use the same functional form as they did, namely, the MMSV (Morse-Morse-switching function-van der Waals) potential. This is an extremely flexible piecewise potential. In reduced form, with x = r/r, and f(x) = V( r)/e, the MSSV potential for each neutral RgX state is given by
f(x)=exp[2pt(l-x)1-2 exp[pt(l-x)], O<xGl,
=exp[2P2( 1 -x)-2 exp[P2( 1 -x)]=M~(x),
1 <&x, ,
=SW(x)M~(x)+[1-SW(x)]W(x), x,<x<x2,
= - c&.L6- c&Y*= W(x), X2GX<~. (1)
The switching function SW(x) is given by
1
[ +-xl)
SW= y cos (x2-x,) +1 ) 1
6542 Zhao et al.: Study of the ArBr-, Arl-, and Krl-
(2)
and the long range attraction constants are given by
C6r=C6/(4), C8,=C&&. (3)
Here, E is the well depth and rm the internuclear distance of the potential minimum. C6 and Cs are the dispersion coeffi- cients which account for the induced dipole-induced dipole and the induced dipole-induced quadrupole interactions, re- spectively. Any other constants of the same order or higher order are neglected because of their very small contributions.
In the cases of ArBr and KrI neutral states, we use the C6 and Cs constants which were previously used by Lee and co-workers.7 For the states which were not studied in their experiments, we estimate the C, and Cs constants the same way as they did. The C6 constants are estimated from the Slater-Kirkwood formula3’ for the effective number of elec- trons and polarizabilities. The relevant polarizabilities are Br 3.05, I 5.35, Ar 1.64, and Kr 2.48 A3.32 The Cs constants of A&r, ArXe, and KrXe are used for ArBr, ArI, and KrI, re- spectively. The Cs constants for the unlike rare gas pairs are estimated by applying the combining rules based on Cohen and Pack.33 These values are consistent with those calculated based on the method of Koutselos et ~1.~~
For the anion potential, the leading long range attraction term should be dominated by a - l/r4 term with a significant contribution from a -l/r6 term. We use the same MMSV potential form for the anion electronic state except the last (fourth) piece of the potential form, which now should be written as
f(x)= -B4+-4-&j$-6-W(X), x2%dm,
where
B4,.= B41(eri), B6r= B6 /( a-k);
and
(4)
(5)
B4= -q2a,/2, &=-q2CY;/2fc6. (6)
Here, q is the negative charge on the X-, while aB and 4 are the dipole and quadrupole polarizability of the rare gas atom, respectively. The B6 constant consists of contributions from two terms: the charge-induced quadrupole interaction
J. Chem. Phys., Vol. 101, No. 6, 15 October 1994
and the induced dipole-induced dipole interaction. When es- timating the latter, the following anion polarizability values are used Br- 5.22, I- 7.81 A3.35
Since only transitions between several low-lying anion and neutral vibrational levels are observed, our simulation is not sensitive to the very long range part of the potential or the repulsive part of the potential with energies well above the asymptote. The long range part of the potential mainly affects the vibrational levels close to the dissociation limit. Therefore, during our simulation, Cg, Cs, B6, and Bs are left unchanged at the estimated values.
In addition to fixing the long range attraction constants, there is one extra restriction on the potential parameters of the involved potentials. Once one of the four well depths is determined, we can immediately extract the other three well depths from the known or experimentally determined ener- getics. For example, if gx is known for the X1/2 state, E, of the anion potential is determined from
v~~+o;+E~-w;=E,+EA. (7)
Here, voo is the energy of the origin transition for band A, EA is the electron affinity of the halogen atom, (3.3636 eV for Br,36 3.0591 eV for 137) and 4 and wg are the zero point energies of the anion state and the neutral X l/2 state, respec- tively. This relation is made clear in Fig. 4. The zero point energies can be estimated based on vibrational frequencies we obtained in the assignments, or from the DVR calculation of the corresponding potentials. In any case, the error in- volved in the difference of the zero point energies should be very small compared to the energy scale of the well depth. Once the anion well depth is determined, the well depths of the I3/2 and IZ1/2 neutral states are extracted by the same method.
In simulating the ArBr- and KrI- spectra, we start with the X l/2 and I3/2 potentials from Ref. 7. The initial estimate for the anion potential function is obtained by fitting the peak positions and intensities in bands A and B. The initial poten- tial for the II l/2 neutral state is then constructed by simulat- ing band C. The initial potentials for all neutral and anion states are subsequently optimized to obtain the best fit be- tween the experimental and simulated spectra in all three bands. However, as discussed in Sec. IV D, it is difficult to determine absolute values for rm and E from our spectra. We therefore fix these parameters for the X l/2 states of ArBr and KrI at the same values found by Lee and co-workers.7
There are no reported experimental results for the ArI complex. We therefore require a means of accurately estimat- ing rm and E for one of the neutral electronic states. This is done by modification of the simple correlation formulae for rm and E in terms of atomic polarizabilities (in A3) proposed by Pirani et d3*
R,= 1.767 ,y + cry t%%)7 (‘Q; ~=0.72 2 (meV) (8) m
where y=O.O95. As will be discussed in Sec. V, Eqs. (8) should apply to
the II l/2 state when the halogen spin-orbit splitting is large. Nonetheless, a slight modification of the numerical coeffi- cients (1.728 for R, , 0.78 for E) is necessary to reproduce
our values of r, and E for the ZZ1/2 states of ArBr and KrI, and we use Eqs. (8) with these modified coefficients to de- termine rm and E for the ZZ1/2 state of ArI. We then deter- mine the anion potential and the potentials for the X1/2 and 1312 states applying the same procedure used for ArBr and KrI.
The Franck-Condon calculation generates a vibrational stick spectrum. To obtain a simulation that can be compared to the experimental spectrum, the stick spectrum must be convoluted with the factors that result in a nonzero finite experimental line width. These are considered in the follow- ing section.
C. Peak shape and rotational analysis
As mentioned previously, the peak shapes of the ZEKE spectra are asymmetric and change from band to band. In addition, the peak widths vary with source conditions. We explain the peak shape and width in terms of the asymmetric ZEKE experimental peak shape combined with the effect of the unresolved rotational structure associated with each vi- brational transition. Both effects are discussed in this section, with the main focus on how one treats the rotational contri- bution to the peak widths.
The ejected electron has spin s = l/2 and orbital angular momentum Z=O (only s-wave photodetachment is observed in anion ZEKE experiments25). Hence, the anion+neutral rotational selection rules are Aj= t 1/2,?3/2. Since indi- vidual rotational lines are not resolved in our spectra, several assumptions are required to simulate these transitions. For calculating the energies of the rotational transitions in each band, equilibrium rotational constants B, are assumed, using the r,,, values from the potentials obtained in the vibrational analysis discussed above.
The more difficult aspect of the rotational analysis in- volves calculating the relative intensities of the rotational transitions in each band. Xie and Zare39 derived an expres- sion for the photoionization probability of a diatomic mol- ecule conforming to Hund’s case (b) in terms of a general- ized rotational line strength factor and the reduced multipole moments. Here, we adapt this approach to a Hund’s case (c) molecule. The results are valid for photodetachment as well as photoionization. Although we do not resolve individual rotations in the spectra presented in this paper, the results presented below should be useful for future investigations in
TABLE IV. Quantum number nomenclature for rotational analysis.
Angular Molecule-Fixed Space-Fixed Momentum Projection Projection Description
J n M Total angular momentum of neutral
J- n- M- Total angular momentum of anion
i 0 m Total photoelectron angular momentum (orbital+spin)
1 CL I-% Angular momentum of photon k 4 P Vector sum of photon and
photoelectron angular momenta
Zhao et al.: Study of the ArBr-, Arl-, and Krl- 6543
J. Chem. Phys., Vol. 101, No. 8, 15 October 1994

6544 Zhao et a/.: Study of the ArBr-, Art-, and Krl-
which rotational structure is resolved. Moreover, the final expressions obtained are quite simple, and result in a very satisfactory fitting of the peak shapes.
The eigenstates of a case (c) molecule are represented by
InJcMu)= lJm4)lni-qu), (9) where the angular momentum quantum numbers are defined in Table IV; u is the vibrational quantum number, and n represents the remaining quantum numbers. On the right side of Eq. (9) we have assumed the Born-Oppenheimer approxi- mation and independence of rotational from vibrational de- grees of freedom to separate the eigenstate into rotational, electronic, and vibrational parts. The detached electron is assumed to be well approximated asymptotically by a partial wave expansion in a spherically symmetric potential.40 The eigenstate of a given electron partial wave in the coupled representation appropriate to case (c) is Ijm), where j is the total (orbital and spin) angular momentum of the electron partial wave, and m its projection in the space-fixed frame. The electronic dipole operator transforms as a spherical ten- sor, T( l,&, under rotation. The photodetachment probabil- ity for a given electron angular momentum from rotational state J- of the anion to state J of the neutral is then (neglect- ing constants and the vibrational eigenvectors)
qJ-,J)=C c I(Jfw(~~l
We transform the dipole operator and electron eigen- states to the molecule fixed frame using the Wigner rotation matrices as defined by Zare4’
m*Po)=C ~~~,(R)m4? cc
(Ml =C [~i,:(~>l+(~47 lo (11)
where R stands for the Euler angles 4, ~3, and x, and the angular momentum quantum numbers are defined in Table IV.
The rotational eigenfunctions are
m hi&-
X(jmIT( l,~o)ln-~n-)IJ-~n-M-)12. (10) Substituting Eqs. (11) and (12) into Eq. (10) gives
Pj(J-,J)K
(25+ 1)(2J-+ 1) (f3~*)* z M.- I(- l)“-R+m+‘o+M--n-~ (- I)--‘( I o’Mn(R)D’,,(R)o’,,_,(R)
P,*
XL&--,-(R)dR (nRl(jolT(l,~)ln-n->l*, )
where all the dependence on angular nuclear coordinates is contained in the integral over the four rotation matrices.
To evaluate the integral over the four rotation matrices, we expand those from the detached electron and dipole op- erator in a Clebsch-Gordon series4’
D;m(R)D\po-p=( - l)P-qc (2kf 1) k
4: -:, ;) x(; -; &,-JR) (14)
with
k= 1 +j,...,(1 -j(,
p=p0-m,
(12)
(13)
I
q=p--w.
Substituting this into Eq. (13) we obtain an integral over three rotation matrices4’
I o’Mn(R)04,-,(R)DJ--~-(R)dR
J- k J =a,rr* M- p ( i(
J- k J
1 -M n- q -iI.
Using Eqs. (14) and (15) in Eq. (13) we obtain
(15)
J. Chem. Phys., Vol. 101, No. 8, 15 October 1994
Zhao et al.: Study of the ArBr-, Arl-, and Krl- 6545
Pj(J-,J)a(2J+ 1)(2J-+ 1)x C I(- l)“-n+m+~O+M--n-+p m lu,lu-
T Ok+l)(; -1, ;)
J )x (-1)-p-y-4( j, 1, ~)(~nl(jwlT(1,1*)l~-~-)12. n-i-I-- --R W-3
LW
The condition q=R-CL- (i.e., p+s1-=w+fi) determines the electronic selection rules.
The M and M - dependent terms in the square of the sum over k for a given k’ and k” give rise to sums
1 = ~ i&k!,
2k’fl
(17)
so that the cross terms vanish,39 leaving
Pj(J-,J)af C Sk(J-,J)IPj(k,q)12* k
Here, following Xie and Zare,39 we define the rotational line strength factor
s,(J-,J)=(zJ+ 1)(2J-+ 1)
I( J- k J *
x cl- cl-cl- -n )I (19)
which contains all the J and J- dependence, and a general- ized multipole transition moment
I/+(k,q)l2=(2k+ 1) 2 (-1)-p-@-q l&w (: 1, :)
X(nnl(jop( l,/L)ln-n-) *. (20)
In anion ZEKE spectroscopy, j= l/2 (because I=0 for the detached electron) and Eq. (18) becomes
P~,~(J-~J)o:C~,~S~,~(J-,J)+S~,~(J-,J) (21)
with
(22)
For s-wave detachment, AJ= J- -J= 2 l/2,+3/2. Ex- pressions for the line strength factors for transitions from n-=0 to Q=1/2 (X1/2 and ZZ1/2 states) and to a=3/2 (13/2 state) for each of the allowed branches are given in Table V. Note that S112(J-,J) vanishes for the AJ=+-3/2 branches of the transitions to R=1/2 states and for all branches of transitions to the fi=3/2 state.
One can calculate a rotational stick spectrum by multi- plying Eq. (21) by a Boltzmann factor, treating the coeffi- cient Cln (for the fi= l/2 neutral states) as an adjustable parameter. To obtain realistic peak shapes, the rotational lines must be convoluted with the empirically determined ZEKE instrumental line shape. Based on our results for the
atomic halides:’ the ZEKE line shape is represented by a linearly rising edge on the low energy side followed by an exponentially decaying tail
y= 1 -k.(Eo-E), i i
Eo-k GE-CEO,
y=exp(a.((E-Eo)-b)2)- 1, EoSE<(Eo+b); (23)
where b=3.1895XFWHM, a=ln 2/b*, k=2/FWHM. Here, E, E,, and FWHM are all in units of meV, and E. is the calculated energy of the rovibronic transition.
Figure 5 shows how both of these effects contribute to a single vibrational feature in the KrI- ZEKE spectrum. The solid lines show the effect of rotational structure alone. These were obtained by adding up the rotational sticks within each energy interval of 0.5 cm-‘. The rotational con- stants used reflect the anion and neutral r,,, values for KrI, for which r,< ran< rI< rll (see below). A rotational temperature of 40 K is assumed, consistent with previous experiments in which we were able to resolve individual rotational transitions.25 The peaks are shaded towards the blue in the X1/2 band and towards the red in the 1312 band and II l/2 band. The dotted lines in Fig. 5 show the result of convolut- ing the individual rotational lines with the ZEKE instrumen- tal peak shape; the FWHM of the ZEKE peak is assumed to be 4.0 cm-‘. This makes the X1/2 band shade further to- wards the blue and makes the other two bands more sym- metrical, in qualitative agreement with experiment.
In simulating the experimental spectra, a least-squares fit is used to determine the parameters FWHM, C,, [Eq. (21)], and Clx, which determines the relative intensities of the Z3/2 and X1/2 bands. The rotational temperature was fixed at 40 K; this procedure was used because the ZEKE line- width and rotational temperature are highly correlated, and
TABLE V. Rotational line strengths for transitions to three neutral states.
AJ SUAJ-94 s,,,u-.J)
I312 X1/2 or II112 1312 X1/2 or 11112
0 J--F1 3(3-+ l)(J-+2) J-(J-+1) 2(2.-+3) ~ 2(21-+3)
3J-(J-- 1) J-(J-+1) 2(21--l) - 2(2r- 1)
0 (J-+2)(J-+3) 3(J- + l)(J- +2) 2(2.- +3) 2(2r +3)
3 (J-- l)(J--2) 3J-(J- 1) - -- 2 0 0 [email protected] 1) 2(2x-l)
J. Chem. Phys., Vol. 101, No. 8, 15 October 1994
6546 Zhao et a/.: Study of the ArBr-, Ari-, and Krl-
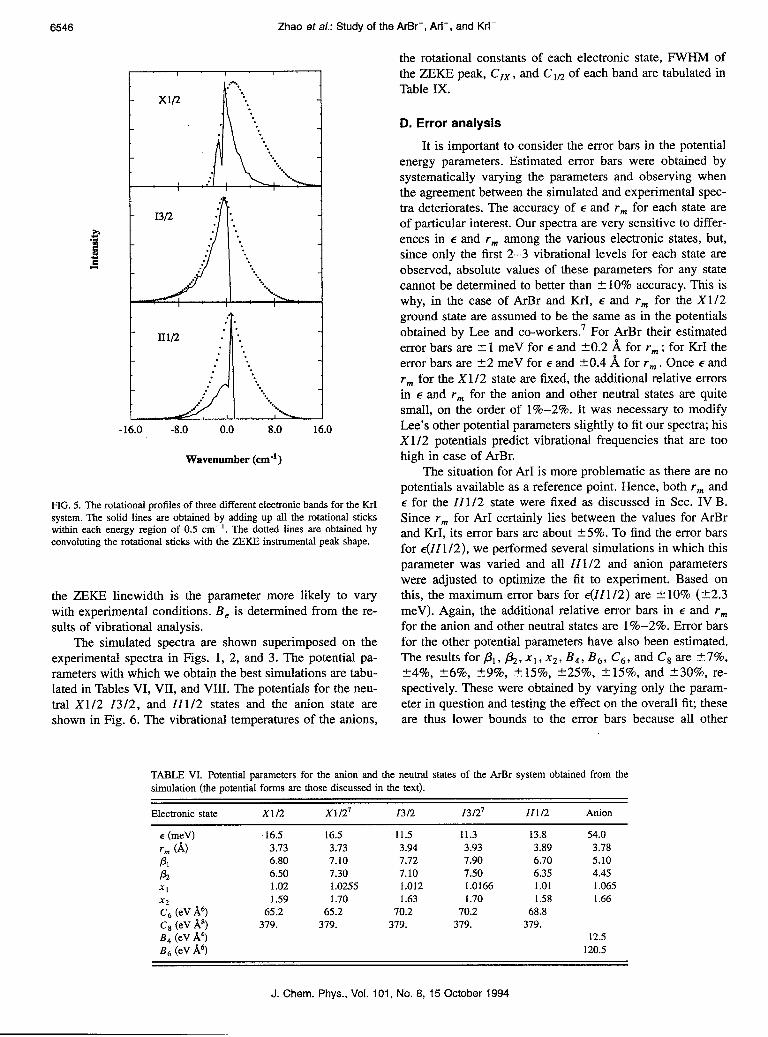
-16.0 -8.0 0.0 8.0
Wavenumber (cm-‘)
PIG. 5. The rotational profiles of three different electronic bands for the KrI system. The solid lines are obtained by adding up all the rotational sticks within each energy region of 0.5 cm-‘. The dotted lines are obtained by convoluting the rotational sticks with the ZEKE instrumental peak shape.
the ZEKE linewidth is the parameter more likely to vary with experimental conditions. B, is determined from the re- sults of vibrational analysis.
The simulated spectra are shown superimposed on the experimental spectra in Figs. 1, 2, and 3. The potential pa- rameters with which we obtain the best simulations are tabu- lated in Tables VI, VII, and VIII. The potentials for the neu- tral X1/2 Z3/2, and ZZ1/2 states and the anion state are shown in Fig. 6. The vibrational temperatures of the anions,
the rotational constants of each electronic state, FWHM of the ZME peak CIX , and Cm of each band are tabulated in Table IX.
D. Error analysis
It is important to consider the error bars in the potential energy parameters. Estimated error bars were obtained by systematically varying the parameters and observing when the agreement between the simulated and experimental spec- tra deteriorates. The accuracy of E and rm for each state are of particular interest. Our spectra are very sensitive to differ- ences in E and r,,, among the various electronic states, but, since only the first 2-3 vibrational levels for each state are observed, absolute values of these parameters for any state cannot be determined to better than f 10% accuracy. This is why, in the case of ArBr and KrI, E and r, for the X1/2 ground state are assumed to be the same as in the potentials obtained by Lee and co-workers.7 For ArBr their estimated error bars are t 1 meV for l and +0.2 8, for rm ; for KrI the error bars are +2 meV for E and to.4 A for rm . Once E and r, for the X1/2 state are fixed, the additional relative errors in E and rm for the anion and other neutral states are quite small, on the order of l%-2%. It was necessary to modify Lee’s other potential parameters slightly to fit our spectra; his X1/2 potentials predict vibrational frequencies that are too high in case of ArBr.
The situation for ArI is more problematic as there are no potentials available as a reference point. Hence, both r,,, and E for the 11112 state were fixed as discussed in Sec. IV B. Since r,,, for ArI certainly lies between the values for ArBr and KrI, its error bars are about ?5%. To find the error bars for e(ZZ1/2), we performed several simulations in which this parameter was varied and all ZZ1/2 and anion parameters were adjusted to optimize the fit to experiment. Based on this, the maximum error bars for E(ZZ1/2) are + 10% (22.3 meV). Again, the additional relative error bars in E and r,,, for the anion and other neutral states are l%-2%. Error bars for the other potential parameters have also been estimated. Theresultsfor/3t,,&,x1,x2,B4,B6, Cg,andCsare +7%, t4%, 26%, +9%, t15%, +25%, +15%, and t30%, re- spectively. These were obtained by varying only the param- eter in question and testing the effect on the overall fit; these are thus lower bounds to the error bars because all other
TABLE VI. Potential parameters for the anion and the neutral states of the ArBr system obtained from the simulation (the potential forms are those discussed in the text).
Electronic state x1/2 x1127 1312 i3/27 II112 Anion
l (meV) rm (A) Pl
a
XI
x2
C6 (eV A6) C8 (eV As) B4 (eV A4) B, (eV A6)
16.5 16.5 3.73 3.73 6.80 7.10 6.50 7.30 1.02 1.0255 1.59 1.70
65.2 65.2 379. 379.
11.5 11.3 13.8 54.0 3.94 3.93 3.89 3.78 7.72 7.90 6.70 5.10 7.10 7.50 6.35 4.45 1.012 1.0166 1.01 1.065 1.63 1.70 1.58 1.66
70.2 70.2 68.8 379. 379. 379.
12.5 120.5
J. Chem. Phys., Vol. 101, No. 8, 15 October 1994
parameters were fixed. One conclusion we draw from the error analysis is that changes in the parameters representing the long range interactions (i.e., B,, B,, Cs, and Cs) are not sensitive to the spectral features observed in our spectra. We are more sensitive to the bottom of the potential than to the long range attractive region. This situation differs from our earlier study of I-CO2 in which more extended vibrational progressions were observed.’
As for the parameters involved in the least-square fitting of the peak shapes, their error bars are directly determined from the fitting procedure. The error bars in FWHM are 20.5 cm-‘, those in C,x are kO.04, while those in C,, are typically much larger, ranging up to several hundred percent. Hence, this last parameter plays a small role at best in deter- mining the peak shapes; the observed variations in peak shapes are primarily due to the differences in rotational con- stants among the various electronic states.
V. DISCUSSION
In this section, we examine in more detail some features of the RgX- and RgX potential energy curves obtained in the previous section. Several different trends in the E and r,,, parameters will be summarized. The first point to consider is the change in the Rg-X bond length upon photodetachment. For weakly bound molecules or ions, the length of the weak bond is determined by the strength of the attractive interac- tion and the sizes of the atoms involved in the bond. In our case, these two factors compete: The anion is more strongly bound than the neutral, but I- (or Br-) is larger than I (or Br). Our results show the same trend in relative bond lengths for each Rg-X system: rx112< rtion<rlll12<r13/2. The trend in well depths for each system is e13/2cE111/2<EX1/2cE,ion.
The above trend in bond lengths differs from the I-CO, system, for which ranion<rX1,2<r1,,,2<r13,2.5 The relatively shorter bond length in I-CO2 is consistent with the large binding energy of I-CO, (e=2 12 meV>, compared to the X1/2 IC02 well depth of 44.5 meV. In contrast, the differ- ences between the RgX- and RgX well depths are not as large. The I.CO, system shows the same trends in well depths as the RgX systems: ~,3/2< ~1,1,2< ~X1,2< E,ion.
A comparison of the different RgX systems with each other shows that for each neutral state, r,(ArBr)<r,(ArI)<r,(KrI), and E(ArBr)<&.rI)<E(KrI). The trend in anion rm values is the same as in the neutral: r,(ArBr-)<r,(ArI-)<r,(KrI-). However, the ordering of the anion well depths is e&I-)<E(ArBr-)<e(KrI-), which differs from the neutrals. The trends in anion and neutral bond lengths are consistent with the atomic sizes. The neutral well depths follow the same trends as in the interactions between the analogous closed shell atoms, namely that ~(ArKr)<fi(ArXe)<~(KrXe).~
The ordering of the anion well depths can be understood considering that the well depth for a Rg-X- complex is determined by the balance between short range repulsion and the long range attraction between the charge of X- and the polarizability of the rare gas atom. Since the amount of charge for Br- and I- is the same, and the polarizability of Kr is larger than that of Ar, we expect KrI- to have the
deepest potential well. Comparing At-BY and ArI-, we have the same amount of charge interacting with the same polar- izability. However, since Br- is smaller than I-, Br- should lie closer to Ar than I- does, resulting in a slightly larger well depth for ArBr-. These considerations would lead one to predict that &I-)<e(KrBr-), and we have recently con- firmed this?2
The only other detailed experimental results for the ArBr and KrI potentials come from the differential cross section measurements of Lee and co-workers.7 In Tables VI and VIII, our potential functions for the X1/2 and 1312 states of ArBr and KrI are compared to those derived from the scat- tering experiments. These experiments are fundamentally different from ours in that (a) in principle, they probe the entire Rg-X potential including the long range attraction and repulsive wall (at least up to the collision energies used in their experiments), and (b) they provide absolute values for rm and E. For example, the rainbow maximum in the differ- ential cross section (only partially resolved in Ref. 7) is di- rectly related to the well depth. In contrast, our experiment is more sensitive to the Franck-Condon region near the poten- tial energy minimum and less sensitive to the repulsive wall above the dissociation limit and, for the complexes reported in this paper, the long range attractive part of the potential. Also, in our experiment, the contributions of the X1/2 and Z3/2 states are clearly separated, whereas this is not the case in the scattering experiments. Finally, as mentioned earlier, the molecular beam experiments provide no information on the ZZ1/2 state because of the negligible Br* and I* popula- tions in the halogen atom beams, so our experiments provide the first detailed characterization of these potentials.
In spite of the differences between the two sets of ex- periments, our potential functions for the X1/2 and 1312 states are quite similar to those obtained by Lee. This is perhaps not so surprising for the Xl I2 states. As discussed above, the E and r,,, values for our X1/2 states were fixed at the values obtained by Lee. However, it was necessary to change /It and p2 for ArBr slightly in order to reproduce our vibrational frequencies. These parameters affect the curva- ture at the bottom of the potential energy well.
For the Z3/2 states, the largest discrepancy between the spectroscopy and scattering experiments is in the KrI well depths (16.7 vs 15.6 meV). Once the X1/2 well depth is known, the Z3/2 well depth is determined by Eq. (7), so we
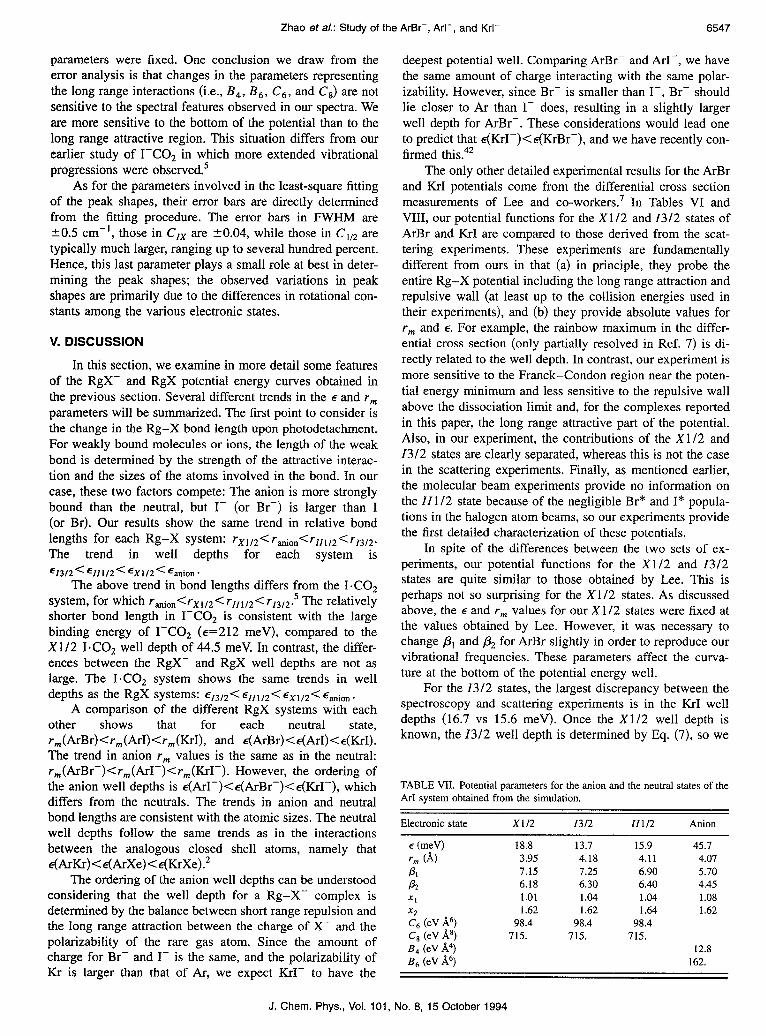
TABLE VII. Potential parameters for the anion and the neutral states of the ArI system obtained from the simulation.
Electronic state
l (meV) rm (A)
2 XI x2
C, (eV A6) C8 (eV As) B, (eV A4) B, (eV A6)
x1/2 1312 11112 Anion
18.8 13.7 15.9 45.7 3.95 4.18 4.11 4.07 7.15 7.25 6.90 5.70 6.18 6.30 6.40 4.45 1.01 1.04 1.04 1.08 1.62 1.62 1.64 1.62
98.4 98.4 98.4 715. 715. 715.
12.8 162.
Zhao et al.: Study of the ArBr-, Arl-, and Krl- 6547
J. Chem. Phys., Vol. 101, No. 8, 15 October 1994

6548 Zhao et al.: Study of the ArBr-, Arl-, and Krl-
TABLE VIII. Potential parameters for the anion and the neutral states of the KrI system obtained from the simulation.
Electronic state XII2 x1/2’ I312 1312’ III/2 Anion
e (meV) 23.85 23.85 16.7 15.6 20.2 67.2 r, 6) 4.05 4.05 4.32 4.32 4.20 4.11 Pl 5.80 5.70 6.72 6.80 6.38 5.44 a 6.12 6.10 6.48 6.30 6.25 4.55 XI 1.08 1.1136 1.11 1.11 1.09 1.04 x2 1.77 1.85 1.64 1.70 1.70 1.54 C6 (eV A6) 141. 141. 141. 141. 141. C, (eV As) 908. 908. 908. 908. 908. B4 (eV A4) 20.2 B, (eV A6) 238.
believe our value is more accurate. We also obtained a better fit to our spectra using slightly different values for /3i and pZ. Nonetheless, the overall agreement from the two experi- ments is quite good, providing strong support for the validity of the potential functions.
Our results for the anion potentials can be compared to those based on the gaseous ion transport data which were reported by AlbrittonzO and McDaniel.” McDaniel and Viehlandz3 obtained the interaction potentials on some of RgX- complexes from the inversion of the mobility mea- surement results. McDaniel’s results on ArBr- (~=59 meV, r,=3.72 A) agree reasonably well with our results (e=54 meV, t-,=3.78 A), while Viehland’s results on ArBr- (~=82 meV, r,=3.39 A) and ArI- (~=76 meV, r,=3.62 A) repre- sent significantly stronger binding than our values (for AC, ~=45.7 meV, r,=4.07 A). The error bars in the E and rm
ArBr ArI KrI
&I -3 p’: 1312
W 3 4s L- x112
$ .)3 E
tt
Anion
‘k 0 I .#I -
Ik--l ‘,-
kI-l a
28 II 1‘ 53 u 7.3 u ll Y II n &I 73 I.2 28 II u 53 u 1.3 u
RR~X (A)
FIG. 6. The anion and neutral adiabatic potential energy curves resulting from our fit to the ZEKE spectrum of ArBr-, AC, and KC.
parameters from the ion transport data were estimated to be ?20%-25%, but our values for E are still outside the range of Viehland’s values.
There has been a considerable effort over the years to develop predictive models for key features of the potential function between weakly interacting species.2 These include (a) the development of combining rules?3-45 in which one aims to predict r,,, and E for two unlike rare gas atoms based on the results for the homonuclear dimers, (b) the search for “universal” potential functions that can be applied to a large variety of systems by changing only a small number of parameters,46 and (c) the development of simple expressions for rm and E based on the properties of the separated atoms.38 While most of this work is aimed at rare gas dimers, some of the results can be applied to the isotropic component of the interaction between rare gas and halogen atoms, and to the rare gas-halide interaction as well.
To compare our results for the neutral RgX potentials with any of these models, we need to extract the isotropic component of the potential energy function from the three experimental potentials. This is done as follows. In the ab- sence of spin-orbit coupling, the interaction potential be- tween a rare gas and a halogen atom can be written as4
V(r,0)=Vo(r)+V2(r)P2(cos t?), (24)
where r is the internuclear distance and 8 is the angle be- tween the unfilled p orbital on the halogen atom and the internuclear axis. Here, V,(r) represents the spherical com- ponent of the interaction potential, while V,(r) represents the anisotropic component due to the half-filled p orbital on the halogen atom. Haberland3 and Aquilanti et ~1.~ showed that, if the spin-orbit coupling A is assumed independent of the internuclear distance, then the three potentials V(X1/2), V(Z3/2), and V(ZZ1/2) are related to V,(r) and V,(r) by (with A>O)
V(X1/2)=V,+ ;+ ;- $ & V;+A2-; V2A 112
,
V(Z3/2)= V,- $,
J. Chem. Phys., Vol. 101, No. 8, 15 October 1994
Zhao et al.: Study of the ArBr-, Arl-, and Krl-
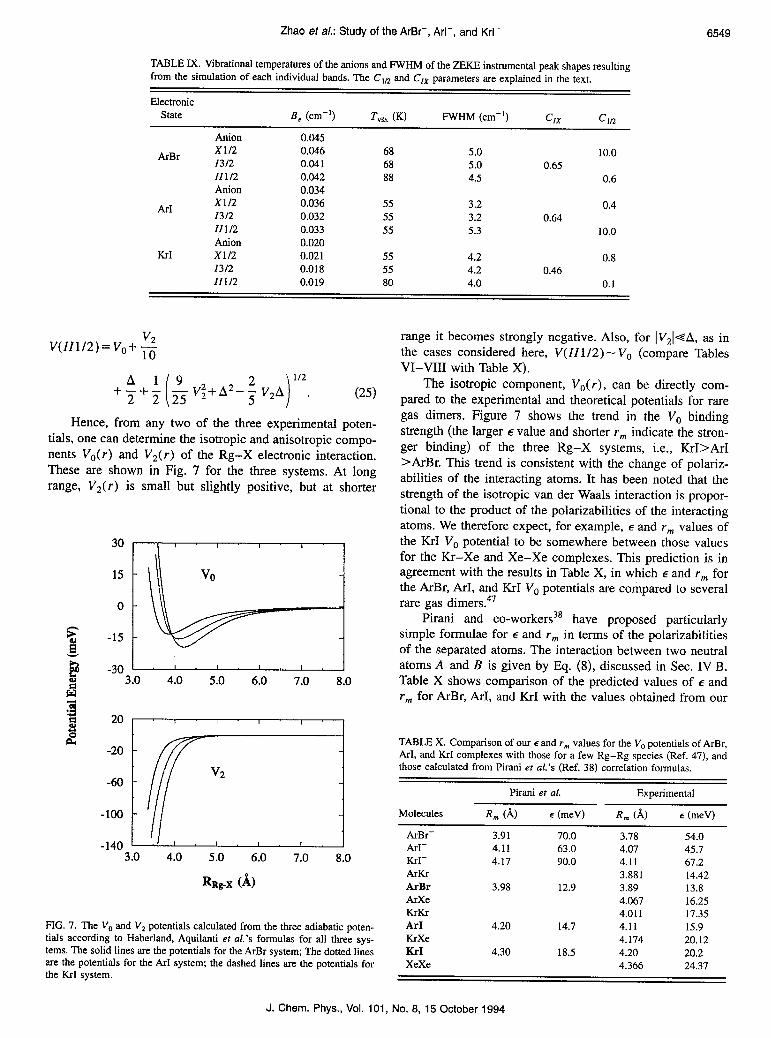
TABLE IX. Vibrational temperatures of the anions and FWHM of the ZEKE instrumental peak shapes resulting from the simulation of each individual bands. The Cm and C,x parameters are explained in the text.
Electronic State
ArBr
ArI
KrI
Anion x1/2 1312 II112 Anion x1/2 I312 II112 Anion x112 13l2 II112
B, (cm-‘)
0.045 0.046 0.041 0.042 0.034 0.036 0.032 0.033 0.020 0.021 0.018 0.019
Tvib. W FWHM (cm-‘) CIX Cl/z
68 5.0 10.0 68 5.0 0.65 88 4.5 0.6
55 3.2 0.4 55 3.2 0.64 55 5.3 10.0
55 4.2 0.8 55 4.2 0.46 80 4.0 0.1
112 . (25)
Hence, from any two of the three experimental poten- tials, one can determine the isotropic and anisotropic compo- nents V,(r) and V2( r) of the Rg-X electronic interaction. These are shown in Fig. 7 for the three systems. At long range, V2(r) is small but slightly positive, but at shorter
3o r-----l 15 -
0 -
E -15 - .3
p -303!o 410 510 610 710 . *lo W
$ 20 1 I . 1 I
J! -20 -
-60 -
-100 -
-140 I I I I 3.0 4.0 5.0 6.0 7.0 8.0
RR~-x <A>
FIG. 7. The V, and V2 potentials calculated from the three adiabatic poten- tials according to Haberland, Aquilanti et al.‘s formulas for all three sys- tems. The solid lines are the potentials for the ArBr system; The dotted lines are the potentials for the ArI system; the dashed lines are the potentials for the KrI system.
range it becomes strongly negative. Also, for IV,I-+A, as in the cases considered here, V(ZZ1/2) - V, (compare Tables VI-VIII with Table X).
The isotropic component, Vo(r), can be directly com- pared to the experimental and theoretical potentials for rare gas dimers. Figure 7 shows the trend in the V. binding strength (the larger E value and shorter rm indicate the stron- ger binding) of the three Rg-X systems, i.e., KrI>ArI >ArBr. This trend is consistent with the change of polariz- abilities of the interacting atoms. It has been noted that the strength of the isotropic van der Waals interaction is propor- tional to the product of the polarizabilities of the interacting atoms. We therefore expect, for example, E and r,,, values of the KrI V. potential to be somewhere between those values for the Kr-Xe and Xe-Xe complexes. This prediction is in agreement with the results in Table X, in which E and r,,, for the ArBr, ArI, and KrI VO potentials are compared to several rare gas dimers.47
Pirani and co-workers3* have proposed particularly simple formulae for E and r,,, in terms of the polarizabilities of the separated atoms. The interaction between two neutral atoms A and B is given by Eq. (8), discussed in Sec. IV B. Table X shows comparison of the predicted values of E and rm for ArBr, ArI, and KrI with the values obtained from our
TABLE X. Comparison of our l and r,,, values for the V,, potentials of ArBr, ArI, and KrI complexes with those for a few Rg-Rg species (Ref. 47), and those calculated from Pirani et al.‘s (Ref. 38) correlation formulas.
Molecules
ArBr- ‘4rr Krr ArKr ArBr ArXe KrKr ArI KrXe IcrI XeXe
Pirani et al.
R, 6) l (meV)
3.91 70.0 4.11 63.0 4.17 90.0
3.98 12.9
4.20 14.7
4.30 18.5
Experimental
Rm (A) 8 (meV)
3.78 54.0 4.07 45.7 4.11 67.2 3.881 14.42 3.89 13.8 4.067 16.25 4.011 17.35 4.11 15.9 4.174 20.12 4.20 20.2 4.366 24.37
J. Chem. Phys., Vol. 101, No. 8, 15 October 1994

V,(r) potentials. The table shows that the predicted rm val- ues are 2%-3% too long, while the predicted E values are too small by about 8%. We note that the scaling factors in Eq. (8) are derived from considering several rare gas dimers. While these formulas predict r,,, and E for other rare gas dimers very accurately, they appear to be slightly less accurate for open shell interactions.
Pirani and co-workers38 have also proposed formulas analogous to Eq. (8) for the A--B (negative ion-neutral) interaction
R,= 1.767 cyy3 -I- iY;t3
[aA-aB(l +P)Y Lb
6=5.20X IO3 $ (lfp) (mev); m
where
aA- ffB
‘= [ 1 + (hA- /aB)2’3]“;‘2-
Again the predicted rm values are too large by 2%-3%, and the calculated E values for A--B interactions are ca. 30% too large. These discrepancies are not surprising given that there is little prior reference data on ion geometries from which to construct accurate scaling factors, and we hope that the data presented here will help alleviate this situation.
We next consider the anisotropic part of the Rg-X po- tential. Figure 7 shows that at long rRgex range, the anisot- ropy, is very small, while at shorter range, V2 becomes in- creasingly more negative. The small long range anisotropy is from the anisotropy in the polarizability of the halogen atom, while the much larger shorter range anisotropy is attributed to significant state mixing between the ground covalent states and the strongly bound excited ionic states.4’7’19 As pointed out by Hay and Dunning,” in lowering the ionic Rgf +X- asymptote relative to the covalent Rg+X limit, the amount of the ionic character mixed into the covalent states is increased. Given the values of electron affinity of Br and I [EA(Br)>EA(I), see Sec. IV B] and the ionization potentials of Ar and Kr [IP(Ar)=15.76 eV, IP(Kr)=14.00 eV], the separation of the ionic and neutral asymptotes increases ac- cording to KrI<ArI<ArBr. One therefore expects the mag- nitude in the shorter range anisotropies to be KrI>ArI >ArBr. This is confirmed in Fig. 7. KrI has the largest magnitude of V, due to the lower IP value of Kr atom.
We close the discussion by comparing the Kr- results to our earlier study of I-CO2.5 The isotropic polarizability of CO2 is 2.9 11 A3, which is slightly larger than that of Kr. In applying the analysis of Eqs. (24) and (25) to the neutral potentials of I.C02, we found that for Vo(r), r,=4.08 A and ~=32 meV. These values indicate somewhat stronger binding than in KrI (see Table X), probably due to the inter- action of the CO2 quadrupole moment with the I atom polar- izability in I.C02. There is a much greater difference in the binding strength between I-CO,(e=212 meV, r,=3.77 A) and KrI-(~=67 meV, r,=4.11 A). This can not simply been explained on the basis of the extra charge-quadrupole inter- action present in I-C02. In fact, our photoelectron spectrum
6550 Zhao et a/.: Study of the ArBr-, Arl-, and Krl-
of I-CO248 shows that the CO2 moiety is slightly bent in the anion. One might expect this to significantly increase the attractive interaction with the I-, since bent CO2 has a dipole moment, and the comparison with the KrI- results strongly suggests that this is indeed the case.
VI. CONCLUSIONS
We have used anion ZEKE spectroscopy to study the ArBr-, ArI-, and Kr- rare gas halide anions and corre- sponding open shell van der Waals complexes resulting from photodetachment of these anions. The open shell complexes have three low-lying states resulting from the electronically anisotropic interaction of Br or I(2P3,2,1,2) with a rare gas atom (Ar or Kr), and all three are accessible by anion pho- todetachment. The ZEKE spectra show well-resolved vibra- tional progressions in the low frequency modes of the anion and the three neutral electronic states. These results represent the first observation of vibrational structure for these anion and neutral states. From the spectra, we are able to construct potential energy curves for the anion and the three neutral electronic states for these three complexes. These are com- pared to the potentials previously determined for ArBr and KrI from scattering experiments, and for the rare gas halides from ion mobility measurements.
We plan to apply this technique to study more of Rg-X complexes and larger clusters involving multiple rare gas atoms bound to a halide ion. Preliminary experimental re- sults have already been obtained on KrBr-, XeBr-, AK-, KrC-, and XeCl- in our laboratory, as well as polyatomic Br-(Ar), and I-&), clusters. The trends resulting from this work will provide significant insight into the nature of the interactions in weakly bound neutral and anion complexes.
ACKNOWLEDGMENTS
This research is supported by the Air Force Office of Scientific Research under Grant No. AFOSR-94-00598. G.R. thanks the Deutsche Forschungsgemeinschaft for a postdoc- toral fellowship.
‘G. C. Maitland, M. Rigby, E. B. Smith, and W. A. Wakeham, Intermolecu- lar Forces (Oxford University, Oxford, 1981).
‘R. A. Aziz, in Inert Gases, edited by M. L. Klein (Springer, Berlin, 1984), pp. 5-86.
3H. Haberland, 2. Phys. A 307, 35 (1982). 4V. Aquilanti and G. Grossi, J. Chem. Phys. 73, 116.5 (1980); V. Aquilanti,
G. Liuti, F. Pirani, and F. Vecchiocattivi, J. Chem. Sot., Faraday Trans. 2 85, 955 (1989).
‘Y. Zhao, C. C. Arnold, and D. M. Neumark, J. Chem. Sot. Faraday Trans. 89, 1449 (1993).
6(a) C. H. Becker, P. Casavecchia, and Y. T. Lee, J. Chem. Phys. 69, 2377 (1978); (b) ibid. 70, 2986 (1979); (c) C. H. Becker, J. J. Valentini, P. Casavecchia, S. J. Sibener, and Y. T. Lee, Chem. Phys. Lett. 61, 1 (1979).
7(a) P. Casavecchia, G. He, R. K. Sparks, and Y. T. Lee, J. Chem. Phys. 75, 710 (198 I); (b) P. Casavecchia, G. He, R. Sparks, and Y. T. Lee, ibid. 77, 1878 (1982).
8V. Aquilanti, R. Condori, and F. Pirani, J. Chem. Phys. 89, 6157 (1988). 9(a) V. Aquilanti, E. Luzzatti, F. Pirani, and G. G. Volpi, J. Chem. Phys. 89,
6165 (1988); (b) V. Aquilanti, R. Condori, D. Cappelletti, V. Lorent, and F. Pirani, Chem. Phys. 145, 293 (1990).
“(a) V. Aquilanti, D. Cappelletti, V. Lorent, E. Luzzatti, and F. Pirani, Chem. Phys. Lett. 192, 153 (1992); (b) V. Aquilanti, D. Cappelletti, V. Lorent, E. Luzzatti, and F. Pirani, J. Phys. Chem. 97, 2063 (1993).
“J. E. Velazco and D. W. Setser, J. Chem. Phys. 62, 1990 (1975); G. Inoue,
J. Chem. Phys., Vol. 101, No. 8, 15 October 1994

Zhao et a/.: Study of the A&W, Ad-, and Krl- 6551
I. K. Ku. and D. W. Setser, ibid. 76, 733 (1982); G. Lo and D. W. Setser, ibid. 100, 5432 (1994).
“J J Ewing and C. A. Brau, Phys. Rev. A 12, 129 (1975); C. A. Brat’ and . . J. J. Ewing, J. Chem. Phys. 63, 4640 (1975); J. J. Ewing and C. A. Brau, Appl. Phys. I.&t. 27, 350 (1975); C. A. Brau and J. J. Ewing, ibid. 27,435 (1975).
‘“J. Tellinghuisen, J. M. Hoffman, G. C. Tisone, and A. K. Hays, J. Chem. Phys. 64, 2484 (1976); J. Tellinghuisen, G. C. Tisone, J. M. Hoffman, and A. K. Hays, ibid. 64, 4796 (1976); J. Tellinghuisen, A. K. Hays, J. M. Hoffman, and G. C. Tisone, ibid. 65, 4473 (1976); P. C. Tellinghuisen, J. Tellinghuisen, J. A. Coxon, J. E. Velazco, and D. W. Sester, ibid. 68, 5187 (1978); A. Sur, A. Hui, and J. Tellinghuisen, J. Mol. Spectrosc. 74, 465 (1979).
14M. F. Golde and B. Thrush, Chem. Phys. Lett. 29, 486 (1974); M. F. Golde, J. Mol. Spectrosc. 58, 261 (1975); M. P. Casassa, M. F. Golde, and A. Kvamn, Chem. Phys. Lett. 59, 51 (1978); M. F. Golde and A. Kvaran, J. Chem. Phys. 72, 434 (1980); 442 (1980).
“A. L. Smith and P C. Kobrinsky, J. Mol. Specuosc. 69, 1 (1978). 16C Jouvet, C. Lardeux-Dedonder, and D. Solgadi, Chem. Phys. Lett. 156,
569 (1989). 17D. L. Monts, L. M. Ziurys, S. M. Beck, M. G. Liverman, and R. E.
Smalley, J. Chem. Phys. 71, 4057 (1979). “R B. Jones, J. H. Schloss, and J. G. Eden, J. Chem. Phys. 98, 4317
(1993); J. H. Schloss, R. B. Jones, and J. G. Eden, ibid. 99, 6483 (1993). 19(a) T. H. Dunning and P J. Hay, Appl. Phys. Lett. 28, 649 (1976); (b) P. J.
Hay and T. H. Dunning, Jr., J. Chem. Phys. 66, 1306 (1977); (c) T. H. Dunning and P. J. Hay, ibid. 69, 134 (1978); (d) P. J. Hay and T. H. Dunning, Jr.. ibid. 69, 2209 (1978).
*‘I. Dotan and D. L. Albritton, ibid. 66, 5238 (1977). “M. G. Thackston, F. L. Eisele, H. W. Ellis, E. W. McDaniel, and I. R.
Gatland, J. Chem. Phys. 73, 3183 (1980). 22D R Lamm, R. D. Chelf . J R. Twist, F. B. Holleman, M. G. Thackston, I .
F. L. Eisele, W. M. Pope, I. R. Gatland, and E. W. McDaniel, J. Chem. Phys. 79, 1965 (1983).
“C. C. Kirkpatrick and L. A. Viehland, Chem. Phys. 98, 221 (1985). 24Y. S. Kim and R. Cl. Gordon, J. Chem. Phys. 61, 1 (1974); R. Ahlrichs, H.
J. Bohm, S. Brode, K. T. Tang, and J. P. Toennies, ibid. 88, 6290 (1988); V. Kello and A. D. Sadlej, Chem. Phys. 157, 123 (1991); E. J. Mansky and M. R. Flannery, J. Chem. Phys. 99, 1962 (1993).
“T. N. Kitsopoulos, I. M. Wailer, J. G. Loeser, and D. M. Neumark, Chem. Phys. Len. 159, 300 (1989); C. J. Chick, Y. Zhao, and D. M. Neumark, J. Chem. Phys. 97, 6121 (1992).
26J. M. Bakker, J. Phys. E 6, 785 (1973). 27K. Miiller-Dethlefs, M. Sander, and E. W. Schlag, Z. Naturforsch Teil A
39, 1089 (1984); Chem. Phys. Lett. 12, 291 (1984); K. Miiller-Detblefs and E. W. Schlag, Ann. Rev. Phys. Chem. 42, 109 (1991).
*sD. 0. Harris, G. G. Engerholm, and W. D. Gwinn, J. Chem. Phys. 43, 1515 (1965).
*‘J. C. Light, I. P Hamilton, and J. V. Lill, J. Chem. Phys. 82, 1400 (1985). 30R. B. Metz, Ph.D thesis, University of California, Berkeley, 1991. 3’ J. C. Slater and J. G. Kirkwood, Phys. Rev. 37, 682 (193 1); see also K. S.
Pitzer, Adv. Chem. Phys. 61, 2372 (1974). 32Efandbook of Chemistry and Physics, 74th ed. (CRC, Boca Raton, 1994),
pp. 10-198. 33J. S. Cohen and R. T. Pack, J. Chem. Phys. 61, 2372 (1974). 34A. D. Koutselos and E. A. Mason, J. Chem. Phys. 85, 2154 (1986). 35H. Coker, J. Phys. Chem. 80, 2078 (1976). 36C. Blondel, l? Cacciani, C. Delsart, and R. Trainham, Phys. Rev. A 40,
3698 (1989). 37 H. Hotou and W. C. Lineberger, J. Phys. Chem. Ref. Data 14,73 1 (1985). 38(a) G. Liuti and E Pirani, Chem. Phys. Lett. 122, 245 (1985); (b) D.
Cappelletti, G. Liuti and F. Pirani, Chem. Phys. Lett. 183, 297 (1991); (c) R. Cambi, D. Cappelletti, G. Liuti, and F. Pirani, J. Chem. Phys. 95, 1852 (1991).
39J. Xie and R. N. Zare, J. Chem. Phys. 93, 3033 (1990); J. Xie and R. N. Zare, ibid., 97, 2891 (1992).
40 A. D. Buckingham, B. J. Orr, and J. M. Sichel, Philos. Trans. R. Sot. London, Ser. A 268, 147 (1970).
4’ R. N. Zare, Angular Momentum (Wiley, New York, 1988). 42G Reiser, I. Yourshaw, Y. Zhao, and D. M. Neumark (to be published). 43K: T. Tang and J. P. Toennies, J. Chem. Phys. SO,3725 (1984); K. T. Tang
and J. P. Toennies, Z. Phys. D 1, 91 (1986). 44J. Bzowski, E. A. Mason, and J. Kestin, Int. J. Thermophys. 9, 131 (1988). 45C. Douketis G Stoles, S. Marchetti, M. Zen, and A. J. Thakkar, J. Chem. 7 f
Phys. 76, 3057 (1982); G. Stoles, International J. Quantum Chem. S 24, 475 (1990).
&A. D. Koutselos, E. A. Mason, and L. A. Viehland, J. Chem. Phys. 93, 7125 (1990).
47D. A. Barrow, M. J. Slaman, and R. A. Aziz, I. Chem. Phys. 91, 6348 (1989).
48D W Arnold, S. E. Bradforth, E. H. Kim, and D. M. Neumark, J. Chem. . Phys. 97, 9468 (1992).
J. Chem. Phys., Vol. 101, No. 8, 15 October 1994


![[pgr]-Conjugated Anions: From Carbon-Rich Anions to](https://img.pdfslide.net/doc/110x75/62887182fd628c47fb7ebde3/pgr-conjugated-anions-from-carbon-rich-anions-to-.jpg)