Embed Size (px)
Citation preview
International Journal of Economics, Business and Management Research
Vol. 4, No. 12; 2020
ISSN: 2456-7760
www.ijebmr.com Page 170
STUDY OF THE INFLUENCE OF THE LOCAL SENEGALESE
CONTEXT ON THE PERCEPTION OF CUSTOMER SATISFACTION IN
THE AUTO INSURANCE MARKET
Mamadou Salla GUEYE1, Ngor Sarr2, Mouhamadou B. Ly3, Mouhamed Badji4, Ibrahima Ly2 1Ecole Polytechnique de Thiès, BP 10, Sénégal, Département Tronc commun ;
2Ecole Polytechnique de Thiès, BP 10, Sénégal, Département Electromécanique ; 3UFR-SES, Université de Thiès, Sénégal, Département de Management des Organisations
4Faseg, Université Cheikh Anta Diop Dakar, Département Gestion
Abstract
This article analyses the perception of customer satisfaction in the Senegalese context of the
motor insurance market. The major result of this article shows the two-dimensional nature of
satisfaction, which, moreover, is a purely affective concept. In other words, the specimen
'senegalensis' perceives satisfaction in a purely affective way.
In short, in this work, it was shown that the Senegalese consumer is not "universal" as opposed
to globalization, which favors the cognitive or affective concept.
Keywords: Satisfaction, Cognition, Affection, Consumer, Loyalty
Introduction
Through the service marketing literature (Lovelock, C. & al. 2008-1; Bruwer, J. 2014-2; Ryu, K.
& al. 2010-3, etc.), satisfaction manifests itself as a key variable both in terms of organizational
practices (River E. & Ngobo P.-V., 2016-4) as regards the theory of consumer behavior and
interpersonal relationships. Indeed, satisfaction often appears as a mediator of behavior after
purchase/consumption (Oliver, 2015-5). Thus, many studies have shown that a high level of
satisfaction can influence consumer behavior (Gueye, M.S. & al, 2020-6; Ryu, K. & al. 2012-7).
On the other hand, some many authors consider that the satisfaction-behavior relationship is not
systematic (Wayan A. & al. 2019-8). It is within this framework that this article attempts to
conceptualize and measure satisfaction in the insurance sector in the unique context of Senegal.
The local culture, the still embryonic economic fabric as well as the particularity of auto
insurance are the parameters that distinguish this work from those studied in other frames of
reference. For this, the concept of satisfaction, indicating its sources and manifestations, is dealt
with in this article as well as the methodology and results of exploratory and confirmatory
research. These results made it possible to show the perception of the "senegalens is" specimen
of satisfaction.
I - Satisfaction: Polysemic concept - processual and multidimensional
Consumer satisfaction is the vector for business development. This is, in essence, the thought of
some many researchers. For them, consumer satisfaction with a product will probably lead to
repeat purchases, acceptance of other products in the same line and favorable word of mouth
advertising (Suchánek P. & al. 2019-9). Thus, several studies have shown that satisfied
International Journal of Economics, Business and Management Research
Vol. 4, No. 12; 2020
ISSN: 2456-7760
www.ijebmr.com Page 171
customers can be enticed to return and even to be loyal (Hicks, J., & al. 2005-10; Gueye, M.S. &
al, 2020-6, op. Cit.). The customer is able to recommend the product to other consumers leading
to an improvement in the reputation of the company without incurring additional communication
costs (Tokman, M., & al. 2007-11). In sum, many authors have shown that improving
satisfaction reduces the costs associated with the complaint (Antonella, C., & al. 2007-12). In the
context of this article, it is important to know how satisfaction is perceived as a concept capable
of supporting economic activity (P.-V. Ngobo, & al. 2012-13). In fact, many researchers
interested in the process of forming consumer satisfaction have retained the satisfaction specific
to a transaction (Vanhamme J., 2002 -14; Ladhari R. 2005-15). Processes are the antecedents of
satisfaction (Vanhamme (2002-14, op. Cit.)). From this angle, satisfaction can bring all the
simplicity that allows a study at a specific time.
To arrive at this conceptualization, we took as a reference the transformational marketing
approach within experiential marketing. In this way, some many authors consider that the
consumer is not only a homo economicus. But, he is also a sensitive being, who knows how to
have pleasure and find offers that will surprise and move him (Farber, M.E. & al. 2007-16;
Vanhamme J. 2008-17). Thanks to these different consumer reactions, several currents of
thought are opposed on the subject of the construct. The first stream is inspired by work on
emotions in psychology. This stream maintains that satisfaction is an emotion (Vanhamme J.,
2002-17, op. Cit.). The second considers that satisfaction is not an emotion in itself. It is a
cognitive evaluation of the emotion perceived in relation to the expected emotion (Zadra, J. R.,
& al. 2011-18). For this current, the consumer may not be satisfied even when he perceives
positive emotions as long as these do not correspond to his expectations. For still others,
satisfaction combines these two considerations (Oliver R.L., 2015-5, op. Cit.).
Other research has found that satisfaction stems from a process of comparison between the use or
consumption of the product and a given reference standard (Gallarza, M.G. & al. 2013 -19). This
is the theory of the disconfirmation paradigm (Vanhamme J. 2002-14 op. Cit.). However, this
does not mean that certain attributes do not contribute linearly to the respective constructs of
satisfaction and dissatisfaction (Gustafsson, A. & al. 2005-20). But, according to some many
researchers (Menvielle, W. & al. 2008 -21), neither of these currents has categorically
established the predominance of the conceptualization of satisfaction and dissatisfaction as two
independent or dependent constructs.
In the light of these analyzes, we consider that the bidirectional approach to satisfaction
(opposition between satisfaction and dissatisfaction, called the theory of two factors (Menvielle,
W. & al. 2008 -21 op. Cit.) Appears to be complementary to the classic approach. The two-way
approach effectively provides a qualitative view of the types of attributes leading to satisfaction
or dissatisfaction. As for the classic approach, it gives a global vision of the evaluation of the
consumption/purchase experience. This experience passes through a single score (Continuum
with an opposition between two extreme poles: positive = very satisfied/negative = very
dissatisfied). It thus appears that satisfaction reveals a 'multi-facial' geometry where satisfaction
is specific to the transaction and follows the evaluation of the consumer's
purchasing/consumption experience (Gueye, M.S. & al. 2020-6 op. Cit.; Ryu, K. & al. 2012-7
op. Cit.). The processing of survey data and their analysis reveal some rather specific results of
satisfaction. In fact, within the framework of the auto insurance market, the payment of
International Journal of Economics, Business and Management Research
Vol. 4, No. 12; 2020
ISSN: 2456-7760
www.ijebmr.com Page 172
insurance, partly compulsory, allows the driver to circulate in complete peace and constitutes the
first mode of consumption of this service (Gustafsson, A. & al. 2005-20 op. Cit.). The promise to
cover the driver if necessary, for a certain period of time, constitutes the second mode of
consumption of the service. In this work, we deal with the satisfaction of the consumer during
the transaction. Thus, auto insurance integrates purchase/consumption.
In this article, the main hypothesis is as follows: Satisfaction is a cognitive or emotional
phenomenon measured by the purchase/consumption of auto insurance in the Senegalese context.
As a secondary hypothesis arises from the main hypothesis, it is formulated as follows: the
components of the construct are linked. This hypothesis and its corollary allow us to study the
calibration of satisfaction. On this point, several researchers note that the measurement of
satisfaction encounters a major problem in studies and research (Jolibert, A. & al. 2006-22). The
problem would come from objective measurements and subjective measurements. The first type
of measure is often used by businesses and concerns the identification of consumer complaints.
This is the measurement of brand satisfaction or the use of guarantees.
The second type of measurement is subjective. These measures allow to know the subjective
experience of the consumer (Jolibert, A. & al. 2006-22 op. Cit.). Indeed, there is a great
difference in the formulation of the questions according to the conceptualizations and according
to the scale formats. However, many researchers have focused on the definition of the concept to
be measured (Ladhari, R., 2005-15 op. Cit.; Ladhari, R., 2007-23; Vanhamme, J., 2002-14 op.
Cit., etc.). Such a demarche takes into account what is part of it and its neighborhood.
II - METHODOLOGY FOR MEASURING SATISFACTION
This part of our work describes the procedures and actions that lead to the collection of essential
information to calibrate the concept of "Satisfaction" in order to obtain the expected results. The
process of measuring "Satisfaction" translates into actions. In fact, a series of interviews was
conducted with ten executives from the five largest insurance companies whose main activity
revolved around products (fire, accidents, miscellaneous and technical risks) and a few
professional insurance organizations. For customer interview, five individuals and five transport
companies make up the sample. Subsequently, data collection was carried out for customers. The
choice fell on auto insurance which contributes at least 60% of turnover in all the markets of the
countries of the Inter African Conference on Insurance Markets (CIMA).
Regarding sampling, the empirical survey of the quota method (Jolibert, A. & al. 2006-22 op.
Cit.) was used because it includes more easily attainable selection criteria (fast and relates to DK
registered vehicles). Regarding the characteristics of the sample, the targets are made up of two
types of clientele:
- Private and business customers, for a weight of 57% out of a workforce of 550 individuals.
This clientele is made up of individuals for 41% of the total sample and 16% of businesses;
- The mass public transport clientele known as "public passenger transport". This second type of
clientele represents a percentage of 43% of the total sample. These are public transport coaches
International Journal of Economics, Business and Management Research
Vol. 4, No. 12; 2020
ISSN: 2456-7760
www.ijebmr.com Page 173
and taxis for 21.5% each. The overall sample was chosen large enough to address any
imperfections related to the surveys.
Regarding the methods of collecting and administering the questionnaire, the objectives were to:
- check the factorial structure of the construct and its reliability;
- test the validity of the "construct components" link hypothesis.
As for the questionnaire, it was pre-tested. The "face-to-face" investigation was held up at the
time of his administration. The pre-test was a means of verifying the quality of the questionnaire
(Jolibert, A. & al. 2006-22 op. Cit.) as well as the duration it takes. When estimating the
parameters, the Churchill (1979 -24) paradigm was used. The data processing software to check
validity is SPSS 12. This software has stabilized the satisfaction measurement scale through
Principal Component Analysis (PCA). Likewise, the AMOS 4.0 software subsequently made it
possible to carry out Confirmatory Factor Analysis (CFA) of the empirical data from the survey.
Thanks to this AFC, a two-dimensional structure was demonstrated.
III. Study results
Based on the calibration of the concept and methods of parameter estimation, the results obtained
in this article are divided into two parts; namely the results of the exploratory analysis and those
of the confirmatory analysis. These results are followed by discussions.
III.1. Results of the exploratory analysis
Using SPSS 12 software, the exploratory factor structure of the descriptive statistics test is
shown in Table 1.
International Journal of Economics, Business and Management Research
Vol. 4, No. 12; 2020
ISSN: 2456-7760
www.ijebmr.com Page 174
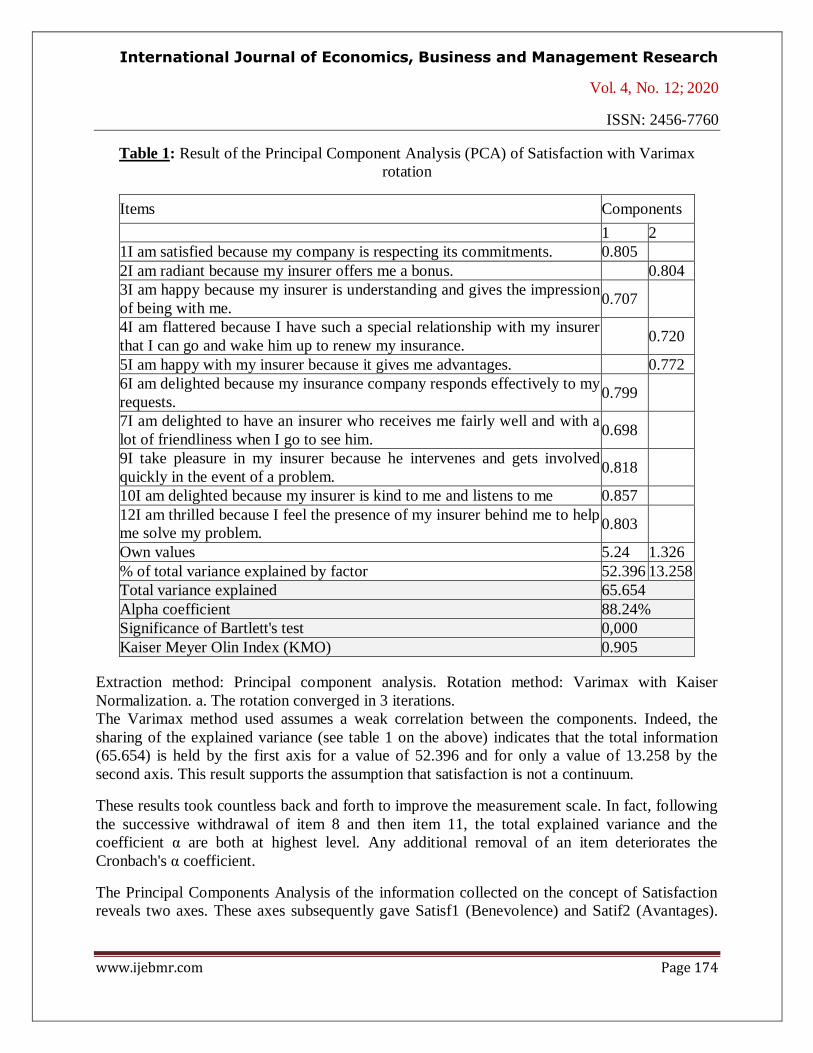
Table 1: Result of the Principal Component Analysis (PCA) of Satisfaction with Varimax
rotation
Items Components
1 2
1I am satisfied because my company is respecting its commitments. 0.805
2I am radiant because my insurer offers me a bonus. 0.804
3I am happy because my insurer is understanding and gives the impression
of being with me. 0.707
4I am flattered because I have such a special relationship with my insurer
that I can go and wake him up to renew my insurance. 0.720
5I am happy with my insurer because it gives me advantages. 0.772
6I am delighted because my insurance company responds effectively to my
requests. 0.799
7I am delighted to have an insurer who receives me fairly well and with a
lot of friendliness when I go to see him. 0.698
9I take pleasure in my insurer because he intervenes and gets involved
quickly in the event of a problem. 0.818
10I am delighted because my insurer is kind to me and listens to me 0.857
12I am thrilled because I feel the presence of my insurer behind me to help
me solve my problem. 0.803
Own values 5.24 1.326
% of total variance explained by factor 52.396 13.258
Total variance explained 65.654
Alpha coefficient 88.24%
Significance of Bartlett's test 0,000
Kaiser Meyer Olin Index (KMO) 0.905
Extraction method: Principal component analysis. Rotation method: Varimax with Kaiser
Normalization. a. The rotation converged in 3 iterations.
The Varimax method used assumes a weak correlation between the components. Indeed, the
sharing of the explained variance (see table 1 on the above) indicates that the total information
(65.654) is held by the first axis for a value of 52.396 and for only a value of 13.258 by the
second axis. This result supports the assumption that satisfaction is not a continuum.
These results took countless back and forth to improve the measurement scale. In fact, following
the successive withdrawal of item 8 and then item 11, the total explained variance and the
coefficient α are both at highest level. Any additional removal of an item deteriorates the
Cronbach's α coefficient.
The Principal Components Analysis of the information collected on the concept of Satisfaction
reveals two axes. These axes subsequently gave Satisf1 (Benevolence) and Satif2 (Avantages).
International Journal of Economics, Business and Management Research
Vol. 4, No. 12; 2020
ISSN: 2456-7760
www.ijebmr.com Page 175
The first latent variable, namely, Satisf1 (Benevolence) is a result confirmed by previous
research (Gueye, M.S. & al. 2020-25).
The reliability is obtained. It has a coefficient Alpha (α) = 88.24%; Standardized item alpha
=0.8998.
Total explained variance and alpha are at their highest. Any additional item removal deteriorates
the Cronbach's alpha coefficient to a greater or lesser extent.
From Table 1, the analysis of the structure and internal consistency of the scale for measuring
satisfaction from is as follows:
- The KMO index and the Barlett specificity test are significant. The commons are all largely
greater than 0.5. The total explained variance is 65.654. The first component alone explains
52.396% of the total variance;
- The Exploratory Analysis has two Components. Cronbach's alpha is 0.8841 for 10 items. The
component correlation matrix shows a weak link between the two components (0.593).
III.2. Confirmatory analysis results from AMOS 4.0 software on the measurement of
satisfaction
For these results, the satisfaction normality test was performed first. It involves checking the
coefficients of symmetry (skewness) and concentration (kurtosis) which are calculated for all
items on the scale after purification. The test of normality of the components of satisfaction:
satisf1 (Benevolence) and satisf2 (Advantages) is acceptable. The same is true of the test of the
studied construct, namely Satisfaction (see table 6).
Regarding the implementation of the concept measurement model, the adjustment criteria are
acceptable since it is totally determined with a number of zero degrees of freedom. The
satisfaction measurement model integrating the perception of "Benevolence" and the perception
of "Advantages" by the consumer was tested between the latent variables of satisfaction. Figure
1, below, shows the case where the two variables interact.

International Journal of Economics, Business and Management Research
Vol. 4, No. 12; 2020
ISSN: 2456-7760
www.ijebmr.com Page 176
0; ,69
Bienv
3,31
sat12
0; ,34
es12
3,65
sat10
0; ,30
es10
3,27
sat9
0; ,29
es9
4,06
sat7
0; ,48
es7
3,30
sat6
0; ,33
es6
3,50
sat3
0; ,56
es3
3,44
sat1
0; ,44
es1
0; ,70
Avantag
2,46
sat2
0; ,92
es2
2,77
sat4
0; 1,45
es4
2,79
sat5
0; ,32
es5
1
1 ,64
,92
,92
1,00
1,03
,76
1,00
1,38
1
1
1
1
1
1
1
1
1,01
1,00
,41
Figure 1: Case of interaction between the two latent variables of satisfaction.
Following several trials, the model adjusts thanks to the phi link between the two latent
variables. The adjusted Chi-square (Χ2) is found to be acceptable. The same is true for the
parsimony measurement indices (AIC and ECVI) as shown in Table 2 below.
Table 2 : Model fit indices, AFC (N = 554)
Absolute fit measurement indices Parsimony measurement indices
Df
(ddl) Np* RMR [0, 1] Χ2
RMSEA
<0,08 AIC ECVI Χ2 /ddl
45 0.000 0.0233 337.73 0.067 548.497 0.776 1.638
Np*: Probability level
For the analysis of absolute fit measures, the chi-square indices (337.73), the number of degrees
of freedom (df = 45) and the level of probability (p = 0.000) are significant. . Chi-square is
significant at a probability level of less than 1%. The large sample size (N = 554 ›200) which
could interfere with this test seems to enhance the quality of the result. Thus, the indices indicate
a good probability that the theoretical model will fit well with the empirical data. The Root Mean
Square Error of Approximation (RMSEA) = an index of fit where a value of zero indicates the
best fit. The RMSEA converges since it is 0.067 and lies between two bounds which are also
within the required limits [0.065; 0.079]. These three criteria indicate a good fit of the model to
the empirical data. For the Root-mean-square (RMR), its value is equal to 0.0233 <0.05. This
value indicates good quality of fit. Therefore, the results of the absolute fit measurements are
very acceptable and the hypotheses have been validated. The incremental adjustment indices
have key values of 0.9 so that the incremental or comparative good adjustment criteria are in line
with the proposed theoretical model (Hair & al. 2002-26). The values obtained are respectively
0.950; 0.940 and 0.950 and they are all greater than 0.9.
Advantages
es
0.691
Benevolence
International Journal of Economics, Business and Management Research
Vol. 4, No. 12; 2020
ISSN: 2456-7760
www.ijebmr.com Page 177
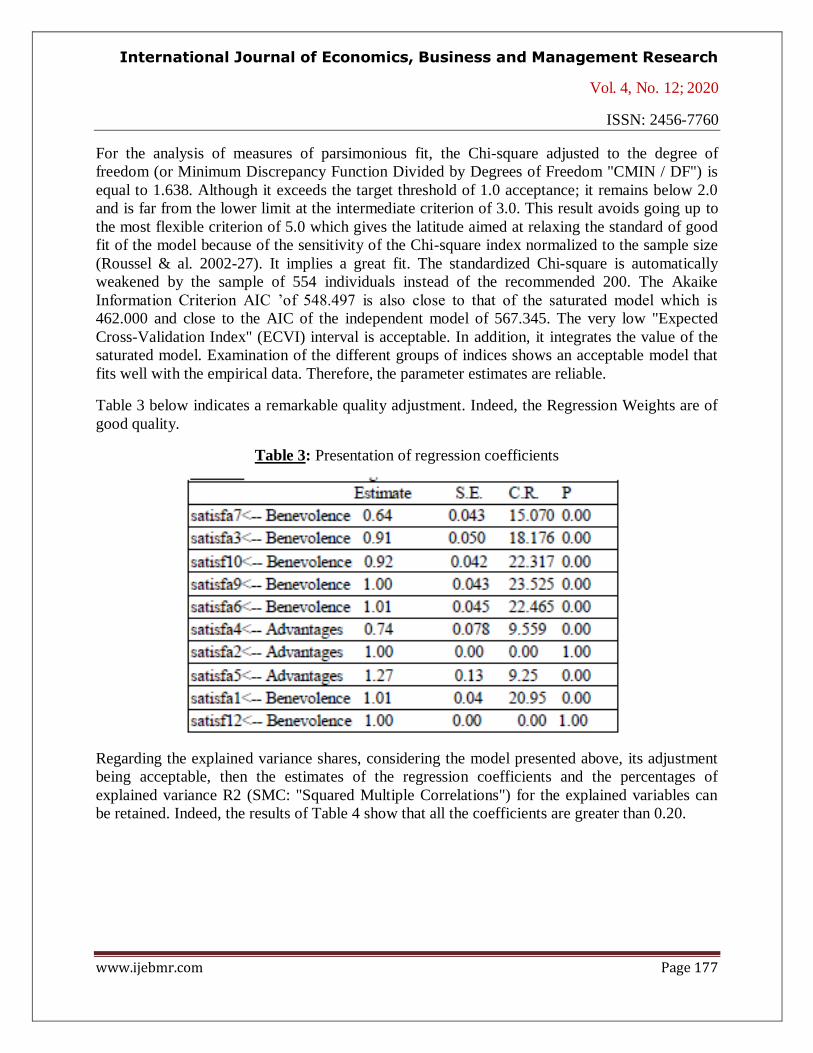
For the analysis of measures of parsimonious fit, the Chi-square adjusted to the degree of
freedom (or Minimum Discrepancy Function Divided by Degrees of Freedom "CMIN / DF") is
equal to 1.638. Although it exceeds the target threshold of 1.0 acceptance; it remains below 2.0
and is far from the lower limit at the intermediate criterion of 3.0. This result avoids going up to
the most flexible criterion of 5.0 which gives the latitude aimed at relaxing the standard of good
fit of the model because of the sensitivity of the Chi-square index normalized to the sample size
(Roussel & al. 2002-27). It implies a great fit. The standardized Chi-square is automatically
weakened by the sample of 554 individuals instead of the recommended 200. The Akaike
Information Criterion AIC ’of 548.497 is also close to that of the saturated model which is
462.000 and close to the AIC of the independent model of 567.345. The very low "Expected
Cross-Validation Index" (ECVI) interval is acceptable. In addition, it integrates the value of the
saturated model. Examination of the different groups of indices shows an acceptable model that
fits well with the empirical data. Therefore, the parameter estimates are reliable.
Table 3 below indicates a remarkable quality adjustment. Indeed, the Regression Weights are of
good quality.
Table 3: Presentation of regression coefficients
Regarding the explained variance shares, considering the model presented above, its adjustment
being acceptable, then the estimates of the regression coefficients and the percentages of
explained variance R2 (SMC: "Squared Multiple Correlations") for the explained variables can
be retained. Indeed, the results of Table 4 show that all the coefficients are greater than 0.20.

International Journal of Economics, Business and Management Research
Vol. 4, No. 12; 2020
ISSN: 2456-7760
www.ijebmr.com Page 178
Table 4: Standardized regression coefficients (Standardized Regression Weights)
As for the explained variance, it is given in Table 5 below.
Table 5: Percentage of variance explained in Satisfaction (SMC)
Squared Multiple Correlations (SMC) = R2
Estimate
Satisf12 0.671
Satisfa5 0.744
Satisfa2 0.469
Satisfa4 0.229
Satisfa6 0.68
Satisfa9 0.706
Satisf10 0.671
Satisfa3 0.503
Satisfa7 0.372
Satisfa1 0.621
The Percentage of variance explained for Satisfaction (Squared Multiple Correlations (SMC) =
R2) varies around 0.60 for five items out of 7. It is 0.40 for the other three. All the share of
explained variance coefficients are much greater than 0.20.
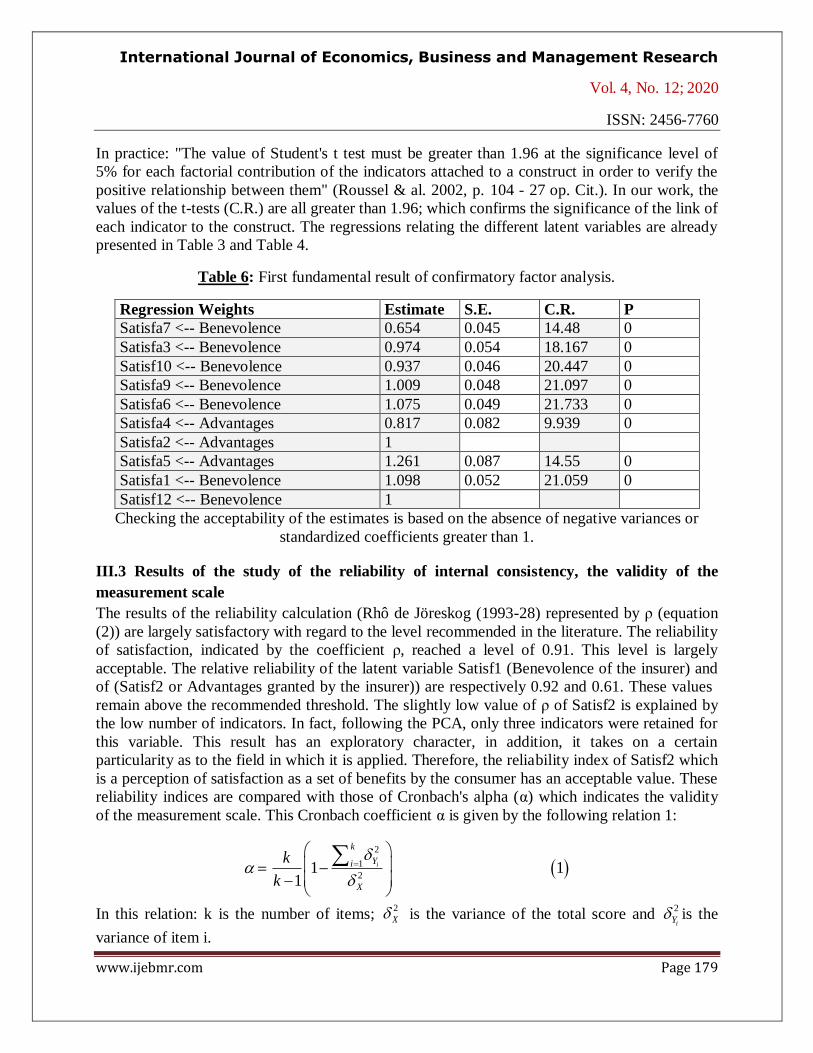
Regarding the evaluation of the measurement model and the analysis of the significance of the
factor contributions, Table 6 below presents the first fundamental result of the confirmatory
factor analysis. The first column indicates the variables whose relationships are measured. The
second indicates the levels of the estimated parameters (correlations, factor contributions,
variances). The third column indicates the standard error or standardized error (S.E.) of each
estimated parameter. The fourth presents the results of each Student's T for the estimated
parameters. The significance level of an estimate is 1.96 at a confidence level less than 0.05. This
level of confidence appears in the last column which indicates the level of probability of the test.
International Journal of Economics, Business and Management Research
Vol. 4, No. 12; 2020
ISSN: 2456-7760
www.ijebmr.com Page 179
In practice: "The value of Student's t test must be greater than 1.96 at the significance level of
5% for each factorial contribution of the indicators attached to a construct in order to verify the
positive relationship between them" (Roussel & al. 2002, p. 104 - 27 op. Cit.). In our work, the
values of the t-tests (C.R.) are all greater than 1.96; which confirms the significance of the link of
each indicator to the construct. The regressions relating the different latent variables are already
presented in Table 3 and Table 4.
Table 6: First fundamental result of confirmatory factor analysis.
Regression Weights Estimate S.E. C.R. P
Satisfa7 <-- Benevolence 0.654 0.045 14.48 0
Satisfa3 <-- Benevolence 0.974 0.054 18.167 0
Satisf10 <-- Benevolence 0.937 0.046 20.447 0
Satisfa9 <-- Benevolence 1.009 0.048 21.097 0
Satisfa6 <-- Benevolence 1.075 0.049 21.733 0
Satisfa4 <-- Advantages 0.817 0.082 9.939 0
Satisfa2 <-- Advantages 1
Satisfa5 <-- Advantages 1.261 0.087 14.55 0
Satisfa1 <-- Benevolence 1.098 0.052 21.059 0
Satisf12 <-- Benevolence 1
Checking the acceptability of the estimates is based on the absence of negative variances or
standardized coefficients greater than 1.
III.3 Results of the study of the reliability of internal consistency, the validity of the
measurement scale
The results of the reliability calculation (Rhô de Jöreskog (1993-28) represented by ρ (equation
(2)) are largely satisfactory with regard to the level recommended in the literature. The reliability
of satisfaction, indicated by the coefficient ρ, reached a level of 0.91. This level is largely
acceptable. The relative reliability of the latent variable Satisf1 (Benevolence of the insurer) and
of (Satisf2 or Advantages granted by the insurer)) are respectively 0.92 and 0.61. These values
remain above the recommended threshold. The slightly low value of ρ of Satisf2 is explained by
the low number of indicators. In fact, following the PCA, only three indicators were retained for
this variable. This result has an exploratory character, in addition, it takes on a certain
particularity as to the field in which it is applied. Therefore, the reliability index of Satisf2 which
is a perception of satisfaction as a set of benefits by the consumer has an acceptable value. These
reliability indices are compared with those of Cronbach's alpha (α) which indicates the validity
of the measurement scale. This Cronbach coefficient α is given by the following relation 1:
2
1
21 1
1
i
k
Yi
X
k
k
In this relation: k is the number of items; 2
X is the variance of the total score and 2
iY is the
variance of item i.
International Journal of Economics, Business and Management Research
Vol. 4, No. 12; 2020
ISSN: 2456-7760
www.ijebmr.com Page 180
Relation 1 can be put in the following simplified form:
1'
1 1
k r
k r
With r
average correlation between items.
The expression for the reliability (ρ) is given by the following equation (2):
2
1
2
1 1
2
p
i
p p
i
VAR
VAR VAR
With δ = measurement error of X variables; X = observed indicators of the latent variable; λ =
coefficient linking the latent variable to its indicators; Ksi (ξ) = Latent explanatory variable (Ksi
(ξ) = Satisf1 & Ksi (ξ) = Satisf2).
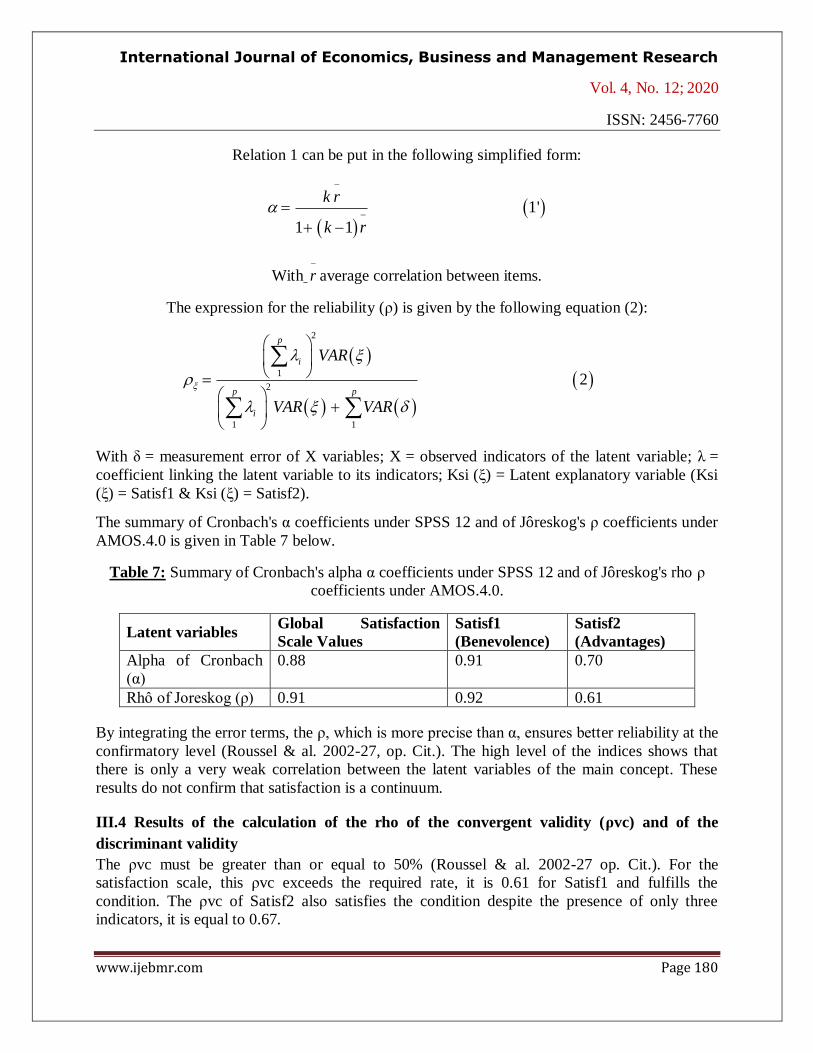
The summary of Cronbach's α coefficients under SPSS 12 and of Jôreskog's ρ coefficients under
AMOS.4.0 is given in Table 7 below.
Table 7: Summary of Cronbach's alpha α coefficients under SPSS 12 and of Jôreskog's rho ρ
coefficients under AMOS.4.0.
Latent variables Global Satisfaction
Scale Values
Satisf1
(Benevolence)
Satisf2
(Advantages)
Alpha of Cronbach
(α)
0.88 0.91 0.70
Rhô of Joreskog (ρ) 0.91 0.92 0.61
By integrating the error terms, the ρ, which is more precise than α, ensures better reliability at the
confirmatory level (Roussel & al. 2002-27, op. Cit.). The high level of the indices shows that
there is only a very weak correlation between the latent variables of the main concept. These
results do not confirm that satisfaction is a continuum.
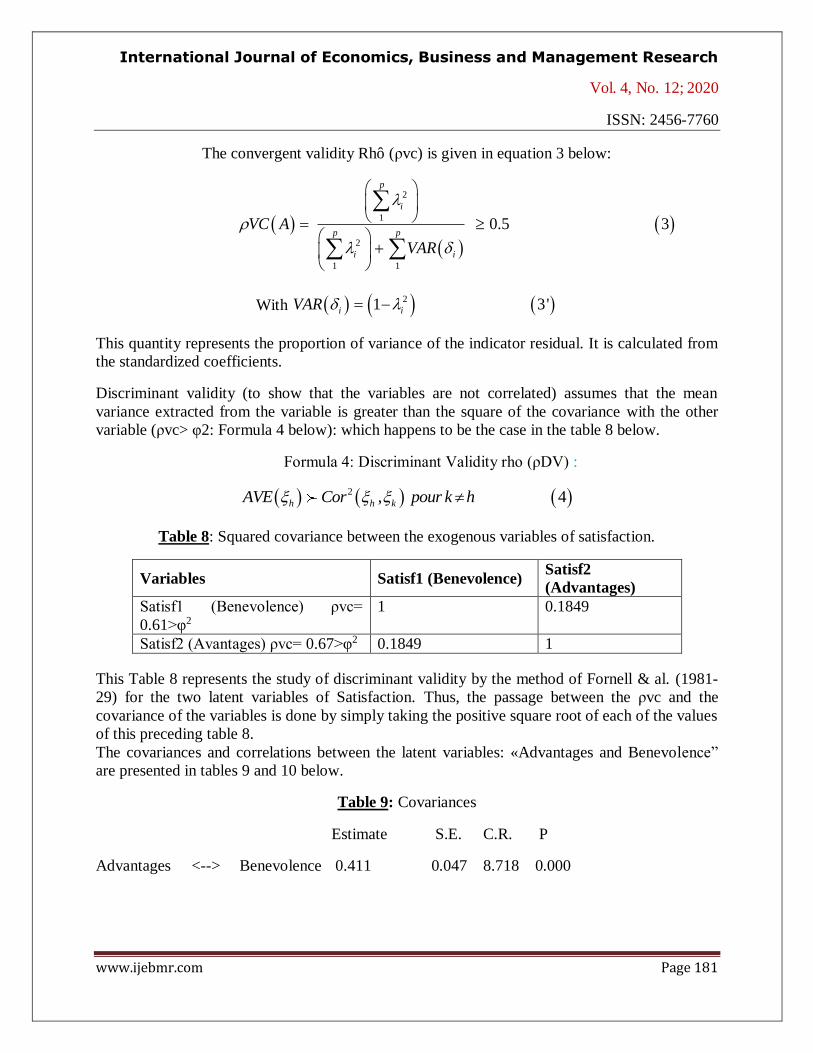
III.4 Results of the calculation of the rho of the convergent validity (ρvc) and of the
discriminant validity
The ρvc must be greater than or equal to 50% (Roussel & al. 2002-27 op. Cit.). For the
satisfaction scale, this ρvc exceeds the required rate, it is 0.61 for Satisf1 and fulfills the
condition. The ρvc of Satisf2 also satisfies the condition despite the presence of only three
indicators, it is equal to 0.67.
International Journal of Economics, Business and Management Research
Vol. 4, No. 12; 2020
ISSN: 2456-7760
www.ijebmr.com Page 181
The convergent validity Rhô (ρvc) is given in equation 3 below:
2
1
2
1 1
0.5 3
p
i
p p
i i
VC A
VAR
With 21 3'i iVAR
This quantity represents the proportion of variance of the indicator residual. It is calculated from
the standardized coefficients.
Discriminant validity (to show that the variables are not correlated) assumes that the mean
variance extracted from the variable is greater than the square of the covariance with the other
variable (ρvc> φ2: Formula 4 below): which happens to be the case in the table 8 below.
Formula 4: Discriminant Validity rho (ρDV) :
2 , 4h h kAVE Cor pour k h
Table 8: Squared covariance between the exogenous variables of satisfaction.
Variables Satisf1 (Benevolence) Satisf2
(Advantages)
Satisf1 (Benevolence) ρvc=
0.61>φ2
1 0.1849
Satisf2 (Avantages) ρvc= 0.67>φ2 0.1849 1
This Table 8 represents the study of discriminant validity by the method of Fornell & al. (1981-
29) for the two latent variables of Satisfaction. Thus, the passage between the ρvc and the
covariance of the variables is done by simply taking the positive square root of each of the values
of this preceding table 8.
The covariances and correlations between the latent variables: «Advantages and Benevolence”
are presented in tables 9 and 10 below.
Table 9: Covariances
Estimate S.E. C.R. P
Advantages <--> Benevolence 0.411 0.047 8.718 0.000
International Journal of Economics, Business and Management Research
Vol. 4, No. 12; 2020
ISSN: 2456-7760
www.ijebmr.com Page 182
Table 10: Correlations
Estimate SE SE-SE
Advantages <--> Benevolenc 0.593 0.003 0.001
So the structure of the measurement scale presents itself with good psychometric qualities. The
normality of the data and the internal consistency of the scale from exploratory factor analyzes
(performed under SPSS.12) and confirmatory analyzes (performed using AMOS 4.0 software)
were found to be acceptable. Thus, reliability was assessed using two indicators: Cronbach's α
coefficient and Jöreskog's ρ. The validity of the scale has been observed through exploratory
factor analyzes and by the method of Fornell C. and Larcker D.F. (1981-29 op. Cit.).
IV. Discussion of results
Based on factorial and reliability analyzes, our discussion focuses on the measurement scale of
the concept of Satisfaction. The results of this article focus on principal component analyzes and
the evaluation of the criteria for good scaling. These results reveal an adequate calibration of
Customer Satisfaction in the auto insurance market in Senegal.
The choice of a unidirectional concept with two poles has not been verified. This result is in
agreement with those of the two-factor theory (Abdou N.K. 2002-30). Clearly, satisfaction is
distinguished from dissatisfaction. Satisfaction is a construct in its own right and has two
dimensions (Gueye M.S. & al. 2020-6 op. Cit.; Oliver, 2015-5 op. Cit.). This two-dimensional
structure of satisfaction is confirmed by the results obtained in this work. It indicates that
satisfaction is perceived by the client as a feeling of “benevolence and conviviality (satisf1)” in
his relationship with the insurer, on the one hand or “advantages and friendship (satisf2)”', on the
other go. It also appears that satisfaction includes a theoretical dimension of trust, namely
benevolence already highlighted by some other researchers particularly. (Ganesan (1994-31;
Gueye M.S. & al. 2020 -25, op. Cit.).
Conclusion
From this present work, it follows that Satisfaction is a two-dimensional structure inducing two
situations (response of the local consumer to a shopping experience and to a consumption
experience). In addition, it follows a purely emotional character of Satisfaction. Indeed, Satisf1
and Satisf2 are highly effective dimensions where the local consumer has expectations. He
would like his expectations to be taken into account in the transaction/consumption process
which exactly matches the two-dimensional structure of satisfaction in the context of this article.
Among the major results obtained in this present work from the point of view of exploratory and
confirmatory analysis, we can note that:
- The KMO index and the Barlett specificity test are significant with commonalities all well
above 0.5;

International Journal of Economics, Business and Management Research
Vol. 4, No. 12; 2020
ISSN: 2456-7760
www.ijebmr.com Page 183
- The acceptability of the normality of the data and the internal consistency of the scale from
exploratory factor analyzes under SPSS.12 and confirmatory analyzes of the AMOS 4.0
software;
- Obtaining an adequate calibration of Customer Satisfaction in the auto insurance market in
Senegal.
In short, we have shown in this present work that the "senegalens is" specimen perceives
satisfaction in a purely affective way. We are therefore in the presence of a non-"universal"
consumer, the opposite of globalization which favors the cognitive/affective aspect.
Bibliographical references
1. Lovelock, C., Wirtz, J., Lapert, D. et Annie, M. (2008). Marketing des services (6e éd). Paris:
Pearson Education.
2. Bruwer, J. (2014). "Service quality perception and satisfaction: buying behaviour prediction in
an Australian festivals cape", International Journal of Tourism Research, 16, 1, p.
76-86
3. Ryu, K.; Han, H. (2010). Influence of the quality of food, service, and physical environment
on customer satisfaction and behavioral intention in quick-casual restaurants:
Moderating role of perceived price. J. Hosp. Tour. Res., 34, 310–329.
4. River, E. & Ngobo, P.-V. (2016). “Les Facteurs Explicatifs de la Prédisposition des
Entreprises Prestataires à Co-créer un Service B2B”. Recherche et Applications en
Marketing. vol.31 (6):67-96.
5. Oliver, R.L. (2015). Satisfaction: A Behavioural Perspective on the Consumer. Oxford,
England; New York: Routledge, (2010, 22), 519 pages.
6. Mamadou Salla Gueye; Mame F. M. Fall; Ngor Sarr; Ibrahima Ly. (2020). Analysis of the
Interdependence Trust- Satisfaction-Loyalty of Customer in Client-Seller
Relationships in the Insurance Market in Senegal. Sumerianz Journal of Business
Management and Marketing, https://www.sumerianz.com/?ic=journal-
home&journal=27&info=archive-detail&month=09-2020&issue=9&volume=3; Vol.
3, n° 9, pp. 124-132.
7. Ryu, K., Lee, H.R., Kim, W.G. (2012). The influence of the quality of the physical
environment, food, and service on restaurant image, customer perceived value,
customer satisfaction, and behavioral intentions. Int. J. Contemp. Hosp. Manag. 24,
200–223.
8. Wayan, A., Ketut Rahyuda, K., Giantari, I G. A. K., Sukaatmadja, I P. G. (2019). Customer
Satisfaction and Behavioral Intentions in Tourism: A Literature Review. International
Journal of Applied Business & International Management, Vol.4 (3):84-93.
International Journal of Economics, Business and Management Research
Vol. 4, No. 12; 2020
ISSN: 2456-7760
www.ijebmr.com Page 184
9. Suchánek P. & Králová M. (2019). Customer Satisfaction, Loyalty, Knowledge and
Competitiveness in the food industry. Economic Research-Ekonomska Istraživanja,
32:1, 1237-1255.
10. Hicks, J., Page, T.J., Behe, B.K., Dennis, J.H., Fernandez, R.T. (2005), Delighted customers
buy again: an investigation into the impact of consumer knowledge on consumer
satisfaction and delight of flowering potted plants, Journal of
Satisfaction/Dissatisfaction, and Complaining Behavior, 18, 94–104.
11. Tokman, M., Davis, L.M., Lemon, K.N. (2007). The WOW factor: creating value through
win-back offers to reacquire lost customers, Journal of Retailing, 83, 1, 47–64.
12. Antonella, C. and Fabrizio, Z. (2007). The Cost of Customer Satisfaction: A Framework for
Strategic Cost Management in Service Industries. European Accounting Review 16:3,
499-530.
13. Ngobo, P.-V., Casta, J.F. & Ramond, O. (2012). Is Customer Satisfaction a Relevant Metric
for Financial Analysts? Journal of the Academy of Marketing Science, May 2012,
volume 40, Issue 3, pp 480-508.
14. Vanhamme, J. (2002). La satisfaction des consommateurs spécifique à une transaction :
définition, antécédents, mesures et modes. Recherche et Application en Marketing.
17 :2.55-80.16.
15. Ladhari, R. (2005). La satisfaction du consommateur, ses déterminants et ses conséquences.
Revue de l’Université de Moncton, vol.36, n°2, 2005, p.171-201.
16. Farber, M.E., Hall, T.E. (2007). Emotion and environment: visitor's extraordinary
experiences along the Dalton Highway in Alaska, Journal of Leisure Research, 39,
2, 248 -270.
17. Vanhamme, J. (2008). Marketing Expérientiel : la relation surprise -ravissement revisitée à
l’aune du marketing expérientiel. Recherche et Application en Marketing, vol .23(9),
n° 3, pp.113-139.
18. Zadra, J. R., and Clore, G. L. (2011). Emotion and perception: the role of affective
information. Wiley Interdiscip. Rev. Cogn. Sci. 2, 676–685.
19. Gallarza, M.G., Saura, I.G., & Moreno, F.A. (2013). The Quality-Value Satisfaction-Loyalty
Chain: Relationships and Impacts. Tourism Review, 68 (1): 3-20.
20. Anders Gustafsson, A., Johnson, M., Roos, I. (2005). The Effects of Customer Satisfaction,
Relationship Commitment Dimensions, and Triggers on Customer Retention. Journal
of Marketing. 69(4) :201-218.
21. Menvielle, W., Menvielle, L. & Mars, M.-C. (2008). La satisfaction des consommateurs à
l’égard des PME de la restauration libre-service : une étude exploratoire. Revue
internationale P.M.E., 21 (3-4), 145–183.
22. Jolibert, A., Jourdan, P. (2006). Marketing Research : méthodes de recherche et d'études en
marketing, Paris, Dunod.
International Journal of Economics, Business and Management Research
Vol. 4, No. 12; 2020
ISSN: 2456-7760
www.ijebmr.com Page 185
23. Ladhari, R. (2007). The movie experience: a revised approach to determinants of satisfaction.
Journal of Business Research, 60, 5, 454–462.
24. Churchill, G. (1979). A Paradigm for Developing Better Measures of Marketing Constructs.
Journal of Marketing research, vol. 16, 1, pp. 64-73.
25. Mamadou Salla GUEYE, Ngor Sarr, Mame F. M. Fall and Ibrahima Ly (2020) «Conception
d’un Modèle d’Analyse de la Clientèle du marché des assurances pour la Perception
de la Confiance dans le contexte sénégalais et son effet sur le Comportement de la
Fidélité», International Journal of Current Research Vol. 12, Issue, 05, pp.10390-
10396, May, 2020 ; http://www.journalcra.com/about-journal
26. Hair, J.F., Anderson, R.E. Tathman R.I. & Black, W.C. (2002). Multivariate Data Analysis.
Prentice Hall, New Jersey, 6th Edition.
27. Roussel, P. & al. (2002). Méthodes d’équations structurelles : recherche et applications en
gestion. Paris, Economica.
28. Jöreskog, K.G. (1993). Testing Structural Equation Models. Bollen K.A. and Long J.S. (Eds),
Testing Stractural Equation Models, Sage Publications, pp.294-316.
29. Fornell, C. & Larcker, D.F. (1981). Evaluating Structural Equation Models with
Unobservable Variables and Measurement Errors. Journal of Marketing Research,
vol. 18, 1, pp.39-50.
30. Abdou, N. K. (2002). L' (in)satisfaction au travail des professeurs du second degré du
Sénégal. In Revue des Sciences de l’éduction, Vol XXVI, n°2, pp. 439 à 462.
31. Ganesan, S. (1994). Determinants of Long-Term Orientation in Buyer-Seller Relationships.
Journal of Marketing, vol 58 (April), 1-19.