Embed Size (px)
Citation preview
Journal of Energy and Power Engineering 9 (2015) 117-127 doi: 10.17265/1934-8975/2015.02.001
Study of the Jet-Induced Mixing of Two-Layer
Density-Stratified Fluid in a Rectangular Tank
Shogo Shakouchi1, 2, Shota Fukue2 and Tomomi Uchiyama3
1. Development Section, Chubu Electric Power Co., Inc., Nagoya 461-8680, Japan
2. Graduate School of Information Science, Nagoya University, Nagoya 464-8601, Japan
3. EcoTopia Science Institute, Nagoya University, Nagoya 464-8603, Japan
Received: August 26, 2014 / Accepted: October 15, 2014 / Published: February 28, 2015. Abstract: The mixing phenomena of a two-layer density-stratified fluid induced by a jet in a tank are experimentally investigated. The upper and lower fluids are water and a NaCl-water solution, respectively, with the lower fluid issued vertically upward from a nozzle at the bottom of the tank. The jet Reynolds number Re, defined by the jet velocity and the water kinematic viscosity, ranges from 90 to 4,200. The mass concentration of the NaCl-water solution C0 is less than 0.08. The flow visualization makes clear the jet behavior relative to the density interface between the upper and lower fluids. The measurement of the concentration distribution of the water paint issued with the jet highlights the effects of Re and C0 on the mixing between the jet and the ambient fluid. The measurement of the fluid velocity distribution with a PIV (particle image velocimetry) system successfully elucidates the relationship between the velocity field and the resultant mixing. Key words: Jet, density-stratified fluid, mixing, intrusion, concentration, PIV.
1. Introduction
In a storage tank of LNG (liquefied natural gas), the
density stratification of the LNG is produced when
another LNG is loaded on top of the LNG. This is
because the density and components of LNG are
specific to the producing areas and the purification
plants. The density-stratified LNG becomes unstable
over time because of temperature and composition
variations. When density of the lower LNG becomes
smaller than that of the upper one, a sudden mixing,
known as rollover, occurs. Rollover generates large
amounts of vaporized gases, causing severe damages to
the storage tank. Therefore, the prevention and
elimination of stratification are essential for the
operation of LNG storage tanks.
Mixing phenomena of density-stratified fluid
induced by jets in tank have thus far been studied with
Corresponding author: Tomomi Uchiyama, doctor of
engineering, professor, research fields: fluid engineering and computational. E-mail: [email protected].
laboratory-based experiments [1-6]. Mixing LNG by a
jet issued from a nozzle mounted on the tank wall is
considered to a promising technique to prevent and
eliminate stratification in LNG storage tanks. The
current authors [7] performed a laboratory-based
experiment of two-layer density-stratified fluid in a
rectangular tank. The upper and lower fluids were
water and a NaCl-water solution, respectively, and the
lower fluid was issued vertically upward from a nozzle
on the tank bottom. The authors investigated the jet
behavior by the flow visualization and clarified the
effects of the jet Reynolds number, the concentration of
the lower fluid and the fluid thickness. They also
demonstrated that the maximum height of the jet can be
predicted by the Froude number defined by the jet
velocity and the density difference between the upper
and lower fluids. The current authors [8] also proposed
a simulation method for a jet issued into a two-layer
density-stratified fluid. The method was based on a
vortex in cell method, which discretizes the vorticity
D DAVID PUBLISHING
Study of the Jet-Induced Mixing of Two-Layer Density-Stratified Fluid in a Rectangular Tank
118
field into vortex elements and computes the time
evolution of the flow by tracing the convection of each
vortex element. Shakouchi et al. [8] performed the jet
simulation at the same conditions as their previous
experiment [7] and confirmed the validity of the
simulation method by comparing the simulated results
with the experimental ones. The abovementioned
authors’ studies [7, 8] successfully clarified the jet
behavior and presented the simulation method. But the
mixing between the jet and the ambient fluid as well as
the fluid velocity deeply interacting with the mixing is
not fully elucidated.
In this study, the concentration distribution of the
water paint issued with the jet is measured on the flow
field investigated by the authors’ previous work [7].
The distribution of the fluid velocity is also measured.
On the basis of the measurements, the effects of the jet
Reynolds number and the concentration of the lower
fluid on the mixing between the jet and the ambient
fluid are clarified. The knowledge of the velocity
distribution, which contributes to the understanding of
the jet-induced mixing, is also acquired.
2. Experimental
2.1 Experimental Setup
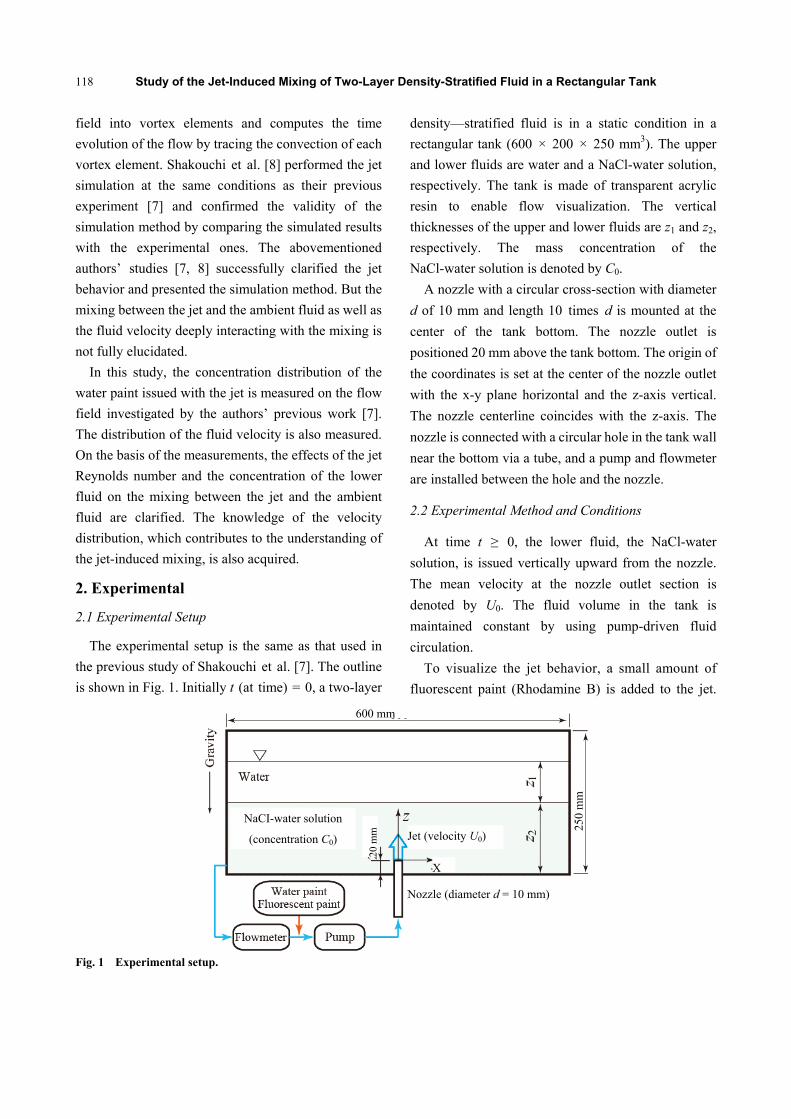
The experimental setup is the same as that used in
the previous study of Shakouchi et al. [7]. The outline
is shown in Fig. 1. Initially t (at time) = 0, a two-layer
density—stratified fluid is in a static condition in a
rectangular tank (600 × 200 × 250 mm3). The upper
and lower fluids are water and a NaCl-water solution,
respectively. The tank is made of transparent acrylic
resin to enable flow visualization. The vertical
thicknesses of the upper and lower fluids are z1 and z2,
respectively. The mass concentration of the
NaCl-water solution is denoted by C0.
A nozzle with a circular cross-section with diameter
d of 10 mm and length 10 times d is mounted at the
center of the tank bottom. The nozzle outlet is
positioned 20 mm above the tank bottom. The origin of
the coordinates is set at the center of the nozzle outlet
with the x-y plane horizontal and the z-axis vertical.
The nozzle centerline coincides with the z-axis. The
nozzle is connected with a circular hole in the tank wall
near the bottom via a tube, and a pump and flowmeter
are installed between the hole and the nozzle.
2.2 Experimental Method and Conditions
At time t ≥ 0, the lower fluid, the NaCl-water
solution, is issued vertically upward from the nozzle.
The mean velocity at the nozzle outlet section is
denoted by U0. The fluid volume in the tank is
maintained constant by using pump-driven fluid
circulation.
To visualize the jet behavior, a small amount of
fluorescent paint (Rhodamine B) is added to the jet.
Fig. 1 Experimental setup.
NaCI-water solution
(concentration C0)
600 mm
Jet (velocity U0)
20 m
m
X
Nozzle (diameter d = 10 mm)
250
mm

Study of the Jet-Induced Mixing of Two-Layer Density-Stratified Fluid in a Rectangular Tank
119
Fig. 2 Visualization of the central vertical cross-section of the flow field.
The images in the vertical plane passing through the
nozzle centerline are captured by a video camera using
a laser light sheet (power: 1 W, wavelength: 532 nm,
thickness: 2 mm), as shown in Fig. 2. The spatial
resolution, framerate, and shutter speed of the camera
are 640 × 480 pixels, 200 fps, and 1/200 s,
respectively.
To reveal the mixing phenomena, a small amount of
white water paint is added to the jet, and the images in
the vertical plane are captured by a flow visualization
camera. The brightness of the water paint in the image
is assumed to be proportional to the concentration Γ of
the paint. In order to normalize the Γ-value, Γ is set to 1
at the nozzle exit and 0 in regions furthest from the
nozzle. This is because the brightness, which is at the
maximum at the nozzle exit, decreases with increasing
distance from the nozzle.
The fluid velocity is measured by a PIV system.
Nylon particles (mean diameter: 20 μm, specific
weight: 1.02) are used as tracers. The particles images
are acquired by using the laser light sheet and video
camera used for the flow visualization.
The jet Reynolds number, Re, is defined by U0/ν,
where ν is the kinematic viscosity of water. The
non-dimensional time t* is defined by tU0/d. Table 1
summarizes the experimental conditions.
Table 1 Experimental conditions.
Upper fluid Water at 298 K
Lower fluid NaCl-water solution at 298 K
Nozzle inner diameter: d 10 mm
Size of rectangular tank 600 × 200 × 250 mm3
Reynolds number: Re = dU0/ν 90 ≤ Re ≤ 4,200
Concentration of NaCl-water solution: C0
C0 ≤ 0.08
Thickness of upper fluid: z1 20 ≤ z1 ≤ 60 mm
Thickness of lower fluid: z2 20 ≤ z2 ≤ 80 mm
3. Results and Discussions
3.1 Jet Behavior Relative to Density Interface
The jet behavior relative to the density interface
between the upper and lower fluids can be classified
into three patterns A, B, and C according to the
Reynolds number Re and mass concentration of the
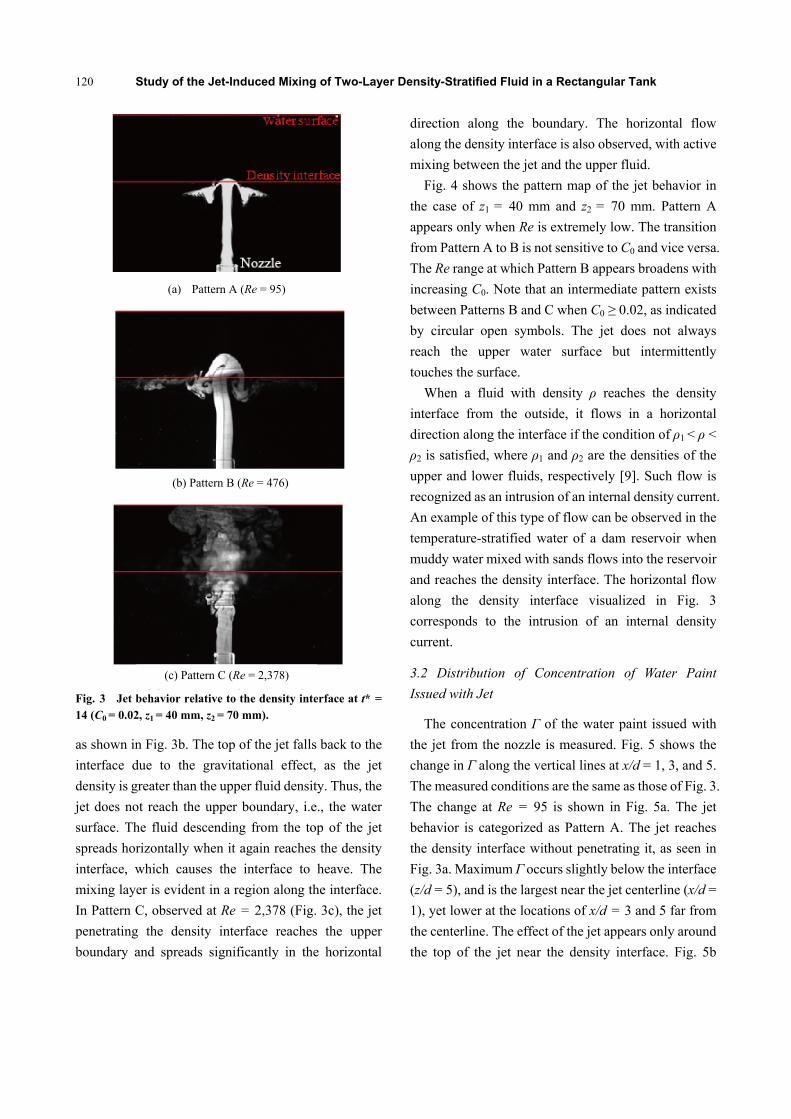
NaCl-water solution C0 [7]. Fig. 3 shows typical
examples for C0 = 0.02, where z1 = 40 mm and z2 = 70
mm. The images are acquired at t* = 14. The white area
representing the fluorescent paint issued from the
nozzle reveals the jet. In Pattern A, observed at Re = 95
(Fig. 3a), the jet reaches the density interface without
penetrating it. The top of the jet spreads almost
horizontally outward beneath the interface and thus
causes minimal mixing. In Pattern B, observed at Re =
476, the jet penetrates the density interface and the
non-axisymmetric flow structure becomes pronounced,
Study of the Jet-Induced Mixing of Two-Layer Density-Stratified Fluid in a Rectangular Tank
120
Fig. 3 Jet behavior relative to the density interface at t* = 14 (C0 = 0.02, z1 = 40 mm, z2 = 70 mm).
as shown in Fig. 3b. The top of the jet falls back to the
interface due to the gravitational effect, as the jet
density is greater than the upper fluid density. Thus, the
jet does not reach the upper boundary, i.e., the water
surface. The fluid descending from the top of the jet
spreads horizontally when it again reaches the density
interface, which causes the interface to heave. The
mixing layer is evident in a region along the interface.
In Pattern C, observed at Re = 2,378 (Fig. 3c), the jet
penetrating the density interface reaches the upper
boundary and spreads significantly in the horizontal
direction along the boundary. The horizontal flow
along the density interface is also observed, with active
mixing between the jet and the upper fluid.
Fig. 4 shows the pattern map of the jet behavior in
the case of z1 = 40 mm and z2 = 70 mm. Pattern A
appears only when Re is extremely low. The transition
from Pattern A to B is not sensitive to C0 and vice versa.
The Re range at which Pattern B appears broadens with
increasing C0. Note that an intermediate pattern exists
between Patterns B and C when C0 ≥ 0.02, as indicated
by circular open symbols. The jet does not always
reach the upper water surface but intermittently
touches the surface.
When a fluid with density ρ reaches the density
interface from the outside, it flows in a horizontal
direction along the interface if the condition of ρ1 < ρ <
ρ2 is satisfied, where ρ1 and ρ2 are the densities of the
upper and lower fluids, respectively [9]. Such flow is
recognized as an intrusion of an internal density current.
An example of this type of flow can be observed in the
temperature-stratified water of a dam reservoir when
muddy water mixed with sands flows into the reservoir
and reaches the density interface. The horizontal flow
along the density interface visualized in Fig. 3
corresponds to the intrusion of an internal density
current.
3.2 Distribution of Concentration of Water Paint
Issued with Jet
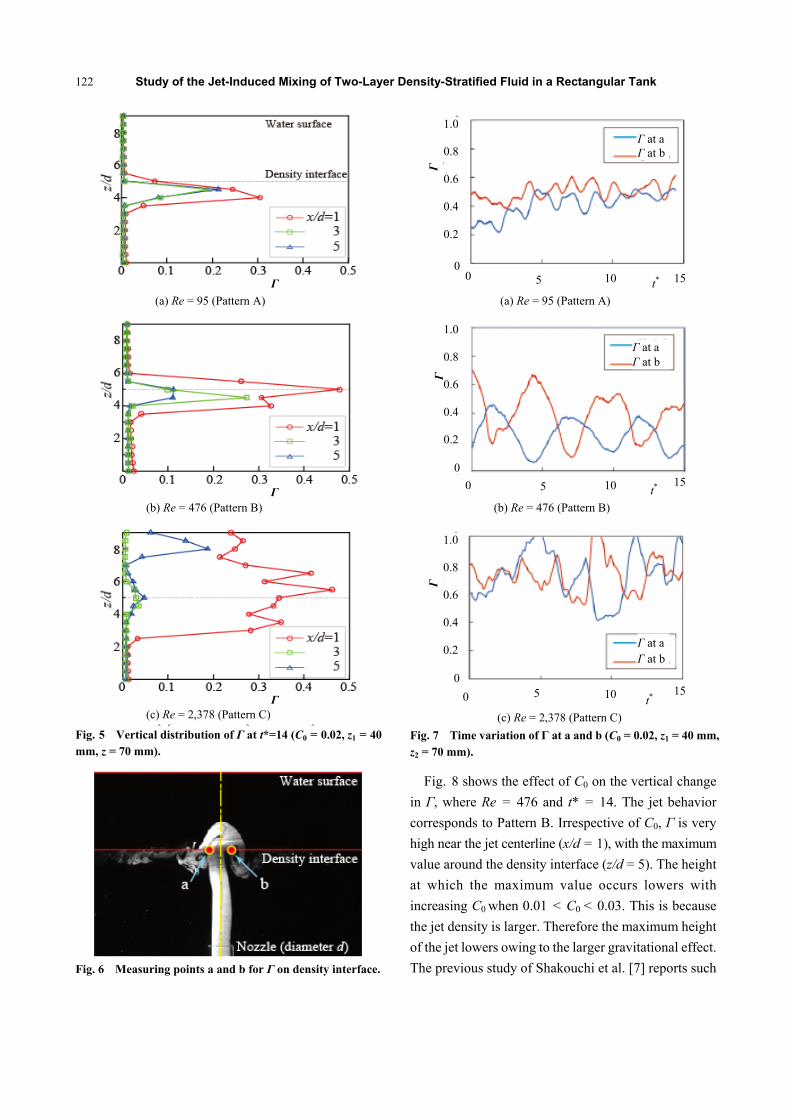
The concentration Γ of the water paint issued with
the jet from the nozzle is measured. Fig. 5 shows the
change in Γ along the vertical lines at x/d = 1, 3, and 5.
The measured conditions are the same as those of Fig. 3.
The change at Re = 95 is shown in Fig. 5a. The jet
behavior is categorized as Pattern A. The jet reaches
the density interface without penetrating it, as seen in
Fig. 3a. Maximum Γ occurs slightly below the interface
(z/d = 5), and is the largest near the jet centerline (x/d =
1), yet lower at the locations of x/d = 3 and 5 far from
the centerline. The effect of the jet appears only around
the top of the jet near the density interface. Fig. 5b
(c) Pattern C (Re = 2,378)
(a) Pattern A (Re = 95)
(b) Pattern B (Re = 476)

Study of the Jet-Induced Mixing of Two-Layer Density-Stratified Fluid in a Rectangular Tank
121
Fig. 4 Pattern map of jet behavior (z1 = 40 mm, z2 = 70 mm).
shows the change in Γ at Re = 476. The jet behavior is
categorized as Pattern B. The top of the jet penetrating
the density interface falls back to the interface and
spreads horizontally along the interface, as seen in Fig.
3b. At x/d = 1, Γ reaches the maximum on the interface,
and the maximum value is larger than that at Re = 95.
One can confirm the mixing along the interface. The
change at Re = 2,378 is shown in Fig. 5c. The jet
behavior is categorized as Pattern C. The jet
penetrating the density interface reaches the upper
water surface, as seen in Fig. 3c. The Γ value near the
jet centerline (x/d = 1) is high in the broader region
above the density interface as well as beneath the upper
water surface, even at x/d = 5. This is a product of the
fluid flow along the water surface and thus reconfirms
active mixing between the jet and the ambient fluid.
The flow along the density interface or the intrusion
is reconfirmed by the fact that Γ is at the maximum near
the interface in every flow pattern, as shown in Fig. 5.
To investigate the time variation of Γ on the density
interface of the flow fields shown in Fig. 3, the
variation is measured at two points a and b on either
side of the jet centerline (x = 0). The distance between
the points is the nozzle diameter d. The points a and b
are superimposed on the flow image at Re = 476, as
shown in Fig. 6.
Fig. 7 shows the time variation of Γ measured at
points a and b. The variations at Re = 95 are shown in
Fig. 7a. The measuring points are nearly located on the
most leading end of the jet. Each value measured at
points a and b fluctuates with a constant period. The
phase difference between the measurements is very
small. The jet is found to be almost axisymmetric. The
mixing between the jet and the ambient fluid occurs
extremely locally. When Re = 476, Γ also oscillates
with a constant period as shown in Fig. 7b. The
measuring points are located slightly below the top of
the jet. The oscillating amplitude and period are much
larger than those at Re = 95, and the phase inversion
occurs. These demonstrate that the top of the jet swings
markedly in the horizontal direction on the density
interface and that the mixing is activated there. The
variations at Re = 2,378 are shown in Fig. 7c. The
measuring points are located near the centerline of the
fully developed jet. The Γ-value is larger and fluctuates
irregularly. There is no correlation between the
measurements at points a and b. One can find that
eddies having various scales pass through the
measuring points and that the mixing becomes more
complicated and activated.
1,000 2,000 3,000 Re
Study of the Jet-Induced Mixing of Two-Layer Density-Stratified Fluid in a Rectangular Tank
122
Fig. 5 Vertical distribution of Γ at t*=14 (C0 = 0.02, z1 = 40 mm, z = 70 mm).
Fig. 6 Measuring points a and b for Γ on density interface.
Fig. 7 Time variation of Г at a and b (C0 = 0.02, z1 = 40 mm, z2 = 70 mm).
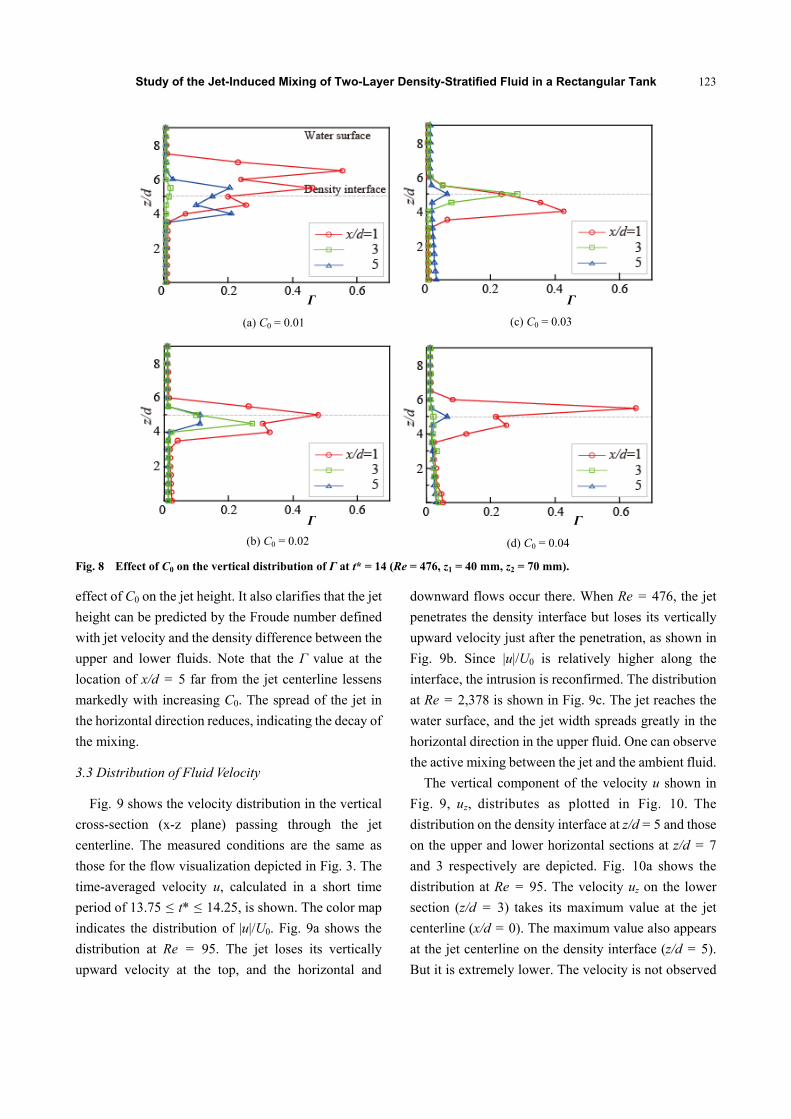
Fig. 8 shows the effect of C0 on the vertical change
in Γ, where Re = 476 and t* = 14. The jet behavior
corresponds to Pattern B. Irrespective of C0, Γ is very
high near the jet centerline (x/d = 1), with the maximum
value around the density interface (z/d = 5). The height
at which the maximum value occurs lowers with
increasing C0 when 0.01 < C0 < 0.03. This is because
the jet density is larger. Therefore the maximum height
of the jet lowers owing to the larger gravitational effect.
The previous study of Shakouchi et al. [7] reports such
1.0 0.8 0.6 0.4 0.2
(c) Re = 2,378 (Pattern C)
Γ
Γ
Γ at aΓ at b
Γ
Γ
Γ at aΓ at b
Γ
Γ
Γ at aΓ at b
(c) Re = 2,378 (Pattern C)
(b) Re = 476 (Pattern B) (b) Re = 476 (Pattern B)
(a) Re = 95 (Pattern A) (a) Re = 95 (Pattern A)
0 5 10 0
15 t*
1.0 0.8 0.6 0.4 0.2
0
0
1.0 0.8 0.6 0.4 0.2
0
0
5 10 t*
t*
15
15 10 5
Study of the Jet-Induced Mixing of Two-Layer Density-Stratified Fluid in a Rectangular Tank
123
Fig. 8 Effect of C0 on the vertical distribution of Г at t* = 14 (Re = 476, z1 = 40 mm, z2 = 70 mm).
effect of C0 on the jet height. It also clarifies that the jet
height can be predicted by the Froude number defined
with jet velocity and the density difference between the
upper and lower fluids. Note that the Γ value at the
location of x/d = 5 far from the jet centerline lessens
markedly with increasing C0. The spread of the jet in
the horizontal direction reduces, indicating the decay of
the mixing.
3.3 Distribution of Fluid Velocity
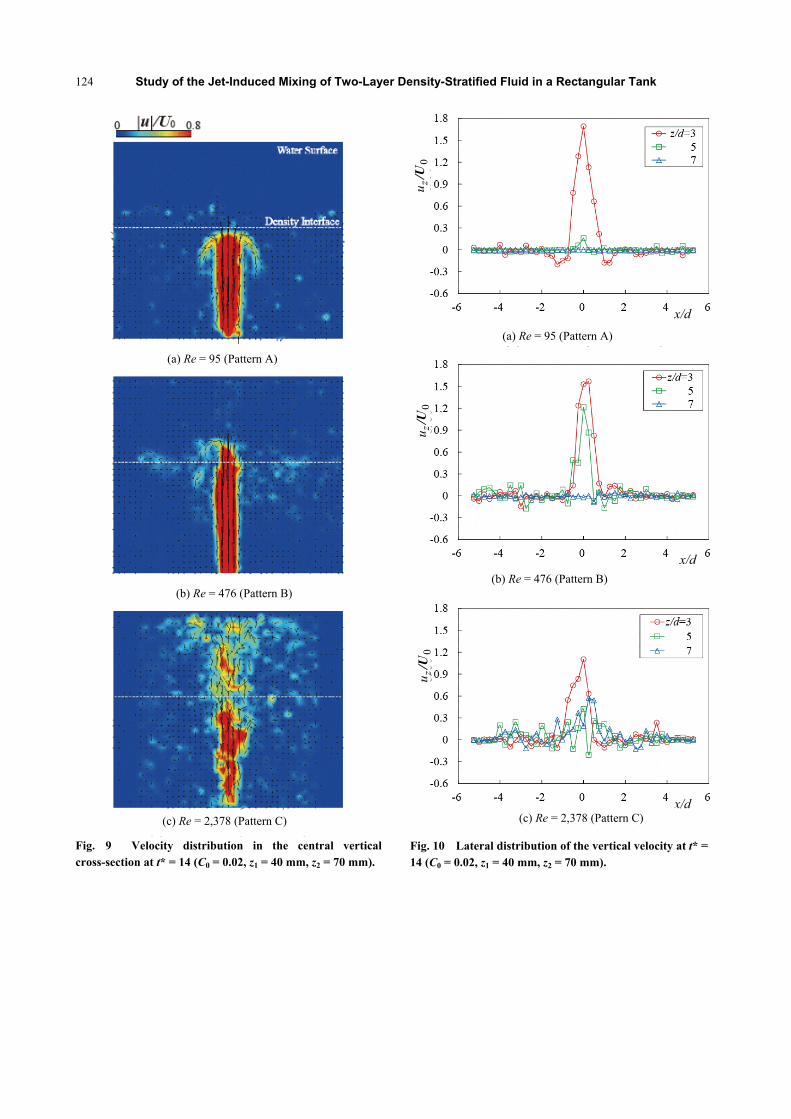
Fig. 9 shows the velocity distribution in the vertical
cross-section (x-z plane) passing through the jet
centerline. The measured conditions are the same as
those for the flow visualization depicted in Fig. 3. The
time-averaged velocity u, calculated in a short time
period of 13.75 ≤ t* ≤ 14.25, is shown. The color map
indicates the distribution of |u|/U0. Fig. 9a shows the
distribution at Re = 95. The jet loses its vertically
upward velocity at the top, and the horizontal and
downward flows occur there. When Re = 476, the jet
penetrates the density interface but loses its vertically
upward velocity just after the penetration, as shown in
Fig. 9b. Since |u|/U0 is relatively higher along the
interface, the intrusion is reconfirmed. The distribution
at Re = 2,378 is shown in Fig. 9c. The jet reaches the
water surface, and the jet width spreads greatly in the
horizontal direction in the upper fluid. One can observe
the active mixing between the jet and the ambient fluid.
The vertical component of the velocity u shown in
Fig. 9, uz, distributes as plotted in Fig. 10. The
distribution on the density interface at z/d = 5 and those
on the upper and lower horizontal sections at z/d = 7
and 3 respectively are depicted. Fig. 10a shows the
distribution at Re = 95. The velocity uz on the lower
section (z/d = 3) takes its maximum value at the jet
centerline (x/d = 0). The maximum value also appears
at the jet centerline on the density interface (z/d = 5).
But it is extremely lower. The velocity is not observed
Γ Γ
Γ Γ
(a) C0 = 0.01
(b) C0 = 0.02
(c) C0 = 0.03
(d) C0 = 0.04
Study of the Jet-Induced Mixing of Two-Layer Density-Stratified Fluid in a Rectangular Tank
124
Fig. 9 Velocity distribution in the central vertical cross-section at t* = 14 (C0 = 0.02, z1 = 40 mm, z2 = 70 mm).
(a) Re=95 (Pattern A)
(b) Re=476 (Pattern B)
(c) Re=2378 (Pattern C)
x/d
x/d
x/d
u/U
0z
u/U
0z
u/U
0z
Fig. 10 Lateral distribution of the vertical velocity at t* = 14 (C0 = 0.02, z1 = 40 mm, z2 = 70 mm).
(c) Re = 2,378 (Pattern C) (c) Re = 2,378 (Pattern C)
(b) Re = 476 (Pattern B)
(a) Re = 95 (Pattern A)
(b) Re = 476 (Pattern B)
(a) Re = 95 (Pattern A)

Study of the Jet-Induced Mixing of Two-Layer Density-Stratified Fluid in a Rectangular Tank
125
Fig. 11 Effect of C0 on the velocity distribution in the central vertical cross-section at t* = 14 (Re = 476, z1 = 40 mm, z2 = 70
mm).
in the region far from the jet centerline. There is no
flow on the upper section (z/d = 7). The velocity uz on
the lower section (z/d = 3) reaches the minimum value
at x/d = -1 and 1 on the right and the left sides of the jet
centerline. This is the result of the downward flow from
the top of the jet, as shown in Figs. 3 and 9. When Re =
476, such downward flow does not appears on the
lower section (z/d = 3), as found from Fig. 10b.
Comparing the velocity on the interface (z/d = 5) with
the result at Re = 95, the maximum value is rather
larger and the velocity uz also occurs in the region far
from the jet centerline. One can reconfirm the active
mixing along the density interface. But the flow hardly
exists on the upper section (z/d = 7), just as in the case
of Re = 95 Fig. 10c shows the distribution at Re =
2,378. The maximum velocity on the density interface
lowers and the momentum of the jet markedly diffuses
in the horizontal direction. The velocity is induced
even in the upper fluid. The mixing is highly activated.
Fig. 11 shows the effect of C0 on the velocity
distribution in the vertical cross-section passing
through the jet centerline, where Re = 476, z1 = 40 mm
and z2 = 70 mm. The time-averaged velocity u at 13.75
≤ t* ≤ 14.25 is plotted. The jet behavior corresponds to
Pattern B. When C0 = 0.01, the jet loses its vertically
upward velocity after penetrating the density interface.
The height, at which the jet loses the velocity, or the
maximum height of the jet lowers with increasing C0.
(a) C0 = 0.01
(b) C0 = 0.02
(c) C0 = 0.03
(d) C0 = 0.04
Study of the Jet-Induced Mixing of Two-Layer Density-Stratified Fluid in a Rectangular Tank
126
(a) C =0.01
(b) C =0.02
(c) C =0.03
(d) C =0.04
0
0
0
0
u/U
0z
u/U
0z u/U
0z
u/U
0z
x/d
x/d
x/d
x/d
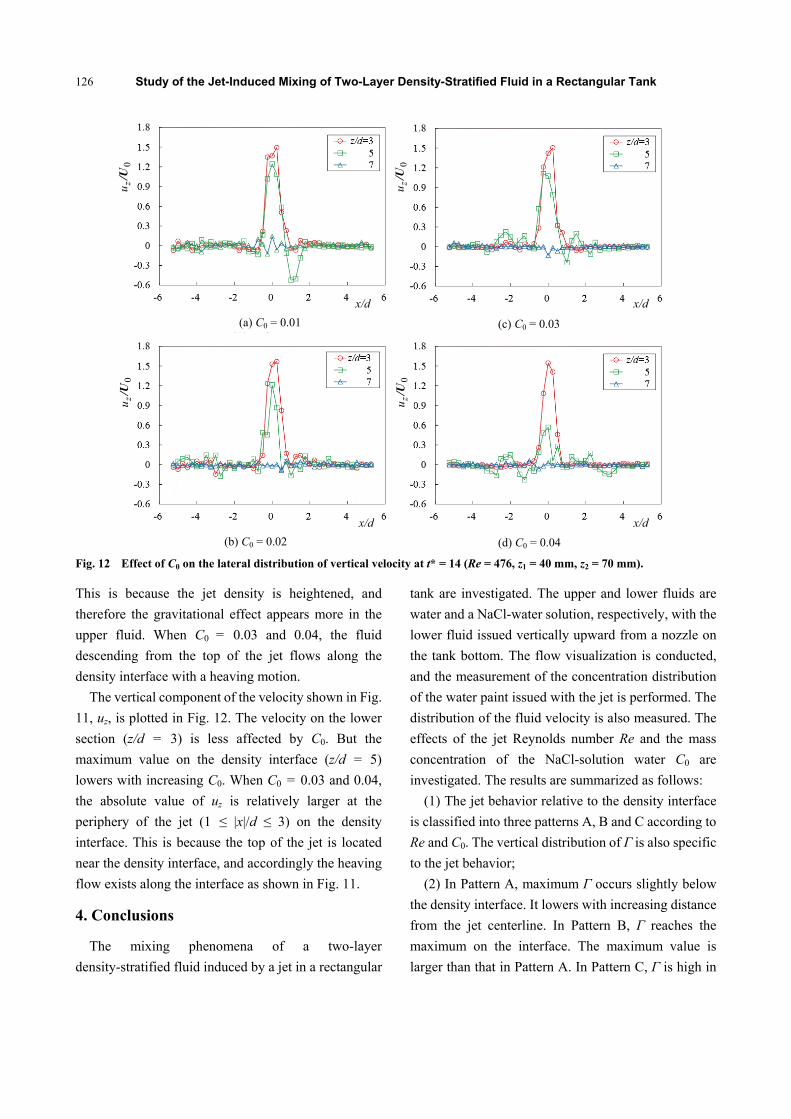
Fig. 12 Effect of C0 on the lateral distribution of vertical velocity at t* = 14 (Re = 476, z1 = 40 mm, z2 = 70 mm).
This is because the jet density is heightened, and
therefore the gravitational effect appears more in the
upper fluid. When C0 = 0.03 and 0.04, the fluid
descending from the top of the jet flows along the
density interface with a heaving motion.
The vertical component of the velocity shown in Fig.
11, uz, is plotted in Fig. 12. The velocity on the lower
section (z/d = 3) is less affected by C0. But the
maximum value on the density interface (z/d = 5)
lowers with increasing C0. When C0 = 0.03 and 0.04,
the absolute value of uz is relatively larger at the
periphery of the jet (1 ≤ |x|/d ≤ 3) on the density
interface. This is because the top of the jet is located
near the density interface, and accordingly the heaving
flow exists along the interface as shown in Fig. 11.
4. Conclusions
The mixing phenomena of a two-layer
density-stratified fluid induced by a jet in a rectangular
tank are investigated. The upper and lower fluids are
water and a NaCl-water solution, respectively, with the
lower fluid issued vertically upward from a nozzle on
the tank bottom. The flow visualization is conducted,
and the measurement of the concentration distribution
of the water paint issued with the jet is performed. The
distribution of the fluid velocity is also measured. The
effects of the jet Reynolds number Re and the mass
concentration of the NaCl-solution water C0 are
investigated. The results are summarized as follows:
(1) The jet behavior relative to the density interface
is classified into three patterns A, B and C according to
Re and C0. The vertical distribution of Γ is also specific
to the jet behavior;
(2) In Pattern A, maximum Γ occurs slightly below
the density interface. It lowers with increasing distance
from the jet centerline. In Pattern B, Γ reaches the
maximum on the interface. The maximum value is
larger than that in Pattern A. In Pattern C, Γ is high in
(a) C0 = 0.01
(b) C0 = 0.02
(c) C0 = 0.03
(d) C0 = 0.04

Study of the Jet-Induced Mixing of Two-Layer Density-Stratified Fluid in a Rectangular Tank
127
the broader region above the density interface;
(3) In Pattern B, Γ takes the maximum value at the
height near the density interface irrespective of C0. The
height lowers with increasing C0;
(4) The fluid velocity also depends on the jet
behavior relative to the density interface. In Pattern A,
the jet loses its vertically upward velocity when reaching
the interface, and the horizontal and downward flows
occur there. In Pattern B, the jet loses the vertically
upward velocity just after the penetration of the density
interface and the fluid velocity occurs along the
interface. In Pattern C, the jet velocity diffuses
markedly in the horizontal direction in the upper fluid;
(5) In Pattern C, the height at which the jet loses the
velocity lowers with increasing C0. When C0 = 0.03
and 0.04, the absolute value of the vertical velocity is
relatively larger at the periphery of the jet along the
density interface.
References
[1] Baines, W. D., Turner, J. S., and Campbell, I. H. 1990. “Turbulent Fountains in an Open Chamber.” Journal of Fluid Mechanics 212 (Mar.): 557-92.
[2] Bloomfield, L. J., and Kerr, R. C. 1998. “Turbulent Fountains in a Stratified Fluid.” Journal of Fluid Mechanics 358 (Mar.): 335-56.
[3] Bloomfield, L. J., and Kerr, R. C., 1999. “Turbulent Fountains in a Confined Stratified Environment.” Journal of Fluid Mechanics 389 (June): 27-54.
[4] Friedman, P., and Katz, J. 2000. “Rise Height for
Negatively Buoyant Fountains and Depth of Penetration
for Negatively Buoyant Jets Impinging an Interface.”
Journal of Fluids Engineering 122 (Apr.): 779-82.
[5] Lin, Y. J. P., and Linden, P. F. 2005. “The Entrainment
due to a Turbulent Fountain at a Density Interface.”
Journal of Fluid Mechanics 542 (Nov.): 25-52.
[6] Ansong, J. K., Kyba, P. J, and Sutherland, B. R. 2008.
“Fountains Impinging upon a Density Interface.” Journal
of Fluid Mechanics 595 (Jan.): 115-39.
[7] Shakouchi, S., Fukue, S., and Uchiyama, T. 2015.
“Investigation of the Behavior of a Jet Issued into
Two-Layer Density-Stratified Fluid.” Journal of Flow
Control, Measurement and Visualization 3 (1): 1-9.
[8] Shakouchi, S., Shimada, S., and Uchiyama, T. 2014.
“Numerical Simulation of Jet Flow Issued into
Density-Stratified Fluid by Vortex in Cell Method.”
Advances and Applications in Fluid Mechanics (accepted
and in press).
[9] Simpson, J. E. 1982. “Gravity Currents in the Laboratory,
Atmosphere, and Ocean.” Annual Review of Fluid
Mechanics 14 (Jan.): 213-34.