Embed Size (px)
Citation preview

Date 18 December 2017
Version Final
Study of the potential impact of onshore Coal Bed Methane production in Wales, as defined within the Petroleum Act 1998,
with regard to environmental, social and economic factors
Dr Muhammad Irfan
Research Associate
Geoenvironmental Research Centre
Cardiff University

1
1. Contents
1. Contents ................................................................................................................ 1
2. Summary ............................................................................................................... 2
3. Introduction .......................................................................................................... 3
4. Approach and methodology ................................................................................. 4
5. Site Suitability Maps .............................................................................................. 7
5.1 Environmental Domain ......................................................................................... 7
5.2 Public Health Domain ..........................................................................................11
5.3 Socio-Economic Domain .....................................................................................13
5.4 Techno-Economic Domain ..................................................................................18
5.5 Combined Domains .............................................................................................19
6. Site Ranking .........................................................................................................21
7. Site Impact Assessment ......................................................................................23
7.1 RIAM-based impact assessment of CBM ............................................................23
7.2 RIAM-based site baseline assessment ................................................................28
7.3 Interpretation ......................................................................................................31
8. References ..........................................................................................................39

2
2. Summary
Natural Resources Wales (NRW) commissioned Cardiff University`s Geoenvironmental Research
Centre (GRC) to carry out an investigation into the potential for Coalbed Methane (CBM) production
in Wales. Natural Resources Wales was interested in both the potential for Coalbed Methane (CBM)
production in Wales, and the potential impact of the production on socio-economic, environmental
and public health issues.
The study has been carried out using the Seren Spatial Decision Support System (Seren SDSS),
developed by the GRC as a part of the ERDF-funded Seren project. Seren SDSS has been developed
to support the decision-making needed to address complex problems related to geo-energy
applications such as Site Selection, Site Ranking and Site Impact Assessment. Seren SDSS combines
different GIS, Artificial Intelligence and Multicriteria Decision Analysis techniques as well as enabling
spatial knowledge discovery (Irfan, 2015; Irfan et al., 2017). This bespoke tool operates in an
integrated manner, considering environmental, socio-economic, public health and techno-economic
domains.
For Site Suitability and Site Ranking, contemporary qualitative and quantitative spatial information
across all aforementioned domains has been analysed and a series of maps, graphs and textual
information produced.
The Site Impact Assessment tool of the SEREN-SDSS has been applied to the sites that have been
granted planning permission for CBM development, as provided by NRW.
This report contains the obtained maps, indicators used for all four domains (environmental, socio-
economic, public health and techno-economic) as well as the relative weights to which they have
been assigned for analysis.

3
3. Introduction
Cardiff University’s Geoenvironmental Research Centre (GRC) were commissioned by National
Resources Wales (NRW) to carry out an investigation into the potential for Coal Bed Methane (CMB)
production in Wales. The full brief is reproduced below for completeness.
“Natural Resources Wales is looking to procure a short investigation into both the potential for
Coalbed Methane (CBM) production in Wales, and the potential impact of the production on socio-
economic, environmental and public health issues. The investigation should analyse contemporary
qualitative and quantitative spatial information across economic, socio-economic, environmental
and public health issues, thereby enabling policy makers to undertake an informed consideration of
the potential impact of CBM production in Wales.
Natural Resources Wales is looking for a supplier that has access to a robust spatial decision support
tool, and the expertise to apply the tool to investigate the potential impacts of CBM development in
Wales. The spatial decision support tool must be cable of providing visually intuitive representations
of the potential CBM reserves in Wales, and the potential impact of production (preferably via
shape-files). The tool must also determine the impact of any assumptions or weightings utilised by
its operator.
The investigation should consider:
1. Within the existing Welsh Petroleum Exploration and Development licensed areas, what potential exists to extract Coal Bed Methane from sites that are likely: a) to have minimum negative impact on the environment, b) to have positive impact on the socio-economic conditions of the communities living nearby, c) to be located in areas where public health is not already under stress, and d) to be economically and technically more viable than other potential areas?
2. For proposed developments that have existing planning consent and environmental permits for Coal Bed Methane exploratory activities (i.e. the location is already fixed), what would be the potential impact should the sites progress to production activities?
Performance expectations / outputs
The output of this study should be a series of shape-files that demonstrate the potential impact of
CBM production in Wales. It will also be necessary to provide commentary on the findings of the
investigations and any assumptions made.
4
4. Approach and methodology
In order to meet the specified tender requirements, the GRC utilised their in-house SEREN Spatial
Decision Support System (SEREN-SDSS) and adopted methodology similar to that presented in Irfan
(2015).
The system has been developed in order to facilitate decision-making regarding geo-energy
developments - in particular, problems related to Site Selection, Site Ranking and Site Impact
Assessment. SEREN-SDSS has different modules, either based on Multicriteria Decision Analysis
(MCDA) techniques or Artificial Neural Networks (Irfan et. al, 2017).
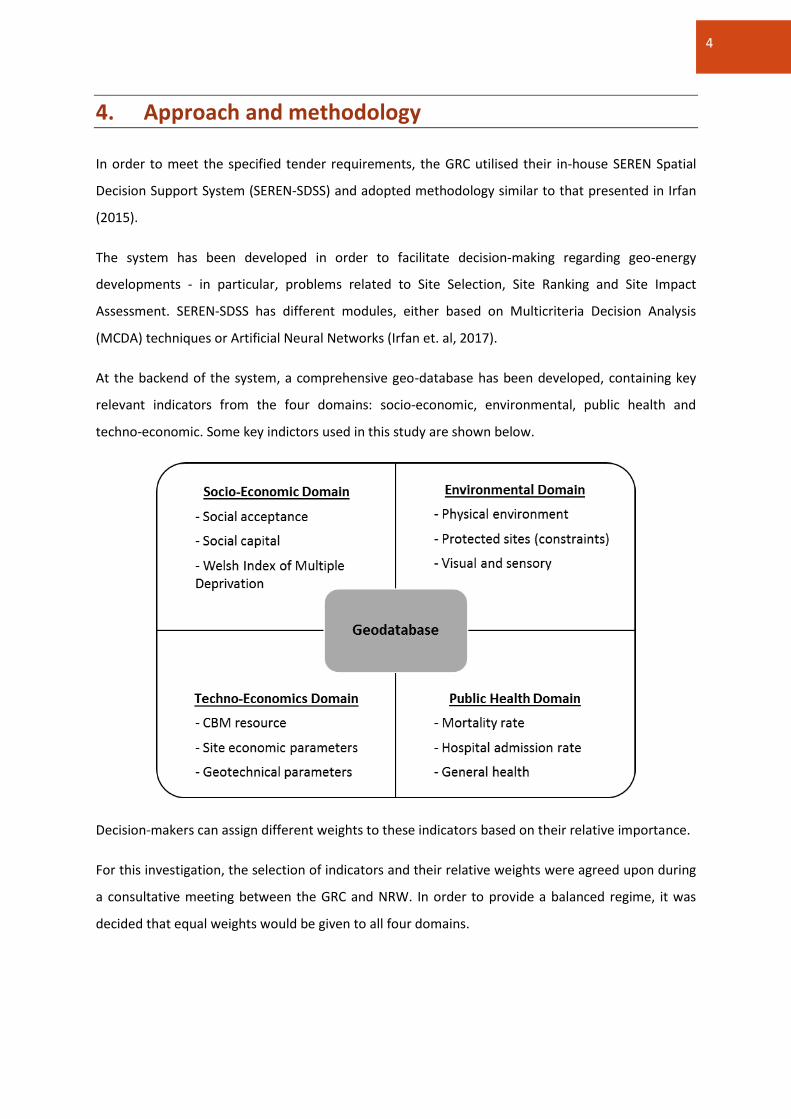
At the backend of the system, a comprehensive geo-database has been developed, containing key
relevant indicators from the four domains: socio-economic, environmental, public health and
techno-economic. Some key indictors used in this study are shown below.
Decision-makers can assign different weights to these indicators based on their relative importance.
For this investigation, the selection of indicators and their relative weights were agreed upon during
a consultative meeting between the GRC and NRW. In order to provide a balanced regime, it was
decided that equal weights would be given to all four domains.

5
Sub-weightings were applied to individual indicators within each domain, based on the outcome of
the consultation meeting mentioned above. Each is listed below in Tables 1, 2, 3 and 4, in sections
5.1, 5.2, 5.3 and 5.4 respectively.
Artificial Neural Networks find natural clusters in the data and assigns ranks to them based on these
indicators. The impact assessment modules also consider these indicators while assessing the
existing conditions in the neighbourhood of the proposed sites.
After indicators were selected and their relative weights assigned, the onshore coal bearing areas of
Wales were divided into 500m2 cells and populated with the chosen indicators. Following that,
SEREN-SDSS was applied in a stepwise manner in order to carry out the Site Suitability, Site Ranking
and Site Impact Assessment.
The Site Suitability assessment was undertaken in the first step. The AHP results generated from this
step provided numerical values to indicate the suitability of each cell with regard to each of the four
domains (environment, socio-economic, public health and techno-economic); these values were
used to create suitability maps (See Section 5). After the Site Suitability step, a filtration process was
applied in order to remove all the sites intersecting with constraint maps, e.g. Source Protection
Zones. After the filtration process, the Site Ranking step was carried out to rank sites according to
their suitability in terms of the AHP score from the four domains. Maps of best ranked sites are
presented in Section 6.
Site Suitability
•Site Suitability Analysis using the Analytical Heirarchy Process (AHP), based on the site selection module of the SEREN-SDSS using the key indicators of the four domains: Environmental, Public Health, Socio-Economic and Techno-Economic.
Site Ranking
•Site Ranking using Self-Organising Maps (SOM), based on the site ranking module of the SEREN-SDSS using the resultant maps of above domains.
Site Impact Assessment
•Site Impact assessment using the Rapid Impact Assessment Matrix (RIAM) module of the system, using Physical/Chemical, Biological/Ecological, Social/Cultural and Economics/Operational impacts.

6
For the second part of the brief, namely the assessment of all sites already possessing permits from
NRW, the Site Impact Assessment step was carried out using a Rapid Impact Assessment Matrix
(RIAM) tool. The RIAM approach accounts for the existing condition of key parameters in the
surrounding areas of the proposed sites.

7
5. Site Suitability Maps
Site Suitability has been carried out using the AHP-based site selection module of SEREN-SDSS. The
tool scales all participating indicators between 0 and 1 in order to normalise them appropriately
(gaining objectivity to individual units/currency). Scaling was carried out based on the nature of the
indicators i.e. whether a particular indicator is benefit (higher value indicating a better site) or cost
(lower value indicating a better site). This ensures that the contribution of each indicator and its sub-
indicators to the site suitability analysis is realistic. Maps produced from these results have been
populated using a colour scheme ranging from red (indicating that the site is, on a relative basis, very
unsuitable) to green (indicating that the site is, on a relative basis, very suitable). It is important to
emphasise that this colour scheme (as used in Figures 1-5) provides an indication of relative
suitability i.e. a green region is considered very suitable in comparison to the other areas considered
in the analysis; it is not an absolute measure that is definitively suitable.
The indicators used in the analysis under all four domains are provided in the following (Tables 1-4)
along with the produced maps (Figures 1-4). The sum of the relative weights of the indicators at each
level of the decision hierarchy in the AHP is equal to 1 (100%). The relative weight of a given
indicator is subdivided into its sub-indicators based on its relative importance. Details of the AHP
tool can be found in Irfan (2015) and Irfan et al. (2017).
5.1 Environmental Domain
As listed in Table 1, the indicators used for the environmental domain can be grouped into the
following categories.
i) Physical Environment. The physical environment indicators used in the construction of
environmental deprivation ranks in the Welsh Index of Multiple Deprivation (WIMD) were
acquired at the Lower Super Output Area (LSOA) level (Welsh Government, 2014).
ii) Proximity to CCW Protected Sites. The impact on protected areas is an important consideration
for the exploitation of Geoenergy resources. Therefore, the distances from the boundaries of
protected sites were calculated.
iii) CCW visual and sensory indexes. Visual and sensory indicators represent the landscape, scenic
beauty, and aesthetics of an area. This includes the Intrinsic Evaluation Matrix, which records
information about the ecological, visual, historical and cultural landscapes of Wales. The Intrinsic
Evaluation Matrix consists of indicators of the scenic quality, integrity, character, and rarity of
the landscape, as well as an overall index classifying the landscape as either “Outstanding”,

8
“High”, “Moderate” or “Low”. The Land Form indicator, which describes broader land cover,
comprised of slope and elevation, was also included within the visual sensory indicators (NRW,
2017).
iv) Ambient Air Quality. Modelled ambient air quality maps were acquired at 1km2 resolution. Each
map models the annual mean pollutant concentration in μgm-3, with the exception of CO, which
is modelled in mgm-3 (DEFRA, 2017).
Table 1. Environmental Indicators used in the Site Suitability Assessment
Indicator Weight
Physical Environment 0.25
WIMD-2014 Indicator of Air Quality (Emissions) 0.25
WIMD-2014 Indicator of Air Quality (Concentrations) 0.25
Flood Risk 2014 0.25
Proximity to waste disposal and industrial sites 2014 0.25
CCW Protected Sites 0.25
Distance from - Site of Special Scientific Interest (SSSI) 0.0833
Distance from - Special Areas of Conservation (SAC) 0.0833
Distance from - Special Protection Areas (SPA) 0.0833
Distance from - Wetlands of International Importance (Ramsar Sites) 0.0833
Distance from - National Nature Reserves (NNR) 0.0833
Distance from - Marine Nature Reserves (MNR) 0.0833
Distance from - Areas of Outstanding Natural Beauty (AONB) 0.0833
Distance from - Heritage Coasts 0.0833

9
Distance from - Biospheric Reserves 0.0833
Distance from - Biogenetic Reserves 0.0833
Distance from - Local Nature Reserves (LNR) 0.0833
Distance from - Source Protection Zones (SPZ) 0.0833
CCW Visual Sensory 0.25
Intrinsic Evaluation Matrix 0.5
Scenic Quality 0.2
Integrity 0.2
Character 0.2
Rarity 0.2
Overall Evaluation 0.2
Land Form 0.5
Ambient Air Quality 0.25
Benzene (Ambient) 0.125
CO (Ambient) 0.125
NO2 (Ambient) 0.125
NOX (Ambient) 0.125
PM2.5 (Ambient) 0.125
PM10 (Ambient) 0.125
SO2 (Ambient) 0.125
Ozone (Ambient) 0.125

10
Figure 1. Site suitability based on the Environmental domain Only
As shown in Figure 1, based on these indicators, the most suitable areas were found in the South
Wales valleys, within the county boroughs of Neath Port Talbot, Bridgend, Rhondda Cynon Taff,
Merthyr, Caerphilly, Gwent, and Torfaen, as well as the south-east of Wrexham, and central
Denbighshire. The least suitable areas were found around Swansea Bay and along the Dee Estuary in
Flintshire.

11
5.2 Public Health Domain
Public health indicators obtained from the NHS Wales Informatics Service (2017) were used to
identify sites with the least impact on public health. As listed in Table 2, the indicators used for the
public health domain can be grouped into the following categories.
i. Mortality Rates. These were obtained for the ‘all-cause’ case, as well as mortality rates specific
to cardiovascular disease and cancer. All data was obtained at the Middle Layer Super Output
(MSOA) level.
ii. Hospital Admission Rates. These were also obtained at MSOA level, for cancer, cardiovascular
and respiratory related admissions. The data is age-standardised as different age groups have
different death rates.
iii. Health per 100,000 people. Health indicators from the WIMD (Welsh Government, 2014) at the
LSOA level were also included in order to provide a finer level of detail.
Table 2. Public Health Indicators used in the Site Suitability Assessment
Indicator Weight
Mortality 0.4
Mortality All Cause - Death Rates (Age-Standardised) per 100,000 population(2010) 0.1111
Mortality All Cause - Death Rates (Age-Standardised) per 100,000 population, Females(2010) 0.1111
Mortality All Cause - Death Rates (Age-Standardised) per 100,000 population, Males(2010) 0.1111
Mortality All Cause - Death Rates (Age-Standardised) per 100,000 population <75 yrs - 2 Yr Range(2009-2010) 0.1111
Mortality All Cause - Death Rates (Age-Standardised) per 100,000 population, Females <75 yrs - 2 Yr Range(2009-2010) 0.1111
Mortality All Cause - Death Rates (Age-Standardised) per 100,000 population, Males <75 yrs - 2 Yr Range(2009-2010) 0.1111
Cancer Mortality - Death Rates (Age-Standardised) per 100,000 population(2015) 0.1111
Cancer Mortality - Death Rates (Age-Standardised) per 100,000 population <75 yrs - 2 Yr Range(2009-2010) 0.1111
Cardiovascular Mortality - Death Rates (Age-Standardised) 0.1111
12
per 100,000 population - 2 Yr Range(2009-2010)
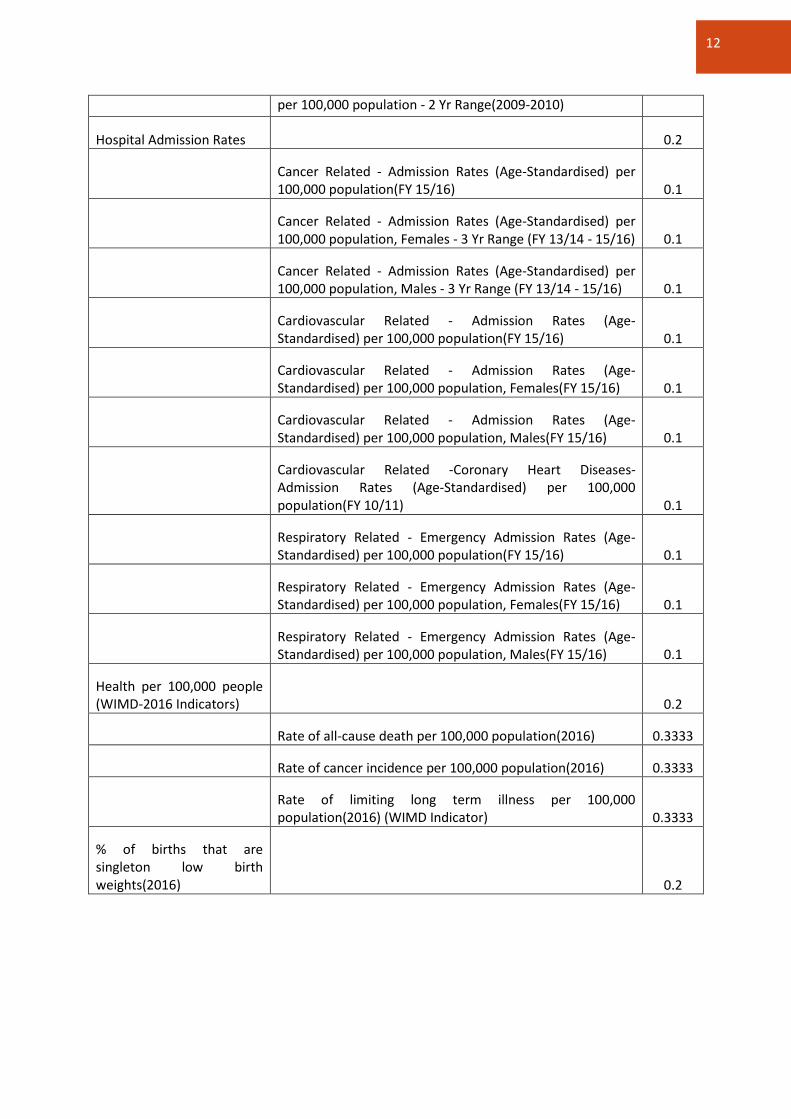
Hospital Admission Rates 0.2
Cancer Related - Admission Rates (Age-Standardised) per 100,000 population(FY 15/16) 0.1
Cancer Related - Admission Rates (Age-Standardised) per 100,000 population, Females - 3 Yr Range (FY 13/14 - 15/16) 0.1
Cancer Related - Admission Rates (Age-Standardised) per 100,000 population, Males - 3 Yr Range (FY 13/14 - 15/16) 0.1
Cardiovascular Related - Admission Rates (Age-Standardised) per 100,000 population(FY 15/16) 0.1
Cardiovascular Related - Admission Rates (Age-Standardised) per 100,000 population, Females(FY 15/16) 0.1
Cardiovascular Related - Admission Rates (Age-Standardised) per 100,000 population, Males(FY 15/16) 0.1
Cardiovascular Related -Coronary Heart Diseases- Admission Rates (Age-Standardised) per 100,000 population(FY 10/11) 0.1
Respiratory Related - Emergency Admission Rates (Age-Standardised) per 100,000 population(FY 15/16) 0.1
Respiratory Related - Emergency Admission Rates (Age-Standardised) per 100,000 population, Females(FY 15/16) 0.1
Respiratory Related - Emergency Admission Rates (Age-Standardised) per 100,000 population, Males(FY 15/16) 0.1
Health per 100,000 people (WIMD-2016 Indicators) 0.2
Rate of all-cause death per 100,000 population(2016) 0.3333
Rate of cancer incidence per 100,000 population(2016) 0.3333
Rate of limiting long term illness per 100,000 population(2016) (WIMD Indicator) 0.3333
% of births that are singleton low birth weights(2016)
0.2

13
Figure 2. Site Suitability based on the Public Health domain only
From Figure 2 it is evident that there is a high degree of spatial variation in public health indicators,
resulting in every county borough having a mix of highly suitable and highly unsuitable areas.
5.3 Socio-Economic Domain
As listed in Table 3, the indicators used for the socio-economic domain can be grouped into the
following categories.

14
i. Social Acceptance. Firstly, the distance between the proposed site and any residential areas was
used as a social acceptance indicator since communities closer to the site are more likely to have
concerns relating to environmental, health, safety, and socio-economic impacts. Secondly, the
Total Economic Value (TEV) of land was considered as it may be more difficult to acquire social
acceptance in regions of higher total economic value and it may increase the cost of the project
and therefore be financially less viable. TEV covers all the factors governing the market and non-
market value of the area (van der Horst 2007) and is a complex indicator; for simplicity, the
average household income is used as an indicator of TEV here, using the Experian average
household income data acquired at the LSOA level (Experian 2012). Thirdly, the potential
recreational value of land was considered since potential sites in areas of high recreational value
are less likely to get approval by authorities or attain social acceptance from the public. The
proximity of the site to national parks, woodlands, recreational areas, leisure facilities, and
RAMSAR sites was used as an indicator. Fourthly, proximity to existing industrial or mining
activity has been considered, since communities in the vicinity of prior industrial or mining
industry may be more likely to accept similar projects due to benefits of job and business
generation (this is somewhat offset by the potential for environmental degradation and
subsequent job creation from other sectors (Horst, 2007)). Fifthly, the income level of the
community was considered since low and medium income communities are more likely to
accept unconventional gas developments, as they can create opportunities to uplift their socio-
economic conditions (Garrone & Groppi, 2012). Data was obtained using ‘PayCheck’ developed
by CACI; the figures obtained account for investments, welfare support and income
supplements.
ii. Social Capital. A range of indicators were used to assess the level of social capital, whether
positive or negative (Foxton & Jones, 2011). Civic participation was measured by voter turnout
data (Plymouth University, 2013) and crime data was obtained from the Welsh Index of Multiple
deprivation Crime index. The other indicators were obtained from surveys (British Household
Panel Survey and the National Survey of Wales).
iii. Social Disadvantage. Indicators of social disadvantage are used to identify areas of deprivation
where new unconventional energy resources can support the local economy, create jobs and
build infrastructure, and so alleviate deprivation. The Welsh Indicator of Multiple Deprivation
(WIMD) was used as a measure of social disadvantage (Welsh Government, 2015).
iv. Population. Population data from the 2011 census (Office for National Statistics, 2017) is used to
help with infrastructure and contingency planning.

15
v. Labour Market. Labour market statistics are used to identify areas where a pool of skilled labour
is available and also areas with high unemployment
Table 3. Socio-Economic Indicators used in the Site Suitability Assessment
Indicator Weight
Social acceptance 0.25
Distance from siting 0.2
Total economic value of the land 0.2
Potential recreational value 0.2
Distance from existing industrial and mining activities 0.3
Income level of the community 0.1
Social capital 0.25
Civic participation 0.1667
Crime 0.1667
Rate of recorded criminal damage per 100 people (day-time population)(2016) 0.5
Rate of adult offenders per 100 people (adult population)(2008-2010) 0.5
Social participation 0.1667
BHPS- Attends religious services 0.333
BHPS- Attend local group/voluntary organisation 0.333
BHPS- Do unpaid voluntary work 0.333
Views of the local area 0.1667
NSW- Belonging to local area? 0.333
NSW- Safety at home after dark 0.333
NSW- Safety walking in local area after dark 0.333
Reciprocity and Trust 0.1667

16
NSW- Trusting people in the neighbourhood 0.25
NSW- Safe for children to play outside 0.25
NSW- People from different backgrounds get on well together 0.25
NSW- People treating each other with respect and consideration 0.25
Welsh language skills by LSOA. 2011 Census 0.1667
Social Disadvantage 0.25
WIMD Income 0.25
WIMD Employment 0.25
WIMD Health 0.25
WIMD Physical Environment 0.25
Population 0.1
Total population 0.6
Occupied Houses 0.4
Labour Market 0.15
Employment by industry 0.6
Manufacturing 0.1
Construction 0.6
Accommodation and food service activities 0.1
Administrative and support service activities 0.1
Professional, scientific and technical activities 0.1
Economic Activity 0.4
Economically active: Unemployed 1
17
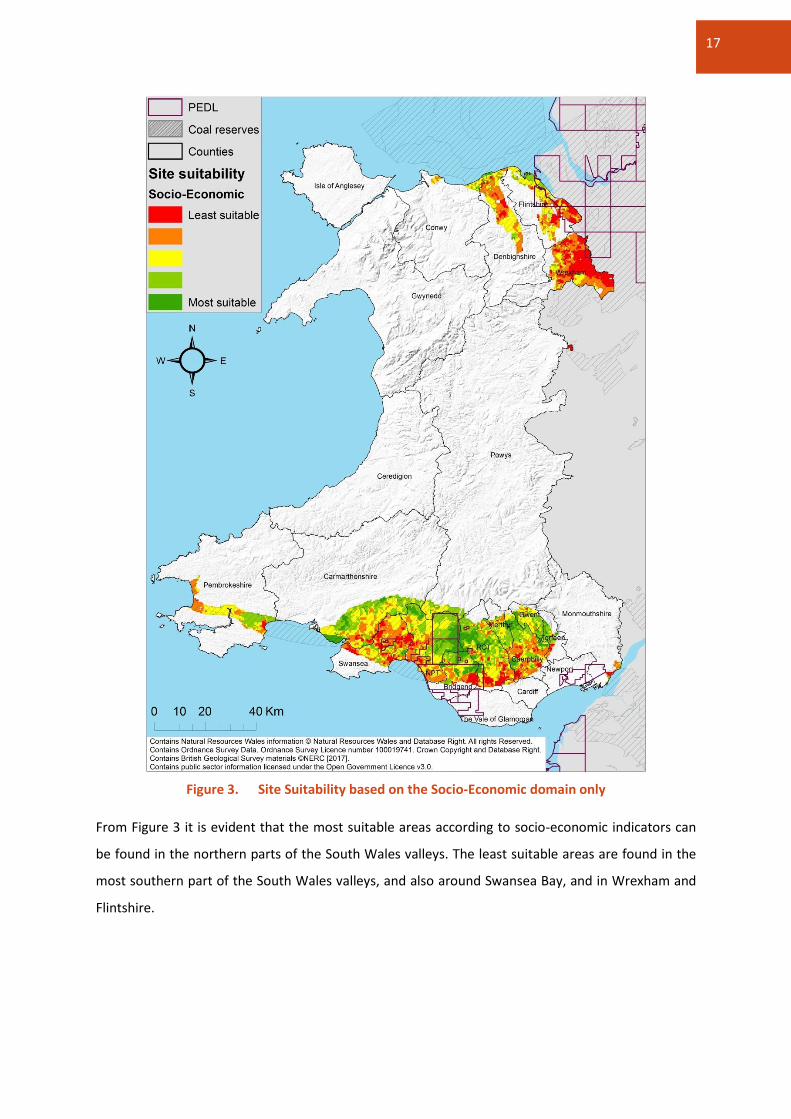
Figure 3. Site Suitability based on the Socio-Economic domain only
From Figure 3 it is evident that the most suitable areas according to socio-economic indicators can
be found in the northern parts of the South Wales valleys. The least suitable areas are found in the
most southern part of the South Wales valleys, and also around Swansea Bay, and in Wrexham and
Flintshire.

18
5.4 Techno-Economic Domain
As listed in Table 4, the indicators used for the techno-economic domain can be grouped into the
following categories.
i. Geology. The distance from geological features (fault lines and geological dykes) was calculated
in order to identify suitable sites.
ii. CBM Resource. An estimate of the CBM resource was calculated from the BGS coal datasets
(Jones, et al., 2004).
iii. Site Economic Parameters. Assessment of the economic indicators of the site is important with
regard to the economic viability of the site (DECC, 2012). Distance from major CO2 emitters and
distance from the gas feeder pipeline network have been considered.
iv. Terrain. The elevation and slope are important considerations for the feasibility of the site, also
for assessing project costs.
Table 4. Techno-Economic Indicators used in the Site Suitability Assessment
Indicator Weight
Geology 0.1
Distance From Fault Lines 0.5
Distance From Geological Dykes 0.5
CBM (Coal Bed Methane) 0.7
H - Coal Thickness (m) 0.25
D - Coal Density (g/cm3) 0.25
C- Gas Content (m3/t) 0.25
A- Area of Coal (km2) 0.25
Site Economic Parameters 0.1
Distance from major CO2 emitters 0.5
Distance from gas feeder pipeline network 0.5
Terrain 0.1
Elevation 0.5
Slope 0.5

19
Based on the techno-economic indicators, the area north of the county of Swansea was identified as
the most suitable. Suitability generally decreases as one moves further from this area as shown in
Figure 4.
Figure 4. Site Suitability based on the Techno-Economic domain only
5.5 Combined Domains
In order to consider a balanced approach, equal weights have been assigned to all four domains to
analyse combined site suitability. When all of the above indicators are combined, the most suitable
20
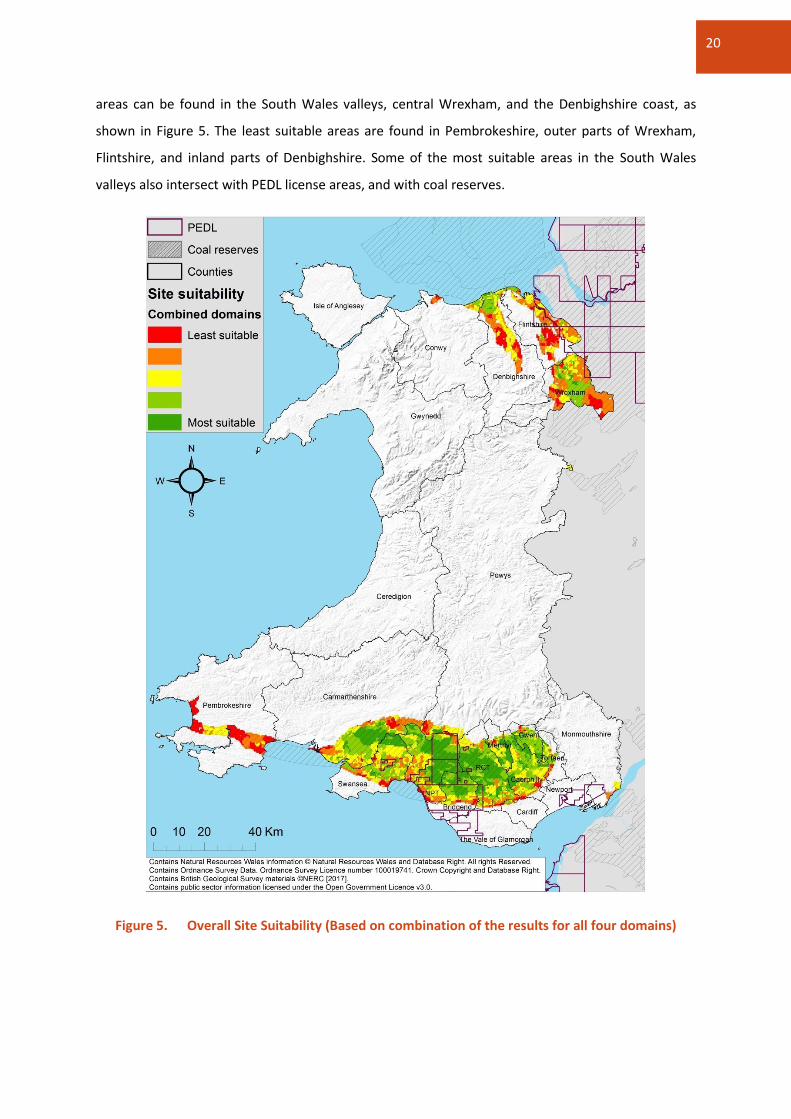
areas can be found in the South Wales valleys, central Wrexham, and the Denbighshire coast, as
shown in Figure 5. The least suitable areas are found in Pembrokeshire, outer parts of Wrexham,
Flintshire, and inland parts of Denbighshire. Some of the most suitable areas in the South Wales
valleys also intersect with PEDL license areas, and with coal reserves.
Figure 5. Overall Site Suitability (Based on combination of the results for all four domains)

21
6. Site Ranking
Site suitability, as discussed in the preceding section, gave a general overview of the study area in
terms of the relative suitability of different areas based on the chosen indicators and their assigned
weights. The next step was to reduce the number of potential sites by assigning a rank. Before the
ranking was carried out, a buffer of 500 meters was generated around the strategic environmental
areas (constraint maps) e.g. Source Protection Zones (SPZ). Any site intersecting with these buffers
was removed from the dataset.
Following the aforementioned filtration process, site ranking was carried out using the site ranking
module of the SEREN-SDSS. Since site ranking is crucial for prioritising site development, it is
important that further intervention from the user (now that the various weights have been assigned)
is kept to a minimum at this stage (Irfan, 2015; Irfan et al., 2017). Therefore, the site ranking module
of the SEREN-SDSS has been developed using a special type of unsupervised Artificial Neural
Networks, called Self-Organizing Maps (SOMs). SOMs have the capability to reduce the dimensions
of the problem and to identify naturally occurring clusters in the data; that is, they compact the
influence of the many factors (across all domains) that indicate the suitability of the site, into a
single-value index (in the case of a one-dimensional SOM) that allows for comparison between sites.
Therefore, the output map of a SOM is a low dimensional network of neurons (usually one-
dimensional or two-dimensional) which is an abstraction of the high dimensional input data space.
SOM preserves the natural structure (similarity or dissimilarity of input data points in terms of the
considered domains) of the input data using a neighbourhood function, while mapping it from high
dimensional input to a low dimensional output map. One-dimensional SOMs have the inbuilt
capability to order themselves in ascending or descending order after convergence. Each neuron in a
one-dimensional SOM represents a naturally occurring cluster of data points in the input data space
(Kohonen, 2001). Because of its self-ordering capability, these natural clusters in the data are
assigned a rank, based on their position in the output one-dimensional map. This ensures that
ranking is carried out based on natural data values, without requiring further intervention from the
user.
Another advantage of using one-dimensional SOMs for site ranking purpose is that they don’t force
equal number of input data points (e.g sites) into clusters. Rather each cluster represents a group of
data points that naturally fits into that cluster based on the similarity of considered domains. For
example, if the input data has to be ranked from 1-10, each ranked cluster may represent a different
number of sites. The number of sites represented by each cluster will change if the ranking is
22
increased (e.g 1-20) or decreased (e.g. 1-5), by finding new natural clusters (Irfan, 2015; Irfan et al.,
2017).
During the consultative meetings between the GRC and NRW, it was decided that the AHP score of
the four domains (acquired during the site selection step earlier) will be used to rank the sites from 1
to 20. Therefore, the input data space had four dimensions and the output was a one-dimensional
SOM (1X20). It is important to mention here that these clusters are not to be confused with
geographical clusters. A rank being assigned to sites, is not based on their geographical contiguity,
rather it is based on how similar they are in terms of the AHP score of the four domains used for
clustering and ranking purpose.
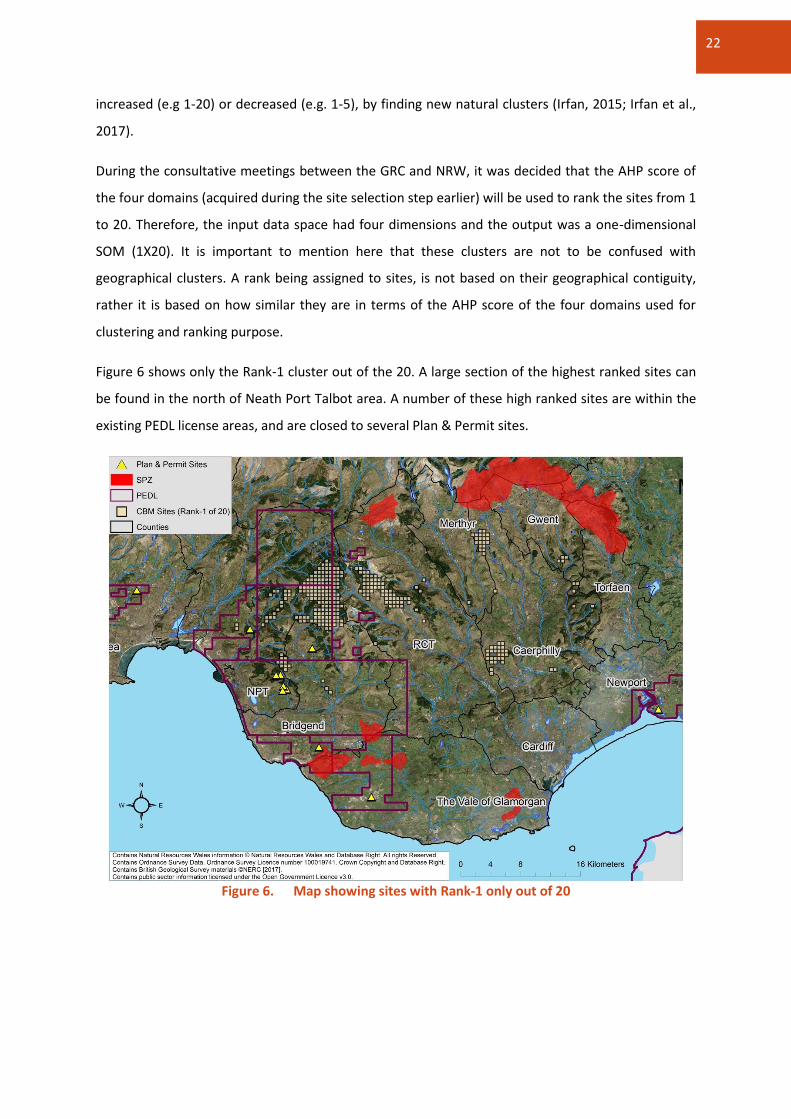
Figure 6 shows only the Rank-1 cluster out of the 20. A large section of the highest ranked sites can
be found in the north of Neath Port Talbot area. A number of these high ranked sites are within the
existing PEDL license areas, and are closed to several Plan & Permit sites.
Figure 6. Map showing sites with Rank-1 only out of 20

23
7. Site Impact Assessment
This section details an assessment of the impact of CBM on the eleven sites listed in Table 5. These
sites have existing planning consent and environmental permits for CBM exploratory activities.
The potential impact of CBM at a particular site has been deduced using the following approach.
First, the impact of CBM technology itself has been assessed, independent of any specific site, using
the RIAM tool of SEREN-SDSS. Results from this phase of the assessment process are detailed in
Section 7.1. Secondly, the current status of each of the sites listed in Table 5 has been assessed with
regard to the various factors that are likely to be affected by the introduction of CBM technology to
that site. The results of this phase of the assessment are detailed in Section 7.2. In Section 7.3, an
interpretation of the results provided in Sections 7.1 and 7.2 is given by considering the impact of
the technology itself in the context of the baseline results for each site. For example, an
interpretation regarding the significance of job creation is given by setting the potential for job
creation arising from the technology itself (as described in Section 7.1) in the context of the need for
job growth in the area surrounding each site (as described in Section 7.2).
Table 5. Proposed sites for CBM development
Site Local Authority PEDL Hydrocarbon Easting Northing
A Newport 157 Conventional crude oil exploration 333548 183398
B NPT 215 CBM & Shale exploration 279045 194113
C Bridgend 216 CBM exploration 288251 178367
D VOG 217 CBM exploration 295245 171717
E Bridgend 149 Abandoned coal mine methane production 287359 191561
F Swan 214 CBM exploration 263927 199294
G NPT 100 CBM production 283113 188009
H NPT 100 CBM production 283930 186073
I NPT 100 CBM production 282525 187958
J NPT 100 CBM production 283496 186518
K NPT 100 CBM production 283392 185904
7.1 RIAM-based impact assessment of CBM
An impact assessment of the CBM technology itself, irrespective of the specifics of the chosen site,
has been carried out using the RIAM module of the SEREN-SDSS. In the RIAM method, each aspect of
the technology is evaluated against a range of environmental factors; for example, increase in traffic

24
or increase in pollution due to work at site. Each environmental factor is classified into one of four
categories:
1. Physical/Chemical (P/C)
2. Biological/Ecological (B/E)
3. Social/Cultural (S/C)
4. Economics/Operational (E/O)
Each environmental factor is evaluated against five criteria: (A1) the importance of the condition,
(A2) the magnitude/effect of the change, (B1) its permanence (B2) its reversibility and (B3) whether
it has a cumulative effect. For example, with reference to Table 6, if the ‘disposal of water’
environmental factor is assigned an A1 ranking of 3 and an A2 ranking of -2 then the appropriate
interpretation is that ‘disposal of water’ is important to regional/national interests and can have a
significant deterioration to the status quo. Similarly, B1, B2 and B3 rankings of 2, 2 and 3 respectively
indicate that ‘disposal of water’ is temporary, reversible and cumulative. The overall assessment
score (ES), which provides an integer-value indication of the impact of a particular environmental
factor (such as ‘disposal of water’) is calculated as follows (Pastakia and Jensen 1998):
𝐸𝑆 = (𝐴𝑇) × (𝐵𝑇)
where:
𝐴𝑇 = (𝐴1) × (𝐴2)
𝐵𝑇 = (𝐵1) + (𝐵2) + (𝐵3)
Here we draw attention to the difference between the influence of the A criteria (the importance of
the condition, and the magnitude/effect of the change) on 𝐸𝑆 compared with the influence of the B
criteria (permanence, reversibility and cumulative nature). In particular we can make the
classification:
Group A. Criteria that are of high importance and can individually exert a significant bearing
on the overall assessment score that is obtained (for example, an A1 score of 0, indicating that
the factor is of no importance, will result in an overall 𝐸𝑆 score of 0 irrespective of the values of
A2, B1, B2 and B3).
Group B. Criteria that influence the overall 𝐸𝑆 score but cannot, in isolation, have a
controlling impact.

25
Table 6. Assessment criteria (Pastakia & Jensen, 1998)
Criteria Scale Description
A1: Importance of the condition 4 Important to national/international interests
3 Important to regional/national interests
2 Important to areas immediately outside the local condition
1 Important only to the local condition
0 No importance
A2: Magnitude of change/effect 3 Major positive benefit
2 Significant improvement to status quo
1 Improvement to status quo
0 No change/status quo
−1 Negative change to status quo
−2 Significant deterioration to status quo
−3 Major dis-benefit or change
B1: Permanence 1 No change/not applicable
2 Temporary
3 Permanent
B2: Reversibility 1 No change/not applicable
2 Reversible
3 Irreversible
B3: Cumulative 1 No change/not applicable
2 Non-cumulative/single
3 Cumulative/synergistic
Once the overall assessments score (ES) has been calculated for an individual environmental factor,
a range band can also be assigned to classify it, using Table 7. For example, the ES score for ‘disposal
of water’ was found to be -42 and so this is classified into range band -D, meaning ‘disposal of water’
during CBM possess ‘significant negative change/impacts’.

26
Table 7. Look up table for Environmental Scores and Range Bands (Pastakia & Jensen, 1998)
Environmental Score Range Bands Description of Range Bands
+72 to +108 +E Major positive change/impacts
+36 to +71 +D Significant positive change/impacts
+19 to +35 +C Moderately positive change/impacts
+10 to +18 +B Positive change/impacts
+1 to +9 +A Slightly positive change/impacts
0 N No change/status quo/not applicable
−1 to −9 −A Slightly negative change/impacts
−10 to −18 −B Negative change/impacts
−19 to −35 −C Moderately negative change/impacts
−36 to −71 −D Significant negative change/impacts
−72 to −108 −E Major negative change/impacts
Following consultation with NRW, several RIAM components were identified under the four
categories (physical/chemical, biological/ecological, social/cultural and economic/operational). Table
8 shows these components along with the values of the impact assessment criteria, overall
environmental score (ES) and classifying range bands.
Table 8. RIAM impact components with their individual scores
Category Impact Component A1 A2 B1 B2 B3 ES Range
Band
Ph
ysic
al/C
he
mic
al
Disposal of water 3 -2 2 2 3 -42 -D
Contamination of surface water due to wellbore integrity
2 -1 2 2 3 -14 -B
Soil disturbance due to site 1 -1 2 2 2 -6 -A
Increase in air pollution due to work at site 2 -1 2 2 3 -14 -B
Increase in air pollution due to transportation 3 -2 2 2 3 -42 -D
Fugitive methane emissions 3 -2 2 2 3 -42 -D
Contamination of ground water due to borehole integrity
3 -2 2 2 3 -42 -D
Contamination of soil in the surrounding areas 1 -1 2 2 3 -7 -A
Lowered ground water table 0 0 1 1 1 0 N
Minor tremors caused by drilling and extraction process
1 0 2 2 3 0 N
Infrastructure wear and tear 3 -1 2 2 3 -21 -C
Contamination of aquifer due to wellbore 3 -2 2 2 3 -42 -D

27
integrity
Methane migration in aquifers 1 -2 2 2 3 -14 -B
Bio
logi
cal/
Eco
logi
cal
Impact of noise on wildlife 1 -1 2 2 3 -7 -A
Night time light pollution for wildlife 1 -2 2 2 3 -14 -B
Effect on aquatic wildlife 1 -1 2 2 3 -7 -A
Habitat fragmentation and loss 1 -1 2 2 3 -7 -A
Forest cut down for sitting 1 -1 2 2 3 -7 -A
Soci
al/C
ult
ura
l
Increase in traffic 2 -2 2 2 3 -28 -C
Resettlement of people from siting areas 0 0 1 1 1 0 N
Social acceptance 3 -2 2 2 3 -42 -D
Health and safety of general public due to normal operations
1 -1 2 2 3 -7 -A
Health and safety on workers in case of accident 1 -1 2 2 3 -7 -A
Health and safety of general public in case of accident
2 -1 2 2 3 -14 -B
Migration workers (impact on local communities) 2 -1 2 2 3 -14 -B
Effect on scenic quality of the area 2 -1 2 2 3 -14 -B
Employment generation for surrounding communities
2 1 2 2 3 14 +B
Eco
no
mic
/ O
per
atio
nal
Cost of water treatment 0 0 1 1 1 0 N
Loss of agricultural land 1 -1 2 2 3 -7 -A
Disturbance in grazing patterns 0 0 1 1 1 0 N
Local jobs creation 1 1 2 2 3 7 +A
Effect on energy situation 3 3 2 2 3 63 +D
Amount and value of methane gas produced 3 3 2 2 3 63 +D
Cost of processing the produced gases 0 0 1 1 1 0 N
Cost of transporting produced gas to be utilised 0 0 1 1 1 0 N
Cost of treatment of CO2 and its transportation to the site
0 0 1 1 1 0 N
Economic growth 3 1 2 2 3 21 +C
Effect on housing and infrastructure 2 1 2 2 3 14 +B
Figure 7 shows the breakdown of the RIAM results for each of the four domains. Results show that
most of the positive scores are associated with the Economic/Operational category. Components in
the other three categories have mostly negative scores. However, despite these negative scores, it is
notable that none of the impacts are classified as being of major negative change or impact (group –
E). Most of the negative impacts are temporary and reversible. It is emphasised that this assessment

28
(the results listed in Table 8 and shown in Figure 7) refer to the assessment of the CBM technology
itself, and are not specific to a particular site.
Figure 7. Results of RIAM analysis, by domain
7.2 RIAM-based site baseline assessment
To carry out the baseline assessment, that is, to establish the current status of each of the
considered sites, a subset of the RIAM components listed in Table 8 (i.e. those considered in Section
7.1) have been considered. As listed in Tables 9 and 10, only those depending on geographical data,
and are therefore specific to the individual sites, have been considered for the baseline assessment.
Table 9 contains the quantitative indicators while Table 10 contains the qualitative indicators. The
distinction is clarified here with an example: ‘Air Emissions 2014’ is a quantitative indicator since it
can take varying levels of severity depending on its magnitude whereas ‘forest cover’ is a qualitative
indicator as trees are either present or not. In the case of qualitative indicators, separate classes are
considered; for example, five classes are considered for: ‘forest cover’ for the different types of tree.
For each site, a buffer zone of 1000m radius around each site has been considered as the
representative area to carry out the baseline impact assessment. For the qualitative indicators, in
order to provide greater insight, the proportion of each buffer zone affected by each indicator has
been determined (e.g. for ‘forest cover’, the percentage area covered by each tree type has been

29
determined). For the quantitative indicators, the system generates maximum, minimum and average
values within the buffer zone.
The site analyser tool (a sub-tool of RIAM-based impact assessment tool of SEREN-SDSS) has been
used to carry out the baseline assessments.
Table 9. Quantitative indicators linked with the RIAM components
RIAM Component RIAM Category
Indicator RIAM ES Band
Increase in air pollution due to work at site
P/C
WIMD-2014 Indicator of Air Quality (Emissions)
-B
WIMD-2014 Indicator of Air Quality (Concentrations)
-B
Increase in air pollution due to transportation
P/C WIMD-2014 Indicator of Air Quality (Emissions)
-D
WIMD-2014 Indicator of Air Quality (Concentrations)
-D
Minor tremors caused by drilling and extraction process
P/C Distance From Fault Lines
N
Distance From Geological Dykes
N
Habitat fragmentation and loss B/E
Distance from - Site of Special Scientific Interest (SSSI)
-A
Distance from - Special Areas of Conservation (SAC)
-A
Distance from - Special Protection Areas (SPA)
-A
Employment generation for surrounding communities
S/C WIMD-2014 Employment
+B
Local jobs creation E/O Census-2011 Employment by industry (Construction)
+A
Census-2011 Employment by industry (Manufacturing)
+A
Census-2011 +A

30
Employment by industry (Accommodation and food service activities)
Census-2011
Employment by
industry
(Administrative and
support service
activities)
+A
Census-2011 Employment by industry (Professional, scientific and technical activities)
+A
Effect on housing and infrastructure E/O WIMD-2014 Housing
+B
Table 10. Qualitative indicators linked with the RIAM components
RIAM component Category Linked Indicator Discrete Class RIAM ES Band
Contamination of aquifer due to wellbore integrity
P/C HydroGeological Features
Coastline Brackish -B
Highly productive aquifer
-B
Low productivity aquifer
-B
Moderately productive aquifer
-B
Rocks with essentially no groundwater
-B
Fugitive methane emissions
P/C
Gas Hazard - Methane and CO2 in superficial geology
No Hazard -D
Potential gas hazard from peat
-D
Methane migration in aquifers
P/C HydroGeological Features
Highly productive aquifer
-B
Low productivity aquifer
-B
Moderately productive aquifer
-B

31
Contamination of aquifer due to wellbore integrity
P/C
Source Protection Zones (SPZ)
Inner Protection Zone
-D
Outer Protection Zone
-D
Total catchment -D
Methane migration in aquifers P/C
Source Protection Zones (SPZ)
Inner Protection Zone
-B
Outer Protection Zone
-B
Total catchment -B
Forest cut down for siting
B/E
Forest Cover (welsh Forestry Commission)
Broadleaved -A
Conifer -A
Mixed mainly broadleaved
-A
Mixed mainly conifer -A
Young trees -A
Effect on scenic quality of the area
S/C
LandMap (Scenic Quality)
High -B
Outstanding -B
Loss of agricultural land E/O Corine Land Cover 2006
Heterogeneous agricultural areas
-A
Pastures -A
Permanent crops -A
Disturbance in grazing patterns
E/O Corine Land Cover 2006
Pastures N
7.3 Interpretation
The results of both qualitative and quantitative baseline assessment for each of the eleven proposed
sites are provided fully in Tables 11 and 12 at the end of this section. These results provide a critical
reference point for assessing changes and impact, as it establishes a basis for comparing the
situation before and after the CBM site development. In the following, interpretation of the results is
provided on a relative basis, that is, the impact on any one site of a particular RIAM component is
evaluated in comparison to the impact of that component on the other sites. To clarify, no findings
are drawn on an absolute basis regarding the impact any one parameter will exert on a particular
site.
In the following, each of the indicators is considered in turn to highlight the main trends in the data.
Air quality. Analysing the baseline values for proposed sites, it is evident that Site-C has the
worst existing air quality among the proposed eleven sites, followed by Site-A, Site-B and

32
Site-E. The RIAM components for air quality (Table 8) suggest that air quality will deteriorate
as a result of work at site and the transport involved during the operation. Therefore, it is
anticipated that air quality at these sites will deteriorate further compared to the others
considered here, with potentially negative environmental impact.
Minor Tremors. Referring to Table 8, the impact of minor tremors has been classified as N
(no change/ status quo/ not applicable). However, for completeness, we note that the
baseline data indicates that Site-G and Site-H are closest to geological fault lines, while Site-
D is the closest to a geological dyke. Therefore, if there were to be an impact of minor
tremors, the analysis reported here indicates that these sites are more vulnerable than the
other considered.
Habitat fragmentation and loss. To assess the impact of habitat fragmentation and loss, the
distances of each buffer zone from SSSI, SAC and SPA were analysed. As listed in Table 8, the
relevant RIAM component has been identified as –A (slightly negative change/impacts).
From the baseline data, it is evident that Site-A is the closest to all three critical
environmental areas, i.e. SSSI, SAC and SPA. Site-F and Site-E are also very close to SSSI. Site-
C is close to both SSI and SAC.
Employment generation. The RIAM component of employment generation for surrounding
communities has been linked with the WIMD-2014 (Employment rank) indicator. The impact
has been evaluated as +B (Positive change/impact). By looking at the baseline values of the
WIMD employment indicator in the neighbourhood of the proposed sites, it is evident that
Site-A, Site-E and Site-G are more deprived compared to the other sites based on the WIMD-
2014 employment indicator. It is therefore evident that site development at these locations
may help improve the employment status of these areas to a greater extent than the others.
Local job creation. The RIAM component for local job creation has been linked with the
Census-2011 Employment by Industry dataset. CBM site development is expected to create
some local jobs related to construction, manufacturing, accommodation, food services,
administrative, support service, professional, scientific and technical activities. This impact
component has been identified as +A (Positive change/impact). The baseline data shows that
Site-A and Site-B have the highest proportion of the population associated with jobs related
to construction. Site-A and Site-D have highest proportion of the population associated with
jobs related to accommodation and food services. The surrounding areas of these sites
provide an existing skillset for the types of jobs that are likely to be created from CBM
development.

33
Accommodation and housing. The RIAM impact component for accommodation and housing
is +B (positive change/impact) and is linked with the WIMD-2014 (Housing Rank) indicator.
By looking at the baseline values for each of the eleven sites, it is evident that Site-A is the
worst in terms of the existing housing situation. The rest of the sites have much better
existing housing situation. Development at Site-A has the potential to increase further
pressure on the existing housing situation of this area.
Aquifer contamination due to wellbore integrity. The RIAM component of aquifer
contamination due to wellbore integrity has been identified as –D (significant negative
change/impact). This impact component has been linked with the Hydrogeological Features
data provided by the BGS and Source Protection Zones (SPZ) data provided by NRW. Both
these datasets are qualitative in nature, therefore their discrete classes has been used for
the baseline assessment. The percentage of the buffer zone area (1000m radius circle) that
is covered by the given discrete classes has been analysed. By looking at these baseline
figures, it is evident that none of the proposed eleven sites intersect with the ‘highly
productive’ class of the hydrogeological features dataset. However all of the sites intersect
with the ‘moderately productive aquifers’ class. In terms of SPZ data, Site-C is the closest to
the ‘inner protection zone’ class of the SPZ. Its buffer zone area intersects with this critical
resource. Therefore, Site-C is the most susceptible to causing contamination due to wellbore
integrity. The same indicators have been linked with the RIAM impact component of
methane migration in aquifers. Therefore, the susceptibility to causing contamination
remains the same for this case. All of the proposed sites intersect with ‘moderately
productive aquifers’ class of the BGS Hydrogeological features data.
Fugitive methane emissions. The impact component of fugitive methane emissions from the
site has been identified as –D (significant negative change/impacts). Although the fugitive
methane emission can be linked to wellbore integrity (discussed above) and storage at the
site, it is also important to analyse the existing hazard of methane in the superficial geology.
Therefore, the BGS data of Gas Hazard in superficial geology has been linked to this impact
component. It is evident from the baseline values that none of the proposed sites with their
applied buffer zones intersect with any designated hazardous areas in terms of methane or
CO2 in the superficial geology.
Forest cut down for siting. The RIAM component of forest cutting to allow for site
development has been identified as –A (Slightly negative change/impact). This component
has been linked with the Welsh Forestry Commission’s Forest cover dataset. Site-A and Site-
D are the best in terms of this impact component since their buffer zones doesn’t have any

34
forest cover. Sites B, C, F and K have broadleaved forests enclosed within their buffer zones.
Sites B and K have significant areas covered under conifer forest. Site B has some area
covered by young trees. Sites C and F have some areas under cover of mixed forest types.
Effect on scenic quality of the area. The RIAM impact components related to effects of scenic
quality of the area has been identified as –B (negative change/impacts). This impact
component has been linked with the LandMap-Scenic Quality dataset provided by NRW. The
sites have been assessed in terms of ‘Outstanding’ and ‘High’ scenic areas. It is evident from
the baseline results that Site-A is the worst in terms of scenic quality impact since a
significant percentage of the buffer zone of this Site-A is designated as ‘Outstanding’ or
‘High’. Site-C comes next in this category with a small percentage of area covered by these
two classes of scenic quality data. Site-F and Site-K also contain some areas designated as
being of ‘High’ scenic quality. The rest of the sites don’t intersect with ‘Outstanding’ or ‘High’
scenic areas and therefore are less sensitive to this impact component.
Loss of agricultural land. The RIAM impact component for loss of agricultural land due to site
development has been identified as –A (slightly negative change/impact). Relevant discrete
classes taken from the Corine Landcover 2006 dataset have been linked with this impact
component. By analysing the baseline values of these classes, it is evident that none of the
buffer zones of the proposed sites intersect with the regions containing ‘permanent crops’
or ‘heterogeneous agricultural areas’.
Disturbance in grazing patterns. The RIAM impact component of disturbance in grazing
patterns, has been identified as N (No change/status quo/not applicable). The Corine
Landcover class, ‘Pastures’, has been linked with this impact component. Although the
expected impact is no change, the baseline data suggests that buffer zones of all the
proposed sites intersect with land classified under the ‘Pastures’ class. Sites C, D, F, H, J and
K have more than 50% of their buffer zone areas covered under this class. Therefore, an
impact on grazing pattern is expected on these sites.
The analysis of the results of Rapid Impact Assessment Matrix (RIAM) along with the baseline values
provides an evidence based impact assessment of the proposed sites and their defined
neighbourhood (1000m radius buffer zone). As stated previously, these results provide a critical
reference point for assessing changes and impact. Interpretation of the results have been provided
on a relative basis, that is, the impact on any one site of a particular RIAM component is evaluated in
comparison to the impact of that component on the other sites. In particular, no findings are drawn
on an absolute basis regarding the impact any one parameter will exert on a particular site.

35
Table 11. Baseline Assessment Values of Quantitative Indicators (Sites: A-E)
Linked Indicator
Wales Site-A Site-B Site-C Site-D Site-E
Min Avg Max Min Avg Max Min Avg Max Min Avg Max Min Avg Max Min Avg Max
Ph
ysi
cal
/ C
hem
ical
WIMD-2014 Indicator of Air Quality
(Emissions)1 0 17 100 49 49 58 1 5 39 19 26 85 3 5 12 26 35 40
WIMD-2014 Indicator of Air Quality
(Concentrations) 1 0 16 100 90 90 93 27 30 46 44 45 57 23 31 33 32 35 36
WIMD-2014 Indicator of Air Quality
(Emissions) 1 0 17 100 49 49 58 1 5 39 19 26 85 3 5 12 26 35 40
WIMD-2014 Indicator of Air Quality
(Concentrations) 1 0 16 100 90 90 93 27 30 46 44 45 57 23 31 33 32 35 36
Distance From Fault Lines2 0 1800 26496 4719 5577 6751 1549 2610 3724 263 1501 2890 1324 2378 3484 558 2144 3156
Distance From Geological Dykes2 0 34871 86564 53714 54933 55963 75839 76857 78229 59144 60871 64158 49526 50876 52022 70758 72126 74177
Bio
log
ical
/
Eco
log
ical
Distance from - Site of Special Scientific Interest (SSSI) 2
0 1343 9013 0 43 295 5079 6018 7083 217 1368 2541 1122 2323 3347 78 1108 1949
Distance from - Special Areas of Conservation (SAC) 2
0 3103 19408 0 453 1392 6240 7182 8276 217 1445 2683 5411 6492 7530 6151 7468 8608
Distance from - Special Protection Areas (SPA) 2
0 13220 44736 0 721 1862 20482 21453 22584 29213 30367 31632 20608 21701 22778 28738 29899 30970
So
cial
/
Cu
ltu
ral
WIMD-2014 Employment3 1 1335 1908 390 1115 1153 517 657 838 1400 1475 1905 1746 1769 1867 233 240 253
Eco
no
mic
s /
Op
erat
ion
al
Census-2011 Employment by industry (Construction) 4
1.3 9.4 17.5 6.1 9.0 9.2 6.2 10.6 11.7 5.6 7.0 7.2 5.9 6.8 10.7 8.4 10.2 11.1
Census-2011 Employment by industry (Manufacturing) 4
0.0 0.3 7.4 0.0 0.0 0.3 0.3 0.4 0.4 0.1 0.3 0.3 0.3 0.5 0.5 0.0 0.1 0.4
Census-2011 Employment by industry
(Accommodation and food service activities) 4
1.5 6.7 35.4 4.9 5.2 10.8 2.8 3.6 4.6 2.9 4.2 4.4 5.6 5.6 5.7 2.9 3.3 4.2
Census-2011 Employment by industry
(Administrative and support service activities) 4
0.8 3.4 10.2 4.6 4.7 5.6 4.9 5.1 5.4 1.8 2.3 2.7 3.2 3.8 3.9 3.9 4.4 5.5
Census-2011 Employment by industry
(Professional, scientific and technical activities) 4
0.0 4.7 14.5 1.8 4.4 4.5 3.0 3.4 3.9 4.8 6.0 6.1 7.1 9.6 10.2 1.8 1.8 1.8
WIMD-2014 Housing3 1 877 1909 61 803 842 1214 1517 1700 1484 1553 1908 1405 1646 1703 1273 1348 1386

36
Table 11. Baseline Assessment Values of Quantitative Indicators (Sites: F-K)
Linked Indicator
Site-F Site-G Site-H Site-I Site-J Site-K
Min Avg Max Min Avg Max Min Avg Max Min Avg Max Min Avg Max Min Avg Max
Ph
ysi
cal
/ C
hem
ical
WIMD-2014 Indicator of Air Quality (Emissions)1 31 31 31 21 24 32 23 23 23 21 23 23 23 23 23 23 23 23
WIMD-2014 Indicator of Air Quality (Concentrations) 1 61 61 61 35 61 69 69 69 69 37 67 69 69 69 69 69 69 69
WIMD-2014 Indicator of Air Quality (Emissions) 1 31 31 31 21 24 32 23 23 23 21 23 23 23 23 23 23 23 23
WIMD-2014 Indicator of Air
Quality (Concentrations) 1 61 61 61 35 61 69 69 69 69 37 67 69 69 69 69 69 69 69
Distance From Fault Lines2 2082 3372 4446 219 2103 3202 164 1412 2337 219 2560 3627 1204 1965 2853 459 1489 2539
Distance From Geological Dykes2 77776 79171 80099 68434 71513 73740 67982 69949 73146 69921 71592 73740 68678 70341 73338 68151 69435 73146
Bio
log
ical
/
Eco
log
ical
Distance from - Site of Special
Scientific Interest (SSSI) 2 0 945 2112 3154 3930 4641 1938 2923 4018 2766 3736 4529 2466 3311 4260 1612 2695 3657
Distance from - Special Areas of Conservation (SAC) 2 4883 5697 6569 4245 5318 6479 2013 3248 4245 4343 5203 6185 2676 3895 4912 2213 3267 4343
Distance from - Special Protection
Areas (SPA) 2 5221 6444 7633 25661 26696 27875 27006 28100 29238 25186 26307 27402 26352 27450 28583 26546 27694 28779
So
cial
/
Cu
ltu
ral
WIMD-2014 Employment3 1766 1766 1766 221 1319 1466 1466 1466 1466 1314 1458 1466 1466 1466 1466 1466 1466 1466
Eco
no
mic
s /
Op
erat
ion
al
Census-2011 Employment by
industry (Construction) 4 7.1 7.1 7.1 6.1 6.8 10.5 6.1 6.1 6.1 6.1 6.2 8.0 6.1 6.1 6.1 6.1 6.1 6.1
Census-2011 Employment by
industry (Manufacturing) 4 0.4 0.4 0.4 0.2 0.3 0.7 0.2 0.2 0.2 0.2 0.2 0.5 0.2 0.2 0.2 0.2 0.2 0.2
Census-2011 Employment by
industry (Accommodation and
food service activities) 4 2.8 2.8 2.8 3.1 4.0 5.0 4.1 4.1 4.1 3.1 4.1 4.1 4.1 4.1 4.1 4.1 4.1 4.1
Census-2011 Employment by
industry (Administrative and
support service activities) 4 2.8 2.8 2.8 2.7 3.7 3.9 3.9 3.9 3.9 3.5 3.9 3.9 3.9 3.9 3.9 3.9 3.9 3.9
Census-2011 Employment by
industry (Professional, scientific and technical activities) 4
4.4 4.4 4.4 1.9 4.9 5.8 5.8 5.8 5.8 1.9 5.6 5.8 5.8 5.8 5.8 5.8 5.8 5.8
WIMD-2014 Housing3 1539 1539 1539 1032 1656 1836 1836 1836 1836 1169 1803 1836 1836 1836 1836 1836 1836 1836
37
1 Scored from 0 and 100; 2 Euclidean distance in metres; 3Rank (1-1908) Lower rank = higher deprivation; 4 Percentage (%) employed, aged 16-74
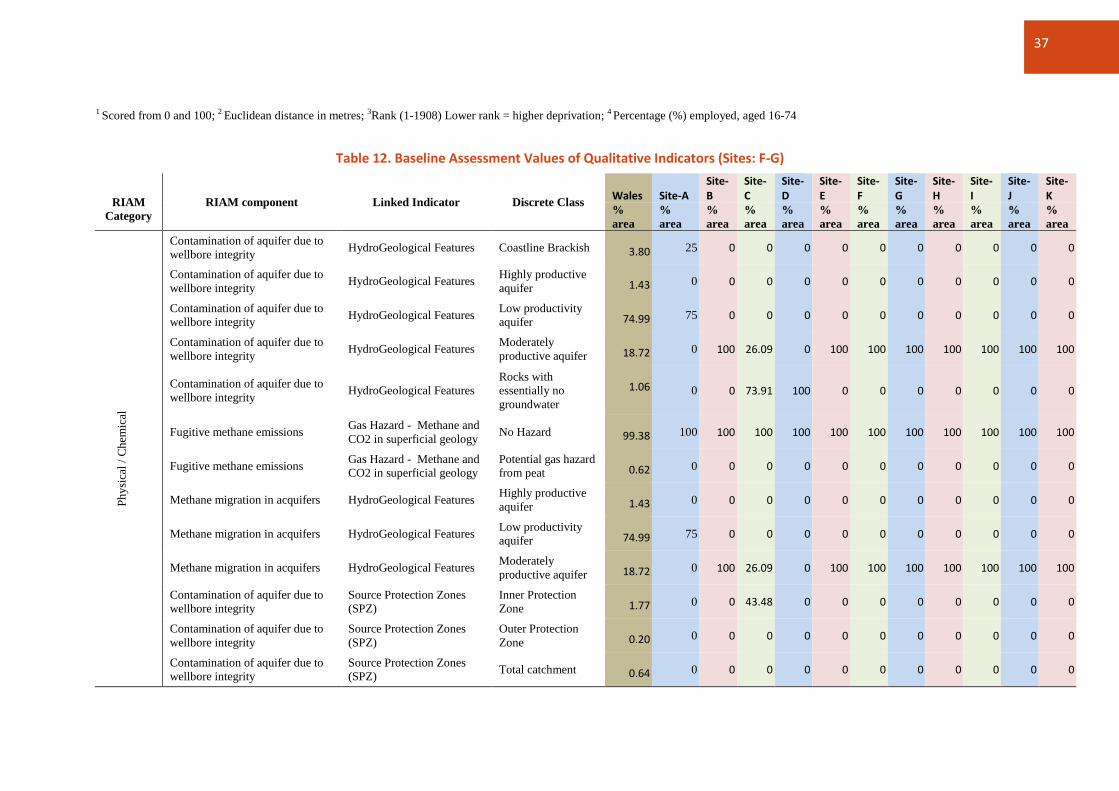
Table 12. Baseline Assessment Values of Qualitative Indicators (Sites: F-G)
RIAM
Category
RIAM component Linked Indicator Discrete Class Wales Site-A
Site-B
Site-C
Site-D
Site-E
Site-F
Site-G
Site-H
Site-I
Site-J
Site-K
%
area
%
area
%
area
%
area
%
area
%
area
%
area
%
area
%
area
%
area
%
area
%
area
Ph
ysi
cal
/ C
hem
ical
Contamination of aquifer due to
wellbore integrity HydroGeological Features Coastline Brackish 3.80 25 0 0 0 0 0 0 0 0 0 0
Contamination of aquifer due to
wellbore integrity HydroGeological Features
Highly productive
aquifer 1.43 0 0 0 0 0 0 0 0 0 0 0
Contamination of aquifer due to
wellbore integrity HydroGeological Features
Low productivity
aquifer 74.99 75 0 0 0 0 0 0 0 0 0 0
Contamination of aquifer due to
wellbore integrity HydroGeological Features
Moderately
productive aquifer 18.72 0 100 26.09 0 100 100 100 100 100 100 100
Contamination of aquifer due to
wellbore integrity HydroGeological Features
Rocks with
essentially no
groundwater
1.06 0 0 73.91 100 0 0 0 0 0 0 0
Fugitive methane emissions Gas Hazard - Methane and
CO2 in superficial geology No Hazard 99.38 100 100 100 100 100 100 100 100 100 100 100
Fugitive methane emissions Gas Hazard - Methane and
CO2 in superficial geology
Potential gas hazard
from peat 0.62 0 0 0 0 0 0 0 0 0 0 0
Methane migration in acquifers HydroGeological Features Highly productive
aquifer 1.43 0 0 0 0 0 0 0 0 0 0 0
Methane migration in acquifers HydroGeological Features Low productivity
aquifer 74.99 75 0 0 0 0 0 0 0 0 0 0
Methane migration in acquifers HydroGeological Features Moderately
productive aquifer 18.72 0 100 26.09 0 100 100 100 100 100 100 100
Contamination of aquifer due to
wellbore integrity
Source Protection Zones
(SPZ)
Inner Protection
Zone 1.77 0 0 43.48 0 0 0 0 0 0 0 0
Contamination of aquifer due to
wellbore integrity
Source Protection Zones
(SPZ)
Outer Protection
Zone 0.20 0 0 0 0 0 0 0 0 0 0 0
Contamination of aquifer due to
wellbore integrity
Source Protection Zones
(SPZ) Total catchment 0.64 0 0 0 0 0 0 0 0 0 0 0

38
Bio
log
ical
/ E
colo
gic
al
Forest cut down for sitting Forest Cover (welsh
Forestry Commission) Broadleaved 5.19 0 19.05 8.70 0 0 13.04 5 10 5 10 13.64
Forest cut down for sitting Forest Cover (welsh
Forestry Commission) Conifer 5.75 0 33.33 0 0 14.29 8.70 35 40 40 35 27.27
Forest cut down for sitting Forest Cover (welsh
Forestry Commission)
Mixed mainly
broadleaved 0.27 0 0 0 0 0 0 0 0 0 0 0
Forest cut down for sitting Forest Cover (welsh
Forestry Commission)
Mixed mainly
conifer 0.27 0 0 4.35 0 0 4.35 5 5 0 5 0
Forest cut down for sitting Forest Cover (welsh
Forestry Commission) Young trees 1.08 0 9.52 0 0 0 0 10 0 5 5 0
So
cial
/
Cu
ltu
ral
Effect on scenic quality of the
area LandMap (Scenic Quality) High 41.22 30 0 4.35 0 0 13.04 5 0 10 10 4.55
Effect on scenic quality of the
area LandMap (Scenic Quality) Outstanding 12.80 20 0 8.70 0 0 0 0 0 0 0 0
Eco
no
mic
s /
Op
erat
ion
al
Loss of agricultural land due to
site Corine Land Cover 2006
Heterogeneous
agricultural areas 1.35 0 0 0 0 0 0 0 0 0 0 0
Loss of agricultural land due to
site Corine Land Cover 2006 Pastures 51.13 25 28.57 73.91 66.67 28.57 60.87 35 50 30 50 68.18
Loss of agricultural land due to
site Corine Land Cover 2006 Permanent crops 0.03 0 0 0 0 0 0 0 0 0 0 0
So
cial
/
Cu
ltu
ral
Disturbance in grazing patterns Corine Land Cover 2006 Pastures 51.13
25 28.57 73.91 66.667 28.57 60.87 35 50 30 50 68.18

39
8. References
DECC, 2012. Department of Energy & Climate Change, Onshore GIS data. [Online] Available at: https://www.gov.uk/oil-and-gas-onshore-maps-and-gis-shapefiles#onshore-gis-data [Accessed 04 10 2017]. DEFRA, 2017. Modelled background pollution data. [Online] Available at: https://uk-
air.defra.gov.uk/data/pcm-data [Accessed 04 10 2017]. Experian, 2012. Experian Mosaic June 2012. [Online] Available at: http://www.experian.co.uk/marketing-services/products/mosaic-uk.html [Accessed: 07 May 2015]. Foxton, F. & Jones, R., 2011. Social Capital Indicators Review., s.l.: Office for National Statistics. Garrone, P. & Groppi, A., 2012. Siting locally-unwanted facilities: What can be learnt from the location of Italian power plants. Energy Policy, 45(June 2012), pp. 176-186. Horst, D. v. d., 2007. NIMBY or not? Exploring the relevance of location and the politics of voiced opinions in renewable energy siting controversies. Energy Policy, 35(5), pp. 2705-2714. Irfan, M., 2014. An integrated, multicriteria, spatial decision support system, incorporating environmental, social and public health perspectives, for use in geoenergy and geoenvironmental applications, Cardiff University. Irfan, M., Koj, A., Sedighi, M., Thomas, H., 2017. Design and development of a generic spatial decision support system, based on artificial intelligence and multicriteria decision analysis. GeoResJ, 14, pp. 47-58. Jones, N. S. et al., 2004. UK Coal resource for new exploitation technologies. Final report., Nottingham: British Geological Survey. Kohonen, T., 2001. Self-Organizing Maps. Springer Berlin Heidelberg. NHS Wales Informatics Service, 2017. HealthMapsWales. [Online] Available at: https://www.healthmapswales.wales.nhs.uk/IAS/ [Accessed 04 10 2017]. NRW, 2017. LANDMAP - the Welsh landscape baseline. [Online] Available at: http://www.naturalresources.wales/landmap?lang=en [Accessed 04 10 2017]. Office for National Statistics, 2017. 2011 Census. [Online] Available at: https://www.ons.gov.uk/census/2011census [Accessed 04 10 2017]. Pastakia, C.M., Jensen, A., 1998. The rapid impact assessment matrix (RIAM) for EIA. Environmental Impact Assessment Review, 18(5), pp. 461-482. Plymouth University, 2013. The Elections Centre. [Online] Available at: http://www1.plymouth.ac.uk/research/ceres/TEC/Pages/default.aspx [Accessed 30 September 2013].