Embed Size (px)
Citation preview

Study of the Teacher Education Assistance for College and Higher Education (TEACH) Grant Program

Study of the Teacher Education Assistance for College and Higher Education (TEACH) Grant Program
March 2018 Prepared for:
U.S. Department of Education Office of Planning, Evaluation and Policy Development
Policy and Program Studies Service
Prepared by:
Elizabeth Barkowski Evan Nielsen
HarmoniJoie Noel Melissa Dodson
Kathy Sonnenfeld Cong Ye
Elizabeth DeMonte Brianne Monahan Megan Eccleston
American Institutes for Research
This report was produced under U.S. Department of Education Contract No. EDPEP-11-O-0089/Task Order 30 with American Institutes for Research. Brian Fu served as the contracting officer’s representative. The views expressed herein do not necessarily represent the positions or policies of the U.S. Department of Education. No official endorsement by the U.S. Department of Education of any product, commodity, service, or enterprise mentioned in this publication is intended or should be inferred.
U.S. Department of Education Betsy DeVos Secretary
Office of Planning, Evaluation and Policy Development Frank Brogan Delegated Duties of Assistant Secretary
Policy and Program Studies Service Victoria Hammer Acting Director
March 2018
This report is in the public domain. Authorization to reproduce it in whole or in part is granted. While permission to reprint this publication is not necessary, the citation should be: U.S. Department of Education, Office of Planning, Evaluation and Policy Development, Policy and Program Studies Service, Study of the Teacher Education Assistance for College and Higher Education (TEACH) Grant Program, Washington, DC, 2018.
This report is available on the Department’s website at: https://www2.ed.gov/about/offices/list/opepd/ppss/reports.html.
Availability of Alternate Formats Requests for documents in alternate formats such as Braille or large print should be submitted to the Alternate Format Center by calling 202-260-0852 or by contacting the 504 coordinator via email at [email protected].
Notice to Limited English Proficient Persons If you have difficulty understanding English, you may request language assistance services for Department information that is available to the public. These language assistance services are available free of charge. If you need more information about interpretation or translation services, please call 1-800-USA-LEARN (1-800-872-5327) (TTY: 1-800-437-0833), or email us at: [email protected]. Or write to: U.S. Department of Education, Information Resource Center, LBJ Education Building, 400 Maryland Avenue SW, Washington, D.C. 20202.
Content Contact: Brian Fu 202-260-1467 [email protected]
Study of the Teacher Education Assistance for College and Higher Education (TEACH) Grant Program
iii
Contents
List of Exhibits .................................................................................................................................... v
Acknowledgments ............................................................................................................................ xi
Executive Summary ......................................................................................................................... xiii TEACH Grant Recipient Views and Outcomes ............................................................................... xiv Recipient Factors Associated with Not Meeting the TEACH Grant Requirements ............................. xv Institutional Administration of TEACH Grants ............................................................................... xvi Study Limitations .......................................................................................................................... xvii
Introduction ................................................................................................................................1 Study Research Questions ............................................................................................................... 2 Data Sources .................................................................................................................................... 2 Sample Selection, Data Collection Activities, and Analysis Methods .............................................. 3 Study Limitations ............................................................................................................................. 6
TEACH Grant Recipient Views and Outcomes ................................................................................7 Key Findings ..................................................................................................................................... 7 Influence of TEACH Grant on Student Decisions to Pursue Teaching.............................................. 7 Likelihood of Meeting the Grant Requirements .............................................................................. 8 Conversion Rates from Grants to Loans ........................................................................................ 10 Chapter Summary .......................................................................................................................... 11
Recipient Factors Associated with Not Meeting the TEACH Grant Requirements .......................... 13 Key Findings ................................................................................................................................... 13 Factors Associated with Recipients Not Meeting the TEACH Grant Requirements .......................... 14 Recipient Understanding of Program Requirements ..................................................................... 16 Institution Perspective on Reasons for Grant-to-Loan Conversion ............................................... 19 Recipient Characteristics Associated with Grant-to-Loan Conversions ......................................... 20 Timing of When Recipients Receive TEACH Grants ....................................................................... 22 Chapter Summary .......................................................................................................................... 23
Institutional Administration of TEACH Grants ............................................................................. 25 Key Findings ................................................................................................................................... 25 Institutional Goals for Use of TEACH Grants .................................................................................. 25 Institution Staff Roles Related to TEACH Grant Implementation .................................................. 26 Promoting Awareness of the TEACH Grant ................................................................................... 28 Counseling ...................................................................................................................................... 30 Prevalence of Institutional Practices Associated with Lower Grant-to-Loan Conversion Rates ... 33 How Grants Relate to Federal Annual Loan Limits ........................................................................ 36
Study of the Teacher Education Assistance for College and Higher Education (TEACH) Grant Program
iv
Field and Job Placement Services .................................................................................................. 36 Chapter Summary .......................................................................................................................... 38
Summary of Findings ........................................................................................................................ 39
References ....................................................................................................................................... 41
Appendix A. Institutions of Higher Education and Recipient Data Tables ............................................ 43
Appendix B. Case Study Narratives ................................................................................................... 59
Appendix C. Data Sources, Data Collection Activities, Data Processing, and Analysis Methods ........... 77 Data Sources .................................................................................................................................. 77 Data Collection Activities ............................................................................................................... 84 Data Processing .............................................................................................................................. 89 Analysis Methods ........................................................................................................................... 96
Appendix D. Data Collection Instruments ....................................................................................... 103
Study of the Teacher Education Assistance for College and Higher Education (TEACH) Grant Program
v
Exhibits
Exhibit 1. Percentage of TEACH Grant recipients who reported how influential the TEACH Grant was as an incentive to pursue teaching as a career or to pursue teaching in a high-need field and school ................................................................................................. 8
Exhibit 2. Percentage of TEACH Grant recipients’ likelihood of fulfilling the service requirements at the time of receiving their first TEACH Grant, by grant-to-loan conversion status .................................................................................................................. 9
Exhibit 3. Percentage of TEACH Grant recipients’ likelihood of fulfilling the service requirements at the time of survey completion, by loan conversion status ...................... 10
Exhibit 4. Distribution of TEACH Grant recipients by grant or loan status ......................................... 11
Exhibit 5. Percentage of TEACH Grant recipients in loan status who reported factors that influenced their not fulfilling the service requirements ..................................................... 14
Exhibit 6. Percentage of TEACH Grant recipients in loan status who reported the reason they are teaching in a nonqualifying position .................................................................... 16
Exhibit 7. Percentage of TEACH Grant recipients who reported how well informed they were about the four-year service requirement to teach in a qualifying high-need field and school, during the process of obtaining their first TEACH Grant, by loan conversion status ................................................................................................................ 17
Exhibit 8. Percentage of TEACH Grant recipients who reported how well informed they were about the requirement to annually certify their intent to teach in a high-need field and school, after leaving their teacher preparation program, by loan conversion status ................................................................................................................ 18
Exhibit 9. Percentage of TEACH Grant recipients who reported how well informed they were about determining whether a specific teaching position qualified under the TEACH Grant ....................................................................................................................... 19
Exhibit 10. Distribution of TEACH Grant recipients by grant or loan status, by academic level, gender, first generation status, federal loan borrower status, and Pell Grant status ................................................................................................................................... 21
Exhibit 11. Distribution of TEACH Grant recipients by grant or loan status, by academic level after receiving first TEACH Grant ........................................................................................ 22
Exhibit 12. Distribution of TEACH Grant recipients by grant or loan status, by institutional sector .................................................................................................................................. 22

Study of the Teacher Education Assistance for College and Higher Education (TEACH) Grant Program
vi
Exhibit 13. Percentage of TEACH Grant recipients who were accepted and admitted into a teacher preparation program prior to or after receiving their first TEACH Grant.............. 23
Exhibit 14. Percentage of institutions of higher education reporting certain institutional goals for the use of TEACH Grants ............................................................................................... 26
Exhibit 15. Percentage of institutions of higher education, by office or department with the lead oversight for TEACH Grant administration ................................................................. 27
Exhibit 16. Percentage of institutions of higher education, by office or department that informs students about the TEACH Grant .......................................................................... 28
Exhibit 17. Percentage of TEACH Grant recipients, by information source from which recipients first learned about the TEACH Grant ................................................................. 29
Exhibit 18. Percentage of institutions of higher education that used various modes of communication to inform students about the TEACH Grant ............................................. 30
Exhibit 19. Percentage of institutions that provided integrated mandatory or optional counseling either in-person or online by office or department ......................................... 31
Exhibit 20. Percentage of institutions that provided stand-alone mandatory or optional counseling either in-person or online by office or department ......................................... 31
Exhibit 21. Percentage of institutions of higher education offering TEACH Grant counseling, by type of counseling provided ........................................................................................... 32
Exhibit 22. Variation in grant-to-loan conversion rates by reported use of various institutional practices ......................................................................................................... 34
Exhibit 23. Percentage of institutions of higher education that reported using various practices .............................................................................................................................. 35
Exhibit 24. Percentage of institutions of higher education that reported providing various types of placement services for positions that qualify for TEACH Grant requirements, by office or department .............................................................................. 37
Exhibit A1.1a. Percentage of institutions of higher education reporting certain institutional goals for the use of TEACH Grants ............................................................................................... 43
Exhibit A1.1b. Percentage of institutions of higher education reporting the level of influence of TEACH Grants on student decisions .................................................................................... 43
Exhibit A1.2a. Percentage of institutions of higher education, by office or department and by the modes of communication that institutions use to inform students about the TEACH Grant .................................................................................................................................... 44
Study of the Teacher Education Assistance for College and Higher Education (TEACH) Grant Program
vii
Exhibit A1.2b. Percentage of institutions of higher education, by office or department that inform students about the TEACH Grant ............................................................................ 44
Exhibit A1.2c. Percentage and standard error of the percentage of TEACH Grant recipients, by information source from which recipients first learned about the TEACH Grant and by loan conversion status ............................................................................................ 45
Exhibit A1.3a. Percentage of institutions of higher education, by office or department with the lead oversight for TEACH Grant administration ................................................................. 45
Exhibit A1.4a. Percentage of institutions of higher education, by the types of TEACH Grant integrated counseling provided and by office or department ........................................... 46
Exhibit A1.4b. Percentage of institutions of higher education, by the types of TEACH Grant stand-alone counseling provided and by office or department ......................................... 46
Exhibit A1.5a. Percentage of institutions of higher education, by the types of placement services provided for qualifying TEACH Grant service positions and by office or department ..................................................................................................................... 47
Exhibit A1.6a. Percentage and standard error of the percentage of TEACH Grant recipients who were accepted and admitted into a teacher preparation program prior to or after receiving their first TEACH Grant, by loan conversion status ............................................. 47
Exhibit A2.1a. Percentage and standard error of the percentage of TEACH Grant recipients who reported how well Informed they were about the requirement to annually certify their intent to teach in a high-need field at a high-need school, on leaving their teacher preparation program, by loan conversion status .................................................. 48
Exhibit A2.1b. Percentage and standard error of the percentage of TEACH Grant recipients who reported how well informed they were about the four-year service requirement to teach in a qualifying high-need field at a high-need school, during the process of obtaining their first TEACH Grant, by loan conversion status ........................................ 48
Exhibit A2.1c. Percentage and standard error of the percentage of TEACH Grant recipients who reported how well informed they were about determining whether a specific teaching position qualified for TEACH Grant service, on leaving their teacher preparation program, by loan conversion status ............................................................... 49
Exhibit A2.2a. Percentage and standard error of the percentage of TEACH Grant recipients who reported the likelihood of fulfilling the TEACH Grant four-year service requirement to teach in a qualifying high-need field at a high-need school, upon receipt of their first TEACH Grant, by loan conversion status ............................................ 49
Study of the Teacher Education Assistance for College and Higher Education (TEACH) Grant Program
viii
Exhibit A2.2b. Percentage and standard error of the percentage of TEACH Grant recipients who reported the likelihood of fulfilling the TEACH Grant four-year service requirement in a qualifying high-need field at a high-need school, at the time of survey completion, by loan conversion status ................................................................... 50
Exhibit A2.2c. Percentage and standard error of the percentage of TEACH Grant recipients who reported factors that influenced their likelihood of completing the service requirements, at the time of survey completion, by loan conversion status ..................... 50
Exhibit A2.2d. Percentage and standard error of the percentage of TEACH Grant recipients whose grants were converted to loans and who reported the reason they did not certify annually ............................................................................................................................... 51
Exhibit A2.2e. Percentage and standard error of the percentage of TEACH Grant recipients in loan status who reported the reason they are teaching in a nonqualifying position ........ 51
Exhibit A2.2f. Percentage and standard error of the percentage of TEACH Grant recipients whose grants converted to loans who reported factors that influenced their likelihood of completing the service requirements at the time of survey completion, by whether not certifying annually was a factor in conversion ..................... 52
Exhibit A2.3a. Percentage and standard error of the percentage of TEACH Grant recipients who reported how influential the TEACH Grant was as an incentive to pursue teaching as a career or teaching in a high-need field at a high-need school .................................... 53
Exhibit A3.1a. Percentage and average grant-to-loan conversion rate of institutions of higher education, by criteria used to limit eligibility of students to receive TEACH Grants .......... 54
Exhibit A3.1b. Percentage and average grant-to-loan conversion rate of institutions of higher education, by the modes of communication that institutions use to inform students about the TEACH Grant ........................................................................................ 55
Exhibit A3.1c. Percentage and average grant-to-loan conversion rate of institutions of higher education, by the type of TEACH Grant counseling provided ............................................ 55
Exhibit A3.1d. Percentage and average grant-to-loan conversion rate of institutions of higher education, by the types of placement services provided for qualifying TEACH Grant service positions ....................................................................................................... 56
Exhibit A4. Grant-to-loan conversion rates for all TEACH Grant recipients by gender, first generation status, federal loan borrower status, Pell Grant status, academic level, and institutional sector ....................................................................................................... 57
Exhibit C1. Number and percentage of survey sample frame, by strata: TEACH Grant Recipient Survey ................................................................................................................. 80
Study of the Teacher Education Assistance for College and Higher Education (TEACH) Grant Program
ix
Exhibit C2. Number and percentage of selected survey sample, by strata: TEACH Grant Recipient Survey ................................................................................................................. 81
Exhibit C3. Case study institutions, by geographic region, sector, number of recipients, grant-to-loan conversion rates, distance learning, and freshmen and sophomores receiving grants (2009–2014) .............................................................................................. 83
Exhibit C4. Number of sample members receiving survey contact attempts, number of sample members responding after each contact attempt, and the cumulative response rate after each contact attempt: IHE Survey....................................................... 85
Exhibit C5. Number of sample members receiving survey contact attempts, number of sample members responding after each contact attempt, and the cumulative response rate after each contact attempt, by grant-to-loan conversion strata: Recipient Survey ................................................................................................................. 86
Exhibit C6. Number of interviews by protocol type and institution ..................................................... 88
Exhibit C7. Mean distribution of the frame variables for the selected sample, the respondent sample, and bias: IHE Survey .............................................................................................. 93
Exhibit C8. Distribution of the frame variables for the selected sample, the respondent sample, and bias: TEACH Grant Recipient Survey ............................................................... 94
Exhibit C9. Preliminary codes and code definitions ............................................................................ 100

Study of the Teacher Education Assistance for College and Higher Education (TEACH) Grant Program
xi
Acknowledgments
We wish to thank several people who contributed to the completion of this study.
We are grateful for the faculty and staff at the institutions of higher education who were the subjects of this study for their kind cooperation and assistance in completing surveys and participating in interviews, which provided the data for this study. Without their participation, this report would not have been possible, and we deeply appreciate their assistance.
We would like to acknowledge the thoughtful contributions of the members of our Technical Working Group, including Mark LeCelle-Peterson, American Association of Colleges for Teacher Education; Karen McCarthy, National Association of Student Financial Aid Administration; Robert Muller, National Louis University; Melissa Pizzo, Arizona State University; and Dan Player, University of Virginia.
Many additional staff of American Institutes for Research assisted with this report. Specifically, we would like to thank Kerstin Le Floch, Sandy Eyster, Anne Diffenderffer, Helen Duffy, Meredith Ludwig, Andrew Wayne, Alexandra Hickling, Marian Eaton, Michael Jackson, Jingyan Xia, Yan Wang, and our Publications team. We also recognize the assistance of Charles Coble and Michael Allen and the staff from Teacher Preparation Analytics for their assistance with interview protocol development and site visits.
Thanks also to the National Student Loan Data System team and the Pennsylvania Higher Education Assistance Agency servicing team for their support in providing administrative data.
Although we appreciate the assistance and support of all the above individuals, any errors in judgment or fact are, of course, the responsibility of the authors.

Study of the Teacher Education Assistance for College and Higher Education (TEACH) Grant Program
xiii
Executive Summary
There is a shortage of highly qualified individuals teaching in high-need fields and schools in the United States (U.S. Department of Education 2016b). The U.S. Department of Education’s Teacher Education Assistance for College and Higher Education (TEACH) Grant aims to increase the number of teachers in high-need fields and schools by providing up to $4,000 per year to undergraduate and graduate students enrolling in coursework to become a teacher. To meet the requirements of the TEACH Grant, recipients must teach in a high-need field1 such as reading specialist, mathematics, or science, at a high-need school,2 for at least four years in an eight-year period and annually certify that they intend to meet this requirement. If a recipient does not meet the grant requirements or the annual certification requirements, the grant converts to an unsubsidized loan (U.S. Department of Education 2016a).
A 2015 Government Accountability Office (GAO) report found that large numbers of TEACH Grant recipients did not meet the grant requirements (GAO 2015). Similarly, using extant data from the loan servicer, this study found that 63 percent of the recipients who began their service obligation period prior to July 2014 converted a TEACH Grant to an unsubsidized loan prior to June 2016. Other research on physician loan forgiveness and service scholarship programs suggests that when the financial benefit offsets the cost of professional preparation, these programs can successfully recruit and retain high-quality professionals into fields and communities where they are most needed. However, studies also have found that programs that provide small amounts are not effective when the financial benefit does not offset the cost of professional preparation (Podolsky and Kini 2016).
The purpose of this study was to answer three main questions:
1. How do TEACH Grant recipients view grant requirements and to what extent do recipients fulfill those requirements?
2. What factors are associated with TEACH Grant recipients not meeting the grant requirements?
3. How do institutions of higher education administer TEACH Grants and support grant recipients?
This study was conducted in 2016 and included a survey of institutions of higher education, a survey of grant recipients, interviews with institution staff, federal student aid data, and institutional data obtained from the loan servicer.
In this report, we initially present the key findings across the study as a whole; then we present the key findings from the three research questions. For this report, grant recipients who left school and continue to satisfy the certification requirements or have successfully completed the four-year teaching
1 This definition of high-need field comes from the list of service requirements for the TEACH Grant:
https://studentaid.ed.gov/sa/types/grants-scholarships/teach#high-need-fields. 2 Defined by the U.S. Department of Education as a public or other nonprofit private elementary or secondary school with
more than 30 percent of the school’s enrollment counted as meeting a measure of poverty under Section 1113(a)(f) Title I of the Elementary and Secondary Education Act of 1965 (ESEA). This report will use high-need school instead of low-income school. This definition of low-income school comes from U.S. Department of Education Teacher Cancellation Low Income Directory Web site for Federal Student Aid: https://tcli.ed.gov/CBSWebApp/tcli/.
Study of the Teacher Education Assistance for College and Higher Education (TEACH) Grant Program
xiv
commitment are referred to as “recipients in grant status,” and recipients who did not meet the requirements and whose grants converted to loans are referred to as “recipients in loan status.”
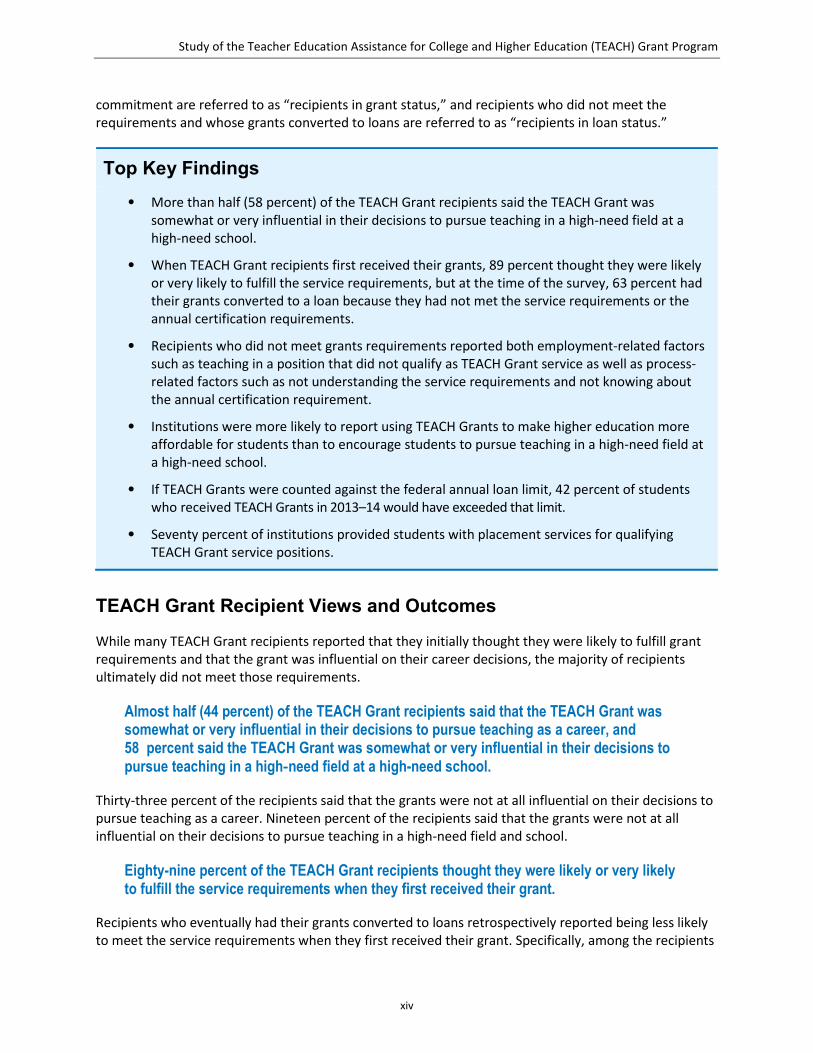
Top Key Findings • More than half (58 percent) of the TEACH Grant recipients said the TEACH Grant was
somewhat or very influential in their decisions to pursue teaching in a high-need field at a high-need school.
• When TEACH Grant recipients first received their grants, 89 percent thought they were likely or very likely to fulfill the service requirements, but at the time of the survey, 63 percent had their grants converted to a loan because they had not met the service requirements or the annual certification requirements.
• Recipients who did not meet grants requirements reported both employment-related factors such as teaching in a position that did not qualify as TEACH Grant service as well as process-related factors such as not understanding the service requirements and not knowing about the annual certification requirement.
• Institutions were more likely to report using TEACH Grants to make higher education more affordable for students than to encourage students to pursue teaching in a high-need field at a high-need school.
• If TEACH Grants were counted against the federal annual loan limit, 42 percent of students who received TEACH Grants in 2013–14 would have exceeded that limit.
• Seventy percent of institutions provided students with placement services for qualifying TEACH Grant service positions.
TEACH Grant Recipient Views and Outcomes
While many TEACH Grant recipients reported that they initially thought they were likely to fulfill grant requirements and that the grant was influential on their career decisions, the majority of recipients ultimately did not meet those requirements.
Almost half (44 percent) of the TEACH Grant recipients said that the TEACH Grant was somewhat or very influential in their decisions to pursue teaching as a career, and 58 percent said the TEACH Grant was somewhat or very influential in their decisions to pursue teaching in a high‐need field at a high-need school.
Thirty-three percent of the recipients said that the grants were not at all influential on their decisions to pursue teaching as a career. Nineteen percent of the recipients said that the grants were not at all influential on their decisions to pursue teaching in a high-need field and school.
Eighty-nine percent of the TEACH Grant recipients thought they were likely or very likely to fulfill the service requirements when they first received their grant.
Recipients who eventually had their grants converted to loans retrospectively reported being less likely to meet the service requirements when they first received their grant. Specifically, among the recipients
Study of the Teacher Education Assistance for College and Higher Education (TEACH) Grant Program
xv
whose grants converted to loans, 86 percent indicated that after receiving their first grant, they initially thought they were likely or very likely to fulfill the four-year service requirement to teach in a qualifying high-need field at a high-need school. Among recipients in grant status, 94 percent indicated that they had thought they were likely or very likely to fulfill the four-year service requirements.
Among TEACH Grant recipients who began their eight-year service obligation period prior to July 2014, 63 percent had their grants converted to an unsubsidized loan because they did not meet the service requirements or the annual certification requirements as of June 2016.
Using extant data for the entire population of recipients, this grant-to-loan conversion rate was derived by first calculating the cumulative, total number of recipients who had begun their service obligation period prior to July 1, 2014. Then the number of those recipients for whom at least one grant had been converted to a loan was divided by the total to obtain the conversion rate. Among the remaining, 6 percent had completed the service requirements, and 31 percent had grants requiring service.
Recipient Factors Associated with Not Meeting the TEACH Grant Requirements
Results from the recipient survey provide insights on employment and process factors associated with recipients not meeting the grant requirements. In addition, administrative data shed light on recipient characteristics that are associated with not meeting the grant requirements. Most respondents who were in loan status identified factors as influencing their not completing the grant requirements. These factors fall into three broad categories: factors related to employment relate to situations that affect whether recipients obtain positions that qualify for grant service, factors related to understanding the service requirements include situations in which recipients did not understand the requirements to complete grant service, and factors related to annual certification pertain to the administrative process by which recipients maintain their grant status.
Factors related to employment that are influential to not completing the service requirements, as reported at the time of survey completion by grant recipients in loan status, included teaching in a position that did not qualify for TEACH Grant service (39 percent) and not working as a certified teacher (33 percent).
Thirty-two percent of the recipients in loan status reported not understanding the service requirements as being influential to not completing those requirements.
Factors related to annual certification that are influential to not completing the service requirements, as reported at the time of survey completion by grant recipients in loan status, included not certifying because they did not know about the annual certification process (19 percent) and not certifying because of challenges related to the certification process (13 percent).
Nine percent of the recipients in loan status reported that forgetting about annual certification was a factor influential to not completing the service requirements. Twenty-four percent reported other factors such as never being certain of intention to teach and changing to a nonteaching, administrative position at a school (e.g., promotion to principal) prior to fulfilling their service. Reasons related to
Study of the Teacher Education Assistance for College and Higher Education (TEACH) Grant Program
xvi
recipients currently not teaching included not continuing in a teacher preparation program, not graduating, not completing the teaching degree or certificate, and leaving the profession after graduating or teaching.
TEACH Grant recipients who were in loan status were less likely than those who were in grant status to say they were well informed about the service requirements during the process of obtaining their first grant (39 percent and 65 percent, respectively).
Reports of being well informed about the service requirements varied based on whether the recipient had a grant converted to a loan or not. Among recipients whose grants converted to loans, 35 percent indicated they were somewhat or not informed about the service requirements during the process of obtaining their first grant compared with 13 percent of the recipients in grant status.
Grant-to-loan conversion rates were higher among males, students with federal loans, and Pell Grant recipients.
For example, among the TEACH Grant recipients who began their service obligation period before July 1, 2014, 66 percent who were Pell Grant recipients3 had a grant converted to a loan versus 58 percent of those who were not Pell Grant recipients.
Institutional Administration of TEACH Grants
Institutions are responsible for implementing aspects of the TEACH Grant program, including awarding the grants, counseling recipients, and in many cases assisting recipients in securing teaching positions that qualify for grant service. Results from the survey of institutions provide insights into how institutions view and administer these grants.
Almost half (49 percent) of the institutions reported using TEACH Grants to encourage students to pursue teaching in a high-need field at a high-need school, and nearly all (92 percent) institutions reported using TEACH Grants to make higher education more affordable for students.
In describing institutional goals for using TEACH Grants, institutions were more likely to report making higher education more affordable for students than encouraging students to pursue teaching in a high-need field at a high-need school.
Within higher education institutions, TEACH Grants were primarily overseen by financial aid office staff rather than college of education staff.
Ninety-three percent of the IHE Survey respondents indicated that the financial aid office led oversight of the grant, whereas 7 percent indicated that other departments, such as the college of education, led oversight.
3 The federal Pell Grant program provides need-based grants to low-income undergraduate and certain postbaccalaureate
students to promote access to postsecondary education.
Study of the Teacher Education Assistance for College and Higher Education (TEACH) Grant Program
xvii
For 42 percent of the students who received TEACH Grants in 2013–14, the sum of their TEACH Grants and federal loans in that year exceeded the federal annual loan limit.
Federal loan limits exist to protect students from excessive borrowing. In comparing the sum of each recipient’s TEACH Grant funds and Stafford loan funds disbursed in 2013–14 with the recipient’s estimated federal 2013–14 annual loan limit, 42 percent of the grant recipients would have borrowed more than their federal annual loan limit if their grants were considered loans.
In an examination of common TEACH Grant administrative practices, 70 percent of the institutions provided students with placement services for qualifying TEACH Grant service positions.
More than half of participating institutions reported providing guidance to students on how to identify teaching positions that would qualify under the grant requirements (58 percent). Fewer institutions indicated that they provided updated lists of available positions to students (48 percent) or established relationships with elementary and secondary schools that have eligible positions (46 percent). Colleges of education typically were responsible for providing the placement services.
Study Limitations
Readers should note some limits to the interpretation and generalizability of the study findings.
Some under-coverage of the target population exists in the extant data and recipient survey sample frame. For example, due to the July 2013 transition in federal loan servicer for the TEACH Grant, the current servicer does not possess records for some recipients who either converted grants to loans or completed service prior to the transition. As a result, these recipients, representing about 6 percent of the recipients in the target population, are not accounted for in conversion rate calculations and were not included in the sampling frame.
A significant number of recipients in loan status (32 percent) responded to a question about the likelihood of completing the grant requirements by selecting categories that indicated they had already completed the requirements or were likely to do so. The inconsistency of these responses with their administrative status may have been a result of respondents misunderstanding the question in the way the item was worded and structured, misunderstanding the current status of their grant, and/or misunderstanding the grant processes and requirements. Because survey skip logic did not prompt these respondents to answer subsequent questions about the factors that influenced their not completing the grant requirements, findings related to these factors should be interpreted with caution.

Study of the Teacher Education Assistance for College and Higher Education (TEACH) Grant Program
1
Introduction
There is a shortage of highly qualified individuals teaching in high-need fields and schools in the United States (U.S. Department of Education 2016b). The Teacher Education Assistance for College and Higher Education (TEACH) Grant aims to increase the number of teachers in high-need fields and schools by helping prospective and current teachers finance college and graduate school. First implemented by the U.S. Department of Education in 2008–09, the TEACH Grant provides up to $4,000 per year to undergraduate and graduate students enrolling in coursework to become a teacher. In the 2015–16 award year, 774 institutions awarded grants to at least one student, and the average institution awarded grants to 40 students; more than 30,800 students received grants in total, with almost $90 million disbursed to these recipients.4 To meet the requirements of the TEACH Grant, recipients must teach in a high-need field such as reading specialist, mathematics, or science, at a high-need school, for at least four years in an eight-year period and annually certify that they intend to meet this requirement. If a recipient does not meet the grant requirements or does not annually certify progress toward completing their service obligation, the grant converts to an unsubsidized loan (U.S. Department of Education 2016a).
To meet the TEACH Grant requirements, students must do the following:
• Be enrolled as an undergraduate, postbaccalaureate, or graduate student at an institution that participates in the TEACH Grant Program.
• Meet certain academic achievement requirements (generally, scoring above the 75th percentile on one or more portions of a college admissions test or maintaining a cumulative GPA of at least 3.25).
• Receive TEACH Grant counseling.
• Sign an agreement to serve in the teaching profession in a high-need field at a high-need school for a minimum of four years in an eight-year period.
• Provide documentation of annual certification indicating that they intend to teach at or are currently teaching in a high-need field at a high-need school after completing their program.
For this report, grant recipients who left school and continue to satisfy the certification requirements or have successfully completed the four-year commitment are referred to as “recipients in grant status,” and recipients who did not meet the requirements and whose grants converted to loans are referred to as “recipients in loan status.”
A 2015 Government Accountability Office (GAO) report found that large numbers of TEACH Grant recipients did not meet the grant requirements (GAO 2015). Similarly, using extant data from the loan servicer, this study found that 63 percent of the recipients who began their service obligation period
4 Federal Student Aid Title IV Program Volume Reports for Grant Programs, as of January 31, 2017.
Study of the Teacher Education Assistance for College and Higher Education (TEACH) Grant Program
2
prior to July 2014 converted the TEACH Grant to an unsubsidized loan prior to June 2016.5 Conversion rates were similar across public, proprietary, and private institutions. Moreover, the GAO study of the federal grant and loan forgiveness programs for teachers suggests that how a program is structured and managed also influences its success.
Results from the GAO report align with existing research findings on teacher and physician loan forgiveness and service scholarship programs. Research suggests that programs that provide small amounts are not effective when the financial benefit does not offset the cost of professional preparation. For example, the authors found that the Arkansas State Teacher Education Program provided an average of $3,000 per year to teachers, but this amount was too low to attract teachers. Similarly, the Oklahoma Future Scholarships, providing approximately $1,000 to $1,500 per year to teacher candidates, did not influence whether the recipient pursued a career teaching science (Podolsky and Kini 2016).
The study also found, however, that when the financial benefit offsets the cost of professional preparation, these programs could successfully recruit and retain high-quality professionals into fields and communities where they are most needed. Programs such as the National Science Foundation Robert Noyce Teacher Scholarship, the Woodrow Wilson Fellowship, and the North Carolina Teaching Fellows Program appeared to influence candidates’ decisions to complete the teacher certification program, to teach low-income students, and remain in the field (Podolsky and Kini 2016).
Study Research Questions
Three main questions guided this study:
1. How do TEACH Grant recipients view the grant requirements and to what extent do recipients fulfill those requirements?
2. What factors are associated with TEACH Grant recipients not meeting the grant requirements?
3. How do institutions of higher education administer TEACH Grants and support grant recipients?
Data Sources
The study included three primary forms of data collection in 2016:
• Surveys: (1) a survey of the 472 institutions that awarded TEACH Grants to at least 10 recipients in 2014–15,6 and (2) a survey of 500 separated grant recipients, who were no longer enrolled in the institution from which they received the grant, meaning they graduated or withdrew from the institution. Appendix A includes exhibit tables with the data from the survey analyses.
5 Using extant data for the entire institutional population, grant-to-loan conversion rates were derived by first calculating the
cumulative total number of recipients from award years 2008–2014 who had begun their service obligation prior to July 1, 2014, for each institution. Then, the number of those recipients for whom at least one grant had been converted to a loan was divided by the total to get the conversion rate. Recipients identified with a death or disability status, or whose grants had been canceled, were excluded. For more information, see Appendix C.
6 Based on Federal Student Aid Title IV Program Volume Reports for Grant Programs, as of July 15, 2015.
Study of the Teacher Education Assistance for College and Higher Education (TEACH) Grant Program
3
• Interviews: Interviews were conducted with faculty and staff at a nonrepresentative sample of nine institutions administering TEACH Grants. Appendix B includes the case study narratives.
• Extant Data. The study included examining the following:
– Administrative data on TEACH Grants (e.g., recipient, institution, conversion status, and academic level).
– Documents provided by institutions that were used to promote awareness about the TEACH Grant (e.g., flyers or emails).
Sample Selection, Data Collection Activities, and Analysis Methods
This section describes the sample selection for each data source, data collection activities, and methods used to analyze the data. The majority of the data collection activities occurred between June and August 2016. Appendix C includes additional detail about sample selection, data collection, and analysis methods.
Institution of Higher Education Survey
The target population was defined as institutions that awarded TEACH Grants to at least 10 recipients in the 2014–15 award year. From 788 institutions that awarded grants in 2014–15, 472 institutions met the eligibility criteria and were invited to participate in the IHE Survey. These 472 institutions awarded the grants to 95 percent of the recipients in that award year. The data collection period started in late May 2016 and ended in late August 2016. The questionnaire covered topics related to the implementation and administration of the grant, including any challenges related to grant administration (see Appendix D for the questionnaire). This survey was administered primarily through an online platform, with a small minority (6 percent) of the respondents completing a paper questionnaire. The Department sent the initial survey invitations by U.S. Mail to the financial aid officer primarily responsible for coordinating the grants at each selected institution; each invitation letter included a personalized URL to the Web survey for the institution. Nonresponse follow-up efforts extended for a 10-week period and included up to five email reminder messages that included the survey link, up to eight telephone reminder call attempts, and one paper questionnaire mailing. The final response rate to the IHE Survey was 73 percent.
To represent the entire population of institutions in the analysis, the response data from the IHE Survey were weighted to adjust for entire survey nonresponse by using extant data for each institution to calculate response propensities (see Appendix C for more information). Most of the analysis of the IHE Survey data set involved tallying the responses to the survey items and weighting these tallies to account for survey nonresponse. Much of the questionnaire asked institutions to report the incidence of certain activities (e.g., communication about the grant to students, methods of counseling recipients, and job placement services) performed by various institutional units (e.g., financial aid office or career services office) across various student subgroups. To simplify the analysis of these items, the student subgroups were collapsed so that incidence of the activities could be compared across institutional units. Finally, analysis of the institution data to address the second research question (factors associated with recipients not meeting the grant requirements) involved cross-tabulating the incidence of grant administration activities (collapsed to the overall institutional level) by the average institutional grant-to-loan conversion rate. Tests for statistical significance were not performed when analyzing the IHE Survey data because those tests consider differences in light of sampling error; because the survey sample included the entire population of institutions that awarded at least 10 grants in the 2014–15
Study of the Teacher Education Assistance for College and Higher Education (TEACH) Grant Program
4
year, statistical significance tests were not appropriate. Weighting adjustments were made to compensate for nonresponse bias.
TEACH Grant Recipient Survey
A stratified, random sample was drawn of 500 recipients who had received the grant and had graduated or withdrew (i.e., separated) from one of the 472 institutions selected for the study prior to July 1, 2014. The starting sample frame included 69,809 separated recipients whose grants did not have a status of death or other life circumstances and for whom complete contact information was available. Recipients who did not receive any grants from one of the 472 institutions included in the IHE Survey were removed from the sampling frame. The final sampling frame contained 63,023 recipients.
The recipient sample was stratified by institution type (e.g., public, private nonprofit, or proprietary), the geographical region of the institution (i.e., Northeast, Southeast, Midwest, Southwest, and West), and the grant-to-loan conversion status (i.e., recipients in loan status and recipients in grant status). The sample of 500 recipients, evenly split between recipients in loan status and recipients in grant status, was designed to have the power to detect differences between these two groups at a 90 percent confidence level, assuming a 70 percent response rate for both halves of the sample. Of the nearly 26,000 recipients who had completed or were in the process of completing their service requirements (i.e., recipients in grant status), 250 people were selected, and of approximately 37,000 recipients whose grants had been converted to loans (i.e., recipients in loan status), 250 people were selected.
The data collection period started in early July 2016 and ended in mid-September 2016. The final response rate to the TEACH Grant Recipient Survey was 64 percent, with a higher response rate for recipients in grant status (78 percent) than for recipients in loan status (51 percent).
The analysis data set for the TEACH Grant Recipient Survey was weighted to adjust for entire survey nonresponse using two methods: (1) post-stratification and (2) using extant data for each recipient to calculate response propensities. Most of the analysis for this data set involved tallying the responses to the survey items and weighting these tallies to account for survey nonresponse, several items were cross-tabulated by the grant-to-loan conversion status, and differences between recipients in loan status and recipients in grant status were tested for statistical significance. More details about the weighting and nonresponse analyses can be found in Appendix C.
Interviews for Case Studies
Interviews in a nonrepresentative sample of nine institutions were selected to include a range of characteristics, conditions, and outcomes. The sample selection and interview processes were intended to yield information to illustrate some of the ways in which institutions administer the TEACH Grant in various types of institutions. The following characteristics were used to select the sample:
• Number of TEACH Grants awarded. Institutions that awarded at least 10 grants in the 2014–15 award year and more than 100 grants before July 1, 2014 (178 institutions met this criterion).
• Geographic region. Institutions across the five geographic regions: Northeast, Southeast, Midwest, Southwest, and West.
• Distance learning. One institution classified as a distance-learning institution, defined as having 75 percent or more of the students enrolled in distance education coursework.
Study of the Teacher Education Assistance for College and Higher Education (TEACH) Grant Program
5
• Sector. Five public institutions, three private institutions, and one proprietary institution.
• TEACH Grant-to-loan conversion rates. Institutions with both high and low percentages of TEACH Grants in loan status. The average grant-to-loan conversion rate for the population of 178 institutions that met the first criterion for inclusion was 56 percent. The nine-site sample included four institutions with rates at or above the average and five below the average. Grant-to-loan conversion rates ranged from approximately 40 percent to 70 percent.
• Academic levels of the TEACH Grant recipients. Institutions that administered TEACH Grants to students at various academic levels in their institution enrollment (e.g., freshman year, senior year, graduate level).
Appendix B presents the case study narratives based on the interview data.
In-person interviews were conducted at six institutions and telephone interviews were conducted at three institutions. The interviews were conducted with deans of education, teaching program coordinators, field placement coordinators, job placement counselors, financial aid officers, and other institutional staff involved in the administration of the grants. Semistructured interview protocols were aligned to the research questions and tailored to each type of institutional staff. Appendix C details the type of interviews conducted at each institution and Appendix D includes the interview protocols.
To analyze and report the interview data, a set of codes were developed and aligned to the research questions and the interview protocols. NVivo qualitative data analysis software was used to code the interview transcripts using the set of codes. The coded data were then used to identify themes related to the research questions. In addition to using interview data to answer the research questions, the interview data were used to write six in-depth case studies describing institution implementation of the grant.7
Extant Data
Extant data were obtained from the Federal Student Aid National Student Loan Data System (NSLDS) and from the loan servicer, the Pennsylvania Higher Education Assistance Agency (PHEAA). PHEAA provided a grant-level data file describing all grants in their databases including information such as the institution that administered the grant, the recipient who received the grant, the status of the grant (e.g., converted to a loan, service completed, service required, death), and the service obligation start date for the grant. In addition, recipient-level data derived from NSLDS included demographic characteristics, including gender, Pell Grant status, and Stafford loan amount. These data were analyzed both in their entirety (e.g., calculating grant-to-loan conversion rates for various segments of the recipient population) and by linking the data to the sub-set of survey records (e.g., cross-tabulating survey responses with recipient demographics). See Appendix C for more details about the extant data.
In conjunction with the IHE Survey, documents used by institutions in the administration of the grants were solicited. These documents were coded by type: whether they were application forms, informational materials (e.g., fact sheets, frequently asked questions, or website material), promotional materials (e.g., flyers or posters), direct outreach (email templates or letters to students), or counseling materials. Documents also were coded by type if they were created and distributed by an
7 Case study summaries were prepared for the six sites in which interviews were conducted with at least four staff members.
Study of the Teacher Education Assistance for College and Higher Education (TEACH) Grant Program
6
external source (such as the Department, rather than by the institution). In addition, documents were coded according to the information they included, with three types of information considered most crucial: (1) information on the grant’s eligibility and service requirements, (2) information on grant-to-loan conversion, and (3) information on annual certification of teaching status. After coding, the documents were analyzed thematically to describe the commonalities and differences in how institutions administered the grants.
Study Limitations
Readers should note some limits to the interpretation and generalizability of the study findings. For instance, the interviews were semistructured, purposefully allowing some variability in the questions. Interviews were limited to individuals identified by college of education leaders; therefore, it is unclear whether institutional staff interviewed provided complete information about how the institution administers the TEACH Grant. Because only a small number of institutions were interviewed, the interview findings are not generalizable to other institutions.
Some under-coverage of the target population exists in the extant data and recipient survey sample frame. In July 2013, the federal loan servicer managing the TEACH Grant changed. Because the current servicer was not contracted to service all recipients whose grants converted to loans or whose service obligation was completed prior to the transition, the current servicer did not obtain complete records for these recipients, representing about 6 percent of the recipients in the target population. As a result, these recipients are not accounted for in conversion rate calculations presented in this report. In addition, the current servicer did not have service obligation start dates for roughly 12,000 grants that were converted to loans by the prior servicer. Based on the assumption that these converted grants had a service obligation start date prior to the servicer transition, these converted grants represent 14 percent of the recipients with an observed or assumed service obligation start date prior to the 2013 transition. Because these recipients could not be accurately assigned to an individual-year cohort, conversion rates were calculated based on a combination of multiple cohorts.
The sample frame for the TEACH Grant Recipient Survey excluded about 9 percent of the recipients in the target population because they lacked any contact information available to the study team. Because most of these recipients’ grants had been converted to loans before the 2013 servicer transition, the sample underrepresented recipients who converted earlier in the program (prior to 2013). See Appendix C for more information.
An examination of the survey response patterns among recipients whose grants had been converted to loans revealed that a significant number of those respondents (32 percent) answered a question about the likelihood of completing the grant requirements by selecting categories that indicated they had already completed the requirements or were likely to do so. The inconsistency of these responses with their administrative status may have been a result of respondents misunderstanding the question in the way the item was worded and structured, misunderstanding the current status of their grant, and/or misunderstanding the grant processes and requirements. These respondents were not asked subsequent questions about the factors that influenced their completion of the grant requirements because the questionnaire routed respondents who indicated they had completed or were likely to complete past questions about these factors. As a result, the findings related to the factors that influence the completion of the grant requirements are limited.
Study of the Teacher Education Assistance for College and Higher Education (TEACH) Grant Program
7
TEACH Grant Recipient Views and Outcomes
This chapter describes the influence of the grant on recipients’ decisions to pursue teaching as a career, recipients’ expectations about meeting the service requirements, how many recipients had their grants converted to loans, and how loan limits could have been exceeded if the grant were provided as a loan from the outset.
Key Findings
• Almost half (44 percent) of the TEACH Grant recipients said that the TEACH Grant was somewhat or very influential in their decisions to pursue teaching as a career, and 58 percent said the TEACH Grant was somewhat or very influential in their decisions to pursue teaching in a high-need field at a high-need school.
• Eighty-nine percent of the TEACH Grant recipients thought they were likely or very likely to fulfill the service requirements when they first received their grant.
• Among TEACH Grant recipients who began their eight-year service obligation period prior to July 2014, 63 percent had their grants converted to an unsubsidized loan because they did not meet the service requirements or the annual certification requirements as of June 2016.
• For TEACH Grants that are eventually converted to loans, in many cases these grants would have caused recipients’ financial aid packages to exceed federal loan limits if they had been provided as loans from the outset.
Influence of TEACH Grant on Student Decisions to Pursue Teaching
Both the TEACH Grant Recipient Survey and the IHE Survey asked respondents to report on how much the grants influenced students’ decisions to pursue a career in teaching and specifically a teaching career in a high-need field at a high-need school. Results from both surveys were similar.
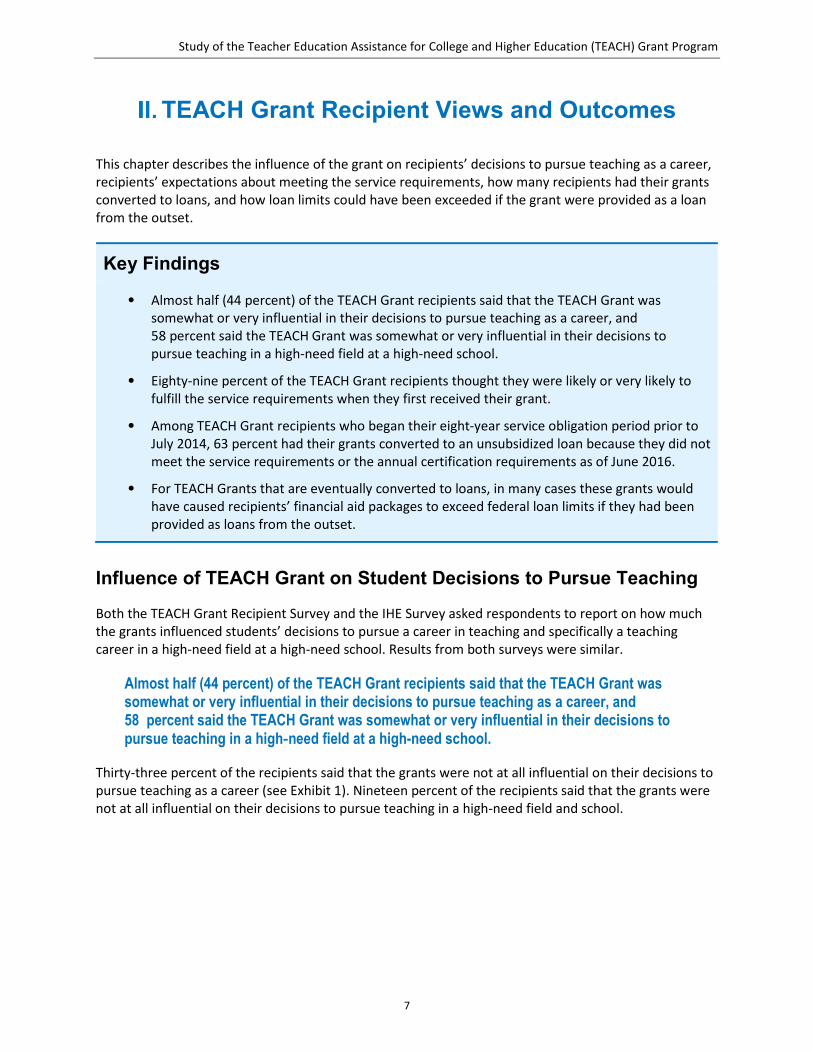
Almost half (44 percent) of the TEACH Grant recipients said that the TEACH Grant was somewhat or very influential in their decisions to pursue teaching as a career, and 58 percent said the TEACH Grant was somewhat or very influential in their decisions to pursue teaching in a high‐need field at a high-need school.
Thirty-three percent of the recipients said that the grants were not at all influential on their decisions to pursue teaching as a career (see Exhibit 1). Nineteen percent of the recipients said that the grants were not at all influential on their decisions to pursue teaching in a high-need field and school.
Study of the Teacher Education Assistance for College and Higher Education (TEACH) Grant Program
8
Exhibit 1. Percentage of TEACH Grant recipients who reported how influential the TEACH Grant was as an incentive to pursue teaching as a career or to pursue teaching in a high-need field and school
Exhibit reads: Twenty-three percent of the recipients said that TEACH Grants were very influential on their decisions to pursue teaching in a high-need field at a high-need school. Source: TEACH Grant Recipient Survey, 2016 (n=322; see Exhibit A2.3a in Appendix A).
Likelihood of Meeting the Grant Requirements
TEACH Grant recipients were first asked to report about how likely they thought they were to fulfill the service requirement at two points in time: (1) after receiving their first grant and (2) the day of survey completion. After the latter question, those who reported that they were unlikely to complete, they did not know how likely they were to complete, or their grants had already been converted to loans were asked follow-up questions to ascertain which factors influenced their ability to meet the program requirements.
Eight-nine percent of the TEACH Grant recipients thought they were likely or very likely to fulfill the service requirements when they received their first grant.
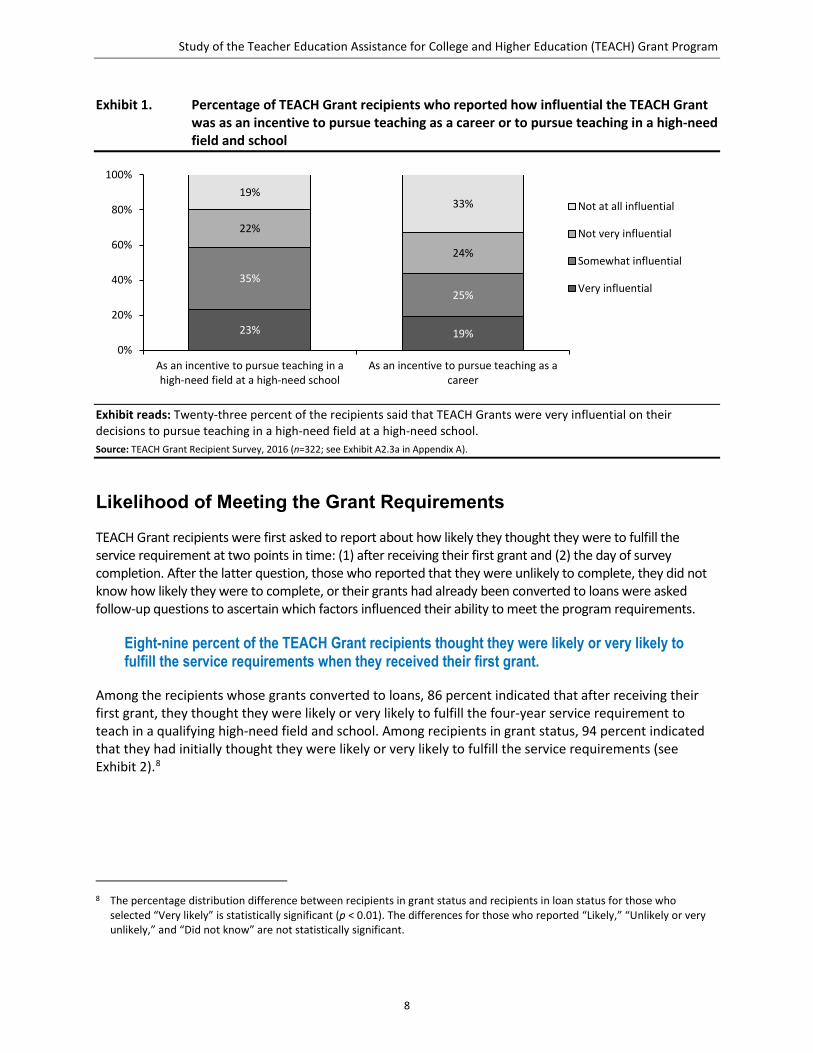
Among the recipients whose grants converted to loans, 86 percent indicated that after receiving their first grant, they thought they were likely or very likely to fulfill the four-year service requirement to teach in a qualifying high-need field and school. Among recipients in grant status, 94 percent indicated that they had initially thought they were likely or very likely to fulfill the service requirements (see Exhibit 2).8
8 The percentage distribution difference between recipients in grant status and recipients in loan status for those who
selected “Very likely” is statistically significant (p < 0.01). The differences for those who reported “Likely,” “Unlikely or very unlikely,” and “Did not know” are not statistically significant.
19%23%
25%35%
24%
22%
33%19%
0%
20%
40%
60%
80%
100%
As an incentive to pursue teaching as acareer
As an incentive to pursue teaching in ahigh-need field at a high-need school
Not at all influential
Not very influential
Somewhat influential
Very influential
Study of the Teacher Education Assistance for College and Higher Education (TEACH) Grant Program
9
Exhibit 2. Percentage of TEACH Grant recipients’ likelihood of fulfilling the service requirements at the time of receiving their first TEACH Grant, by grant-to-loan conversion status
Exhibit reads: Fifty-eight percent of the recipients indicated that they were very likely to fulfill the service requirements when they first received their grant. Source: TEACH Grant Recipient Survey, 2016 (n=322; see Exhibit A2.2a in Appendix A).
At the time of survey completion, 56 percent of the recipients reported that they were likely or very likely to complete the service requirements — or had already completed them.
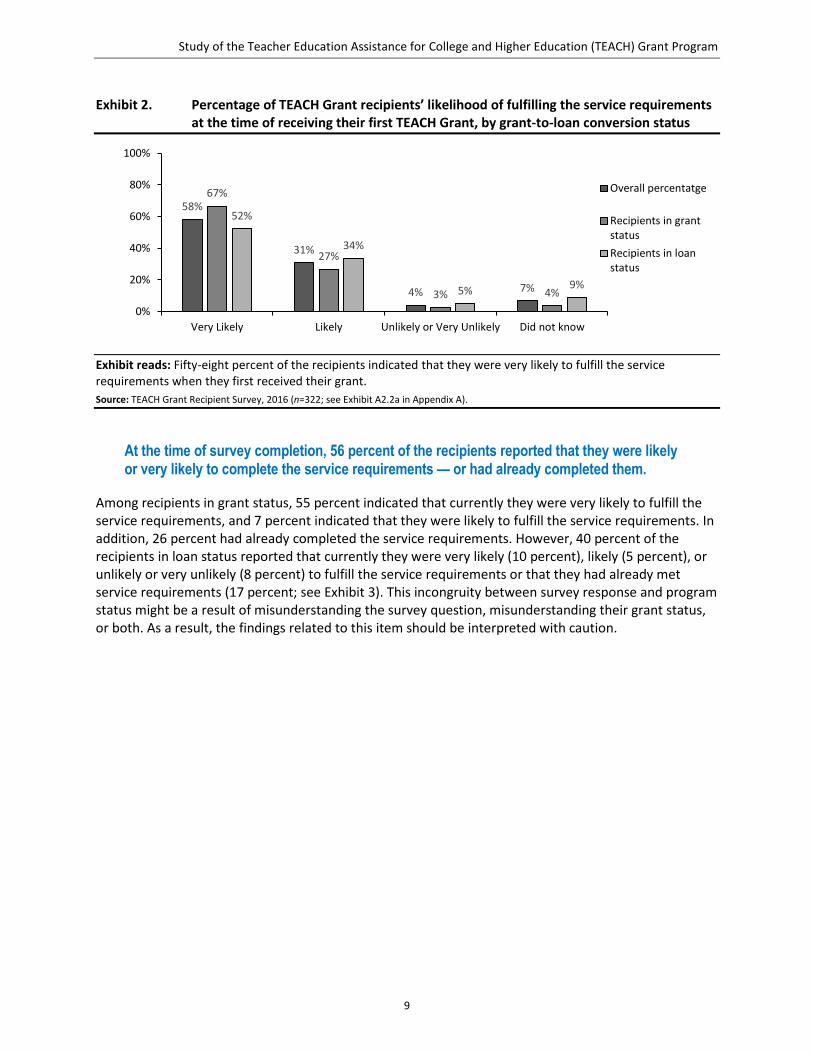
Among recipients in grant status, 55 percent indicated that currently they were very likely to fulfill the service requirements, and 7 percent indicated that they were likely to fulfill the service requirements. In addition, 26 percent had already completed the service requirements. However, 40 percent of the recipients in loan status reported that currently they were very likely (10 percent), likely (5 percent), or unlikely or very unlikely (8 percent) to fulfill the service requirements or that they had already met service requirements (17 percent; see Exhibit 3). This incongruity between survey response and program status might be a result of misunderstanding the survey question, misunderstanding their grant status, or both. As a result, the findings related to this item should be interpreted with caution.
58%
31%
4% 7%
67%
27%
3% 4%
52%
34%
5% 9%
0%
20%
40%
60%
80%
100%
Very Likely Likely Unlikely or Very Unlikely Did not know
Overall percentatge
Recipients in grantstatusRecipients in loanstatus
Study of the Teacher Education Assistance for College and Higher Education (TEACH) Grant Program
10
Exhibit 3. Percentage of TEACH Grant recipients’ likelihood of fulfilling the service requirements at the time of survey completion, by loan conversion status
Exhibit reads: Twenty-nine percent of the recipients indicated that they were very likely to fulfill the service requirements at the time of survey completion. — = Not applicable. ^ = Interpret with caution. Recipients in loan status who reported they were very likely, likely, unlikely, or very unlikely to meet or had already met service requirements were responding inconsistently relative to their program status. Note: For recipients in loan status, 0.8 percent said “Do Not Know” and are not shown in this graph. Source: TEACH Grant Recipient Survey, 2016 (n=319; see Exhibit A2.2b in Appendix A).
Conversion Rates from Grants to Loans
Using extant data for the entire institutional population, grant-to-loan conversion rates were derived by first calculating the cumulative total number of recipients from award years 2008–2014 who had begun their service obligation period prior to July 1, 2014, for each institution. Then, the number of those recipients for whom at least one grant had been converted to a loan was divided by the total to get the conversion rate. Recipients identified with a death or disability status, or whose grants had been canceled, were excluded.
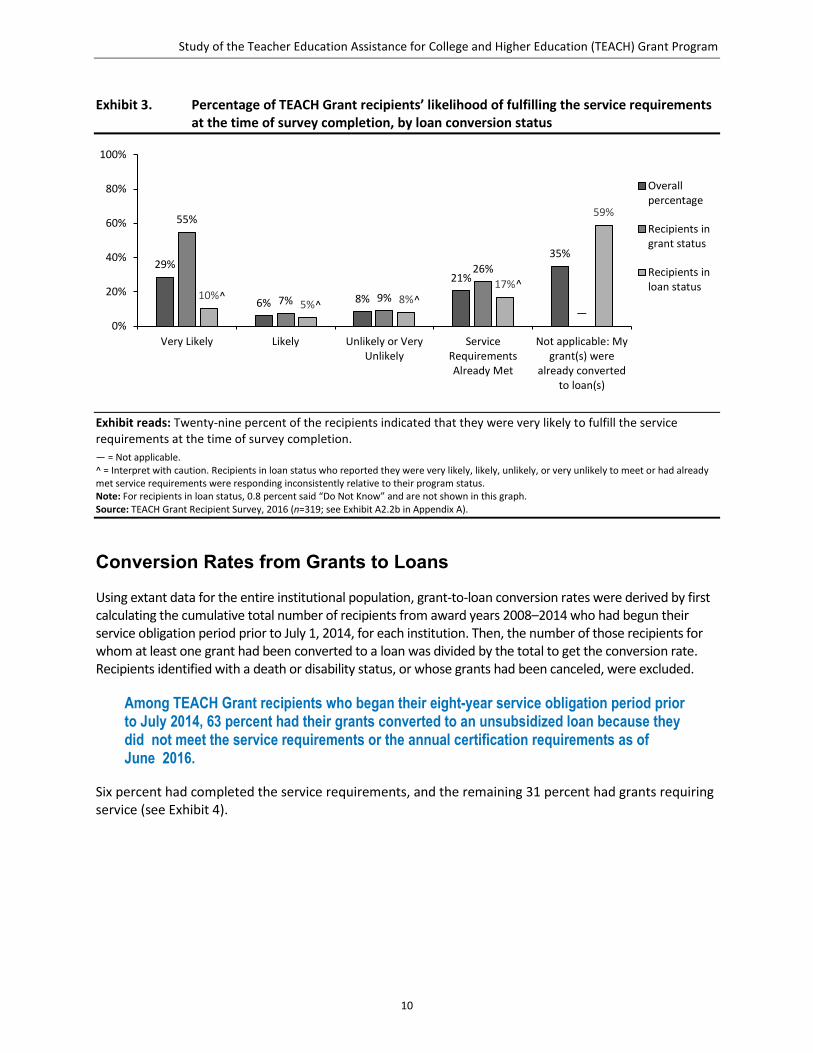
Among TEACH Grant recipients who began their eight-year service obligation period prior to July 2014, 63 percent had their grants converted to an unsubsidized loan because they did not meet the service requirements or the annual certification requirements as of June 2016.
Six percent had completed the service requirements, and the remaining 31 percent had grants requiring service (see Exhibit 4).
29%
6% 8%
21%
35%
55%
7% 9%
26%
—10%
5% 8%17%
59%
0%
20%
40%
60%
80%
100%
Very Likely Likely Unlikely or VeryUnlikely
ServiceRequirementsAlready Met
Not applicable: Mygrant(s) were
already convertedto loan(s)
Overallpercentage
Recipients ingrant status
Recipients inloan status
^ ^ ^
^
Study of the Teacher Education Assistance for College and Higher Education (TEACH) Grant Program
11
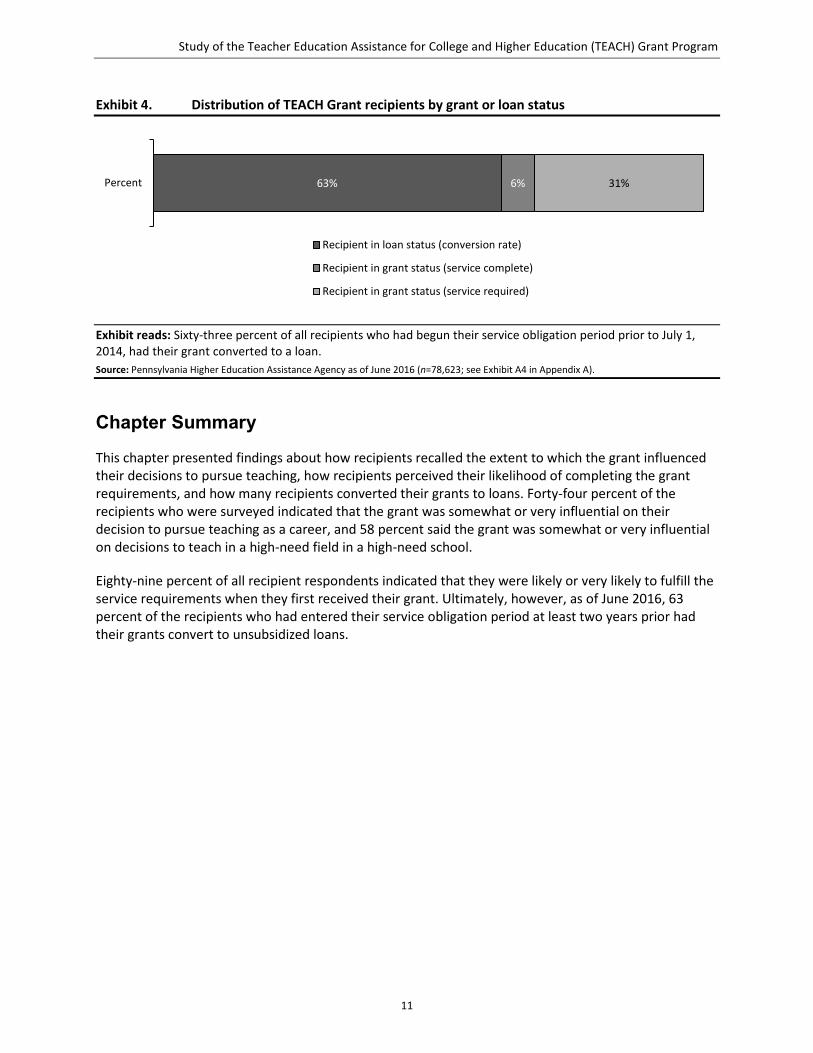
Exhibit 4. Distribution of TEACH Grant recipients by grant or loan status
Exhibit reads: Sixty-three percent of all recipients who had begun their service obligation period prior to July 1, 2014, had their grant converted to a loan. Source: Pennsylvania Higher Education Assistance Agency as of June 2016 (n=78,623; see Exhibit A4 in Appendix A).
Chapter Summary
This chapter presented findings about how recipients recalled the extent to which the grant influenced their decisions to pursue teaching, how recipients perceived their likelihood of completing the grant requirements, and how many recipients converted their grants to loans. Forty-four percent of the recipients who were surveyed indicated that the grant was somewhat or very influential on their decision to pursue teaching as a career, and 58 percent said the grant was somewhat or very influential on decisions to teach in a high-need field in a high-need school.
Eighty-nine percent of all recipient respondents indicated that they were likely or very likely to fulfill the service requirements when they first received their grant. Ultimately, however, as of June 2016, 63 percent of the recipients who had entered their service obligation period at least two years prior had their grants convert to unsubsidized loans.
63% 6% 31%Percent
Recipient in loan status (conversion rate)
Recipient in grant status (service complete)
Recipient in grant status (service required)

Study of the Teacher Education Assistance for College and Higher Education (TEACH) Grant Program
13
Recipient Factors Associated with Not Meeting the TEACH Grant Requirements
This chapter presents findings about the recipient factors associated with recipients’ not meeting the grant requirements, including details on factors such as not annually certifying and teaching in a nonqualifying position. These recipient factors include reported employment and educational circumstances, reported understanding of grant requirements, and personal characteristics. In addition, this chapter provides comparisons of recipients’ perceptions of how informed they were about the grant requirements between recipients whose grants converted to loans and recipients whose grant requirements were met or require service (i.e., in grant status). The chapter concludes with a discussion of grant-to-loan conversion rates and their association with recipient characteristics such as gender, Pell Grant recipients, and academic level at the time of first grant award.
Key Findings
• Factors related to employment that are influential to not completing the service requirements, as reported at the time of survey completion by grant recipients in loan status, included teaching in a position that did not qualify for TEACH Grant service (39 percent) and not working as a certified teacher (33 percent).
• Thirty-two percent of the recipients in loan status reported not understanding the service requirements as an influencing factor to not completing those requirements.
• Factors related to annual certification that are influential to not completing the service requirements, as reported at the time of survey completion by grant recipients in loan status, included not certifying because they did not know about the annual certification process (19 percent) and not certifying because of challenges related to the certification process (13 percent).
• TEACH Grant recipients who were in loan status were less likely than those who were in grant status to say they were well informed about the service requirements during the process of obtaining their first grant (39 percent and 65 percent, respectively).
• Grant-to-loan conversion rates were higher among males, students with federal loans, and Pell Grant recipients.
TEACH Grant recipients were first asked to report about how likely they thought they were to fulfill the service requirement at two points in time: (1) after receiving their first grant and (2) the day of survey completion. After the latter question, those who reported that they were unlikely to complete, that they did not know how likely they were to complete, or that their grants had already been converted to loans were asked follow-up questions to ascertain which factors influenced their inability to meet the program requirements. They were asked to respond with a yes or no to each factor, which allowed them to say yes to multiple factors. These factors included situations that would eventually lead to loan conversion if they persisted — like teaching in a nonqualifying position — as well as situations that would immediately lead to loan conversion — that is, not certifying annually. The annual certification requirement is part of the Agreement to Serve, and the annual certification itself is required to

Study of the Teacher Education Assistance for College and Higher Education (TEACH) Grant Program
14
document teaching in a high-need field and school; for this reason, factors related to annual certification are included on the list of factors influencing the completion of the service requirements.
Factors Associated with Recipients Not Meeting the TEACH Grant Requirements
Sixty-eight percent of the recipients in loan status reported factors influential to not completing the service requirements (see Exhibit 5). These factors fall into three broad categories: factors related to employment include situations that affect whether recipients obtain positions that qualify for grant service, factors related to understanding the service requirements include situations in which the recipients did not understand the requirements to complete grant service, and factors related to annual certification pertain to the administrative process by which recipients maintain their grant status.
Exhibit 5. Percentage of TEACH Grant recipients in loan status who reported factors that influenced their not fulfilling the service requirements
Exhibit reads: Thirty-nine percent of the recipients in loan status indicated at the time of survey completion that teaching in a position that does not qualify for TEACH Grant service is a factor that influenced their not fulfilling the service requirements. This exhibit presents responses to two related survey questions that were asked only of those respondents who had reported in a previous question that either their grants had already been converted to loans or they were unlikely or unsure of their likelihood to complete the service requirements. The first of these two survey questions asked respondents to select any or all factors influential to not completing the service requirements (see Exhibit A2.2c). The second asked the 44 percent of respondents who reported not annually certifying as a factor in the first question to select one reason why they did not certify (see Exhibit A2.2d, which, in contrast to this exhibit, uses that 44 percent of respondents as the denominator). As a result, the percentages of “factors related to employment” and “factors related to understanding requirements” may not be directly comparable to “factors related to annual certification.” The total percentage will not sum to 100 percent because respondents could select more than one response category. Source: TEACH Grant Recipient Survey, 2016. (n=88; see Exhibit A2.2c and A2.2d in Appendix A).
39%33% 32%
19%13% 9%
0%
20%
40%
60%
80%
100%
Teaching in aposition that
does not qualifyfor TEACH Grant
service
Not teaching ordid not complete
degree orteaching
certificate
Did notunderstand the
servicerequirements of
the grant
Did not certifybecause did not
know aboutannual
certificationprocess
Did not certifybecause ofchallenges
related to annualcertification
process
Did not certifybecause forgotabout annualcertification
Factors related to employment Factors related tounderstandingrequirements
Factors related to annual certification
Study of the Teacher Education Assistance for College and Higher Education (TEACH) Grant Program
15
Factors related to employment that are influential to not completing the service requirements, as reported at the time of survey completion by grant recipients in loan status, included teaching in a position that did not qualify for TEACH Grant service (39 percent) and not working as a certified teacher (33 percent).
Thirty-two percent of the recipients in loan status reported not understanding the service requirements as being an influencing factor to not completing those requirements.
Factors related to annual certification that are influential to not completing the service requirements, as reported at the time of survey completion by grant recipients in loan status, included not certifying because they did not know about the annual certification process (19 percent) and not certifying because of challenges related to the certification process (13 percent).
Forty-four percent of the recipients in loan status reported factors related to not annually certifying as influencing their not completing the grant requirements: 19 percent reported not certifying because they did not know about the annual certification process, 13 percent reported not certifying because of challenges related to the process, 9 percent reported not certifying because they forgot, and 2 percent reported not certifying for another reason.9
Twenty-four percent of the recipients in loan status also reported other factors, such as never being certain of intention to teach or not meeting state requirements for a highly qualified teacher, as influencing their not completing the service requirements.
Among the 12 percent of recipients in grant status who indicated that they were very unlikely, unlikely, or unsure of their likelihood to complete their service requirements, the most common factor was teaching in a nonqualifying position (47 percent). Other common factors were not understanding the service requirements (44 percent) and not teaching or not completing a degree or teaching certificate (33 percent).
Recipients could select more than one factor, and some selected factors related to both annual certification and employment. For example, two respondents reported that they did not annually certify because (1) they did not know about annual certification or the process and (2) they were teaching in a nonqualifying position because they could not obtain a qualifying position.
As discussed previously (see Study Limitations), the reader should note that findings related to these survey questions are limited because, in a previous question, 32 percent of the recipients in loan status reported that they were likely or very likely to complete the service requirements or that they had already completed the service requirements (see Exhibit 3). These respondents were logically skipped past questions about factors influencing the conversion of their grants to loans and therefore are not included in these analyses. Eight percent of the recipients in loan status reported that they were unlikely or very unlikely to complete the service requirements. Although these respondents were asked the questions about contributing factors, the inconsistency of their responses to the question about likelihood to complete the requirements relative to their program status may indicate that their responses to the factors questions also are limited.
9 The total of these annual certification subcomponents do not sum to 44 percent because of rounding.
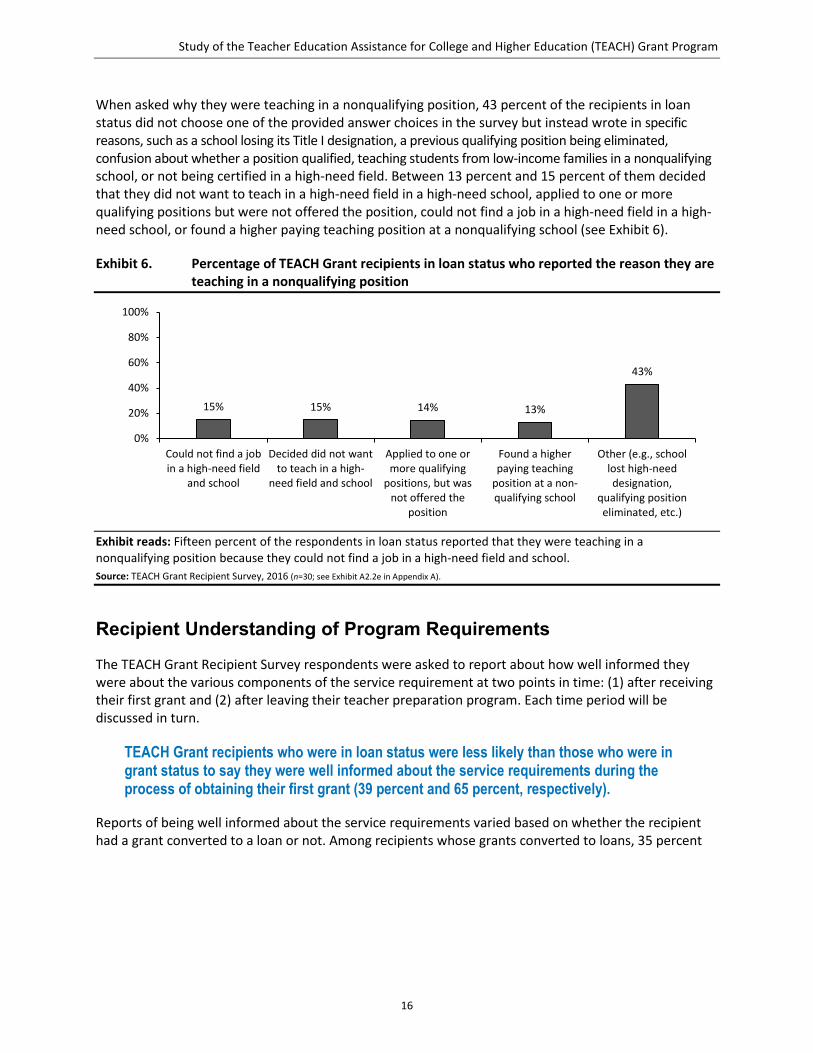
Study of the Teacher Education Assistance for College and Higher Education (TEACH) Grant Program
16
When asked why they were teaching in a nonqualifying position, 43 percent of the recipients in loan status did not choose one of the provided answer choices in the survey but instead wrote in specific reasons, such as a school losing its Title I designation, a previous qualifying position being eliminated, confusion about whether a position qualified, teaching students from low-income families in a nonqualifying school, or not being certified in a high-need field. Between 13 percent and 15 percent of them decided that they did not want to teach in a high-need field in a high-need school, applied to one or more qualifying positions but were not offered the position, could not find a job in a high-need field in a high-need school, or found a higher paying teaching position at a nonqualifying school (see Exhibit 6).
Exhibit 6. Percentage of TEACH Grant recipients in loan status who reported the reason they are teaching in a nonqualifying position
Exhibit reads: Fifteen percent of the respondents in loan status reported that they were teaching in a nonqualifying position because they could not find a job in a high-need field and school. Source: TEACH Grant Recipient Survey, 2016 (n=30; see Exhibit A2.2e in Appendix A).
Recipient Understanding of Program Requirements
The TEACH Grant Recipient Survey respondents were asked to report about how well informed they were about the various components of the service requirement at two points in time: (1) after receiving their first grant and (2) after leaving their teacher preparation program. Each time period will be discussed in turn.
TEACH Grant recipients who were in loan status were less likely than those who were in grant status to say they were well informed about the service requirements during the process of obtaining their first grant (39 percent and 65 percent, respectively).
Reports of being well informed about the service requirements varied based on whether the recipient had a grant converted to a loan or not. Among recipients whose grants converted to loans, 35 percent
15% 15% 14% 13%
43%
0%
20%
40%
60%
80%
100%
Could not find a jobin a high-need field
and school
Decided did not wantto teach in a high-
need field and school
Applied to one ormore qualifying
positions, but wasnot offered the
position
Found a higherpaying teaching
position at a non-qualifying school
Other (e.g., schoollost high-needdesignation,
qualifying positioneliminated, etc.)
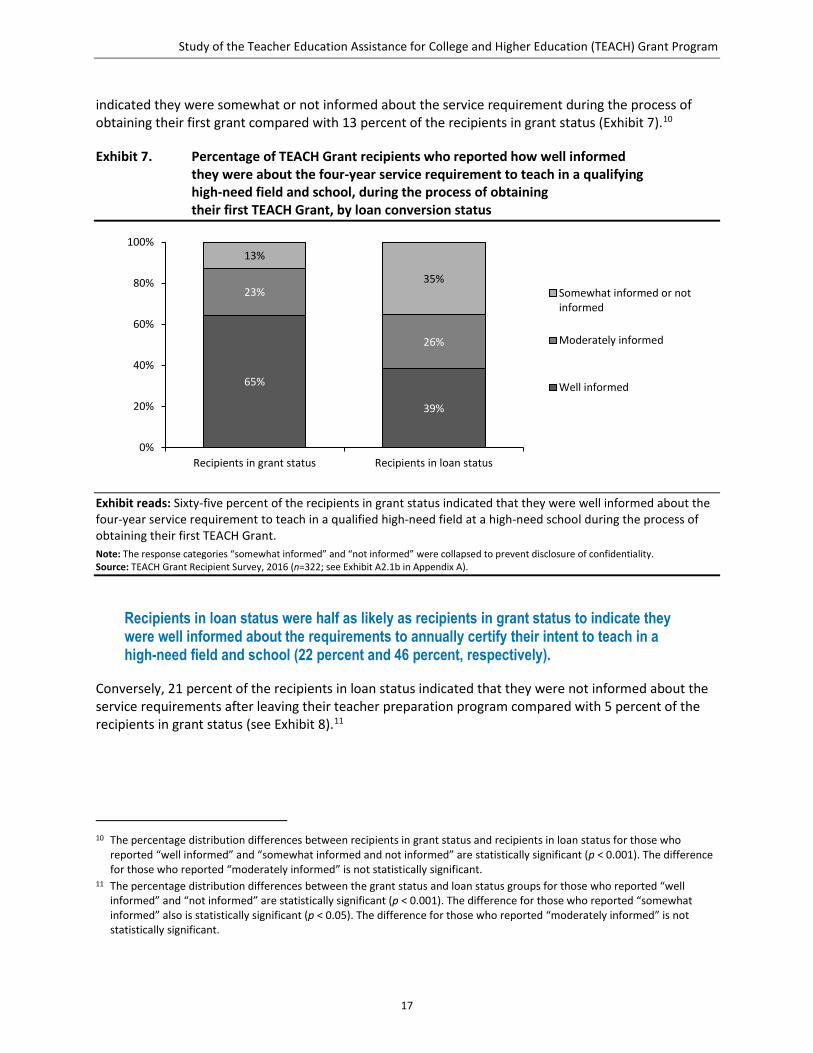
Study of the Teacher Education Assistance for College and Higher Education (TEACH) Grant Program
17
indicated they were somewhat or not informed about the service requirement during the process of obtaining their first grant compared with 13 percent of the recipients in grant status (Exhibit 7).10
Exhibit 7. Percentage of TEACH Grant recipients who reported how well informed they were about the four-year service requirement to teach in a qualifying high-need field and school, during the process of obtaining their first TEACH Grant, by loan conversion status
Exhibit reads: Sixty-five percent of the recipients in grant status indicated that they were well informed about the four-year service requirement to teach in a qualified high-need field at a high-need school during the process of obtaining their first TEACH Grant. Note: The response categories “somewhat informed” and “not informed” were collapsed to prevent disclosure of confidentiality. Source: TEACH Grant Recipient Survey, 2016 (n=322; see Exhibit A2.1b in Appendix A).
Recipients in loan status were half as likely as recipients in grant status to indicate they were well informed about the requirements to annually certify their intent to teach in a high-need field and school (22 percent and 46 percent, respectively).
Conversely, 21 percent of the recipients in loan status indicated that they were not informed about the service requirements after leaving their teacher preparation program compared with 5 percent of the recipients in grant status (see Exhibit 8).11
10 The percentage distribution differences between recipients in grant status and recipients in loan status for those who
reported “well informed” and “somewhat informed and not informed” are statistically significant (p < 0.001). The difference for those who reported “moderately informed” is not statistically significant.
11 The percentage distribution differences between the grant status and loan status groups for those who reported “well informed” and “not informed” are statistically significant (p < 0.001). The difference for those who reported “somewhat informed” also is statistically significant (p < 0.05). The difference for those who reported “moderately informed” is not statistically significant.
39%
65%
26%
23%35%
13%
0%
20%
40%
60%
80%
100%
Recipients in loan statusRecipients in grant status
Somewhat informed or notinformed
Moderately informed
Well informed
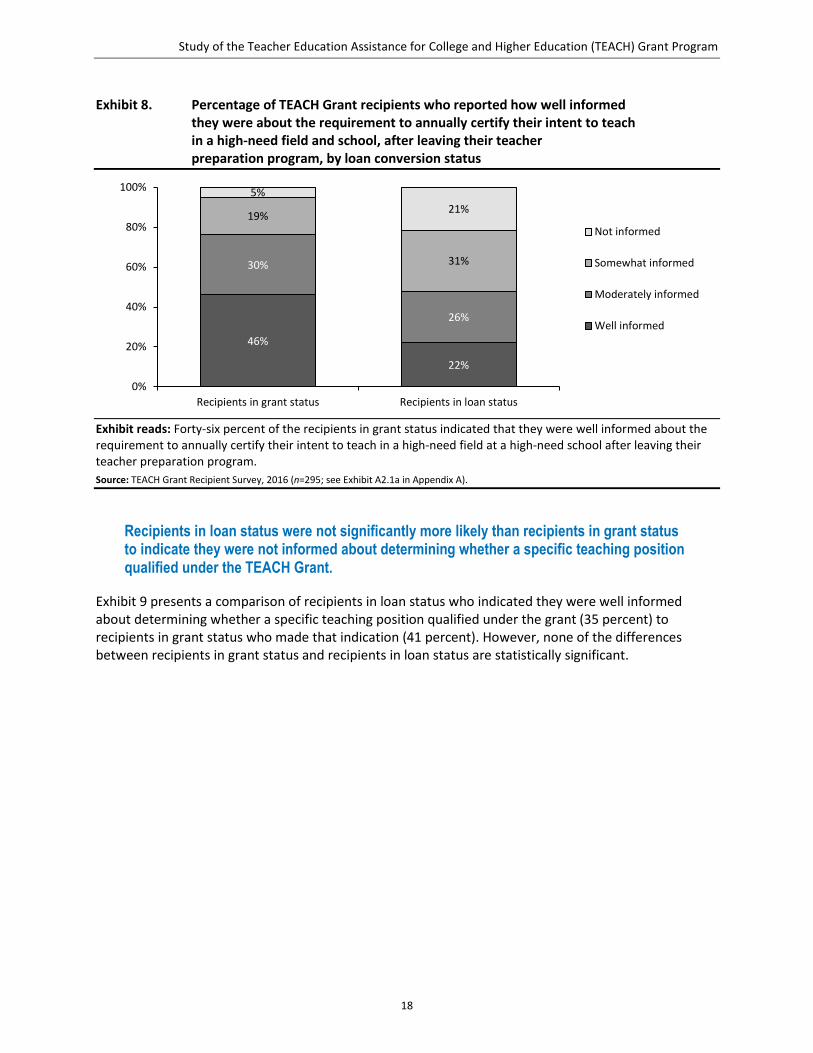
Study of the Teacher Education Assistance for College and Higher Education (TEACH) Grant Program
18
Exhibit 8. Percentage of TEACH Grant recipients who reported how well informed they were about the requirement to annually certify their intent to teach in a high-need field and school, after leaving their teacher preparation program, by loan conversion status
Exhibit reads: Forty-six percent of the recipients in grant status indicated that they were well informed about the requirement to annually certify their intent to teach in a high-need field at a high-need school after leaving their teacher preparation program. Source: TEACH Grant Recipient Survey, 2016 (n=295; see Exhibit A2.1a in Appendix A).
Recipients in loan status were not significantly more likely than recipients in grant status to indicate they were not informed about determining whether a specific teaching position qualified under the TEACH Grant.
Exhibit 9 presents a comparison of recipients in loan status who indicated they were well informed about determining whether a specific teaching position qualified under the grant (35 percent) to recipients in grant status who made that indication (41 percent). However, none of the differences between recipients in grant status and recipients in loan status are statistically significant.
22%
46%
26%
30% 31%
19% 21%5%
0%
20%
40%
60%
80%
100%
Recipients in loan statusRecipients in grant status
Not informed
Somewhat informed
Moderately informed
Well informed
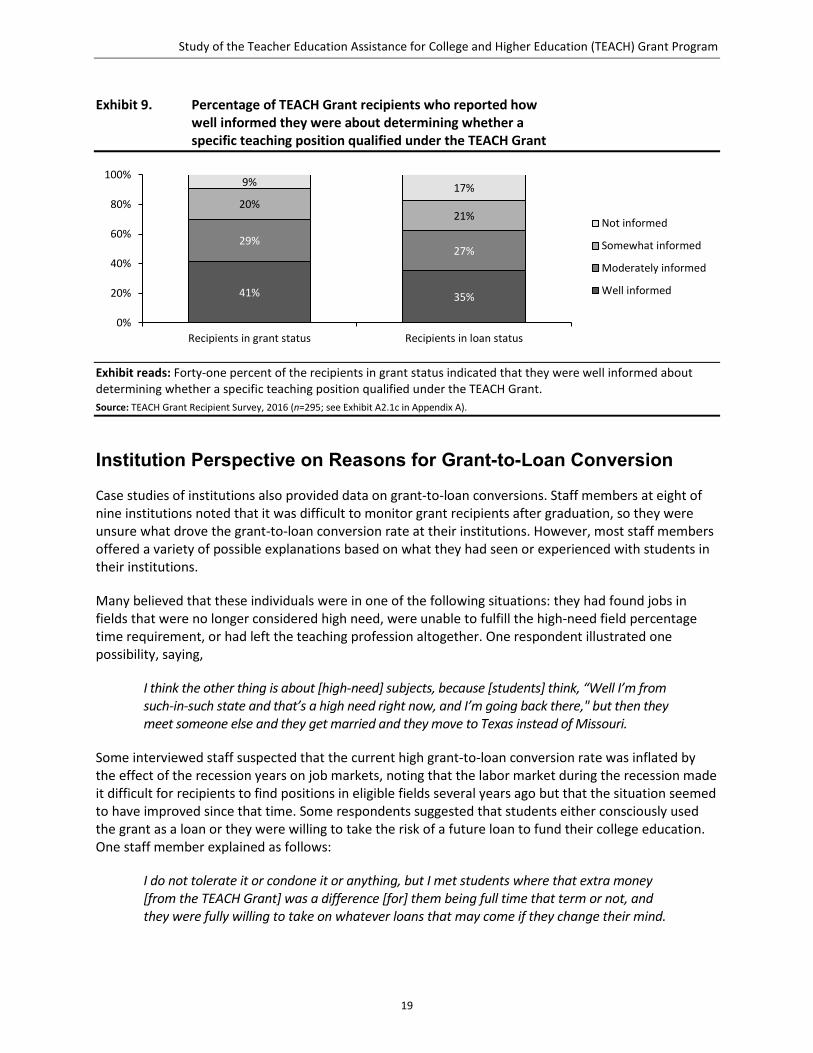
Study of the Teacher Education Assistance for College and Higher Education (TEACH) Grant Program
19
Exhibit 9. Percentage of TEACH Grant recipients who reported how well informed they were about determining whether a specific teaching position qualified under the TEACH Grant
Exhibit reads: Forty-one percent of the recipients in grant status indicated that they were well informed about determining whether a specific teaching position qualified under the TEACH Grant. Source: TEACH Grant Recipient Survey, 2016 (n=295; see Exhibit A2.1c in Appendix A).
Institution Perspective on Reasons for Grant-to-Loan Conversion
Case studies of institutions also provided data on grant-to-loan conversions. Staff members at eight of nine institutions noted that it was difficult to monitor grant recipients after graduation, so they were unsure what drove the grant-to-loan conversion rate at their institutions. However, most staff members offered a variety of possible explanations based on what they had seen or experienced with students in their institutions.
Many believed that these individuals were in one of the following situations: they had found jobs in fields that were no longer considered high need, were unable to fulfill the high-need field percentage time requirement, or had left the teaching profession altogether. One respondent illustrated one possibility, saying,
I think the other thing is about [high-need] subjects, because [students] think, “Well I’m from such-in-such state and that’s a high need right now, and I’m going back there," but then they meet someone else and they get married and they move to Texas instead of Missouri.
Some interviewed staff suspected that the current high grant-to-loan conversion rate was inflated by the effect of the recession years on job markets, noting that the labor market during the recession made it difficult for recipients to find positions in eligible fields several years ago but that the situation seemed to have improved since that time. Some respondents suggested that students either consciously used the grant as a loan or they were willing to take the risk of a future loan to fund their college education. One staff member explained as follows:
I do not tolerate it or condone it or anything, but I met students where that extra money [from the TEACH Grant] was a difference [for] them being full time that term or not, and they were fully willing to take on whatever loans that may come if they change their mind.
35%41%
27%29%
21%20%
17%9%
0%
20%
40%
60%
80%
100%
Recipients in loan statusRecipients in grant status
Not informed
Somewhat informed
Moderately informed
Well informed
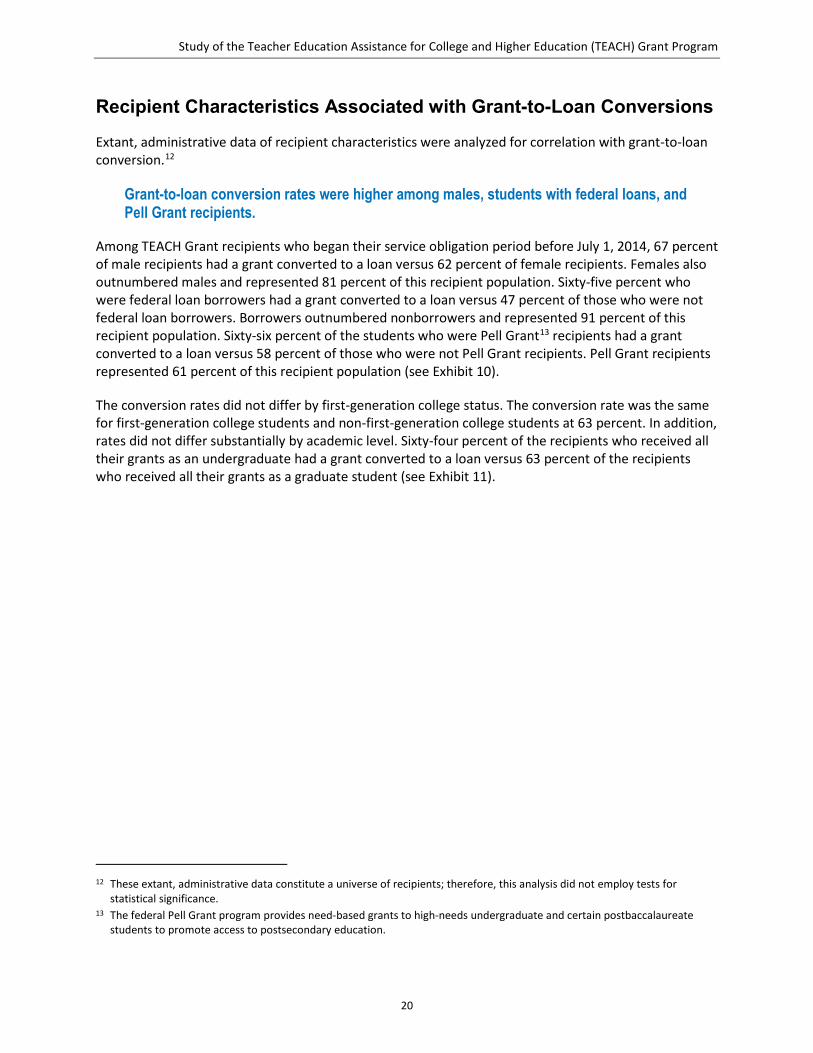
Study of the Teacher Education Assistance for College and Higher Education (TEACH) Grant Program
20
Recipient Characteristics Associated with Grant-to-Loan Conversions
Extant, administrative data of recipient characteristics were analyzed for correlation with grant-to-loan conversion.12
Grant-to-loan conversion rates were higher among males, students with federal loans, and Pell Grant recipients.
Among TEACH Grant recipients who began their service obligation period before July 1, 2014, 67 percent of male recipients had a grant converted to a loan versus 62 percent of female recipients. Females also outnumbered males and represented 81 percent of this recipient population. Sixty-five percent who were federal loan borrowers had a grant converted to a loan versus 47 percent of those who were not federal loan borrowers. Borrowers outnumbered nonborrowers and represented 91 percent of this recipient population. Sixty-six percent of the students who were Pell Grant13 recipients had a grant converted to a loan versus 58 percent of those who were not Pell Grant recipients. Pell Grant recipients represented 61 percent of this recipient population (see Exhibit 10).
The conversion rates did not differ by first-generation college status. The conversion rate was the same for first-generation college students and non-first-generation college students at 63 percent. In addition, rates did not differ substantially by academic level. Sixty-four percent of the recipients who received all their grants as an undergraduate had a grant converted to a loan versus 63 percent of the recipients who received all their grants as a graduate student (see Exhibit 11).
12 These extant, administrative data constitute a universe of recipients; therefore, this analysis did not employ tests for
statistical significance. 13 The federal Pell Grant program provides need-based grants to high-needs undergraduate and certain postbaccalaureate
students to promote access to postsecondary education.
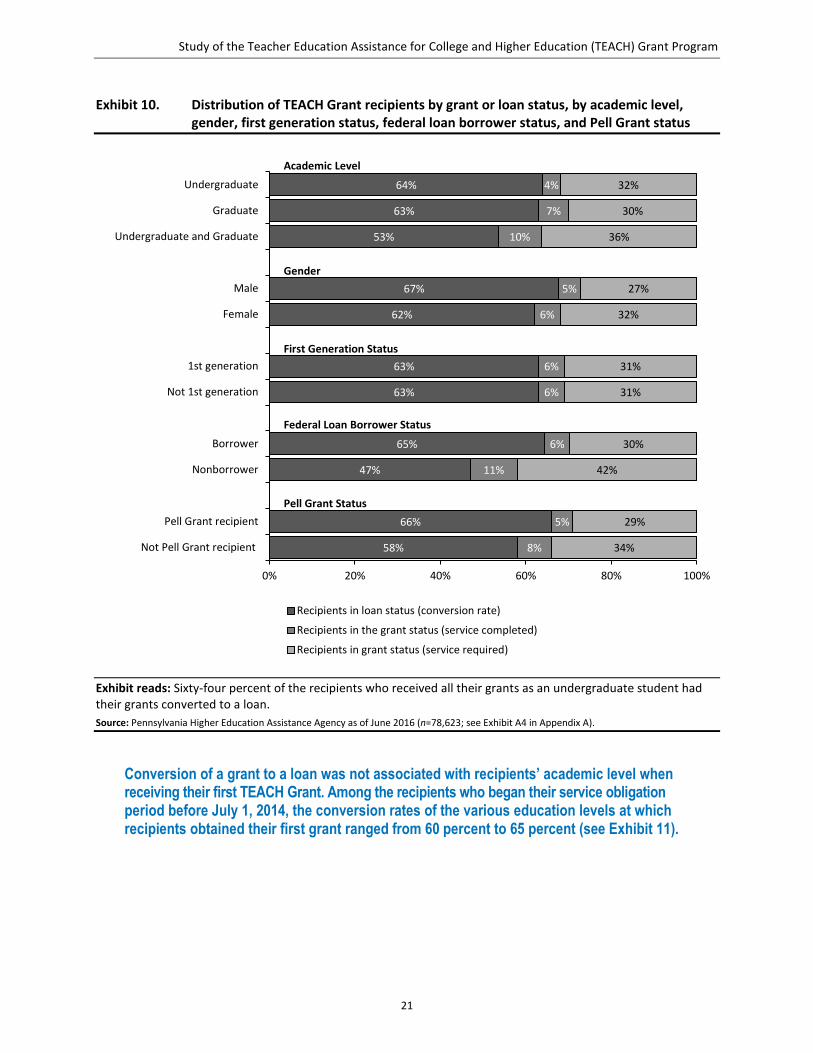
Study of the Teacher Education Assistance for College and Higher Education (TEACH) Grant Program
21
Exhibit 10. Distribution of TEACH Grant recipients by grant or loan status, by academic level, gender, first generation status, federal loan borrower status, and Pell Grant status
Exhibit reads: Sixty-four percent of the recipients who received all their grants as an undergraduate student had their grants converted to a loan. Source: Pennsylvania Higher Education Assistance Agency as of June 2016 (n=78,623; see Exhibit A4 in Appendix A).
Conversion of a grant to a loan was not associated with recipients’ academic level when receiving their first TEACH Grant. Among the recipients who began their service obligation period before July 1, 2014, the conversion rates of the various education levels at which recipients obtained their first grant ranged from 60 percent to 65 percent (see Exhibit 11).
58%
66%
47%
65%
63%
63%
62%
67%
53%
63%
64%
8%
5%
11%
6%
6%
6%
6%
5%
10%
7%
4%
34%
29%
42%
30%
31%
31%
32%
27%
36%
30%
32%
0% 20% 40% 60% 80% 100%
Not Pell Grant recipient
Pell Grant recipient
Nonborrower
Borrower
Not 1st generation
1st generation
Female
Male
Undergraduate and Graduate
Graduate
Undergraduate
Recipients in loan status (conversion rate)
Recipients in the grant status (service completed)
Recipients in grant status (service required)
Academic Level
Gender
First Generation Status
Federal Loan Borrower Status
Pell Grant Status
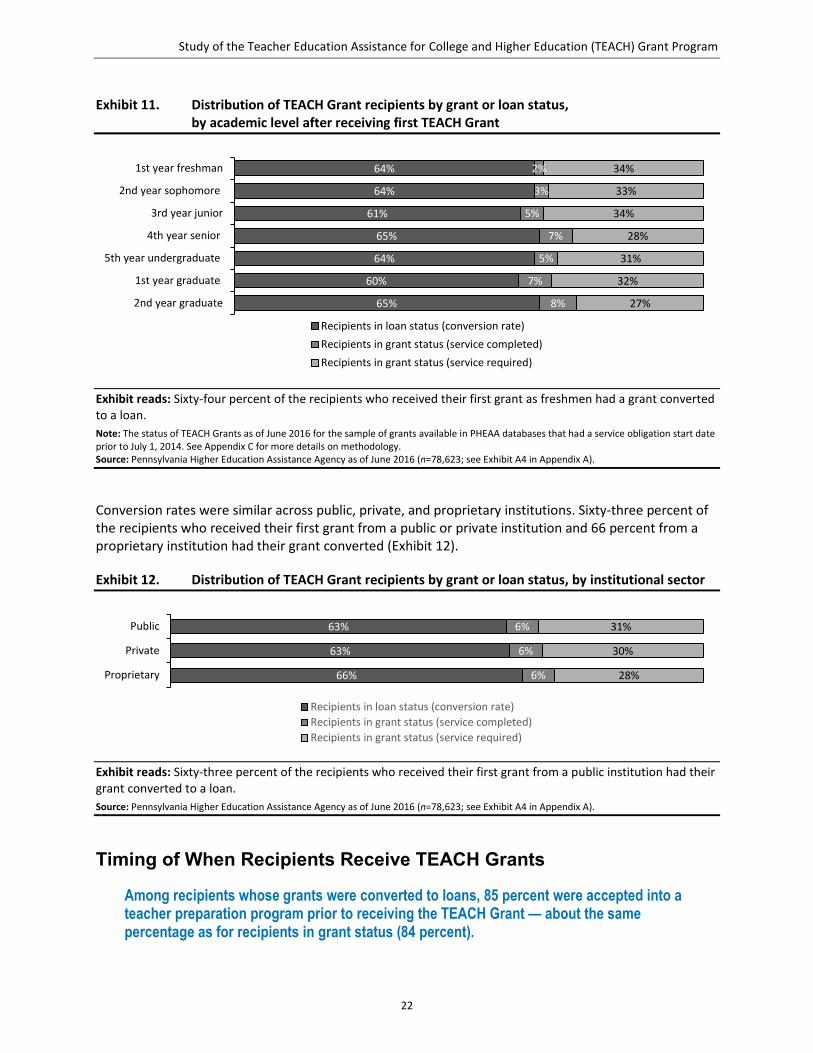
Study of the Teacher Education Assistance for College and Higher Education (TEACH) Grant Program
22
Exhibit 11. Distribution of TEACH Grant recipients by grant or loan status, by academic level after receiving first TEACH Grant
Exhibit reads: Sixty-four percent of the recipients who received their first grant as freshmen had a grant converted to a loan. Note: The status of TEACH Grants as of June 2016 for the sample of grants available in PHEAA databases that had a service obligation start date prior to July 1, 2014. See Appendix C for more details on methodology. Source: Pennsylvania Higher Education Assistance Agency as of June 2016 (n=78,623; see Exhibit A4 in Appendix A).
Conversion rates were similar across public, private, and proprietary institutions. Sixty-three percent of the recipients who received their first grant from a public or private institution and 66 percent from a proprietary institution had their grant converted (Exhibit 12).
Exhibit 12. Distribution of TEACH Grant recipients by grant or loan status, by institutional sector
Exhibit reads: Sixty-three percent of the recipients who received their first grant from a public institution had their grant converted to a loan. Source: Pennsylvania Higher Education Assistance Agency as of June 2016 (n=78,623; see Exhibit A4 in Appendix A).
Timing of When Recipients Receive TEACH Grants
Among recipients whose grants were converted to loans, 85 percent were accepted into a teacher preparation program prior to receiving the TEACH Grant — about the same percentage as for recipients in grant status (84 percent).
64%
64%
61%
65%
64%
60%
65%
2%
3%
5%
7%
5%
7%
8%
34%
33%
34%
28%
31%
32%
27%
1st year freshman
2nd year sophomore
3rd year junior
4th year senior
5th year undergraduate
1st year graduate
2nd year graduate
Recipients in loan status (conversion rate)Recipients in grant status (service completed)Recipients in grant status (service required)
63%
63%
66%
6%
6%
6%
31%
30%
28%
Public
Private
Proprietary
Recipients in loan status (conversion rate)Recipients in grant status (service completed)Recipients in grant status (service required)
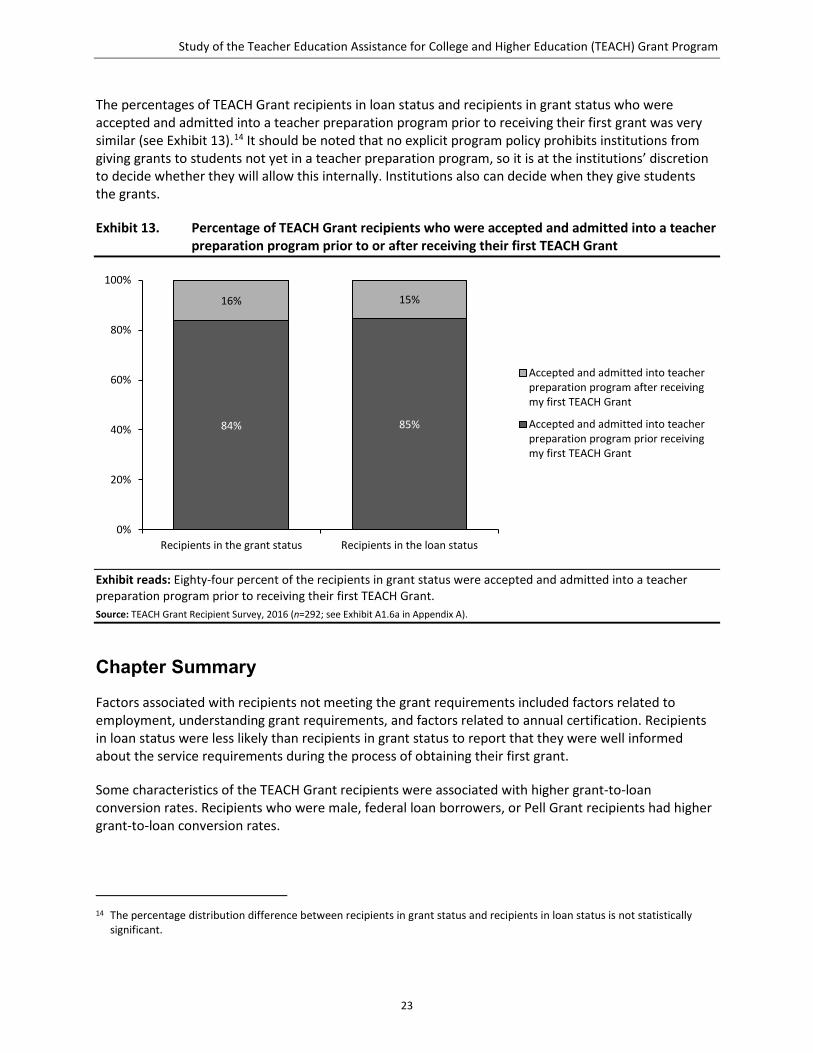
Study of the Teacher Education Assistance for College and Higher Education (TEACH) Grant Program
23
The percentages of TEACH Grant recipients in loan status and recipients in grant status who were accepted and admitted into a teacher preparation program prior to receiving their first grant was very similar (see Exhibit 13).14 It should be noted that no explicit program policy prohibits institutions from giving grants to students not yet in a teacher preparation program, so it is at the institutions’ discretion to decide whether they will allow this internally. Institutions also can decide when they give students the grants.
Exhibit 13. Percentage of TEACH Grant recipients who were accepted and admitted into a teacher preparation program prior to or after receiving their first TEACH Grant
Exhibit reads: Eighty-four percent of the recipients in grant status were accepted and admitted into a teacher preparation program prior to receiving their first TEACH Grant. Source: TEACH Grant Recipient Survey, 2016 (n=292; see Exhibit A1.6a in Appendix A).
Chapter Summary
Factors associated with recipients not meeting the grant requirements included factors related to employment, understanding grant requirements, and factors related to annual certification. Recipients in loan status were less likely than recipients in grant status to report that they were well informed about the service requirements during the process of obtaining their first grant.
Some characteristics of the TEACH Grant recipients were associated with higher grant-to-loan conversion rates. Recipients who were male, federal loan borrowers, or Pell Grant recipients had higher grant-to-loan conversion rates.
14 The percentage distribution difference between recipients in grant status and recipients in loan status is not statistically
significant.
85%84%
15%16%
0%
20%
40%
60%
80%
100%
Recipients in the loan statusRecipients in the grant status
Accepted and admitted into teacherpreparation program after receivingmy first TEACH Grant
Accepted and admitted into teacherpreparation program prior receivingmy first TEACH Grant

Study of the Teacher Education Assistance for College and Higher Education (TEACH) Grant Program
25
Institutional Administration of TEACH Grants
The findings in this section describe how and why institutions administered the grant and the type of support they provide to the recipients.
Key Findings
• Institutions were more likely to report using TEACH Grants to make higher education more affordable for students than to encourage students to pursue teaching in a high-need field at a high-need school.
• Within higher education institutions, TEACH Grants were primarily overseen by financial aid office staff rather than college of education staff.
• For 42 percent of the students who received TEACH Grants in 2013–14, the sum of their TEACH Grants and federal loans in that year exceeded the federal annual loan limit.
• In an examination of common TEACH Grant administrative practices, 70 percent provided students with placement services for qualifying TEACH Grant service positions.
Institutional Goals for Use of TEACH Grants
Institutions were more likely to report using TEACH Grants to make higher education more affordable for students than to encourage students to pursue teaching in a high-need field at a high-need school.
Ninety-two percent of the IHE Survey respondents reported that one goal of the grant was to make education more affordable for their students who are interested in teaching in high-need areas (Exhibit 14). Forty-nine percent indicated that they administered the grant to encourage students to pursue teaching in a high-need field at a high-need school.
As one staff member explained, their institution administers the TEACH Grant because
We want students in those [high needs] as much as possible. The state has a great need for these areas, and the TEACH Grant is one of those ways that we try to encourage students to go into the field, knowing that they would get some financial incentive to join us and be in those areas.

Study of the Teacher Education Assistance for College and Higher Education (TEACH) Grant Program
26
Exhibit 14. Percentage of institutions of higher education reporting certain institutional goals for the use of TEACH Grants
Exhibit reads: Ninety-two percent of the IHE Survey respondents indicated that they administered the TEACH Grant to make education more affordable for teacher candidates potentially interested in teaching in a high-need field at a high-need school. Source: Institution of Higher Education Survey, 2016 (n=345; see Exhibit A1.1a in Appendix A).
Institution Staff Roles Related to TEACH Grant Implementation
Within higher education institutions, TEACH Grants were primarily overseen by financial aid office staff rather than college of education staff.
Survey and interview data indicated that the financial aid office provides lead oversight of the TEACH Grant within institutions. Ninety-three percent of the IHE Survey respondents indicated that the financial aid office led oversight of the grant. Seven percent of the respondents indicated that other departments led oversight, including the college of education (see Exhibit 15). Institutional interviews15 supported the survey findings. During the staff interviews, financial aid office and college of education staff described how financial aid offices typically conduct administrative activities associated with the grant. Interviews with financial aid staff were conducted for seven sites. For these seven sites, the financial aid staff interviewed described how they typically assigned a point person or small team to work on the grant and serve as the “expert.”
15 Institution interviews were conducted with a nonrepresentative sample of institutions.
92%
49%
6%
0% 20% 40% 60% 80% 100%
To make education affordable for teacher candidatespotentially interested in teaching in a high-need subject at a
high-need school
Encourage education students to pursue teaching in a high-need subject at a high-need school
Other

Study of the Teacher Education Assistance for College and Higher Education (TEACH) Grant Program
27
Exhibit 15. Percentage of institutions of higher education, by office or department with the lead oversight for TEACH Grant administration
Exhibit reads: In 93 percent of the institutions, the financial aid office takes the lead on oversight of the TEACH Grant. Source: Institution of Higher Education Survey, 2016 (n=345; see Exhibit A1.3a in Appendix A).
During interviews, the financial aid staff described their involvement in TEACH Grant administration, including how they determined initial and ongoing student eligibility for the grant while students were enrolled in the institution. Staff at three of nine institutions discussed the use of data systems to automatically capture eligibility information, whereas the other six institutions manually confirmed student eligibility. When asked about activities conducted to administer the grant, financial aid staff at six of the seven sites who had financial aid staff interviewed also indicated that they counseled students on grant requirements, both in person and online. Staff created and disseminated informational materials about the grant and trained and informed college of education staff about the grant.
In interviews, college of education staff at all nine institutions described some involvement with TEACH Grant administration, stating that they typically work with the financial aid office to review and verify eligible college of education programs and eligible students. This included informing financial aid offices of high-need certification areas, in addition to corresponding majors, minors, and teacher education programs. At seven of nine institutions, staff also informed students about the grant through college of education events or courses. At four of nine institutions, college of education staff specifically described how they worked collaboratively with the financial aid office to support grant administration; for example, one dean of education said:
We are a very collaborative environment. Our services are all college driven and collaboratively developed. For example, with respect to the TEACH Grant, we drive which programs are eligible for those grants. We’re the ones that review that academic program to see if it meets the qualifications, not only at a federal level but at a state level, and then work directly with [financial aid] to make sure that those programs are the only ones that are available to our students.
In contrast, two college of education deans stated that college of education staff had little involvement with the grant program. For example, one said:
The College of Education isn’t all that much involved in it [the TEACH Grant]. It’s handled really with financial aid. Students learn about it partially through them. Our advisors can tell students about it mostly as we talk about other resources, but then the financial aid people I’m sure will deal with the counseling specifically about the TEACH Grants.
93%
5%
2%
0% 20% 40% 60% 80% 100%
Financial aid office
School/department of education
Other field-specific school or department
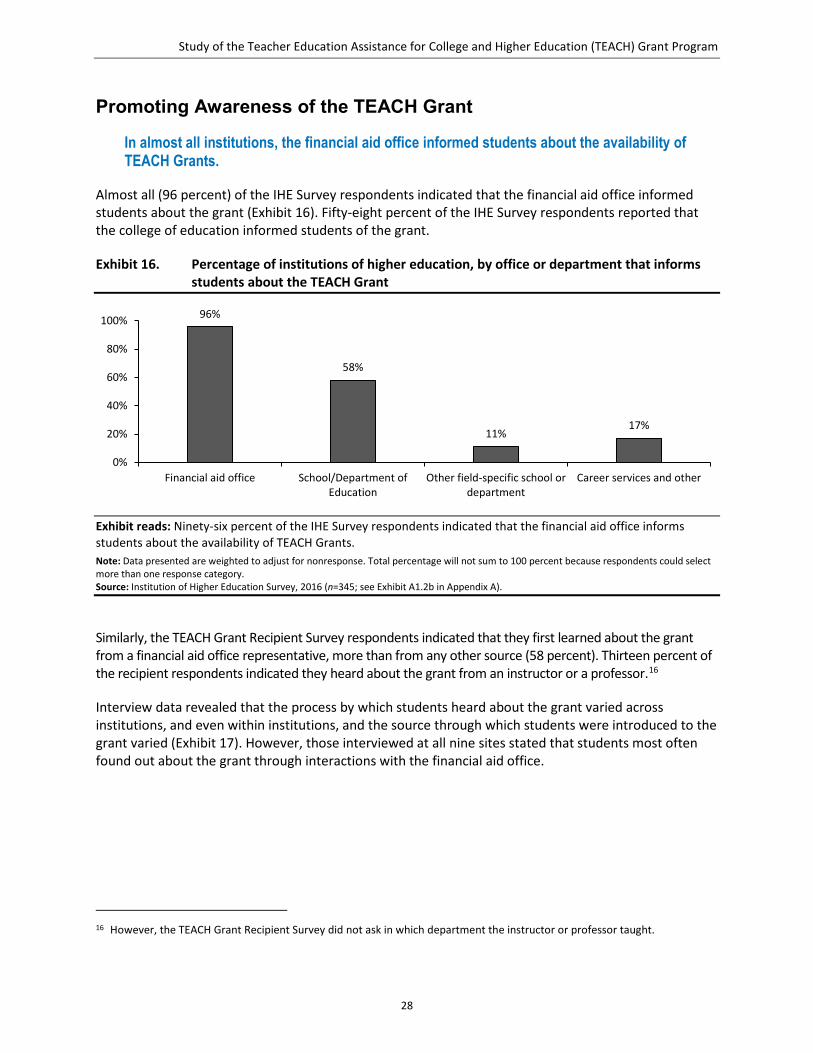
Study of the Teacher Education Assistance for College and Higher Education (TEACH) Grant Program
28
Promoting Awareness of the TEACH Grant
In almost all institutions, the financial aid office informed students about the availability of TEACH Grants.
Almost all (96 percent) of the IHE Survey respondents indicated that the financial aid office informed students about the grant (Exhibit 16). Fifty-eight percent of the IHE Survey respondents reported that the college of education informed students of the grant.
Exhibit 16. Percentage of institutions of higher education, by office or department that informs students about the TEACH Grant
Exhibit reads: Ninety-six percent of the IHE Survey respondents indicated that the financial aid office informs students about the availability of TEACH Grants. Note: Data presented are weighted to adjust for nonresponse. Total percentage will not sum to 100 percent because respondents could select more than one response category. Source: Institution of Higher Education Survey, 2016 (n=345; see Exhibit A1.2b in Appendix A).
Similarly, the TEACH Grant Recipient Survey respondents indicated that they first learned about the grant from a financial aid office representative, more than from any other source (58 percent). Thirteen percent of the recipient respondents indicated they heard about the grant from an instructor or a professor.16
Interview data revealed that the process by which students heard about the grant varied across institutions, and even within institutions, and the source through which students were introduced to the grant varied (Exhibit 17). However, those interviewed at all nine sites stated that students most often found out about the grant through interactions with the financial aid office.
16 However, the TEACH Grant Recipient Survey did not ask in which department the instructor or professor taught.
96%
58%
11%17%
0%
20%
40%
60%
80%
100%
Financial aid office School/Department ofEducation
Other field-specific school ordepartment
Career services and other

Study of the Teacher Education Assistance for College and Higher Education (TEACH) Grant Program
29
Exhibit 17. Percentage of TEACH Grant recipients, by information source from which recipients first learned about the TEACH Grant
Exhibit reads: Fifty-eight percent of all recipients indicated that they first learned about the TEACH Grants from a financial aid office representative. ‡ = Reporting standards not met. Either there are too few cases for a reliable estimate or the coefficient of variation (CV) is 50 percent or greater. Note: Data presented are weighted for sampling and nonresponse. Total number of TEACH Grant recipient respondents unweighted = 322. Total percentage will not sum to 100 percent because respondents could select more than one response category. Standard errors (SE) are relative to the percentages. Source: TEACH Grant Recipient Survey, 2016 (n=322; see Exhibit A1.2c in Appendix A).
Staff members at eight sites were asked about using the TEACH Grant as a recruitment tool. Six sites described some use of the grant by institutions to recruit candidates into teaching and high-need fields and schools. A dean of the college of education at one institution summarized as follows:
I think especially for those people who are interested in teaching in one of those [high-need] fields, I think it at least gets their attention... I think for those who might be wavering too, maybe they want to be a teacher but they’re not sure exactly which field to go into, whether it’s elementary education or special education. I think knowing that the TEACH [Grant] is there, I think that might help them in making that decision.
Institutions primarily used in-person communication to promote awareness of the TEACH Grants.
Based on the IHE Survey, person-to-person contact was the primary mode of communication to promote awareness of the grants (79 percent), followed by use of a website (61 percent) or email (48 percent). Institutions less frequently reported using events (28 percent) or flyers (25 percent) to communicate with students about the grants (see Exhibit 18).
58%
13%7%
14%9%
‡
10%
0%
20%
40%
60%
80%
100%
Financial aidoffice
representative
Instructor orprofessor
Counselor Another student College oruniversitywebsite
College oruniversity flyer
Other

Study of the Teacher Education Assistance for College and Higher Education (TEACH) Grant Program
30
Exhibit 18. Percentage of institutions of higher education that used various modes of communication to inform students about the TEACH Grant
Exhibit reads: Seventy-nine percent of the IHE Survey respondents reported at least one office or department informed students about the TEACH Grant through person-to-person contact. Note: The response categories “career services” and “other” were collapsed to prevent disclosure of confidentiality. Source: Institution of Higher Education Survey, 2016 (n=345; see Exhibit A1.2a in Appendix A).
Counseling
In addition to counseling from the U.S. Department of Education that TEACH Grant recipients must complete each year before receiving their grant funds, institutions also provide counseling services to students about the grant and its requirements. However, these counseling services can vary by the office responsible for providing the counseling, whether the counseling is stand alone or integrated20 into larger discussions about financial aid, whether the counseling is mandatory or optional, and whether the counseling is available in person or online.
The financial aid office was the primary provider of counseling specific to the TEACH Grant program.
The IHE Survey results showed that, for all counseling types, the most common provider of counseling was the financial aid office. For example, 65 percent of the IHE Survey respondents reported their financial aid office provided integrated optional in-person counseling compared with the college of education (21 percent), career services/other (6 percent), or another field-specific school or department (3 percent; see Exhibit 19). Similarly, Exhibit 20 shows that 56 percent of the IHE Survey respondents reported that their financial aid office provided stand-alone optional in-person counseling compared with the college of education (18 percent), career services/other (6 percent), or another field-specific school or department (3 percent).
79%
61%
48%
28%
25%
0% 20% 40% 60% 80% 100%
Person-to-person contact
Website
Events
Flyers
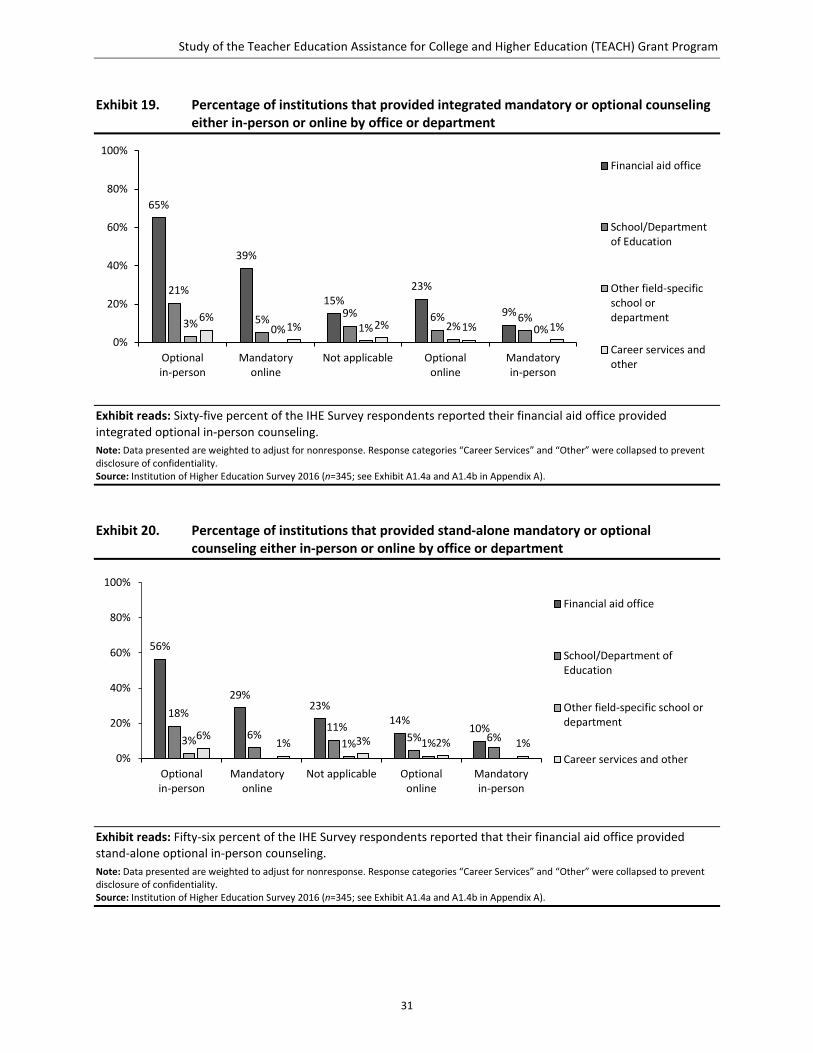
Study of the Teacher Education Assistance for College and Higher Education (TEACH) Grant Program
31
Exhibit 19. Percentage of institutions that provided integrated mandatory or optional counseling either in-person or online by office or department
Exhibit reads: Sixty-five percent of the IHE Survey respondents reported their financial aid office provided integrated optional in-person counseling. Note: Data presented are weighted to adjust for nonresponse. Response categories “Career Services” and “Other” were collapsed to prevent disclosure of confidentiality. Source: Institution of Higher Education Survey 2016 (n=345; see Exhibit A1.4a and A1.4b in Appendix A).
Exhibit 20. Percentage of institutions that provided stand-alone mandatory or optional counseling either in-person or online by office or department
Exhibit reads: Fifty-six percent of the IHE Survey respondents reported that their financial aid office provided stand-alone optional in-person counseling. Note: Data presented are weighted to adjust for nonresponse. Response categories “Career Services” and “Other” were collapsed to prevent disclosure of confidentiality. Source: Institution of Higher Education Survey 2016 (n=345; see Exhibit A1.4a and A1.4b in Appendix A).
65%
39%
15%23%
9%
21%
5% 9% 6% 6%3% 0% 1% 2% 0%6%
1% 2% 1% 1%0%
20%
40%
60%
80%
100%
Optionalin-person
Mandatoryonline
Not applicable Optionalonline
Mandatoryin-person
Financial aid office
School/Departmentof Education
Other field-specificschool ordepartment
Career services andother
56%
29%23%
14%10%
18%
6%11%
5% 6%3% 1% 1%6%
1% 3% 2% 1%0%
20%
40%
60%
80%
100%
Optionalin-person
Mandatoryonline
Not applicable Optionalonline
Mandatoryin-person
Financial aid office
School/Department ofEducation
Other field-specific school ordepartment
Career services and other
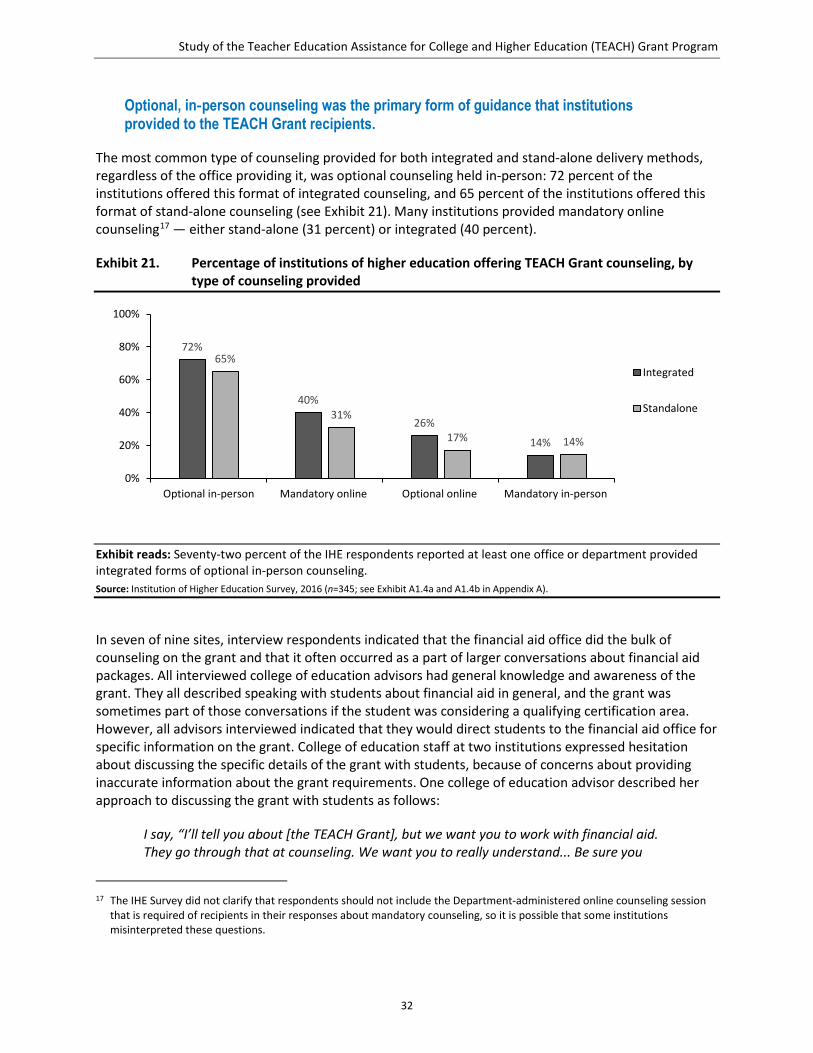
Study of the Teacher Education Assistance for College and Higher Education (TEACH) Grant Program
32
Optional, in‐person counseling was the primary form of guidance that institutions provided to the TEACH Grant recipients.
The most common type of counseling provided for both integrated and stand-alone delivery methods, regardless of the office providing it, was optional counseling held in-person: 72 percent of the institutions offered this format of integrated counseling, and 65 percent of the institutions offered this format of stand-alone counseling (see Exhibit 21). Many institutions provided mandatory online counseling17 — either stand-alone (31 percent) or integrated (40 percent).
Exhibit 21. Percentage of institutions of higher education offering TEACH Grant counseling, by type of counseling provided
Exhibit reads: Seventy-two percent of the IHE respondents reported at least one office or department provided integrated forms of optional in-person counseling. Source: Institution of Higher Education Survey, 2016 (n=345; see Exhibit A1.4a and A1.4b in Appendix A).
In seven of nine sites, interview respondents indicated that the financial aid office did the bulk of counseling on the grant and that it often occurred as a part of larger conversations about financial aid packages. All interviewed college of education advisors had general knowledge and awareness of the grant. They all described speaking with students about financial aid in general, and the grant was sometimes part of those conversations if the student was considering a qualifying certification area. However, all advisors interviewed indicated that they would direct students to the financial aid office for specific information on the grant. College of education staff at two institutions expressed hesitation about discussing the specific details of the grant with students, because of concerns about providing inaccurate information about the grant requirements. One college of education advisor described her approach to discussing the grant with students as follows:
I say, “I’ll tell you about [the TEACH Grant], but we want you to work with financial aid. They go through that at counseling. We want you to really understand... Be sure you
17 The IHE Survey did not clarify that respondents should not include the Department-administered online counseling session
that is required of recipients in their responses about mandatory counseling, so it is possible that some institutions misinterpreted these questions.
72%
40%
26%
14%
65%
31%
17% 14%
0%
20%
40%
60%
80%
100%
Optional in-person Mandatory online Optional online Mandatory in-person
Integrated
Standalone
Study of the Teacher Education Assistance for College and Higher Education (TEACH) Grant Program
33
know what you’re doing because if you’re not going to go into a high-need area, high-need field, if you realize that teaching’s not for you, you’ve got to pay this back with interest.” I say things like that because I’ve heard horror stories. I don’t want to just say nothing, but I don’t want to be the one who tells them to get it or not. That has to come from [the financial aid office].
During interviews, financial aid staff described providing counseling services at their institutions throughout the various stages of students’ postsecondary careers. As required by the grant, institutions reported providing students with initial counseling on the grant online or in person. After initial counseling, interactions with students about the grant typically included reminders about completing the annual agreement to serve. These interactions also often reinforced the eligibility and service requirements of the grant. Interviewed staff at five of nine institutions also described conducting exit counseling with grant recipients, but they noted that it often was difficult to successfully schedule students at that late point in their postsecondary careers. A college of education advisor at one institution mentioned that he or she did not know which students had TEACH Grants, and data on this would be useful to help track and monitor students’ eligibility and meeting grant requirements.
Prevalence of Institutional Practices Associated with Lower Grant-to-Loan Conversion Rates
A wide range of institutional practices were identified in the IHE Survey and interviews that restricted eligibility for the TEACH Grant recipients or provided placement services. Some of these practices included setting eligibility requirements, such as declaring a major or minor in a high-need field, being admitted to a teacher preparation program, and excluding freshmen and sophomores. Other practices included placement services for employment.
To analyze whether any of these eligibility restriction or placement services were related to lower grant-to-loan conversion rates, the conversion rate of all recipients who had begun their grant service obligation period prior to July 1, 2014, was calculated for each institution. Then the average conversion rate of institutions that reported a specific practice was compared with the average conversion rate of those that did not report that practice.
As shown in Exhibit 22, the following practices showed the largest percentage point differences in average conversion rates between institutions that reported employing the practice and those that did not:
• Freshmen and sophomores were not eligible to receive TEACH Grants.
• Only students who declared a major or minor in high-need fields were eligible to receive the TEACH Grants.
• Only students who were admitted into a teacher preparation program were eligible to receive the TEACH Grants.
• Relationships were established with schools that had qualifying service teaching positions.
In contrast, the following institutional practices did not appear to correlate with the institutional conversion rate:
• Only students who declared a major or minor in teaching were eligible to receive TEACH Grants.
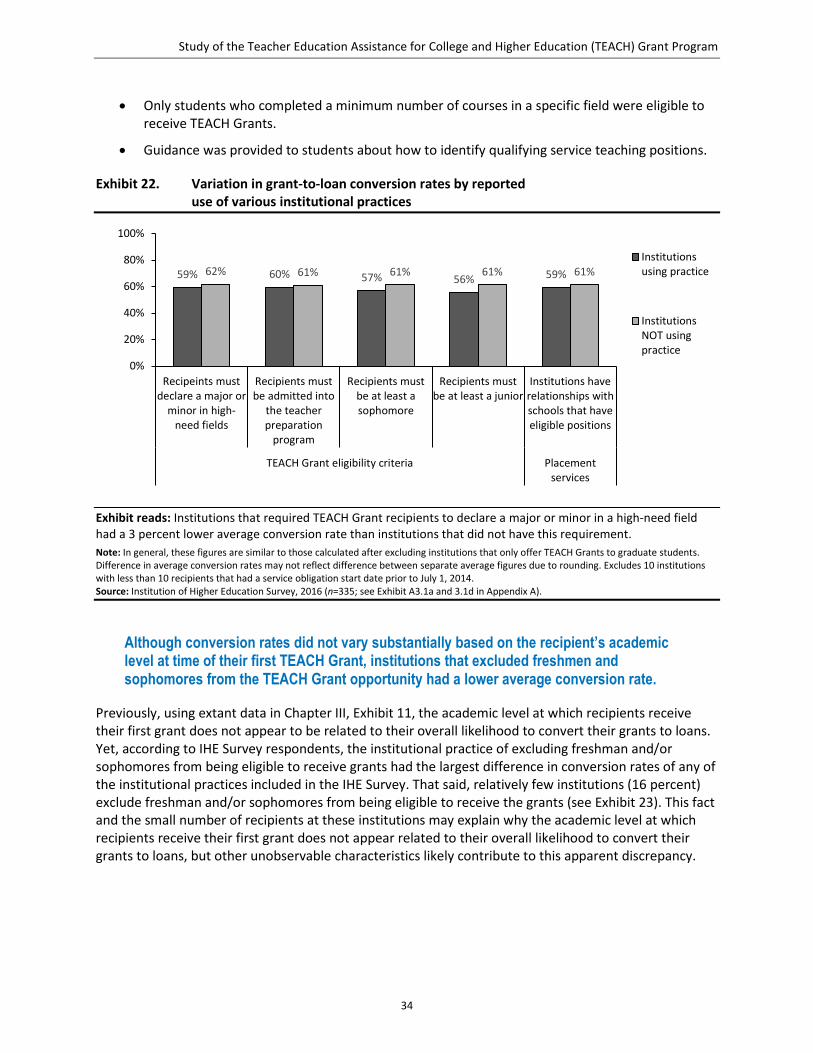
Study of the Teacher Education Assistance for College and Higher Education (TEACH) Grant Program
34
• Only students who completed a minimum number of courses in a specific field were eligible to receive TEACH Grants.
• Guidance was provided to students about how to identify qualifying service teaching positions.
Exhibit 22. Variation in grant-to-loan conversion rates by reported use of various institutional practices
Exhibit reads: Institutions that required TEACH Grant recipients to declare a major or minor in a high-need field had a 3 percent lower average conversion rate than institutions that did not have this requirement. Note: In general, these figures are similar to those calculated after excluding institutions that only offer TEACH Grants to graduate students. Difference in average conversion rates may not reflect difference between separate average figures due to rounding. Excludes 10 institutions with less than 10 recipients that had a service obligation start date prior to July 1, 2014. Source: Institution of Higher Education Survey, 2016 (n=335; see Exhibit A3.1a and 3.1d in Appendix A).
Although conversion rates did not vary substantially based on the recipient’s academic level at time of their first TEACH Grant, institutions that excluded freshmen and sophomores from the TEACH Grant opportunity had a lower average conversion rate.
Previously, using extant data in Chapter III, Exhibit 11, the academic level at which recipients receive their first grant does not appear to be related to their overall likelihood to convert their grants to loans. Yet, according to IHE Survey respondents, the institutional practice of excluding freshman and/or sophomores from being eligible to receive grants had the largest difference in conversion rates of any of the institutional practices included in the IHE Survey. That said, relatively few institutions (16 percent) exclude freshman and/or sophomores from being eligible to receive the grants (see Exhibit 23). This fact and the small number of recipients at these institutions may explain why the academic level at which recipients receive their first grant does not appear related to their overall likelihood to convert their grants to loans, but other unobservable characteristics likely contribute to this apparent discrepancy.
59% 60% 57% 56% 59%62% 61% 61% 61% 61%
0%
20%
40%
60%
80%
100%
Recipeints mustdeclare a major or
minor in high-need fields
Recipients mustbe admitted into
the teacherpreparation
program
Recipients mustbe at least asophomore
Recipients mustbe at least a junior
Institutions haverelationships withschools that haveeligible positions
TEACH Grant eligibility criteria Placementservices
Institutionsusing practice
InstitutionsNOT usingpractice
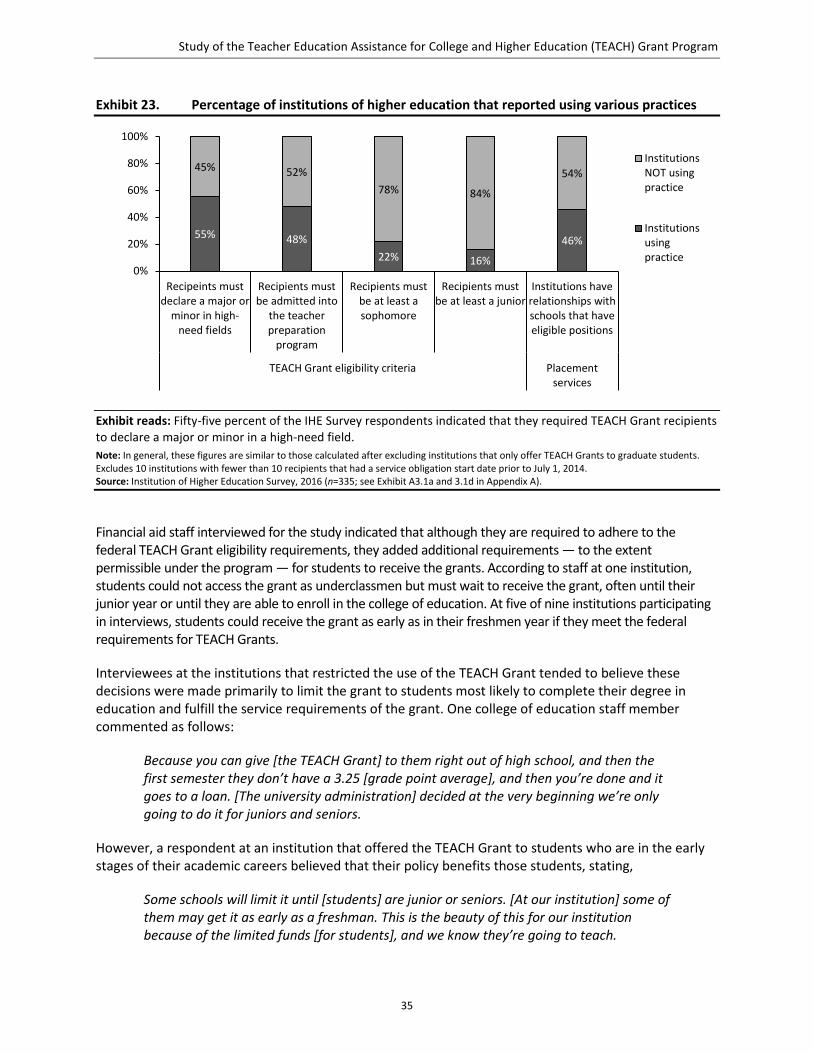
Study of the Teacher Education Assistance for College and Higher Education (TEACH) Grant Program
35
Exhibit 23. Percentage of institutions of higher education that reported using various practices
Exhibit reads: Fifty-five percent of the IHE Survey respondents indicated that they required TEACH Grant recipients to declare a major or minor in a high-need field. Note: In general, these figures are similar to those calculated after excluding institutions that only offer TEACH Grants to graduate students. Excludes 10 institutions with fewer than 10 recipients that had a service obligation start date prior to July 1, 2014. Source: Institution of Higher Education Survey, 2016 (n=335; see Exhibit A3.1a and 3.1d in Appendix A).
Financial aid staff interviewed for the study indicated that although they are required to adhere to the federal TEACH Grant eligibility requirements, they added additional requirements — to the extent permissible under the program — for students to receive the grants. According to staff at one institution, students could not access the grant as underclassmen but must wait to receive the grant, often until their junior year or until they are able to enroll in the college of education. At five of nine institutions participating in interviews, students could receive the grant as early as in their freshmen year if they meet the federal requirements for TEACH Grants.
Interviewees at the institutions that restricted the use of the TEACH Grant tended to believe these decisions were made primarily to limit the grant to students most likely to complete their degree in education and fulfill the service requirements of the grant. One college of education staff member commented as follows:
Because you can give [the TEACH Grant] to them right out of high school, and then the first semester they don’t have a 3.25 [grade point average], and then you’re done and it goes to a loan. [The university administration] decided at the very beginning we’re only going to do it for juniors and seniors.
However, a respondent at an institution that offered the TEACH Grant to students who are in the early stages of their academic careers believed that their policy benefits those students, stating,
Some schools will limit it until [students] are junior or seniors. [At our institution] some of them may get it as early as a freshman. This is the beauty of this for our institution because of the limited funds [for students], and we know they’re going to teach.
55% 48%22% 16%
46%
45% 52%78% 84%
54%
0%
20%
40%
60%
80%
100%
Recipeints mustdeclare a major or
minor in high-need fields
Recipients mustbe admitted into
the teacherpreparation
program
Recipients mustbe at least asophomore
Recipients mustbe at least a junior
Institutions haverelationships withschools that haveeligible positions
TEACH Grant eligibility criteria Placementservices
InstitutionsNOT usingpractice
Institutionsusingpractice
Study of the Teacher Education Assistance for College and Higher Education (TEACH) Grant Program
36
How Grants Relate to Federal Annual Loan Limits
Federal annual loan limits exist to protect students from excessive borrowing. To estimate loan limits for each grant recipient in award year 2013–14 based on NSLDS data, the amount of the grant funds and the amount of the Stafford loan funds awarded for that academic year were summed and compared with the annual federal loan maximum set for the recipient’s academic level (highest reported) and dependency status.18
For TEACH Grants that are eventually converted to loans, in many cases these grants would have caused recipients’ financial aid packages to exceed federal annual loan limits if they had been provided as loans from the outset.
In 2013–14, 42 percent of the grant recipients would be borrowing over their federal annual loan limit if their grants were considered loans.
Field and Job Placement Services
In an examination of common TEACH Grant administrative practices, 70 percent of the institutions provided students with placement services for qualifying TEACH Grant service positions. However, conversion rates were similar for institutions that did and did not report this practice.
Across the various types of job placement services, the college of education at the institution was most often responsible for providing the placement services. Regardless of the department or office provider, more than half of institutions provided guidance to students on how to identify TEACH Grant-qualifying positions (58 percent; see Exhibit 24). Forty-eight percent of the institutions indicated that they provided an updated list of available positions to students, and 46 percent indicated that they established relationships with schools that have eligible positions.19 However, none of the interviewed staff from any of the nine case study institutions described career and job placement services or practices that were specific to the grant recipients or indicated that they were aware of whether students were grant recipients, unless the student explicitly stated it.
Forty-six percent of the institutions had relationships with K–12 schools with qualifying positions. However, conversion rates were similar for institutions that did and did not report this practice.
The responsibility for job placement services within institutions was most commonly assumed by college of education staff (33 percent) or career services staff (16 percent; see Exhibit 24). The conversion rates were similar for institutions using this practice (59 percent) and institutions not using this practice (61 percent). Financial aid offices more frequently participated in providing guidance on how to identify qualifying positions compared with the other two types of services. 18 The sum of grant and loan funds does not account for (1) undergraduate students whose annual loan limits are increased as
a result of parents’ denial of PLUS loans and (2) loan periods that are borrower based, which skew the assignment of award years to loans, which then may overestimate or underestimate the amount of loans in an award year for borrower-based students.
19 The question in the IHE Survey referred to students generally because such respondents may have interpreted this as placement services provided to any student, not just TEACH Grant recipients.
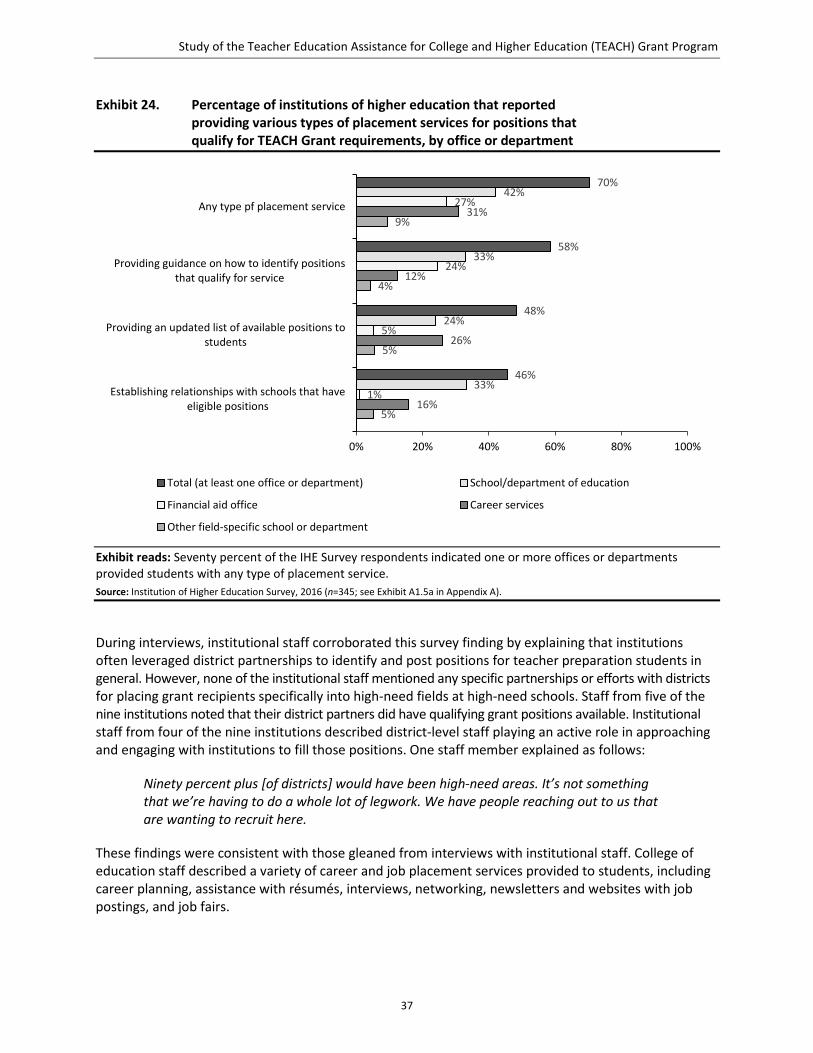
Study of the Teacher Education Assistance for College and Higher Education (TEACH) Grant Program
37
Exhibit 24. Percentage of institutions of higher education that reported providing various types of placement services for positions that qualify for TEACH Grant requirements, by office or department
Exhibit reads: Seventy percent of the IHE Survey respondents indicated one or more offices or departments provided students with any type of placement service. Source: Institution of Higher Education Survey, 2016 (n=345; see Exhibit A1.5a in Appendix A).
During interviews, institutional staff corroborated this survey finding by explaining that institutions often leveraged district partnerships to identify and post positions for teacher preparation students in general. However, none of the institutional staff mentioned any specific partnerships or efforts with districts for placing grant recipients specifically into high-need fields at high-need schools. Staff from five of the nine institutions noted that their district partners did have qualifying grant positions available. Institutional staff from four of the nine institutions described district-level staff playing an active role in approaching and engaging with institutions to fill those positions. One staff member explained as follows:
Ninety percent plus [of districts] would have been high-need areas. It’s not something that we’re having to do a whole lot of legwork. We have people reaching out to us that are wanting to recruit here.
These findings were consistent with those gleaned from interviews with institutional staff. College of education staff described a variety of career and job placement services provided to students, including career planning, assistance with résumés, interviews, networking, newsletters and websites with job postings, and job fairs.
70%
58%
48%
46%
42%
33%
24%
33%
27%
24%
5%
1%
31%
12%
26%
16%
9%
4%
5%
5%
0% 20% 40% 60% 80% 100%
Any type pf placement service
Providing guidance on how to identify positionsthat qualify for service
Providing an updated list of available positions tostudents
Establishing relationships with schools that haveeligible positions
Total (at least one office or department) School/department of education
Financial aid office Career services
Other field-specific school or department
Study of the Teacher Education Assistance for College and Higher Education (TEACH) Grant Program
38
Staff interviewed at four institutions stated that the grant recipients interested in finding employment in a high-need school could locate qualifying schools in their respective regions. According to one staff member who was asked whether TEACH Grant-qualifying opportunities were available for students, “There are so many schools within [our state] that fall within the requirements of the TEACH Grant.” The same staff member also mentioned that labor market factors have affected job placement for grant recipients; notably, this person believed that students faced much more difficult prospects in finding qualifying teaching work during the recession years, but this difficulty had largely passed as the economy recovered.
In addition to job placement support, interviewed staff at all the institutions described extensive, diverse field experience opportunities that the college of education offered and required of teacher candidates. Staff at two institutions specifically mentioned a requirement that education students complete field experience in a high-need school setting.
Chapter Summary
Financial aid offices at institutions primarily administered the TEACH Grant and were involved in most administrative processes. Consistent with this finding, more than half the recipient respondents indicated that they first learned about the grant from a financial aid office representative. Almost all the institutions reported using the grants to make higher education more affordable for students, whereas only about half reported using the grants to encourage students to pursue teaching in a high-need field at a high-need school. The financial aid office also was the primary provider of counseling specific to the TEACH Grant program.
However, one specific area where the primary responsibility shifted away from the financial aid office was job placement services. Across the various types of job placement services, the school or department of education was the most common provider.
Study of the Teacher Education Assistance for College and Higher Education (TEACH) Grant Program
39
Summary of Findings
This study sought to examine why many TEACH Grant recipients did not meet the grant requirements and, as a result, had their grants converted to loans. As part of this examination, this study collected information to better understand institutional practices in implementing the grant program, including how institutions promote awareness of the program and how they support grant recipients as students complete their teacher education programs and obtain employment. The study also aimed to identify factors associated with grant recipients not meeting the grant requirements.
Grant Requirements
Forty-four percent of the recipients who were surveyed indicated that the grant was somewhat or very influential on their decision to pursue teaching as a career and 58 percent indicated that the grant was somewhat or very influential on their decision to teach in a high-need field in a high-need school.
In hindsight, 58 percent of all recipient respondents indicated that they believed they were very likely to fulfill the service requirements when they first received their grant. Ultimately, however, 63 percent of the recipients had their grants convert to an unsubsidized loan.
Factors Associated with Not Meeting Grant Requirements
Factors associated with recipients not meeting the grant requirements included factors related to employment, understanding grant requirements, and factors related to annual certification.
Compared with those in grant status, a lower percentage of recipients in loan status indicated being well informed about the service requirements while obtaining their first TEACH Grant and the requirement to annually certify their intent to teach in a high-need field at a high-need school after graduation.
Some grant recipient characteristics were associated with higher grant-to-loan conversion rates. Males, federal loan borrowers, or Pell Grant recipients had higher grant-to-loan conversion rates.
How Institutions Administer TEACH Grants
Almost all the institutions reported using the grants to make higher education more affordable. About half the institutions reported using the grants to incentivize teaching candidates to pursue teaching positions in high-need fields and schools.
In almost all institutions, the TEACH Grant program is administered by financial aid office staff, not college of education staff.
However, one specific area where the primary responsibility shifted away from the financial aid office was job placement services. Across the various types of job placement services, the college or department of education was the most common provider. The majority of institutions provide placement services for teaching positions.
If their grants were considered as loans from the onset, 42 percent of the recipients could be borrowing over the federal loan limits.

Study of the Teacher Education Assistance for College and Higher Education (TEACH) Grant Program
41
References
American Association for Public Opinion Research. 2015. Standard Definitions: Final Dispositions of Case Codes and Outcome Rates for Surveys. 8th edition. Oakbrook Terrace, IL: AAPOR. Accessed February 15, 2017. https://www.aapor.org/AAPOR_Main/media/publications/Standard-Definitions2015_8theditionwithchanges_April2015_logo.pdf
Government Accountability Office. 2015. Better Management of Federal Grant and Loan Forgiveness Programs for Teachers Needed to Improve Participant Outcomes (GAO 15-314). Washington, DC: United States Government Accountability Office.
Kolenikov, Stanislav. 2014. “Calibrating Survey Data Using Iterative Proportional Fitting (Raking).” The Stata Journal 14 (1): 22–59.
Podolsky, Anne, and Tara Kini. 2016. How Effective Are Loan Forgiveness in Service Scholarships for Recruiting Teachers. Washington, DC: Learning Policy Institute. Accessed September 25, 2017. https://learningpolicyinstitute.org/sites/default/files/product-files/How_Effective_Are-Loan_Forgiveness_and_Service-Scholarships_Recruiting_Teachers.pdf
Therneau, Terry, Beth Atkinson, and Brian Ripley. 2015. rpart: Recursive Partitioning and Regression Trees. R package version 4.1-10.
U.S. Department of Education. 2016a. TEACH Grants. Federal Student Aid. Accessed February 20, 2017. https://studentaid.ed.gov/sa/types/grants-scholarships/teach
U.S. Department of Education. 2016b. Teacher Shortage Areas Nationwide Listing 1990–1991 through 2016–2017. Office of Postsecondary Education. Accessed May 31, 2017. http://www2.ed.gov/about/offices/list/ope/pol/tsa.doc

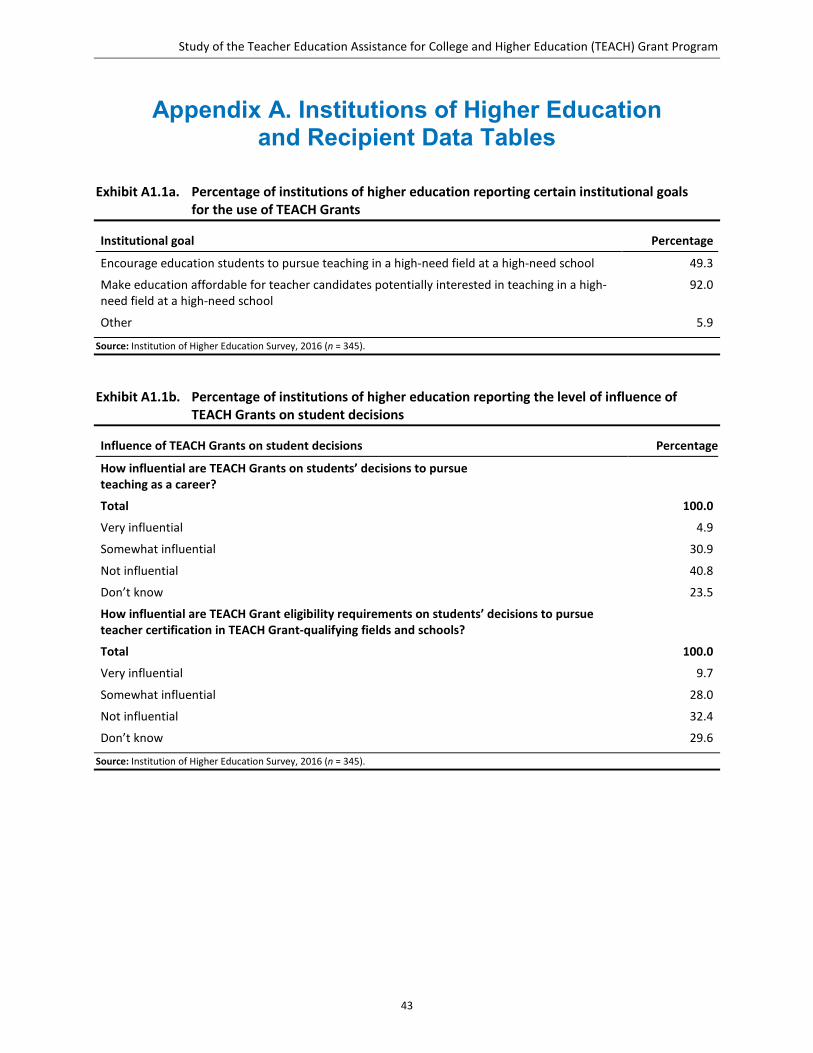
Study of the Teacher Education Assistance for College and Higher Education (TEACH) Grant Program
43
Appendix A. Institutions of Higher Education and Recipient Data Tables
Exhibit A1.1a. Percentage of institutions of higher education reporting certain institutional goals for the use of TEACH Grants
Institutional goal Percentage
Encourage education students to pursue teaching in a high-need field at a high-need school 49.3
Make education affordable for teacher candidates potentially interested in teaching in a high-need field at a high-need school
92.0
Other 5.9
Source: Institution of Higher Education Survey, 2016 (n = 345).
Exhibit A1.1b. Percentage of institutions of higher education reporting the level of influence of TEACH Grants on student decisions
Influence of TEACH Grants on student decisions Percentage
How influential are TEACH Grants on students’ decisions to pursue teaching as a career?
Total 100.0
Very influential 4.9
Somewhat influential 30.9
Not influential 40.8
Don’t know 23.5
How influential are TEACH Grant eligibility requirements on students’ decisions to pursue teacher certification in TEACH Grant-qualifying fields and schools?
Total 100.0
Very influential 9.7
Somewhat influential 28.0
Not influential 32.4
Don’t know 29.6
Source: Institution of Higher Education Survey, 2016 (n = 345).
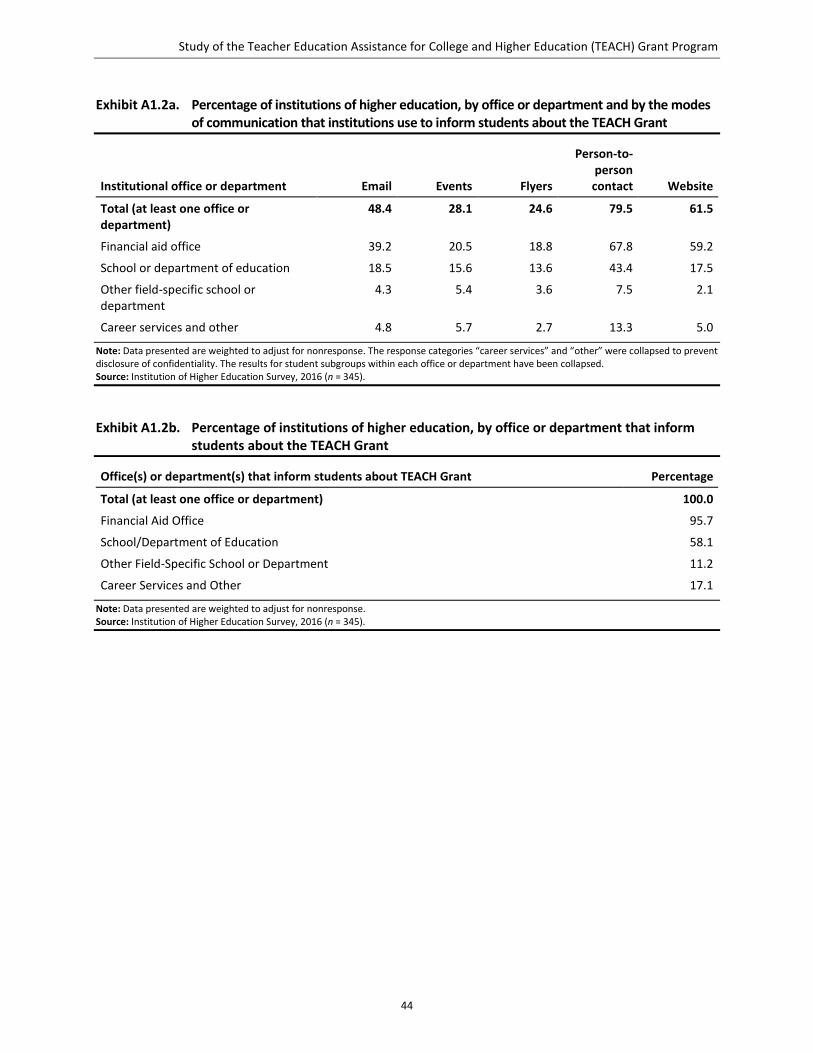
Study of the Teacher Education Assistance for College and Higher Education (TEACH) Grant Program
44
Exhibit A1.2a. Percentage of institutions of higher education, by office or department and by the modes of communication that institutions use to inform students about the TEACH Grant
Institutional office or department Email Events Flyers
Person-to-person contact Website
Total (at least one office or department)
48.4 28.1 24.6 79.5 61.5
Financial aid office 39.2 20.5 18.8 67.8 59.2
School or department of education 18.5 15.6 13.6 43.4 17.5
Other field-specific school or department
4.3 5.4 3.6 7.5 2.1
Career services and other 4.8 5.7 2.7 13.3 5.0
Note: Data presented are weighted to adjust for nonresponse. The response categories “career services” and “other” were collapsed to prevent disclosure of confidentiality. The results for student subgroups within each office or department have been collapsed. Source: Institution of Higher Education Survey, 2016 (n = 345).
Exhibit A1.2b. Percentage of institutions of higher education, by office or department that inform students about the TEACH Grant
Office(s) or department(s) that inform students about TEACH Grant Percentage
Total (at least one office or department) 100.0
Financial Aid Office 95.7
School/Department of Education 58.1
Other Field-Specific School or Department 11.2
Career Services and Other 17.1
Note: Data presented are weighted to adjust for nonresponse. Source: Institution of Higher Education Survey, 2016 (n = 345).
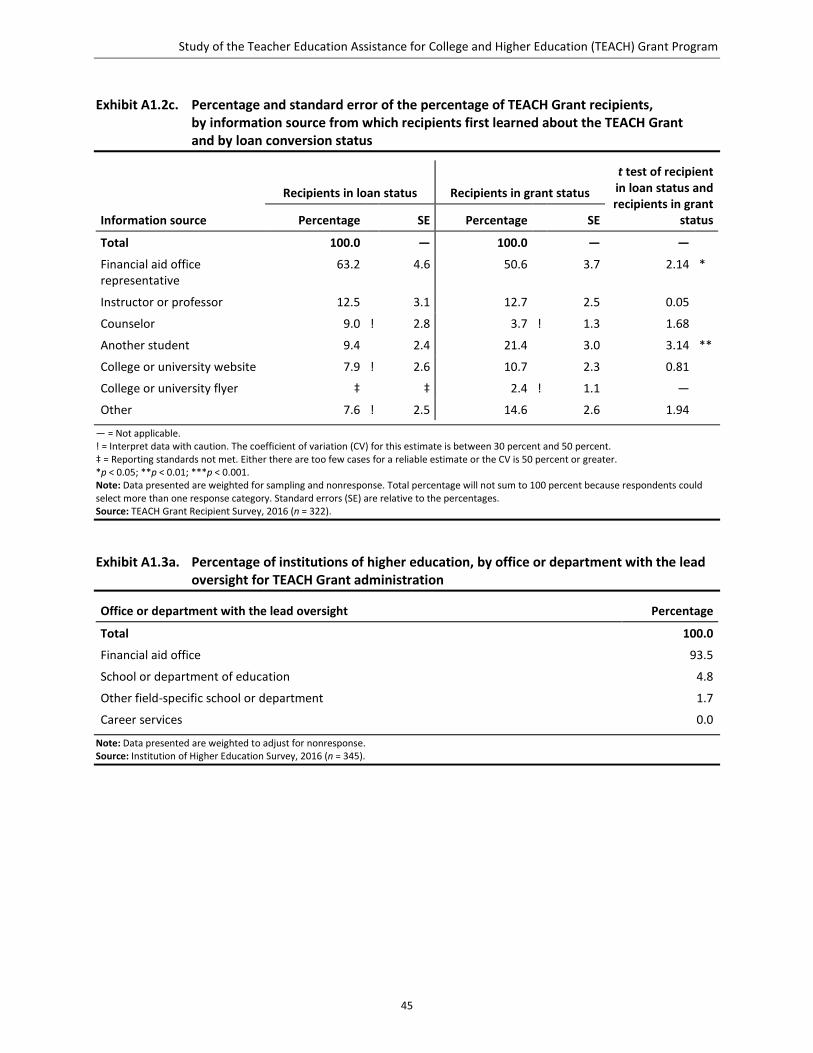
Study of the Teacher Education Assistance for College and Higher Education (TEACH) Grant Program
45
Exhibit A1.2c. Percentage and standard error of the percentage of TEACH Grant recipients, by information source from which recipients first learned about the TEACH Grant and by loan conversion status
Information source
Recipients in loan status Recipients in grant status
t test of recipient in loan status and recipients in grant
status Percentage SE Percentage SE
Total 100.0 — 100.0 — —
Financial aid office representative
63.2 4.6 50.6 3.7 2.14 *
Instructor or professor 12.5 3.1 12.7 2.5 0.05
Counselor 9.0 ! 2.8 3.7 ! 1.3 1.68
Another student 9.4 2.4 21.4 3.0 3.14 **
College or university website 7.9 ! 2.6 10.7 2.3 0.81
College or university flyer ‡ ‡ 2.4 ! 1.1 —
Other 7.6 ! 2.5 14.6 2.6 1.94
— = Not applicable. ! = Interpret data with caution. The coefficient of variation (CV) for this estimate is between 30 percent and 50 percent. ‡ = Reporting standards not met. Either there are too few cases for a reliable estimate or the CV is 50 percent or greater. *p < 0.05; **p < 0.01; ***p < 0.001. Note: Data presented are weighted for sampling and nonresponse. Total percentage will not sum to 100 percent because respondents could select more than one response category. Standard errors (SE) are relative to the percentages. Source: TEACH Grant Recipient Survey, 2016 (n = 322).
Exhibit A1.3a. Percentage of institutions of higher education, by office or department with the lead oversight for TEACH Grant administration
Office or department with the lead oversight Percentage
Total 100.0
Financial aid office 93.5
School or department of education 4.8
Other field-specific school or department 1.7
Career services 0.0
Note: Data presented are weighted to adjust for nonresponse. Source: Institution of Higher Education Survey, 2016 (n = 345).
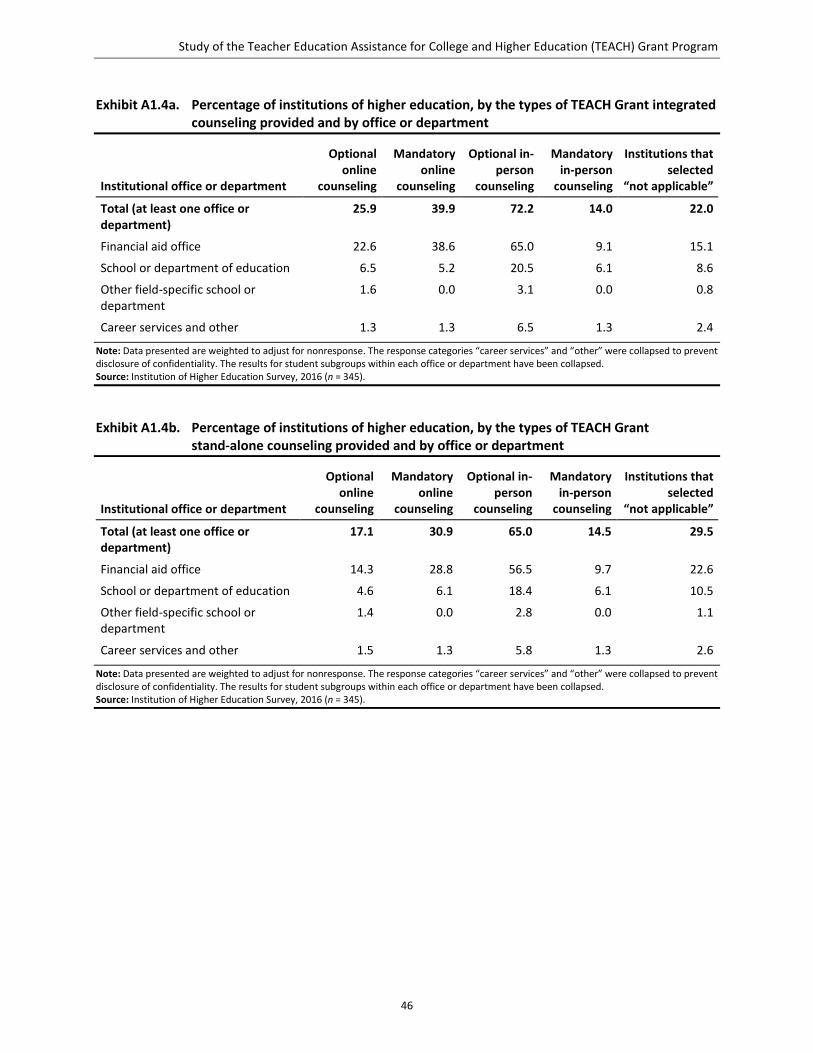
Study of the Teacher Education Assistance for College and Higher Education (TEACH) Grant Program
46
Exhibit A1.4a. Percentage of institutions of higher education, by the types of TEACH Grant integrated counseling provided and by office or department
Institutional office or department
Optional online
counseling
Mandatory online
counseling
Optional in-person
counseling
Mandatory in-person
counseling
Institutions that selected
“not applicable”
Total (at least one office or department)
25.9 39.9 72.2 14.0 22.0
Financial aid office 22.6 38.6 65.0 9.1 15.1
School or department of education 6.5 5.2 20.5 6.1 8.6
Other field-specific school or department
1.6 0.0 3.1 0.0 0.8
Career services and other 1.3 1.3 6.5 1.3 2.4
Note: Data presented are weighted to adjust for nonresponse. The response categories “career services” and “other” were collapsed to prevent disclosure of confidentiality. The results for student subgroups within each office or department have been collapsed. Source: Institution of Higher Education Survey, 2016 (n = 345).
Exhibit A1.4b. Percentage of institutions of higher education, by the types of TEACH Grant stand-alone counseling provided and by office or department
Institutional office or department
Optional online
counseling
Mandatory online
counseling
Optional in-person
counseling
Mandatory in-person
counseling
Institutions that selected
“not applicable”
Total (at least one office or department)
17.1 30.9 65.0 14.5 29.5
Financial aid office 14.3 28.8 56.5 9.7 22.6
School or department of education 4.6 6.1 18.4 6.1 10.5
Other field-specific school or department
1.4 0.0 2.8 0.0 1.1
Career services and other 1.5 1.3 5.8 1.3 2.6
Note: Data presented are weighted to adjust for nonresponse. The response categories “career services” and “other” were collapsed to prevent disclosure of confidentiality. The results for student subgroups within each office or department have been collapsed. Source: Institution of Higher Education Survey, 2016 (n = 345).
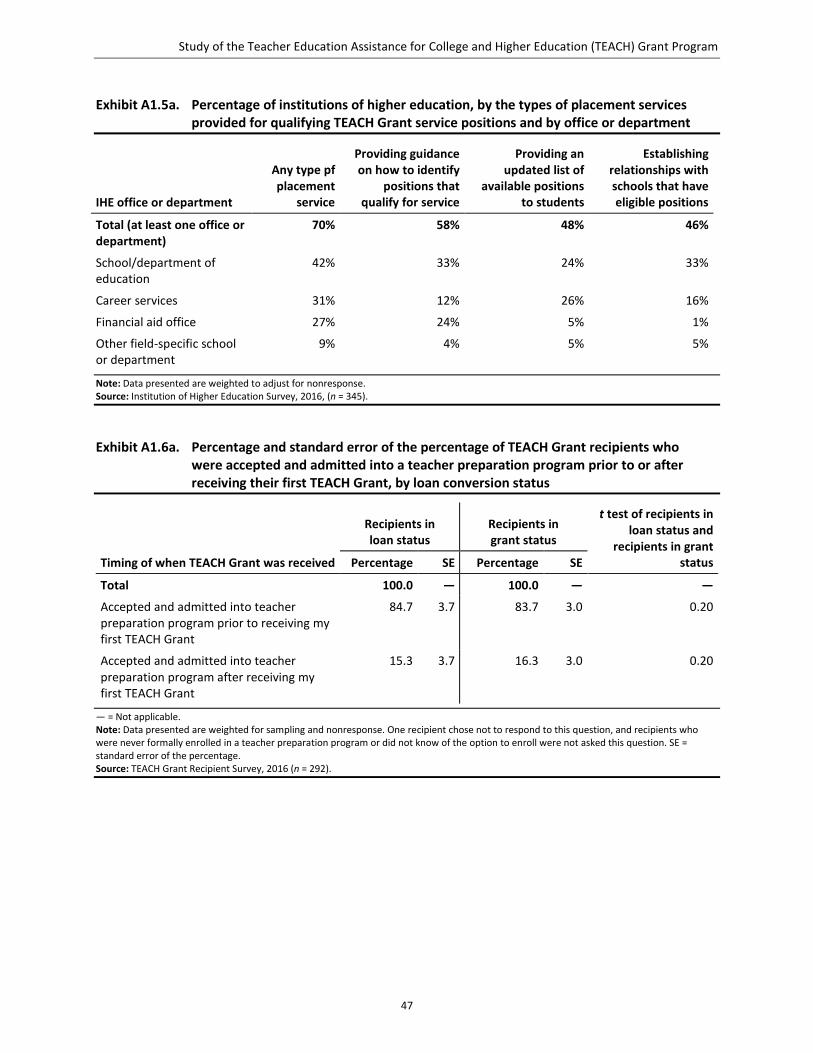
Study of the Teacher Education Assistance for College and Higher Education (TEACH) Grant Program
47
Exhibit A1.5a. Percentage of institutions of higher education, by the types of placement services provided for qualifying TEACH Grant service positions and by office or department
IHE office or department
Any type pf placement
service
Providing guidance on how to identify
positions that qualify for service
Providing an updated list of
available positions to students
Establishing relationships with schools that have eligible positions
Total (at least one office or department)
70% 58% 48% 46%
School/department of education
42% 33% 24% 33%
Career services 31% 12% 26% 16%
Financial aid office 27% 24% 5% 1%
Other field-specific school or department
9% 4% 5% 5%
Note: Data presented are weighted to adjust for nonresponse. Source: Institution of Higher Education Survey, 2016, (n = 345).
Exhibit A1.6a. Percentage and standard error of the percentage of TEACH Grant recipients who were accepted and admitted into a teacher preparation program prior to or after receiving their first TEACH Grant, by loan conversion status
Timing of when TEACH Grant was received
Recipients in loan status
Recipients in grant status
t test of recipients in loan status and
recipients in grant status Percentage SE Percentage SE
Total 100.0 — 100.0 — —
Accepted and admitted into teacher preparation program prior to receiving my first TEACH Grant
84.7 3.7 83.7 3.0 0.20
Accepted and admitted into teacher preparation program after receiving my first TEACH Grant
15.3 3.7 16.3 3.0 0.20
— = Not applicable. Note: Data presented are weighted for sampling and nonresponse. One recipient chose not to respond to this question, and recipients who were never formally enrolled in a teacher preparation program or did not know of the option to enroll were not asked this question. SE = standard error of the percentage. Source: TEACH Grant Recipient Survey, 2016 (n = 292).
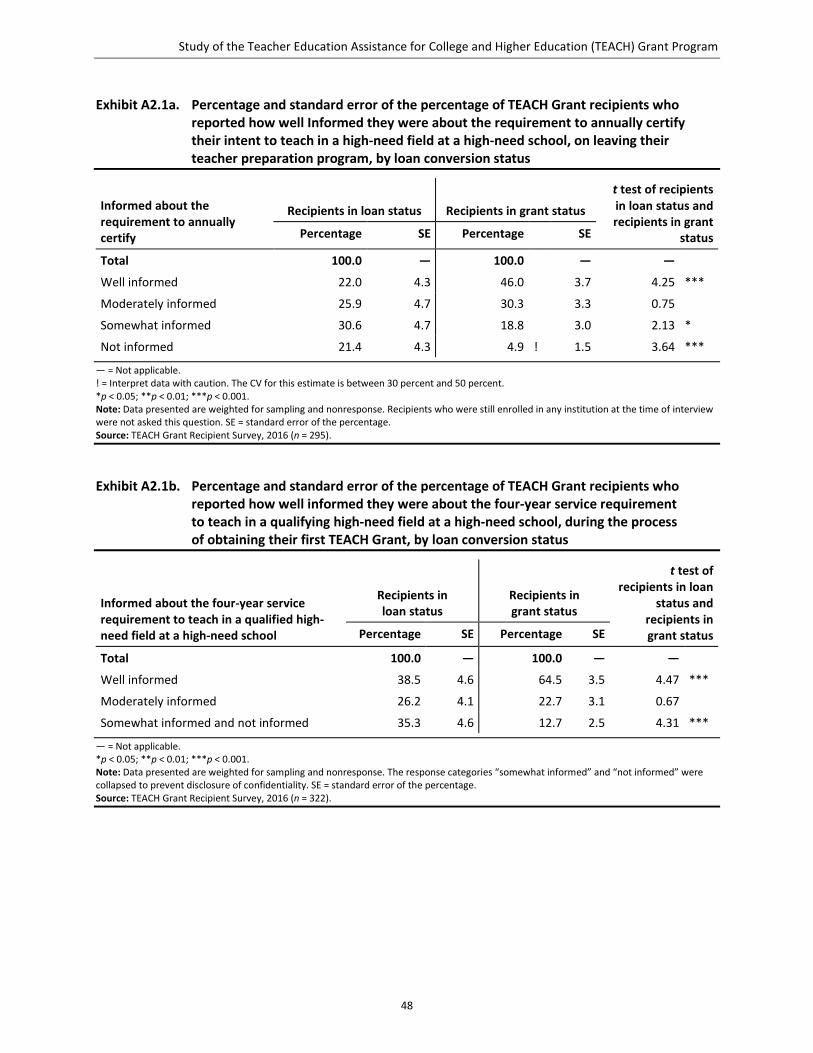
Study of the Teacher Education Assistance for College and Higher Education (TEACH) Grant Program
48
Exhibit A2.1a. Percentage and standard error of the percentage of TEACH Grant recipients who reported how well Informed they were about the requirement to annually certify their intent to teach in a high-need field at a high-need school, on leaving their teacher preparation program, by loan conversion status
Informed about the requirement to annually certify
Recipients in loan status Recipients in grant status
t test of recipients in loan status and recipients in grant
status Percentage SE Percentage SE
Total 100.0 — 100.0 — —
Well informed 22.0 4.3 46.0 3.7 4.25 ***
Moderately informed 25.9 4.7 30.3 3.3 0.75
Somewhat informed 30.6 4.7 18.8 3.0 2.13 *
Not informed 21.4 4.3 4.9 ! 1.5 3.64 ***
— = Not applicable. ! = Interpret data with caution. The CV for this estimate is between 30 percent and 50 percent. *p < 0.05; **p < 0.01; ***p < 0.001. Note: Data presented are weighted for sampling and nonresponse. Recipients who were still enrolled in any institution at the time of interview were not asked this question. SE = standard error of the percentage. Source: TEACH Grant Recipient Survey, 2016 (n = 295).
Exhibit A2.1b. Percentage and standard error of the percentage of TEACH Grant recipients who reported how well informed they were about the four-year service requirement to teach in a qualifying high-need field at a high-need school, during the process of obtaining their first TEACH Grant, by loan conversion status
Informed about the four-year service requirement to teach in a qualified high-need field at a high-need school
Recipients in loan status
Recipients in grant status
t test of recipients in loan
status and recipients in grant status Percentage SE Percentage SE
Total 100.0 — 100.0 — —
Well informed 38.5 4.6 64.5 3.5 4.47 ***
Moderately informed 26.2 4.1 22.7 3.1 0.67
Somewhat informed and not informed 35.3 4.6 12.7 2.5 4.31 ***
— = Not applicable. *p < 0.05; **p < 0.01; ***p < 0.001. Note: Data presented are weighted for sampling and nonresponse. The response categories “somewhat informed” and “not informed” were collapsed to prevent disclosure of confidentiality. SE = standard error of the percentage. Source: TEACH Grant Recipient Survey, 2016 (n = 322).
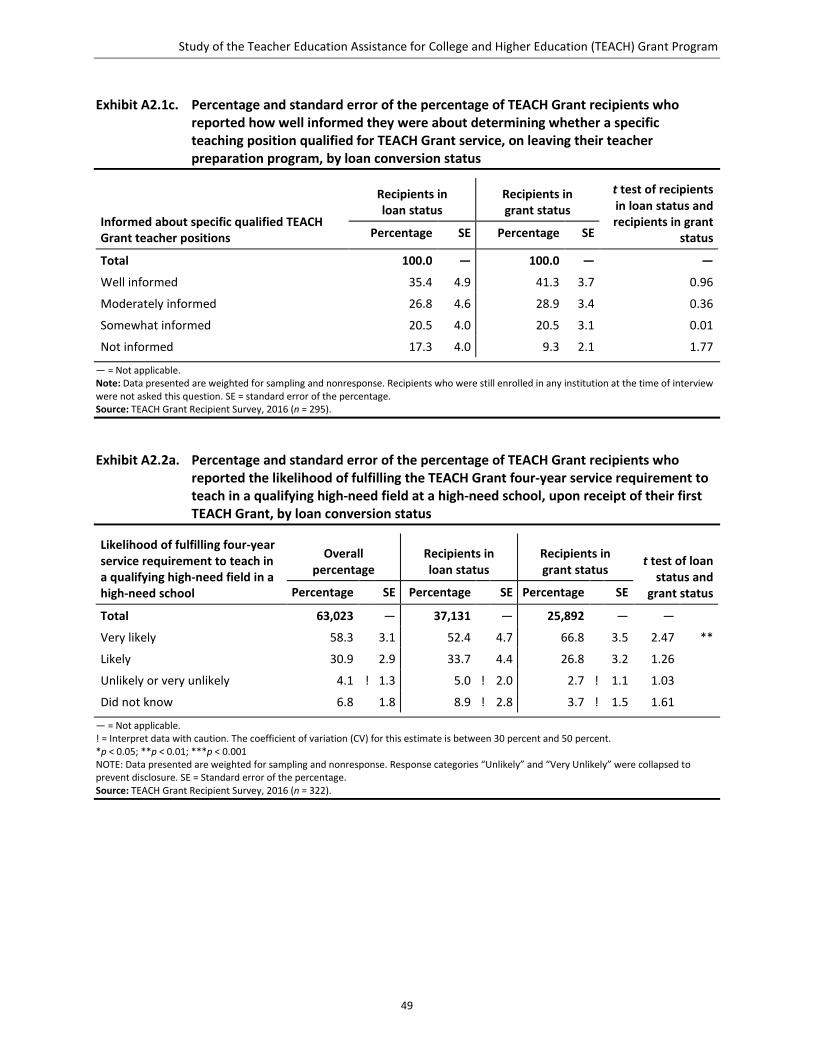
Study of the Teacher Education Assistance for College and Higher Education (TEACH) Grant Program
49
Exhibit A2.1c. Percentage and standard error of the percentage of TEACH Grant recipients who reported how well informed they were about determining whether a specific teaching position qualified for TEACH Grant service, on leaving their teacher preparation program, by loan conversion status
Informed about specific qualified TEACH Grant teacher positions
Recipients in loan status
Recipients in grant status
t test of recipients in loan status and recipients in grant
status Percentage SE Percentage SE
Total 100.0 — 100.0 — —
Well informed 35.4 4.9 41.3 3.7 0.96
Moderately informed 26.8 4.6 28.9 3.4 0.36
Somewhat informed 20.5 4.0 20.5 3.1 0.01
Not informed 17.3 4.0 9.3 2.1 1.77
— = Not applicable. Note: Data presented are weighted for sampling and nonresponse. Recipients who were still enrolled in any institution at the time of interview were not asked this question. SE = standard error of the percentage. Source: TEACH Grant Recipient Survey, 2016 (n = 295).
Exhibit A2.2a. Percentage and standard error of the percentage of TEACH Grant recipients who reported the likelihood of fulfilling the TEACH Grant four-year service requirement to teach in a qualifying high-need field at a high-need school, upon receipt of their first TEACH Grant, by loan conversion status
Likelihood of fulfilling four-year service requirement to teach in a qualifying high-need field in a high-need school
Overall percentage
Recipients in loan status
Recipients in grant status
t test of loan status and
grant status Percentage SE Percentage SE Percentage SE
Total 63,023 — 37,131 — 25,892 — —
Very likely 58.3 3.1 52.4 4.7 66.8 3.5 2.47 **
Likely 30.9 2.9 33.7 4.4 26.8 3.2 1.26
Unlikely or very unlikely 4.1 ! 1.3 5.0 ! 2.0 2.7 ! 1.1 1.03
Did not know 6.8 1.8 8.9 ! 2.8 3.7 ! 1.5 1.61
— = Not applicable. ! = Interpret data with caution. The coefficient of variation (CV) for this estimate is between 30 percent and 50 percent. *p < 0.05; **p < 0.01; ***p < 0.001 NOTE: Data presented are weighted for sampling and nonresponse. Response categories “Unlikely” and “Very Unlikely” were collapsed to prevent disclosure. SE = Standard error of the percentage. Source: TEACH Grant Recipient Survey, 2016 (n = 322).
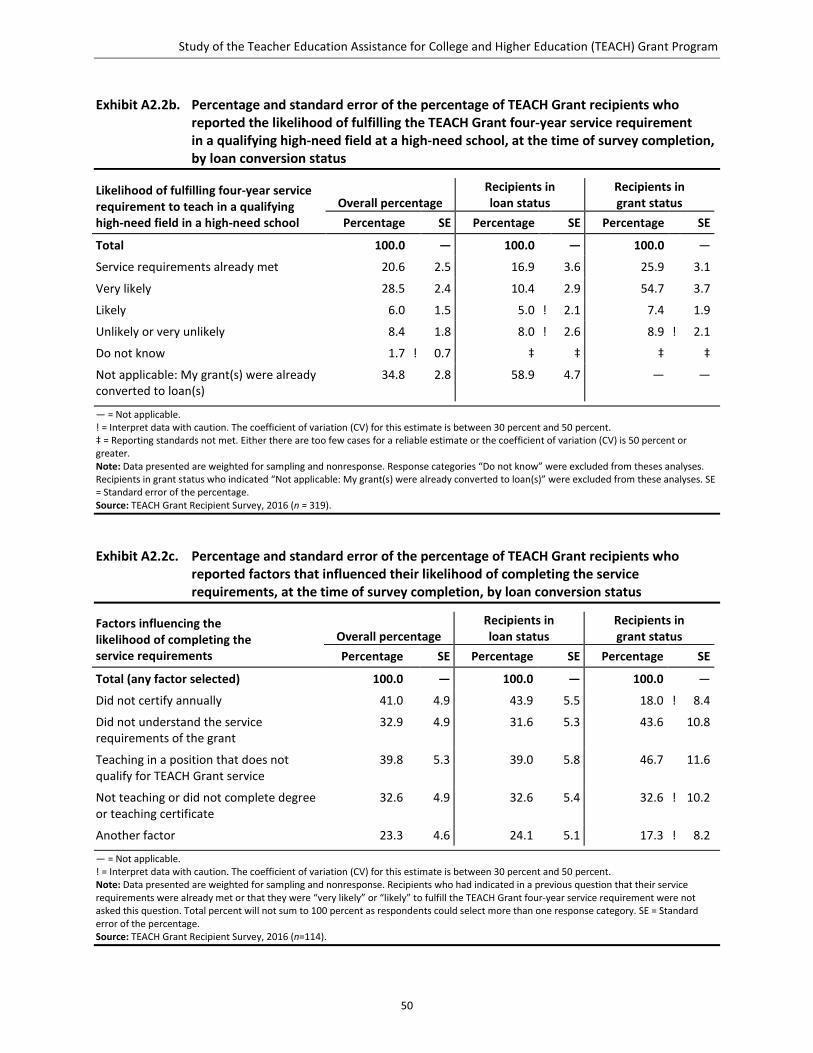
Study of the Teacher Education Assistance for College and Higher Education (TEACH) Grant Program
50
Exhibit A2.2b. Percentage and standard error of the percentage of TEACH Grant recipients who reported the likelihood of fulfilling the TEACH Grant four-year service requirement in a qualifying high-need field at a high-need school, at the time of survey completion, by loan conversion status
Likelihood of fulfilling four-year service requirement to teach in a qualifying high-need field in a high-need school
Overall percentage Recipients in loan status
Recipients in grant status
Percentage SE Percentage SE Percentage SE
Total 100.0 — 100.0 — 100.0 —
Service requirements already met 20.6 2.5 16.9 3.6 25.9 3.1
Very likely 28.5 2.4 10.4 2.9 54.7 3.7
Likely 6.0 1.5 5.0 ! 2.1 7.4 1.9
Unlikely or very unlikely 8.4 1.8 8.0 ! 2.6 8.9 ! 2.1
Do not know 1.7 ! 0.7 ‡ ‡ ‡ ‡
Not applicable: My grant(s) were already converted to loan(s)
34.8 2.8 58.9 4.7 — —
— = Not applicable. ! = Interpret data with caution. The coefficient of variation (CV) for this estimate is between 30 percent and 50 percent. ‡ = Reporting standards not met. Either there are too few cases for a reliable estimate or the coefficient of variation (CV) is 50 percent or greater. Note: Data presented are weighted for sampling and nonresponse. Response categories “Do not know” were excluded from theses analyses. Recipients in grant status who indicated “Not applicable: My grant(s) were already converted to loan(s)” were excluded from these analyses. SE = Standard error of the percentage. Source: TEACH Grant Recipient Survey, 2016 (n = 319).
Exhibit A2.2c. Percentage and standard error of the percentage of TEACH Grant recipients who reported factors that influenced their likelihood of completing the service requirements, at the time of survey completion, by loan conversion status
Factors influencing the likelihood of completing the service requirements
Overall percentage Recipients in loan status
Recipients in grant status
Percentage SE Percentage SE Percentage SE
Total (any factor selected) 100.0 — 100.0 — 100.0 —
Did not certify annually 41.0 4.9 43.9 5.5 18.0 ! 8.4
Did not understand the service requirements of the grant
32.9 4.9 31.6 5.3 43.6 10.8
Teaching in a position that does not qualify for TEACH Grant service
39.8 5.3 39.0 5.8 46.7 11.6
Not teaching or did not complete degree or teaching certificate
32.6 4.9 32.6 5.4 32.6 ! 10.2
Another factor 23.3 4.6 24.1 5.1 17.3 ! 8.2
— = Not applicable. ! = Interpret data with caution. The coefficient of variation (CV) for this estimate is between 30 percent and 50 percent. Note: Data presented are weighted for sampling and nonresponse. Recipients who had indicated in a previous question that their service requirements were already met or that they were “very likely” or “likely” to fulfill the TEACH Grant four-year service requirement were not asked this question. Total percent will not sum to 100 percent as respondents could select more than one response category. SE = Standard error of the percentage. Source: TEACH Grant Recipient Survey, 2016 (n=114).
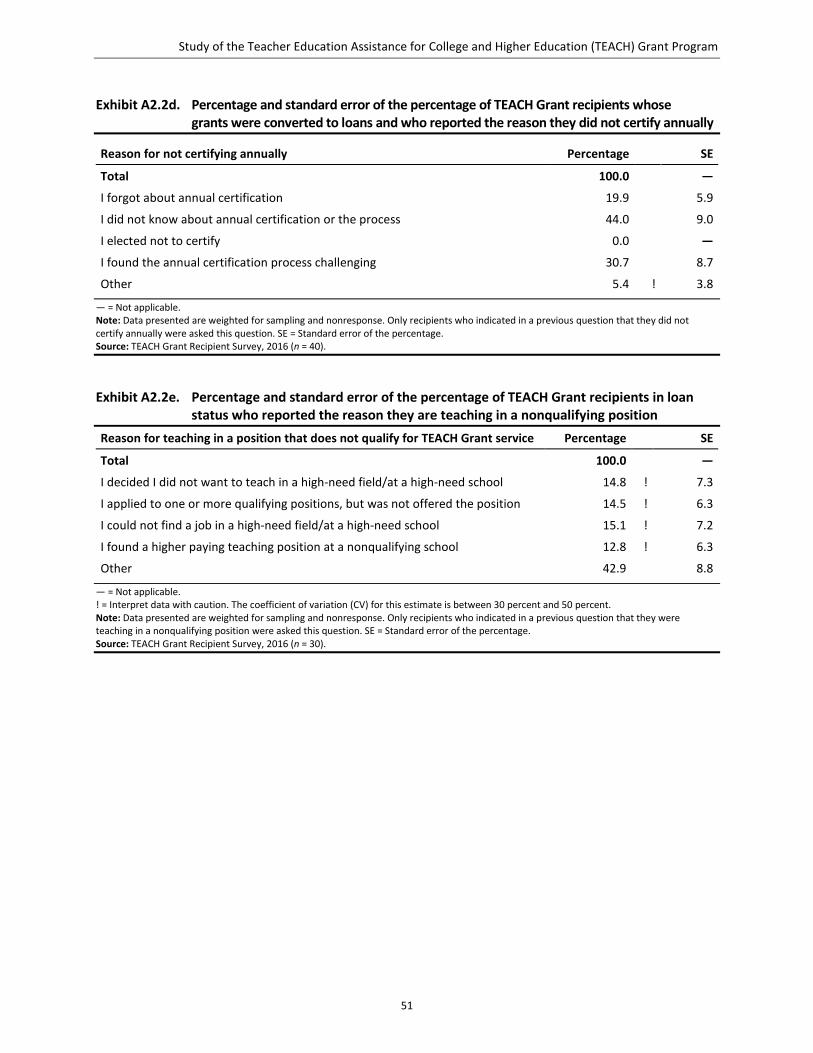
Study of the Teacher Education Assistance for College and Higher Education (TEACH) Grant Program
51
Exhibit A2.2d. Percentage and standard error of the percentage of TEACH Grant recipients whose grants were converted to loans and who reported the reason they did not certify annually
Reason for not certifying annually Percentage SE
Total 100.0 —
I forgot about annual certification 19.9 5.9
I did not know about annual certification or the process 44.0 9.0
I elected not to certify 0.0 —
I found the annual certification process challenging 30.7 8.7
Other 5.4 ! 3.8
— = Not applicable. Note: Data presented are weighted for sampling and nonresponse. Only recipients who indicated in a previous question that they did not certify annually were asked this question. SE = Standard error of the percentage. Source: TEACH Grant Recipient Survey, 2016 (n = 40).
Exhibit A2.2e. Percentage and standard error of the percentage of TEACH Grant recipients in loan status who reported the reason they are teaching in a nonqualifying position
Reason for teaching in a position that does not qualify for TEACH Grant service Percentage SE
Total 100.0 —
I decided I did not want to teach in a high-need field/at a high-need school 14.8 ! 7.3
I applied to one or more qualifying positions, but was not offered the position 14.5 ! 6.3
I could not find a job in a high-need field/at a high-need school 15.1 ! 7.2
I found a higher paying teaching position at a nonqualifying school 12.8 ! 6.3
Other 42.9 8.8
— = Not applicable. ! = Interpret data with caution. The coefficient of variation (CV) for this estimate is between 30 percent and 50 percent. Note: Data presented are weighted for sampling and nonresponse. Only recipients who indicated in a previous question that they were teaching in a nonqualifying position were asked this question. SE = Standard error of the percentage. Source: TEACH Grant Recipient Survey, 2016 (n = 30).
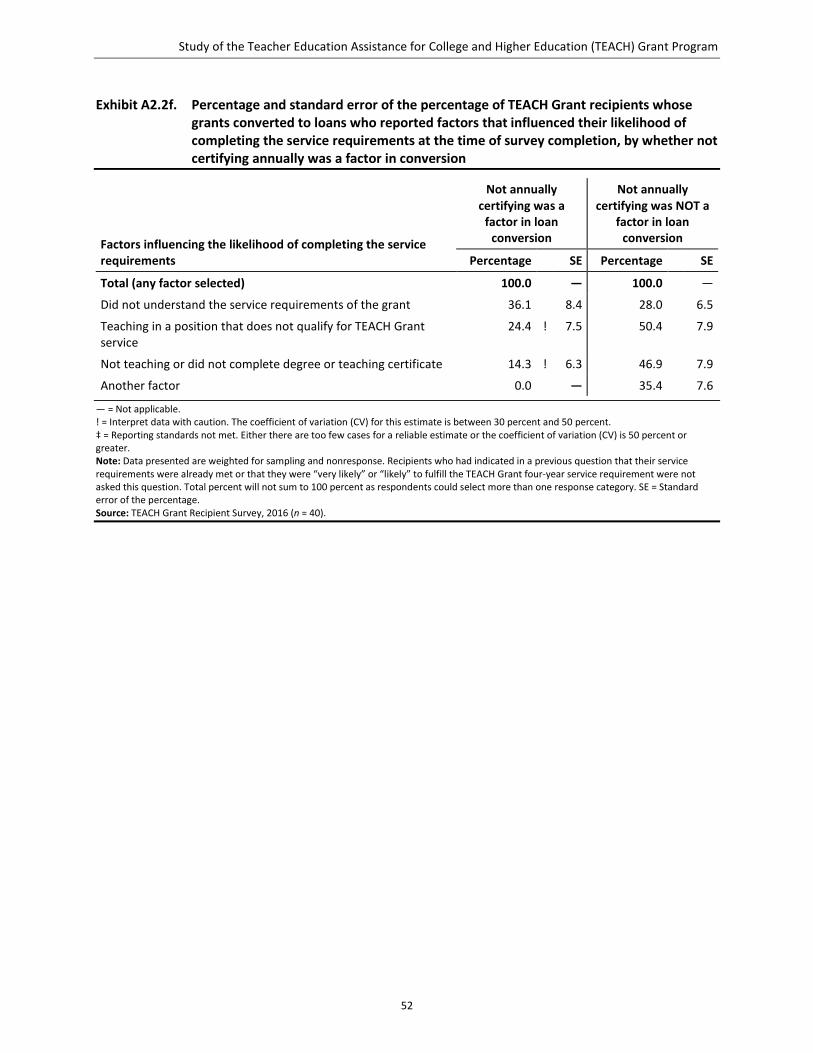
Study of the Teacher Education Assistance for College and Higher Education (TEACH) Grant Program
52
Exhibit A2.2f. Percentage and standard error of the percentage of TEACH Grant recipients whose grants converted to loans who reported factors that influenced their likelihood of completing the service requirements at the time of survey completion, by whether not certifying annually was a factor in conversion
Factors influencing the likelihood of completing the service requirements
Not annually certifying was a
factor in loan conversion
Not annually certifying was NOT a
factor in loan conversion
Percentage SE Percentage SE
Total (any factor selected) 100.0 — 100.0 —
Did not understand the service requirements of the grant 36.1 8.4 28.0 6.5
Teaching in a position that does not qualify for TEACH Grant service
24.4 ! 7.5 50.4 7.9
Not teaching or did not complete degree or teaching certificate 14.3 ! 6.3 46.9 7.9
Another factor 0.0 — 35.4 7.6
— = Not applicable. ! = Interpret data with caution. The coefficient of variation (CV) for this estimate is between 30 percent and 50 percent. ‡ = Reporting standards not met. Either there are too few cases for a reliable estimate or the coefficient of variation (CV) is 50 percent or greater. Note: Data presented are weighted for sampling and nonresponse. Recipients who had indicated in a previous question that their service requirements were already met or that they were “very likely” or “likely” to fulfill the TEACH Grant four-year service requirement were not asked this question. Total percent will not sum to 100 percent as respondents could select more than one response category. SE = Standard error of the percentage. Source: TEACH Grant Recipient Survey, 2016 (n = 40).
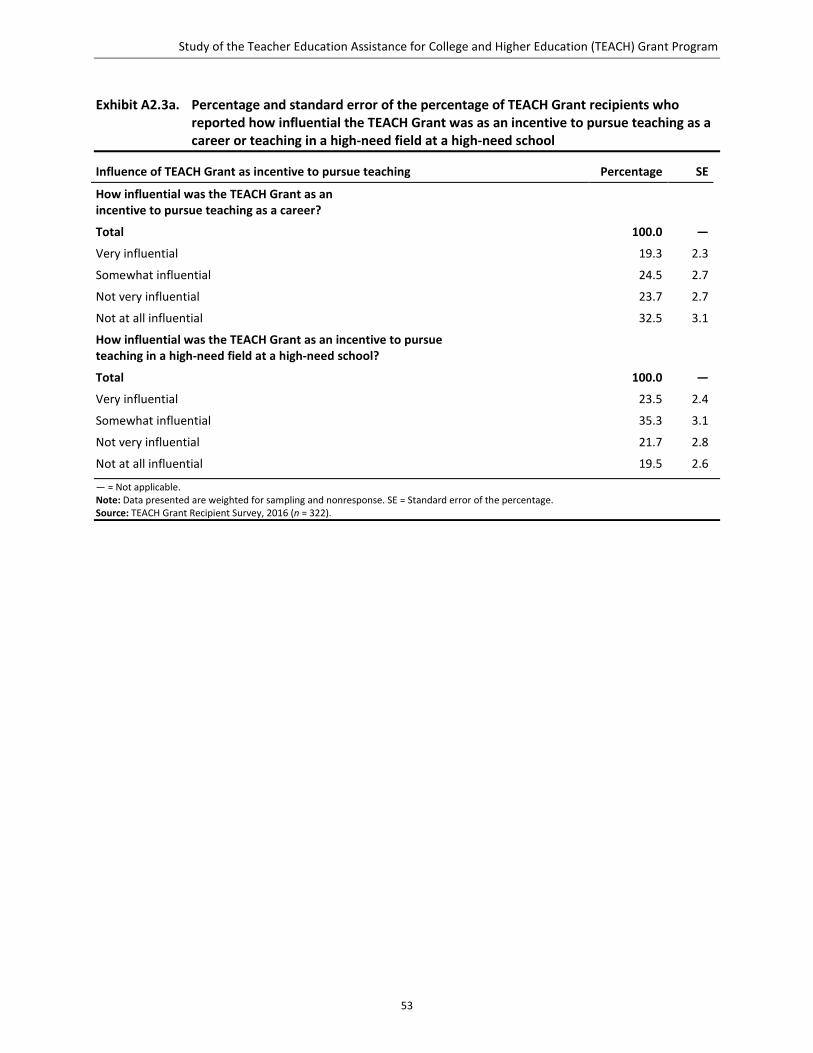
Study of the Teacher Education Assistance for College and Higher Education (TEACH) Grant Program
53
Exhibit A2.3a. Percentage and standard error of the percentage of TEACH Grant recipients who reported how influential the TEACH Grant was as an incentive to pursue teaching as a career or teaching in a high-need field at a high-need school
Influence of TEACH Grant as incentive to pursue teaching Percentage SE
How influential was the TEACH Grant as an incentive to pursue teaching as a career?
Total 100.0 —
Very influential 19.3 2.3
Somewhat influential 24.5 2.7
Not very influential 23.7 2.7
Not at all influential 32.5 3.1
How influential was the TEACH Grant as an incentive to pursue teaching in a high-need field at a high-need school?
Total 100.0 —
Very influential 23.5 2.4
Somewhat influential 35.3 3.1
Not very influential 21.7 2.8
Not at all influential 19.5 2.6
— = Not applicable. Note: Data presented are weighted for sampling and nonresponse. SE = Standard error of the percentage. Source: TEACH Grant Recipient Survey, 2016 (n = 322).
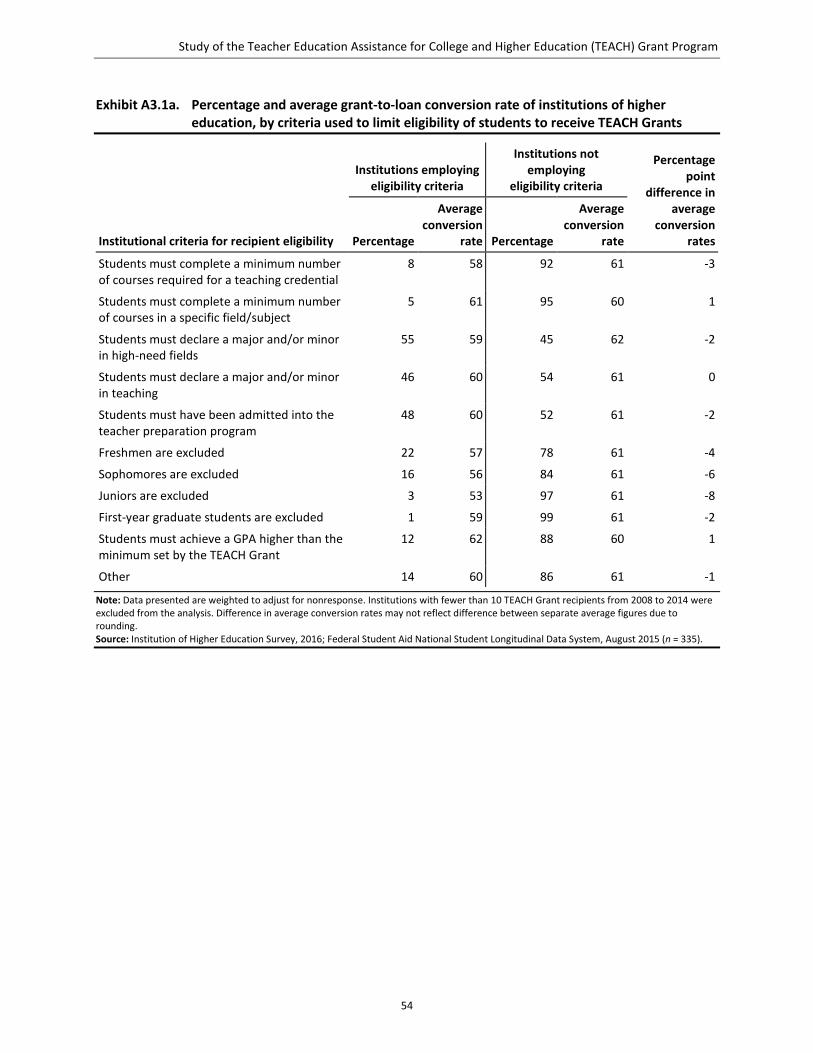
Study of the Teacher Education Assistance for College and Higher Education (TEACH) Grant Program
54
Exhibit A3.1a. Percentage and average grant-to-loan conversion rate of institutions of higher education, by criteria used to limit eligibility of students to receive TEACH Grants
Institutional criteria for recipient eligibility
Institutions employing eligibility criteria
Institutions not employing
eligibility criteria
Percentage point
difference in average
conversion rates Percentage
Average conversion
rate Percentage
Average conversion
rate
Students must complete a minimum number of courses required for a teaching credential
8 58 92 61 -3
Students must complete a minimum number of courses in a specific field/subject
5 61 95 60 1
Students must declare a major and/or minor in high-need fields
55 59 45 62 -2
Students must declare a major and/or minor in teaching
46 60 54 61 0
Students must have been admitted into the teacher preparation program
48 60 52 61 -2
Freshmen are excluded 22 57 78 61 -4
Sophomores are excluded 16 56 84 61 -6
Juniors are excluded 3 53 97 61 -8
First-year graduate students are excluded 1 59 99 61 -2
Students must achieve a GPA higher than the minimum set by the TEACH Grant
12 62 88 60 1
Other 14 60 86 61 -1
Note: Data presented are weighted to adjust for nonresponse. Institutions with fewer than 10 TEACH Grant recipients from 2008 to 2014 were excluded from the analysis. Difference in average conversion rates may not reflect difference between separate average figures due to rounding. Source: Institution of Higher Education Survey, 2016; Federal Student Aid National Student Longitudinal Data System, August 2015 (n = 335).
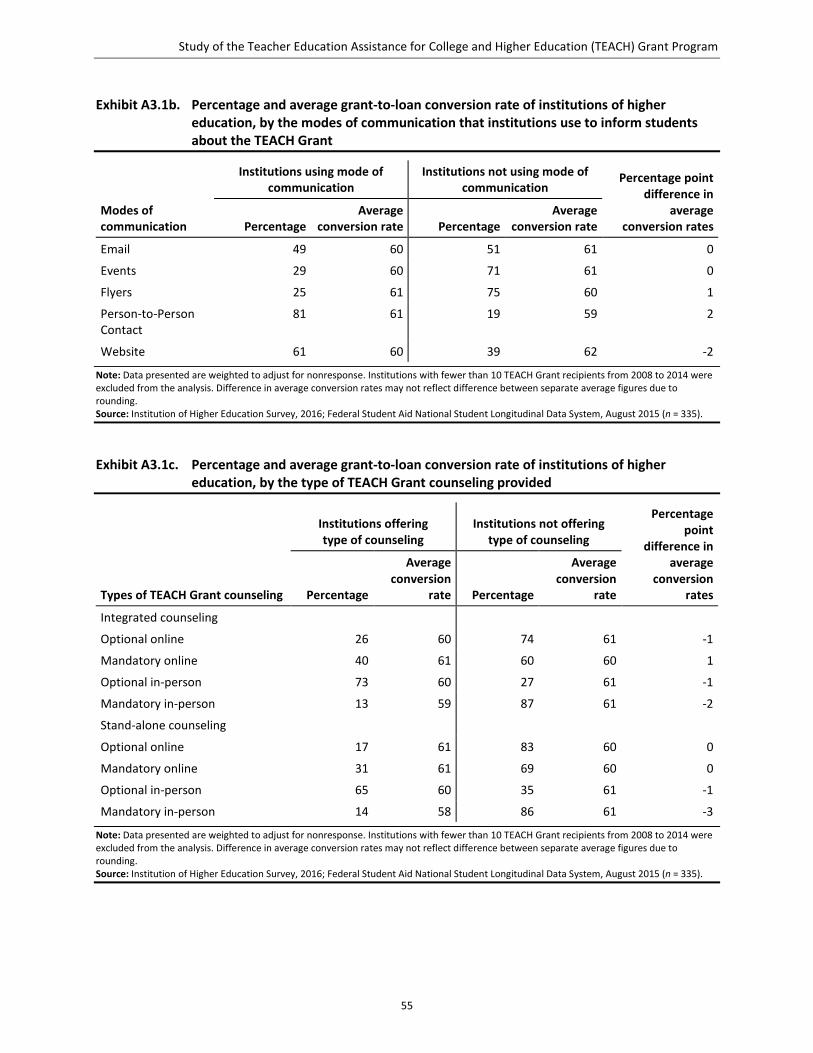
Study of the Teacher Education Assistance for College and Higher Education (TEACH) Grant Program
55
Exhibit A3.1b. Percentage and average grant-to-loan conversion rate of institutions of higher education, by the modes of communication that institutions use to inform students about the TEACH Grant
Modes of communication
Institutions using mode of communication
Institutions not using mode of communication
Percentage point difference in
average conversion rates Percentage
Average conversion rate Percentage
Average conversion rate
Email 49 60 51 61 0
Events 29 60 71 61 0
Flyers 25 61 75 60 1
Person-to-Person Contact
81 61 19 59 2
Website 61 60 39 62 -2
Note: Data presented are weighted to adjust for nonresponse. Institutions with fewer than 10 TEACH Grant recipients from 2008 to 2014 were excluded from the analysis. Difference in average conversion rates may not reflect difference between separate average figures due to rounding. Source: Institution of Higher Education Survey, 2016; Federal Student Aid National Student Longitudinal Data System, August 2015 (n = 335).
Exhibit A3.1c. Percentage and average grant-to-loan conversion rate of institutions of higher education, by the type of TEACH Grant counseling provided
Types of TEACH Grant counseling
Institutions offering type of counseling
Institutions not offering type of counseling
Percentage point
difference in average
conversion rates Percentage
Average conversion
rate Percentage
Average conversion
rate
Integrated counseling Optional online 26 60 74 61 -1
Mandatory online 40 61 60 60 1
Optional in-person 73 60 27 61 -1
Mandatory in-person 13 59 87 61 -2
Stand-alone counseling
Optional online 17 61 83 60 0
Mandatory online 31 61 69 60 0
Optional in-person 65 60 35 61 -1
Mandatory in-person 14 58 86 61 -3
Note: Data presented are weighted to adjust for nonresponse. Institutions with fewer than 10 TEACH Grant recipients from 2008 to 2014 were excluded from the analysis. Difference in average conversion rates may not reflect difference between separate average figures due to rounding. Source: Institution of Higher Education Survey, 2016; Federal Student Aid National Student Longitudinal Data System, August 2015 (n = 335).
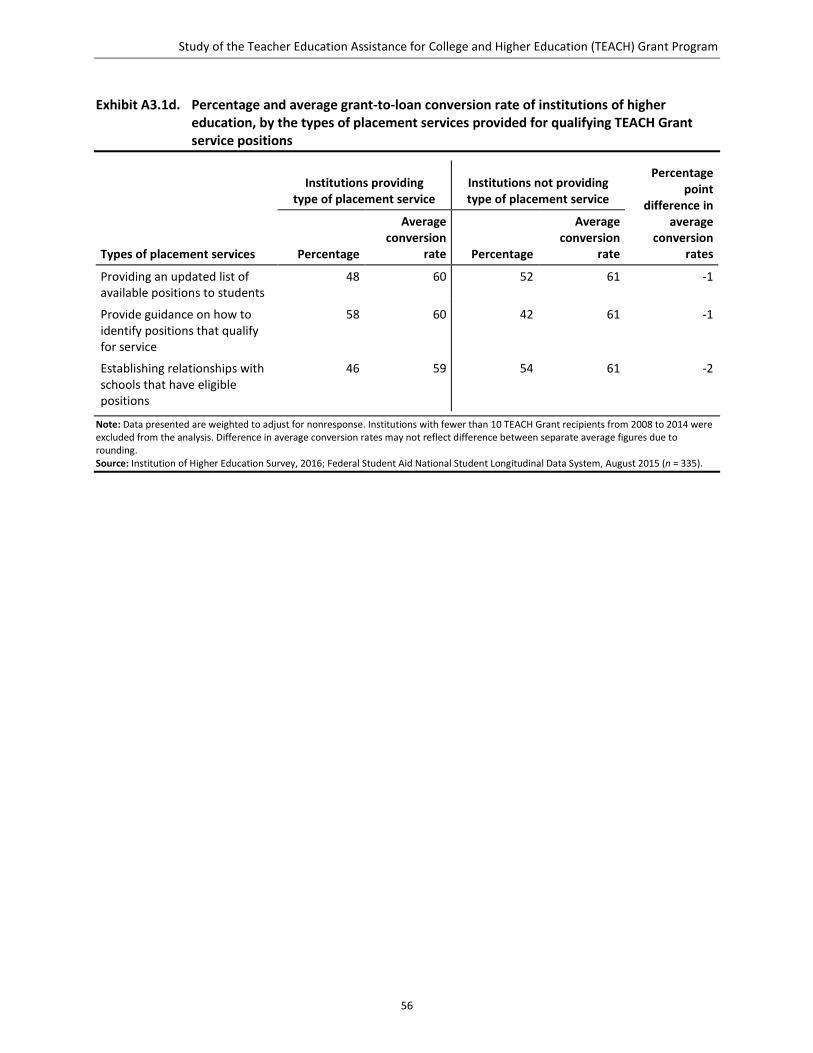
Study of the Teacher Education Assistance for College and Higher Education (TEACH) Grant Program
56
Exhibit A3.1d. Percentage and average grant-to-loan conversion rate of institutions of higher education, by the types of placement services provided for qualifying TEACH Grant service positions
Types of placement services
Institutions providing type of placement service
Institutions not providing type of placement service
Percentage point
difference in average
conversion rates Percentage
Average conversion
rate Percentage
Average conversion
rate
Providing an updated list of available positions to students
48 60 52 61 -1
Provide guidance on how to identify positions that qualify for service
58 60 42 61 -1
Establishing relationships with schools that have eligible positions
46 59 54 61 -2
Note: Data presented are weighted to adjust for nonresponse. Institutions with fewer than 10 TEACH Grant recipients from 2008 to 2014 were excluded from the analysis. Difference in average conversion rates may not reflect difference between separate average figures due to rounding. Source: Institution of Higher Education Survey, 2016; Federal Student Aid National Student Longitudinal Data System, August 2015 (n = 335).
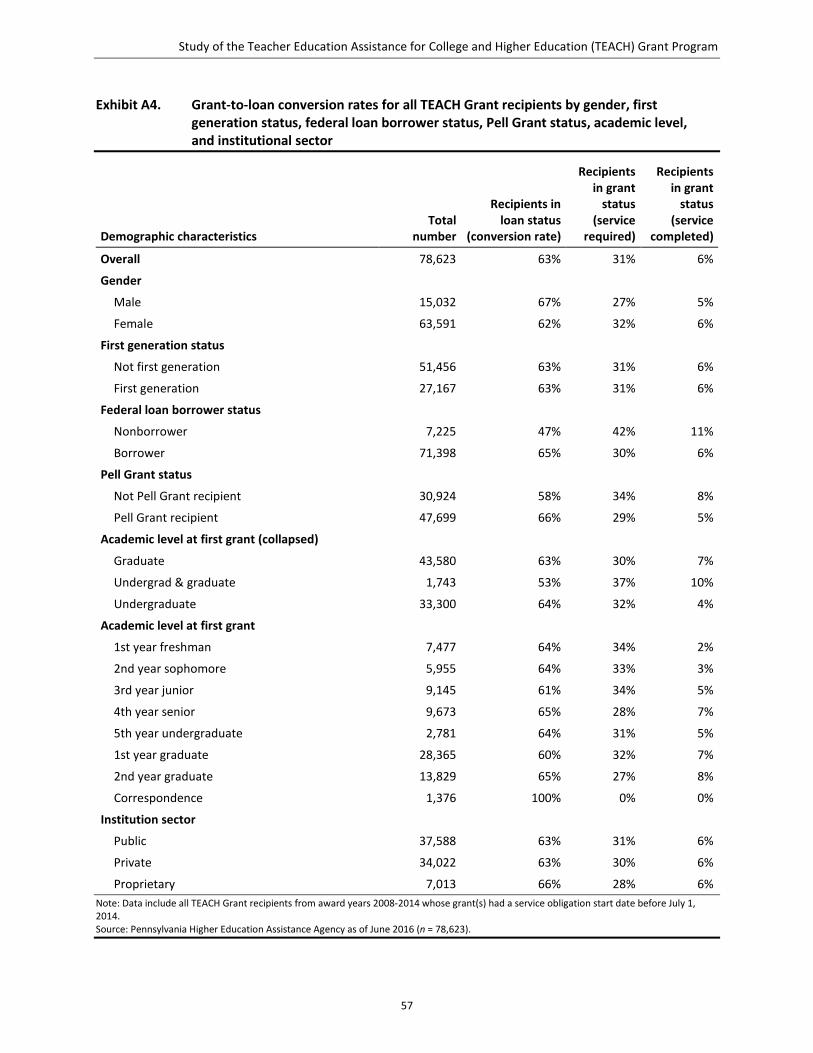
Study of the Teacher Education Assistance for College and Higher Education (TEACH) Grant Program
57
Exhibit A4. Grant-to-loan conversion rates for all TEACH Grant recipients by gender, first generation status, federal loan borrower status, Pell Grant status, academic level, and institutional sector
Demographic characteristics Total
number
Recipients in loan status
(conversion rate)
Recipients in grant
status (service
required)
Recipients in grant
status (service
completed)
Overall 78,623 63% 31% 6%
Gender Male 15,032 67% 27% 5%
Female 63,591 62% 32% 6%
First generation status Not first generation 51,456 63% 31% 6%
First generation 27,167 63% 31% 6%
Federal loan borrower status Nonborrower 7,225 47% 42% 11%
Borrower 71,398 65% 30% 6%
Pell Grant status Not Pell Grant recipient 30,924 58% 34% 8%
Pell Grant recipient 47,699 66% 29% 5%
Academic level at first grant (collapsed)
Graduate 43,580 63% 30% 7%
Undergrad & graduate 1,743 53% 37% 10%
Undergraduate 33,300 64% 32% 4%
Academic level at first grant 1st year freshman 7,477 64% 34% 2%
2nd year sophomore 5,955 64% 33% 3%
3rd year junior 9,145 61% 34% 5%
4th year senior 9,673 65% 28% 7%
5th year undergraduate 2,781 64% 31% 5%
1st year graduate 28,365 60% 32% 7%
2nd year graduate 13,829 65% 27% 8%
Correspondence 1,376 100% 0% 0%
Institution sector Public 37,588 63% 31% 6%
Private 34,022 63% 30% 6%
Proprietary 7,013 66% 28% 6% Note: Data include all TEACH Grant recipients from award years 2008-2014 whose grant(s) had a service obligation start date before July 1, 2014. Source: Pennsylvania Higher Education Assistance Agency as of June 2016 (n = 78,623).

Study of the Teacher Education Assistance for College and Higher Education (TEACH) Grant Program
59
Appendix B. Case Study Narratives
Small, Private Institution in the Northeast
Site Description
This institution is a small private rural college, with a total enrollment of less than 5,000. About 100 students are enrolled in the teacher preparation program. At this institution, many of the students are the first in their families to attend college. For entering freshmen, the average financial aid package is about $27,000 and most incoming students receive some form of financial assistance mainly in the form of grants and scholarships in addition to student loans.
The institution administered the majority (approximately 65 percent) of its TEACH Grants to juniors and seniors, and the remaining to freshman and sophomores. Accordingly, very few TEACH Grants were administered to graduate students. Since 2009, the total number of TEACH Grants administered was approximately 200. To date, the institution’s grant-to-loan conversion rate has been approximately 60 percent.
Administration of TEACH Grants
At this private institution, the financial aid office administers the TEACH Grant. Every semester, the financial aid office sends a list of the scholarships and grant programs to the education department to help inform faculty and students about potential sources of funding. The education department’s role is to disseminate information about the TEACH Grant to students and to instruct them to contact the financial aid office to learn more. The admissions office also plays a role by informing potential applicants and incoming students about the TEACH Grant’s benefits such as the amount of the grant and the requirements to teach in a high-need subject and high-need school.
The financial aid office automatically qualifies students for the TEACH Grant if they meet the grade point average minimum of 3.25 and are majoring in a discipline containing a high-need component. Thus, entering admitted freshmen or any student switching to a major containing a high-need component are immediately eligible to receive a TEACH Grant if they meet the grade point average requirement. Once the student is found to qualify, the financial aid office then prepares an aid letter that includes the entire package of aid that student could receive. The financial aid package contains scholarships and other available funds regardless of the student’s level of need. The section of the financial aid letter devoted to the TEACH Grant informs the student that receiving the grant hinges on completing the agreement to serve and attending a seminar to learn about the requirements of the grant.
Grant recipients are required to attend an entrance seminar, presented by the financial aid office, where they learn about the details of their financial aid, including the requirements for the TEACH Grant. They also are told about situations that would cause the grant to become a loan, including not meeting the minimum grade point average, switching out of a qualifying major, or not meeting the obligation to teach for four years in a high-need subject at a high-need school. After attending the seminar, grant recipients are then required to sign an agreement to serve, which is collected by the financial aid office.
Every semester, the financial aid office monitors student eligibility by reviewing the list of students receiving the TEACH Grant and comparing their majors to the list of eligible majors. Those students who no longer qualify are then notified. The financial aid officer explained that students become ineligible
Study of the Teacher Education Assistance for College and Higher Education (TEACH) Grant Program
60
because they often do not meet the minimum grade point average but that they tend to raise their grades within a semester.
Use of TEACH Grants to Recruit and Assist Teacher Candidates
Representatives from the admissions office visit several hundred high schools every fall to talk to prospective students about the college. The financial aid office hosts local financial aid workshops for interested students and parents. During these visits, they talk about financial aid, including the TEACH Grant. In addition to these workshops, the TEACH Grant is featured on the college website’s section on financial aid and includes an explanation of the Grant’s requirements and obligations. The institution also added information about the TEACH Grant to its recruitment materials. Admission staff believe that the TEACH Grant is useful in recruiting students to the college of education because parents often ask about the TEACH Grant.
The director of the college of education and the chair of the education division — both faculty at the college — said that all teacher candidates are placed in a high-need school for at least one of their clinical experiences, and because of the college’s location, such placement is often in a rural community. However, they also acknowledged that because faculty do not know which students received a TEACH Grant, they do not target support to help grant recipients meet the service requirement. After students graduate, faculty and staff do not follow-up with grant recipients. As a result, staff are unable to help them fulfill their service requirements due to the lack of communication after graduation.
TEACH Grant Successes and Challenges
The TEACH Grant is perceived as a helpful tool in recruiting students into the college of education because it helps them pay tuition, particularly because many students come from families without the resources to cover the cost of college.
However, some students reportedly decline the TEACH Grant because of the service requirement. A financial aid officer said these students often come to her office, asking about how to get more aid. In some cases, the students declined the grant because they do not want to teach in an urban setting, and think that such a placement is required if they accept the TEACH Grant. The financial aid officer said that students are then reminded that a high-need setting also can include a rural school, which convinces some students to then accept the grant. These students are often more comfortable teaching in a rural school because many of them grew up in a rural setting. Another challenge is that students also tend to underestimate the value of their financial aid awards and likely do not understand the requirements of the agreement under the TEACH Grant. Financial aid staff feel that this is part of a more systemic issue with students not understanding their financial aid packages and direct loans.
Why TEACH Grants Convert to Loans
Different staff within the institution offered varied interpretations of graduates’ experiences and expectations of teaching in a high-need school. For example, the director of the college of education and the chair of the education division felt that graduates were unable to get jobs that would fulfill the service requirement, whereas, the admissions officer stated that such jobs were indeed available to graduates, and that the perception of a lack of jobs was incorrect.

Study of the Teacher Education Assistance for College and Higher Education (TEACH) Grant Program
61
Moreover, the financial aid officer explained that students may not have a full understanding of the requirements of the TEACH Grant. She said that although the financial aid office counsels students about the grant while they are enrolled, students still told her they were surprised by the amount they received through the grant program and the requirements to be fulfilled. She felt that some students accepted the grant knowing that it would ultimately convert to a loan for them because they needed the funds to pay tuition. They accepted the grant even if they were unsure that they would teach in a high-need school or high-need field. On the other hand, the faculty thought that students had a full understanding of the grant requirements, contrary to the financial aid officer’s view.
Faculty felt that some students major in education with an unrealistic view of the teaching profession. According to these faculty, students tend to be idealistic about the teaching profession and believe that because they like children, they will like teaching. When they begin to work in schools, however, they sometimes discover that they do not like teaching and then change their major. If they have received a TEACH Grant, changing major can have an unanticipated and negative impact when it converts to a loan.
Recommendations on TEACH Grant Implementation and Requirements
The admissions officer said it would help if grant recipients could visit a website that lists districts and job openings so that they could have a better sense of the positions available in high-need schools and in districts where they would like to work. She said that candidates often want to return to their hometowns after graduation and would like to teach in a nearby district, but it is difficult for them to target jobs that would allow them to fulfill the grant requirements.
Study of the Teacher Education Assistance for College and Higher Education (TEACH) Grant Program
62
Large, Public Institution in the Southeast
Site Description
This institution is a large, rural public institution in the Southeast, enrolling more than 20,000 students. About 10 percent of the institution’s enrollment includes undergraduate and graduate students in the college of education. All undergraduate programs are offered only on campus, but most of the master’s degree and education specialist programs are offered online only.
The institution administered approximately 70 percent of its TEACH Grants to undergraduate students, with the majority going to juniors and seniors. The institution administered the remaining 30 percent of grants to first-year graduate students. Since 2009, there have been about 200 TEACH Grant recipients. The grant-to-loan conversion rate stands at 55 percent for this institution.
Staff reported that the institution currently restricts eligibility for TEACH Grants until a student’s junior year, which is when they enter the college of education. That decision was made by the college of education’s dean, who “had great concerns about offering [the TEACH Grant] too soon because students [often] change their majors, and [so as not to] saddle students who do decide ‘teaching maybe isn’t for me’ while having then to repay that loan.”
Administration of TEACH Grants
The financial aid office primarily administers the TEACH Grant, whereas, advisers in the student support center inform students about the grants. The advisers in the college of education are tasked with counseling students on whether they qualify for a TEACH Grant.
Qualified students interested in receiving a TEACH Grant complete a form created by the student support center, and after the form is approved by the advisers there, it is sent to the institution’s financial aid office. Once the office verifies that the student is qualified to receive the grant, it finalizes the application and adds the award to the student’s financial aid package. At the end of each school year, the student support center and the financial aid office review the grade point average and major of each student at or beyond their junior year who are receiving a TEACH Grant. Students are then required to reapply for the TEACH Grant for the upcoming school year which is typically for their senior year of study.
The student support center advisor stated that every student at the institution is required to meet regularly with an advisor, and in the case of education majors, such meetings take place at the student support center. At the end of their sophomore year, when education majors are preparing to enroll in education courses, advisers talk to those students who qualify about the TEACH Grant and what they need to do to apply. They also require students to do their own research before applying for a TEACH Grant.
The college of education’s application form for the TEACH Grant includes a section that explains the requirements of the grant and the responsibilities of students receiving the grant. As part of the application process, students then sign that they understand their obligations. If the students have any questions, they are told to direct them to the staff at the student support center for assistance with the application process and for information about the TEACH Grant.
Study of the Teacher Education Assistance for College and Higher Education (TEACH) Grant Program
63
The financial aid office runs a report every semester that examines whether a student has changed major or has had a drop in grade point average that makes a student ineligible for a TEACH Grant. The financial aid office notifies staff in the student support center about any teacher preparation students who no longer qualify. The advisers then must provide exit counseling to those students.
Students are required to reapply for the TEACH Grant each semester, which helps advisors monitor their continuing eligibility. This also informs the financial aid office of any changes to the list of majors that qualify students to receive a TEACH Grant.
Use of TEACH Grants to Recruit and Assist Teacher Candidates
Institution staff had differing views of the use of TEACH Grants to recruit prospective students into teaching. The institution-wide admissions staff member indicated that her office did not use TEACH Grants as a recruitment tool, whereas, the student support center did. The director of the student support center indicated that the student support advisor served as a part-time recruiter for the college of education. The director of the center explained that TEACH Grants were an added financial bonus for those students who had committed to teaching after matriculating into the college of education in their junior year rather than as a lure to enter the school.
The college helps teacher candidates meet the grant requirements by immersing them in a variety of clinical placements and requiring 1,000 hours of clinical training. In this way, the dean said, candidates will inevitably have had experience in the kind of high-need schools that they are required to work in to meet the grant requirements.
As students approach the end of their teacher preparation programs, the financial aid office notifies TEACH Grant recipients that they need to complete the mandatory, online TEACH Grant exit counseling required by the Department of Education.
Job placement and career services are handled in the central career services office under the division of student affairs and enrollment management, which serves the entire institution, including the college of education. None of the institution’s processes were designed to support efforts by TEACH Grant recipients to obtain positions in high-need schools. However, staff who work in career services said that representatives from high-need schools and districts often attend the institution's career fairs to recruit new teachers.
TEACH Grant Successes and Challenges
Higher education staff at this institution felt that TEACH Grants helped teacher candidates pay for college, thus motivating students to serve in high-need schools. Officials throughout the institution also said that placing well-prepared teachers into high-need schools benefits both the community and state, especially when the state is facing a teacher shortage.
Administrators and faculty disagreed about whether the college of education should offer TEACH Grants to students in their freshman and sophomore years, rather than starting in their junior year. According to the Director of the Student Success Center in the college of education, some staff argued that grant funds should not be withheld from students and that the grant should be available to all students in the education program. At the same time, most officials agreed that offering TEACH Grants to freshmen could be unwise since those students are more likely to change majors before entering the college of

Study of the Teacher Education Assistance for College and Higher Education (TEACH) Grant Program
64
education, thus incurring substantial debt. Lastly, faculty within the college of education felt that the 3.25 grade point average requirement was too high. They argued that the requirement prevented some good teacher candidates from receiving the grant.
Why TEACH Grants Convert to Loans
The staff did not offer much detail on the reasons for which Grants converted to loans and instead reflected on reasons for which teachers leave the profession. For example, the admissions officer felt that the recession had led to teacher layoffs and the elimination of some teaching jobs, so graduates had a difficult time finding teaching positions. One faculty member explained that many new teachers feel isolated and experience a lack of support, so they ultimately leave teaching altogether. One advisor thought that some graduates — often finishing their undergraduate degree at age 22 — mistakenly think that the eight years to fulfill their obligation to the program is a long time so they can put off starting their career, which increases the likelihood of conversion.
Recommendations on TEACH Grant Implementation and Requirements
Institution officials suggested that modifications to the current TEACH Grant requirements would, in her view, enable the Grant to reach more students. For example, the faculty emphasized that by lowering the grade point average and loosening the service requirements for a short time, federal officials could entice more candidates into teaching. Numerous officials at this institution stated that it would be helpful to have better data about the graduates whose grants convert to loans to help institution officials make better decisions about how to administer the grant. Specifically, they noted that data on conversion rates and job placement would be helpful to the institution.

Study of the Teacher Education Assistance for College and Higher Education (TEACH) Grant Program
65
Small, Private Institution in the South
Site Description
This institution is a rural, relatively small private institution in the south, with an enrollment of slightly more than 6,000 students. The college of education enrolls approximately 300 students of whom about two-thirds are enrolled in undergraduate programs. The institution administers approximately half of its TEACH Grants to undergraduate students. The institution administers the remaining half of TEACH Grants to first and second year graduate students. Since 2009, there have been about 500 TEACH Grant recipients with a grant-to-loan conversion rate of 65 percent.
Administration of TEACH Grants
The financial aid office administers TEACH Grants at this institution. The financial aid officer responsible for TEACH Grant administration explained that she did not receive any outside training for this role, but that her predecessor introduced her to the grant requirements and the administration procedures. When students ask about financial aid and if they are planning to major in education and in a high-need field, the financial aid office tells them about the TEACH Grant. The financial aid office first verifies their eligibility and then asks the students to apply.
The financial aid officer reported that her office reviews student majors and grade point averages each year to make sure students are eligible to receive a TEACH Grant. Moreover, financial aid officers often have personal knowledge of which students have TEACH Grants, whereas, faculty and staff in the college of education stated that they generally do not know which students are recipients.
The financial aid office uses the college of education’s online counseling tool to help students learn about the TEACH Grant requirements. Although students do not enter the college of education until their junior year, students can be awarded a TEACH Grant while they are freshmen and sophomores. When students are admitted to the college for reasons such as changing majors or are transferring in from another institution, their advisors usually mention the TEACH Grant if the student is in an eligible field.
The director of teacher education said she speaks to prospective students about TEACH Grants when they visit the institution but that she is careful to tell them and their families about the requirements of the TEACH Grant. She informs prospective students that the grants do not cover all majors and can convert to loans if the requirements are not met. In addition, faculty who teach in high-need areas discuss the TEACH Grants in their courses to students who might qualify.
Use of TEACH Grants to Recruit and Assist Teacher Candidates
The director of teacher education and faculty often work with the admissions office when groups of interested students visit the institution. During these visits, the director talks to those interested in teacher education about the TEACH Grant, and she also distributes a brochure with information about the grant. If potential students — or their parents — are interested in the TEACH Grant, she directs them to the financial aid office to obtain more information. She explained that she does not have data on whether the TEACH Grant is an effective tool for recruiting students to either the college of education or to a high-need field.
Study of the Teacher Education Assistance for College and Higher Education (TEACH) Grant Program
66
Because faculty and staff in the college of education do not know which of their students receive TEACH Grants, they rely on the students to tell them when they are completing an application, noting their preference for field experience in a high-need school. However, the director of field experience noted that all their partner K–12 schools are considered high need, so every teacher candidate will have some experience teaching in a high-need school.
Staff members said that they remind students, when they are close to completing the teacher preparation program, to make sure to complete all the forms for the U.S. Department of Education, including the TEACH Grant form. Once students graduate, the institution does not receive information about the status of their TEACH Grants.
TEACH Grant Successes and Challenges
Although staff did not know how to access data about the status of graduates’ TEACH Grants, they felt that the TEACH Grant was a good way to incentivize students to major in a high-need field and to encourage them to work in a high-need school.
The financial aid office at this institution noted that tracking varied state lists of what qualifies as a high-need field proved unexpectedly challenging especially since the institution enrolls students from throughout the United States. Although the federal government has a list of high-need majors, each state can add its own high-need subject areas. The lists change from time to time, and the financial aid office finds it challenging to keep up with the changes. For example, one state added “family consumer science” as a high-need field. In addition to this, the financial aid officer said it was also challenging to monitor every student’s grade point average and major.
Why TEACH Grants Convert to Loans
Despite counseling, the financial aid officer said that freshmen and sophomores sometimes accept a TEACH Grant, even though they do not know what they want to choose as a major. They may intend to teach, but change their minds a few semesters into their undergraduate education and their grants convert to loans. Although the counseling sessions explain the grant requirements, the financial aid officer was uncertain whether students fully understand the commitments that TEACH Grant recipients must fulfill to prevent the grant from becoming a loan. For example, although recipients receive notices every semester to fill out paperwork for the grant some students forget to periodically fulfill the grant obligations.
Staff indicated that students sometimes make decisions about their major based on the needs of their home state, where they plan to return after graduation. But students may change their minds about this as well, perhaps deciding to live elsewhere or get married and move to their spouse’s home state. The staff explained that in both these situations, it is possible that a student’s major no longer qualifies as a high-need subject area depending on the state where the candidate takes a teaching position.
The financial aid officer said that students are sometimes so interested in staying out of debt that they are eager to take a TEACH Grant because it is a grant, without considering the ramifications of not completing the service requirements.
Study of the Teacher Education Assistance for College and Higher Education (TEACH) Grant Program
67
Recommendations on TEACH Grant Implementation and Requirements
One staff member said that it would be helpful if the college of education included a question about the status of TEACH Grants in the survey the college sends to graduates one year and three years after they graduate. She noted that it would be helpful if the U.S. Department of Education could somehow support and facilitate the efforts of teacher preparation program staff to follow-up with graduates about the status of their TEACH Grants. She further commented that lengthening the time in which a grant converts to a loan might give students more time to meet grant requirements. Another staff member said that she would prefer a program that gave grants to all teacher candidates because it would support all those students who are going into this kind of public service.
Study of the Teacher Education Assistance for College and Higher Education (TEACH) Grant Program
68
Large, Public Institution in the Midwest
Site Description
This institution is a large, rural public institution in the Midwest, with a total enrollment of about 10,000. Enrollment in this institution’s teacher preparation programs is high, and it prepares more teachers than any other university in the state. The institution primarily serves undergraduate students, but enrolls a smaller population of graduate students. Since 2009, about 600 students have been awarded the TEACH Grant. The institution administered almost 100 percent of its TEACH Grants to undergraduate students, with approximately 30 percent of those grants going to freshman and sophomores and the rest to juniors, seniors, and fifth-year seniors. The grant-to-loan conversion rate stands at 45 percent.
Administration of TEACH Grants
The financial aid office is responsible for determining student eligibility for the TEACH Grant and communicating with students about the grant requirements. The office enhanced its automated processes so that information about a student’s admission into the college of education and the information about the TEACH Grant are compiled into one record. Therefore, the grant is automatically applied to the financial aid award of students meeting all the TEACH Grant eligibility requirements.
Financial aid staff stated that the grant does not credit to students’ accounts until students meet with them to discuss the rules and requirements of receiving the grant and formally enter the grant program. The staff in the financial aid office track the majors and minors eligible for TEACH Grants and communicate with the college of education admissions office staff so that they can inform prospective students at recruiting events about high-need subject areas related to TEACH Grant eligibility.
Financial aid staff explained that students are required to meet individually with staff in the institution’s financial aid office in person to discuss their financial aid package. During this meeting, students are told that to receive a TEACH Grant, they must declare a major in a high-need field, and they are informed about which fields qualify as high need. A staff member in the financial aid office explained,
Everyone is required to come in for personal counseling, which takes about 45–60 minutes. We give them all the content, and they sign a form, which lists their rights and responsibilities.
Students also are informed that they must complete the TEACH Grant agreement to serve and receive counseling through the U.S. Department of Education’s website each year to credit the grant to their account.
Staff in the institution’s financial aid office said that they regularly monitor declared academic majors and minors of students to ensure that their chosen academic course of study conforms to the list of high-need subject areas eligible for the TEACH Grant. Financial aid staff also review each student’s grade point average to verify that it meets the requirements for receiving a TEACH Grant. In some cases, that means informing a student that he or she is no longer eligible to receive a TEACH Grant, if his or her grade point average falls below the required level or if he or she changes the concentration in teacher preparation to a non-high-need subject or content area. Financial aid staff indicated that they inform students that if they raise their grade point averages or choose an appropriate concentration, they will again become eligible for a TEACH Grant.
Study of the Teacher Education Assistance for College and Higher Education (TEACH) Grant Program
69
Use of TEACH Grants to Recruit and Assist Teacher Candidates
The admissions office at the institution holds several events for potential students to learn more about the institution and its academic programs. Faculty and staff from every academic unit participate to inform recruits about opportunities and programs within the institution. These events for potential students typically include high school and community college students. At these events, representatives from the college of education introduce the TEACH Grant and its qualification and service requirements.
Students already enrolled in the institution who may be considering declaring or changing their major or minor to education or teaching can attend other recruitment events. The financial aid office created a flyer that faculty and admissions staff can use at various recruiting events to provide information on the TEACH Grant. Staff at this institution explained that the TEACH Grant is particularly useful in recruiting middle class students who may not qualify for need-based financial aid. Because the grant is based on meeting service requirements rather than financial need, it is available to students with a broader range of backgrounds.
At several points in their teacher training programs, faculty and staff in the college of education provide support that can better position teacher candidates to fulfill the TEACH Grant requirements. For example, the institution and the college of education require that all education students complete several clinical experiences prior to the end of their academic programs that are administered and monitored by faculty.
Students enrolled in the college of education and in a teaching major receive guidance from academic advisers who handle field placements. They match the placements related to students’ specialization in high-need subjects and schools. These placements provide students an opportunity to gain experience in areas that would fulfill the TEACH Grant requirements. Students whose majors are outside the college of education, in disciplines such as mathematics, and who plan to go into teaching are advised by a faculty member in their major about their clinical placements. One faculty member who helps coordinate the elementary education program said of the TEACH Grant recipients: “[Students are] coached really well along the way to make us aware that they do have a TEACH Grant. That’s important for student teaching coordinators to know as they are helping students network for jobs.”
The career services staff also provide experiences for all education students that assist TEACH Grant recipients in fulfilling their grant requirements, including a teacher employment fair where all teacher preparation students can learn about positions that qualify for fulfillment of the TEACH Grant requirements.
TEACH Grant Successes and Challenges
Staff at the college of education expressed that they are committed to supporting students at each stage of their admission, matriculation, and completion. The associate dean said,
[The institution] really has a mind-set of “students first.” We work hard on getting them here, and we work doubly hard on retaining them. We work triply hard on making sure they have the right program and get out of here as soon as possible with the least amount of debt.
The dean and others reported that regular communication with students about TEACH Grants explains why the institution has a grant-to-loan conversion rate that is below the national average.

Study of the Teacher Education Assistance for College and Higher Education (TEACH) Grant Program
70
Communication helps students remain aware of the obligations and requirements associated with accepting a TEACH Grant. The director of the financial aid office reported that she believes the availability of TEACH Grants is particularly important to middle-class students who do not qualify for Pell Grants because their parents earn too much to qualify for need-based aid.
Staff believe that the TEACH Grant is an effective way to recruit teachers into high-need schools and fields. According to a coordinator of teacher education,
We have close to 500 students involved in the program that are going into those areas. That’s very good for us in [the state]. We like the TEACH Grant. It’s a great program for our students.
However, several staff members also commented that the amount of paperwork and procedures required to administer the TEACH Grant is burdensome. Moreover, the director of the financial aid office said she does not typically have timely and accurate access to information about how students and graduates fare with TEACH Grants, which makes it difficult to monitor how the program is working. In addition, she explained that the fact that recipients have up to eight years to fulfill the service requirements further complicates the office’s ability to collect data to understand how they can improve supports for students.
Why TEACH Grants Convert to Loans
Faculty and staff noted that the cost of attending the institution continues to increase, and one consequence of the rising cost of tuition is that students want to complete their programs in less than four years. The director of curriculum and instruction said she is concerned that when students rush their preparation, they do not have the opportunity to earn certifications that would allow them to be hired into jobs that would fulfill the service requirement. By rushing their training, students may set themselves up to have their TEACH Grants convert to loans.
The director of the financial aid office said that although the federally designated high-need subject area categories change infrequently, the state high-need subject area categories change more often. Consequently, a TEACH Grant recipient who enrolled in a specialized area because it was a high need in one year may find that the area is no longer considered high need by the state in the following year. A staff member from the career services office echoed this concern, indicating that the key issue for TEACH Grantees is to have the right minors and earn endorsements from the state in several high-need areas, in case the designated high-need areas change. Paying attention to these changes and being prepared to adapt has implications for students in the time needed to complete their programs which may explain why some graduates are unable to meet service requirements and have their grants converted to loans.
The institution’s staff indicated that graduates sometimes find that when they enter the workforce and take a teaching position in what is designated a high-need field, their actual work ends up being less than 50 percent in the high-need field and so it no longer qualifies as high need. This is particularly a challenge for students who want to teach in the elementary grades, in which a teacher commonly teaches all subjects, not just those classified as high need. The financial aid office director offered an example about a teacher who was prepared in K–8 mathematics.
If they’re planning to be an elementary teacher and get [a TEACH Grant], they have to make sure their employment is more than 50 percent in that high-need field. Sometimes
Study of the Teacher Education Assistance for College and Higher Education (TEACH) Grant Program
71
that’s out of their control, once they get in that environment…It’s almost like you’re buying a faulty car.
In some cases, graduates are unable to find a teaching position in a high-need area. Staff mentioned that was more common several years ago, but it still happens. When it does, the TEACH Grant recipient may not be able to keep the grant, and it may convert to a loan.
Various staff noted that some students’ grants convert to loans because they did not file the annual service commitment with the U.S. Department of Education once they were in the workforce. They believe that graduates sometimes did not realize that they had to report annually even if they were working in a high-need field or school, or if they intended to do so within the eight-year service requirement window. Some students might simply forget to file once they were in the field.
Because TEACH Grants can be used for four years, students often begin receiving the grant in their freshman year at this institution, before they may be fully committed to becoming a teacher and completing the teacher preparation program. A large number freshman at this institution received TEACH Grants during the six years prior to the 2015–16 school year. Faculty called the freshmen year a period of “discernment,” during which students participate in limited clinical experiences while they are learning what it is like to be a teacher. They indicated that although the institution attracts many potential teachers because of its reputation for educator preparation, some students may later decide that they do not want to be teachers or teach in high-need areas after they have begun accepting TEACH Grants. Those students will no longer receive TEACH Grants when their change in major is registered in the financial aid database, and the grants will convert to a loan. However, faculty and staff felt that the grant-to-loan conversion was higher at other institutions than their own, citing the school’s reputation for educator preparation and its ability to attract students with stable aspirations for teaching.
Recommendations on TEACH Grant Implementation and Requirements
Faculty and staff at the institution provided some recommendations on how to improve the administration and requirements of the TEACH Grant. One staff member said she would like to see the grant eligibility expanded to include additional factors to help recruit a more diverse teacher workforce, such as students who might be the first in their family to attend college or students from minority backgrounds. Another staff member said that given current and projected teacher shortages, expanding the TEACH Grant to include other subject areas, such as English language arts, social studies, or the arts, might be useful in increasing enrollments in teacher preparation programs.
Because they viewed the grant as challenging to administer, some institution officials discussed implementing changes to simplify the administration process. A financial aid staffer noted that the amount of paperwork the financial aid office required to process the TEACH Grant was “cumbersome” and suggested implementing more “streamlined” procedures. Several staff said that although aspects of the TEACH Grant program were challenging to administer, they agreed overall that it is an important program. One staff member said,
We thoroughly appreciate the money that’s put into this program, and it’s really helped our students. It means a lot to the students who are getting it. I know the faculty have some great stories, and I want to get some pictures of those teachers and those stories that are out in the teaching world, and what this has meant to them. I just want to reiterate: We need a program, whether this is the ideal program or not, I don't know that it is.
Study of the Teacher Education Assistance for College and Higher Education (TEACH) Grant Program
72
Large, Proprietary Institution
Site Description
This institution is a large, urban proprietary institution, in which the majority of students are enrolled in online programs. Of the approximately 70,000 students, about 20 percent take courses on campus; the rest are enrolled in online, distance programs. The institution offers several dozen programs in education that lead to an undergraduate degree and a teaching certification, along with dozens of masters’ level programs.
The institution administered approximately 50 percent of its TEACH Grants to undergraduate students, which are somewhat evenly distributed across freshman, sophomores, juniors, and seniors. The remaining 50 percent of grants were allocated to first- and second-year graduate students. Since 2009, the institution disbursed approximately 1,000 TEACH Grants, with an estimated grant-to-loan conversion rate of 65 percent. The majority of the TEACH Grants recipients are enrolled in the institution’s online program and live all over the country.
Administration of TEACH Grants
When potential students contact this institution, they speak with a representative assigned to help them through the admissions and enrollment process. The representative asks these potential students about their interests and aspirations and then guides them through a net price calculator to compare the cost to attend the institution under various parameters (e.g., whether the student will enroll full-time versus part-time and whether the student will access private loans or federal aid). If the student expresses interest in teaching in a high-need field and meets the requirements for the TEACH Grant, a pricing calculator auto-populates the TEACH Grant as a financial aid option, and the counselor may discuss the grant with students. After interested students apply and are admitted to the institution, they are again contacted by the enrollment representative or their assigned student service advisor to discuss financial requirements and processes, including for the TEACH Grant. If interested in the TEACH Grant, the student would then fill out a financial aid form. The process of applying for a TEACH Grant is entirely online. Students can go to a website, get the information, complete the forms, and submit their application.
After a student enrolls in the institution, a student services advisor replaces the online counseling role, at 21 days after the student begins taking classes. Each student has a mandatory appointment with the advisor every semester. Student services advisors then inform students about the requirements associated with the TEACH Grants.
The financial aid office monitors the student’s aid package, grade point average, and major to determine eligibility for TEACH Grants. According to financial aid staff,
Our job is to help the [student services advisors] know what they’re doing when they talk to students about it.
The financial aid office provides training and materials to other departments administering TEACH Grants, including the student services advisors. Because the definition of a high-need subject area varies from state to state, the proportion of students receiving TEACH Grants varies by state, which means some student service advisors — depending on the geographic area they cover — have more students receiving TEACH Grants than other advisers.
Study of the Teacher Education Assistance for College and Higher Education (TEACH) Grant Program
73
Use of TEACH Grants to Recruit and Assist Teacher Candidates
At this institution, TEACH Grants are not used to recruit students into the institution or into the college of education. Instead, TEACH Grants are presented to students who indicate they are interested in teaching, in a specialty area that is eligible for a TEACH Grant.
The student services advisors and the financial aid office reported that they monitor students’ eligibility to receive a TEACH Grant, which may change over time. The director of clinical placement said that the student services adviser is required to monitor a student’s program of study in relation to TEACH Grant requirements. College of education staff indicated that they also oversee the eligibility requirements for each state, in relation to the programs of study undertaken by online students. The director said that faculty and staff in the college of education work with various departments in the institution to inform them of the requirements and ensure that students learn about the requirements. However, the director of clinical practice said that students — particularly online students — are responsible for making sure their clinical placements are aligned to the high-need subject for their state.
TEACH Grant Successes and Challenges
Staff at the institution felt that TEACH Grants were a benefit for students to cover the cost of college and were serving a need in education overall. Multiple staff mentioned the institution’s net price calculator was an effective tool in counseling students to make financially responsible decisions about funding their education, including their decision on whether to accept the TEACH Grant.
Several staff members said that it is difficult to coordinate a student’s course of study when the state-level high-need subject areas change annually, especially given the institution’s number of online recipients spread throughout the country. The director of clinical placements said that the varied list of high-need subjects and certification requirements in different states made it difficult to ensure that online students were meeting the local requirements to become a teacher. For example, some states are now using edTPA, a portfolio-based assessment that requires candidates to provide a packet of their teaching work along with a video of their teaching, as the licensure examination. Other states use standardized, multiple-choice tests for licensure, and still other states have created their own licensure examinations. The variety of licensure assessment means the college of education needs to coordinate with states where their students reside so that the teacher candidates are adequately prepared to pass local licensure examinations.
Why TEACH Grants Convert to Loans
Several staff members stated that freshmen and sophomores often change majors as they progress through college. The financial aid officer said,
You’re 18 to 22 years old, and you don’t really know what you want to do. There’s a lot of changes in life at that time.
Students who received TEACH Grants early in their education programs before switching to an ineligible major would have the grant convert to a loan. Staff indicated that some students withdraw from the institution after a year or two, and these students would have TEACH Grants convert to loans.
Study of the Teacher Education Assistance for College and Higher Education (TEACH) Grant Program
74
The financial aid office recently began analyzing data on students whose grants converted to loans but does not yet have any information showing patterns or trends. The financial aid officer believed that some students did not pay attention to the information they received about TEACH Grants when they went online to learn about and apply for a grant. The financial aid officer also felt that students took the TEACH Grant because they saw it as a way to reduce college costs, without thinking about the teaching job they would have to take to fulfill the service requirements or consciously treating the grant as a loan.
In addition, one staff member thought that there might be a disconnect between the time students graduate and the time they are required to certify that they were fulfilling the service requirements, and students either did not realize they had to submit a form or forget to do so. Lastly, staff reported that students and graduates sometimes move to a different state where the subject areas under the TEACH Grant are different, thus causing grants to convert to loans since the graduate is no longer able to meet the service requirements if he or she moves.
Recommendations on TEACH Grant Implementation and Requirements
The financial aid officer explained that eliminating the state-level high-need subject areas in favor of federal high-need areas would be helpful in coordinating majors and placements for students, especially those in the online program.
Several staff members suggested modifying the structure of the grant. According to the dean, the name TEACH Grant implies that it is not a loan program, which sets up assumptions on the part of students. One official suggested awarding the grant on a prorated scale based on a student’s grade level. For example, because freshman and sophomores have more time to change their minds about teaching, recipients in those grades would receive a smaller grant, whereas, juniors and seniors, who are closer to becoming certified teachers, would receive a larger grant. In addition, he suggested forgiving the grant based on the number of years served. In this case, a TEACH Grant recipient who completed three of the four years of service in a high-need field would have only 25 percent of his or her grant converted to a loan.
One staff member recommended implementing better communication procedures with students after graduation, to help remind them to submit their annual forms if they are in the process of completing the grant requirements. Another recommendation was to have districts note on job postings if a position is in a TEACH Grant-eligible school and subject area to enable students to easily locate eligible positions.
Study of the Teacher Education Assistance for College and Higher Education (TEACH) Grant Program
75
Large, Public Institution in the West
Site Description
This institution is a large, urban public institution enrolling nearly 30,000 students. About 75 percent of the students are in state, and most of the remaining students come from neighboring states. The institution serves both undergraduate and graduate students. The institution administered the majority of its TEACH Grants to graduate students, with approximately 20 percent of the grants going to undergraduates. Since 2009, there have been about 1,000 TEACH Grant recipients with a loan-to-conversion rate of about 70 percent.
At this institution, students cannot earn a teaching credential when they receive a baccalaureate degree, so the college of education does not enroll undergraduate students. All students in the college of education are graduate students seeking a teaching credential. The institution offers several majors and minors in the college of liberal arts and sciences that are for students seeking to continue into graduate school to become teachers. The TEACH Grant is offered to eligible students who are undergraduates or graduate students pursuing teaching.
Administration of TEACH Grants
The institution’s financial office handles administration of the TEACH Grant. The financial aid counselor reported that after a student receives admission to the institution, the student can work with the financial aid office to develop a student-specific package of financial aid. Those whose major and other credentials meet the requirements for the TEACH Grant are offered the grant as part of their aid package. The financial aid counselor said that as soon as the student indicates an interest in teaching, institution officials inquire about grade point average and major so they can offer the student a TEACH Grant.
The financial aid counselor also explained that students receiving a TEACH Grant are required to participate in an online counseling session every year they receive a grant. The teacher pathways coordinator said she informs students and prospective students with an eligible major about the TEACH Grant, and she emphasizes the grant requirements. She said she urges these students to become educated about the TEACH Grant obligations before accepting the grant. She also suggests to freshmen and sophomores that they take some courses about teaching and participate in field experience activities before they commit to teaching and the obligations associated with the TEACH Grant. She went on to explain that if students are unsure about taking the grant, she suggests that if it is a choice between an unsubsidized loan or the TEACH Grant, they should take the grant. She stated,
Some students perhaps do not understand the obligations that accompany a TEACH Grant, but if they sign the agreement and say they have no questions and are eligible, there is nothing the financial aid office can do.
Use of TEACH Grants to Recruit and Assist Teacher Candidates
Financial aid officers attend college fairs and conduct welcome orientations. At these events, they hand out a federal loan flyer that describes all kinds of federal financial aid available to prospective students. The TEACH Grant is included on the flyers, and the flyer and other TEACH Grant information is available on the institution website.
Study of the Teacher Education Assistance for College and Higher Education (TEACH) Grant Program
76
The dean of education said that because the college of education has close partnerships with nearby districts, along with a commitment to preparing teachers for high-need schools, support for new teachers to meet the grant requirements is built into the school and the curriculum. The dean said that his faculty have a secondary motivation — because the school has received national accreditation, it must make preparing and placing graduates in high-need schools a priority to meet national accreditation standards.
TEACH Grant Successes and Challenges
The dean reported that the TEACH Grant is well aligned with the school’s goals because it is seeking a diverse enrollment. Almost two-thirds of students are first-generation college students, and they often require financial aid to afford college. The TEACH Grant is an attractive aid option because it is a grant, and if students fulfill the requirements, they do not have to pay it back.
School faculty and staff stated that they do not know of a way to track their graduates to support them after graduation. They also do not have information about available jobs, although the dean said the state has a website with employment opportunities.
Why TEACH Grants Convert to Loans
The financial aid counselor said she was not sure why grants convert to loans; she only has had two students call the office after graduation with concerns about why the grant was going to convert. In one case, it was because the school where the graduate was working was not considered as high need. In the other case, an error in the reporting of the graduate’s date of graduation was corrected.
The dean said that the job market in the last few years made it difficult for graduates to get a job. Schools were laying off teachers, and new teachers had trouble finding work. Other staff said that because the federal and state identification of high-need subjects changes with some regularity, graduates might find that they are not prepared to teach in a subject that qualifies. Staff speculated that in a few cases, graduates may not be fully aware of what it will be like to work as a full-time teacher, or perhaps the environment in which they are working is not a good fit for them. In those cases, it is possible that graduates simply leave teaching and therefore not meeting the TEACH Grant requirements.
According to the teacher pathway coordinator, some students take the money knowing it will eventually convert to a loan, but they need it at the time to pay for their education. She mentioned that because the college of education and TEACH Grant primarily serve graduate students at the institution, many forego working full time and have families to support, so they need as much financial aid as possible. Many reach their loan limits, so they use the TEACH Grant to supplement their financial aid and do not care about the grant converting to a loan because they would have taken a loan anyway.
Recommendations on TEACH Grant Implementation and Requirements
The dean said it would be helpful if there were a way to track their graduates. He said the state has already begun to work on a process for that, but 20 percent of the institution’s graduates leave the state to teach. If the federal government could help track graduates, that would help the college of education obtain data and support graduates.
Study of the Teacher Education Assistance for College and Higher Education (TEACH) Grant Program
77
Appendix C. Data Sources, Data Collection Activities, Data Processing, and Analysis Methods
Data for this study were derived from several sources: extant data, the Institution of Higher Education (IHE) Survey, the TEACH Grant Recipient Survey, and qualitative interviews with institutional staff. This appendix describes the various data sources, the procedures for collecting and processing these data, and the analysis methods used to address the research questions.
Data Sources
Extant Data
Extant data were gathered from the Federal Student Aid National Student Loan Data System (NSLDS) and the TEACH Grant servicer, the Pennsylvania Higher Education Assistance Agency (PHEAA). These extant files were used in combination to identify eligible institutions for the qualitative interviews, establish the target populations for the IHE Survey and the TEACH Grant Recipient Survey, and serve as a source of data included in the analyses.
The PHEAA file contained data on 258,960 grants awarded to 138,286 recipients from 2008 (the inception of the program) through the 2015–16 award year as of June 2016. The data elements included the recipient, the institution awarding the grant, the academic level of the recipient, the award date and amount, the date that service obligation period began (based on when students separate from their institution), the current status (e.g., loan conversion), and the conversion date.
In order to examine conversion rates for an appropriate group of TEACH Grant recipients (that is, those that had either completed or withdrawn from the postsecondary program for which they received the TEACH Grant), we removed grants and recipients that did not meet certain criteria from the dataset. First, we removed 113,405 grants awarded to 59,562 recipients that had a start obligation date on or after July 1, 2014, resulting in a data file with 145,555 grants awarded to 78,724 recipients.20 We also removed 893 recipients that had one or more grants recorded in the PHEAA file with a current status of “death,” “disability,” “canceled,” or “life circumstance.” This data file was merged with the NSLDS file, which provided demographic information on each grant recipient as of August 2015.21
The resulting data file containing 77,831 recipients and 78,623 records was used in this report’s extant data analysis to calculate grant-to-loan conversion rates among various segments of the recipient population.22 Recipients with one or more grants with a current status of “loan” were designated as 20 Records that were missing a service obligation start date (approximately 8,500 records) were not removed because the
missing date likely indicated that their grant had been converted to a loan prior to the 2013 transition between federal loan servicers managing the grant.
21 Due to limitations in data transfer during the transition, about 5,000 NSLDS records of TEACH Grant recipients who converted or satisfied their grants in full prior to the transition did not have corresponding records in the PHEAA data; these recipients were excluded from the merged file because of the lack of data regarding their current conversion status.
22 Note that the unit of analysis for the conversion rate analysis is based on records rather than recipients. Each record represents a unique combination of recipient and institution, and recipients that received awards from multiple institutions would have more than one record.
Study of the Teacher Education Assistance for College and Higher Education (TEACH) Grant Program
78
“recipients in loan status” for the purpose of this analysis, and the remaining recipients were designated as “recipients in grant status.”23
IHE Survey
The IHE Survey conducted for this study was a universe survey of all 472 institutions that awarded TEACH Grants to at least 10 recipients during the 2014–15 award year, according to data from the Federal Student Aid Title IV Grant Volume Report for academic year 2014–15 as of July 2015. These 472 institutions accounted for 95 percent of all grant recipients for that year (out of the 788 institutions that awarded grants).
TEACH Grant Recipient Survey
The sampling frame for the TEACH Grant Recipient Survey was based on the 77,831 recipients in the data file described in the Extant Data section above. In order to provide a suitable sampling frame for administering this survey, we removed 14,808 recipients from the frame for the following reasons:
• Recipients who received grants at institutions that awarded grants to fewer than 10 students in 2014–15, because these institutions were not examined in the survey component of this study (approximately 7,000 recipients).
• Recipients for which we were not able to obtain reliable contact information through an initial query of PHEAA databases (approximately 8,000 recipients).24
The resulting sampling frame of 63,023 recipients contained 37,131 recipients whose grants had been converted to loans (i.e., recipients in loan status) and 25,892 recipients who had already completed or were in the process of completing the grant requirements (i.e., recipients in grant status).
The actual TEACH Grant Recipient Survey sample included 500 total recipients: 250 recipients in loan status and 250 recipients in grant status. The study aimed to achieve a 70 percent response rate for both halves of the sample to have power to detect differences between these two groups at a 90 percent confidence level. The TEACH Grant Recipient Survey sample design included three-level stratification:
• Grant-to-loan conversion status
– Service requirements either completed or in progress (i.e., recipients in grant status)
– Loan conversion (i.e., recipients in loan status)
• Sector of institution that awarded first TEACH Grant
– Public
– Private-nonprofit
– Proprietary 23 A very small number of recipients had some but not all grants converted to loans. 24 An analysis of the demographic characteristics of these records from the NSLDS indicated that these excluded records were
generally representative of the entire population of recipients, with the exception of the timeframe of loan conversion. Specifically, those who did not have contact information tended to be those who converted prior to the transition of servicers in 2013.
Study of the Teacher Education Assistance for College and Higher Education (TEACH) Grant Program
79
• Geographical region of the institution25 that awarded the first TEACH Grant26
– Northeast (Connecticut, District of Columbia, Delaware, Massachusetts, Maryland, Maine, New Jersey, New York, Pennsylvania, Virginia, and West Virginia)
– Southeast (Alabama, Florida, Georgia, Kentucky, Louisiana, Mississippi, North Carolina, Puerto Rico, South Carolina, and Tennessee)
– Midwest (Iowa, Illinois, Indiana, Kansas, Michigan, Minnesota, Missouri, North Dakota, Nebraska, New Hampshire,27 Ohio, South Dakota, and Wisconsin)
– Southwest (Arkansas, Arizona, New Mexico, Oklahoma, and Texas)
– West (Alaska, California, Colorado, Guam, Hawaii, Idaho, Northern Mariana Islands, Nevada, Oregon, Utah, and Washington)
The geographic region indicator was merged into the recipient survey sample frame from the institution universe file provided by the Department. To ensure at least two cases in each stratum, the Southwest and West regions were collapsed, resulting in four regions. The sample design resulted in 22 strata because no proprietary institutions in the Northeast were represented in the study. Exhibit C1 shows the distribution of the sample frame across those 22 strata.
25 The geographic region of the institution is based on the location of main campus of an institution; however, institutions may
have satellite campuses in other locations and/or enroll a significant number of distance education students who could be in any region (or even outside the United States).
26 Four states (Montana, Rhode Island, Vermont, and Wyoming) are not listed because no institutions from those four states were in the study universe.
27 New Hampshire was included in the Midwest region in error. Only one institution with 100 total recipients from 2008 to 2014 was misclassified, and only one of these recipients was selected for the TEACH Grant Recipient Survey sample.
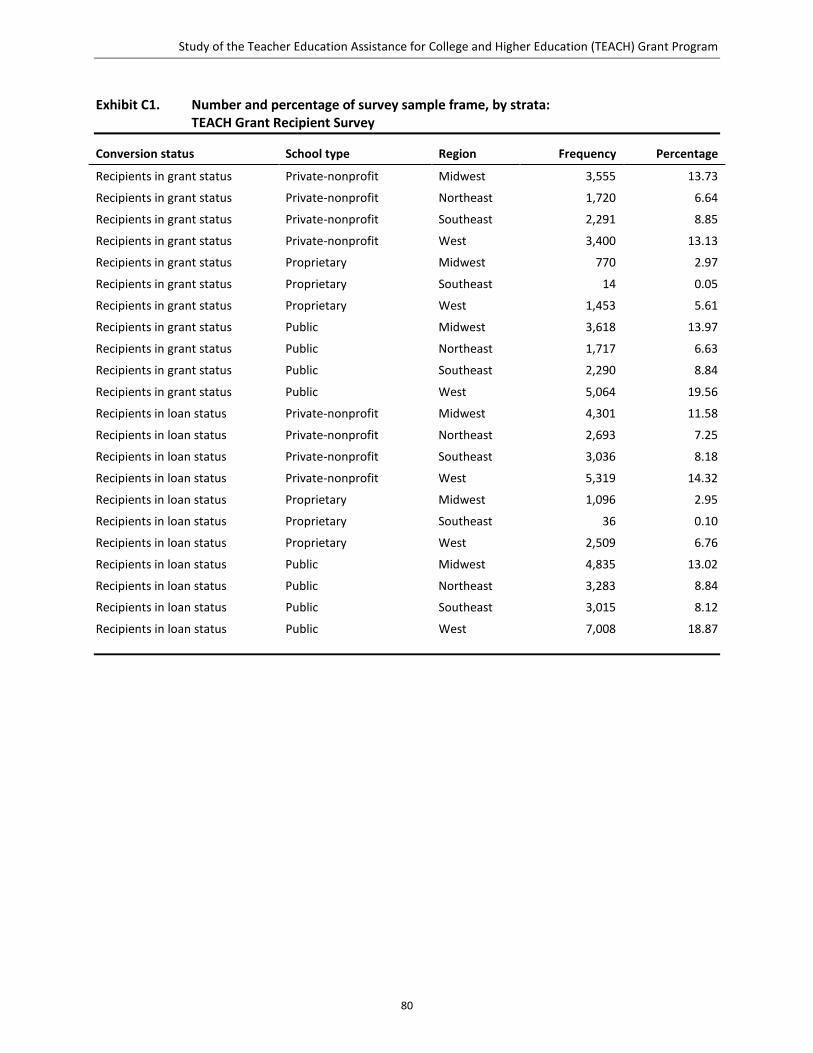
Study of the Teacher Education Assistance for College and Higher Education (TEACH) Grant Program
80
Exhibit C1. Number and percentage of survey sample frame, by strata: TEACH Grant Recipient Survey
Conversion status School type Region Frequency Percentage
Recipients in grant status Private-nonprofit Midwest 3,555 13.73
Recipients in grant status Private-nonprofit Northeast 1,720 6.64
Recipients in grant status Private-nonprofit Southeast 2,291 8.85
Recipients in grant status Private-nonprofit West 3,400 13.13
Recipients in grant status Proprietary Midwest 770 2.97
Recipients in grant status Proprietary Southeast 14 0.05
Recipients in grant status Proprietary West 1,453 5.61
Recipients in grant status Public Midwest 3,618 13.97
Recipients in grant status Public Northeast 1,717 6.63
Recipients in grant status Public Southeast 2,290 8.84
Recipients in grant status Public West 5,064 19.56
Recipients in loan status Private-nonprofit Midwest 4,301 11.58
Recipients in loan status Private-nonprofit Northeast 2,693 7.25
Recipients in loan status Private-nonprofit Southeast 3,036 8.18
Recipients in loan status Private-nonprofit West 5,319 14.32
Recipients in loan status Proprietary Midwest 1,096 2.95
Recipients in loan status Proprietary Southeast 36 0.10
Recipients in loan status Proprietary West 2,509 6.76
Recipients in loan status Public Midwest 4,835 13.02
Recipients in loan status Public Northeast 3,283 8.84
Recipients in loan status Public Southeast 3,015 8.12
Recipients in loan status Public West 7,008 18.87
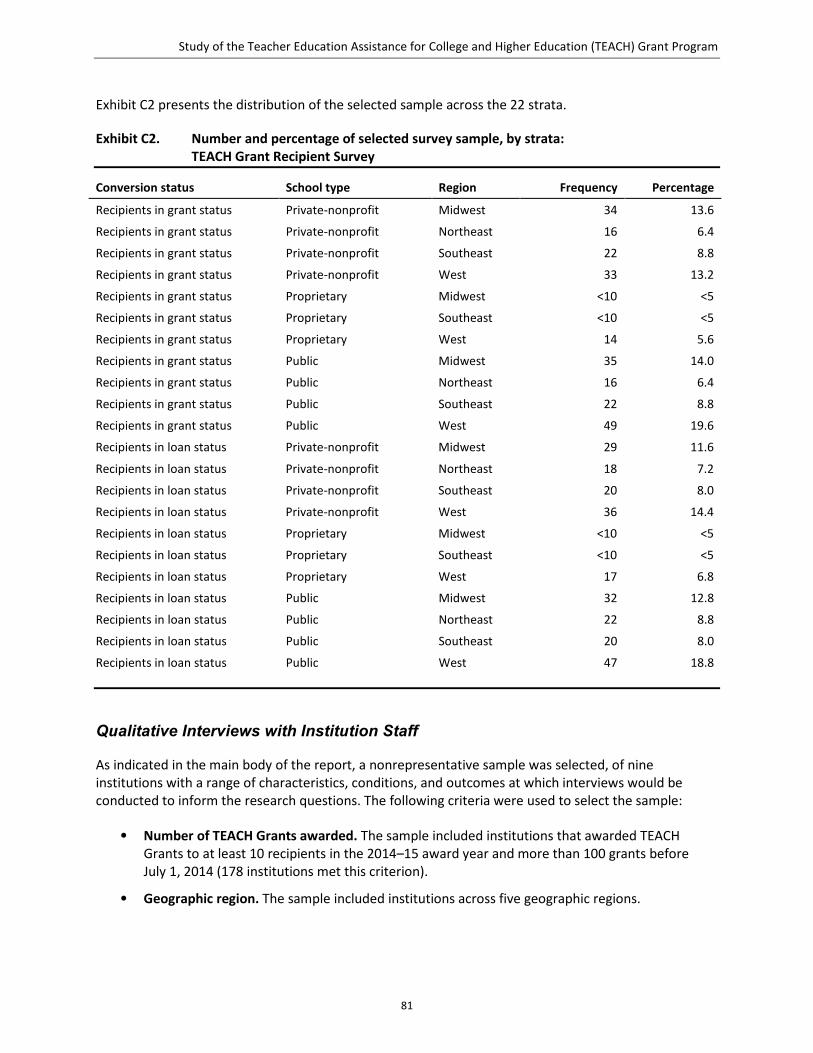
Study of the Teacher Education Assistance for College and Higher Education (TEACH) Grant Program
81
Exhibit C2 presents the distribution of the selected sample across the 22 strata.
Exhibit C2. Number and percentage of selected survey sample, by strata: TEACH Grant Recipient Survey
Conversion status School type Region Frequency Percentage
Recipients in grant status Private-nonprofit Midwest 34 13.6
Recipients in grant status Private-nonprofit Northeast 16 6.4
Recipients in grant status Private-nonprofit Southeast 22 8.8
Recipients in grant status Private-nonprofit West 33 13.2
Recipients in grant status Proprietary Midwest <10 <5
Recipients in grant status Proprietary Southeast <10 <5
Recipients in grant status Proprietary West 14 5.6
Recipients in grant status Public Midwest 35 14.0
Recipients in grant status Public Northeast 16 6.4
Recipients in grant status Public Southeast 22 8.8
Recipients in grant status Public West 49 19.6
Recipients in loan status Private-nonprofit Midwest 29 11.6
Recipients in loan status Private-nonprofit Northeast 18 7.2
Recipients in loan status Private-nonprofit Southeast 20 8.0
Recipients in loan status Private-nonprofit West 36 14.4
Recipients in loan status Proprietary Midwest <10 <5
Recipients in loan status Proprietary Southeast <10 <5
Recipients in loan status Proprietary West 17 6.8
Recipients in loan status Public Midwest 32 12.8
Recipients in loan status Public Northeast 22 8.8
Recipients in loan status Public Southeast 20 8.0
Recipients in loan status Public West 47 18.8
Qualitative Interviews with Institution Staff
As indicated in the main body of the report, a nonrepresentative sample was selected, of nine institutions with a range of characteristics, conditions, and outcomes at which interviews would be conducted to inform the research questions. The following criteria were used to select the sample:
• Number of TEACH Grants awarded. The sample included institutions that awarded TEACH Grants to at least 10 recipients in the 2014–15 award year and more than 100 grants before July 1, 2014 (178 institutions met this criterion).
• Geographic region. The sample included institutions across five geographic regions.

Study of the Teacher Education Assistance for College and Higher Education (TEACH) Grant Program
82
• Distance learning. The sample included one institution classified as a distance-learning institution, which is defined as 75 percent or more of the students enrolled in distance education coursework.
• Sector. The sample included five public institutions, three private institutions, and one proprietary institution.
• TEACH Grant-to-loan conversion rates. The sample included institutions with both higher and lower percentages of TEACH Grants that converted to loans. The average grant-to-loan conversion rate for the population of 178 institutions that met the first criterion for inclusion was 56 percent. The nine-site sample included four institutions with rates at or above the average and five below the average. Grant-to-loan conversion rates ranged from approximately 40 percent to 70 percent.
• Academic levels of the TEACH Grant recipients. The sample included institutions that administered TEACH Grants to students at various academic levels in their institution enrollment (e.g., freshman year, senior year, or graduate level).
After the first six institutions were selected based on these criteria; three additional institutions were selected that administered fewer than 100 TEACH Grants with lower than average grant-to-loan conversion rates. The Technical Working Group members indicated that institutions administering small numbers of grants may do so deliberately and have different responses to questions related to implementation. In lieu of site visits, phone interviews were conducted with deans and financial aid officers from these three institutions.
Exhibit C3 lists the interviewed institutions by key factors and displays the data used to select the sample.
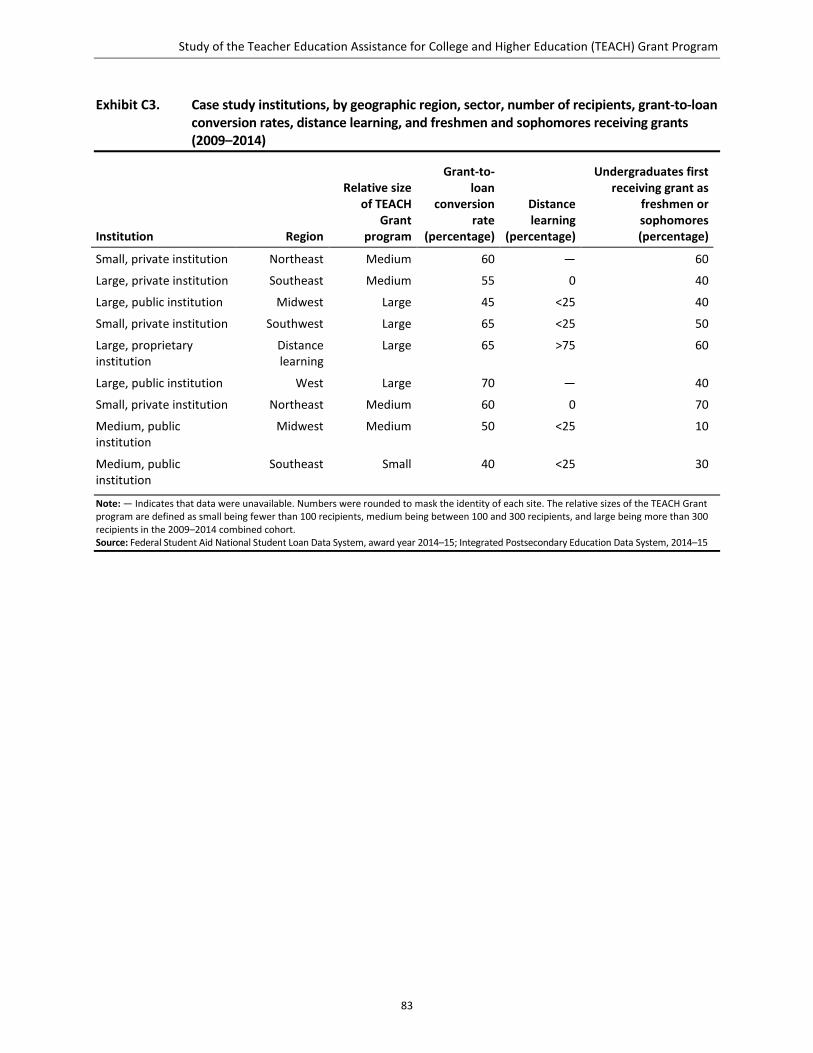
Study of the Teacher Education Assistance for College and Higher Education (TEACH) Grant Program
83
Exhibit C3. Case study institutions, by geographic region, sector, number of recipients, grant-to-loan conversion rates, distance learning, and freshmen and sophomores receiving grants (2009–2014)
Institution Region
Relative size of TEACH
Grant program
Grant-to-loan
conversion rate
(percentage)
Distance learning
(percentage)
Undergraduates first receiving grant as
freshmen or sophomores (percentage)
Small, private institution Northeast Medium 60 — 60
Large, private institution Southeast Medium 55 0 40
Large, public institution Midwest Large 45 <25 40
Small, private institution Southwest Large 65 <25 50
Large, proprietary institution
Distance learning
Large 65 >75 60
Large, public institution West Large 70 — 40
Small, private institution Northeast Medium 60 0 70
Medium, public institution
Midwest Medium 50 <25 10
Medium, public institution
Southeast Small 40 <25 30
Note: — Indicates that data were unavailable. Numbers were rounded to mask the identity of each site. The relative sizes of the TEACH Grant program are defined as small being fewer than 100 recipients, medium being between 100 and 300 recipients, and large being more than 300 recipients in the 2009–2014 combined cohort. Source: Federal Student Aid National Student Loan Data System, award year 2014–15; Integrated Postsecondary Education Data System, 2014–15
Study of the Teacher Education Assistance for College and Higher Education (TEACH) Grant Program
84
Data Collection Activities
Questionnaire Design
The IHE Survey focused on the institutional goals of the TEACH Grant, the institutional units or departments that are responsible for administering the grants, and the specific roles (e.g., counseling students about the program and providing job placement services) that each unit performs. Because of the information that respondents may have needed to gather from institutional colleagues, the estimated average completion time for this survey was about 60 minutes. The TEACH Grant Recipient Survey mainly asked about how informed recipients were about the program requirements at various points in their education, how influential the program was in their career pursuit decisions, and which factors influenced the likelihood of completing the service requirements of the program. The estimated average completion time for the TEACH Grant Recipient Survey was about 10 minutes.
Both questionnaires were not tested prior to being fielded due to the compressed schedule from development to deployment of the questionnaires. Both questionnaires were originally designed as hard-copy, paper instruments; to enable a mixed-mode data collection through online and paper modes, the structure and skip logic of many items (mostly in the IHE Survey) were modified to be compatible with survey data collection software. For example, the IHE Survey contained a series of items that looped through a “grid” question for each unit or department. In the online survey, one “mark-all-that-apply” filter question determined which units or departments were relevant to the respondent, whereas in the paper survey, separate yes or no filter questions about each unit or department appeared before each grid question. The questionnaires for both surveys, as adapted for online administration, can be found in Appendix D.
Survey Operations
IHE Survey On May 31, 2016, the survey invitation letters were sent by U.S. Postal Service first-class mail on U.S. Department of Education letterhead. This letter was addressed to the Federal Aid Administrator at each selected institution, based on information provided to NSLDS by the Postsecondary Education Participants System as of January 2016. Each invitation letter included a personalized URL to the online survey for the institution. Five reminder emails were sent to those Federal Aid Administrators who had not yet responded by the dates indicated in Exhibit C4. The reminder email on August 3, 2016, was sent by the project officer at the Department; all other reminder emails were sent by the study team at AIR. A paper questionnaire was sent by first-class mail to 306 nonrespondents on July 1, 2016. From July 7 through July 26, 2016, telephone calls were placed to nonresponding Federal Aid Administrators to verify that they had received the study information and remind them to complete the survey. During this period, nonrespondents received up to eight call attempts, with a median of five. During this telephone calling effort, about 40 institutions were identified for which the contact person invited to complete the survey was incorrect, and the new contact person was subsequently invited by email to complete the survey. Survey data collection closed on August 31, 2016. See Appendix D for all invitation and reminder materials sent to sample members.
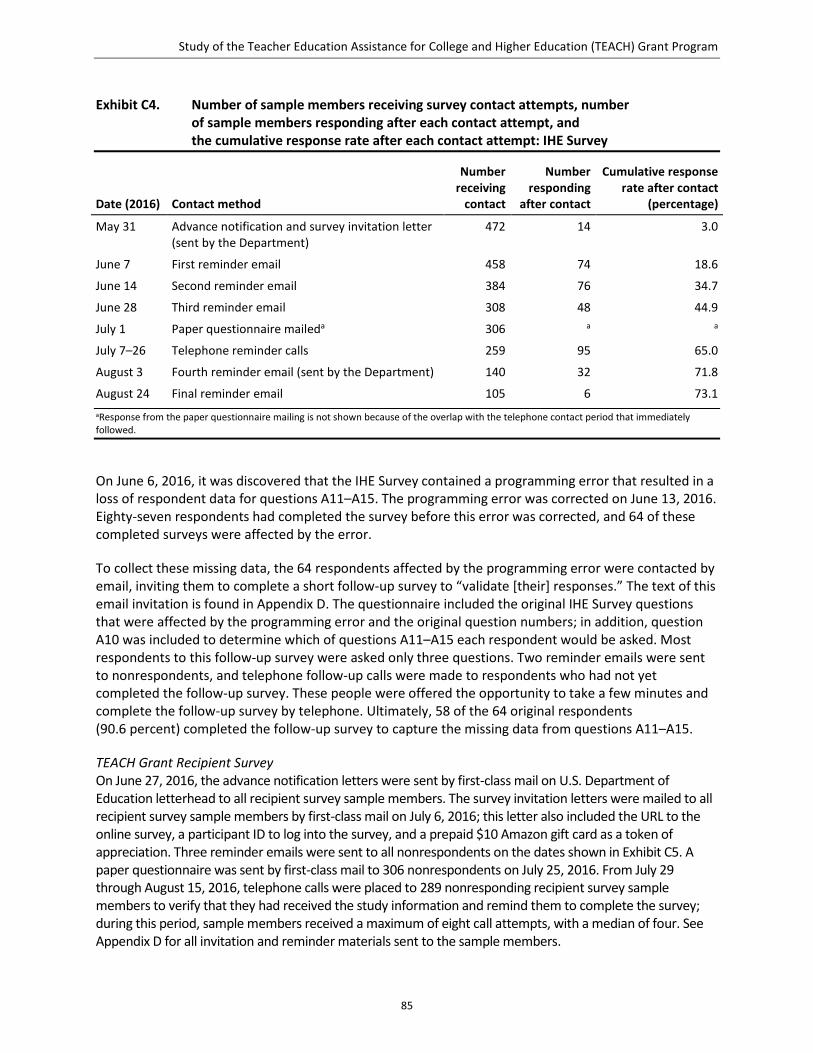
Study of the Teacher Education Assistance for College and Higher Education (TEACH) Grant Program
85
Exhibit C4. Number of sample members receiving survey contact attempts, number of sample members responding after each contact attempt, and the cumulative response rate after each contact attempt: IHE Survey
Date (2016) Contact method
Number receiving
contact
Number responding
after contact
Cumulative response rate after contact
(percentage)
May 31 Advance notification and survey invitation letter (sent by the Department)
472 14 3.0
June 7 First reminder email 458 74 18.6
June 14 Second reminder email 384 76 34.7
June 28 Third reminder email 308 48 44.9
July 1 Paper questionnaire maileda 306 a a
July 7–26 Telephone reminder calls 259 95 65.0
August 3 Fourth reminder email (sent by the Department) 140 32 71.8
August 24 Final reminder email 105 6 73.1 aResponse from the paper questionnaire mailing is not shown because of the overlap with the telephone contact period that immediately followed.
On June 6, 2016, it was discovered that the IHE Survey contained a programming error that resulted in a loss of respondent data for questions A11–A15. The programming error was corrected on June 13, 2016. Eighty-seven respondents had completed the survey before this error was corrected, and 64 of these completed surveys were affected by the error.
To collect these missing data, the 64 respondents affected by the programming error were contacted by email, inviting them to complete a short follow-up survey to “validate [their] responses.” The text of this email invitation is found in Appendix D. The questionnaire included the original IHE Survey questions that were affected by the programming error and the original question numbers; in addition, question A10 was included to determine which of questions A11–A15 each respondent would be asked. Most respondents to this follow-up survey were asked only three questions. Two reminder emails were sent to nonrespondents, and telephone follow-up calls were made to respondents who had not yet completed the follow-up survey. These people were offered the opportunity to take a few minutes and complete the follow-up survey by telephone. Ultimately, 58 of the 64 original respondents (90.6 percent) completed the follow-up survey to capture the missing data from questions A11–A15.
TEACH Grant Recipient Survey On June 27, 2016, the advance notification letters were sent by first-class mail on U.S. Department of Education letterhead to all recipient survey sample members. The survey invitation letters were mailed to all recipient survey sample members by first-class mail on July 6, 2016; this letter also included the URL to the online survey, a participant ID to log into the survey, and a prepaid $10 Amazon gift card as a token of appreciation. Three reminder emails were sent to all nonrespondents on the dates shown in Exhibit C5. A paper questionnaire was sent by first-class mail to 306 nonrespondents on July 25, 2016. From July 29 through August 15, 2016, telephone calls were placed to 289 nonresponding recipient survey sample members to verify that they had received the study information and remind them to complete the survey; during this period, sample members received a maximum of eight call attempts, with a median of four. See Appendix D for all invitation and reminder materials sent to the sample members.
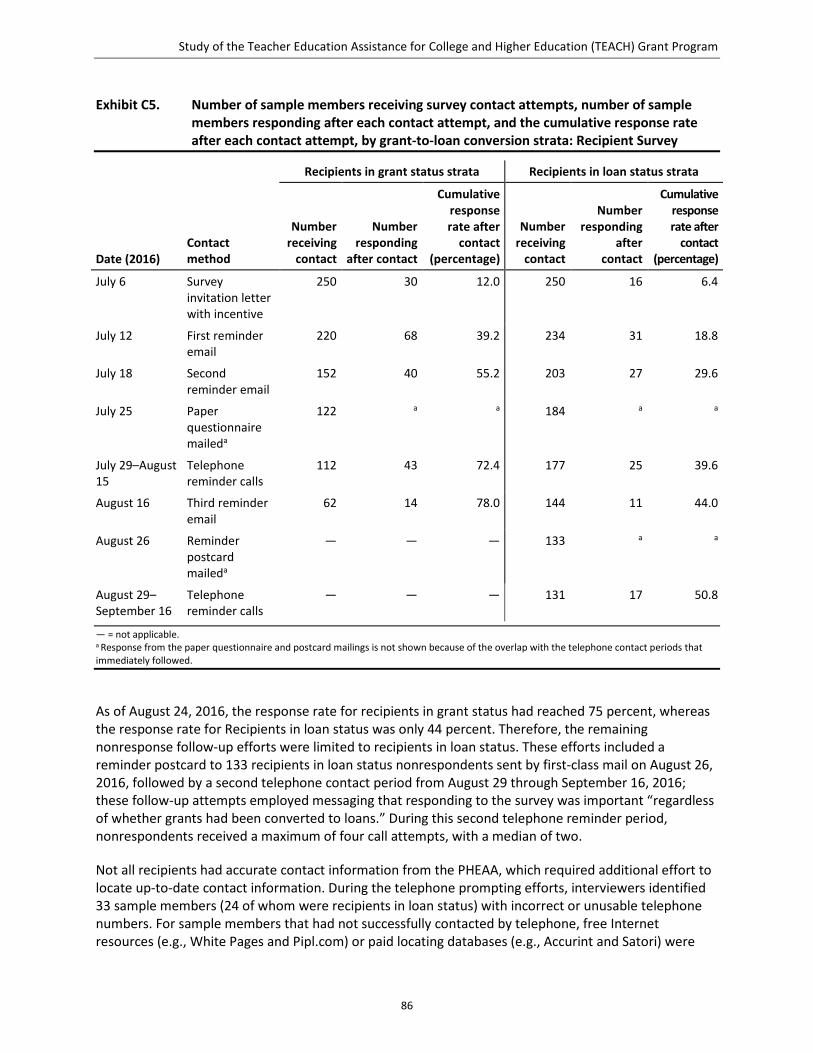
Study of the Teacher Education Assistance for College and Higher Education (TEACH) Grant Program
86
Exhibit C5. Number of sample members receiving survey contact attempts, number of sample members responding after each contact attempt, and the cumulative response rate after each contact attempt, by grant-to-loan conversion strata: Recipient Survey
Date (2016) Contact method
Recipients in grant status strata Recipients in loan status strata
Number receiving
contact
Number responding
after contact
Cumulative response rate after
contact (percentage)
Number receiving
contact
Number responding
after contact
Cumulative response rate after
contact (percentage)
July 6 Survey invitation letter with incentive
250 30 12.0 250 16 6.4
July 12 First reminder email
220 68 39.2 234 31 18.8
July 18 Second reminder email
152 40 55.2 203 27 29.6
July 25 Paper questionnaire maileda
122 a a 184 a a
July 29–August 15
Telephone reminder calls
112 43 72.4 177 25 39.6
August 16 Third reminder email
62 14 78.0 144 11 44.0
August 26 Reminder postcard maileda
— — — 133 a a
August 29–September 16
Telephone reminder calls
— — — 131 17 50.8
— = not applicable. a Response from the paper questionnaire and postcard mailings is not shown because of the overlap with the telephone contact periods that immediately followed.
As of August 24, 2016, the response rate for recipients in grant status had reached 75 percent, whereas the response rate for Recipients in loan status was only 44 percent. Therefore, the remaining nonresponse follow-up efforts were limited to recipients in loan status. These efforts included a reminder postcard to 133 recipients in loan status nonrespondents sent by first-class mail on August 26, 2016, followed by a second telephone contact period from August 29 through September 16, 2016; these follow-up attempts employed messaging that responding to the survey was important “regardless of whether grants had been converted to loans.” During this second telephone reminder period, nonrespondents received a maximum of four call attempts, with a median of two.
Not all recipients had accurate contact information from the PHEAA, which required additional effort to locate up-to-date contact information. During the telephone prompting efforts, interviewers identified 33 sample members (24 of whom were recipients in loan status) with incorrect or unusable telephone numbers. For sample members that had not successfully contacted by telephone, free Internet resources (e.g., White Pages and Pipl.com) or paid locating databases (e.g., Accurint and Satori) were
Study of the Teacher Education Assistance for College and Higher Education (TEACH) Grant Program
87
used to attempt to locate them. Updated contact information was obtained from PHEAA for 44 recipients in loan status in late August. In total, new contact information was obtained for 112 sample members, 86 of which were recipients in loan status. Of these 112 sample members with new information, 16 ultimately completed the survey; nine of the 16 were recipients in loan status.
Survey data collection for the TEACH Grant Recipient Survey closed on September 26, 2016.
Final Dispositions and Response Rates
IHE Survey For the IHE Survey, a “complete” was defined as all questions having been asked (as appropriate based on skip logic) and the respondent answered at least one question. Therefore, surveys in which respondents stopped in the middle and were not asked all the questions (i.e., a partial survey) were considered incomplete. Of the 472 institutions invited to participate, 345 institutions completed the survey, consisting of 324 online surveys and 21 paper surveys. Response rates were calculated using response rate 1 from the American Association for Public Opinion Research (2015): dividing the number of completes by the number of all eligible sample cases. To be eligible, an institution had to have awarded TEACH Grants to at least 10 recipients in the 2014–15 academic year. No ineligible sample members were identified because the universe was established with known eligibility and therefore the response rate was calculated as the number of complete surveys divided by the sample size. The final response rate to the IHE Survey was 73 percent.
TEACH Grant Recipient Survey For the TEACH Grant Recipient Survey, a “complete” was defined as all questions having been asked (as appropriate based on skip logic) and the respondent answered at least one question. Therefore, surveys in which respondents stopped in the middle and were not asked all the questions (i.e., a partial survey) were considered incomplete. Of the 500 sampled recipients, 322 completed surveys were received, of which 296 were completed online, and 26 were completed on paper. As with the IHE Survey, response rates were calculated using AAPOR response rate 1. The eligibility criteria were to have (1) received a TEACH Grant between 2008 and 2014 from one of the 472 institutions included in the study and (2) started the service obligation period prior to July 1, 2014. No ineligible sample members were identified because the starting sample was drawn from known eligibility. The final overall response rate to the TEACH Grant Recipient Survey was 64 percent. The response rate among recipients in grant status was 78 percent. The response rate among recipients in loan status was 51 percent.
Qualitative Interview Data Collection Activities
To answer questions about how institutions administer TEACH Grants and to investigate reasons and factors associated with whether TEACH Grant recipients were meeting or not meeting the grant requirements, site visits were conducted at six of nine institutions and telephone interviews with the three additional institutions. Site visits consisted of interviews with deans of education, teaching program coordinators, field placement coordinators, job placement counselors, financial aid officers, and other institutional staff involved in the administration of the grant. To identify interviewees, deans of education and financial aid directors were contacted to identify additional staff involved in TEACH Grant administration and serving in counseling and placement roles. Exhibit C6 includes the number and types of interviews conducted by site.
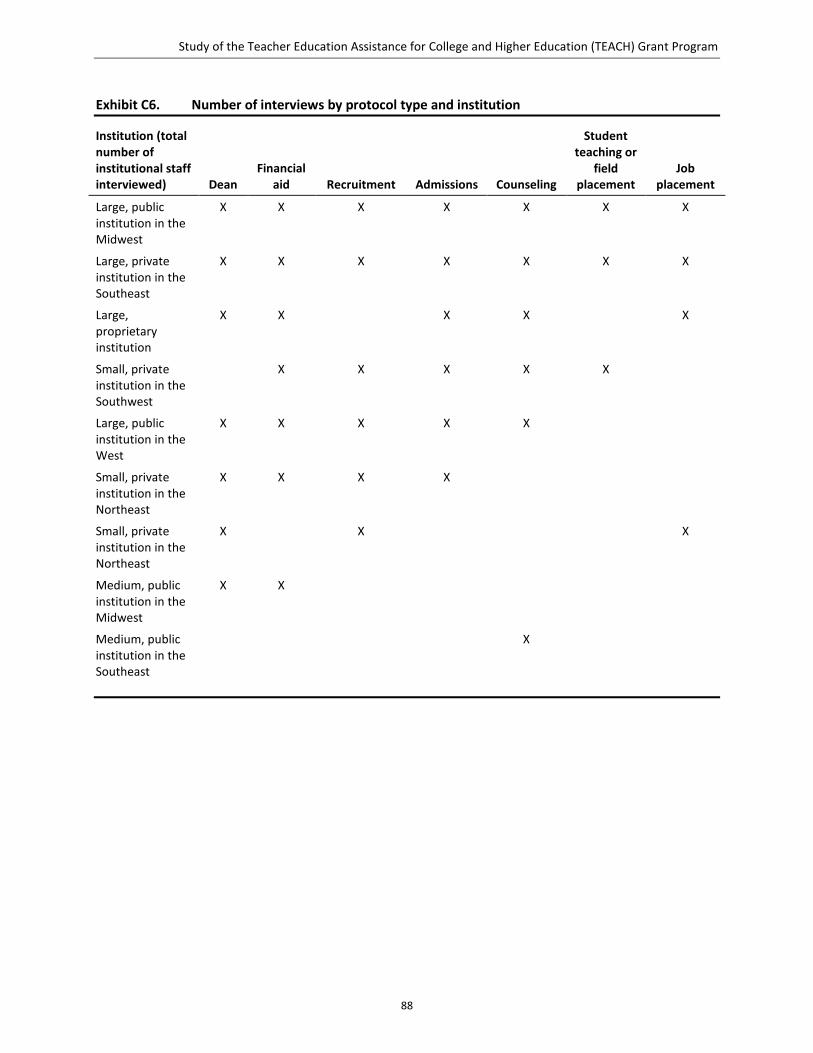
Study of the Teacher Education Assistance for College and Higher Education (TEACH) Grant Program
88
Exhibit C6. Number of interviews by protocol type and institution
Institution (total number of institutional staff interviewed) Dean
Financial aid Recruitment Admissions Counseling
Student teaching or
field placement
Job placement
Large, public institution in the Midwest
X X X X X X X
Large, private institution in the Southeast
X X X X X X X
Large, proprietary institution
X X X X X
Small, private institution in the Southwest
X X X X X
Large, public institution in the West
X X X X X
Small, private institution in the Northeast
X X X X
Small, private institution in the Northeast
X X X
Medium, public institution in the Midwest
X X
Medium, public institution in the Southeast
X
Study of the Teacher Education Assistance for College and Higher Education (TEACH) Grant Program
89
Protocol Development Semistructured interview protocols were developed for each respondent group. The protocols consisted of open-ended questions, aligned with the research questions, intended to gather contextual, in-depth information about TEACH Grant administration. The protocol questions and probes investigated how institutions implemented the grant across varying institution departments and actors, as well as how institution policies and practices contributed to successful grant fulfillment or high grant-to-loan conversion rates. The protocol questions and probes were designed to elicit information about challenges and best practices associated with grant administration and fulfillment of the grant requirements.
Conducting Interviews To prepare for each visit and facilitate and streamline the interviews with respondents, site visit teams reviewed the key features of the site and its TEACH Grant program, as well as relevant information from institution websites (such as teacher education program recruitment materials, TEACH Grant informational materials, and other program- or policy-related documents). The teams annotated each section of the individual interview protocols accordingly. These annotated notes were used to tailor the wording of each question, as appropriate. The use of experienced interviewers, coupled with careful preparation, ensured that the interviews were not “canned” or overly formal. When possible, both members of each site visit team attended all interviews. In some instances, site visitors conducted interviews separately when schedules did not permit both visitors to participate in the same interviews. In addition, each interview was audio recorded and transcribed with permission from the respondents.
Data Management After completing each site visit, the site visit team members saved audio recordings to a secure file server. One member of the study team was responsible for maintaining the files and sent the files for transcription.
Quality Control The case study data collection process used the following quality control procedures: (1) weekly site visit debriefings among the team to identify and problem-solve logistical and data collection concerns; (2) a formal tracking system to ensure that the teams were collecting the required data from each site; and (3) adherence to the timely cleaning and posting of interview notes and written observations, as well as interview audio transcripts, to a secure project website for task leaders to check for completeness and consistency.
Data Processing
Weighting Adjustments
Base Weights Because the IHE Survey was a universe survey (all 472 eligible institutions were sampled for the survey), the base weight for all cases was 1. In contrast, the TEACH Grant Recipient Survey used a stratified sample (as described earlier in this appendix). Five hundred recipients from approximately 63,000 eligible recipients were selected into the sample. The base weight for each case was calculated as follows:
𝐵𝐵𝐵𝐵ℎ𝑖𝑖 =𝑁𝑁ℎ𝑛𝑛ℎ
where BWhi is the base weight, nh is the number of sampled cases in stratum h, and, Nh is the total number of cases in stratum h.
Study of the Teacher Education Assistance for College and Higher Education (TEACH) Grant Program
90
Nonresponse Bias Analysis and Nonresponse Weighting Adjustments Nonresponses occurred in both the IHE Survey and the TEACH Grant Recipient Survey (as described previously). Two types of nonresponses could occur. Unit nonresponse refers to the fact that not all sampled units responded to the survey, whereas item nonresponse could occur when units that responded to the survey but did not provide responses to some items. Only unit response is evaluated here; no adjustments were made to account for item nonresponse. The term nonresponse represents unit nonresponse.
Nonresponse can be dangerous to the accuracy of survey estimates if any difference in the outcome variable exists between respondents and nonrespondents. This can cause a systematic deviation of a survey estimate from the population value. This systematic deviation is called nonresponse bias, which can be measured as follows:
𝐵𝐵(𝑦𝑦�𝑟𝑟) = (𝑛𝑛𝑛𝑛𝑟𝑟/𝑛𝑛)(𝑦𝑦�𝑟𝑟 − 𝑦𝑦�𝑛𝑛𝑟𝑟)
where B is the nonresponse bias, 𝑦𝑦�𝑟𝑟 is the mean estimate for the respondents, 𝑦𝑦�𝑛𝑛𝑟𝑟 is the mean estimate for the nonrespondents, 𝑛𝑛𝑛𝑛𝑟𝑟 is the number of nonrespondents, and 𝑛𝑛 is the total number of sampled units. In other words, nonresponse bias may occur if the outcome variables correlate with response propensity (i.e., the likelihood of response).
However, because information on the outcome variables was not available for nonrespondents, other information on the sampling frame was used to assess the nonresponse bias. A classification and regression tree (CART) was used to identify variables on the sampling frame that correlated with response status. Using available covariates, CART classified cases into classes that were related to their likelihood of being respondents. The algorithm, using the R package rpart (Therneau, Atkinson, and Ripley 2015), recursively partitioned cases into classes based on the association of the covariates and the response status.
For the IHE Survey, CART selected the following variables as being predictive of the response status based on the criterion of stopping the model-building or model-splitting process (thus stopping the variable selection) when the measure of fit does not improve:
• The percentage of recipients with at least one TEACH Grant in grant status
• The percentage of recipients who had independent status based on the first demographic profile on record
• The percentage of recipients who had a completion event in NSLDS after receiving a TEACH Grant at any institution
• The percentage of recipients who received a federal loan at the institution
• The percentage of recipients who were female based on the first demographic profile on record
• The percentage of recipients who were first-generation students based on the first demographic profile on record
• Region (Midwest, Northeast, Southwest, Southeast, or West)
• The percentage of recipients who ever received a Pell Grant in their academic career
• The percentage of recipients with at least one TEACH Grant in loan status
Study of the Teacher Education Assistance for College and Higher Education (TEACH) Grant Program
91
CART considered but did not select the following variables:
• The number of grant recipients in the 2014–15 academic year
• The average number of TEACH Grants per recipient (calculated by grants/recipients)
• School type (public, private, or for-profit)
For a small number of institutions, some data were missing. Because the missing rates were low (not more than 1 percent for any variable), these variables were imputed using a simple linear regression imputation. Missing data in each variable were imputed as follows:
• The variable was regressed on nonmissing variables school type, region, and number of TEACH Grant recipients in the 2014–15 academic year, using nonmissing cases only.
• Cases with missing data for the variable were imputed with the predicted value from the regression model.
This imputation did not noticeably change the distribution of any variable.
For the TEACH Grant Recipient Survey, CART selected the following variables as being predictive of the response status based on the criterion of stopping the model-building or model-splitting process (thus stopping the variable selection) when the measure of fit does not improve:
• Difference in number of years between earliest award year of any converted TEACH Grant and obligation begin date of first grant received
• The recipient’s academic level when first receiving a TEACH Grant
• School type of the institution where the first TEACH Grant was received
• Region (Midwest, Northeast, Southwest, Southeast, or West)
• Whether the recipient ever received a Pell Grant (proxy for low income)
• Award year of the first TEACH Grant
• First-generation student status based on the first demographic profile on record
CART considered but did not select the following variables:
• Status of TEACH Grant
• Grants received as an undergraduate or graduate (or both)
• Gender
• Dependent or independent status during the first demographic profile on record
• First-generation student status based on the first demographic profile on record
Only one case was missing on the variables gender, dependent or independent status during the first demographic profile on record, first-generation student status during the first demographic profile on record, and whether the recipient ever received a Pell Grant (proxy for low income). This case was imputed from the unweighted distribution of nonmissing values for the variable (e.g., the variable
Study of the Teacher Education Assistance for College and Higher Education (TEACH) Grant Program
92
gender was equal to “F” for approximately 70 percent of the cases, so the missing case had a 70 percent chance of being imputed with F). The variable difference between conversion date and obligation start date was missing for 252 cases. A “missing” category was created for cases with valid data, and the variable was treated as a categorical variable.
For both surveys, after variable selection, a logistic regression was run with the response status as the dependent variable and the selected variables as predictors (main effects only). The fitted regression was then used to create a predicted response propensity score for each sampled case. The sample was then sorted by the response propensity score and divided into five quintile classes. For each quintile class, a nonresponse adjustment factor was calculated as the inverse of the observed response rate within the quintile class:
𝑁𝑁𝑁𝑁𝑁𝑁𝑁𝑁 = 𝑛𝑛𝑟𝑟 + 𝑛𝑛𝑛𝑛𝑟𝑟
𝑛𝑛𝑟𝑟
where NRAF is the nonresponse adjustment factor, 𝑛𝑛𝑟𝑟 is the number of respondents, and 𝑛𝑛𝑛𝑛𝑟𝑟 is the number of nonrespondents in the quintile class.
For both surveys, the base weights were adjusted by the nonresponse adjustment factor for respondents and to 0 for nonrespondents.
Raking Adjustments The nonresponse-adjusted weights were further adjusted by raking adjustments, such that the sum of the final weights matched population totals for the frame variables. The raking adjustment procedure can further correct for remaining bias after the nonresponse adjustments. This procedure iteratively adjusts the weights until a convergence criterion is reached, and the final weights can produce the marginal distributions of each frame variable adjusted in the procedure. Raking was performed using the STATA package ipfraking (Kolenikov 2014). All frame variables listed in the nonresponse adjustments section were raked to control totals. Continuous variables were recoded to four-category variables based on their quartiles because the raking method requires that all variables be categorical variables. The weights successfully converged to all the specified control totals.
Results of Nonresponse Bias Analysis and Assessment of Weighting Adjustments As discussed earlier, variables on the sampling frame were used to assess the nonresponse bias.
Variables on the sampling frame also were used to assess the effect of raking adjustments. The differences between the nonresponse-adjusted estimate and the population value were computed.
For the IHE Survey, most frame variables showed relatively low bias (see details in Exhibit C7). For the variables region and school type, the respondent proportion was within 1.5 percentage points of the sample proportion for all categories. For all continuous variables except the variable number of TEACH Grant recipients in the 2014–15 academic year, the respondent mean was within one unit of the sample mean. Nonresponse adjustments reduced the nonresponse bias for any noticeable small biases except for the variable school type, whose bias was removed completely in the raking adjustment. In addition, the raking adjustments reduced the remaining bias after nonresponse adjustments in the variable number of grant recipients in 2014–15 academic year by 15 percent. The biases in other variables after nonresponse adjustments virtually remained unchanged as they were all under 0.3 percentage points.
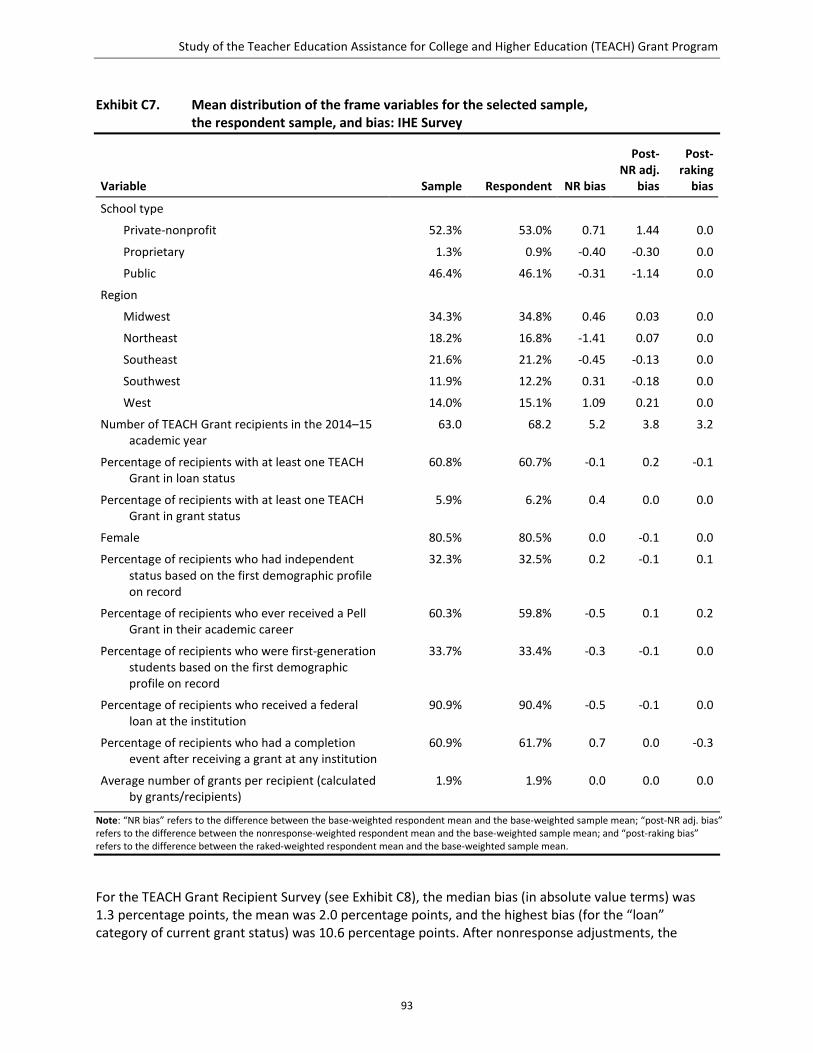
Study of the Teacher Education Assistance for College and Higher Education (TEACH) Grant Program
93
Exhibit C7. Mean distribution of the frame variables for the selected sample, the respondent sample, and bias: IHE Survey
Variable Sample Respondent NR bias
Post-NR adj.
bias
Post-raking
bias
School type
Private-nonprofit 52.3% 53.0% 0.71 1.44 0.0
Proprietary 1.3% 0.9% -0.40 -0.30 0.0
Public 46.4% 46.1% -0.31 -1.14 0.0
Region
Midwest 34.3% 34.8% 0.46 0.03 0.0
Northeast 18.2% 16.8% -1.41 0.07 0.0
Southeast 21.6% 21.2% -0.45 -0.13 0.0
Southwest 11.9% 12.2% 0.31 -0.18 0.0
West 14.0% 15.1% 1.09 0.21 0.0
Number of TEACH Grant recipients in the 2014–15 academic year
63.0 68.2 5.2 3.8 3.2
Percentage of recipients with at least one TEACH Grant in loan status
60.8% 60.7% -0.1 0.2 -0.1
Percentage of recipients with at least one TEACH Grant in grant status
5.9% 6.2% 0.4 0.0 0.0
Female 80.5% 80.5% 0.0 -0.1 0.0
Percentage of recipients who had independent status based on the first demographic profile on record
32.3% 32.5% 0.2 -0.1 0.1
Percentage of recipients who ever received a Pell Grant in their academic career
60.3% 59.8% -0.5 0.1 0.2
Percentage of recipients who were first-generation students based on the first demographic profile on record
33.7% 33.4% -0.3 -0.1 0.0
Percentage of recipients who received a federal loan at the institution
90.9% 90.4% -0.5 -0.1 0.0
Percentage of recipients who had a completion event after receiving a grant at any institution
60.9% 61.7% 0.7 0.0 -0.3
Average number of grants per recipient (calculated by grants/recipients)
1.9% 1.9% 0.0 0.0 0.0
Note: “NR bias” refers to the difference between the base-weighted respondent mean and the base-weighted sample mean; “post-NR adj. bias” refers to the difference between the nonresponse-weighted respondent mean and the base-weighted sample mean; and “post-raking bias” refers to the difference between the raked-weighted respondent mean and the base-weighted sample mean.
For the TEACH Grant Recipient Survey (see Exhibit C8), the median bias (in absolute value terms) was 1.3 percentage points, the mean was 2.0 percentage points, and the highest bias (for the “loan” category of current grant status) was 10.6 percentage points. After nonresponse adjustments, the
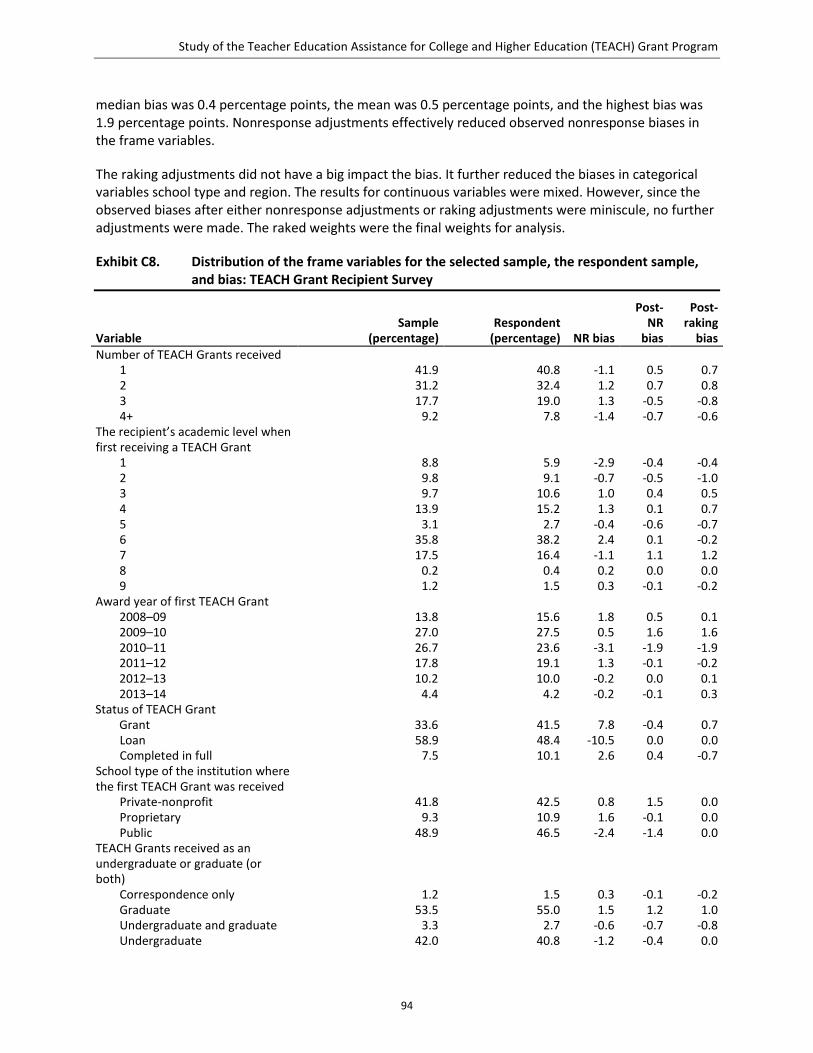
Study of the Teacher Education Assistance for College and Higher Education (TEACH) Grant Program
94
median bias was 0.4 percentage points, the mean was 0.5 percentage points, and the highest bias was 1.9 percentage points. Nonresponse adjustments effectively reduced observed nonresponse biases in the frame variables.
The raking adjustments did not have a big impact the bias. It further reduced the biases in categorical variables school type and region. The results for continuous variables were mixed. However, since the observed biases after either nonresponse adjustments or raking adjustments were miniscule, no further adjustments were made. The raked weights were the final weights for analysis.
Exhibit C8. Distribution of the frame variables for the selected sample, the respondent sample, and bias: TEACH Grant Recipient Survey
Variable Sample
(percentage) Respondent
(percentage) NR bias
Post-NR
bias
Post-raking
bias Number of TEACH Grants received
1 41.9 40.8 -1.1 0.5 0.7 2 31.2 32.4 1.2 0.7 0.8 3 17.7 19.0 1.3 -0.5 -0.8 4+ 9.2 7.8 -1.4 -0.7 -0.6
The recipient’s academic level when first receiving a TEACH Grant
1 8.8 5.9 -2.9 -0.4 -0.4 2 9.8 9.1 -0.7 -0.5 -1.0 3 9.7 10.6 1.0 0.4 0.5 4 13.9 15.2 1.3 0.1 0.7 5 3.1 2.7 -0.4 -0.6 -0.7 6 35.8 38.2 2.4 0.1 -0.2 7 17.5 16.4 -1.1 1.1 1.2 8 0.2 0.4 0.2 0.0 0.0 9 1.2 1.5 0.3 -0.1 -0.2
Award year of first TEACH Grant 2008–09 13.8 15.6 1.8 0.5 0.1 2009–10 27.0 27.5 0.5 1.6 1.6 2010–11 26.7 23.6 -3.1 -1.9 -1.9 2011–12 17.8 19.1 1.3 -0.1 -0.2 2012–13 10.2 10.0 -0.2 0.0 0.1 2013–14 4.4 4.2 -0.2 -0.1 0.3
Status of TEACH Grant Grant 33.6 41.5 7.8 -0.4 0.7 Loan 58.9 48.4 -10.5 0.0 0.0 Completed in full 7.5 10.1 2.6 0.4 -0.7
School type of the institution where the first TEACH Grant was received
Private-nonprofit 41.8 42.5 0.8 1.5 0.0 Proprietary 9.3 10.9 1.6 -0.1 0.0 Public 48.9 46.5 -2.4 -1.4 0.0
TEACH Grants received as an undergraduate or graduate (or both)
Correspondence only 1.2 1.5 0.3 -0.1 -0.2 Graduate 53.5 55.0 1.5 1.2 1.0 Undergraduate and graduate 3.3 2.7 -0.6 -0.7 -0.8 Undergraduate 42.0 40.8 -1.2 -0.4 0.0

Study of the Teacher Education Assistance for College and Higher Education (TEACH) Grant Program
95
Exhibit C8. Distribution of the frame variables for the selected sample, the respondent sample, and bias: TEACH Grant Recipient Survey (Continued)
Variable Sample
(percentage) Respondent
(percentage) NR bias
Post-NR
bias
Post-raking
bias Gender
Female 78.5 80.6 2.1 0.7 -0.8 Male 16.5 15.1 -1.3 -0.1 1.4 Missing 5.1 4.3 -0.8 -0.7 -0.7
Dependent or independent status during the first demographic profile on record
Dependent 65.5 62.2 -3.3 -0.5 -2.7 Independent 34.5 37.8 3.3 0.5 2.7
First-generation student status based on the first demographic profile on record
No 69.1 71.1 2.0 0.9 -3.9 Yes 30.9 28.9 -2.0 -0.9 3.9
Whether the recipient ever received a Pell Grant (proxy for low income)
No 40.8 43.5 2.7 0.3 -0.7 Yes 59.2 56.5 -2.7 -0.3 0.7
Region Midwest 28.8 28.4 -0.5 0.2 0.0 Northeast 14.9 13.8 -1.1 -0.2 0.0 Southeast 16.9 16.9 -0.1 1.6 0.0 Southwest 22.1 21.2 -0.9 -1.5 0.4 West 17.2 19.8 2.6 -0.1 -0.4
Difference in number of years between earliest award year of any converted TEACH Grant and obligation begin date of first grant received
0 2.8 1.9 -0.9 -0.5 -0.5 1 16.4 11.5 -4.9 -0.3 -0.6 2 15.0 11.4 -3.6 -0.1 -0.2 3 10.0 7.6 -2.4 0.4 0.5 4 7.1 8.8 1.6 0.1 0.3 5 3.3 3.4 0.1 0.1 0.1 6+ 2.1 1.5 -0.6 0.2 0.3 Missing 43.2 53.8 10.6 0.1 0.0
Note: “NR bias” refers to the difference between the base-weighted respondent mean and the base-weighted sample mean; “post-NR adj. bias” refers to the difference between the nonresponse-weighted respondent mean and the base-weighted sample mean; and “post-raking bias” refers to the difference between the raked-weighted respondent mean and the base-weighted sample mean.
Data File Creation
After the data collection period ended, frequencies and cross tabulations of the survey data were examined, including verification that (1) the data file contained only values that were specified in the instrument, (2) the total number of cases in the frequency distributions was correct, (3) skip patterns
Study of the Teacher Education Assistance for College and Higher Education (TEACH) Grant Program
96
were followed correctly, and (4) the results matched plausible expectations. The following subsections detail the specific processing steps taken with each survey’s data.
IHE Survey To create the final IHE Survey analytic data file, several files were merged together. The data for the 21 completed paper surveys were merged with the 324 completed online surveys data file to create the full survey data file (n = 345). Next, several variables were merged to complete the data file. The data for the 58 cases that provided follow-up data for variables in questions A10–A15 were merged with the original online data file to fill in those variables (see earlier explanation for the programming error that necessitated this merge). Finally, frame characteristics such as school type, conversion rate, and the number of recipients were merged into the survey data file, along with weights for nonresponse adjustment.
TEACH Grant Recipient Survey Several files were merged together to create the final recipient survey analytic data file. The data for the 26 completed paper surveys were merged with the 296 cases from the online data file to create the full survey data file (n = 322). Next, the survey data were merged with the frame characteristics and weights.
Analysis Methods
Key Variables and Variable Derivation
Extant Data The recipient-level data of approximately 78,000 records, which resulted from the merge of the PHEAA and NSLDS data described in the Data Sources section, were aggregated by institution to calculate institutional overall conversion rates for the 2008–2014 cohort. Conversion rates were calculated for each institution by dividing the total number of TEACH Grant recipients for the 2008–2014 cohort by the number of recipients whose grants had been converted to loans. This same formula was used to calculate conversion rates of various demographic groups of recipients. The unit of analysis for these conversion rate analyses was the unique combination of recipient and institution; therefore, a small number of recipients (approximately 600) who obtained TEACH Grants at multiple institutions are reflected in this data set more than once.
IHE Survey The IHE Survey contained 15 “grid” questions that instructed the respondents to “check all that apply” to report the incidence of certain activities. For example, one series of grid questions asked about the methods of communicating about the grant to students, with rows for student subgroups that could be specified and columns for the various methods (e.g., email, events, flyers), with the respondent looped through the grid for each office or department that was involved in those activities at the institution (e.g., the college of education or financial aid office).
The detailed responses to these grid questions were collapsed into “summary” and “super-summary” variables, and statistics were generated for these variables rather than the detailed responses. First, a summary variable was created indicating whether any row (e.g., student subgroup) was selected in each column (e.g., communication method) for each iteration of the grid (e.g., institutional office or department). Then super-summary variables were created that indicated whether the column (e.g., communication method) was selected for any of the grids in the series (e.g., institutional office or department). Then the super-summary variables were combined for multiple grid questions in the following groupings: communication methods (questions A11–A15), integrated counseling (questions
Study of the Teacher Education Assistance for College and Higher Education (TEACH) Grant Program
97
A19, A21, A23, A25, and A27), and stand-alone counseling (questions A20, A22, A24, A26, and A28). All summary variables indicate 1 if any of the contributing items was answered 1 = yes (applies) and 0 if none of the items was answered 1 = yes (i.e., all contributing items have a value of 0 or missing).
TEACH Grant Recipient Survey A respondent race and ethnicity variable was constructed based on responses to separate race and Hispanic ethnicity items in the survey. Any respondents who reported in the survey that they were Hispanic or Latino were coded as Hispanic and not included in any of the race categories. The race and ethnicity categories included Hispanic or Latino, White, Black or African-American, American Indian or Alaska Native, Asian, Native Hawaiian or Pacific Islander, and a multirace category for those who reported more than one race (excluding Hispanic or Latino).
For the current status variable, which indicates whether (1) a grant was converted to a loan, (2) a grant was still active as a grant, or (3) all the requirements for their grant had been completed, items 2 and 3 were combined for the analytic purposes of comparing Recipients in loan status and recipients in grant status.
For question A16, which asked about the current likelihood of completing the grant requirements, responses for “unlikely” and “very unlikely” were collapsed. For a very small number of Recipients in grant status (n = 2) who reported in question A16 that their grants had already been converted to loans, this response to A16 and any subsequent response to A17 was excluded for analysis purposes because the response to A16 was inconsistent with the grant status in the PHEAA data set used for sampling.
For question A17, several sets of response categories were collapsed such that if any of the items in that set were affirmed, then the set was affirmed. The following list shows which categories were grouped under each of the labels used in Exhibits A2.2c and A2.2f:
• Teaching in a position that does not qualify for TEACH Grant service
– Currently teaching, but not in a position that qualifies for TEACH Grant service
– I started teaching in a qualifying TEACH position, but changed to a nonqualifying TEACH position
• Not teaching or did not complete certification/degree
– Did not continue in a teacher preparation program
– Did not graduate from college or graduate school
– Graduated from a teacher preparation program, but did not go into teaching
– After starting teaching, I left the profession altogether
• Another factor
– Was never certain about intent to teach
– Did not meet state requirements for a Highly Qualified Teacher (HQT)
– I changed to a nonteaching, administrative position at a school (e.g., promotion to principal) prior to fulfilling my service
Study of the Teacher Education Assistance for College and Higher Education (TEACH) Grant Program
98
For question A17B_1, which asked about the reasons why the recipient did not certify annually, response categories “I did not know about annual certification” and “I did not know the process for annual certification” were collapsed.
Responses to question A17G_1, which asked about the reasons why the recipient was teaching in a position not eligible for grant service, were collapsed, such that the responses “I decided I did not want to teach in a high-need field” and “I decided I did not want to teach in a high-need school” were analyzed together, as were the responses “I could not find a job in a high-need field” and “I could not find a job in a high-need school”; this collapsing of categories also enabled the backcoding of four other-specify responses to this question that were otherwise not specific enough to backcode.
Variance Estimation
Proportions for the populations and subpopulations were estimated with design weights adjusted by nonresponse using the Stata statistical software. The variance estimation, using the Taylor expansion method, also took stratification into account. The sampling variance is a measure of reliability of the estimate, which largely depends on the sample size. If the survey was conducted with the same sample size under the same conditions repeatedly, the interval of the estimate minus 1.96 times the standard error (the square root of the variance) and the estimate plus 1.96 times the standard error would include the population value in approximately 95 percent of the samples. Therefore, the interval calculated in this manner is called the 95 percent confidence interval.
Statistical Tests
To test whether the difference is statistically significant, comparisons of estimates between subgroups were tested at the significance level of 0.05, which is a measure of the probability (5 percent) that the observed difference between subgroups would have arisen by chance. If the probability is less than 5 percent, the difference is said to be statistically significant because it is unlikely to occur by chance.
The differences in proportions between subgroups were tested by calculating a z-statistic based on the following formula:
𝑍𝑍 =(�̂�𝑝1 − �̂�𝑝2) − 0
�𝑣𝑣𝑣𝑣𝑣𝑣(�̂�𝑝1) + 𝑣𝑣𝑣𝑣𝑣𝑣(�̂�𝑝2)
where �̂�𝑝1 and �̂�𝑝2 are the estimated proportions in the subgroups in comparison and 𝑣𝑣𝑣𝑣𝑣𝑣(�̂�𝑝1) and 𝑣𝑣𝑣𝑣𝑣𝑣(�̂�𝑝2) are the variance of the estimated proportions. The z-score was compared to a Z table that contains the percentage of area under the normal curve between the zero and the z-score, and the Z table was used to determine whether the calculated z-score was likely to have happened by chance. The statistical significance was tested using a two-tailed test, which means the possibility of the relationship of the two proportions was tested in both directions.
Because the TEACH Grant Recipient Survey was a sample survey, sampling variance was computed, and the differences in proportions between subgroups were tested for statistical significance. In contrast, because the IHE Survey was a universe survey, differences in proportions between subpopulations were presented without statistical tests.
Study of the Teacher Education Assistance for College and Higher Education (TEACH) Grant Program
99
Qualitative Interview Coding and Analysis
The analytic process for the interview data entailed three key activities: preparing interview transcripts, analyzing the qualitative data collected on-site, and reporting the findings. These activities are described in the following subsections in more detail.
Transcripts of All Case Study Interviews The site visit team referred to the notes from the interviews conducted on-site as well as the transcribed interview audio files28 to prepare an accurate documentation of each interview.
Qualitative Analysis A set of qualitative analytic procedures were designed to limit bias and ensure reliable findings. These methods included standards of evidence, triangulation of data, and procedures for measuring interrater agreement.
A set of preliminary codes were developed that aligned with the study questions and the interview protocols. NVivo qualitative data analysis software was used to code each transcript using the preliminary set of codes. The coded data were used to identify emergent themes that addressed the related research questions. The case study lead met regularly with the case study analytic team to review and confirm the consistent application of the codebook, discuss possible additions or refinements to the codebook based on emergent themes, and clarify decision rules regarding the application of specific codes. During these discussions, the team also identified additional codes that were needed to categorize the data to better address the study questions.
Exhibit C9 presents the preliminary list of codes and coding category definitions.
28 AIR sent interview audio files to Rev.com for transcription.
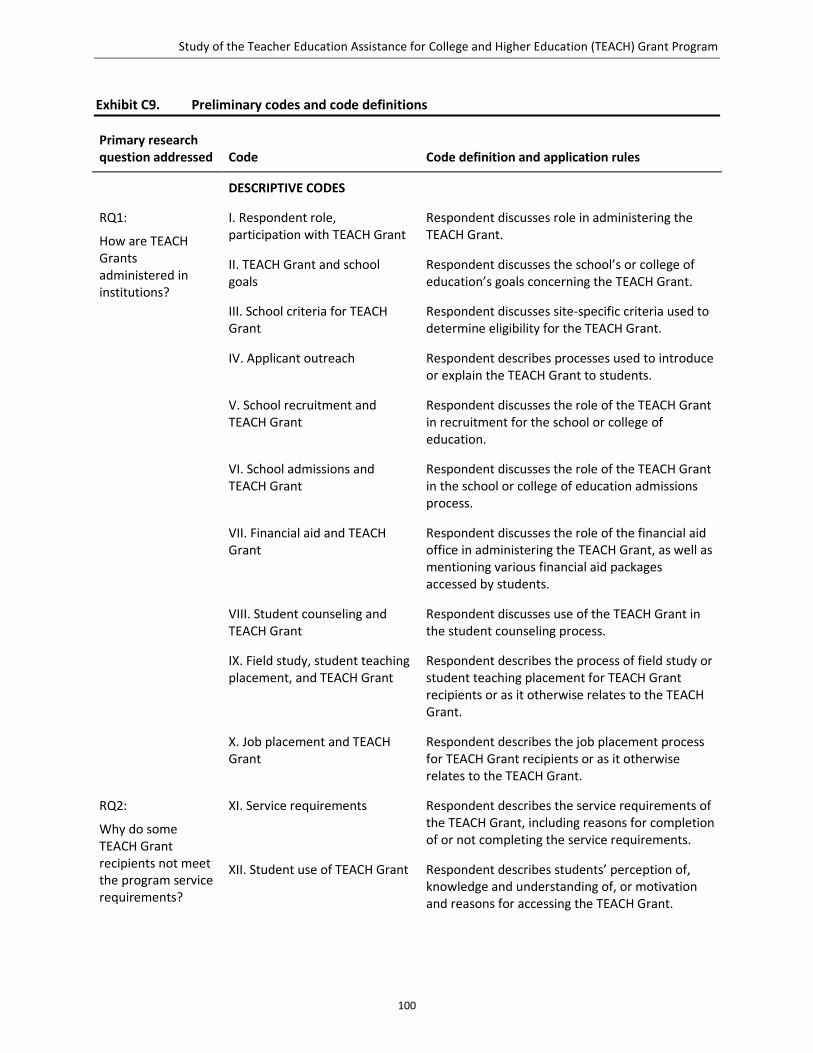
Study of the Teacher Education Assistance for College and Higher Education (TEACH) Grant Program
100
Exhibit C9. Preliminary codes and code definitions
Primary research question addressed Code Code definition and application rules
DESCRIPTIVE CODES
RQ1:
How are TEACH Grants administered in institutions?
I. Respondent role, participation with TEACH Grant
Respondent discusses role in administering the TEACH Grant.
II. TEACH Grant and school goals
Respondent discusses the school’s or college of education’s goals concerning the TEACH Grant.
III. School criteria for TEACH Grant
Respondent discusses site-specific criteria used to determine eligibility for the TEACH Grant.
IV. Applicant outreach Respondent describes processes used to introduce or explain the TEACH Grant to students.
V. School recruitment and TEACH Grant
Respondent discusses the role of the TEACH Grant in recruitment for the school or college of education.
VI. School admissions and TEACH Grant
Respondent discusses the role of the TEACH Grant in the school or college of education admissions process.
VII. Financial aid and TEACH Grant
Respondent discusses the role of the financial aid office in administering the TEACH Grant, as well as mentioning various financial aid packages accessed by students.
VIII. Student counseling and TEACH Grant
Respondent discusses use of the TEACH Grant in the student counseling process.
IX. Field study, student teaching placement, and TEACH Grant
Respondent describes the process of field study or student teaching placement for TEACH Grant recipients or as it otherwise relates to the TEACH Grant.
X. Job placement and TEACH Grant
Respondent describes the job placement process for TEACH Grant recipients or as it otherwise relates to the TEACH Grant.
RQ2:
Why do some TEACH Grant recipients not meet the program service requirements?
XI. Service requirements Respondent describes the service requirements of the TEACH Grant, including reasons for completion of or not completing the service requirements.
XII. Student use of TEACH Grant Respondent describes students’ perception of, knowledge and understanding of, or motivation and reasons for accessing the TEACH Grant.
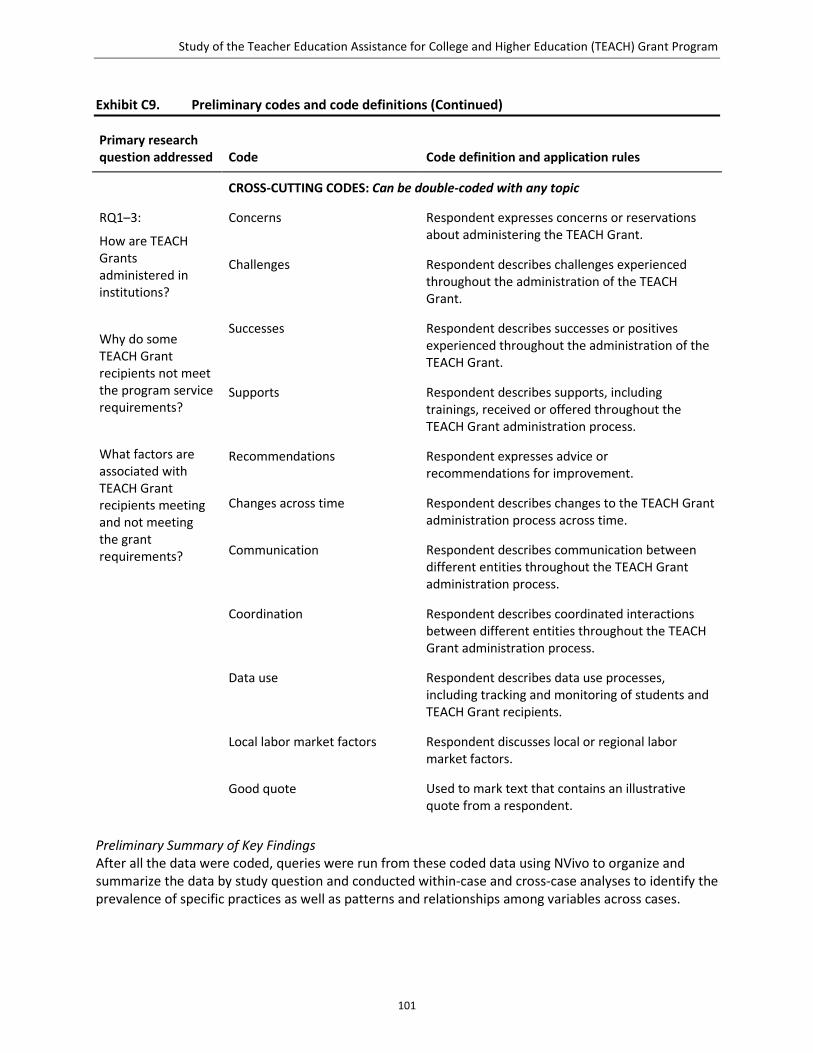
Study of the Teacher Education Assistance for College and Higher Education (TEACH) Grant Program
101
Exhibit C9. Preliminary codes and code definitions (Continued)
Primary research question addressed Code Code definition and application rules
CROSS-CUTTING CODES: Can be double-coded with any topic
RQ1–3:
How are TEACH Grants administered in institutions?
Why do some TEACH Grant recipients not meet the program service requirements?
What factors are associated with TEACH Grant recipients meeting and not meeting the grant requirements?
Concerns Respondent expresses concerns or reservations about administering the TEACH Grant.
Challenges Respondent describes challenges experienced throughout the administration of the TEACH Grant.
Successes Respondent describes successes or positives experienced throughout the administration of the TEACH Grant.
Supports Respondent describes supports, including trainings, received or offered throughout the TEACH Grant administration process.
Recommendations Respondent expresses advice or recommendations for improvement.
Changes across time Respondent describes changes to the TEACH Grant administration process across time.
Communication Respondent describes communication between different entities throughout the TEACH Grant administration process.
Coordination Respondent describes coordinated interactions between different entities throughout the TEACH Grant administration process.
Data use Respondent describes data use processes, including tracking and monitoring of students and TEACH Grant recipients.
Local labor market factors Respondent discusses local or regional labor market factors.
Good quote Used to mark text that contains an illustrative quote from a respondent.
Preliminary Summary of Key Findings After all the data were coded, queries were run from these coded data using NVivo to organize and summarize the data by study question and conducted within-case and cross-case analyses to identify the prevalence of specific practices as well as patterns and relationships among variables across cases.


Study of the Teacher Education Assistance for College and Higher Education (TEACH) Grant Program
103
Appendix D. Data Collection Instruments

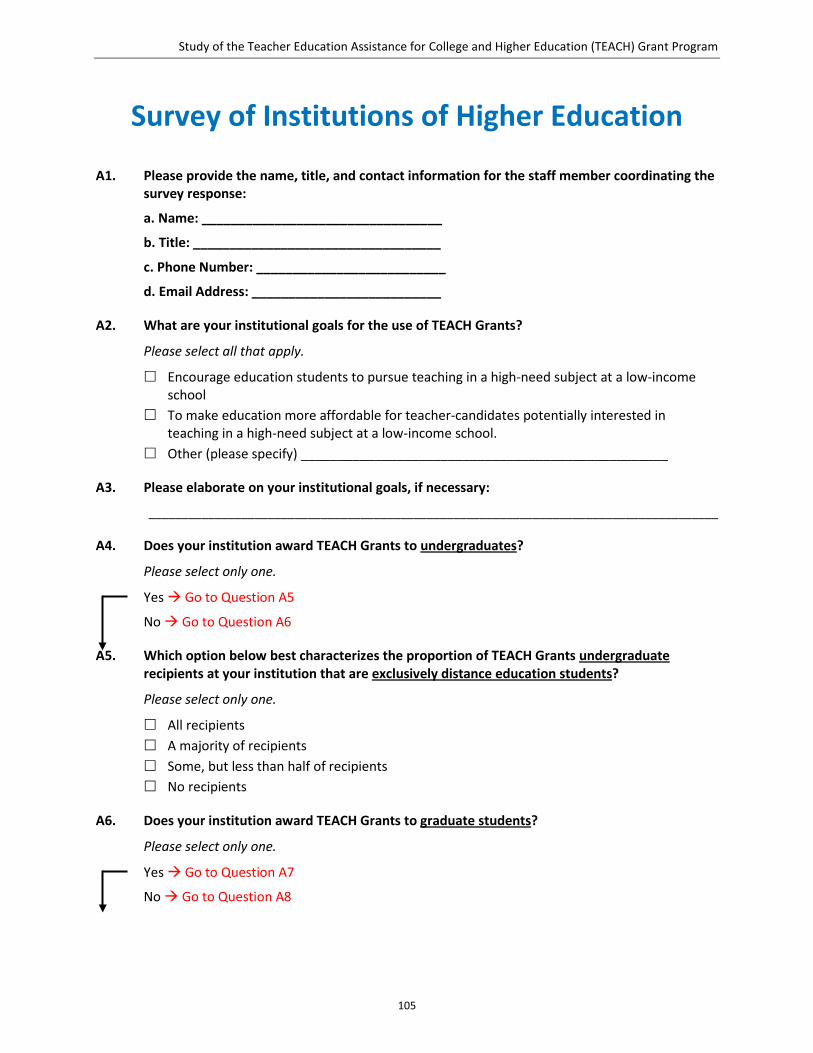
Study of the Teacher Education Assistance for College and Higher Education (TEACH) Grant Program
105
Survey of Institutions of Higher Education
A1. Please provide the name, title, and contact information for the staff member coordinating the survey response:
a. Name: _________________________________
b. Title: __________________________________
c. Phone Number: __________________________
d. Email Address: __________________________
A2. What are your institutional goals for the use of TEACH Grants?
Please select all that apply.
Encourage education students to pursue teaching in a high-need subject at a low-income school
To make education more affordable for teacher-candidates potentially interested in teaching in a high-need subject at a low-income school.
Other (please specify) __________________________________________________
A3. Please elaborate on your institutional goals, if necessary:
______________________________________________________________________________________
A4. Does your institution award TEACH Grants to undergraduates?
Please select only one.
Yes Go to Question A5
No Go to Question A6
A5. Which option below best characterizes the proportion of TEACH Grants undergraduate recipients at your institution that are exclusively distance education students?
Please select only one.
All recipients A majority of recipients Some, but less than half of recipients No recipients
A6. Does your institution award TEACH Grants to graduate students?
Please select only one.
Yes Go to Question A7
No Go to Question A8
Study of the Teacher Education Assistance for College and Higher Education (TEACH) Grant Program
106
A7. Which option below best characterizes the proportion of TEACH Grants graduate recipients at your institution that are exclusively distance education students?
Please select only one.
All recipients A majority of recipients Some, but less than half of recipients No recipients
A8. What office or department has the lead oversight role for TEACH Grants on your campus?
Please select only one.
Financial Aid Office School/Department of Education Other Field-specific School or Department (please specify) _____________________ Career Services
A8a. What does that lead oversight role entail (e.g., setting goals, student outreach, tracking of awards, tracking of fulfillment grant requirements/conversion of grants to loans, etc.)?
______________________________________________________________________________________
A9. Please indicate how your institution limits which teacher preparation students can receive TEACH Grants:
Please select all that apply.
Students must complete a minimum number of courses required for a teaching credential (please specify the number)
Students must complete a minimum number of courses in a specific field/subject (please specify the number)
Students must declare a major and/or minor in high-need fields Students must declare a major and/or minor in teaching Students must have been admitted into the teacher preparation program Freshman are excluded Sophomores are excluded Juniors are excluded First-year graduate students are excluded Students must achieve a GPA higher than the minimum set by TEACH Other (please specify) __________________________________________________ Not Applicable
Study of the Teacher Education Assistance for College and Higher Education (TEACH) Grant Program
107
A9a. In the previous question about how your institution limits which teacher preparation students can receive TEACH Grants, you selected “Students must complete a minimum number of courses required for a teacher credential.” What is the minimum number of courses required?
Please enter the number of courses in the box. If you do not know, please select “Don’t know”
Number of courses ____________________________________________________ Don’t know
A9b. In the previous question about how your institution limits which teacher preparation students can receive TEACH Grants, you selected “Students must complete a minimum number of courses in a specific field/subject.” What is the minimum number of courses required?
Please enter the number of courses in the box. If you do not know, please select “Don’t know”
Number of courses ____________________________________________________ Don’t know
A10. Which departments or offices on your campus inform students about the TEACH Grant?
Please select all that apply.
Financial Aid Office School/Department of Education Other Field-Specific School or Department (e.g., mathematics) Career Services Other(s) (please specify) ________________________________________________ (5)
A11. How does the Financial Aid Office inform students about the TEACH Grant? Please indicate the mode of communication used to make the different subsets of students aware of the TEACH Grant program.
Please select all that apply
• Student subsets might include students taking specific courses, students with specific demographic backgrounds, and students at a specific academic level (e.g., freshman, sophomore, junior, senior)
• Person-to-person contact refers to an in-person interaction such as a meeting with a financial aid counselor.
Targeted Students Email Events Flyers Person-to-
person contact
Website (please
specify URL)
Other (please specify)
All Students Student Subset 1: Student Subset 2: Student Subset 3: Student Subset 4:
Study of the Teacher Education Assistance for College and Higher Education (TEACH) Grant Program
108
A12. How does the School/Department of Education inform students about the TEACH Grant? Please indicate the mode of communication used to make the different subsets of students aware of the TEACH Grant program.
Targeted Students Email Events Flyers Person-to-
person contact
Website (please
specify URL)
Other (please specify)
All Students Student Subset 1: Student Subset 2: Student Subset 3: Student Subset 4:
A13. How does the Other Field-Specific School or Department inform students about the TEACH Grant? Please indicate the mode of communication used to make the different subsets of students aware of the TEACH Grant program.
Targeted Students Email Events Flyers Person-to-
person contact
Website (please
specify URL)
Other (please specify)
All Students Student Subset 1: Student Subset 2: Student Subset 3: Student Subset 4:
A14. How does Career Services inform students about the TEACH Grant? Please indicate the mode of communication used to make the different subsets of students aware of the TEACH Grant program.
Targeted Students Email Events Flyers Person-to-
person contact
Website (please
specify URL)
Other (please specify)
All Students Student Subset 1: Student Subset 2: Student Subset 3: Student Subset 4:
Study of the Teacher Education Assistance for College and Higher Education (TEACH) Grant Program
109
A15. How do Others inform students about the TEACH Grant? Please indicate the mode of communication used to make the different subsets of students aware of the TEACH Grant program.
Targeted Students Email Events Flyers Person-to-
person contact
Website (please
specify URL)
Other (please specify)
All Students Student Subset 1: Student Subset 2: Student Subset 3: Student Subset 4:
A16. Please email any existing example emails, flyers, etc. as noted in previous questions.
Please select only one.
Yes, I will email the examples. (You will be prompted at the end of the survey to email these documents).
No, I am unable to provide examples at this time.
A17. Does your institution provide information about the availability of TEACH Grants to prospective teacher education students considering applying to your institution?
Please select only one.
Yes No Not Sure
A18. Which departments or offices on your campus offer counseling and advising specific to the TEACH Grant program?
Please select all that apply.
Financial Aid Office School/Department of Education Other Field-Specific School or Department (e.g., Mathematics) Career Services Other (please specify) _______________________________________________ Other (please specify) _______________________________________________ Other (please specify) _______________________________________________
Study of the Teacher Education Assistance for College and Higher Education (TEACH) Grant Program
110
A19. What type of integrated counseling or advising does the Financial Aid Office provide?
• Integrated refers to a counseling or advising session in which other topics are discussed, such as loan counseling.
• In-Person refers to in-person interactions such as meetings with a financial aid counselor.
Please select all that apply.
Optional online counseling/advising
Mandatory online counseling/ advising
Optional in-person counseling/advising
Mandatory in-person counseling/advising
Not applicable
Integrated counseling or advising targeted to …
All students regardless of academic level Freshmen Sophomores Juniors Seniors First-year graduate students Second-year graduate students Others (please specify):
A20. What type of stand-alone counseling or advising does the Financial Aid Office provide?
• Stand-alone refers to a counseling or advising session solely dedicated to discussion of the TEACH Grant.
Please select all that apply.
Optional online counseling/ advising
Mandatory online counseling/ advising
Optional in-person counseling/ advising
Mandatory in-person counseling/ advising
Not applicable
Stand-alone counseling or advising targeted to…
All students regardless of academic level Freshmen Sophomores Juniors Seniors First-year graduate students Second-year graduate students Others (please specify):
Study of the Teacher Education Assistance for College and Higher Education (TEACH) Grant Program
111
A21. What type of integrated counseling or advising does the School/Department of Education provide?
Optional online counseling/ advising
Mandatory online counseling/ advising
Optional in-person counseling/ advising
Mandatory in-person counseling/ advising
Not applicable
Integrated counseling or advising targeted to…
All students regardless of academic level Freshmen Sophomores Juniors Seniors First-year graduate students Second-year graduate students Others (please specify):
A22. What type of stand-alone counseling or advising does the School/Department of Education provide?
Optional online counseling/ advising
Mandatory online counseling/ advising
Optional in-person counseling/ advising
Mandatory in-person counseling/ advising
Not applicable
Stand-alone Counseling or Advising targeted to…
All students regardless of academic level Freshmen Sophomores Juniors Seniors First-year graduate students Second-year graduate students Others (please specify):
Study of the Teacher Education Assistance for College and Higher Education (TEACH) Grant Program
112
A23. What type of integrated counseling or advising does the Other Field-Specific School or Department provide?
Optional online counseling/ advising
Mandatory online counseling/ advising
Optional in-person counseling/ advising
Mandatory in-person counseling/ advising
Not applicable
Integrated counseling or advising targeted to…
All students regardless of academic level Freshmen Sophomores Juniors Seniors First-year graduate students Second-year graduate students Others (please specify):
A24. What type of stand-alone counseling or advising does the Other Field-Specific School or Department provide?
Optional online counseling/ advising
Mandatory online counseling/ advising
Optional in-person counseling/ advising
Mandatory in-person counseling/ advising
Not applicable
Stand-alone counseling or advising targeted to…
All students regardless of academic level Freshmen Sophomores Juniors Seniors First-year graduate students Second-year graduate students Others (please specify):
Study of the Teacher Education Assistance for College and Higher Education (TEACH) Grant Program
113
A25. What type of integrated counseling or advising does Career Services provide?
Optional online counseling/ advising
Mandatory online counseling/ advising
Optional in-person counseling/ advising
Mandatory in-person counseling/ advising
Not applicable
Integrated counseling or advising targeted to…
All students regardless of academic level Freshmen Sophomores Juniors Seniors First-year graduate students Second-year graduate students Others (please specify):
A26. What type of stand-alone counseling or advising does Career Services provide?
Optional online counseling/ advising
Mandatory online counseling/ advising
Optional in-person counseling/ advising
Mandatory in-person counseling/ advising
Not applicable
Stand-alone counseling or advising targeted to…
All students regardless of academic level Freshmen Sophomores Juniors Seniors First-year graduate students Second-year graduate students Others (please specify):
Study of the Teacher Education Assistance for College and Higher Education (TEACH) Grant Program
114
A27. What type of integrated counseling or advising do [OTHERS] provide?
Optional online counseling/ advising
Mandatory online counseling/ advising
Optional in-person counseling/ advising
Mandatory in-person counseling/ advising
Not applicable
Integrated counseling or advising targeted to…
All students regardless of academic level Freshmen Sophomores Juniors Seniors First-year graduate students Second-year graduate students Others (please specify):
A28. What type of stand-alone counseling or advising do [OTHERS] provide?
Optional online counseling/ advising
Mandatory online counseling/ advising
Optional in-person counseling/ advising
Mandatory in-person counseling/ advising
Not applicable
Stand-alone counseling or advising targeted to…
All students regardless of academic level Freshmen Sophomores Juniors Seniors First-year graduate students Second-year graduate students Others (please specify):
A29. Please email any existing guidance documents or online resources used in counseling and advising.
Please select only one.
Yes, I will email the documents. (You will be prompted at the end of the survey to email these documents.)
No, I am unable to provide examples at this time.
Study of the Teacher Education Assistance for College and Higher Education (TEACH) Grant Program
115
A30. Do you have an institution-specific TEACH Grant application?
Please select only one.
Yes No Go To Question A32
A31. Please attach a copy or provide the URL for your TEACH Grant application.
Yes, I will email a copy of the TEACH Grant application documents (such as word, gif, pdf, etc. files) (You will be prompted at the end of the survey to email these documents.)
Yes, I have provided the URL to access the TEACH Grant application will mail the documents (please enter URL): ___________________________________________________________
No, I am unable to provide examples at this time.
A32. Please indicate how subsections of your institution provide placement services for qualifying TEACH Grant service positions.
Please select all that apply.
Placement Service Financial Aid Office
School/ Department of Education
Other Field-Specific School or Department
Career Services
Other (please specify)
Providing an updated list of available positions to students
Guidance on how to identify positions that qualify for service
Establishing relationships with schools that have eligible positions
Other (please specify) ______________
A33. What challenges does your institution see in administering TEACH Grants?
A34. What promising strategies has your institution found useful in administering TEACH Grants to improve overall awareness of the program, knowledge of program requirements, placement and retention in qualifying schools and positions, and any other activities to support grant recipients?
A35. How influential are TEACH Grants on students’ decisions to pursue teaching as a career?
Please select only one.
Very influential Somewhat influential Not influential Don’t know Go To Question A37
Study of the Teacher Education Assistance for College and Higher Education (TEACH) Grant Program
116
A36. Please note any data or experience that informs your opinion of how TEACH Grants influence students’ decisions to pursue teaching as a career.
A37. How influential are TEACH Grant eligibility requirements on students’ decisions to pursue teacher certification in TEACH Grant-eligible fields and schools?
Please select only one.
Very influential Somewhat influential Not influential Don’t know Go To Question A39
A38. Please note any data or experience that informs your opinion of how TEACH Grant eligibility requirements influence students’ decisions to pursue teacher certification in TEACH Grant-eligible fields and schools.
______________________________________________________________________________________
A39. Do any of the practices or policies described in this survey represent a significant change in TEACH Grant administration since your institution first started administering these grants?
Please select only one.
Yes No Go to END /Thank you for completing this survey.
A40. Please indicate when changes in TEACH Grant administration were made and provide the reason why those changes were made.
______________________________________________________________________________________
A41. You mentioned you would email us example emails and flyers to inform students of the TEACH Grant, existing guidance documents or online resources used in counseling and advising, and/or your TEACH Grant application. Please click here to email us those examples: [email protected].
Please confirm you are sending us these documents.
Yes, I am emailing documents. No, I am not emailing documents.
END. Thank you for completing this survey.

Study of the Teacher Education Assistance for College and Higher Education (TEACH) Grant Program
117
Survey of TEACH Grant Recipients A1. Please enter and the name of the institution where you received your first TEACH Grant(s):
Institution: ______________________________________________________________
A2. When you received your first TEACH Grant, what was your program of study, major and/or minor?
Please select all that apply.
Education Mathematics Science Foreign Language Bilingual Education English Language Acquisition Special Education Reading Specialist Other (please specify) __________________________________________________
A3. Were you formally accepted and admitted into a teacher preparation program (e.g., accepted into the school of education at an institution)?
Please select only one.
Yes No Go to Question A5 Not applicable (e.g., the institution did not provide this option, or I did not know of an
option to do so) Go to Question A5
A4. Were you accepted and admitted into a teacher preparation program prior to receiving your first TEACH Grant or after receiving your first TEACH Grant?
Please select only one.
Prior to receiving my first TEACH Grant After receiving my first TEACH Grant
Study of the Teacher Education Assistance for College and Higher Education (TEACH) Grant Program
118
A5. What is your enrollment status?
Please select only one.
Still enrolled in the institution at which you received your first TEACH Grant. Enrolled at an institution other than the institution in which you received your first TEACH
Grant. Completed/graduated at the institution at which you received your first TEACH Grant. Go
to Question A7 Completed/graduated at an institution other than the institution in which you received your
first TEACH Grant. Go to Question A7 Not enrolled and withdrew from school without completing/graduating, and do not have
plans to re-enroll in the next year Go to Question A8 Not enrolled and withdrew from school without completing/graduating, but have plans to
re-enroll in the next year Go to Question A8
A6. What is your current program of study, major, and/or minor?
Please select all that apply.
Education Mathematics Science Foreign Language Bilingual Education English Language Acquisition Special Education Reading Specialist Other _______________________________________________________________
GO TO A8.
A7. What was the program of study, major, and/or minor you completed?
Please select all that apply.
Education Mathematics Science Foreign Language Bilingual Education English Language Acquisition Special Education Reading Specialist Other _______________________________________________________________
Study of the Teacher Education Assistance for College and Higher Education (TEACH) Grant Program
119
A8. Upon leaving your teacher preparation program, how well informed were you about determining whether or not a specific teaching position was or was not in a qualifying high-need field at a low-income school, as defined by TEACH requirements?
Please select only one. Well informed Moderately informed Somewhat informed Not informed
A9. Upon leaving your teacher preparation program, how well informed were you about the requirement to annually certify your intent to teach in a high-need field at a low-income school?
Please select only one. Well informed Moderately informed Somewhat informed Not informed
A10. When you were at the institution at which you received your TEACH Grant(s), how much of your course instruction was online?
Please select only one. All course instruction Majority of course instruction Less than half of course instruction No course instruction
A11. How did you first learn about TEACH Grants?
Please select all that apply. Financial Aid Office Representative Instructor/Professor Counselor Another student College/University website College/University flyer Other (please specify) __________________________________________________
A12. How influential was the TEACH Grant as an incentive to pursue teaching as a career?
Please select only one. Very influential Somewhat influential Not very influential Not at all influential
Study of the Teacher Education Assistance for College and Higher Education (TEACH) Grant Program
120
A13. In the process of obtaining your first TEACH Grant, how well informed were you about the four-year service requirement to teach in a qualifying high-need field at a low-income school?
Please select only one.
Well informed Moderately informed Somewhat informed Not informed
A14. How influential was the TEACH Grant as an incentive to pursue teaching in a high-need field at a low-income school?
Please select only one.
Very influential Somewhat influential Not very influential Not at all influential
A15. When you received your first TEACH Grant, how did you feel about your likelihood of fulfilling the TEACH Grant four-year service requirement to teach in a qualifying high-need field at a low-income school?
Please select only one.
Very likely Likely Unlikely Very unlikely Did not know
A16. Please think about your first TEACH Grant. As of today, how do you feel about the likelihood that you will fulfill the TEACH Grant four-year service requirement to teach in a qualifying high-need field at a low-income school?
Please select only one.
Service requirements already met Go To Question A18 Very likely Go To Question A18 Likely Go To Question A18 Unlikely Go To Question A17 Very unlikely Go To Question A17 Do not know Go To Question A17 Not applicable: My grant(s) were already converted to loan(s) Go To Question A17
Study of the Teacher Education Assistance for College and Higher Education (TEACH) Grant Program
121
A17. Did any of the following factors influence your likelihood of completing the service requirements?
Please select all that apply. In each applicable response, please select why.
No Yes Why
a. Did not understand the service requirements of the grant
b. Failed to certify annually
b_1. Why? o I forgot about annual certification o I did not know about annual certification o I did not know the process for annual certification o I elected not to certify o Other (please specify)
c. Was never certain about an intention to teach
d. Did not continue in a teacher preparation program
d_1. Why? o I fell below the academic requirements o I had a change in interests o Other (please specify) ______________________
e. Did not graduate from college or graduate school
e_1. Why? o I fell below the academic requirements o I had a change in interests o Financial reasons (e.g., could no longer afford to
attend) o Other (please specify) ______________________
f. Graduated from a teacher preparation program, but did not go into teaching
f_1. Why? o I was unable to obtain a job in teaching o I had a change in interests o Personal reasons, unrelated to the teaching
profession o I pursued a higher-paying profession o Other (please specify)
g. Currently teaching, but not in a position that qualifies for TEACH Grant service
g_1. Why? o I decided I did not want to teach in a high-need field. o I decided I did not want to teach at a low-income
school. o I applied to one or more qualifying positions, but was
not offered the position. o I could not find a job in a high-need field. o I could not find a job at a low-income school. o I found a higher paying teaching position at a non-
qualifying school o Other (please specify) __________________
Study of the Teacher Education Assistance for College and Higher Education (TEACH) Grant Program
122
No Yes Why
h. Did not meet state requirements for a Highly Qualified Teacher (HQT)
i. After starting teaching, I left the profession altogether.
i_1. Why? o Teaching was more difficult than I expected o Teaching was not challenging enough o Teaching compensation was not enough. o I received a job offer in a different field of work. o Personal reasons unrelated to the teaching
profession. o Other (please specify)
j. I started teaching in a qualifying TEACH position, but changed to a non-qualifying TEACH position.
j_1. Was the new position: o In the same high-need field, but at a non-qualifying
school? o At a low-income school, but in a non-qualifying field?
j_2. Why? o Teaching in a qualifying position was too difficult. o Teaching in a qualifying position was no longer
interesting. o Teaching in a qualifying position did not pay enough. o Other (please specify)
k. I changed to a non-teaching, administrative position at a school (e.g., promotion to principal) prior to fulfilling my service
k_1. Was the non-teaching position: o At a low-income school o Not at a low-income school
A18. Did you obtain a TEACH Grant earlier in your teacher preparation program (e.g., freshman year or first year of graduate school), but not in subsequent years leading up to graduating with a teaching credential (for example, obtaining a grant in your sophomore year, but not your senior year)?
Please select only one.
Yes No Go To Question A20 Don’t know Go To Question A20
Study of the Teacher Education Assistance for College and Higher Education (TEACH) Grant Program
123
A19. Why did you obtain a TEACH Grant earlier in your teacher preparation program, but not in subsequent years?
Please select only one.
I did not meet counseling requirements of the TEACH Grant (i.e. did not pass the counseling quiz or complete required counseling)
I did not meet the academic requirements I transferred to a teacher preparation program for a different field of teaching I stayed in a qualifying field but transferred to an institution that doesn’t offer TEACH Grants I decided to pursue a field and career other than teaching I changed my mind about my intention to teach in a high-need field at a low-income school Other (please specify) __________________________________________________
A20. Do you consider yourself to be Hispanic/Latino?
Please select only one.
Yes No
A21. In addition, select one or more of the following racial categories to describe yourself:
Please select one or more.
American Indian or Alaska Native Asian Black or African American Native Hawaiian or Pacific Islander White
END. Thank you for completing this survey.
Study of the Teacher Education Assistance for College and Higher Education (TEACH) Grant Program
124
Dean of Education Protocol 1. As you know, one grant offered by the US Department of Education that is specifically designed to
support students who are planning to teach is the TEACH Grant. How much do you know about the TEACH Grant program? If they do not say, ask when their university began to administer the TEACH Grant?
a. To what extent were you and your faculty involved in deciding whether your institution would participate in the TEACH Grant program?
b. Did you have any concerns about participating in the grant program?
2. How does the TEACH Grant fit within the goals and objectives of the school or college of education and its programs to prepare teachers? How does your university/school of education use the TEACH Grant to meet those goals (e.g., for recruiting students who plan to teach STEM fields)?
Probes:
a. For example, does the school or college of education use the grant program to attract students who are interested in high-need fields and/or encourage students to go into high-need fields (e.g., STEM, special education, bilingual education) or consider teaching at high-need schools? Please explain.
b. Can you discuss how the TEACH Grant aligns with any other activities that are used to promote teaching in high-need fields or in high-need schools?
c. What does the university/school do to promote the availability of the TEACH Grant?
3. How does the school or college of education staff and faculty coordinate with other entities within your institution in administering the TEACH Grant?
Probes:
a. Do you meet regularly with teacher education program staff, the financial aid office, or others to discuss criteria for eligibility, implementation of the TEACH Grant or other similar grant opportunities for students? Is this coordination effective?
b. Who determines when students become eligible for the TEACH Grant? c. Who explains grant eligibility and requirements to students and to faculty? d. Who do students contact at [name of IHE] if they have any questions once they have become
grant recipients?
4. In your opinion, what motivates students to apply for the TEACH Grant?
a. Does the students’ interest come from a need for financial aid, an interest in teaching or, elsewhere?
5. Based on the survey results we reviewed, your institution uses criteria [cite the survey results to inform specific criteria such as academic level, GPA higher than the federal minimum] to determine eligibility to receive TEACH Grants at your institution.
Please explain why these criteria are in place.
a. Sometimes, students receive TEACH Grants in their first year, second year or third year. Who determines when students at your become eligible for the TEACH Grant?
Study of the Teacher Education Assistance for College and Higher Education (TEACH) Grant Program
125
b. How are the grant eligibility requirements explained to students, faculty, and staff such as advisors, counselors, field placement staff, etc.?
c. Has the timing of the eligibility changed from when you first started to administer the grant to now?
6. As you might know, the national average grant-to-loan conversion rate is high which is what prompted the Department to learn more about the grant program. What do you see happening in your institution with grant-to-loan conversion rates? Given the unique circumstances at your institution, what are your goals and expectations for these grants?
Probes:
a. What challenges does the school or college of education experience when administering the grant?
b. Are there local labor market or other economic factors that you think come into play that might impact a recipient’s ability to complete the grant requirements? For example, what are the employment opportunities available for teaching candidates in local districts? And how might this Grant align or not align with what you see happening in the field?
c. What strategies do the school or college of education implement to help the IHE better administer the grant?
d. How is your institution monitoring students as they complete the grant program requirements? Or, do you have data on the overall completion of the grant requirements over time?
e. What data would help your institution better monitor outcomes associated with the TEACH Grant?
7. Have you and your faculty discussed the reasons why students do not meet the program service and other Grant requirements? If so, what are those reasons?
a. Have you discussed the reasons why students might not request TEACH Grant awards in subsequent years? If so, what are those reasons? If no, do you have any ideas of why?
b. Have you discussed how to address those reasons? If so, have you implemented any strategies? Have those strategies been effective?
8. From your perspective as dean, what are the primary challenges associated with administering the TEACH Grant?
9. What contextual factors, if any, at your institution affect TEACH Grant administration and support for grant recipients? For example, are there opportunities to provide additional support for students who receive TEACH Grants to find placements in schools that would fulfill the grant requirements?
10. How do you ensure that students (who will be teaching in high-need schools) have the necessary experiences in terms coursework, field placement, job placement, counseling, and support to be successful in meeting the TEACH Grant requirements?
11. Thank you for your time today. Before we end, are there any other things you would like me to know about the IHE’s implementation of the TEACH Grant and the support of TEACH Grant recipients that we haven’t discussed?
Study of the Teacher Education Assistance for College and Higher Education (TEACH) Grant Program
126
Financial Aid Staff Protocol 1. I’d like to begin by asking you to describe your role within this financial aid office as it applies to
supporting the administration of the TEACH Grant.
a. How long have you been in your position as financial aid officer and supporting TEACH Grant activities?
b. Are other staff in the financial aid office involved in administering the TEACH Grant (such as Grant counseling, etc.)? If so, how?
c. What support, training, and/or guidance, did you receive in preparation for administering this grant as part of financial aid opportunities for students in your institution and where did that support/training/guidance come from?
d. Was the training and support you received adequate? Please explain. What additional training or support would be helpful?
2. What is your understanding of why your institution participates in the TEACH Grant opportunity? How does the TEACH Grant fit within the larger context of helping students finance their education? For example, is this Grant often combined with other grants or loans? How does it interface with other financial aid and grant opportunities?
a. Do you typically encourage students who express interest in becoming teachers to apply for this grant? If so, why? Under what circumstances?
b. Do you offer the opportunity to receive a TEACH Grant to students at any stage in their education (e.g., first year vs. third or fourth year or graduate students)?
c. In general, what does the financial aid portfolio look for students who apply for the TEACH Grant? Are they typically relying on multiple sources of grants? Is it typically students who have a high financial need or typically students with less financial aid?
3. Once students decide to apply for the grant, what steps do they need to complete to submit the application? Please describe any barriers in completing this process.
Probes:
a. What internal financial aid processes determine if students meet the grant eligibility requirements? Do you monitor whether the students meet the requirements initially and ongoing? Please explain.
b. How, if at all, does the financial aid office coordinate with the college/school of education to determine initial and ongoing eligibility?
4. Based on survey results we reviewed, the financial aid office reported that its staff informs students about the TEACH Grants through [fill in modes based on survey results — e.g., online email communications, phone, in-person/group financial aid counseling sessions].
How did the office decide to use these communication approaches? Please explain further: (e.g., cost-effectiveness, most effective way to communicate, broadest reach, etc.). Note to interviewer: Consider skipping this question, depending on responses from survey results.
Study of the Teacher Education Assistance for College and Higher Education (TEACH) Grant Program
127
Probes:
a. Please say more about how financial aid staff responsible for the implementation of the TEACH Grant conducts these activities to promote awareness of this grant opportunity to students?
5. When the financial aid office conducts activities to inform students about the availability of these grants, do you find that many students already know about the TEACH Grant? To the extent that students already know, can you explain where they received this information?
6. Based on survey results we reviewed, your institution uses the following methods to counsel students [fill in, e.g., online, in-person]. Why are these modes used and how does this relate to the goals, approaches, and constraints of the financial aid office?
a. How does the financial aid staff communicate with students about the requirements of the grant (e.g., how do you approach your discussion with students about the grant? How do you describe the benefits versus the requirements and how much detail do you typically go into? How do financial aid staff follow-up with potential applicants? Is it through scheduled aid packaging communications/meetings?
b. Who in the financial aid office can students contact if they have any questions once they have become grant recipients? To what extent do the students use this particular financial aid contact?
c. How does the financial aid office communicate with college/school of education faculty and staff about the grant requirements?
7. Based on your interactions with students, in your opinion, how well do TEACH Grant recipients understand program requirements?
a. Are there other or additional activities that financial aid staff can use to help clarify or reinforce knowledge about the grant requirements for students?
8. As you might know, the national average grant-to-loan conversion rate is high which is what prompted the Department to learn more about the grant program. What do you see happening in your institution with grant-to-loan conversion rates? Based on interactions between financial aid staff and recipients, to what do you attribute this?
Probes:
a. What are some challenges that the financial aid office faces in administering the grant? b. What strategies, if any, does the financial aid office use to overcome the challenges you just
mentioned.
9. Based on observed or documented interactions between financial aid staff and recipients, would you discuss the reasons TEACH Grantees meet or do not meet the grant requirements (Is it because they stop participating or do not meet the requirements)?
a. What reasons do students provide? Is there a common reason that students provide? b. Do your office monitor completion of the grant requirements once student graduate? c. Do you share this information with the college of education dean(s), faculty, or other staff?
Explain what data you share and how data are shared.
Study of the Teacher Education Assistance for College and Higher Education (TEACH) Grant Program
128
10. Based on your work with students in the financial aid office, have you identified other factors besides the grant requirements that affect administration of the grant at the institution, financial aid office, or school or college of education level?
11. Do you have any uncertainties about the TEACH Grant program and its requirements?
a. How does this grant compare to other grant federal grant opportunities? b. Are the TEACH Grant requirements as easy to navigate and apply for as other grant
opportunities? c. Are the grant requirements more stringent or less stringent than other grants? d. Do you have any suggestions on how the Department of Education could support the
implementation of these grants?
12. Thank you for your time today. Before we end, are there any other things you would like me to know about the financial aid office’s administration of the TEACH Grant that we haven’t discussed?

Study of the Teacher Education Assistance for College and Higher Education (TEACH) Grant Program
129
Candidate Recruitment for Teacher Education Programs
1. Please describe your role in the college/school of education.
2. Please describe how the college/school of education recruits candidates for its teacher education programs and if there are activities recruiting candidates that pursue teaching in high-need fields in low-income schools.
3. The TEACH Grant program is designed to support students who are interested in teaching in high-need fields in underserved schools. Does your institution (including the school of education) use the TEACH Grant program to recruit students especially to pursue high-need fields in high-need schools?
a. Describe the recruitment process, timing of recruitment activities, and how the TEACH Grant fits into that process.
b. Describe any teaching candidate recruitment materials that reference or incorporate information about the TEACH Grant. (Ask interviewee to provide copies of materials, if available)
c. Are there any challenges associated with using the TEACH Grant as a recruitment tool? Please explain.
d. Has your teacher education program(s) been successful using the TEACH Grant as a recruitment tool? Please explain. Ask about specific practices used.
4. How effective is the TEACH Grant as an approach to recruit candidates into the teaching profession? Please explain especially as it pertains to pursuing high-need fields in high-need schools.
a. Is the grant effective to recruit candidates to teach in high-need subjects and high-need schools? Please explain.
b. Are there any aspects of the grant that work as a disincentive to students as they consider applying for the grant? Please explain.
c. Do you collect any data on the percentage of students recruited with and without the TEACH Grant?
5. How could your institution better use the TEACH Grant as an approach to recruit candidates into their program(s)? Do you have any suggestions?
6. Do you have suggestions on how the Department of education could better support your use of the grant to recruit students into teaching and in high-need fields in high-need schools?
7. Thank you for your time today. Before we end, are there any other things you would like me to know about how the TEACH Grant is used in teacher education program recruitment that we haven’t discussed?
Study of the Teacher Education Assistance for College and Higher Education (TEACH) Grant Program
130
Teacher Education Program: Admissions 1. I’d like to begin by asking you to describe your role as it relates to the school or college of
education’s process to admit students into the teacher education program(s).
2. Please describe the teacher education program(s) admissions process. When are students expected to apply? Who reviews their application and makes the final decision to admit? How and when do they hear about acceptance into the program to which they are applying?
a. Are there additional requirements that candidates need beyond the institution’s admissions requirements that are specific for admission into the college/school of education? Please explain. Probe to get at selectivity.
3. As an admissions officer, do you receive information about specific financial aid programs designed to support prospective teachers?
a. If so, can you describe how you learned about the TEACH Grant and its requirements?
4. [NOTE: This question should be linked to the survey response related to whether students must be admitted to a teacher education program as a prerequisite for receiving a TEACH Grant. Our knowledge of this should frame the opening to the question.]
When and how, if at all, does the admissions office or admissions committee inform new teacher education candidates about the TEACH Grant? Please explain.
a. Prior to being admitted into the teacher education program, what steps have students typically taken to learn about and engage with the TEACH Grant? Have they already applied for the grant? [IF Yes] Are admitted students referred to any other departments or individuals to receive more information or assistance with the TEACH Grant? Please explain.
b. What percentage (less than a quarter, a third, half, etc.) of admitted students, would you say, have prior knowledge of the TEACH Grant (meaning they have heard about the grant before you share grant information with them).
c. How are decisions made about students who do not meet the admissions requirements when they apply?
d. How does the college/school of education monitor TEACH Grant recipients’ progress in completing coursework?
5. Would you describe the cohort of TEACH Grant students (e.g., geographic origin, and teaching interests (levels and subject matter)? How, if at all, have the cohorts changed over the course of the grant administration?
6. From the perspective and experience of using the TEACH Grant within the admissions process, would you describe any major challenges or best practices related to the use of the TEACH Grant?
a. [If used as a recruitment strategy:] If you regard the TEACH Grant as an opportunity to recruit students and have used it in that way, what challenges have you experienced? What improvements could be made to accomplish your goals? Based on your experience, what practices or policies at the IHE or school level would facilitate the use of the grant program in this way?
7. Thank you for your time today. Before we end, are there any other things you would like me to know about the TEACH Grant as part of the admissions and selection process that we haven’t discussed?
Study of the Teacher Education Assistance for College and Higher Education (TEACH) Grant Program
131
Teacher Education Program: Student Advisement and Counseling
1. I’d like to begin by asking you to describe your role (or generally the role of faculty and staff) advising and counseling students within the school or college of education’s teacher education program(s).
2. Can you describe the advising and counseling provided to students at your institution, specifically as it relates to the TEACH Grant?
a. When students are admitted into a program, when are they assigned an advisor? b. How is advisor and advisee assignment determined? How often do students meet with
advisors? c. What type(s) of information do advisors provide to students?
3. As a member of the student advisement/counseling staff, how do you receive information about financial aid designed to support education costs for prospective teachers?
a. How did you learn about the TEACH Grant in particular?
4. The TEACH Grant is designed to support students who are interested in teaching in high-need fields in underserved schools. Is there specific guidance or counseling about the TEACH Grant that teacher education program advisors provide to students, either before or after they apply for the grant? Please explain.
a. Probe for information as to whether student advisors provide information, and what type of information, on grants and scholarships, including the TEACH Grant.
b. Probe to inquire about certain information, tools, resources, or other individuals to whom advisors refer a student, particularly about the grant.
5. If not answered already: Are you involved in the advisement of teacher education program students to field placement and job opportunities? If yes, how do advisors work with students to ensure that their opportunities align with the requirements of the TEACH Grant? Please explain.
6. As an advisor, do you monitor student progress in fulfilling the requirements related to the TEACH Grant? If not, does anyone else in the college/school of education monitor progress of fulfilling those requirements?
7. Do you have any suggestions that could help other student advisors provide advisement and counseling to students about the TEACH Grant and its requirements?
8. Thank you for your time today. Before we end, are there any other things you would like me to know about student advising and counseling as it relates to the TEACH Grant within your school or college of education teacher education program(s) that we haven’t discussed?
Study of the Teacher Education Assistance for College and Higher Education (TEACH) Grant Program
132
Field Study and Student Teaching Placement 1. I’d like to begin by asking you to describe your role (or generally the role of faculty and staff) in
placing and mentoring students in student teaching and field study placements.
2. Describe how field study placement and student teaching and mentoring work across your school or college of education’s teacher education program(s).
3. Who is responsible for making decisions about student teaching and field study placements?
a. Are there others who participate in those decisions? If so, how?
4. From the perspective of placing students for student teaching, what school or classroom factors, cooperating teacher criteria, or characteristics of students does the school or college of education consider in determining the best fit for student teaching?
Probe:
a. Are TEACH Grant recipients assured student teaching in high-need subjects and schools? b. Are TEACH Grant recipients assured field study placement in high-need fields and high-need
schools?
5. Does the university have a partnership(s) with specific local education agencies (LEAs) to facilitate the placement of students into classrooms for their student teaching assignments?
a. Probe for names of LEAs, students served at LEAs, and so on. b. In which school districts or schools do most of your candidates complete their student
teaching?
6. You mentioned a partnership with X school districts.
Describe how TEACH Grant recipients’ service requirements are taken into consideration when placing students in these school districts or schools.
Probe for information on whether these school districts or schools are ones in which TEACH Grant recipients could fulfill their service requirements.
7. Does your program face challenges in terms of student teaching and field study placements? For example, in some districts, student teaching is only done in a subset of schools or with a limited number of cooperating teachers. Are you able to place all TEACH Grantees in student teaching and field study placements that address their grant requirements? If not, what would you estimate is the percentage of students you are able to place so they can gain the experience they need?
8. As the field study and student teaching placement coordinator, what additional challenges do you face with placements and what solutions have you found to some of those challenges? Please explain.
9. Thank you for your time today. Before we end, are there any other things you would like me to know about the experiences you and your school or college has had regarding student teaching and field study placement and student teacher mentoring as it relates to the TEACH Grant that we haven’t discussed?
Study of the Teacher Education Assistance for College and Higher Education (TEACH) Grant Program
133
Teacher Education Program: Job Placement
1. I’d like to begin by asking you to describe your role assisting teacher candidates who have successfully completed their program requirements in the job search and hiring process).
a. Is this role shared by others in the school or college of education? If so, is there a common approach used by everyone who assists students? Please describe.
2. Please explain how your program and institution support teaching candidates with job search and placement as they are preparing to graduate or after graduation.
a. As a job placement coordinator, how do you learn about teaching candidates who are TEACH Grant recipients?
b. Does [name of institution] have partnerships with districts to facilitate the hiring of TEACH Grant recipients in high-need schools? How do these partnerships work?
c. Are there other ways such a partnership can support new hires with the successful completion of TEACH Grant requirements (such as ongoing mentoring for the challenges of the first year or two or three of teaching)?
3. If not already answered: As a faculty member or staff in the school or college of education working with students in the hiring process, when do you begin working with students to support their search for full-time teaching positions? What steps do you take with or in support of students to accomplish this goal?
4. Where are the majority of your teaching program candidates hired? Can you describe the geographic and demographic characteristics of these school districts? Is this also where program completers who are trained to teach in high-need schools/TEACH Grant recipients typically get hired?
a. Probe for names of LEAs, students served at LEAs, number of high-need schools, and so on. Listen for information on whether the LEAs and schools meet TEACH Grant requirements. Listen for contextual factors that are beyond the control of the IHE.
b. In your opinion, are there local labor market factors that might impact whether teaching candidates complete the service requirements for the TEACH Grant?
5. In your opinion as a person who assists students in job placement, to what degree do the TEACH Grant requirements influence teaching candidates’ job search strategies when looking for full-time teaching positions? Please explain.
a. For example, in the job search, how do candidates successfully find the schools where they can fulfill TEACH Grant requirements? Probe for teaching candidate understanding of the service requirements and the degree to which the job placement coordinator helps grant recipients find eligible positions.
6. When you’re working with students to identify full-time teaching opportunities, to what extent have you found the TEACH Grant requirements are influencing candidates’ decisions to pursue teaching in a high-need field at a high-need school? Please explain.
Study of the Teacher Education Assistance for College and Higher Education (TEACH) Grant Program
134
7. From your perspective as a job placement coordinator, what are the barriers or challenges candidates face when looking for a full-time teaching position that will fulfill the TEACH Grant requirements? Please explain.
8. As a job placement coordinator, have you identified and/or implemented any strategies to help teaching candidates obtain jobs in TEACH Grant eligible schools? Please explain.
9. Does your school or college of education have information or knowledge of student employment after they complete their degree requirements and teacher certification requirements? If yes, ask the following questions:
a. Do you use this information to support grant recipients post-graduation (e.g., do you follow up with recipients with reminders of how many years of service are left agreement to serve)?
b. Do you know how soon after students are hired and are teaching after they graduate from your teacher preparation program(s)?
c. About what percentage would you say become a classroom teacher within one or two years after completing their degree?
d. Do TEACH Grant recipients typically find employment with the districts where they complete their student teaching?
e. On average, how long do your candidates remain in the classroom? f. On average, how long do your candidates remain teaching in their first school? g. What percentage of TEACH Grant recipients obtain teaching jobs in high-need fields and
high-need schools?
10. Thank you for your time today. Before we end, are there any other things you would like me to know about the teaching candidate’s job placement in regard to the TEACH Grant program that we haven’t discussed?


The Department of Education’s mission is to promote student achievement and preparation for global competitiveness by fostering educational excellence and ensuring equal access.
www.ed.gov