Embed Size (px)
Citation preview
Study on a Horizontal Axial Flow Pump duringRunaway Process with Bidirectional OperatingConditionsKan Kan ( kankanhhueducn )
Hohai UniversityQingying Zhang
Hohai UniversityZhe Xu
Hohai UniversityHuixiang Chen
Hohai UniversityYuan Zheng
Hohai UniversityDaqing Zhou
Hohai UniversityMaxima Binama
Hohai University
Research Article
Keywords Horizontal axial ow pump Runaway process Bidirectional operating condition Vortextransport equation Volume of uid
Posted Date July 15th 2021
DOI httpsdoiorg1021203rs3rs-707821v1
License This work is licensed under a Creative Commons Attribution 40 International License Read Full License
Nomenclature
f Frequency (Hz) fi External body force term (N) g Gravity acceleration (ms2) Z The number of the impeller blades
R Radius of the impeller (m) Z The number of impeller blades
H Delivery head (m) H0 Initial head (m) J Total unit moment of inertia (kgm2) M Total torque of the impeller (kNmiddotm) M0 Initial total torque of the impeller (kNmiddotm) F Axial force of the impeller (kN) F0 Initial axial force of the impeller (kN) n Rotational speed (rmin) n0 Initial rotational speed (rmin) Q Flow rate (m3s) Q0 Initial flow rate (m3s) P Pressure integral (N) p Static pressure (Pa) t Time (s) Δt Time-step (s) η Efficiency () α phasic volume fraction
u Velocity (ms) Ux The axial velocity (ms) Ut The tangential velocity (ms) Sw Swirl number ω Vorticity (s-1) ρ Density (kgm3) ν Kinematic viscosity (m2s) νm Mixture kinematic viscosity (m2s) νt Turbulent kinematic viscosity (m2s) Hamilton operator
2 Laplacian operator Abbreviations
1-D One-dimensional 3-D Three-dimensional BPF Blade passing frequency
BRC Backward runaway condition
CFD Computational fluid dynamics
FRC Forward runaway condition
FVM Finite volume method
MOC Method of characteristics
PS Pressure surface
RANS Reynolds averaged Navier-Stokes
RSI Rotor-stator interaction
SS Suction surface
SST Shear-stress transport STFT Short-time Fourier transform
SIMPLEC Pressure-linked equation-consistent TKE Turbulence kinetic energy
UDF User defined function
VOF Volume of fluids
Study on a Horizontal Axial Flow Pump during Runaway Process 1
with Bidirectional Operating Conditions 2
Kan Kanabc Qingying Zhanga Zhe Xub Huixiang Chenbcd Yuan Zhengab Daqing Zhouab Maxima 3
Binamab 4
aCollege of Energy and Electrical Engineering Hohai University Nanjing 211100 PR China 5
bCollege of Water Conservancy and Hydropower Engineering Hohai University Nanjing 210098 PR 6
China 7
cNantong Ocean and Coastal Engineering Research Institute Hohai University Nanjing PR China 8
dCollege of Agricultural Science and Engineering Hohai University Nanjing 210098 PR China 9
10
Abstract The ultra-low head pump stations often have bidirectional demand of water delivery so there 11
is a risk of runaway accident occurring in both conditions To analyze the difference of the runaway 12
process under forward runaway condition (FRC) and backward runaway condition (BRC) the whole 13
flow system of a horizontal axial flow pump is considered The Shear-Stress Transport (SST) k-ω model 14
is adopted and the volume of fluid (VOF) model is applied to simulate the water surface in the reservoirs 15
Meanwhile the torque balance equation is introduced to obtain the real time rotational speed then the 16
bidirectional runaway process of the pump with the same head is simulated Additionally the vortex 17
transport equation is proposed to compare the contribution of vortex stretching and vortex dilatation 18
terms According to the changing law of the impeller torque the torque curve can be divided into five 19
stages the drop braking rising convergence and runaway stages By comparison the rising peak value 20
of torque under FRC is significantly higher than that under BRC in the rising stage Simultaneously 21
through the short time Fourier transform (STFT) method the amplitude of torque pulsation is obviously 22
different between FRC and BRC The analysis reveals that the flow impact on blade surface increases 23
the pressure difference between the two sides of the blade in braking condition which leads to the torque 24
increase in the rising stage Moreover the pulsation amplitude of torque is mainly affected by the 25
integrity of the vortex rope 26
Abstract Horizontal axial flow pump Runaway process Bidirectional operating condition Vortex 27
transport equation Volume of fluid 28
29
1 Introduction 30
The distribution of water resources in China is uneven in time and space due to the special 31
geographical and climatic conditions Flood and drought disasters occur frequently and the areas with 32
abundant water resources and high water load are asymmetrical [1] To solve the problem of water for 33
production and domestic use China carried out a large number of water diversion drought and flood 34
prevention projects represented by the South-North Water Diversion strategic project As a key power 35
support and energy conversion device in this significant project pump station bears important tasks of 36
water supply and drainage irrigation allocation flood prevention and drought prevention environmental 37
control and river regulation which also plays a vital role in agricultural production [2] 38
When a pump system suddenly stops its normal operations by accident if the outlet gate fails to cut 39
off the water timely the water in pump conduit will flow from upstream to downstream then blades will 40
rotate in the opposite direction under the influence of the backflow Thereafter the rotational speed of 41
impeller continues to increase until a stable maximum rotational speed called runaway speed is reached 42
Under runaway condition the flow pattern inside the conduit will inevitably face violent instability 43
phenomenon which will easily induce severe pressure pulsations and sharp change of blade stress 44
Therefore the research on the transient process of pump system is of great significance for safe and 45
stable operations of pump stations 46
A widely applied method for researching the transient process in pump system is one-dimensional 47
method of characteristics (1D-MOC) The MOC was adopted to simulate the water hammer in long-48
distance water conveyance system at first [34] Thereafter a variety of MOC methods were improved to 49
investigate the transient flow for the advantages of high accuracy and robust convergence in hydraulic 50
system [56] In addition some scholars also studied the influence of different start-up modes and 51
discharge valve openings on the external characteristics of pumps during the transient process [78] With 52
the rapid development of modern numerical software computational fluid dynamics (CFD) has become 53
a useful tool to simulate the evolution law of the internal flow field in pump units [9-11] At the same 54
time three-dimensional (3D) numerical method has been widely applied on the simulation of various 55
transient processes such as start-up shut down runaway process power off and so on [12-14] 56
Some investigated parameter settings of the relative scholars literatures on runaway transient 57
process are presented in Table 1 The model test of transient process is dangerous and expensive in most 58
cases hence experiments of steady condition are often used to test the authenticity and accuracy of 59
numerical simulation [1516] For numerical methods the MOC and 3D simulations differ a lot in 60
modeling and calculation but only a few scholars combined MOC in pressure pipes with 3D transient 61
simulation in hydraulic units [1718] Simultaneously CFX and Fluent became the most widely used 62
CFD components in 3D simulation during transient process owing to their strong adaptability and flexible 63
programmability To close the control equations with low computational cost and reasonable accuracy a 64
variety of turbulence models have been widely used in simulations such as two-equation turbulence 65
models [19-25] four-equation turbulence model [171826] and the SST based Scale-Adaptive 66
Simulation (SAS) model [151627-29] Additionally the compressibility of water is not considered for 67
most studies however few scholars still adopted the user-defined density function with pressure as an 68
independent variable in their investigations [171821] Considering that the simulation of runaway 69
transient process requires more computing time than general steady simulations most scholars reduce 70
the number of grid within reasonable limits for fewer computing cost In most cases the time-step varied 71
from 15times10-4s to 2times10-3s which makes the runner rotate 05-3 degrees per time-step approximately 72
All mentioned works above have contributed a lot to parameter setting and research method 73
selection of the runaway transient process within pump and turbine units Considering the actual water 74
level difference between upstream and downstream most studies mainly focus on the runaway process 75
of single flow direction and the reservoirs near the pump system are always ignored for simplification 76
Therefore compared to the relative researches on runaway simulation this paper provides three 77
innovations Firstly the runaway process with super low head pump (below 1 m) is considered Secondly 78
multiphase flow model was adopted to simulate the free surface between air and water Lastly the 79
runaway transient operations under bi-directionally incoming flow are analyzed in this paper 80
The remainder of this paper is organized as follows an entity 3D model of the horizontal axial flow 81
pump is presented and VOF model is introduced in section 2 In section 3 this paper analyzes the torque 82
and axial force in time and frequency domains explains the increase of torque and axial force in the 83
rising stage establishes the link between vortex rope and torque fluctuation amplitude and exhibits the 84
flow regime in different states Section 4 summaries the whole work and gives the potential research 85
issues for future research focus 86
Table 1 Recapitulation of parameter description of runaway research 87
Main author Turbine Research method Runaway
head Dimension Solver
Turbulence
model
Nicolet et al Francis turbine Finite difference
method 440 m 1D SIMSEN
Zeng et al Pump turbine MOC 145 m 1D TOPSYS
Hosseinimanesh et al Francis turbine Simulation 3D CFX k
Liu et al Kaplan turbine Simulation 10 m 3D Fluent RNG k
Fortin et al Propeller turbine Test and Simulation 25 m 3D CFX k
Liu et al Axial flow pump Simulation 275 m 3D Fluent Realizable k
Li et al Francis turbine Simulation 20 m 3D Fluent RNG -k
Trivedi et al Francis turbine Test and Simulation 1226 m 3D CFX SAS-SST
Zhang et al Pump turbine Simulation 1055 m 1D and 3D Fluent 2 f
Xia et al Francis turbine Simulation 3D Fluent SAS-SST
Liu et al Pump turbine Simulation 178 m 3D Fluent 2 amp SST f k
Anciger et al Pump turbine Simulation 3D CFX
Feng et al bulb turbine Simulation 51 m 3D CFX SST k
2 Numerical methodology 88
21 Governing equations and turbulence model 89
The internal flow of a horizontal axial flow pump is governed by the law of mass and momentum 90
conservation The calculation domain includes upstream and downstream reservoirs with free surfaces 91
where water and air interact but not interpenetrate VOF model was developed by Hirt and Nichols [33] 92
in 1981 to track the interface between immiscible fluids which can solve highly complex flows with 93
small amount of calculation and simple operation Thus the VOF model is suitable for tracking free 94
surface and calculating the volume fraction of water phase The governing equations of the VOF 95
formulations on multiphase flow are defined as [23] 96
The continuity equation 97
+ 0t
u (1) 98
The equation of momentum 99
2pg
t
u
u u u (2) 100
The volume fraction equation 101
0i
it
u (3) 102
where u is the fluid velocity is the density p is the static pressure is the Hamilton operator 2 103
is the Laplacian operator g is the gravity acceleration and is kinematic viscosity 1 and 2 are 104
the volume fraction of air and water phase and 1 2+ =1 The density is determined from the following 105
equations 106
1 1 2 2= + (4) 107
1 1 2 2= + (5) 108
where 1 and 1 indicates gas phase 2 and 2 indicates liquid phase 109
The SST k-ω turbulence model combines the k-ε turbulence model and k-ω turbulence model with 110
blending function And the k-ω is used in the inner region of the boundary layer and switches to the k-ε 111
in the free shear flow Moreover the definition of the eddy viscosity in SST k-ω model is modified to 112
account for the transport of the principal turbulent shear stress [34] Therefore the SST k-ω turbulence 113
model was applied to close governing equations 114
22 Computational domain and boundary condition 115
A horizontal bidirectional flow shaft extended tubular pump with super low head is investigated in 116
this paper The characteristic parameters of horizontal axial flow pump under FRC and BRC are shown 117
in Table 2 Figure 1 presents the computational model of the whole pump system including the upstream 118
reservoir inlet conduit impellers guide vanes outlet conduit and downstream reservoir In addition the 119
flow direction under different conditions is identified The impeller adopts the S-shaped blades for 120
bidirectional flows and the mounting angle of the blades is -4deg 121
Table 2 Characteristic parameters of horizontal axial flow pump flow system 122
Parameters Value
FRC BRC
Diameter of impeller m 16
Number of impeller blades - 4
Number of guide vanes - 5
Blade angle deg -8 ~ 0
Runaway initial head m 091
Rotational speed rmin 170
Total unit moment of inertia kgm2 230
Design discharge m3s 5 45
123
Figure 1 Geometric model of the horizontal axial flow pump system 124
In practical engineering the ultra-low head pump stations often have bidirectional demand of water 125
delivery For FRC the initial flow field of the pump is shown in Figure 2a where water flows from 126
downstream reservoir to upstream reservoir and the water height of upstream reservoir is higher than that 127
of downstream reservoir For BRC the initial flow field of the horizontal axial flow pump is shown in 128
Figure 2b where water flows from upstream reservoir to downstream reservoir and the free surface of 129
downstream reservoir is higher 130
131
(a) 132
133
(b) 134
Figure 2 Initial flow field of the calculated domain (a) FRC (b) BRC 135
In two conditions above the boundary conditions of pressure-inlet and pressure-outlet are adopted 136
at the upstream and downstream reservoirs respectively and the user-defined function (UDF) is applied 137
to let the pressure at the boundary locations change along the water depth rather than keeping them 138
constant To be more specific the hydraulic pressure on the surface of the water is zero and the hydraulic 139
pressure under water is ρgh where h is water depth 140
23 Grid generation and sensitivity analysis 141
In numerical simulation the quality and quantity of grid have major impact on numerical simulation 142
results accuracy The ANSYS-ICEM meshing software is used to generate the structured grids in 143
consideration of its good adaptability and high quality of hexahedral structured grid in the flow field 144
Therefore O-grids are adopted to divide the inlet and outlet conduit so as to increase the grid density of 145
the boundary layer In addition the grids near the wall and free surfaces are encrypted to accurately 146
capture local data 147
The SST k-ω turbulence model is a near-wall model which can better predict the wall flow when 148
y+ is less than 5 In this paper most gridsrsquo y+ is less than 15 which meets the requirements of SST k-ω 149
turbulence model According to Table 3 five grid tested to reduce the influence of grid number on the 150
simulation results and the gird quality of different schemes is detailly introduced Figure 3 shows the 151
effect of grid number on pump head and efficiency under FRC and BRC When grid number of the whole 152
model came to 770times106 (Scheme 3) the relative variation ratio of head and efficiency is no more than 153
06 and the minimum quality is no less than 05 After weighing computing resources and grid 154
computing accuracy scheme 4 is chosen where the total grid number of flow conduit is 984times106 Figure 155
4 presents the computational grids of different flow components 156
157
Table 3 Parameter values of different numerical simulation schemes 158
Domain Mesh characteristics Unit S1 S2 S3 S4 S5
Inlet
conduit
Grid number 105 63 104 142 194 259
Min angle deg 32 34 335 335 335
Grid Quality 04 045 05 05 05
Impeller
Grid number 105 102 145 196 226 266
Min angle deg 18 18 27 27 27
Grid Quality 03 035 045 045 045
Guide
vanes
Grid number 105 64 163 240 326 360
Min angle deg 27 27 30 30 30
Grid Quality 04 045 05 05 05
Outlet
conduit
Grid number 105 51 135 192 238 286
Min angle deg 36 36 355 355 355
Grid Quality 035 06 06 06 06
159
Figure 3 Grid independency test 160
161
Figure 4 Computational grids of flow components 162
2 4 6 8 10 12084
086
088
090
092
094 Head FRC
Head BRC
H (
m)
Grid number (times106)
64
62
60
58
56
54
52
50
48 Efficiency FRC
Efficiency BRC
η (
)
24 Numerical scheme 163
In this study the user-defined function of FLUENT was introduced to control the torque balance 164
equation of the impeller that is 165
30dn M
dt J (6) 166
where J is the total unit moment of inertia n is the rotational speed M is the total torque of the impeller 167
and t is the time 168
The mechanical friction torque and the rotor wind resistance torque were not considered in the total 169
torque Then the rotational speed of every time step is obtained by using 170
1
30i i
Mn n t
J (7) 171
where Δt is the time step 172
ANSYS Fluent provides a widely used platform for UDF and flexible model selection in fluid 173
numerical simulation The finite volume method (FVM) with pressure-based solver was adopted to 174
discretize the governing equations The semi-implicit method for pressure-linked equations-consistent 175
(SIMPLEC) method was applied to the coupling solution of pressure and velocity [23] A second-order 176
upwind scheme is selected to discretize the convection and diffusion terms A first-order implicit format 177
is employed to discretize the time term 178
In this simulation the time step is set to 0001 s to make sure that the convergence criteria of the 179
RSM residuals at each time-step were below a typical criterion of 10-5 And the maximum number of the 180
iterations per time step is set to 40 When the maximum runaway speed is reached the impeller rotation 181
of each time step is about 15deg 182
3 Results and analysis 183
31 Validation of performance characteristics 184
Figure 5 shows the schematic diagram of the model test bench which consists of a downstream 185
tank an upstream tank inlet and outlet conduits an impeller guide vanes an electric motor and a belt 186
conveyor among others This paper adopts the similarity law to transform the parameters obtained from 187
model test to the prototype ones and the comparison of head and efficiency under FRC and BRC are 188
shown in Figure 6 In all the simulated steady pump conditions the delivery head error between the 189
experimental and simulated values is less than 3 and the efficiency error is also less than 3 190
191
Figure 5 Schematic diagram of model test bench for horizontal axial flow pump with ultra-low 192
head 193
194
(a) (b) 195
Figure 6 Numerical simulation and test data comparison in terms of pump head and efficiency (a) 196
FRC (b) BRC 197
32 Analysis of the torque and the axial force evolution in time and frequency domains 198
To discuss the variation of the dimensionless parameters with time the external characteristic 199
variables under FRC and BRC are divided by the averaged values at the last impeller rotating period 200
respectively The HH0 nn0 QQ0 MM0 and FF0 represent the dimensionless head rotational speed 201
flow rate torque and axial force respectively (Figures 7 and 8) The time t0 means power-off occurred 202
the time t1=7s t3=15s and trunaway=425s represent the typical time in the braking convergence and 203
runaway stage (Figure 8a) the time t2 represents the selected time before tQ=0 (Figure 8b) the time tQ=0 204
marks the end of the pump station the time tn=0 marks the start of the turbine condition the time tM=0 205
means the torque is equal to zero (Figure 8a) the time tmin and tmax represent the minimum and maximum 206
value respectively during the rising stage (Figure 8b and 8d) 207
From Figure 7 the rotational speed water head and flow rate are basically stable in the rated 208
condition (from t=0s to t=5s) Once the power-off occurred the impeller cannot provide power force to 209
drive the flow therefore the pump head and the flow rate begin to decrease Thereafter the change of 210
Downstream tank
Upstream tank
Impeller Guide vanes
Inlet conduit
Outlet conduit
Electric motor
Belt conveyor
48 50 52 54 56 58 60 62 6404
06
08
10
12
14
16
18
20
H
(m)
Q (m3s)
Q-H exp
Q-H sim
44
48
52
56
60
64
68
72 Q-η exp
Q-η sim
η (
)
36 40 44 48 52 56 6004
06
08
10
12
14
16
18
20
Q (m3s)
Q-H exp
Q-H sim
H
(m)
42
44
46
48
50
52
54
56
58
60 Q-η exp
Q-η sim
η (
)
rotational speed curves is similar under FRC and BRC owing to similar impeller torque from t=5s to tQ=0 211
When the impeller rotates in reverse after tn=0 the rotational speed starts to increase as flow rate increases 212
while the pump head decreases And the rotational speed under FRC is gradually higher than that under 213
BRC resulting from the larger flow rate under FRC When the pump is totally in runaway condition the 214
head flow rate and rotating speed are mainly steady 215
216
Figure 7 External characteristic curve under FRC and BRC 217
To detailedly investigate the variation of impeller torque and axial force the time-domain curves 218
are divided into five stages drop stage braking stage rising stage convergence stage and runaway stage 219
(Figure 8) In the drop stage the torque and axial force of blades drop rapidly due to the motor shutdown 220
In the braking stage the flow rate gradually decreases until it drops to zero at tQ=0 which has a braking 221
effect on the blades still rotating in pump mode In this case the torque and axial force change at a slower 222
rate than those in the drop stage Then comes the rising stage the value of torque and axial force increase 223
from tmin to tmax Moreover tQ=0 is in front of tmin and tn=0 is between tmin and tmax whether it is under FRC 224
or under BRC For the convergence stage the pressure difference between the inlet and outlet drives the 225
impeller to rotate continuously which makes the torque and axial force tend to be converged In addition 226
the torque slowly decreases to zero and the axial force rises to a stable value in fluctuations The last 227
stage is the runaway stage in which the torque and axial force remain stable with slight fluctuations 228
229
(a) (b) 230
0 5 10 15 20 25 30 35 40-20
-15
-10
-05
00
05
10
10 11 12 13 14086
088
090
t (s) FRC HH
0 BRC HH
0
FRC nn0 BRC nn
0
FRC QQ0 BRC QQ
0
tn=0
Dim
ensi
on
less
par
amet
ers
t (s)
t0
tQ=0
HH
0
0 5 10 15 20 25 30 35 40-02
00
02
04
06
08
10 FRC
BRC
tM=0
tM=0
t (s)
MM
0
t0
t3ampt
3t1ampt
1
drop stage
braking stage
rising stage
convergence stage
runaway stage
100 105 110 115 120 125 130004
008
012
016
020
convergence
stage
convergence
stage
rising stage
rising stage
braking stage
braking stage
FRC
BRC
t2
t (s)
MM
0
tQ=0
tn=0
tn=0
tmax
tmax
tmin
tmint
2
tQ=0
231
(c) (d) 232
Figure 8 Torque and axial force curve under FRC and BRC (a) torque curves (b) detail torque 233
curves in stage 3 (c) axial force (d) detail axial force in stage 3 234
Compared the two conditions the torque and axial force under BRC fluctuate more greatly during 235
the braking stage which shows that the flow instability is more serious under BRC In the rising stage 236
the torque grows by 159 under FRC and 109 under BRC from tmin to tmax and the axial force 237
increment under FRC is more than that under BRC During the convergence and runaway stage the 238
torque and axial force fluctuate more violently under FRC which may be related to the complex flow 239
pattern under FRC 240
In order to deeply study the fluctuations of blade torque and axial force under FRC and BRC the 241
numerical data are processed by STFT method The Hanning window function in STFT is selected to 242
avoid spectral leakage and obtain the accurate frequency The transient characteristics of pulsating 243
frequency and amplitude for torque and axial force are shown in Figures 9 and 10 244
245
(a) (b) 246
Figure 9 Transient frequency domain diagram of torque fluctuation (a) FRC (b) BRC 247
248
(a) (b) 249
0 5 10 15 20 25 30 35 4000
02
04
06
08
10
t0
FRC
BRC
t (s)
FF
0
runaway stage
convergence stage
rising stage
braking stage
drop stage
100 105 110 115 120 125 130000
004
008
012
016
020
024
convergence
stage
convergence
stage
t (s)
FF
0
tmin
tmaxt
Q=0 tQ=0
tn=0t
n=0tmin
tmax
FRC
BRC
braking stagebraking stage
rising stage
rising stage
0 5 10 15 20 25 30 35 400
100
200
300
400
500Amplitude
00
20
40
60
80
100
t (s)
f (H
z)
FRC
rising stage
convergence stage
runaway stage
braking stage
drop stage
0 5 10 15 20 25 30 35 400
100
200
300
400
500Amplitude
00
20
40
60
80
100
t (s)
f (H
z)
BRC
fBPF
0 5 10 15 20 25 30 35 400
100
200
300
400
500
5fBPF3fBPF
Amplitude
t (s)
f (H
z)
00
20
40
60
80
100FRC
fBPF
0 5 10 15 20 25 30 35 400
100
200
300
400
500Amplitude
00
20
40
60
80
100
t (s)
f (H
z)
BRC
fBPF2fBPF
3fBPF
Figure 10 Transient frequency domain diagram of axial force fluctuation (a) FRC (b) BRC 250
The pulsations of torque and axial force is mainly caused by the pressure fluctuations on blade 251
surface which is related to the rotor-stator interaction (RSI) [35] So the frequency is mainly controlled 252
by the blade passing frequency (BPF) which can be expressed as 253
BPF
Z
60
nf (7) 254
where Z is the number of impeller blades and n is the rotational speed 255
Combined with the speed curve (Figure 7) it can be confirmed that the BPF under FRC and BRC 256
is different in runaway state Figure 9 shows the blade torque fluctuation diagram In case of the braking 257
stage there is a higher amplitude with low-frequency pulsation of torque under BRC than that under 258
FRC During the convergence and runaway stage the main pulsation frequencies of torque under FRC 259
are BPF 2BPF and 3BPF and the main pulsation frequency of torque under BRC is only BPF 260
Meanwhile the pulsation amplitude under FRC is higher than that under BRC The axial force fluctuation 261
characteristics (Figure 10) is similar to the torque fluctuation What is more the pulsating characteristics 262
of torque and axial force under both conditions are consistent with the torque and axial force curves in 263
Figure 8 264
33 Pressure pulsation analysis 265
The water pressure on the blade surface is the main source of torque value and axial force so the 266
transient characteristics of the pressure pulsations in pump section are quite important Figure 11 shows 267
the monitoring planes and points The monitored pressure data were transformed by STFT in Figure 12 268
to obtain a frequency domain of pressure fluctuations 269
270
Figure 11 Pressure pulsation monitoring points 271
272
(a) (b) 273
274
(c) (d) 275
276
(e) (f) 277
Figure 12 The Transient frequency domain diagram of pressure fluctuation at monitoring points 278
(a) point 1 under FRC (b) point 1 under BRC (c) point 2 under FRC (d) point 2 under BRC (e) 279
point 3 under FRC (f) point 3 under BRC 280
As a key part of energy conversion components the impeller changes from a power source to an 281
energy dissipation part during the runaway process The BPF varies over time thus the RSI effect during 282
the transient process is different from that in the steady operation The point 1 under FRC (Figure 12a) 283
and point 2 under BRC (Figure 12d) have the similar pulsation characteristics During the period (0-5s) 284
before power failure the pulsation amplitude of the measured pressure at the inflow direction is 285
significantly larger than that at the outflow direction under both FRC and BRC which maybe is related 286
to the pressure concentration at inlet edge of the blade During the braking stage the pressure pulsation 287
amplitude in pump section would be less influenced by rotation speed because of the limited RSI effect 288
with low rotational speed Additionally the high amplitude with low-frequency pulse occurs at the point 289
1 under FRC and point 2 under BRC which may result from the flow deterioration at the inflow direction 290
of the impeller In convergence and runaway stage the frequency of pressure pulsation is strongly 291
affected by RSI Therefore there are several higher harmonics of BPF at point 1 and 2 under FRC and 292
BRC while the pulsation frequency at point 3 is dominated only by BPF Furthermore the pressure 293
pulsation amplitude of points 1 and 2 under FRC is certainly higher than that under BRC which is the 294
reason why the torque and axial force pulsation amplitude under FRC are obviously large 295
34 The pressure repartition over the blades during the rising stage 296
As we all know the torque is directly related to the pressure difference on the blade surface And 297
the pressure integral on the pressure surface (PS) and suction surface (SS) under FRC and BRC are shown 298
in Figure 13 where P represents the pressure integral on PS and SS To discuss the variation of the 299
dimensionless pressure integral with time from t = 10 s to t = 15 s (including the rising stage) the pressure 300
integral P on PS and SS under FRC and BRC are divided by the value at t = 10 s respectively From 301
Figure 13 the overall trend of the pressure integral on PS and SS is downward over time What is more 302
the pressure integral on PS under FRC and BRC have an increasing part from tmin to tmax whereas the 303
pressure integral on SS under FRC and BRC decrease sharply Therefore the pressure difference between 304
PS and SS increases from tmin to tmax which accounts for the reason why the torque enlarges in the 305
increasing stage (Figure 8b) Furthermore the pressure integral difference between PS and SS at tmax is 306
higher under FRC than that under BRC which leads to the higher torque under FRCAs a result the 307
rotational acceleration of impeller is higher at tmax under FRC than that under BRC Since the torque 308
under FRC is higher than that under BRC from tmax to about t = 30 s (Figure 8) the rotational acceleration 309
of impeller is always higher under FRC than that under BRC which leads to the separation of the 310
dimensionless rotation speed curves after tmax under FRC and BRC (Figure 7) 311
312
Figure 13 The pressure integral on PS and SS under FRC and BRC 313
In order to deeply research the reason for the pressure repartition over the blades the streamlines at 314
the middle span are displayed in Figure14 When the unit is under pump condition (t = t2) the streamlines 315
inside the impeller tend to be disordered At tmin the pump unit begins to experience backward flow 316
where the streamlines inside the impeller are further deteriorated and a wide range of low-speed vortices 317
appear At the tmax moment the impeller starts to reverse under the drive of the backflow which leads to 318
the pressure repartition on the blades Therefore the pressure difference on blade surface is larger at tmax 319
than that at tmin which contributes to the exist of the rising stage On the one hand the flow hits the PS 320
at a faster speed at tmax than that at tmin which means the pressure on PS is higher at tmax On the other 321
hand the flow separation obviously takes place on SS at tmax which indicates the pressure on SS is lower 322
at tmax than that at tmin In case of t3 the streamlines are relatively smooth and there is no inlet impact and 323
flow separation in the impeller 324
10 11 12 13 14 15092
094
096
098
100
102
t3ampt
3
FRC - PS
FRC - SS
BRC - PS
BRC - SS
t (s)
PP
t=1
0
tmin
tmin
tmax t
maxt2
t2
325
Figure 14 The streamlines on the blade to blade surface at span=05 under FRC and BRC 326
35 Vortex analysis in pump section 327
In order to research the reason why the torque and axial force oscillate to different degrees the 328
vortex distribution is taken as an important point to link flow regime with torque and axial force In 329
addition the contribution of each component in the vortex transport process is considered The vortex 330
transport equation is as follows 331
2d 1+
di m t
u u f pt
(8) 332
In the above equation the generation of vorticity can be composed of five terms (1) Vortex 333
stretching term u (2) Vortex dilatation term u (3) Physical strength term if 334
which can be ignored due to the potential of gravity (4) Baroclinic torque term 1p
which is 335
not considered in positive pressure fluid (5) Viscous dissipation term 2
m t which can be 336
ignored in high Reynolds number flows It is worth noting that vorticity and its components are 337
dominated by positive values 338
Figure 15 presents the vortex core and the vortex stretching term and the vortex dilatation term 339
distribution under FRC and BRC where the orange arrows indicate the flow direction and the Q-340
criterion is selected to identify strong vortices (actual value of Q is 50 s-2) It is known that the vortex 341
stretching term is dominant while the vortex dilatation term is less important under FRC and BRC 342
343
Figure 15 Vortex core at Q=50 s-2 and vortex stretching term and vortex dilatation term distribution 344
in impeller 345
At t1 (7 s) the shape of shedding vortices is mainly influenced by the conduit in the direction of 346
incoming flow To be specific the shedding vortices tend to be annular under FRC owing to the rotational 347
twisted impeller which disorders the flow and make the vortices bend While the shedding vortices are 348
inclined to be columnar under BRC due to the fixed guide vanes which smooths the flow and makes the 349
vortices extend as far as possible At the moment of tQ=0 the flow pattern in the pump section changes 350
dramatically and there are attached vortices at the blade inlet while shedding vortices are dominant at 351
the outlet At tn=0 since the flow rate is low the shape of shedding vortices is mainly impacted by the 352
conduit where the vortices locate Therefore the vortices are slender around the blades under FRC while 353
the vortices are short and thick insides the guide vanes under BRC In case of tM=0 and trunaway (425 s) 354
the flaky shedding vortices appear at the blade outlet under both FRC and BRC Whatrsquos more the 355
integrity of vortex rope is under the influence of the location of the guide vanes and the impeller ie the 356
vortex rope maintains intact under FRC but dispersed under BRC In this situation the axisymmetrical 357
vortex rope rotates periodically (Figure 16) which means the velocity gradient within the impeller 358
change periodically under FRC In addition the rotation frequency of vortex rope is the same as the main 359
frequency of the pressure pulsation in impeller (ie 181 Hz) which indicates that the vortex rope can 360
enforce the pulsation of torque and axial force under FRC Thus the amplitude of the torque and axial 361
force under FRC is larger than that under BRC 362
363
Figure 16 Morphology of periodical vortex rope and TKE distribution during the runaway stage 364
under FRC 365
Figure 16 indicates the periodic vortex rope and turbulence kinetic energy (TKE) distribution during 366
the runaway stage under FRC There are several whorls on the vortex rope surface among which the 367
three whorls in the closest vicinities to the impeller are clearly visible After a period of rotation the 368
phase of the surface whorls of vortex rope is consistent and the first and second whorls have developed 369
to the second and third whorls And the rotation frequency of vortex rope is the BPF As for the TKE 370
distribution it clearly exhibits the energy dissipation distribution under the influence of the vortices and 371
rotation blades For one thing the TKE at the center section is large which is consistent with the vortex 372
rope distribution For another the TKE of section A is stronger than that at section B which reveals that 373
the TKE decreases with the increase of distance from the blades 374
36 Flow pattern analysis in conduit 375
The flow patterns under the two investigated conditions are different due to differences in terms of 376
respective vortex distribution modes To describe the swirl level quantitatively in the runaway process 377
the swirl number (Sw) is introduced as follows [36] 378
2
0
2
0
d
d
R
x t
w R
x
U U r rS
R U r r (9) 379
Where Ux is the axial velocity Ut is tangential velocity and R is the hydraulic radius representing the 380
impeller radius 381
Figure 17 represents the swirl number (Sw) of the monitoring planes And the value of Sw is mainly 382
related to the shedding vortices (Figure 15) and the wide swirl zones (Figures 18 and 19) Figure 18 383
displays the streamlines and vortex core distributions (actual value of Q is 50 s-2) in the outlet conduit 384
under FRC and BRC At t1 (7s) there exists a vortex rope at the outlet of the pump section At this time 385
the Sw of plane A under BRC is obviously higher than the Sw of plane C under FRC owing to the 386
suppressed tangential velocity near the guide vanes of plane C under FRC At tQ=0 the flow state near the 387
pump section is seriously unstable and the velocity is lower than that in other time What is more the 388
rapid rising Sw leads to the vortices breakdown in the impeller section (Figure 15) At trunaway there is a 389
low velocity zone at the bottom of the flow passage which may be related to the diffusion form of flow 390
passage 391
392
Figure 17 Swirl number of the monitoring planes under FRC and BRC 393
0 5 10 15 20 25 30 35 40-05
00
05
10
15
20
tM=0
FRC-plane A
FRC-plane C
BRC-plane A
BRC-plane C
Sw
irl
num
ber
t (s)
t1
tQ=0
tn=0
Figure 19 shows the flow pattern of the inlet conduit under FRC and BRC At t1 the Sw of plane C 394
is slightly higher than that of plane A (FRC) because the water flow from plane A to plane C and the 395
tangential velocity is higher at the outlet direction of the pump section At tn=0 the flow starts to reverse 396
and pushes the shedding vortices at the pump section to the inlet conduit In case of tM=0 and trunaway the 397
vortex rope remains intact under FRC owing to the low tangential velocity in the inlet conduit At trunaway 398
the steady Sw indicates the stable flow pattern Firstly the steady water level difference between upstream 399
and downstream leads to the stable flow rate and rotation speed Secondly the stable velocity gradient 400
contributes to the stable distribution of vortex rope and shedding vortices Thirdly the RSI in a dynamic 401
equilibrium helps to structure the periotic pulsation of pressure torque and axial force 402
403
Figure 18 Streamline and vortex core distribution of outlet conduit under FRC and BRC 404
405
Figure 19 Streamline and vortex core distribution of inlet conduit under FRC and BRC 406
4 Conclusion 407
In this paper the transient characteristics of a horizontal axial flow pump with ultra-low head under 408
FRC and BRC are simulated and analyzed The VOF model is adopted to take into account the influence 409
of free surface of upstream and downstream reservoirs where the rotational speed is solved by using the 410
torque balance equation Two aspects pertaining to differences in pump operating characteristics under 411
FRC and BRC are emphatically analyzed For one hand the rising stage characteristics and associated 412
differences between the two investigated conditions For another the reason behind large torque 413
fluctuation amplitudes in the runaway stage for FRC The conclusions are as follows 414
(1) The time-domain curves of torque and axial force are divided into five stages drop stage 415
braking stage rising stage convergence stage and runaway stage And the pulsations frequency of torque 416
and axial force is mainly controlled by the BPF 417
(2) In the rising stage of torque curve that is the braking condition the pressure difference on the 418
blade surface continues to increase which serves a direct reason for the endured abnormal torque increase 419
Meanwhile the pressure difference on the blade surface under FRC is larger than that under BRC 420
therefore the increase of the torque is more serious under FRC than BRC 421
(3) When the unit is in runaway state the torque pulsation amplitude under FRC is obviously larger 422
than that under BRC This is because the rotation frequency of the vortex rope is the same as pressure 423
fluctuation frequency under FRC and then amplitude of the pressure fluctuation is enhanced Thus the 424
amplitude of torque and axial force is strengthened in the runaway stage under FRC However the vortex 425
rope is broken due to the inhibitive effect from guide vanes under BRC which fails to enhance the 426
pulsation amplitude of the pressure torque and axial force 427
(4) At tn=0 the special flow pattern products shedding vortices of different shapes namely the 428
shedding vortices are slender in impeller under FRC while they are columnar in the guide vanes under 429
BRC 430
(5) More comparative research about runaway process with different head and pump types can be 431
carried out as the next step and the characteristics of parameters in each stage should be different 432
Additionally it is necessary to further investigate how to effectively control the flow and structural 433
instability according to the flow characteristics under the runaway condition 434
Acknowledgements 435
This study was supported by the National Natural Science Foundation of China (52009033 52006053) 436
the Natural Science Foundation of Jiangsu Province (BK20200509 BK20200508) the Fundamental 437
Research Funds for the Central Universities (B210202066) and the Nantong Science and Technology 438
Bureau (JC2020092) The computational work was supported by High Performance Computing Platform 439
Hohai University The support of Hohai University China is also gratefully acknowledged 440
Author Contributions 441
KK HC and DZ designed the methodology and validation ZX YZ and MB designed and 442
executed the experiment QZ HC and ZX prepared the original manuscript KK YZ DZ and 443
MB reviewed and improved the manuscript 444
Additional Information 445
Competing Interests The authors declare that they have no conflict of interest 446
References 447
[1] Gopal C Mohanraj M Chandramohan P amp Chandrasekar P Renewable energy source water pumping 448
systems-A literature review Renew Sustain Energy Rev 25 351-370 (2013) 449
[2] Cao X Zeng W Wu M Guo X amp Wang W Hybrid analytical framework for regional agricultural water 450
resource utilization and efficiency evaluation Agric Water Manag 231 (2020) 451
[3] Thanapandi P An efficient marching algorithm for water hammer analysis by the method of characteristics 452
Acta Mech 94 105-112 (1992) 453
[4] Afshar M H amp Rohani M Water hammer simulation by implicit method of characteristic Int J Pres Ves 454
Pip 85 851-859 (2008) 455
[5] Rohani M amp Afshar M H Simulation of transient flow caused by pump failure Point-Implicit Method of 456
Characteristics Ann Nucl Energy 37 1742-1750 (2010) 457
[6] Afshar M H Rohani M amp Taheri R Simulation of transient flow in pipeline systems due to load rejection 458
and load acceptance by hydroelectric power plants Int J Mech Sci 52 103-115 (2010) 459
[7] Elaoud S amp Hadj-Taieb E Influence of pump starting times on transient flows in pipes Nucl Eng Des 241 460
3624-3631 (2011) 461
[8] Chalghoum I Elaoud S Akrout M amp Taieb E H Transient behavior of a centrifugal pump during starting 462
period Appl Acoust 109 82-89 (2016) 463
[9] Suh J W et al Unstable S-shaped characteristics of a pump-turbine unit in a lab-scale model Renew Energy 464
171 1395-1417 (2021) 465
[10] Chen H et al On the hydrodynamics of hydraulic machinery and flow control J Hydrodyn Ser B 29 782-466
789 (2017) 467
[11] Feng J et al Numerical investigation on characteristics of transient process in centrifugal pumps during power 468
failure Renew Energy 170 267-276 (2021) 469
[12] Trivedi C et al Investigation of a Francis turbine during speed variation Inception of cavitation Renew 470
Energy 166 147-162 (2020) 471
[13] Fu X et al Dynamic instability of a pump-turbine in load rejection transient process Sci China-Technol Sci 472
61 1765-1775 (2018) 473
[14] Kan K et al Numerical simulation of transient flow in a shaft extension tubular pump unit during runaway 474
process caused by power failure Renew Energy 154 1153-1164 (2020) 475
[15] Trivedi C Cervantes M J amp Gandhi B K Investigation of a High Head Francis Turbine at Runaway 476
Operating Conditions Energies 9 030149 103390en9030149 (2016) 477
[16] Trivedi C Cervantes M J Gandhi B K amp Ole Dahlhaug G Experimental investigations of transient 478
pressure variations in a high head model Francis turbine during start-up and shutdown J Hydrodyn Ser B 26 479
277-290 (2014) 480
[17] Zhang X Cheng Y Xia L amp Yang J in 27th IAHR Symposium on Hydraulic Machinery and Systems Vol 481
22 IOP Conference Series-Earth and Environmental Science (eds N Desy et al) (2014) 482
[18] Zhang X Cheng Y Xia L Yang J amp Qian Z Looping Dynamic Characteristics of a Pump-Turbine in the 483
S-shaped Region During Runaway J Fluids Eng-Trans ASME 138 033297 (2016) 484
[19] Hosseinimanesh H Vu T C Devals C Nennemann B amp Guibault F in 27th IAHR Symposium on 485
Hydraulic Machinery and Systems Vol 22 IOP Conference Series-Earth and Environmental Science (eds N 486
Desy et al) (2014) 487
[20] Fortin M Houde S amp Deschenes C A Hydrodynamic Study of a Propeller Turbine During a Transient 488
Runaway Event Initiated at the Best Efficiency Point J Fluids Eng-Trans ASME 140 040232 (2018) 489
[21] Fortin M Houde S amp Deschenes C in 27th IAHR Symposium on Hydraulic Machinery and Systems Vol 490
22 IOP Conference Series-Earth and Environmental Science (eds N Desy et al) (2014) 491
[22] Liu S Zhou D Liu D Wu Y amp Nishi M in 25th IAHR Symposium on Hydraulic Machinery and Systems 492
Vol 12 IOP Conference Series-Earth and Environmental Science (eds R SusanResiga S Muntean amp S 493
Bernad) (2010) 494
[23] Liu Y Zhou J amp Zhou D Transient flow analysis in axial-flow pump system during stoppage Adv Mech 495
Eng 9 1687814017723280 1011771687814017723280 (2017) 496
[24] Feng J Li W Luo X amp Zhu G Numerical analysis of transient characteristics of a bulb hydraulic turbine 497
during runaway transient process Pro Inst Mech Eng Part E-J Process Mech Eng 233 813-823 (2019) 498
[25] Li J Wu Y Liu S amp Zhu Y 3D unsteady turbulent simulation of the runaway transient of the Francis turbine 499
In ASMEJSME 2007 5th Joint Fluids Engineering Conference 1 2005-2011 (2007) 500
[26] Liu J T et al in 26th IAHR Symposium on Hydraulic Machinery and Systems Pts 1-7 Vol 15 IOP Conference 501
Series-Earth and Environmental Science (eds Y Wu et al) (2013) 502
[27] Xia L Cheng Y You J Jiang Y in 28th IAHR Symposium on Hydraulic Machinery and Systems Vol 49 503
IOP Conference Series-Earth and Environmental Science (2016) 504
[28] Xia L et al Evolutions of Pressure Fluctuations and Runner Loads During Runaway Processes of a Pump-505
Turbine J Fluids Eng-Trans ASME 139 036248 (2017) 506
[29] Xia L et al Mechanism of the S-Shaped Characteristics and the Runaway Instability of Pump-Turbines J 507
Fluids Eng-Trans ASME 139 035026 (2017) 508
[30] Nicolet C et al Unstable operation of francis pump-turbine at runaway rigid and elastic water column 509
oscillation modes Int J Fluid Mach amp Syst 2 324-333 (2009) 510
[31] Zeng W Yang J amp Guo W Runaway Instability of Pump-Turbines in S-Shaped Regions Considering Water 511
Compressibility J Fluids Eng-Trans ASME 137 029313 (2015) 512
[32] Anciger D Jung A amp Aschenbrenner T in 25th IAHR Symposium on Hydraulic Machinery and Systems Vol 513
12 IOP Conference Series-Earth and Environmental Science (eds R SusanResiga S Muntean amp S Bernad) 514
(2010) 515
[33] Hirt C W amp Nichols B D Volume of fluid (VOF) method for the dynamics of free boundaries J Comput 516
Phys 39 201-225 (1981) 517
[34] Menter F R Two-equation eddy-viscosity turbulence models for engineering applications AIAA J 32 1598-518
1605 (1994) 519
[35] Gu Y Pei J Yuan S amp Zhang J A Pressure Model for Open Rotor-Stator Cavities An Application to an 520
Adjustable-Speed Centrifugal Pump With Experimental Validation J Fluids Eng-Trans ASME 142 047532 521
(2020) 522
[36] Morris C E OrsquoDoherty D M Mason-Jones A amp OrsquoDoherty T Evaluation of the swirl characteristics of a 523
tidal stream turbine wake Int J Mar Energy 14 198-214 (2016) 524
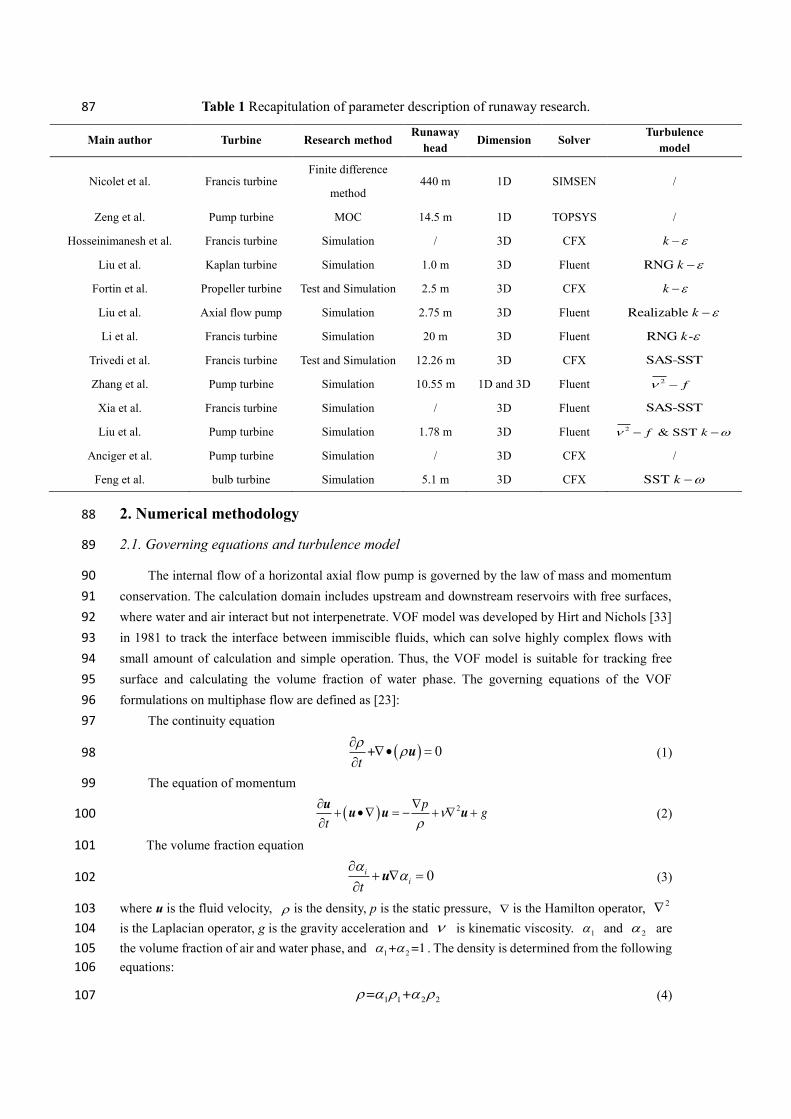
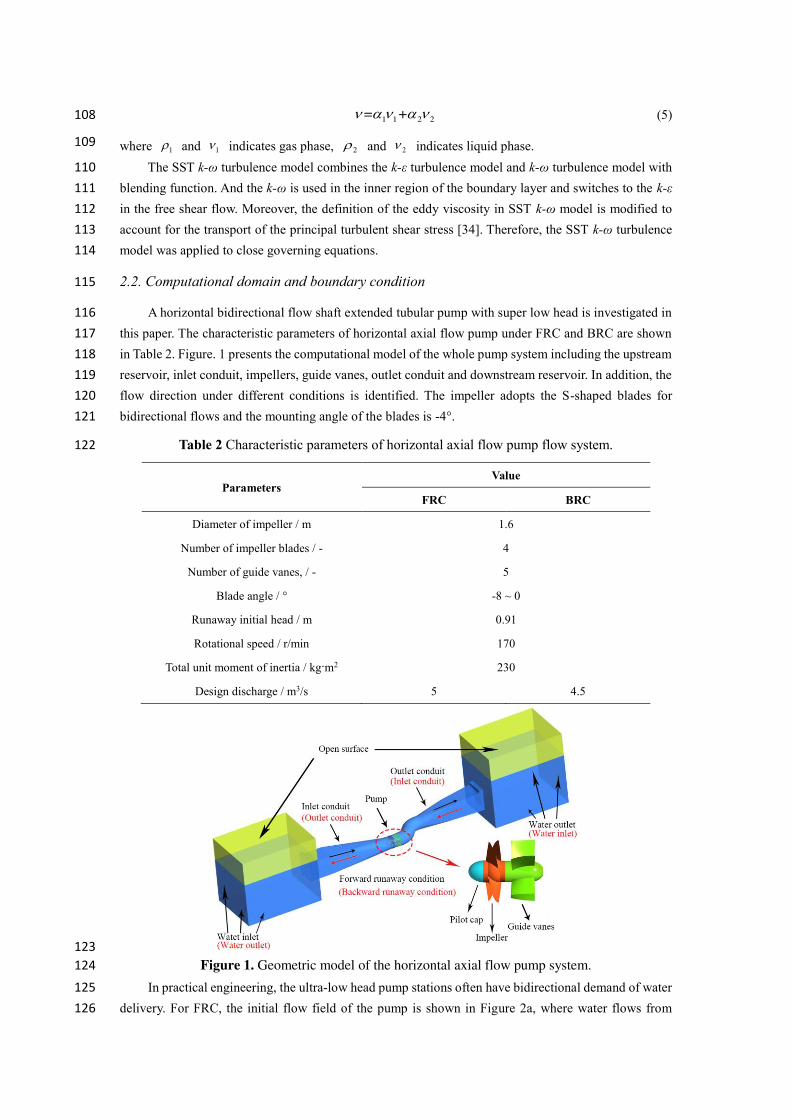
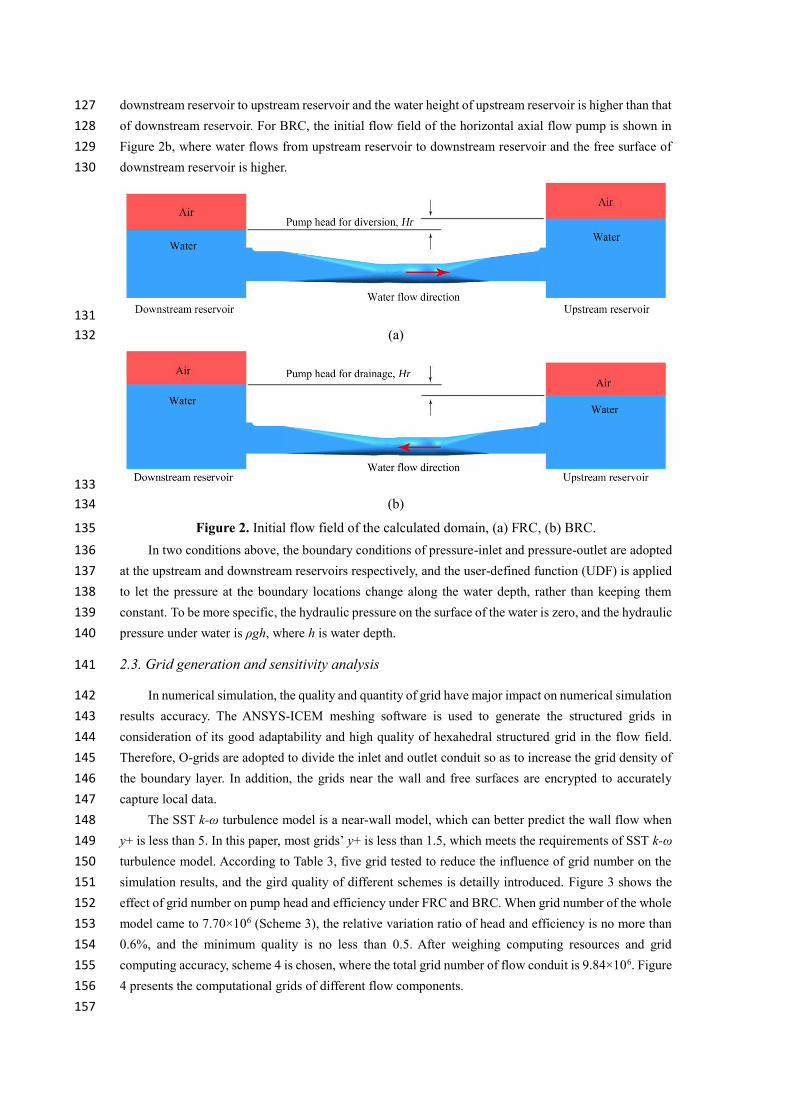
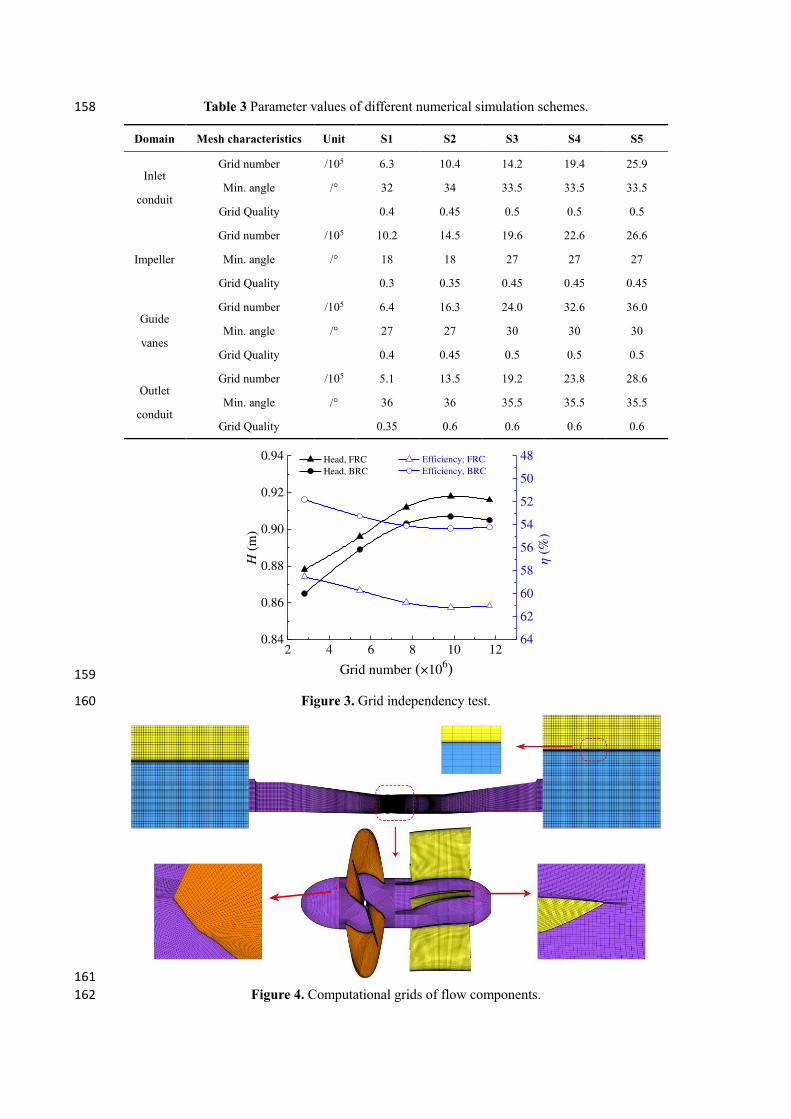
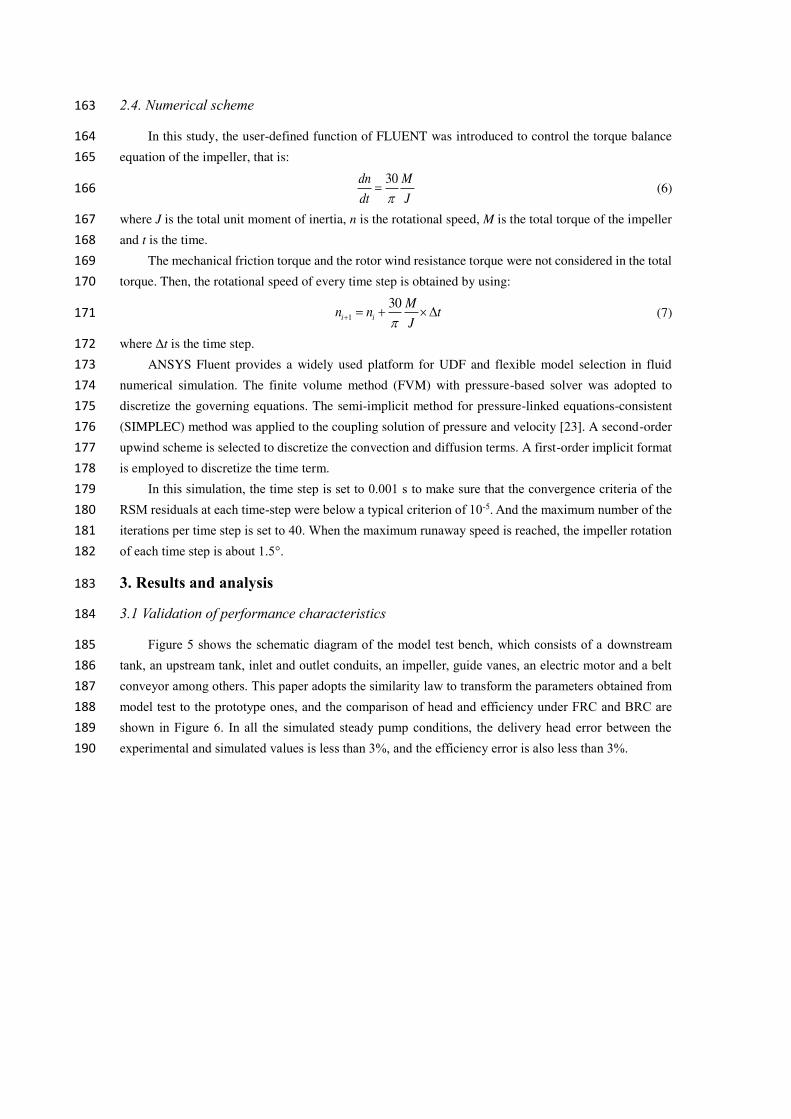
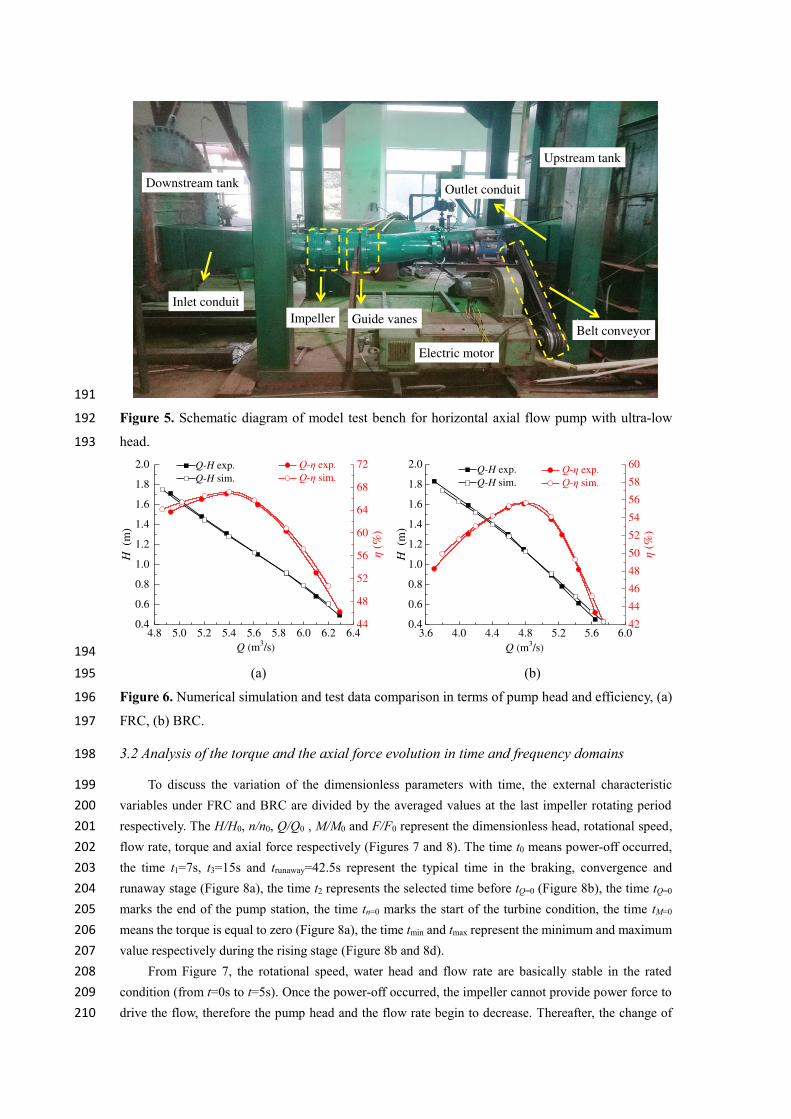
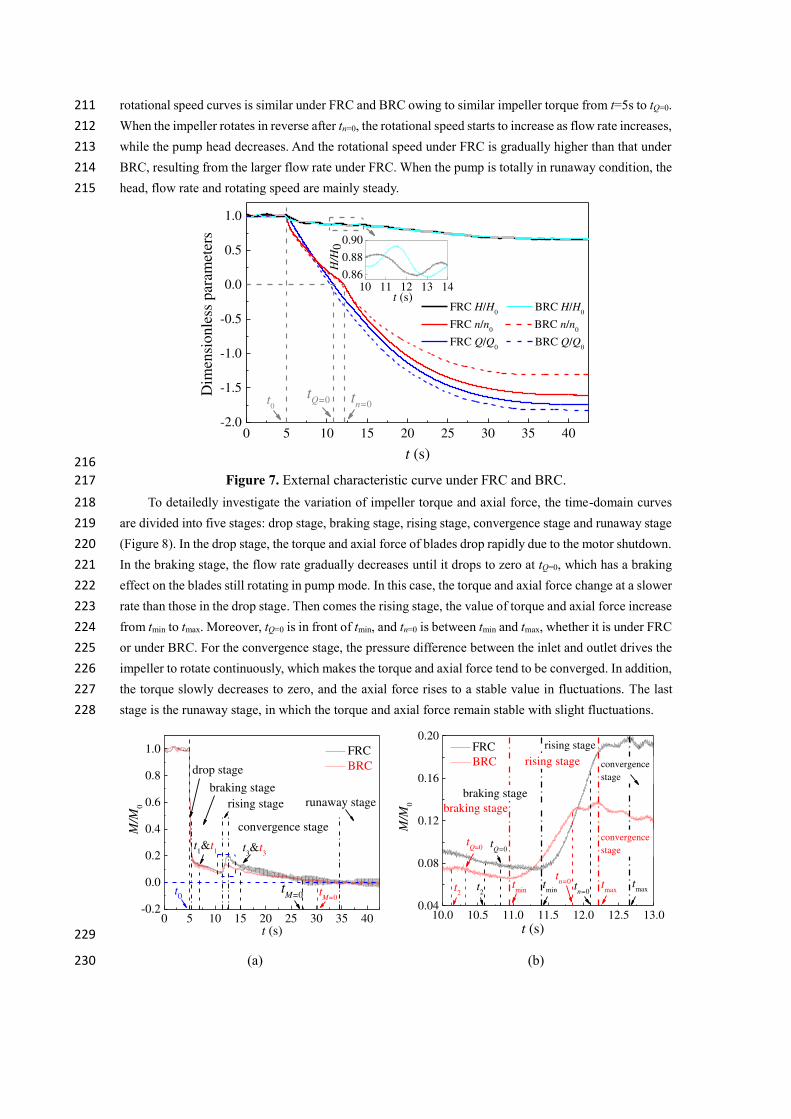
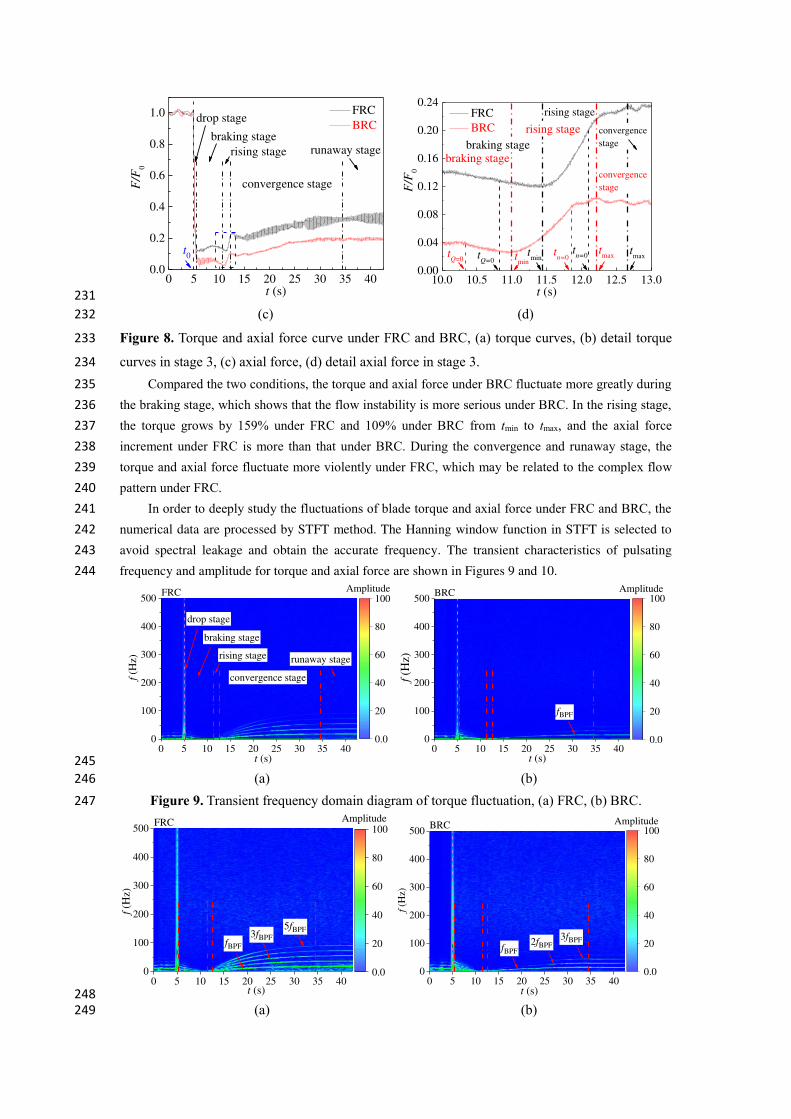
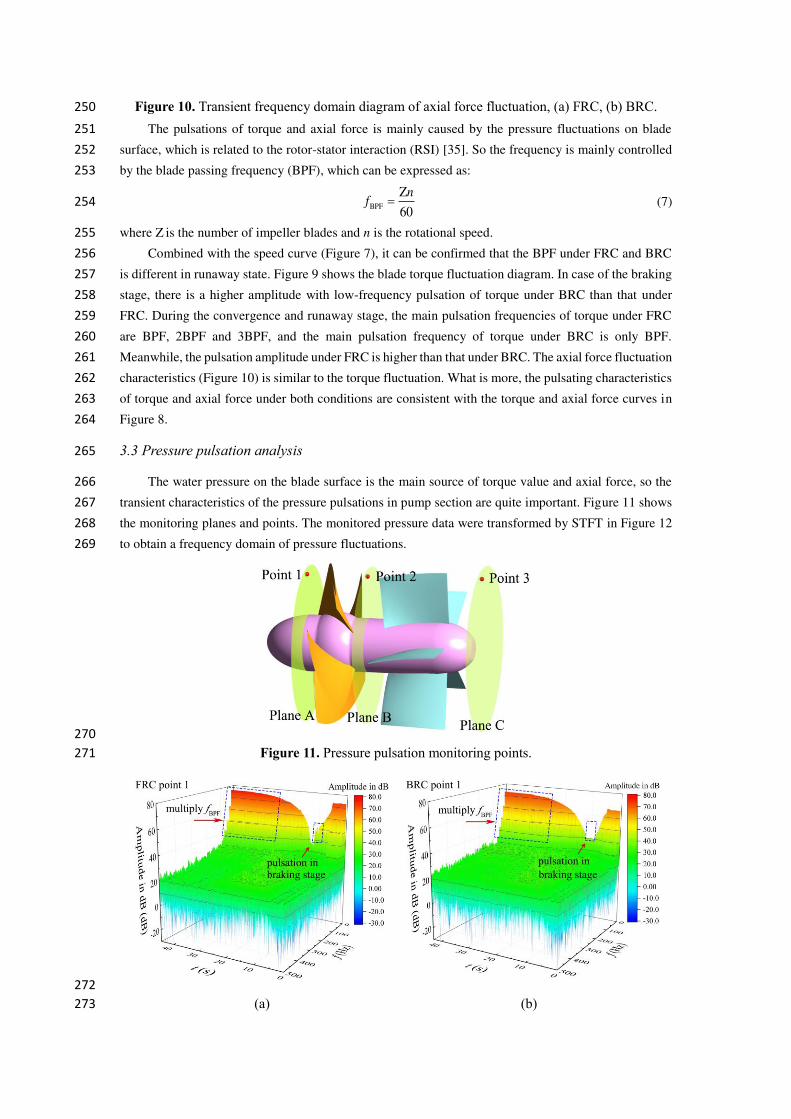
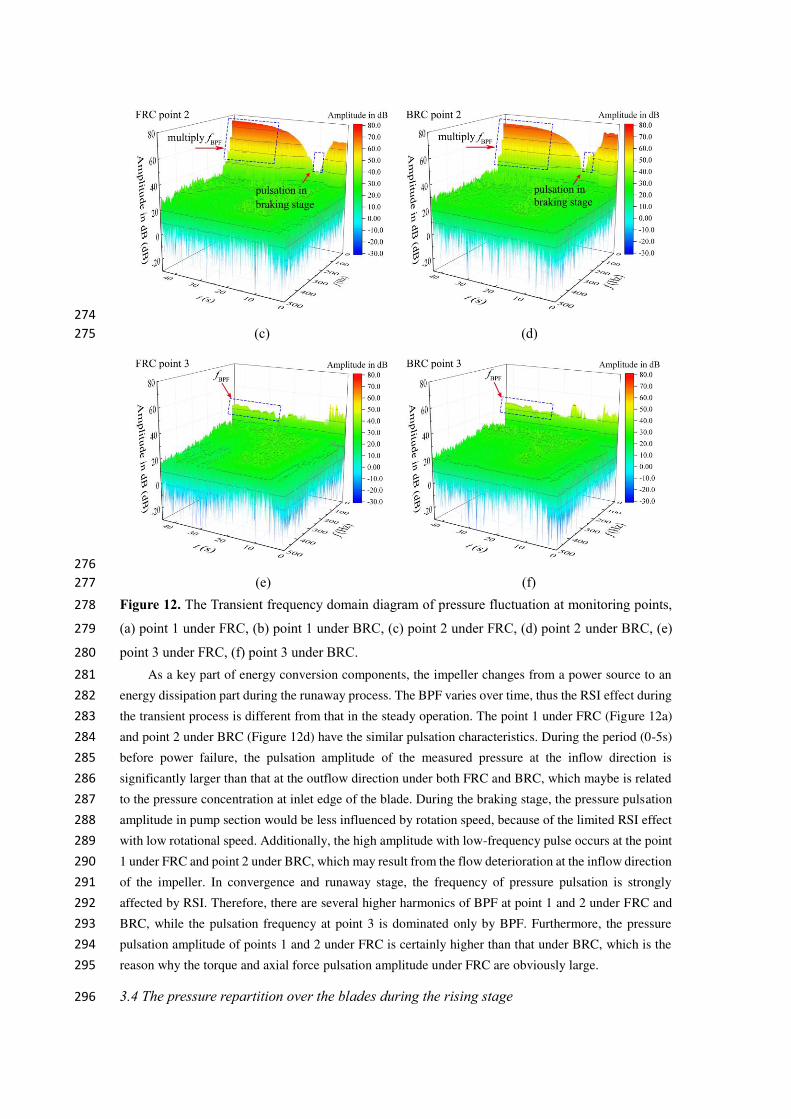
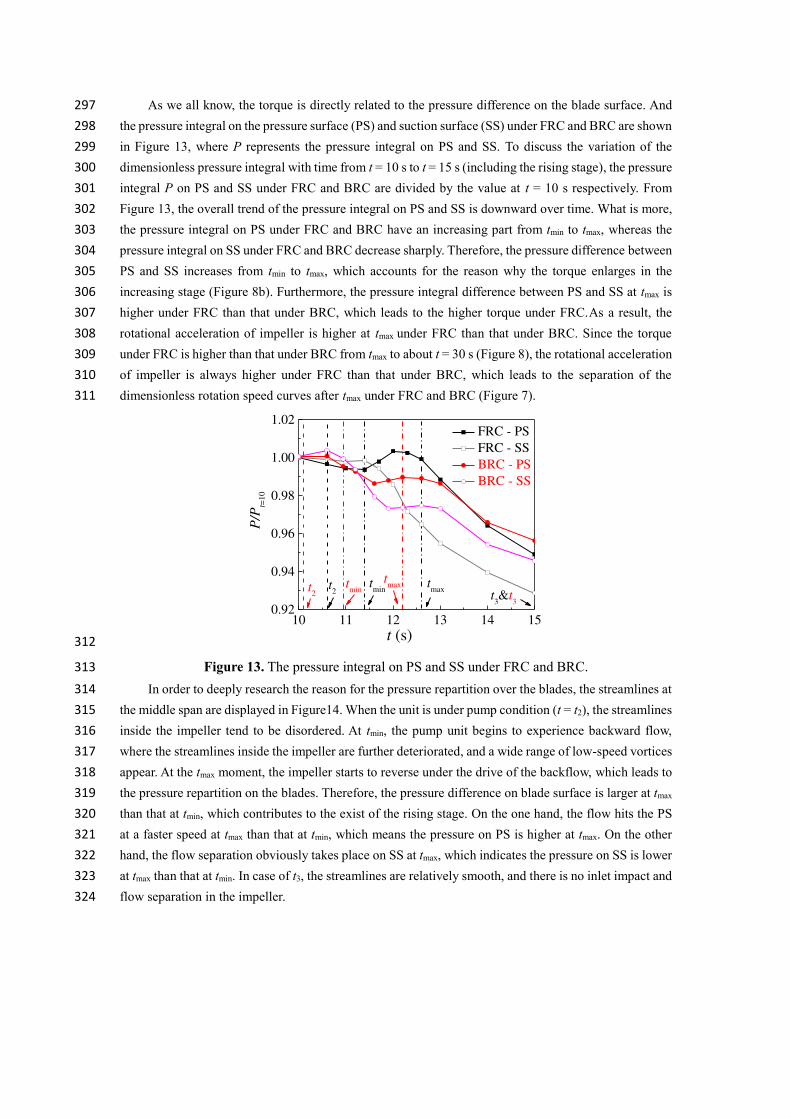
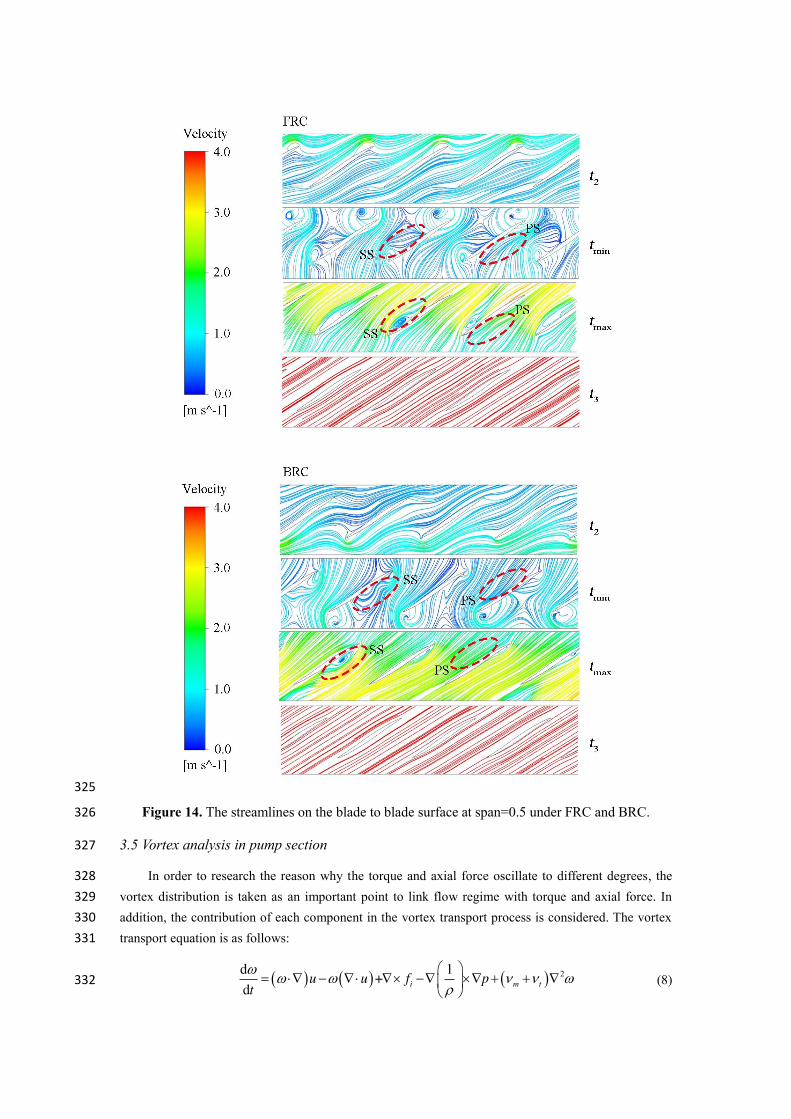
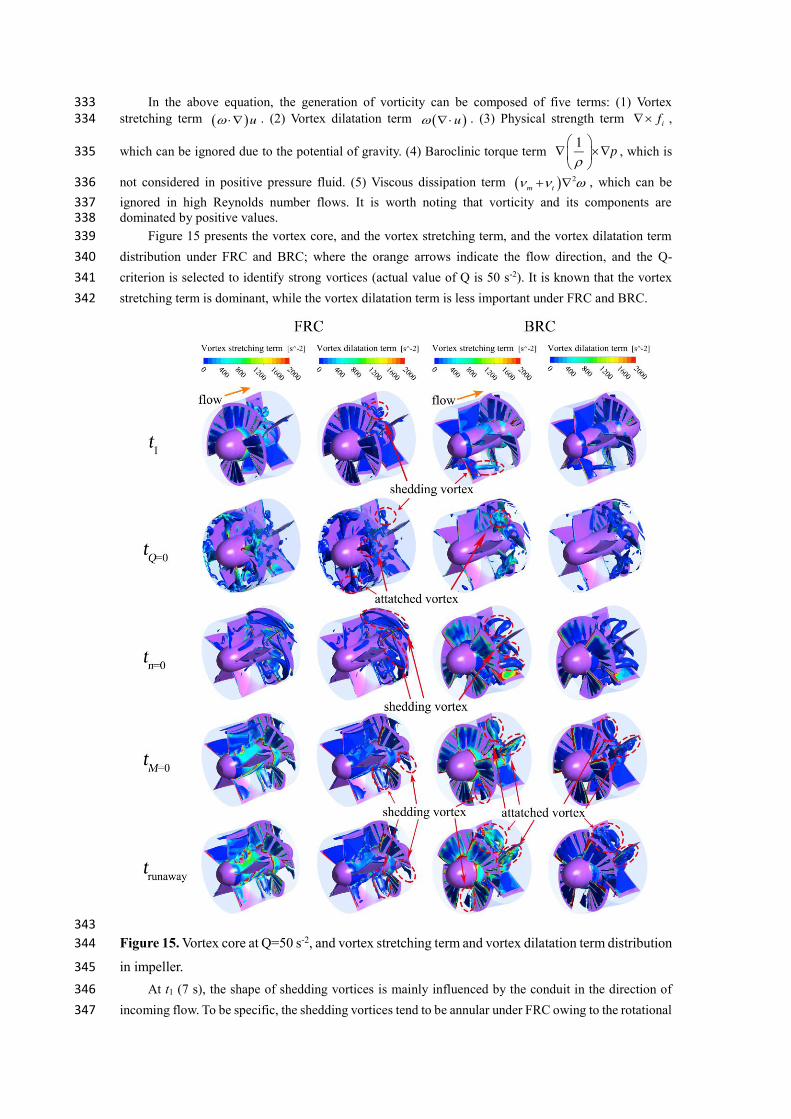
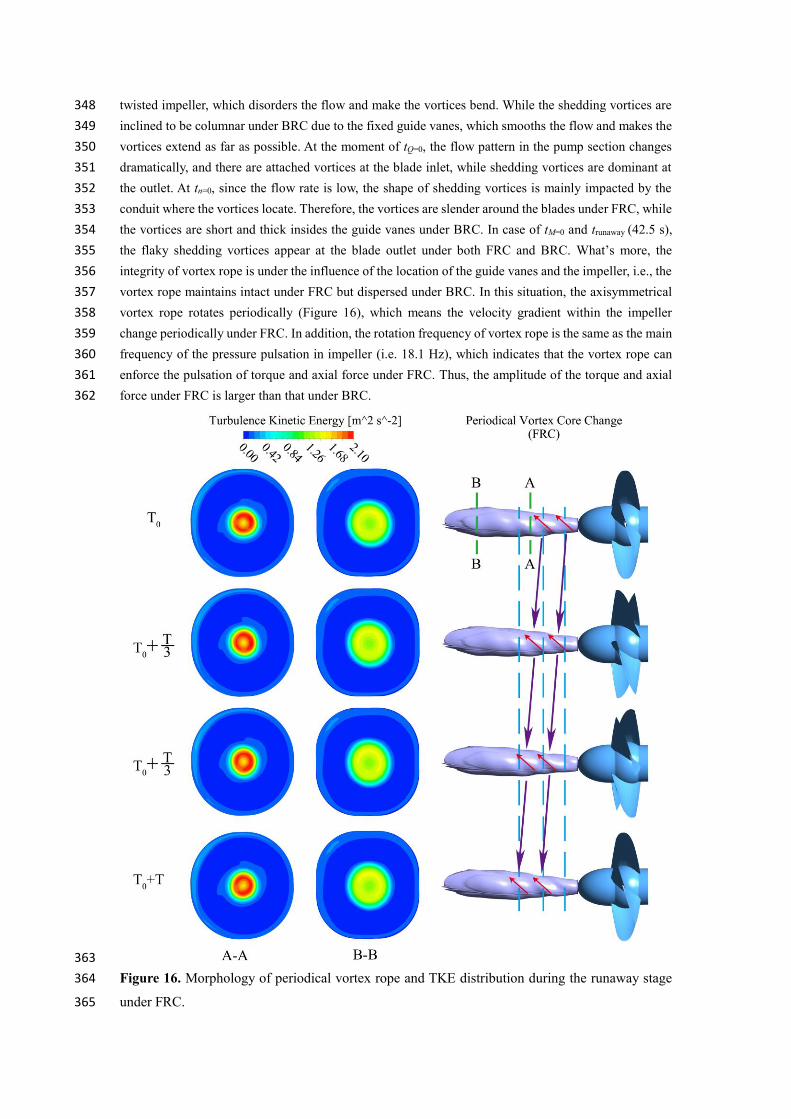
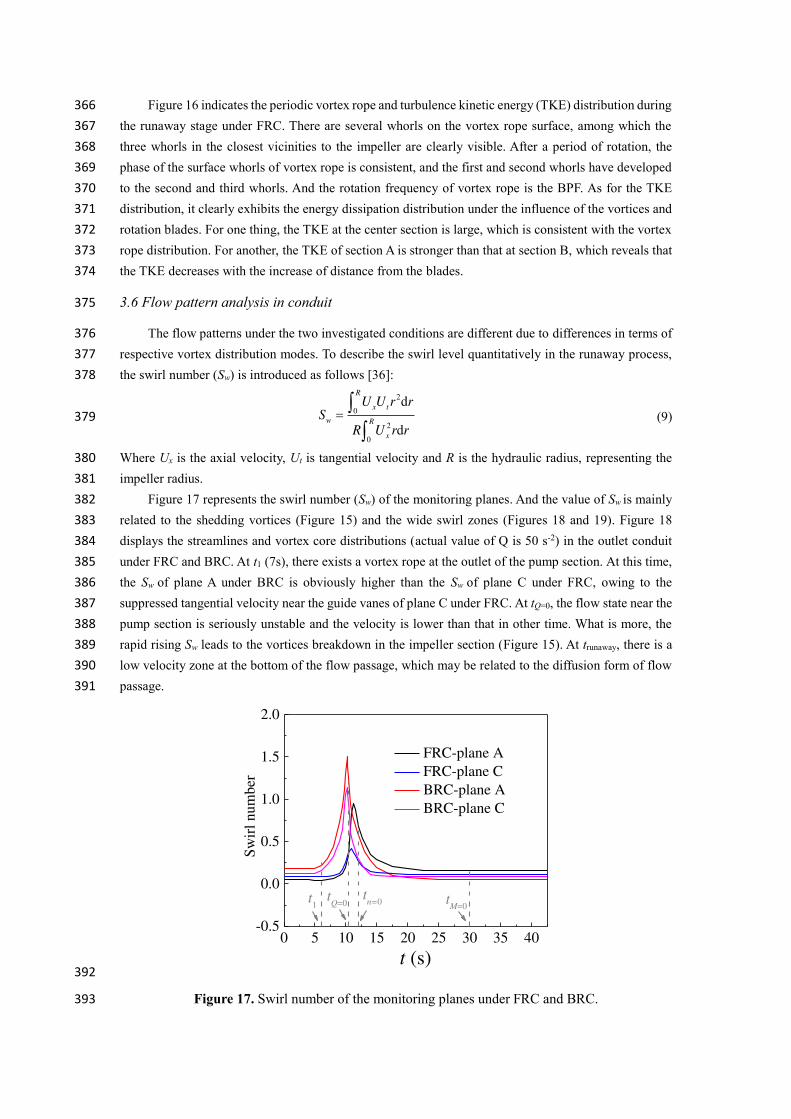
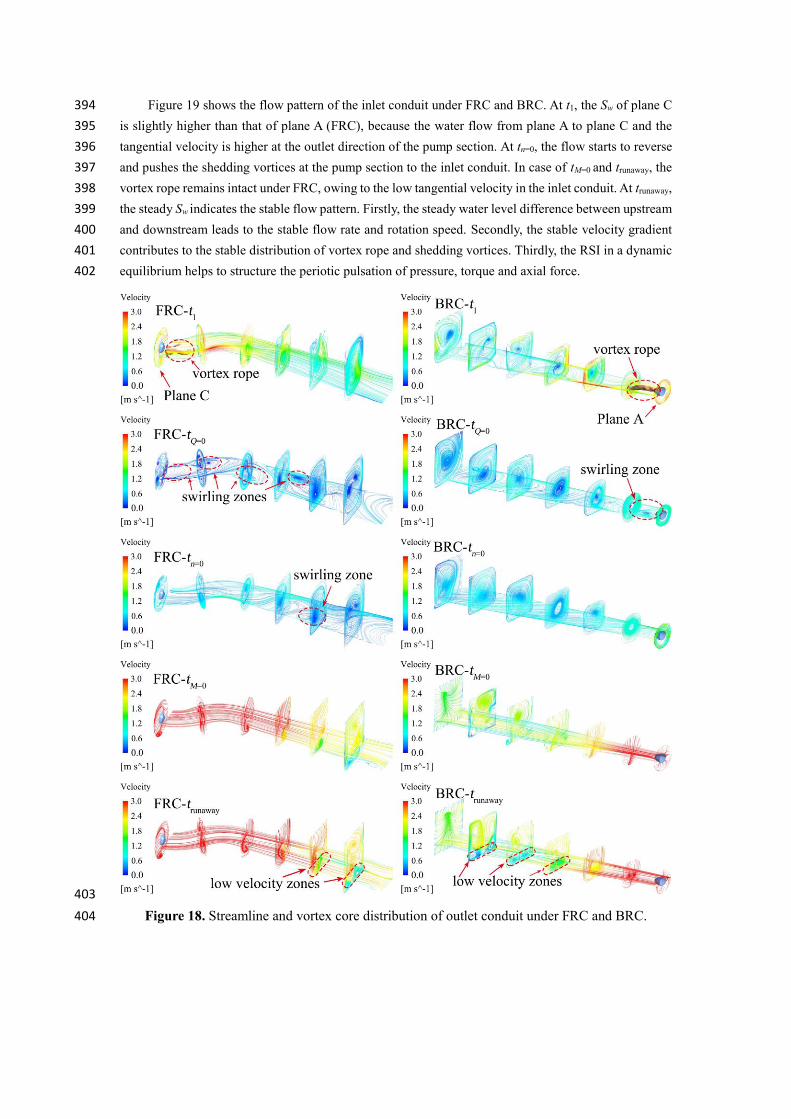
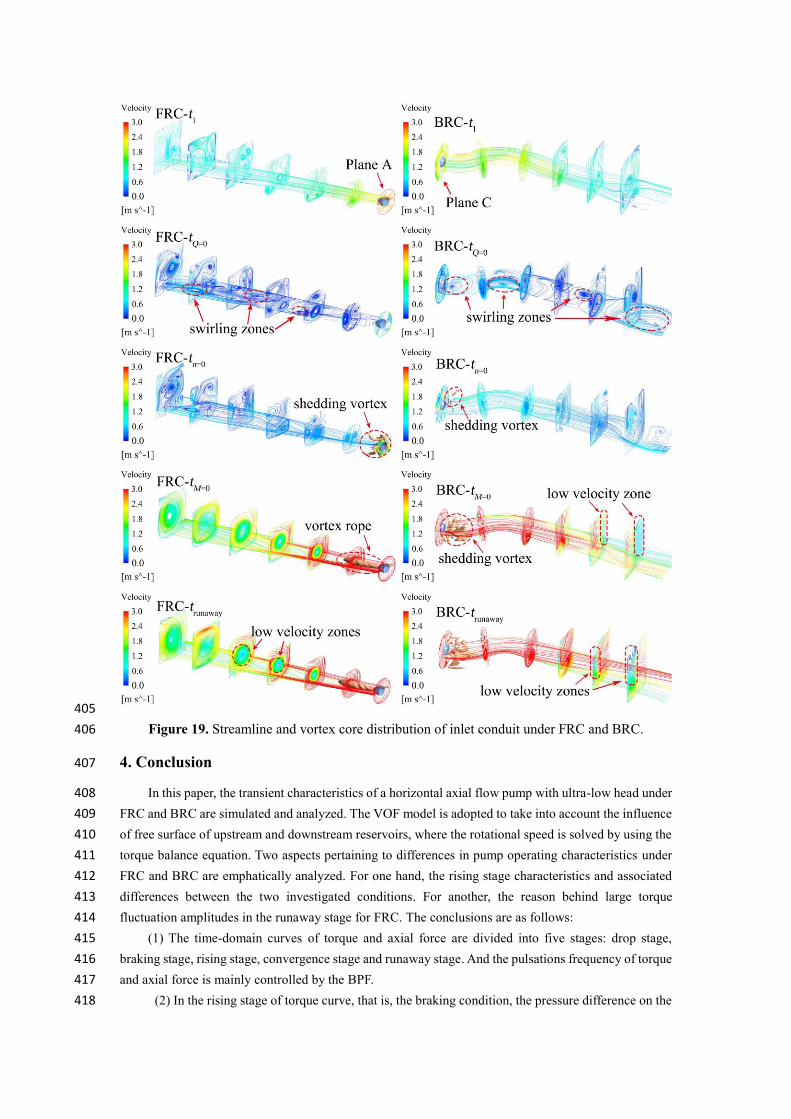